Embed Size (px)
Citation preview
Internalization of R&D Outsourcing Internalization of R&D Outsourcing : Firm : Firm Level Evidience from Korean ManufacturingLevel Evidience from Korean Manufacturing
Dec. 7. 2011
1
Dec. 7. 2011
SangyunSangyun HanHan((Ph.D Student, Graduate School of Management of Technology,))
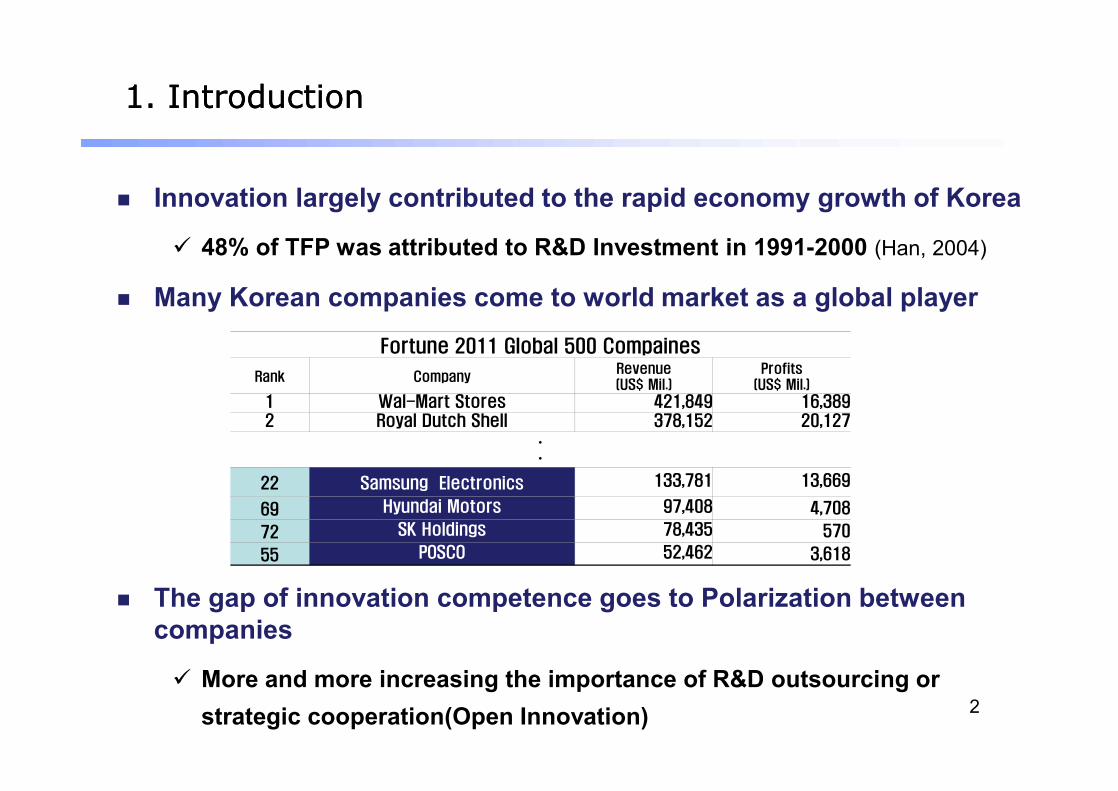
n Innovation largely contributed to the rapid economy growth of Korea
ü 48% of TFP was attributed to R&D Investment in 1991-2000 (Han, 2004)
n Many Korean companies come to world market as a global playerFortune 2011 Global 500 Compaines
Rank CompanyRevenue(US$ Mil.)
Profits(US$ Mil.)
1 Wal-Mart Stores 421,849 16,389
1. Introduction1. Introduction
2
1 Wal-Mart Stores 421,849 16,3892 Royal Dutch Shell 378,152 20,127
ᆞᆞ
22 Samsung Electronics 133,781 13,669
69 Hyundai Motors 97,408 4,708
72 SK Holdings 78,435 570
55 POSCO 52,462 3,618
n The gap of innovation competence goes to Polarization between companies
ü More and more increasing the importance of R&D outsourcing or strategic cooperation(Open Innovation)
1. Introduction1. Introduction
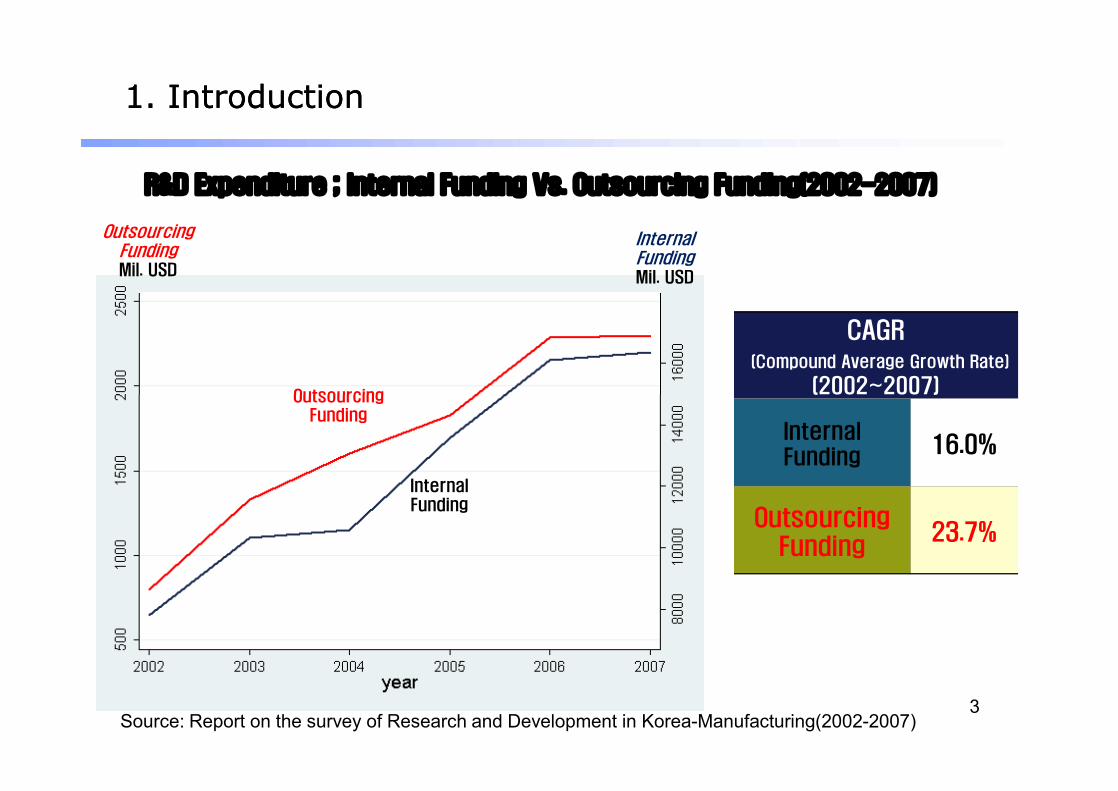
R&D Expenditure ; Internal Funding Vs. Outsourcing Funding(2002-2007)
Outsourcing FundingMil. USD
Internal FundingMil. USD
Outsourcing Funding
CAGR(Compound Average Growth Rate)
(2002~2007)
3Source: Report on the survey of Research and Development in Korea-Manufacturing(2002-2007)
Internal Funding
Outsourcing Funding
CAGR(Compound Average Growth Rate)
(2002~2007)
InternalFunding
16.0%
OutsourcingFunding
23.7%
1. Introduction1. Introduction
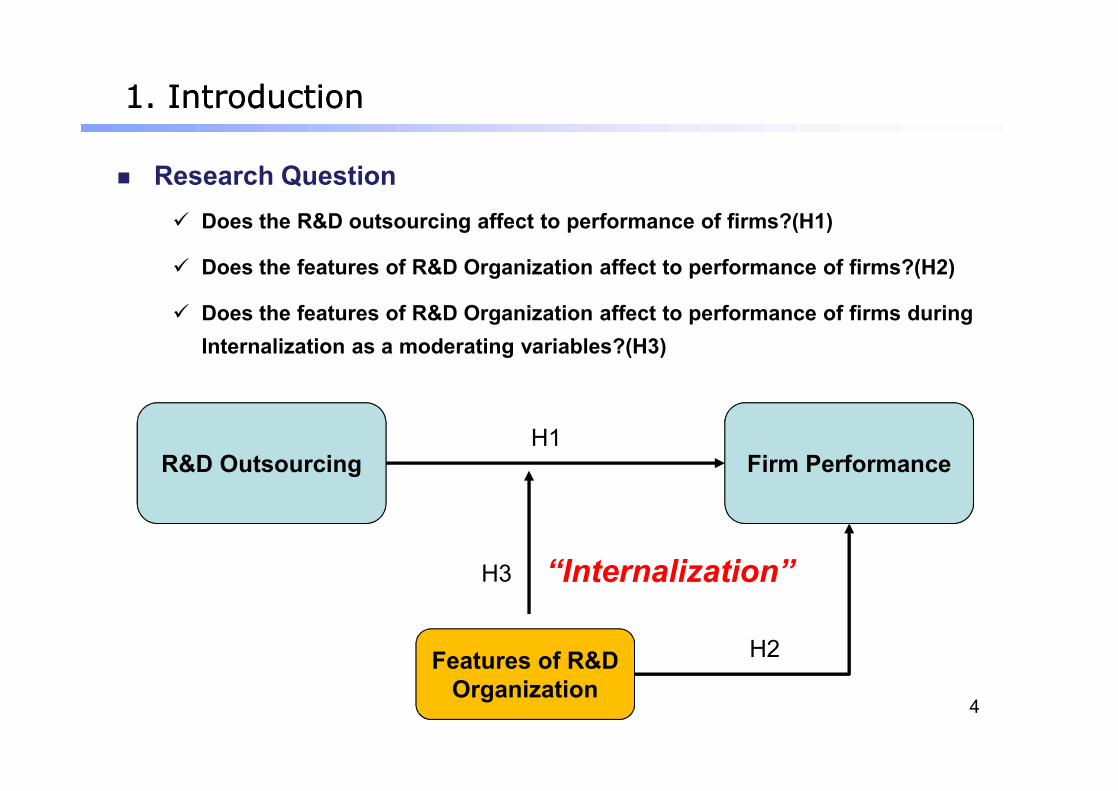
n Research Questionü Does the R&D outsourcing affect to performance of firms?(H1)
ü Does the features of R&D Organization affect to performance of firms?(H2)
ü Does the features of R&D Organization affect to performance of firms during Internalization as a moderating variables?(H3)
4
R&D OutsourcingR&D Outsourcing Firm PerformanceFirm Performance
Features of R&D Organization
Features of R&D Organization
“Internalization”
H1
H3
H2
2. Literature review 2. Literature review
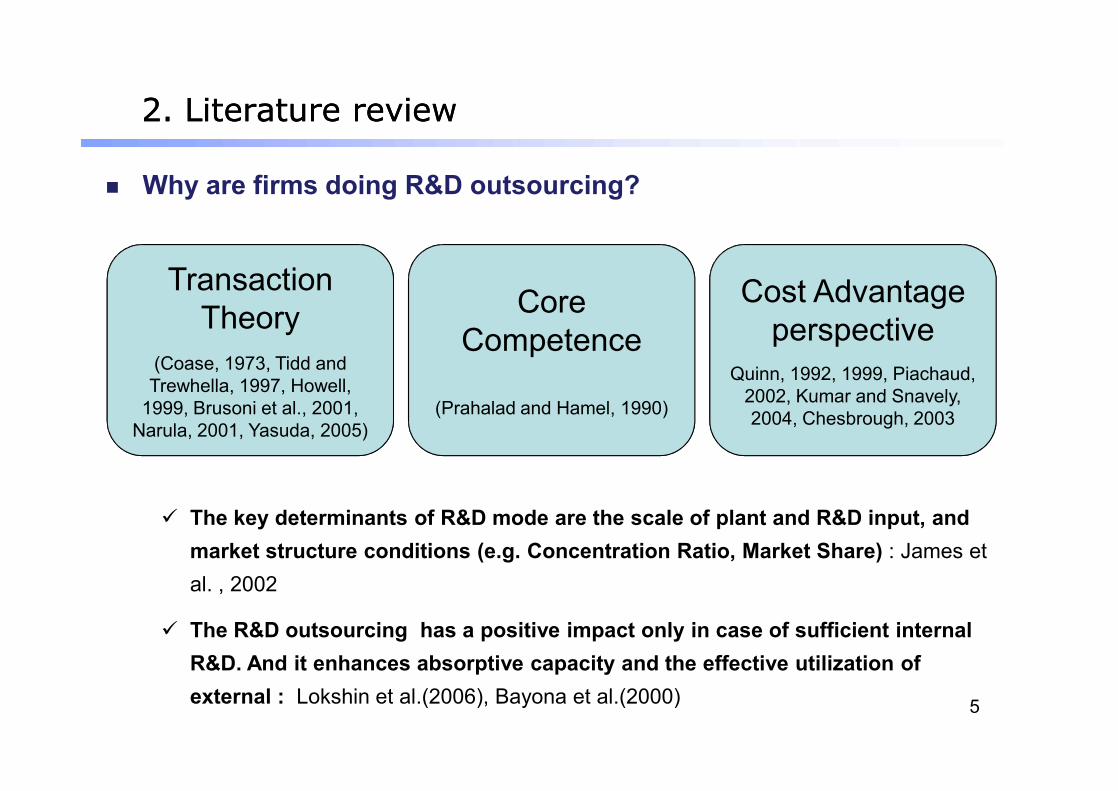
n Why are firms doing R&D outsourcing?
ü The key determinants of R&D mode are the scale of plant and R&D input, and market structure conditions (e.g. Concentration Ratio, Market Share) : James et al. , 2002
ü The R&D outsourcing has a positive impact only in case of sufficient internal R&D. And it enhances absorptive capacity and the effective utilization of external : Lokshin et al.(2006), Bayona et al.(2000)
Transaction Theory
(Coase, 1973, Tidd and Trewhella, 1997, Howell,
1999, Brusoni et al., 2001, Narula, 2001, Yasuda, 2005)
Transaction Theory
(Coase, 1973, Tidd and Trewhella, 1997, Howell,
1999, Brusoni et al., 2001, Narula, 2001, Yasuda, 2005)
Core Competence
(Prahalad and Hamel, 1990)
Core Competence
(Prahalad and Hamel, 1990)
Cost Advantage perspective
Quinn, 1992, 1999, Piachaud, 2002, Kumar and Snavely, 2004, Chesbrough, 2003
Cost Advantage perspective
Quinn, 1992, 1999, Piachaud, 2002, Kumar and Snavely, 2004, Chesbrough, 2003
5
n Why are firms doing R&D outsourcing?
ü The key determinants of R&D mode are the scale of plant and R&D input, and market structure conditions (e.g. Concentration Ratio, Market Share) : James et al. , 2002
ü The R&D outsourcing has a positive impact only in case of sufficient internal R&D. And it enhances absorptive capacity and the effective utilization of external : Lokshin et al.(2006), Bayona et al.(2000)
Transaction Theory
(Coase, 1973, Tidd and Trewhella, 1997, Howell,
1999, Brusoni et al., 2001, Narula, 2001, Yasuda, 2005)
Transaction Theory
(Coase, 1973, Tidd and Trewhella, 1997, Howell,
1999, Brusoni et al., 2001, Narula, 2001, Yasuda, 2005)
Core Competence
(Prahalad and Hamel, 1990)
Core Competence
(Prahalad and Hamel, 1990)
Cost Advantage perspective
Quinn, 1992, 1999, Piachaud, 2002, Kumar and Snavely, 2004, Chesbrough, 2003
Cost Advantage perspective
Quinn, 1992, 1999, Piachaud, 2002, Kumar and Snavely, 2004, Chesbrough, 2003
2. Literature review 2. Literature review
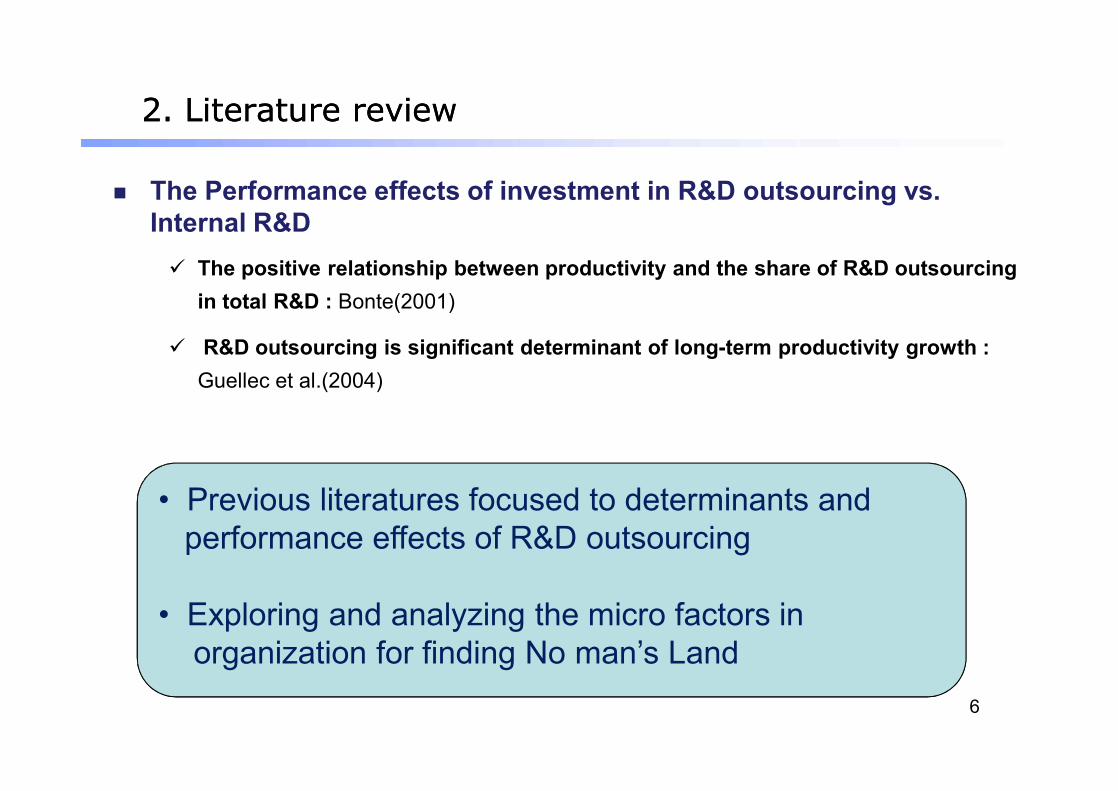
n The Performance effects of investment in R&D outsourcing vs. Internal R&Dü The positive relationship between productivity and the share of R&D outsourcing
in total R&D : Bonte(2001)
ü R&D outsourcing is significant determinant of long-term productivity growth : Guellec et al.(2004)
6
n The Performance effects of investment in R&D outsourcing vs. Internal R&Dü The positive relationship between productivity and the share of R&D outsourcing
in total R&D : Bonte(2001)
ü R&D outsourcing is significant determinant of long-term productivity growth : Guellec et al.(2004)
• Previous literatures focused to determinants andperformance effects of R&D outsourcing
• Exploring and analyzing the micro factors in organization for finding No man’s Land
• Previous literatures focused to determinants andperformance effects of R&D outsourcing
• Exploring and analyzing the micro factors in organization for finding No man’s Land
33. Data. Data and Methodand Method
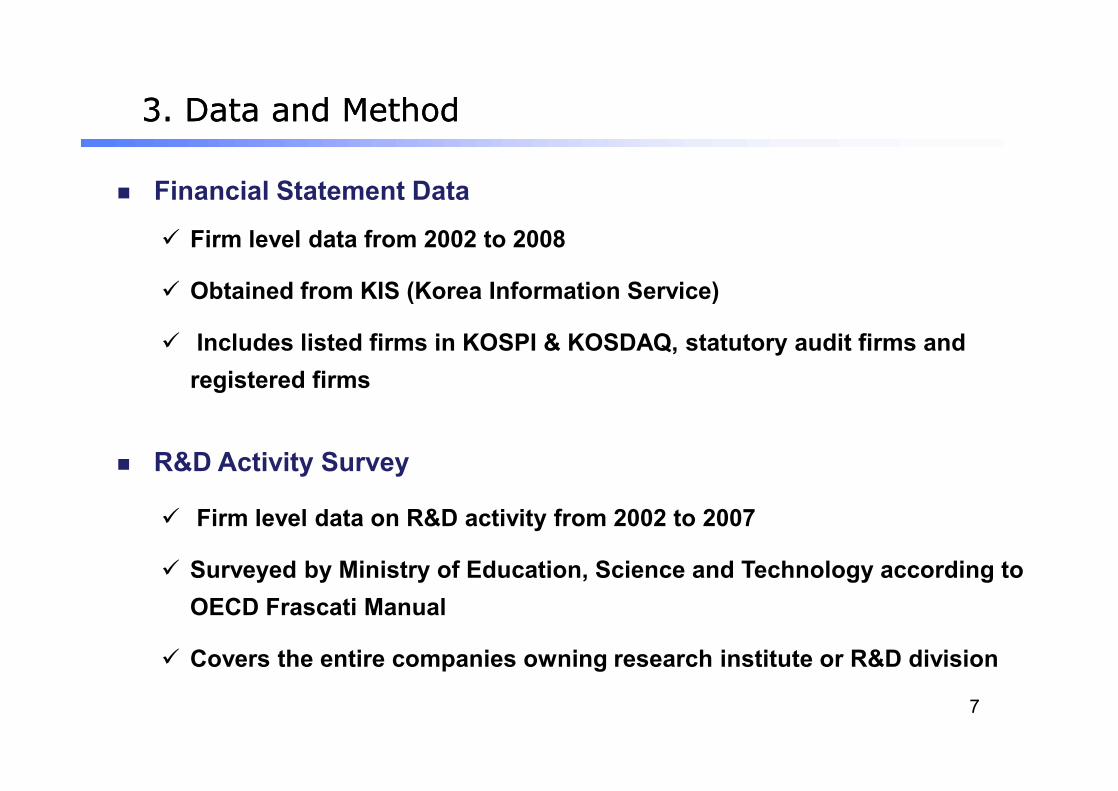
n Financial Statement Data
ü Firm level data from 2002 to 2008
ü Obtained from KIS (Korea Information Service)
ü Includes listed firms in KOSPI & KOSDAQ, statutory audit firms and registered firms
7
ü Firm level data on R&D activity from 2002 to 2007
ü Surveyed by Ministry of Education, Science and Technology according to OECD Frascati Manual
ü Covers the entire companies owning research institute or R&D division
ü Firm level data from 2002 to 2008
ü Obtained from KIS (Korea Information Service)
ü Includes listed firms in KOSPI & KOSDAQ, statutory audit firms and registered firms
n R&D Activity Survey
33. Data. Data and Methodand Method
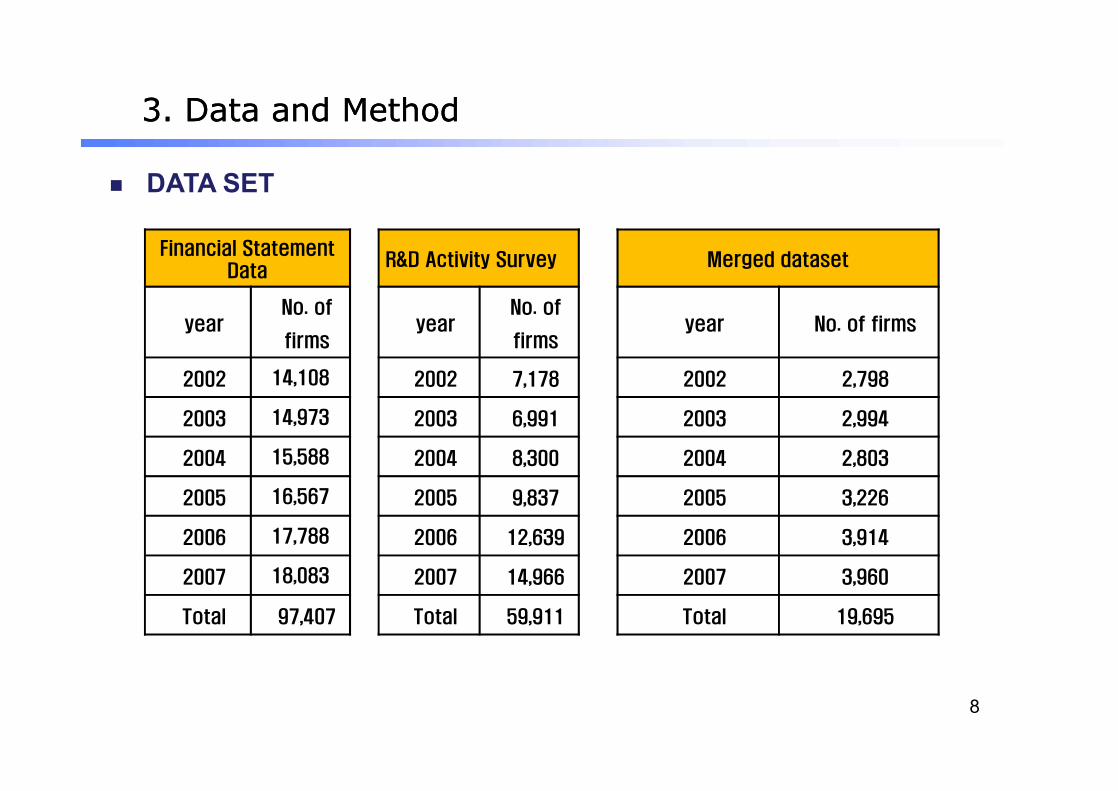
Financial Statement Data
R&D Activity Survey Merged dataset
yearNo. of
firmsyear
No. of
firmsyear No. of firms
2002 14,108 2002 7,178 2002 2,798
n DATA SET
8
2003 14,973 2003 6,991 2003 2,994
2004 15,588 2004 8,300 2004 2,803
2005 16,567 2005 9,837 2005 3,226
2006 17,788 2006 12,639 2006 3,914
2007 18,083 2007 14,966 2007 3,960
Total 97,407 Total 59,911 Total 19,695
33. Data. Data and Methodand Method
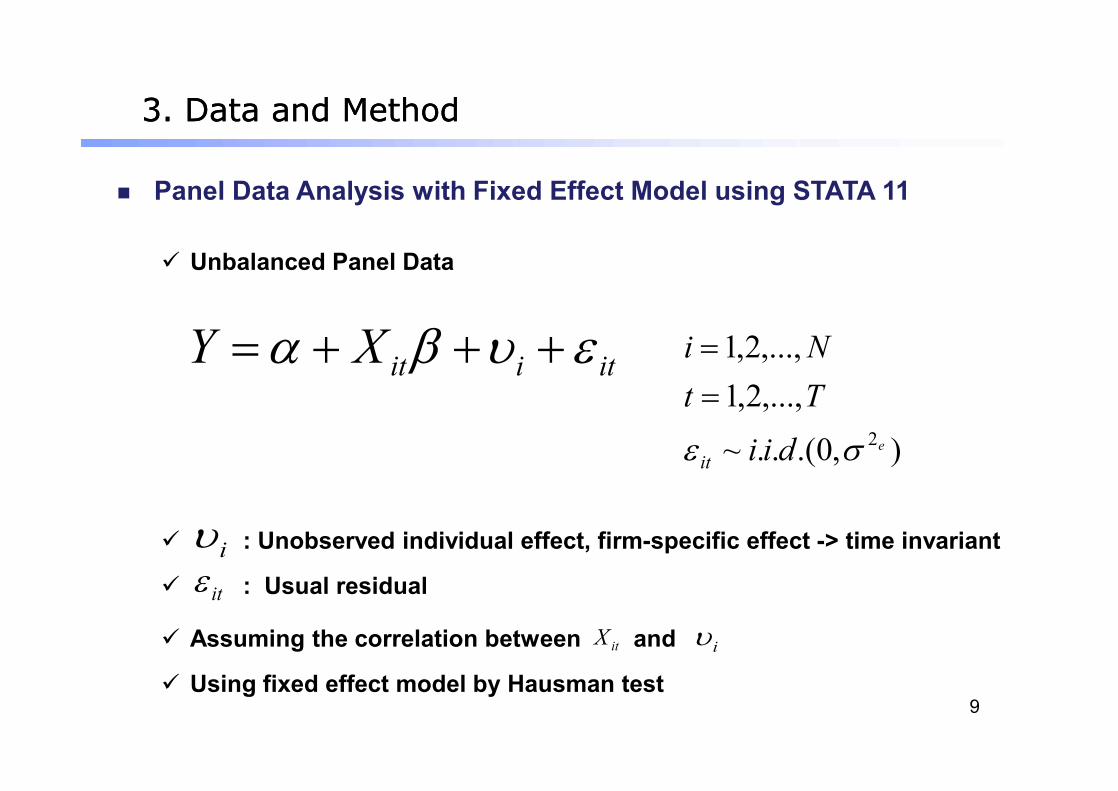
n Panel Data Analysis with Fixed Effect Model using STATA 11
ü Unbalanced Panel Data
itiitXY euba +++=
),0.(..~
,...,2,1,...,2,1
2ediiTtNi
it se
==
9ü Using fixed effect model by Hausman test
),0.(..~
,...,2,1,...,2,1
2ediiTtNi
it se
==
iteü : Unobserved individual effect, firm-specific effect -> time invariantiuü : Usual residual
ü Assuming the correlation between and itX iu
33. Data. Data and Methodand Method
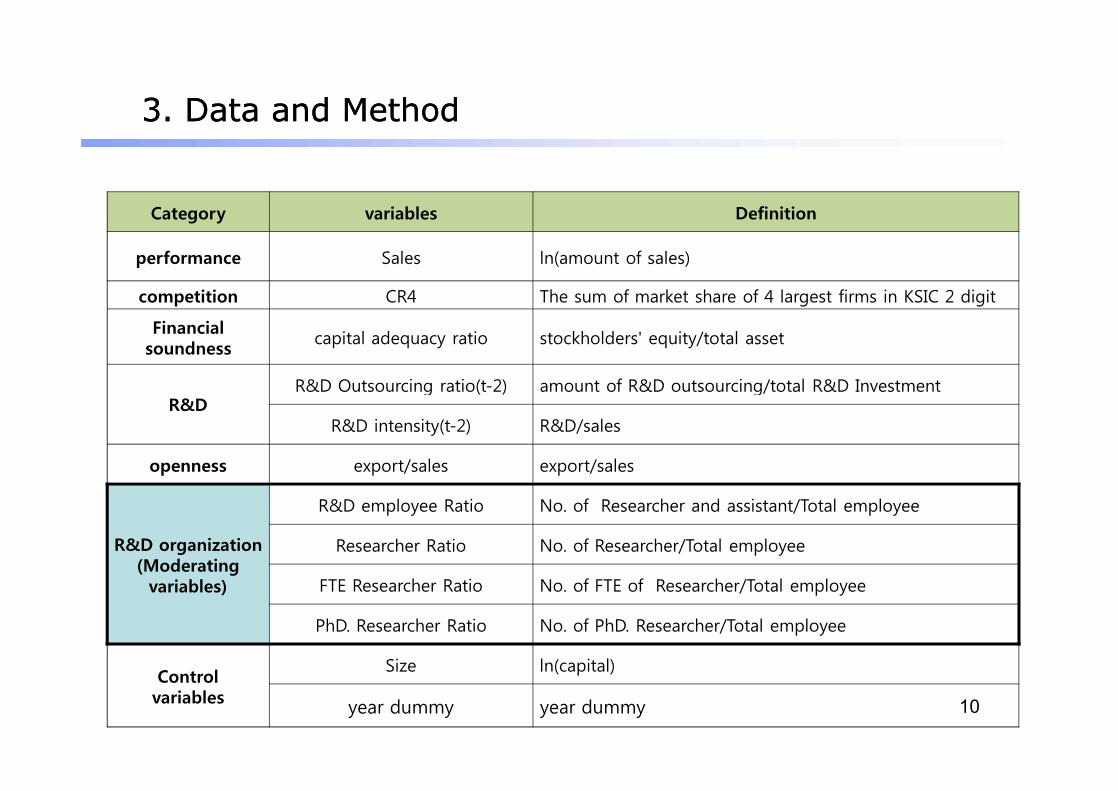
Category variables Definition
performance Sales ln(amount of sales)
competition CR4 The sum of market share of 4 largest firms in KSIC 2 digit
Financial soundness
capital adequacy ratio stockholders' equity/total asset
R&DR&D Outsourcing ratio(t-2) amount of R&D outsourcing/total R&D Investment
10
R&DR&D intensity(t-2) R&D/sales
openness export/sales export/sales
R&D organization(Moderating
variables)
R&D employee Ratio No. of Researcher and assistant/Total employee
Researcher Ratio No. of Researcher/Total employee
FTE Researcher Ratio No. of FTE of Researcher/Total employee
PhD. Researcher Ratio No. of PhD. Researcher/Total employee
Control variables
Size ln(capital)
year dummy year dummy
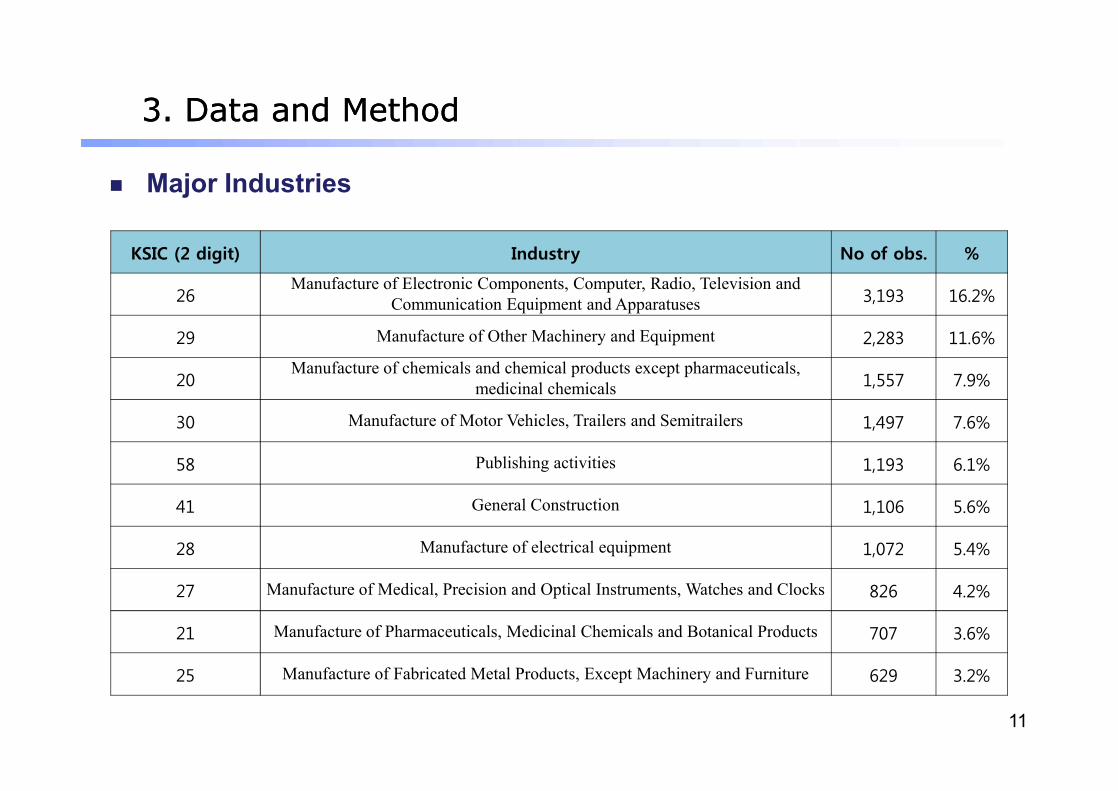
KSIC (2 digit) Industry No of obs. %
26Manufacture of Electronic Components, Computer, Radio, Television and
Communication Equipment and Apparatuses 3,193 16.2%
29 Manufacture of Other Machinery and Equipment 2,283 11.6%
20Manufacture of chemicals and chemical products except pharmaceuticals,
medicinal chemicals 1,557 7.9%
33. Data. Data and Methodand Method
n Major Industries
11
Manufacture of chemicals and chemical products except pharmaceuticals, medicinal chemicals
30 Manufacture of Motor Vehicles, Trailers and Semitrailers 1,497 7.6%
58 Publishing activities 1,193 6.1%
41 General Construction 1,106 5.6%
28 Manufacture of electrical equipment 1,072 5.4%
27 Manufacture of Medical, Precision and Optical Instruments, Watches and Clocks 826 4.2%
21 Manufacture of Pharmaceuticals, Medicinal Chemicals and Botanical Products 707 3.6%
25 Manufacture of Fabricated Metal Products, Except Machinery and Furniture 629 3.2%
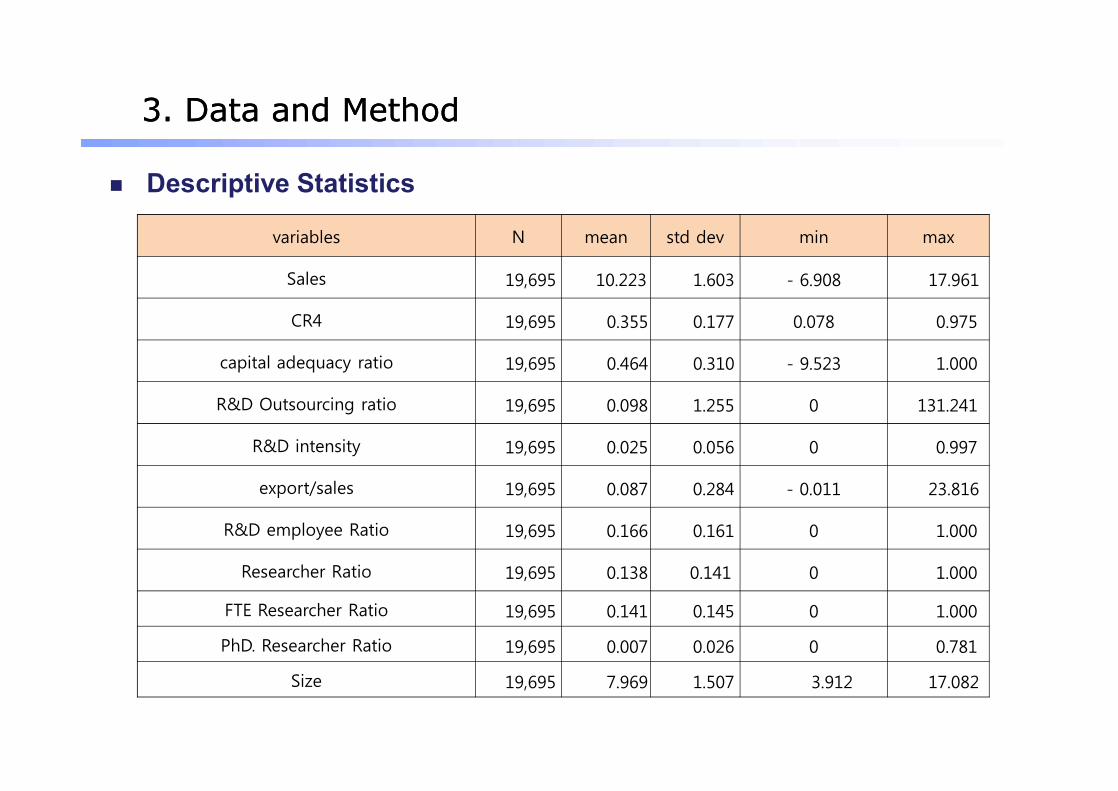
variables N mean std dev min max
Sales 19,695 10.223 1.603 - 6.908 17.961
CR4 19,695 0.355 0.177 0.078 0.975
capital adequacy ratio 19,695 0.464 0.310 - 9.523 1.000
R&D Outsourcing ratio 19,695 0.098 1.255 0 131.241
33. Data. Data and Methodand Method
n Descriptive Statistics
R&D Outsourcing ratio 19,695 0.098 1.255 0 131.241
R&D intensity 19,695 0.025 0.056 0 0.997
export/sales 19,695 0.087 0.284 - 0.011 23.816
R&D employee Ratio 19,695 0.166 0.161 0 1.000
Researcher Ratio 19,695 0.138 0.141 0 1.000
FTE Researcher Ratio 19,695 0.141 0.145 0 1.000
PhD. Researcher Ratio 19,695 0.007 0.026 0 0.781
Size 19,695 7.969 1.507 3.912 17.082
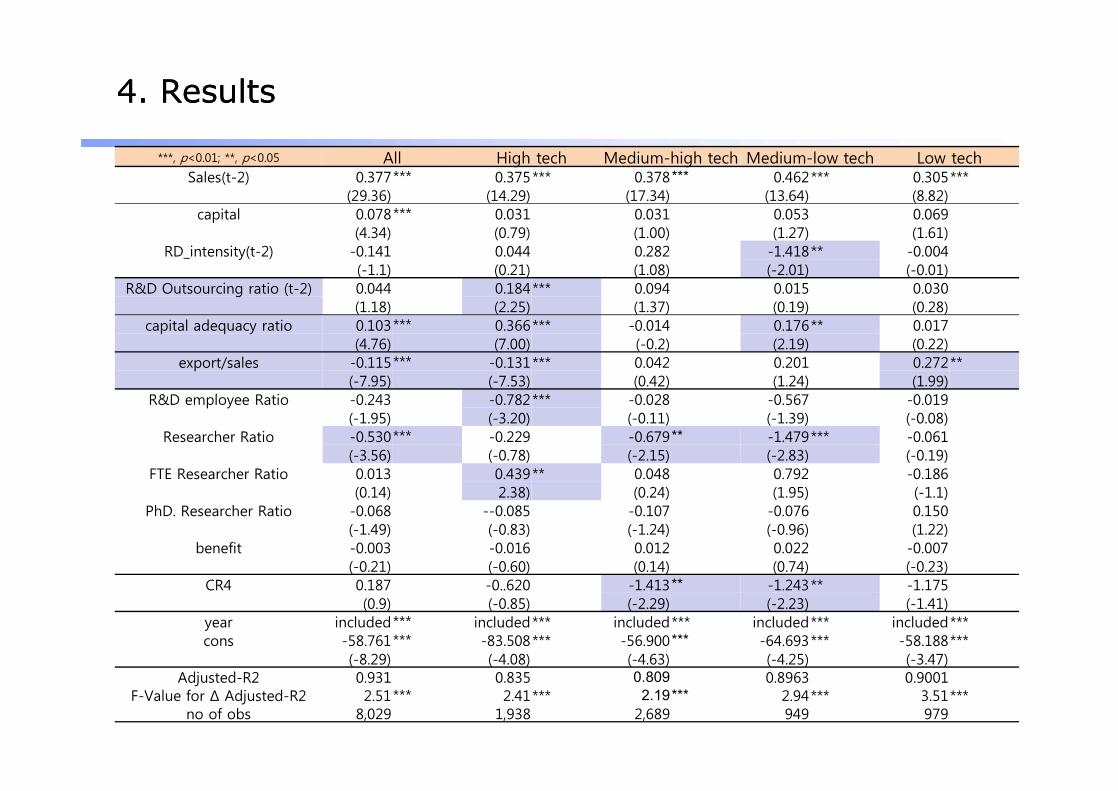
44. Results. Results
***, p<0.01; **, p<0.05 All High tech Medium-high tech Medium-low tech Low techSales(t-2) 0.377 *** 0.375*** 0.378 *** 0.462 *** 0.305 ***
(29.36) (14.29) (17.34) (13.64) (8.82) capital 0.078 *** 0.031 0.031 0.053 0.069
(4.34) (0.79) (1.00) (1.27) (1.61) RD_intensity(t-2) -0.141 0.044 0.282 -1.418 ** -0.004
(-1.1) (0.21) (1.08) (-2.01) (-0.01) R&D Outsourcing ratio (t-2) 0.044 0.184*** 0.094 0.015 0.030
(1.18) (2.25) (1.37) (0.19) (0.28) capital adequacy ratio 0.103 *** 0.366*** -0.014 0.176 ** 0.017
(4.76) (7.00) (-0.2) (2.19) (0.22) export/sales -0.115 *** -0.131*** 0.042 0.201 0.272 **
(-7.95) (-7.53) (0.42) (1.24) (1.99) R&D employee Ratio -0.243 -0.782*** -0.028 -0.567 -0.019 R&D employee Ratio -0.243 -0.782*** -0.028 -0.567 -0.019
(-1.95) (-3.20) (-0.11) (-1.39) (-0.08) Researcher Ratio -0.530 *** -0.229 -0.679 ** -1.479 *** -0.061
(-3.56) (-0.78) (-2.15) (-2.83) (-0.19) FTE Researcher Ratio 0.013 0.439** 0.048 0.792 -0.186
(0.14) 2.38) (0.24) (1.95) (-1.1) PhD. Researcher Ratio -0.068 --0.085 -0.107 -0.076 0.150
(-1.49) (-0.83) (-1.24) (-0.96) (1.22) benefit -0.003 -0.016 0.012 0.022 -0.007
(-0.21) (-0.60) (0.14) (0.74) (-0.23) CR4 0.187 -0..620 -1.413 ** -1.243 ** -1.175
(0.9) (-0.85) (-2.29) (-2.23) (-1.41) year included *** included*** included*** included*** included***cons -58.761 *** -83.508*** -56.900 *** -64.693 *** -58.188 ***
(-8.29) (-4.08) (-4.63) (-4.25) (-3.47) Adjusted-R2 0.931 0.835 0.809 0.8963 0.9001
F-Value for Δ Adjusted-R2 2.51*** 2.41*** 2.19*** 2.94*** 3.51***no of obs 8,029 1,938 2,689 949 979
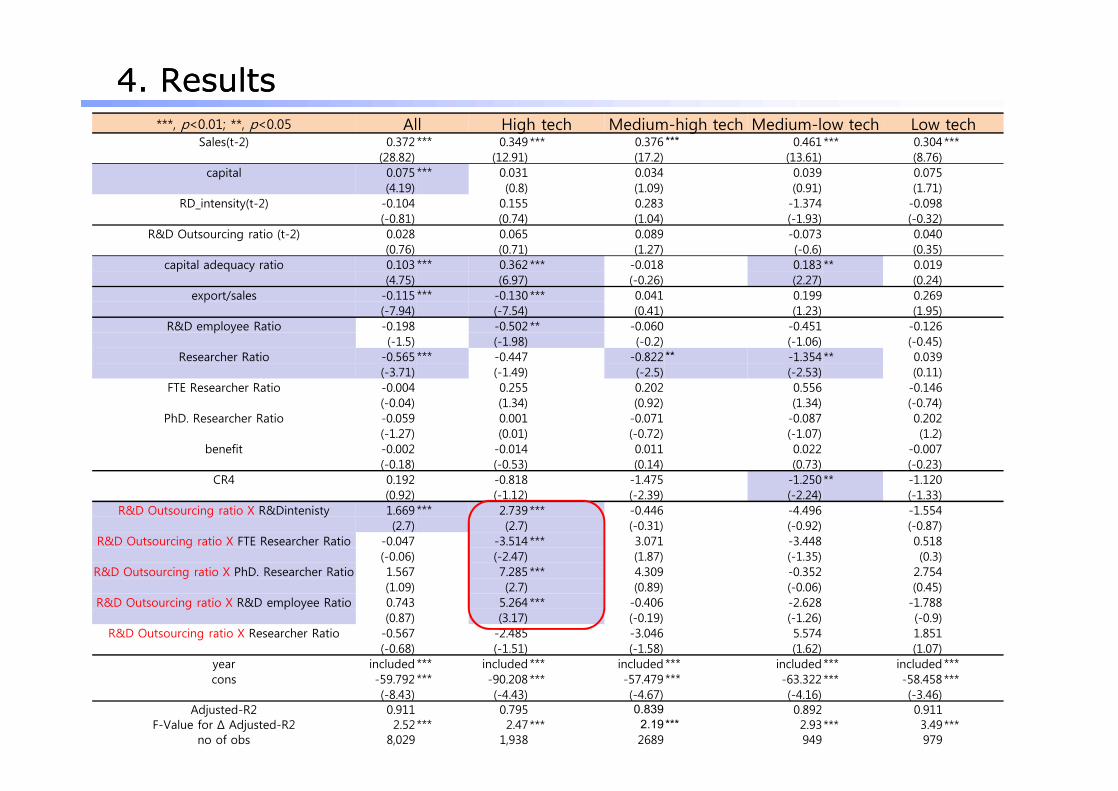
44. Results. Results***, p<0.01; **, p<0.05 All High tech Medium-high tech Medium-low tech Low tech
Sales(t-2) 0.372 *** 0.349 *** 0.376 *** 0.461 *** 0.304 ***(28.82) (12.91) (17.2) (13.61) (8.76)
capital 0.075 *** 0.031 0.034 0.039 0.075 (4.19) (0.8) (1.09) (0.91) (1.71)
RD_intensity(t-2) -0.104 0.155 0.283 -1.374 -0.098 (-0.81) (0.74) (1.04) (-1.93) (-0.32)
R&D Outsourcing ratio (t-2) 0.028 0.065 0.089 -0.073 0.040 (0.76) (0.71) (1.27) (-0.6) (0.35)
capital adequacy ratio 0.103 *** 0.362 *** -0.018 0.183 ** 0.019 (4.75) (6.97) (-0.26) (2.27) (0.24)
export/sales -0.115 *** -0.130 *** 0.041 0.199 0.269 (-7.94) (-7.54) (0.41) (1.23) (1.95)
R&D employee Ratio -0.198 -0.502 ** -0.060 -0.451 -0.126 (-1.5) (-1.98) (-0.2) (-1.06) (-0.45)
Researcher Ratio -0.565 *** -0.447 -0.822 ** -1.354 ** 0.039 (-3.71) (-1.49) (-2.5) (-2.53) (0.11)
FTE Researcher Ratio -0.004 0.255 0.202 0.556 -0.146 (-0.04) (1.34) (0.92) (1.34) (-0.74) (-0.04) (1.34) (0.92) (1.34) (-0.74)
PhD. Researcher Ratio -0.059 0.001 -0.071 -0.087 0.202 (-1.27) (0.01) (-0.72) (-1.07) (1.2)
benefit -0.002 -0.014 0.011 0.022 -0.007 (-0.18) (-0.53) (0.14) (0.73) (-0.23)
CR4 0.192 -0.818 -1.475 -1.250 ** -1.120 (0.92) (-1.12) (-2.39) (-2.24) (-1.33)
R&D Outsourcing ratio X R&Dintenisty 1.669 *** 2.739 *** -0.446 -4.496 -1.554 (2.7) (2.7) (-0.31) (-0.92) (-0.87)
R&D Outsourcing ratio X FTE Researcher Ratio -0.047 -3.514 *** 3.071 -3.448 0.518 (-0.06) (-2.47) (1.87) (-1.35) (0.3)
R&D Outsourcing ratio X PhD. Researcher Ratio 1.567 7.285 *** 4.309 -0.352 2.754 (1.09) (2.7) (0.89) (-0.06) (0.45)
R&D Outsourcing ratio X R&D employee Ratio 0.743 5.264 *** -0.406 -2.628 -1.788 (0.87) (3.17) (-0.19) (-1.26) (-0.9)
R&D Outsourcing ratio X Researcher Ratio -0.567 -2.485 -3.046 5.574 1.851 (-0.68) (-1.51) (-1.58) (1.62) (1.07)
year included *** included *** included *** included *** included ***cons -59.792 *** -90.208 *** -57.479 *** -63.322 *** -58.458 ***
(-8.43) (-4.43) (-4.67) (-4.16) (-3.46) Adjusted-R2 0.911 0.795 0.839 0.892 0.911
F-Value for Δ Adjusted-R2 2.52*** 2.47*** 2.19*** 2.93*** 3.49***no of obs 8,029 1,938 2689 949 979
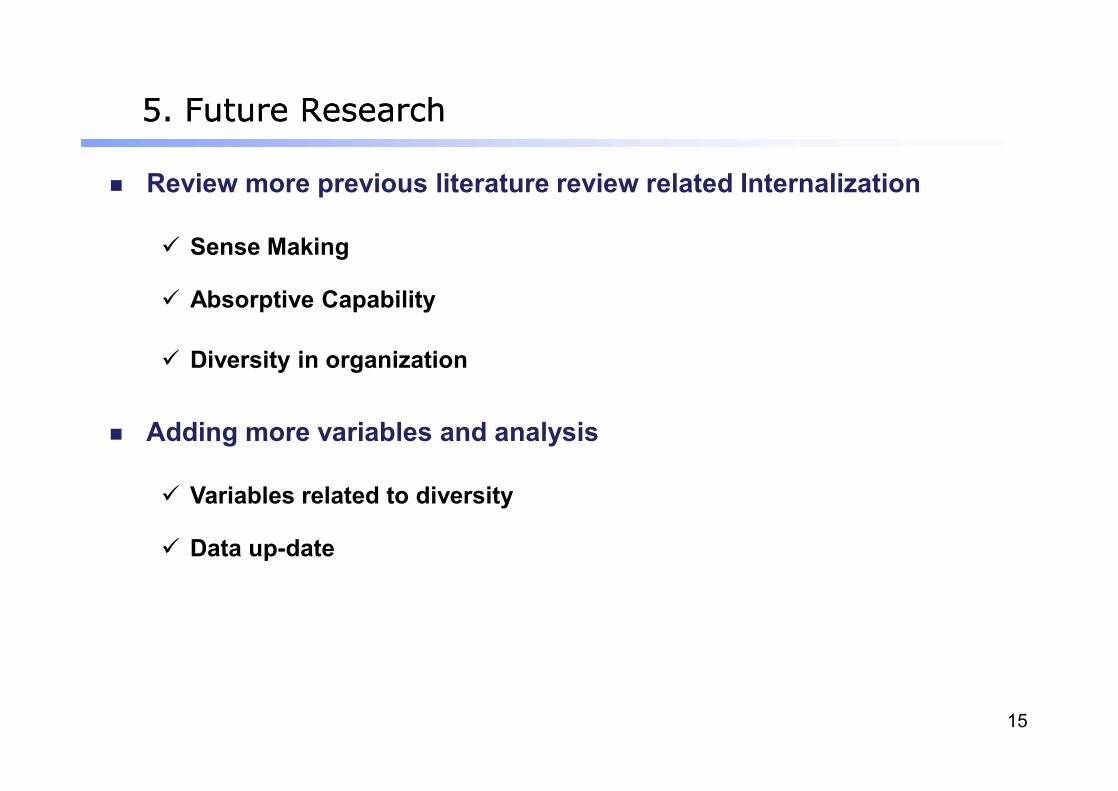
5. Future Research5. Future Research
n Review more previous literature review related Internalization
ü Sense Making
ü Absorptive Capability
ü Diversity in organization
15
n Adding more variables and analysis
ü Variables related to diversity
ü Data up-date

Thanks!
16
Thanks!