Embed Size (px)
Citation preview

ab0cd
Internal capital markets and lending by multinational bank subsidiaries
Ralph De Haas and Iman Van Lelyveld
Summary A defining feature of the banking systems in many transition countries is the large-scale presence of subsidiaries of multinational banks. We use new panel data on the intra-group ownership structure and the balance sheets of 45 of the largest banking groups in the world to analyse what determines the credit growth of their subsidiaries, many of which are in central and eastern Europe. We find that parent banks trade-off lending across several countries (“substitution effect”) and that they support weak subsidiaries (“support effect”). This provides evidence for the existence of internal capital markets through which multinational banks manage the credit growth of their subsidiaries. Greenfield subsidiaries are most closely integrated into such internal capital markets. Keywords: multinational banks, credit supply, internal capital markets JEL classification numbers: F15, F23, F36, G21 Address for correspondence: Ralph De Haas, European Bank for Reconstruction and Development, One Exchange Square, London EC2A 2JN, United Kingdom. Phone: +44 20 7338 7213 Fax: +44 20 7338 6110 Email: [email protected] Iman Van Lelyveld, De Nederlandsche Bank, Supervisory Policy Division, P.O. Box 98, 1000 AB Amsterdam, The Netherlands and Nijmegen School of Management, Radboud University, P.O. Box 9108, 6500 HK, Nijmegen, The Netherlands. Phone: +31 20 524 2024 (De Nederlandsche Bank); Email: [email protected] The authors would like to thank Elcin Akcura, Jack Bekooij, Cees de Boer and Ron Wunderink for excellent research assistance and Arnoud Boot, Robert-Paul Berben, Harry Garretsen, Neeltje van Horen, Maarten Gelderman, Charles Goodhart, Ross Levine, Peter Sanfey, and seminar participants at the University of Amsterdam, the Utrecht School of Economics, the London School of Economics, the World Bank, the Bank of Spain-European Central Bank “Financial Integration and Stability in Europe” Conference, and the XV “Tor Vergata” Conference for useful comments. All errors remain the authors’ own.
The working paper series has been produced to stimulate debate on the economic transformation of central and eastern Europe and the CIS. Views presented are those of the authors and not necessarily of the EBRD or De Nederlandsche Bank.
Working Paper No. 105 Prepared in January 2008
INTRODUCTION Across the world – but most notably in central and eastern Europe and Latin America – substantial parts of the banking system consist of subsidiaries of multinational banks. Also in large transition countries, such as Russia and China, the process of multinational bank penetration is expected to accelerate in the near future. Although many multinational banks are headquartered in Western Europe, banking consolidation in Western Europe itself has primarily occurred within national borders. However, the recent take-overs of German HVB Group by the Italian Unicredit Group and of ABN Amro by a consortium of Fortis Bank, Royal Bank of Scotland and Banco Santander, have been heralded in the media as the start of cross-border consolidation in this part of the world as well. The importance of cross-border banking consolidation and the related emergence of multinational banking groups have initiated a debate among policy-makers about the economic impact on the countries involved. Host countries in particular have a keen interest in the amount of money that multinational bank subsidiaries are willing to lend to domestic firms and households. When multinational banks enter a country – either through greenfield establishments or through taking over existing banks – the parent holding company may play an important role in determining the pace of local credit expansion. The empirical banking literature has remained relatively silent on the question of whether (legally independent) subsidiaries of multinational banks behave like economically independent organisations, similar to unaffiliated domestic banks. We use a new detailed dataset on the ownership structure and the credit supply of multinational banking groups to examine whether parent banks actively manage the credit growth of their subsidiaries. A substantial part of our dataset concerns multinational bank subsidiaries in transition countries, including Bulgaria, Croatia, the Czech Republic, Estonia, Latvia, Lithuania, Hungary, Poland, Russia, Slovenia, the Slovak Republic and Ukraine. We make a distinction between greenfield subsidiaries and take-over subsidiaries, as well as between subsidiaries that are geographically close to their parent bank and those that are further away. We analyse how lending by multinational bank subsidiaries is influenced by the macroeconomic situation in the host country and the home country, the subsidiary’s own financial characteristics, the financial characteristics of the parent bank and the financial characteristics of other subsidiaries in the same banking group.1 This is the first paper to analyse these determinants of multinational bank lending within an integrated empirical framework. Our detailed information on intra-bank ownership structures also allows us to deal with a problem that has plagued earlier empirical literature on multinational banking. Many studies that use aggregate bank lending data have difficulty in distinguishing between
1 We use the terms “parent bank” and “bank holding” alternately. “Host country” refers to the country where a multinational bank subsidiary operates and “home country” refers to the country where the parent bank is domiciled. “Other countries” are defined from the perspective of a particular subsidiary and include all other countries where the parent bank owns subsidiaries, excluding the host country of the particular subsidiary and excluding the home country. For example, in the case of HSBC Poland, the host country is Poland, the home country is the United Kingdom, and “other countries” refers to all countries where HSBC owns subsidiaries except for Poland and the United Kingdom.
1
general macroeconomic linkages between countries and the specific financial linkages in the form of multinational banks. The robustness tests at the end of this paper allow us to disentangle both factors. Our results show that parent banks indeed trade off lending across several countries (substitution effect) as they expand their business in those countries where economic conditions improve and decrease their activities where economic circumstances worsen. We also find that multinational banks tend to support weak subsidiaries (support effect). Both findings provide evidence for the existence of internal capital markets through which multinational banks manage the credit growth of their subsidiaries. Greenfield subsidiaries, and also subsidiaries that are at a greater geographical distance from their parent banks, turn out to be most closely integrated into such internal capital markets. In particular, we find that while the credit growth of (strongly integrated) greenfield subsidiaries is not sensitive to their own balance-sheet strength, this does not hold for the (more independent) take-overs. Apparently, the latter group can rely less on parental support and is thus forced to slow down their lending if their balance sheet gets weaker. Our findings also provide more general evidence that confirms anecdotal observations made during the recent global liquidity squeeze that started in the summer of 2007. An interesting case is the experience of the Kazakh banking system. For several years, Kazakh banks had depended on foreign funding to maintain their very high credit growth rates. Following the recent turmoil, most banks in Kazakhstan were forced to shelve refinancing plans through international bond issues or syndicated loans. This sudden stop in the availability of foreign financing translated directly into lower lending growth. However, not all banks in Kazakhstan were equally affected by the increased risk averseness of global financiers. For instance, ATF Bank, a mid-sized Kazakh bank, was acquired by the Italian UniCredit group in June 2007. Shortly after it obtained a one-year US$ 120 million credit line from its new parent bank as well as short-term credits totalling US$ 470 million. The stated goal of the parent bank was to support its new Kazakh subsidiary to continue its corporate and retail lending. This demonstrates the practical importance that parental support through internal capital markets may have within multinational banks. The remainder of this paper is structured as follows. In Section 1 we discuss the related literature and develop a number of theoretical priors. Section 2 then discusses the data we use, after which Section 3 explains our estimation methodology. Sections 4 and 5 present our empirical results and Section 6 concludes.
2

1. DETERMINANTS OF MULTINATIONAL BANK LENDING
Internal capital markets and multinational bank lending
This paper contributes to two areas in current banking research. A first strand of related literature deals with internal capital markets (Stein, 1997). In the absence of capital market frictions, a multinational bank would not operate an internal capital market. Subsidiaries would attract sufficient liabilities to finance profitable investment projects themselves and would choose their own credit growth strategy, independent of any financing from their parent bank. However, if capital markets do not function perfectly, subsidiaries may not be able to attract sufficient funds themselves.2 It is then advantageous for parent banks, with better access to external funding sources, to allocate scarce capital to their best-performing subsidiaries through an internal capital market. Empirical evidence on internal capital markets within banking groups is only available for the United States. Houston et al (1997) show for bank holding companies that the credit growth of a subsidiary is negatively correlated with the loan growth in other US subsidiaries of that holding. Dahl et al (2002), again for US bank holding companies only, show that such correlated credit growth patterns are due to net equity financing flows between the parent bank and its various subsidiaries. These papers therefore provide indirect and direct evidence, respectively, for bank holdings operating an internal capital market within a single country. To the best of our knowledge, this paper is the first to study this issue in an international context. The extension to an international context is important because empirical results based on national bank holdings may not apply to multinational banks because of the potentially large geographical and cultural distances (we return to this in Section 4.3).3 The second strand of related literature analyses the effect of multinational bank presence on aggregate bank lending in host countries. This body of research is implicitly linked to the internal capital market literature, since the operation of internal markets forms the main channel through which multinational banks can influence the credit growth of foreign subsidiaries. Morgan et al (2004) provide a model of a two-country banking system that can be used to analyse how multinational banks allocate bank capital across borders in reaction to economic shocks in the home country or a host country.4 Such shocks can be either real economic shocks – leading to improved or reduced investment opportunities in a particular country – or bank-specific capital shocks that wipe out part of a subsidiary’s capital. The parent bank reacts to such shocks by reallocating its capital to ensure that the return on bank capital is equalised across all countries of operation. This optimising behaviour leads to two effects. First, in case part of a subsidiary’s capital is wiped out, the parent bank will – all else being equal – support this subsidiary by allocating additional capital and liquidity to it. We term this the support effect. Such 2 Banks indeed face limitations with regard to the amount of capital they can raise (Froot and Stein, 1998). 3 Regulatory constraints at the national level may influence multinational bank lending as well. However, we expect that such constraints are more important for the initial entry decision of a multinational bank (Cerutti et al, 2007; Focarelli and Pozzolo, 2005) than for the dynamics in credit expansion once a multinational bank has set up or acquired a subsidiary in a particular country. 4 We use this model to derive our five theoretical priors as discussed in Section 2.2.
3

parental support implies that the presence of multinational banks can dampen bank capital shocks in the host country. Secondly, the multinational bank (re-)allocates capital over its subsidiaries depending on the expected (risk-adjusted) returns that are available in a certain country. We term this the substitution effect. The substitution effect implies that the presence of multinational banks may sharpen business cycles as they use their internal capital markets to actively shift capital away from “low return countries” to “high return countries”. A limited number of empirical studies on multinational bank lending have been conducted and these tend to confirm that multinational banks transmit shocks across borders. In line with support effects, lending by multinational banks tends to dampen host country financial shocks5 and to transmit home country financial shocks.6 In line with substitution effects, multinational bank lending also tends to be positively correlated with the host country business cycle7 and to be correlated, either positively or negatively, with the home country business cycle.8 Unfortunately, most of these empirical studies suffer from one or two important limitations. First, many studies limit themselves to multinational bank linkages between one specific home region (United States, Japan or Western Europe) and one specific host region (Latin America or central and eastern Europe). Secondly, a lot of studies are based on aggregate bank lending data, so that no bank-level information on intra-bank linkages can be exploited. This makes it difficult to convincingly attribute any empirical findings to multinational banks’ internal capital markets rather than to other more general, macroeconomic cross-country correlations.9 We contribute to this second strand of literature by using a broader sample of host, home and other countries of operations, though with a focus on European banking groups. More importantly, we use a new bank-level panel dataset that allows us to analyse the international linkages between subsidiaries of a multinational banking group in more detail and to come to more robust conclusions as regards the importance of internal capital markets within such bank holdings. Lastly, whereas Focarelli and Pozzolo (2005) analyse the determinants of multinational banks’ foreign expansion, we analyse what determines their lending behaviour once they have established foreign subsidiaries. 5 Dages et al (2000), Peek and Rosengren (2000b), Goldberg (2001), Crystal et al (2002), Martinez Peria et al. (2002) and De Haas and Van Lelyveld (2004, 2006). 6 Peek and Rosengren (1997, 2000a) and Van Rijckeghem and Weder (2000, 2001). 7 Dahl and Shrieves (1999), Buch (2000), Barajas and Steiner (2002), Jeanneau and Micu (2002), Morgan and Strahan (2004) and De Haas and Van Lelyveld (2006). 8 Hernandez and Rudolph (1995), Dahl and Shrieves (1999), Goldberg (2001), Jeanneau and Micu (2002), Martinez Peria et al (2002) and De Haas and Van Lelyveld (2006). Depending on the sample period and the sample of countries, some studies find a positive correlation between multinational bank lending and the home country business cycle, while other studies find a negative relationship. 9 Van Rijckeghem and Weder (2000, 2001) find, for instance, that multinational banks transmit currency crises as they adjust credit lines to third countries in reaction to significant losses in a crisis country. However, the authors use aggregate Bank for International Settlements data by nationality of lender and are therefore unable to directly measure intra-bank linkages at the bank level. Our dataset overcomes this data limitation.
4

Some priors on multinational bank lending
We use the theoretical framework by Morgan et al (2004) to derive several priors on how lending by multinational bank subsidiaries is influenced by internal capital markets. The model by Morgan et al is a multinational extension of the one-country banking model by Holmström and Tirole (1997), which provides for a theoretical exposition of how financial intermediation influences the real economy. In this incentive model, multinational banks are capital constrained and risk neutral and transmit shocks because they rebalance their international credit portfolios in reaction to country-specific shocks. Based on this model, we formulate the following priors:
1. Our first prior is that lending by multinational bank subsidiaries is negatively related to the business cycle in the home country and to the business cycle in the other countries where the parent bank operates. More generally, we expect host country lending to be negatively related to macroeconomic developments that make lending in the home country and in other countries more attractive compared to credit expansion in the host country (substitution effect, see Section 1.1).
2. Our second prior is that host country lending by multinational bank subsidiaries is insensitive to banking crises because they can rely on parental capital and liquidity back-up (support effect, see Section 1.1). This contrasts with the lending behaviour of domestic banks that tend to reduce lending during financial crises because their capital is reduced or because there is a reduced inflow (or even an outflow) of deposits.
3. Third, we expect that lending by multinational bank subsidiaries will not only be sensitive to the financial characteristics of the subsidiary itself but also to the financial position of the parent bank or other subsidiaries.
4. Fourth, we expect that the host country lending of multinational bank subsidiaries is positively related to the host country business cycle and to other host country macroeconomic developments that improve the risk/return characteristics of local lending. Although the credit supply of domestic banks may be procyclical as well, we expect that lending by multinational bank subsidiaries is more procyclical because of the added influence of the parent bank operating an internal capital market (substitution effect).
5. Fifth, we expect subsidiaries that are the result of a take-over to be relatively independent as they may not (yet) be fully integrated into the bank holding (see De Haas and Van Lelyveld, 2006). In contrast, we expect that newly established subsidiaries (greenfields) are relatively closely integrated into the bank holding and its capital allocation mechanism.
5

2. DATA AND DESCRIPTIVE STATISTICS Our sample of multinational banks is based on the Top 1000 list of the world’s largest banks (asset rank) as published by The Banker. Of the 150 largest banks we include all banks that operate more than one significant foreign subsidiary. For each of the 45 remaining bank holdings, we identify – on the basis of information taken from BankScope, from banks’ web sites and based on correspondence with banks – all subsidiaries for which the assets account for 0.5 per cent or more of the parent bank’s assets in 2004 and that are at least 50 per cent owned by the parent bank.10 We therefore limit ourselves to relatively large subsidiaries in which the parent has a controlling stake.11 Note that multinational banks not only operate through foreign subsidiaries but also through foreign branches. For the purpose of this paper, in which we focus on the operation of internal capital markets within multinational banks, we are mainly interested in foreign subsidiaries as these are legally independent affiliates and as such require a separate capitalisation.12 If parent banks are the result of a merger or acquisition in year t we only include them from year t+1 onwards. We only include banks for which we have at least three consecutive years of data, which means we have to exclude all Chinese and most Japanese banks. For each subsidiary, we trace back in which year t it became part of the holding. In case of greenfields we include data for the subsidiary from year t onwards, whereas subsidiaries that result from a take-over are included from t+1.13 A list of all bank holdings included in the sample can be found in Annex 1. As a double check on the quality of our database, we sent a letter to each parent bank asking it to confirm that the subsidiaries we had identified were indeed those considered as material by the parent bank itself. We also asked for the dates when non-greenfield subsidiaries were acquired. In a typical year, each parent bank in our sample is associated with, on average, 4.3 subsidiaries. The geographical distribution of parent banks (subsidiaries) used in the final analysis is as follows: 83 per cent (73 per cent) in Europe (of which many parent banks in Western Europe and many subsidiaries in central and eastern Europe); 13 per cent (15 per cent) in North America; 0 per cent (2 per cent) in South America; 1 per cent (8 per cent) in Asia; and 3 per cent (2 per cent) in Australia. This distribution of our sample reflects that North American and Asia-Pacific banks are relatively domestically oriented, whereas European banks are far more internationalised on average (IMF, 2007, p. 101). In recent years, Western European banks such as Erste Bank, KBC, Raiffeisen Bank and UniCredit have rapidly expanded eastwards by setting up networks of subsidiaries in several transition countries.
10 For each significant subsidiary (level 1) we also check whether it owns significant sub-subsidiaries (level 2) that are larger than 0.5 per cent of the ultimate bank holding (level 0). If this is not the case, we include consolidated data for the level 1 subsidiaries. If this is the case, we include unconsolidated data for the level 1 subsidiary and separately include consolidated data for the sub-subsidiary. 11 We only include commercial banks, savings banks, cooperative banks, real estate/mortgage banks and medium and long-term credit banks. We exclude investment banks, securities houses, government-owned banks and non-banking credit institutions. 12 For more details on the factors that determine whether multinational banks set up foreign branches or subsidiaries, see Cerutti et al (2007). 13 We do not include any subsidiaries based in Luxembourg or Switzerland, as in these countries multinational bank subsidiaries’ activities are mainly driven by the supply of deposits by (foreign) residents, rather than driven by either local macroeconomic developments or parent banks’ steering and capital support.
6
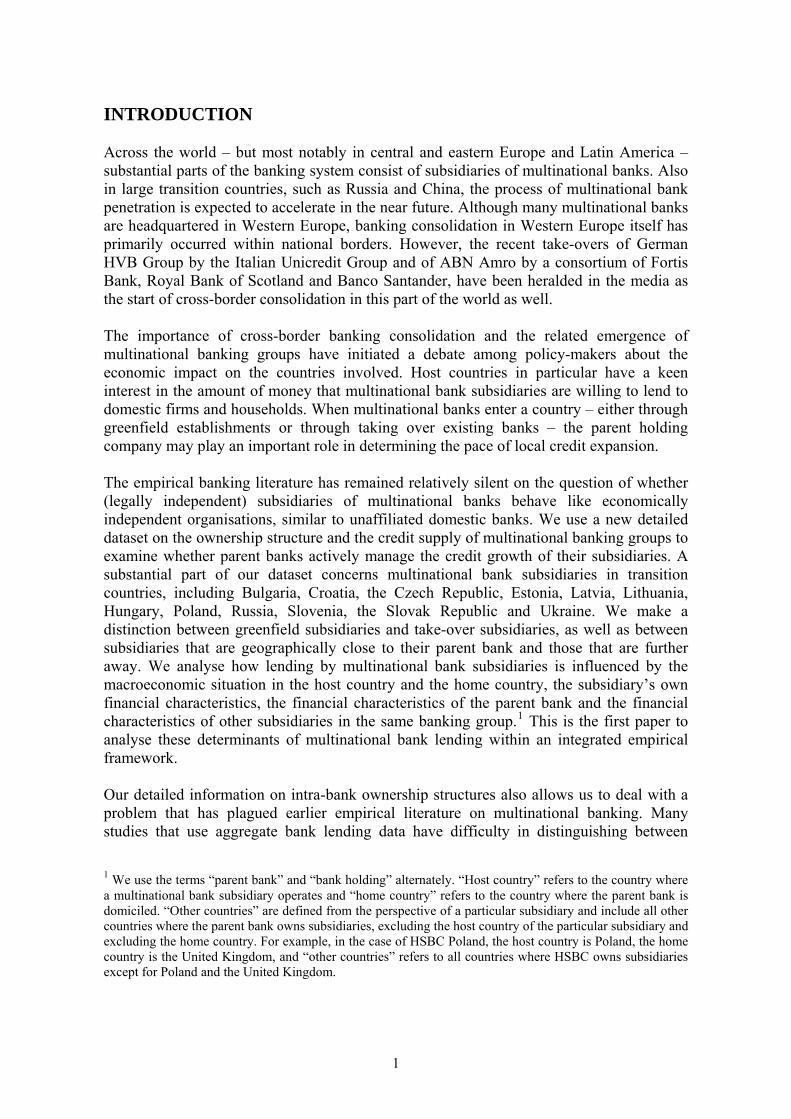
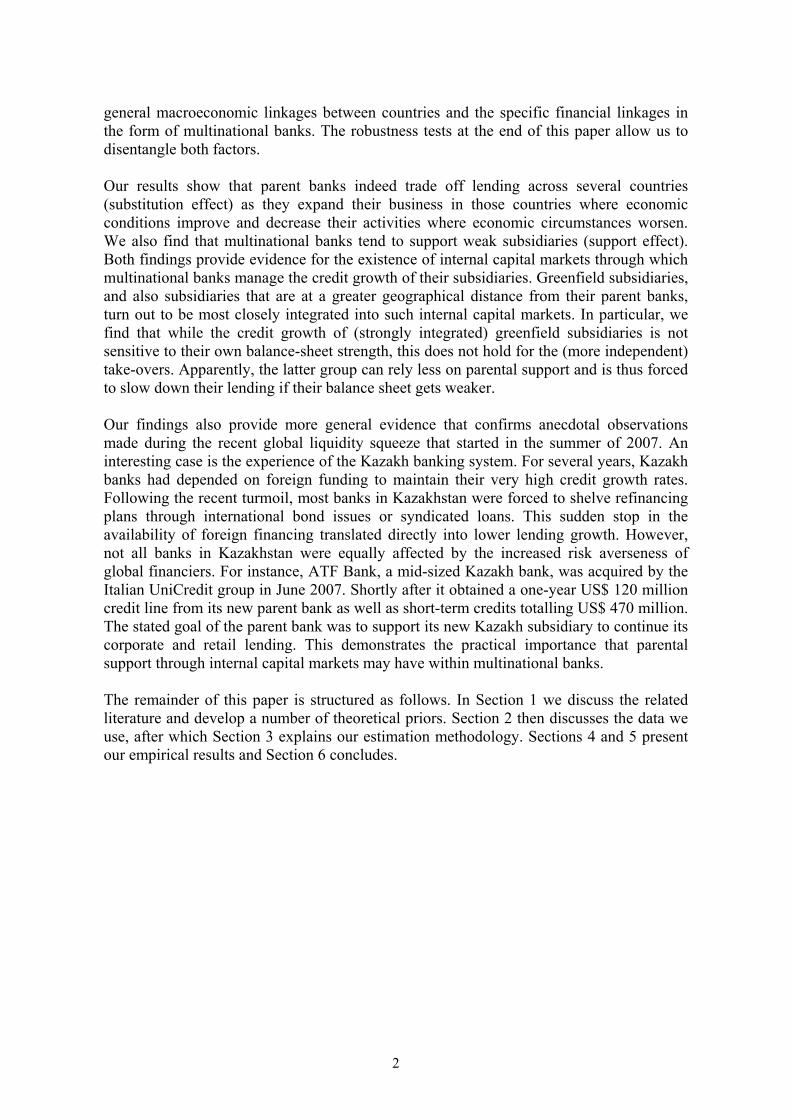
Over time both the number and size of the banks included in our dataset have grown, as shown in Charts 1 and 2. Chart 1 illustrates that internationally active banks have become more international – measured in terms of the number of foreign subsidiaries – especially though take-overs. In terms of total assets, we see in Chart 2 that growth has been even faster. The relative proportions of the assets of take-overs, greenfields and the parent bank are stable over time with on average shares of 4 per cent, 20 per cent and 76 per cent of total assets in our sample, respectively. Chart 1: Number of banks (1992-2004) Chart 2: Total assets (1992-2004)
050
100
150
200
250
No.
ban
ks
1992 1993 1994 1995 1996 1997 1998 1999 2000 2001 2002 2003 2004
Source: BankScope
Parent Takeover Greenfield
010
2030
Trilli
on $
1992 1993 1994 1995 1996 1997 1998 1999 2000 2001 2002 2003 2004
Source: BankScope
Parent Takeover Greenfield
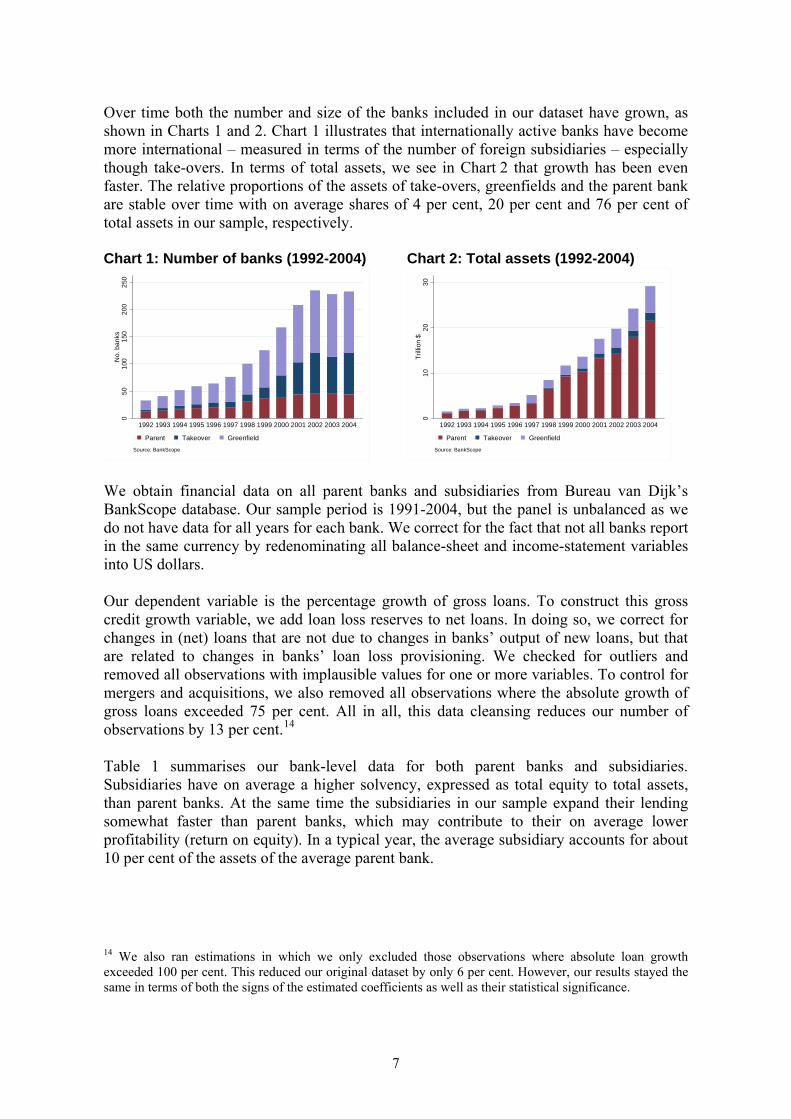
We obtain financial data on all parent banks and subsidiaries from Bureau van Dijk’s BankScope database. Our sample period is 1991-2004, but the panel is unbalanced as we do not have data for all years for each bank. We correct for the fact that not all banks report in the same currency by redenominating all balance-sheet and income-statement variables into US dollars. Our dependent variable is the percentage growth of gross loans. To construct this gross credit growth variable, we add loan loss reserves to net loans. In doing so, we correct for changes in (net) loans that are not due to changes in banks’ output of new loans, but that are related to changes in banks’ loan loss provisioning. We checked for outliers and removed all observations with implausible values for one or more variables. To control for mergers and acquisitions, we also removed all observations where the absolute growth of gross loans exceeded 75 per cent. All in all, this data cleansing reduces our number of observations by 13 per cent.14 Table 1 summarises our bank-level data for both parent banks and subsidiaries. Subsidiaries have on average a higher solvency, expressed as total equity to total assets, than parent banks. At the same time the subsidiaries in our sample expand their lending somewhat faster than parent banks, which may contribute to their on average lower profitability (return on equity). In a typical year, the average subsidiary accounts for about 10 per cent of the assets of the average parent bank.
14 We also ran estimations in which we only excluded those observations where absolute loan growth exceeded 100 per cent. This reduced our original dataset by only 6 per cent. However, our results stayed the same in terms of both the signs of the estimated coefficients as well as their statistical significance.
7
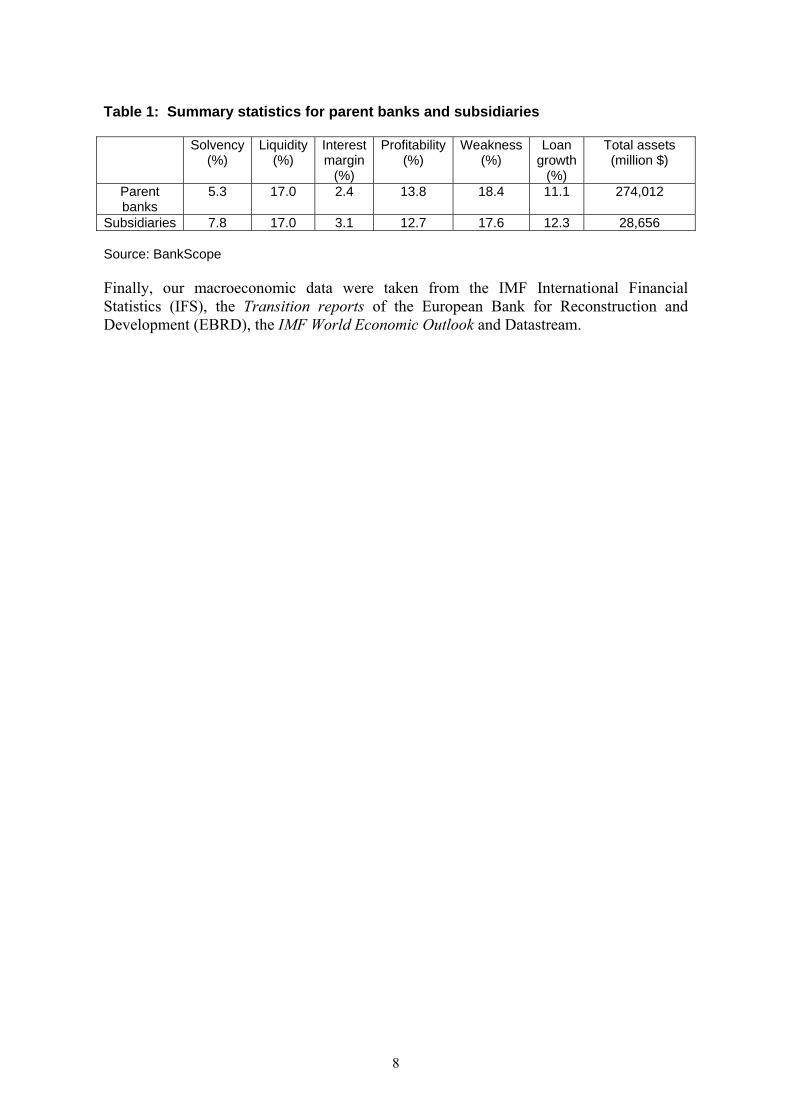
Table 1: Summary statistics for parent banks and subsidiaries
Solvency (%)
Liquidity (%)
Interest margin
(%)
Profitability (%)
Weakness (%)
Loan growth
(%)
Total assets (million $)
Parent banks
5.3 17.0 2.4 13.8 18.4 11.1 274,012
Subsidiaries 7.8 17.0 3.1 12.7 17.6 12.3 28,656 Source: BankScope Finally, our macroeconomic data were taken from the IMF International Financial Statistics (IFS), the Transition reports of the European Bank for Reconstruction and Development (EBRD), the IMF World Economic Outlook and Datastream.
8

3. ESTIMATION APPROACH AND METHODOLOGY We estimate three types of regressions to test the priors set out in Section 1.2. In all three estimations the dependent variable is the credit growth of subsidiary i and the independent variables include a standard set of host-country conditions and a standard set of financial characteristics of subsidiary i itself. To test for the presence of substitution and support effects, we add a number of additional determinants in each of the three regressions. The first regression – (1) – is the basic model where we treat the subsidiary as if it is operating on a stand-alone basis. Credit growth is then solely determined by subsidiary specific variables and host country macroeconomic variables (priors 2 and 4). In the second regression – (2) – we add as additional explanatory variables a number of parent bank characteristics (prior 3). To the extent that support effects are important, we expect to find an influence of the financial characteristics of the parent bank.15 In the third regression – (3) – we do not measure the influence of the financial condition of the parent bank, but explicitly test for substitution effects. We include variables related to the (weighted) average risk/return characteristics of the other subsidiaries of the same bank holding (prior 3). In doing so, we explicitly estimate the trade-off that parent banks face when deciding which parts of their international credit portfolio to expand or to reduce. For the same reason, we also include the average (weighted) GDP growth in the home country and other countries where the multinational bank operates (prior 1):
it
m
lkitkk
l
kitkkitit SUBHOSTLL εββγα ∑∑
+==− +++Δ+=Δ
1,
1,111 (1)
it
p
nk
q
pkitkkitkk
n
mkitkkitit PARENTSUBHOSTLL εβββγα ∑ ∑∑
+= +=+=− ++++Δ+=Δ
1 1,,
1,122 (2)
∑ ∑ ∑∑+= += +=+=
− ++++Δ+=Δs
rk
u
sk
v
ukitkkitkkitkk
r
qkitkkitit HOMEOTHCOSUBHOSTLL
1 1 1,,,
1,133 ββββγα
∑+=
++w
vkititkkOTHSU
1, εβ (3)
where • ΔLit (ΔLit-1) is the percentage credit growth of subsidiary i in year t (t-1 if lagged) • α1, α2 and α3 are intercept terms; γ1, γ2 and γ3 are coefficients and βk are coefficient
vectors • HOSTit is a matrix of host country macroeconomic variables • SUBit is a matrix of characteristics related to bank subsidiary i • PARENTit is a matrix of characteristics related to the parent bank holding of subsidiary i • HOMEit is a matrix of home country macroeconomic variables
15 As we use consolidated information on parent banks, endogeneity problems may occur in case of large subsidiaries. However, as a percentage of total parent bank assets, individual subsidiaries are relatively small, especially in our sample of the world’s largest banks, which in many cases also have significant non-financial operations and equity participations. Reverse causality is therefore unlikely.
9

• OTHCOit is a matrix of (weighted) macroeconomic variables related to the other countries where the bank holding operates (excluding the home country)
• OTHSUit is a matrix of (weighted) characteristics related to other subsidiaries of the parent bank
• itε is the idiosyncratic error, ( )2it 0, IID~ εσε
• i=1,..., N where N is the number of bank subsidiaries in the sample • t=1,..., Ti where Ti is the number of years in the sample for bank subsidiary i. HOST (HOME) includes host country (home country) macroeconomic variables that are likely to influence the (relative) attractiveness of expanding credit in a particular host country (home country). These are GDP growth (+), the unemployment rate (-), the average bank lending rate (+), the nominal exchange rate against the US dollar (+) and inflation (-) (expected sign for the host country variables in parentheses). Banks are likely to expand lending if GDP growth increases, unemployment is low, lending rates are higher and inflation is lower.16 We also include crisis dummies, HOSTCRIS (HOMECRIS), which take on the value of “1” in case the host (home) country experienced a banking crisis in a particular year.17 We expect bank credit to decline during banking crises, unless the subsidiary is financially supported by its parent bank (see the literature cited in Footnote 6). Similarly, OTHCO includes variables measuring the (weighted) macroeconomic development in the other countries of operation of the parent bank. These variables therefore reflect the (relative) attractiveness of expanding credit in other countries and proxy for the opportunity costs of expanding credit in a particular host country. For each year, we weigh the values for each country where a significant subsidiary is present with the size of the particular subsidiary relative to the sum of all subsidiaries of the same parent in our sample. For instance, in the earlier example of HSBC Poland (see Footnote 1), we construct an OTHCO GDP growth variable which measures the weighted average growth rate of all countries where HSBC operates except Poland and the United Kingdom. For example, if the HSBC subsidiary in Canada would be twice as large as the one in Ireland, Canadian GDP growth would count twice as much as Irish GDP growth.18 Finally, the OTHCRIS dummy is ‘0’ in all years except for those years in which there was a banking crisis in one or more other countries of the same banking group.19 16 See Footnotes 7 and 8 for earlier empirical studies that include these macroeconomic determinants. To the extent that host country inflation leads to an increase in the nominal value of loan portfolios there would be a positive effect of inflation on (nominal) credit growth. However, as we redenominated our data to US dollars, inflationary effects should disappear to the extent that PPP holds. We also include the nominal exchange rate to ensure that our results for the other macroeconomic explanatory variables are not driven by residual exchange rate fluctuations. 17 Information for constructing this crisis dummy is taken from Caprio and Klingebiel (2003) and Carstens et al (2004). For 2004, we constructed the dummy ourselves on the basis of several publications in print and on the internet. 18 In case of more than one subsidiary in a host country, we calculate the OTHCO macroeconomic variables on the basis of the other host countries only. For instance, when constructing the OTHCO GDP-growth variable for one of several Polish subsidiaries of the same parent bank, we do not include Polish GDP growth in the weighted OTHCO GDP-variable. This would, by construction, lead to multicollinearity between this variable and the Polish GDP-growth variable (included as a separate determinant). 19 This dummy is constructed by averaging for each year the ‘0’ and ‘1’scores for the other countries were the parent bank has subsidiaries (weighted with the size of the respective subsidiaries). The OTHCRIS dummy is then assigned value ‘1’ if the weighted value equals or exceeds 0.25 and a value of ‘0’ otherwise.
10
As for bank-specific risk and return variables, SUB consists of a number of characteristics of each subsidiary. First, we include solvency (total equity to total assets) and liquidity (total liquid assets to total assets) as measures of the bank’s risk aversion and of the capital/liquidity constraints of the bank. On the one hand, high capital and liquidity ratios may reflect that a bank is relatively risk-averse and expands credit only slowly. At the same time, bank subsidiaries with low capitalisation may be especially prone to moral hazard and rapidly expand (risky) lending (see Black and Strahan, 2002). Both effects imply a negative relationship between bank capital and loan growth. On the other hand, high capital and liquidity ratios may simply signal that liability constraints are less important, so that banks have ample room to expand their lending. The sign of these variables is thus indeterminate. Secondly, we include loan loss provisions to net interest revenue as a proxy for the general financial condition of the bank as well as its willingness to take on risk.20 An increase reflects that higher credit risk is only partially compensated for by higher interest margins and we therefore expect a negative effect on loan growth. Thirdly, we include the return on equity (+) and the net interest margin (-) as bank performance indicators. Finally, PARENT includes the same bank-specific variables for the parent bank of the particular subsidiary, whereas OTHSUB consists of (weighted) variables for the other subsidiaries of the bank holding (including those in the home country).21 To take into account that not all (types of) subsidiaries need to be equally sensitive to parent bank policies, we make an a priori distinction between relatively dependent and relatively independent subsidiaries by constructing an ownership dummy that is “1” for all greenfields and “0” for all take-overs. We expect that, on average, greenfields are more strongly integrated into the multinational bank holding than acquired banks, at least for a number of years. In a separate set of estimations of equations (1) to (3), we use this dummy to construct interaction terms with the variables that measure the characteristics of the parent bank and the other subsidiaries in the same bank holding. In this way we can explicitly test whether any substitution and support effects are stronger for greenfields than for acquired banks. For all regressions we use two estimation methodologies: fixed effects and a dynamic Generalised Method of Moments (GMM) panel-data estimator (Hansen, 1982; Arellano and Bond, 1991). The choice for fixed effects estimations is based on Hausman tests, which consistently point out that fixed effects are to be preferred to random effects, as the determinants of credit growth are correlated with the bank-specific effects. However, in a dynamic context the lagged dependent variable may depend on the panel-level effects, potentially leading to an inconsistent estimator when the time dimension is limited (Nickell, 1981). To solve this potential inconsistency problem, we also estimate all empirical models using a GMM framework. Two additional advantages of GMM are that it does not require distributional assumptions, such as normality, and that it allows for heteroscedasticity of unknown form. We use one-step estimators of the robust variety in order to correct for heteroscedasticity (based on the Sargent test statistics). Throughout all 20 Peek and Rosengren (2000b) find that non-performing loans of parent banks may have an even more significant impact on host-country lending than parent banks’ capitalisation. 21 In this case, contrary to the macroeconomic OTHCO variables, we also include information on other subsidiaries in the same host country and on any separate subsidiaries in the home country (see Footnote 18).
11
tables we report the outcomes of the Arellano-Bond (1991) test for autocorrelation of order 1 and 2. These consistently show that we cannot reject the null hypothesis of no second-order autocorrelation.22 An assumption underlying our panel analysis is that the series are stationary. We tested this for all the right-hand side variables using a number of tests (see Annex 2). As our time dimension is limited, so is the discriminating power of the tests. Furthermore, many of the tests require the panel to be balanced. Forcing this requirement implies dropping many of the subsidiaries. The overall conclusion is that the variables are neither all stationary (Hadri (2000) test) nor are all series non-stationary (Pesaran (2003) test). The Taylor and Sarno (1998) test indicates that the series are I(0).
22 Since the estimator is in first differences, first-order autocorrelation does not point to inconsistent estimates.
12
4. EMPIRICAL RESULTS Basic empirical results
We first estimate the basic model in which multinational bank subsidiaries’ credit growth only depends on lagged credit growth, characteristics of the subsidiary itself and host country characteristics (Table 2, columns 1 and 2). Experimenting with various macroeconomic variables led us to include only GDP growth, the unemployment rate and the crisis dummies, as these turn out to be relatively robust macroeconomic determinants of credit growth.23 We also include the nominal exchange rate.24 Table 2 shows that profitable bank subsidiaries expand their credit faster and that subsidiaries that are either relatively solvent or relatively liquid show lower rates of credit growth. A subsidiary that becomes one percentage point more profitable on average expands its lending by 0.22 percentage points faster per year. However, a subsidiary that becomes more liquid by one percentage point sees a reduction in credit growth of about 0.45 percentage points. Our conjecture is that relatively solvent and liquid banks are more risk averse and grow more slowly because they invest mainly in liquid assets.25 At the same time, undercapitalised subsidiaries with insured liabilities (or an expectation that they will be bailed out by their parent bank) may expand their (risky) lending relatively quickly (Vihriälä, 1996; Black and Strahan, 2002). Subsidiary banks also grow faster when economic growth is higher and unemployment is lower in the host country (confirming prior 4). For instance, an increase in GDP growth of one percentage point leads, all else equal, to an increase in a subsidiary’s credit growth of almost two percentage points. We also find that subsidiaries of multinational banks do not reduce their credit supply when the host country is hit by a systemic banking crisis. This last finding may point to parent banks giving financial support to their subsidiaries when the latter are confronted with adverse financial conditions. Section 5.1 provides similar estimation results for a benchmark group of domestic banks, which show that lending by domestic banks – which lack the support of a parent bank – is affected negatively by local banking crises. Therefore we find a clear difference between multinational bank subsidiaries and unaffiliated domestic banks (confirming prior 2).
23 Contrary to what one might expect, economic growth and the unemployment rate are not very strongly correlated over time and across countries in our sample. 24 See Footnote 16. Excluding the nominal exchange rate does not result in significant changes to the economic or statistical significance of any of the results. 25 Reverse causality could have been an issue here: banks that grow faster will become less liquid and less solvent if they cannot replenish their liquid assets and capital fast enough. However, note that GMM is an instrumental variables technique (where the instruments are lagged values of the variables themselves) and as such controls for reverse causality.
13

Table 2: Determinants of multinational bank lending: basic estimations Dependent variable: credit growth of multinational bank subsidiaries (in per cent) Fixed
effects GMM§ Fixed
effects GMM§ Fixed
effects GMM§
(1) (2) (3) (4) (5) (6) Lagged credit growth 0.06* 0.12** 0.03 0.09* 0.06 0.07 (0.10) (0.02) (0.45) (0.10) (0.15) (0.25) Weakness subsidiary 0.00 0.00 0.00 0.00 -0.02 -0.03 (1.00) (0.84) (0.86) (0.72) (0.72) (0.68) Profitability subsidiary 0.26*** 0.16* 0.27*** 0.17** 0.15 0.01 (0.00) (0.08) (0.00) (0.05) (0.26) (0.93) Liquidity subsidiary -0.50*** -0.48*** -0.43*** -0.52*** -0.35** -0.39** (0.00) (0.00) (0.00) (0.01) (0.02) (0.05) Solvency subsidiary -1.14*** -0.97** -1.13*** -0.90** -1.12*** -0.78* (0.00) (0.02) (0.00) (0.03) (0.01) (0.06) GDP growth host 1.69*** 1.64*** 1.86*** 1.84*** 2.06*** 2.16*** (0.00) (0.00) (0.00) (0.00) (0.00) (0.00) Unemployment host -0.98** -0.45 -1.39** -1.06 -1.92*** -1.20** (0.02) (0.37) (0.01) (0.15) (0.00) (0.05) Exchange rate (US$) -0.01 -0.01 -0.01 -0.00 -0.01 -0.00 (0.40) (0.59) (0.32) (0.88) (0.51) (0.99) Crisis dummy host -2.16 -0.20 -0.17 0.62 -1.04 4.25 (0.59) (0.97) (0.97) (0.90) (0.86) (0.55) Weakness parent bank -0.05 -0.11 (0.47) (0.15) Profitab. parent bank -0.22 -0.21 (0.17) (0.28) Liquidity parent bank -0.52*** -0.45** (0.00) (0.05) Interest margin parent 5.85*** 8.31*** (0.00) (0.00) GDP growth home -2.32*** -2.37*** (0.00) (0.01) Weakness other subs -0.06 -0.13 (0.45) (0.13) Profitability other subs 0.17* 0.22*** (0.10) (0.01) Liquidity other subs -0.13 -0.20 (0.34) (0.15) Solvency other subs -0.03 -0.62 (0.95) (0.17) Crisis other countries -13.71 -17.98 (0.21) (0.18) Constant 29.40*** 0.54 28.83*** 0.45 42.55*** 0.63 (0.00) (0.11) (0.00) (0.33) (0.00) (0.13) Observations 967 763 905 703 677 524 Number of banks 194 183 194 182 147 139 R2
within 0.12 - 0.14 - 0.15 - Hausman& 0.00 - 0.00 - 0.00 - AB test AR1¶ - 0.00 - 0.00 - 0.00 AB test AR2¦ - 0.63 - 0.41 - 0.93 Wald statistic~ - - 0.00 0.00 0.12 0.00 Source: BankScope, Datastream, EBRD, IMF.
14

Note: p values in parentheses * significant at 10 per cent; ** significant at 5 per cent; *** significant at 1 per cent § Arellano-Bond (1991) dynamic panel-data estimator (one-step, robust) & p value of Hausman specification test ¶ p value of Arellano-Bond test that average autocovariance in residuals of order 1 is 0 ¦ p value of Arellano-Bond test that average autocovariance in residuals of order 2 is 0 ~ p value of Wald test that parameters associated with parent bank/other subsidiaries variables are jointly 0 Columns 3 and 4 show similar estimations, but now we also add characteristics of the parent bank. Our earlier results do not change: subsidiaries of multinational banks grow faster when host country economic growth is high and when they are relatively profitable. Subsidiaries that show high levels of solvency and/or liquidity generally expand their credit less swiftly. Interestingly, this expanded empirical model also shows that the balance-sheet structure of the parent bank matters for subsidiary growth. In particular, subsidiaries of parent banks that enjoy high net interest margins tend to grow faster.26 On the contrary, subsidiaries of parent banks that are highly liquid tend to grow slower, which is in line with our result for the liquidity of the subsidiaries themselves. These last two findings are in line with support effects (prior 3). Finally, we estimate a set of regressions in which we include (weighted) variables related to the other subsidiaries of the same multinational bank holding (columns 5 and 6).27 Again, we replicate our finding that subsidiaries’ credit growth is positively related to the host country business cycle and negatively to their own liquidity and solvency. However, profitability is no longer a significant determinant of credit growth.28 Instead, we find that when other subsidiaries in the same group are relatively profitable, this positively influences the credit supply of a subsidiary (prior 3). Note that in case substitution effects would dominate, one would expect a negative relationship between other subsidiaries’ profitability and credit growth. Apparently, support effects are more important here: with (other) profitable subsidiaries, parent banks are able to give more capital support to a particular subsidiary. This support effect also seems to dominate the influence of subsidiaries’ own profitability. We also find that GDP growth in the home country exerts a negative influence on subsidiaries’ credit growth: a one percentage point higher economic growth in the home country leads to a reduction in a foreign subsidiary’s lending growth of about 2.3 percentage points. Parent banks weigh expanding credit growth in the home country against credit growth in the host country (substitution effect, confirming prior 1).
26 Because of the high (0.8) correlation between parent banks’ interest margin and their solvency we only include parent banks’ interest margin. 27 Because of the high (0.6) correlation between other subsidiaries’ interest margin and other subsidiaries’ solvency we only include other subsidiaries’ solvency. We include home country GDP growth but not the weighted GDP growth in the other countries of operation as both economic growth rates tend to be highly correlated. 28 The number of banks in these two sets of estimations is smaller because we remove all subsidiary banks that operate in the same country as their parent bank. For these subsidiaries, the home country and the host country coincide so that we have to exclude them from our sample in order to prevent any artificial multicollinearity between the home country variables and the host country variables.
15

Greenfield versus take-over multinational bank subsidiaries
We expect that subsidiaries that are the result of a take-over are relatively independent as they may not (yet) be fully integrated into the bank holding. In contrast, greenfield subsidiaries – which have been built up from scratch by the parent bank – are expected to be more closely integrated into the bank holding and its internal capital market (see prior 5). To test whether this is borne out by the data, we re-estimate the empirical models, this time interacting the main determinants with an ownership dummy which is 1 for greenfields and 0 for take-overs. We do not include separate ownership dummies since we are only interested in the effect of ownership on the strength of the earlier identified substitution and support effects and not so much in the separate effect of subsidiary type on credit growth.29 Since we want to keep the empirical models as parsimonious as possible we eliminate the most insignificant interaction terms, starting with the least significant ones. This is necessary since including too many interaction effects would lead to an overly large instrument matrix in the GMM estimations. Table 3 reports the results (see page 17). As before, we find that lending by multinational bank subsidiaries is sensitive to their own profitability (+), liquidity (-) and solvency (-), as well as to GDP growth in the home country (-). In case other subsidiaries in the same group are relatively profitable, this stimulates the credit supply of a subsidiary and dominates the effect of the subsidiary’s own profitability. We also confirm that subsidiaries of parent banks with high interest margins grow faster, whereas subsidiaries of highly liquid bank holdings grow slower. On the basis of the interaction terms, we find weak evidence (10 per cent confidence level) that while lending by take-over subsidiaries is sensitive to the weakness of their balance sheet, this does not seem to hold for greenfield subsidiaries. This is in line with a stronger role of the parent bank in the case of greenfields compared to take-overs. Also, we find strong evidence that host country GDP growth only matters for greenfield subsidiaries. The credit supply of take-overs is much less procyclical, perhaps because these banks have not yet been well integrated into the parent bank and substitution effects are therefore less important.
29 Moreover, bank ownership is a time-invariant, bank-specific variable and its influence is already captured by our fixed effects in the FE estimations.
16

Table 3: Determinants of multinational bank lending: ownership interaction terms Dependent variable: credit growth of multinational bank subsidiaries (in per cent) Fixed
effects GMM§ Fixed
effects GMM§ Fixed
effects GMM§
(1) (2) (3) (4) (5) (6) Lagged credit growth 0.05 0.09* 0.02 0.07 0.06 0.07 (0.19) (0.07) (0.50) (0.19) (0.15) (0.26) Weakness subsidiary -0.12* -0.13* -0.12* -0.12 -0.11 -0.12 (0.06) (0.07) (0.07) (0.14) (0.13) (0.14) Weakness/greenfield interaction
0.13* 0.13* 0.12* 0.12 0.14 0.12
(0.06) (0.07) (0.07) (0.14) (0.12) (0.19) Profitability subsidiary 0.24*** 0.18* 0.25*** 0.20** 0.16 0.05 (0.01) (0.08) (0.00) (0.05) (0.24) (0.74) Liquidity subsidiary -0.50*** -0.51*** -0.42*** -0.48*** -0.35** -0.40** (0.00) (0.00) (0.00) (0.01) (0.02) (0.03) Solvency subsidiary -1.10*** -1.07*** -1.07*** -1.09*** -1.08** -0.85** (0.00) (0.01) (0.00) (0.01) (0.01) (0.04) GDP growth host -0.51 -0.39 -0.55 -0.63 0.06 0.34 (0.50) (0.62) (0.48) (0.51) (0.95) (0.62) GDP growth/greenfield interaction
2.59*** 2.46*** 2.94*** 2.93*** 2.42*** 2.20***
(0.00) (0.01) (0.00) (0.00) (0.01) (0.00) Exchange rate (US$) -0.01 -0.01 -0.01 -0.01 -0.01 0.00 (0.27) (0.39) (0.19) (0.56) (0.38) (0.96) Crisis dummy host -4.61 0.08 -2.28 1.11 -1.54 4.34 (0.24) (0.99) (0.62) (0.83) (0.79) (0.55) Unemployment host -0.87** -0.31 -1.24** -0.95 -1.83*** -1.05* (0.04) (0.55) (0.02) (0.19) (0.00) (0.10) Weakness parent bank -0.05 -0.12 (0.52) (0.15) Profitability parent bank -0.23 -0.21 (0.14) (0.27) Liquidity parent bank -0.54*** -0.42** (0.00) (0.04) Interest margin parent 5.98*** 7.37*** (0.00) (0.00) GDP growth home -2.24*** -2.39*** (0.00) (0.00) Weakness other subs -0.06 -0.12 (0.42) (0.13) Profitability other subs 0.18* 0.27*** (0.05) (0.00) Liquidity other subs -0.12 -0.21 (0.41) (0.14) Solvency other subs -0.09 -0.69 (0.86) (0.15) Crisis other countries -14.16 -15.86 (0.20) (0.25) Constant 30.73*** 0.55 29.91*** 0.48 42.42*** 0.71* (0.00) (0.12) (0.00) (0.29) (0.00) (0.10) Observations 971 765 908 704 677 524 Number of banks 195 184 195 183 147 139 R2
within 0.13 - 0.16 - 0.16 - Hausman& 0.00 - 0.00 - 0.00 - AB test AR1¶ - 0.00 - 0.00 - 0.00 AB test AR2¦ - 0.69 - 0.42 - 0.96 Wald statistic~ - - 0.00 0.00 0.09 0.00 Source: BankScope, Datastream, EBRD, IMF.
17

Note: p values in parentheses * significant at 10 per cent; ** significant at 5 per cent; *** significant at 1 per cent § Arellano-Bond (1991) dynamic panel-data estimator (one-step, robust) & p value of Hausman specification test ¶ p value of Arellano-Bond test that average autocovariance in residuals of order 1 is 0 ¦ p value of Arellano-Bond test that average autocovariance in residuals of order 2 is 0 ~ p value of Wald test that parameters associated with parent bank/other subsidiaries variables are jointly 0 “Ownership” is a dummy which takes on the values of 0 (1) for take-overs (greenfields) The influence of geographical distance
The influence of parent bank characteristics and economic developments in the home country on subsidiaries’ credit growth may change if the distance between the parent bank and a subsidiary increases. In case of a larger distance, parent banks can operate an internal capital market on a more objective basis since there is less room for local bank managers to influence the headquarters with “softer” arguments (Carlin et al, 2006). The incentives of subsidiary bank managers need not be fully aligned with those of the bank as a whole, leading to internal agency costs. Banks with distant subsidiaries may be less liable to such internal agency costs if they use more formally structured decision-making mechanisms that reduce the opportunities for foreign subsidiary managers to evade the financial discipline of the internal capital market.30 Parent banks are then more likely to reduce the capital that is allocated to subsidiaries in slowly growing economies (“loser sticking”) and to increase capital to subsidiaries in high growth countries (“winner picking”). However, this effect may be partly or completely counterbalanced if greater distances between parents and subsidiaries would mean that more internal information is lost and the operation of an internal capital market therefore becomes more difficult.31 To analyse the importance of geographical distance, we interact all macroeconomic variables and parent bank characteristics with a measure of the geographical distance between the parent bank and the subsidiary.32 This variable is calculated on the basis of the latitude and longitude co-ordinates of both banks using the great circle distance formula, which measures the shortest distance between any two points along a path on the surface of the earth. Regression estimations showed that especially the interaction term between host country GDP growth and geographical distance is significantly positive and robust. The procyclicality of subsidiary lending therefore turns out to be mainly due to foreign subsidiaries that are relatively far away from the parent banks. Table 3 already shows that the strong procyclical lending behaviour of multinational bank subsidiaries was driven by greenfield subsidiaries. This leads to the question of whether greenfield subsidiaries are, on average, further away from their parent banks than subsidiaries that are the result of a take-over. This turns out to be the case: foreign greenfields are on average 773 km further away from their parents than foreign take-overs (but this difference is not significant).
30 See Degryse et al (2007) for an overview of the literature on how distance and organisational structure influence bank lending. 31 See Carlin et al (2006) for a similar application to non-financial multinationals. 32 As in Table 3 and in line with Carlin et al (2006) we do not include distance as a separate determinant as we are only interested in the effect of distance on the influence of the parent bank and not so much in any separate effect distance may have on the credit growth of a multinational bank subsidiary.
18

So are greenfields really different from take-over subsidiaries as regards their integration into the multinational bank or are they just different because they tend to be further away? Table 4 shows regressions similar to those in Table 3, but now also including the interaction term between host-country GDP growth and geographical distance. It transpires that the procyclicality of local lending is driven by both the greenfield effect and the distance effect. Greenfields are not just different because they are on average further away from the parent bank. They are also more strongly integrated into the parent bank. Table 4: Determinants of multinational bank lending: ownership interaction terms and distance interaction terms Dependent variable: credit growth of multinational bank subsidiaries (in per cent) Fixed
effects GMM§ Fixed
effects GMM§ Fixed
effects GMM§
(1) (2) (3) (4) (5) (6) Lagged credit growth 0.06* 0.12** 0.04 0.08 0.07* 0.08 (0.07) (0.02) (0.33) (0.13) (0.10) (0.20) Weakness subsidiary -0.00 -0.00 0.00 -0.00 -0.02 -0.03 (0.89) (0.92) (0.99) (0.95) (0.65) (0.64) Profitability subsidiary 0.27*** 0.18** 0.28*** 0.21** 0.18 0.06 (0.00) (0.04) (0.00) (0.02) (0.18) (0.70) Liquidity subsidiary -0.50*** -0.48*** -0.42*** -0.49*** -0.35** -0.34* (0.00) (0.00) (0.00) (0.01) (0.02) (0.08) Solvency subsidiary -1.06*** -0.89** -1.00*** -0.70* -1.03*** -0.70* (0.00) (0.02) (0.01) (0.08) (0.01) (0.08) GDP growth host -0.93 -1.26 -1.19 -1.87* -0.35 0.04 (0.26) (0.18) (0.18) (0.09) (0.75) (0.98) GDP growth/greenfield interaction
1.95*** 1.92** 2.32*** 2.55*** 1.82** 1.77**
(0.01) (0.02) (0.00) (0.00) (0.04) (0.02) GDP/distance interaction
0.16** 0.20** 0.17** 0.21** 0.12 0.08
(0.03) (0.02) (0.03) (0.02) (0.27) (0.55) Exchange rate (US$) -0.01 -0.01 -0.01 -0.01 -0.01 -0.00 (0.35) (0.41) (0.29) (0.67) (0.55) (0.87) Crisis dummy host -2.07 -0.39 0.63 1.03 2.53 3.46 (0.60) (0.94) (0.90) (0.84) (0.68) (0.64) Unemployment host -1.03*** -0.49 -1.31** -0.92 -1.98*** -1.09* (0.01) (0.32) (0.02) (0.19) (0.00) (0.07) Weakness parent bank -0.06 -0.13* (0.38) (0.09) Profitability parent bank
-0.13 -0.09
(0.40) (0.64) Liquidity parent bank -0.55*** -0.52** (0.00) (0.02) Interest margin parent 5.39*** 7.06*** (0.01) (0.00) GDP growth home -1.79** -1.94* (0.04) (0.10) Weakness other subs -0.07 -0.13 (0.33) (0.14) Profitability other subs 0.17* 0.23*** (0.10) (0.00)
19

Liquidity other subs -0.14 -0.19 (0.34) (0.19) Solvency other subs -0.05 -0.58 (0.92) (0.20) Crisis other countries -11.42 -15.83 (0.30) (0.24) Constant 31.20*** 0.56* 30.47*** 0.41 42.78*** 0.70* (0.00) (0.10) (0.00) (0.36) (0.00) (0.09) Observations 967 763 905 703 674 523 Number of banks 194 183 194 182 146 138 R2
within 0.13 - 0.16 - 0.16 - Hausman& 0.00 - 0.00 - 0.00 - AB test AR1¶ - 0.00 - 0.00 - 0.00 AB test AR2¦ - 0.62 - 0.39 - 0.94 Wald statistic~ - - 0.00 0.00 0.10 0.00 Source: BankScope, Datastream, EBRD, IMF. Note: p values in parentheses * significant at 10 per cent; ** significant at 5 per cent; *** significant at 1 per cent § Arellano-Bond (1991) dynamic panel-data estimator (one-step, robust) & p value of Hausman specification test ¶ p value of Arellano-Bond test that average autocovariance in residuals of order 1 is 0 ¦ p value of Arellano-Bond test that average autocovariance in residuals of order 2 is 0 ~ p value of Wald test that parameters associated with parent bank/other subsidiaries variables are jointly 0 “Ownership” is a dummy which takes on the values of 0 (1) for take-overs (greenfields)
20
5. ROBUSTNESS The empirical results presented in Section 4 are in line with support effects and substitution effects: the credit growth of subsidiaries is partly determined by developments in other parts of the multinational banking group. However, the results we find may to some extent also reflect other mechanisms that do not reflect intra-bank relationships. For instance, macroeconomic developments in the home country may affect the lending of a multinational bank subsidiary in a host country because of more general linkages between the home country and the host country. Such linkages may also influence the credit supply of domestic banks. As an example, if economic growth in Spain picks up, this may lead Spanish (non-financial) firms that operate in both Spain and Latin America to expand their Spanish activities at the expense of their Latin American operations. To the extent that this shift in focus reduces their demand for bank financing in Latin America, lending by Spanish bank subsidiaries and domestic Latin American banks will decrease. We would then observe a negative correlation between Spanish GDP growth and lending by all types of banks in Latin America. Note that such a negative relationship cannot be attributed to an active involvement of the Spanish parent banks in the credit supply of their foreign subsidiaries. Rather, it would reflect a passive reaction of multinational bank subsidiaries and/or of domestic banks to changes in credit demand that follow from general macroeconomic linkages. To analyse the extent to which our results are driven by such general macroeconomic linkages between countries, in addition to specific intra-bank financial relationships, we perform two robustness tests. Domestic banks as a benchmark
As a first robustness test we estimate the same regressions as in Table 2, but now for a benchmark group consisting of the five largest domestically-owned banks in each host country (Table 5). The domestic banks in this benchmark group are on average very similar to the multinational bank subsidiaries (see Annex 2). The main difference is that domestic banks have substantially higher loan loss provisions to net interest revenue ratios, indicating a weaker loan portfolio. In the first two columns of Table 5 the basic model, in which credit growth only depends on the bank’s own characteristics and on local economic developments, is re-estimated. The results indicate that domestic bank lending depends on profitability, liquidity, solvency and the local business cycle in much the same way as lending by multinational bank subsidiaries does. However, lending by domestic banks tends to be somewhat less procyclical (lower sensitivity to host country growth) than lending by multinational bank subsidiaries (in line with prior 4). Another interesting difference is that domestic bank lending decreases substantially and significantly during banking crises: when a country is hit by a banking crisis, domestic banks on average reduce their bank lending growth by more than seven percentage points. This stands in sharp contrast to the results in Table 2 where none of the estimations provides any evidence that lending by multinational bank subsidiaries is sensitive to episodes of banking stress. Apparently, multinational bank subsidiaries can rely on
21

parental capital and liquidity back-up in case of a financial crisis in the host country, a form of support that is obviously not available to domestic banks. This finding confirms our second prior and is in line with results reported by De Haas and Van Lelyveld (2006) for a sample of transition countries. We also want to check whether lending by domestic banks is influenced by developments in the home countries of their foreign competitors. If we find such influences, this would imply that our earlier results for multinational bank subsidiaries do not only reflect intra-bank linkages but also broader economic relationships between home countries and host countries. To analyse this issue, we link each domestic bank to a “foster parent bank”. We create for each host country a set of foster parent banks that includes all the parent banks of the multinational bank subsidiaries that operate in that host country. When this number of foster parent banks was less than five, we added additional banks from the same home countries. We then randomly assign one of these foster parent banks to each domestic bank. As the results of a single random assignment are not representative, we estimate each model 1,000 times. Table 5 reports the mean estimated coefficients and p values of these 1,000 runs in columns 3 to 6. Since no real ownership linkages exist between the domestic banks and their foster parent banks, any results we would find that point to a sensitivity to the foster parent bank’s characteristics (columns 3 and 4) or to the characteristics of other subsidiaries of the foster parent bank (columns 5 and 6) cannot be explained by an internal capital market and must therefore be attributed to more general macroeconomic linkages.
22

Table 5: Determinants of domestic bank lending Dependent variable: credit growth of domestic banks (in per cent) Fixed
effects GMM§ Fixed
effects GMM§ Fixed
effects GMM§
(1) (2) (3) (4) (5) (6) Lagged credit growth 0.06** 0.04 0.01 -0.05 0.07 0.08 (0.03) (0.50) (0.82) (0.32) (0.12) (0.20) Weakness domestic bank 0.00 0.00 0.00 -0.01 0.02 0.01 (0.70) (0.81) (0.86) (0.82) (0.74) (0.86) Profitability domestic bank 0.44*** 0.41*** 0.54*** 0.42*** 0.27** 0.21 (0.00) (0.00) (0.00) (0.01) (0.05) (0.25) Liquidity domestic bank -0.23*** -0.29** -0.29*** -0.41** -0.32** -0.22 (0.00) (0.04 (0.01) (0.05) (0.03) (0.30) Solvency domestic bank -0.69*** -0.79* -0.91*** -0.73 -1.03** -0.61 (0.00) (0.09) (0.00) (0.19) (0.04) (0.38) GDP growth host country 1.24*** 1.62*** 0.85*** 1.21*** 1.78*** 1.76*** (0.00) (0.00) (0.01) (0.00) (0.00) (0.01) Unemployment host country -1.09*** 0.21 -0.68 0.37 -2.00*** -0.81 (0.00) (1.00) (0.16) (0.63) (0.00) (0.42) Crisis dummy host country -6.93*** -4.37* -9.62*** -7.55*** 3.75 6.08 (0.00) (0.07) (0.00) (0.00) (0.56) (0.46) Exchange rate (US$) -0.01** -0.02*** -0.02* -0.02*** -0.02 -0.02 (0.04) (0.00) (0.06) (0.00) (0.18) (0.22) Weakness foster parent 0.01 -0.06 (0.89) (0.51) Profitability foster parent -0.06 -0.16 (0.72) (0.51) Liquidity foster parent -0.08 0.29 (0.62) (0.23) Interest margin foster parent 3.18 11.16*** (0.13) (0.00) GDP growth foster home country
-1.24* -1.68*
(0.10) (0.06) Weakness other subs foster -0.05 -0.07 (0.50) (0.30) Profitability other subs foster 0.06 0.15 (0.78) (0.49) Liquidity other subs foster -0.14 -0.28 (0.38) (0.15) Solvency other subs foster -0.12 -0.24 (0.82) (0.67) Crisis other countries foster -9.21 -11.17 (0.20) (0.28) Constant 22.73*** 0.22 19.42*** 1.45*** 40.82*** 0.29** (0.00) (0.37) (0.01) (0.00) (0.00) (0.05) Observations 1413 1241 957 719 653 487 Number of banks 185 175 184 172 148 138 R2
within 0.13 - 0.13 - 0.14 - Hausman& 0.00 - 0.00 - 0.00 - AB test AR1¶ - 0.00 - 0.00 - 0.00 AB test AR2¦ - 1.76 - 1.69 - 0.31 Wald statistic~ - - 0.00 0.00 0.08 0.00
23

Source: BankScope, Datastream, EBRD, IMF. Note: p values in parentheses * significant at 10 per cent; ** significant at 5 per cent; *** significant at 1 per cent § Arellano-Bond (1991) dynamic panel-data estimator (one-step, robust) & p value of Hausman specification test ¶ p value of Arellano-Bond test that average autocovariance in residuals of order 1 is 0 ¦ p value of Arellano-Bond test that average autocovariance in residuals of order 2 is 0 ~ p value of Wald test that parameters associated with parent bank/other subsidiaries variables are jointly 0 The results show that domestic banks are generally not sensitive to the liquidity and net interest margin of their foster parent banks.33 We also find that while lending by multinational bank subsidiaries is sensitive to profitability changes in other subsidiaries of their parent bank, domestic banks are not sensitive at all to the profitability in the subsidiaries of the foster parent bank. These results imply that our earlier results for lending by multinational bank subsidiaries, which was consistently sensitive to (1) the liquidity and (2) interest margin of their (real) parent banks as well as to (3) the profitability of other subsidiaries in the same group, indeed point to internal capital market effects. Note, however, that we also find weak evidence (10 per cent level) that lending by domestic banks is negatively related to the business cycle in the home countries of their foreign competitor banks. Yet, the statistical significance of this result is much lower than in the regression results for the multinational bank subsidiaries. Apparently, in addition to the effects of internal capital markets, macroeconomic linkages between home countries and host countries also influence the lending of host country banks. Linking multinational bank subsidiaries to foster parent banks
As a second robustness test, we randomly link each multinational bank subsidiary to an alternative foster parent bank from the same home country. For each host country, the set of foster parent banks again consists of approximately five large banks.34 Annex 2 shows that the average foster parent bank is quite similar to the average real parent bank, although foster parent banks are on average smaller. Again, as the results of a single random allocation of foster parent banks to multinational bank subsidiaries are not representative, we estimate each model 1,000 times. Table 6 reports the mean estimated coefficients and p values of these 1,000 runs. As before, we expect our earlier results to become insignificant as credit growth of a multinational bank subsidiary should not depend on what is going on in other institutions in the home country of its true parent bank. When we compare the results in Table 6 with our earlier results in Table 2, we find that lending by multinational bank subsidiaries is negatively related to the business cycle in the home country of the foster parent bank. This is logical as, by construction, the foster parent bank is located in the same country as the real parent bank and we already knew – see
33 Except for a significant interest margin coefficient in column 4. 34 We include additional home country banks in our set of foster parent banks in case there were not enough real parent banks from the same home country available. For instance, since we have only one Danish parent bank (Danske Bank) in our original dataset, we added four additional large Danish banks to our set of potential Danish foster parent banks.
24
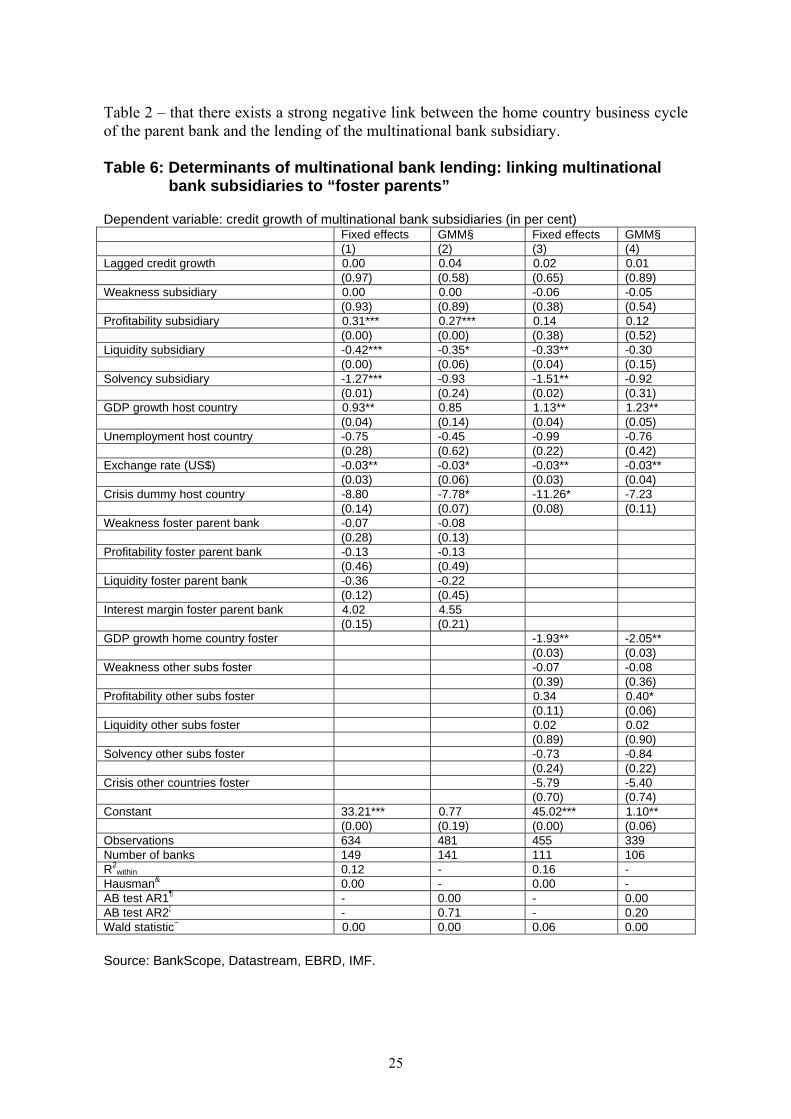
Table 2 – that there exists a strong negative link between the home country business cycle of the parent bank and the lending of the multinational bank subsidiary. Table 6: Determinants of multinational bank lending: linking multinational bank subsidiaries to “foster parents” Dependent variable: credit growth of multinational bank subsidiaries (in per cent) Fixed effects GMM§ Fixed effects GMM§ (1) (2) (3) (4) Lagged credit growth 0.00 0.04 0.02 0.01 (0.97) (0.58) (0.65) (0.89) Weakness subsidiary 0.00 0.00 -0.06 -0.05 (0.93) (0.89) (0.38) (0.54) Profitability subsidiary 0.31*** 0.27*** 0.14 0.12 (0.00) (0.00) (0.38) (0.52) Liquidity subsidiary -0.42*** -0.35* -0.33** -0.30 (0.00) (0.06) (0.04) (0.15) Solvency subsidiary -1.27*** -0.93 -1.51** -0.92 (0.01) (0.24) (0.02) (0.31) GDP growth host country 0.93** 0.85 1.13** 1.23** (0.04) (0.14) (0.04) (0.05) Unemployment host country -0.75 -0.45 -0.99 -0.76 (0.28) (0.62) (0.22) (0.42) Exchange rate (US$) -0.03** -0.03* -0.03** -0.03** (0.03) (0.06) (0.03) (0.04) Crisis dummy host country -8.80 -7.78* -11.26* -7.23 (0.14) (0.07) (0.08) (0.11) Weakness foster parent bank -0.07 -0.08 (0.28) (0.13) Profitability foster parent bank -0.13 -0.13 (0.46) (0.49) Liquidity foster parent bank -0.36 -0.22 (0.12) (0.45) Interest margin foster parent bank 4.02 4.55 (0.15) (0.21) GDP growth home country foster -1.93** -2.05** (0.03) (0.03) Weakness other subs foster -0.07 -0.08 (0.39) (0.36) Profitability other subs foster 0.34 0.40* (0.11) (0.06) Liquidity other subs foster 0.02 0.02 (0.89) (0.90) Solvency other subs foster -0.73 -0.84 (0.24) (0.22) Crisis other countries foster -5.79 -5.40 (0.70) (0.74) Constant 33.21*** 0.77 45.02*** 1.10** (0.00) (0.19) (0.00) (0.06) Observations 634 481 455 339 Number of banks 149 141 111 106 R2
within 0.12 - 0.16 - Hausman& 0.00 - 0.00 - AB test AR1¶ - 0.00 - 0.00 AB test AR2¦ - 0.71 - 0.20 Wald statistic~ 0.00 0.00 0.06 0.00 Source: BankScope, Datastream, EBRD, IMF.
25
Note: p values in parentheses * significant at 10 per cent; ** significant at 5 per cent; *** significant at 1 per cent § Arellano-Bond (1991) dynamic panel-data estimator (one-step, robust) & p value of Hausman specification test ¶ p value of Arellano-Bond test that average autocovariance in residuals of order 1 is 0 ¦ p value of Arellano-Bond test that average autocovariance in residuals of order 2 is 0 ~ p value of Wald test that parameters associated with parent bank/other subsidiaries variables are jointly 0 More importantly, we find that while multinational bank subsidiaries are sensitive to the liquidity and interest margin of their true parent bank (see Table 2), their lending does not depend on the liquidity and interest margin of a foster parent bank in the same home country. We also find that while lending by multinational bank subsidiaries depends very much on profitability changes in other subsidiaries of the “true” parent bank, this effect completely disappears in the fixed effects regressions and is only marginally significant (10 per cent) in the GMM regression. As with our first robustness test, these results strengthen our claim that our earlier empirical findings indeed reflect intra-bank linkages in the form of an internal capital market.
26
6. SUMMARY AND CONCLUSIONS Our findings provide strong evidence for the hypothesis that multinational banks actively manage the credit growth of their subsidiaries. Multinational bank subsidiaries are therefore not stand-alone operations but are influenced by developments in other subsidiaries in the group and in other countries of operation. Robustness tests show that these findings are not the result of more general macroeconomic international linkages, but are due to the operation of internal capital markets. This paper is the first to expand the analysis of lending by bank subsidiaries to the international level. As Houston et al (1997) did for bank holdings at the national level, our paper provides indirect evidence for the operation of internal capital markets at the international level. More specifically, we find that although profitable subsidiaries expand their lending faster, subsidiaries are not only affected by their own balance sheet but also by developments in other parts of the multinational banking group. In line with substitution effects, we find that subsidiaries expand their lending faster if economic growth in their home country decreases. Apparently, parent banks trade off expanding credit growth in the home country against the host country. Likewise, we find that higher host country growth positively influences credit growth, but here the substitution effect is limited to greenfield subsidiaries and subsidiaries that are relatively far away from the parent bank. We also find evidence for support effects. Subsidiaries of parent banks with a high net interest margin tend to grow faster, while subsidiaries of highly liquid parent banks tend to grow slower. If other subsidiaries in the same group are relatively profitable, this positively influences the credit supply of a subsidiary: with (other) profitable subsidiaries parent banks are able to give more capital support. We also find that subsidiaries of multinational banks, in sharp contrast to domestic banks, do not tend to reduce their credit supply when the host country is hit by a banking crisis. Finally, we find that whereas the credit growth of (strongly integrated) greenfield subsidiaries is not sensitive to their own balance-sheet strength, this does not hold for the (more independent) take-overs. Apparently, the latter group can rely less on parental support and is therefore forced to slow down their lending if their balance sheet gets weaker. Our findings that multinational banks both support subsidiaries and trade off lending opportunities across countries imply that affiliated banks are better positioned to exploit local lending opportunities. This provides a rationale for cross-border bank consolidation. At the same time, however, multinational bank entry means that a country becomes more exposed to foreign economic shocks. Here the total number of banks that are in foreign hands is important, as is the diversity regarding the home countries where the parent banks are headquartered. If only a limited number of local banks are part of a multinational bank holding, or if many banks are part of a multinational bank but these banks are headquartered in quite different home countries, aggregate bank lending in the host country will become less dependent on local economic development and thus be less procyclical. This contrasts with a situation in which a substantial share of the banking sector is taken over by parent holding companies from one single home country. (One can think, for instance, of the dominance of Swedish bank subsidiaries in the Baltic countries.) In that case the host country becomes strongly
27

exposed to one particular foreign economy that may be less desirable from the perspective of macroeconomic stability.
28
REFERENCES M. Arellano and S. Bond (1991), “Some tests of the specification for panel data: Monte Carlo evidence and an application to employment equations”, Rev. Econ. Stud. 58, pp. 277-297. A. Barajas and R. Steiner (2002), “Credit stagnation in Latin America”, IMF Working Paper No. 53, International Monetary Fund, Washington D.C. A.N. Berger, L.F. Klapper and G.F. Udell (2001), “The ability of banks to lend to informationally opaque small businesses”, J. Banking Finance 25, pp. 2127-2167. S.E. Black and P.E. Strahan (2002), “Entrepreneurship and bank credit availability”, J. Finance 57, pp. 2807-2833. C.M. Buch (2000), “Why do banks go abroad? Evidence from German data”, Finan. Markets, Inst. Instruments 9, pp. 33-67. G. Caprio and D. Klingebiel (2002), “Episodes of systemic and borderline banking crises”, World Bank, Washington D.C. W. Carlin, A. Charlton and C. Mayer (2006), “Capital markets, ownership and distance”, Centre for Economic Performance Discussion Paper No. 744. A.G. Carstens, D.C. Hardy and C. Pazarbaşioğlu (2004), “Avoiding banking crises in Latin America”, Finance Devel. September, pp. 30-33. E. Cerutti, G. Dell’Ariccia and M. Soledad Martinez Peria (2007), “How banks go abroad: branches or subsidiaries?” J. Banking Finance 31, pp. 1669-1692. J.S. Crystal, B.G. Dages and L.S. Goldberg (2002), “Has foreign bank entry led to sounder banks in Latin America?” Current Issues in Economics and Finance 8, pp. 1-6. D. Dahl and R.E. Shrieves (1999), “The extension of international credit by US banks: A disaggregated analysis, 1988-1994”, J. Int. Money Finance 18, pp. 153-167. D. Dahl, R.E. Shrieves and M.F. Spivey (2002), “Financing loan growth at banks”, J. Finan. Services Res. 22, pp. 189-202. B.G. Dages, L.S. Goldberg and D. Kinney (2000), “Foreign and domestic bank participation in emerging markets: Lessons from Mexico and Argentina”, Federal Reserve Bank of New York Economic Policy Review, September, pp. 17-36. H. Degryse, G. Cerqueiro and S. Ongena (2007), “Distance, bank organizational structure, and credit”, TILEC Discussion Paper No. 18, Tilburg University, Tilburg. R.T.A. De Haas and I.P.P. Van Lelyveld (2004), “Foreign bank penetration and private sector credit in Central and Eastern Europe”, J. Emerging Market Finance 3, pp. 125-151.
29
R.T.A. De Haas and I.P.P. Van Lelyveld (2006), “Foreign banks and credit stability in Central and Eastern Europe. A panel data analysis”, J. Banking Finance 30, pp. 1927-1952. D. Focarelli and A.F. Pozzolo (2005), “Where do banks expand abroad? An empirical analysis”, J. Bus. 78, pp. 2435-2464. K.A. Froot and J.C. Stein (1998), “Risk management, capital budgeting, and capital structure policy for financial institutions: An integrated approach”, J. Finan. Econ. 47, pp. 55-82. L.S. Goldberg (2001), “When is U.S. bank lending to emerging markets volatile?” NBER Working Paper No. 8209, National Bureau of Economic Research, Cambridge, MA. K. Hadri (2000), “Testing for stationarity in heterogeneous panel data”, Econometrics J. 3(2), pp. 148-161. L.P. Hansen (1982), “Large sample properties of generalized method of moments estimators”, Econometrica 50, pp. 1029-1054. L. Hernandez and H. Rudolph (1995), “Sustainability of private capital flows to developing countries – is a generalised reversal likely?” World Bank Policy Research Working Paper No. 1518, World Bank, Washington D.C. B. Holmström and J. Tirole (1997), “Financial intermediation, loanable funds, and the real sector”, Quart. J. Econ. CXII, pp. 663-691. J.F. Houston, C. James and D. Marcus (1997), “Capital market frictions and the role of internal capital markets in banking”. J. Finan. Econ. 46, pp. 135-64. International Monetary Fund (2007), “Global Financial Stability Report”, http://www.imf.org/external/pubs/ft/gfsr/2007/01/index.htm, Washington D.C. S. Jeanneau and M. Micu (2002), “Determinants of international bank lending to emerging market countries”, BIS Working Papers No. 112, Bank for International Settlements, Basel. S. Martinez Peria, A. Powell and I. Vladkova Hollar (2002), “Banking on foreigners: The behavior of international bank lending to Latin America, 1985-2000”, World Bank Working Paper No. 2893, World Bank, Washington D.C. D. Morgan, B. Rime and P.E. Strahan (2004), “Bank integration and state business volatility”, Quart. J. Econ. 119, pp. 1555-85. D. Morgan and P.E. Strahan (2004), “Foreign bank entry and business volatility: Evidence from U.S. states and other countries”, in: L.A. Ahumada and J.R. Fuentes (Eds.), Banking Market Structure and Monetary Policy, Central Bank of Chile, Santiago, pp. 241-269.
30
S. Nickell (1981), “Biases in dynamic models with fixed effects”, Econometrica 49, pp. 1417-1426. J. Peek and E.S. Rosengren (1997), “The international transmission of financial shocks: The case of Japan”, Amer. Econ. Rev. 87, pp. 495-505. J. Peek and E.S. Rosengren (2000a), “Implications of the globalization of the banking sector: The Latin American experience”, New England Econ. Rev., September/October, pp. 45-63. J. Peek and E.S. Rosengren (2000b), “Collateral damage: Effects of the Japanese bank crisis on the United States”. Amer. Econ. Rev. 90, pp. 30-45. M.H. Pesaran (2003), “A simple panel unit root test in the presence of cross section dependence”, Cambridge Working Papers in Economics No. 0346, University of Cambridge. J.C. Stein (1997), “Internal capital markets and the competition for corporate resources”, J. Finan. 52, pp. 111-34. M. Taylor and L. Sarno (1998), “The behaviour of real exchange rates during the post-Bretton Woods period”, J. Int. Econ. 46, pp. 281-312. C. Van Rijckeghem and B. Weder (2000), “Spillovers through banking centers: A panel data analysis”, IMF Working Paper No. 88. International Monetary Fund, Washington D.C. C. Van Rijckeghem and B. Weder (2001), “Sources of contagion: Finance or trade?” J. Inter. Econ. 54, pp. 293-308. V. Vihriälä (1996), “Credit growth and moral hazard. An empirical study of the causes of credit expansion by the Finnish local banks in 1986-1990”. Bank of Finland Working Paper 10/1996.
31

Annex 1: List of multinational banks in sample Name bank holding Home country Number of
subsidiariesHost countries
1 ABN Amro Holding The Netherlands
5 AU, BR, FR, NL, US
2 Allied Irish Bank Ireland 2 PL, UK 3 Banca Intesa Italy 11 HR, FR, HU, IE, IT,
PE, SK 4 Banco Bilbao Vizcaya Argentaria Spain 9 AR, CL, CO, MX, PE,
PT, ES, US, VE 5 Banco Comercial Português Portugal 2 MZ, PL 6 Banco Popular Español Spain 8 FR, ES 7 Banco Santander Central Hispano Spain 11 BR, CL, DE, MX, ES,
US, VE 8 Bank of America United States 2 HK, US 9 Bank of Ireland Ireland 1 UK 10 Bank of Montreal Canada 2 IE, US 11 Barclays Bank United Kingdom 1 ES 12 Bayerische Hypo- und
Vereinsbank Germany 9 CZ, HU, PL, RU, AT
13 BNP Paribas France 4 FR, US 14 Caja de Ahor. y Pens. de
Barcelona Spain 2 FR, ES
15 Citicorp United States 8 BR, CA, MY, MX, PL, US
16 Commerzbank Germany 4 DE, NL, PL 17 Danske Bank Denmark 1 NO 18 Deutsche Bank Germany 6 DE, IT, ES, US 19 Dexia Belgium 7 BE, FR, DE, IT, NL,
ES 20 Dresdner Bank Germany 1 DE 21 DZ Bank Germany 4 DE, IE 22 Erste Bank Austria 8 CZ, HU, AT, SK 23 FöreningsSparbanken
(Swedbank) Sweden 5 EE, LV, LT, SE
24 Fortis Bank Belgium 3 BE, FR, NL 25 Gruppo Monte dei Paschi di Siena Italy 3 FR, IT 26 HBOS United Kingdom 4 IE, UK 27 HSBC Holdings United Kingdom 12 BR, CA, FR, DE, HK,
IN, MY, SA, UK, US 28 ING Bank The
Netherlands 5 BE, CA, FR, NL, PL
29 KBC Bank Belgium 7 BE, CZ, DE, HU, IE, PL
30 MBNA Corp United States 3 CA, UK, US 31 Mitsubishi Tokyo Financial Group Japan 4 JP, US 32 National Australia Bank Australia 2 NZ, UK 33 National Bank of Greece Greece 4 BG, CA, CY, US 34 Nordea Bank Sweden 6 DK, FI, NO, SE 35 Rabobank Group The
Netherlands 1 IE
36 Raiffeisen Zentralbank Oesterreich
Austria 8 BG, HR, CZ, PL, RU, SI, UA, SK
32

37 Royal Bank of Canada Canada 2 UK, US 38 Royal Bank of Scotland Group United Kingdom 5 UK, US 39 Scotiabank Canada 4 SV, MX, UK, US 40 SEB Sweden 5 EE, DE, LV, LT, SE 41 Standard Chartered United Kingdom 4 KE, MY, TH, UK 42 Société Générale France 7 AU, CA, CZ, FR, DE 43 UBS Switzerland 1 UK 44 UniCredit Group Italy 5 BG, IE, IT, PL 45 WGZ Bank Germany 2 DE, IE Country abbreviations: AR=Argentina, AT=Austria, AU=Australia, BE=Belgium, BG=Bulgaria, BR=Brazil, CA=Canada, CL=Chile, CO=Colombia, CY=Cyprus, CZ=Czech Republic, DE=Germany, DK=Denmark, EE=Estonia, ES=Spain, FI=Finland, FR=France, HK=Hong Kong, HR=Croatia, HU=Hungary, IE=Ireland, IN=India, IT=Italy, JP=Japan, KE=Kenya, LV=Latvia, LT=Lithuania, MX=Mexico, MY=Malaysia, MZ=Mozambique, NL=The Netherlands, NO=Norway, NZ=New Zealand, PE=Peru, PL=Poland, PT=Portugal, RU=Russia, SA=Saudi Arabia, SE=Sweden, SI=Slovenia, SK=Slovak Republic, SV=El Salvador, TH=Thailand, UA=Ukraine, UK=United Kingdom, US=United States of America, VE=Venezuela.
33

Annex 2: Summary statistics regarding parent banks, subsidiaries, domestic banks and foster parent banks
Solvency (%)
Liquidity (%)
Interest margin
(%)
Profitability (%)
Weakness (%)
Loan growth
(%)
Total assets
(million $) Parent banks
5.3 17.0 2.4 13.8 18.4 11.1 274,012
Subsidiaries 7.8 17.0 3.1 12.7 17.6 12.3 28,656 Domestic banks
8.6 18.9 4.0 10.5 27.2 10.8 26,058
Foster parents
5.4 16.6 2.4 11.2 24.4 11.3 127,646
Results of the various stationarity tests
Solvency (%)
Liquidity (%)
Interest margin
(%)
Profitability (%)
Weakness (%)
Hadri (2000)* I(1) I(1) I(1) I(1) I(1) Pesaran (2003) I(1) I(0) I(0) I(0) I(0) Taylor and Sarno (1998)
I(0) I(0) I(0) I(0) I(0)
* Based on a balanced sub-panel as required by the Hadri (2000) panel unit root test.
34


![[eBook] BOGDANOVIC Dusan - Counterpoint for Guitar (Ed Berben ENG-ITA)](https://img.pdfslide.us/doc/110x75/563dba3a550346aa9aa3cb8f/ebook-bogdanovic-dusan-counterpoint-for-guitar-ed-berben-eng-ita-566b39f4c7c11.jpg)