Embed Size (px)
Citation preview
Internal Audit Data Analytics
ISACA September 2016
Timothy Tham – Risk Analytics Director – EY UK&I
1
Page 2
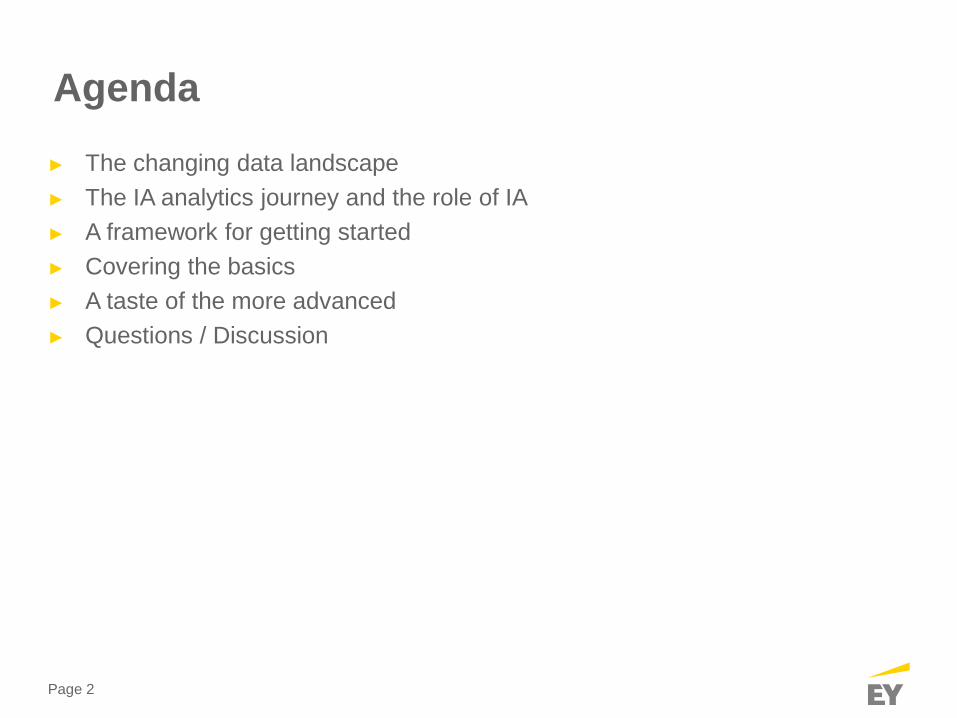
Agenda
► The changing data landscape
► The IA analytics journey and the role of IA
► A framework for getting started
► Covering the basics
► A taste of the more advanced
► Questions / Discussion
Page 3
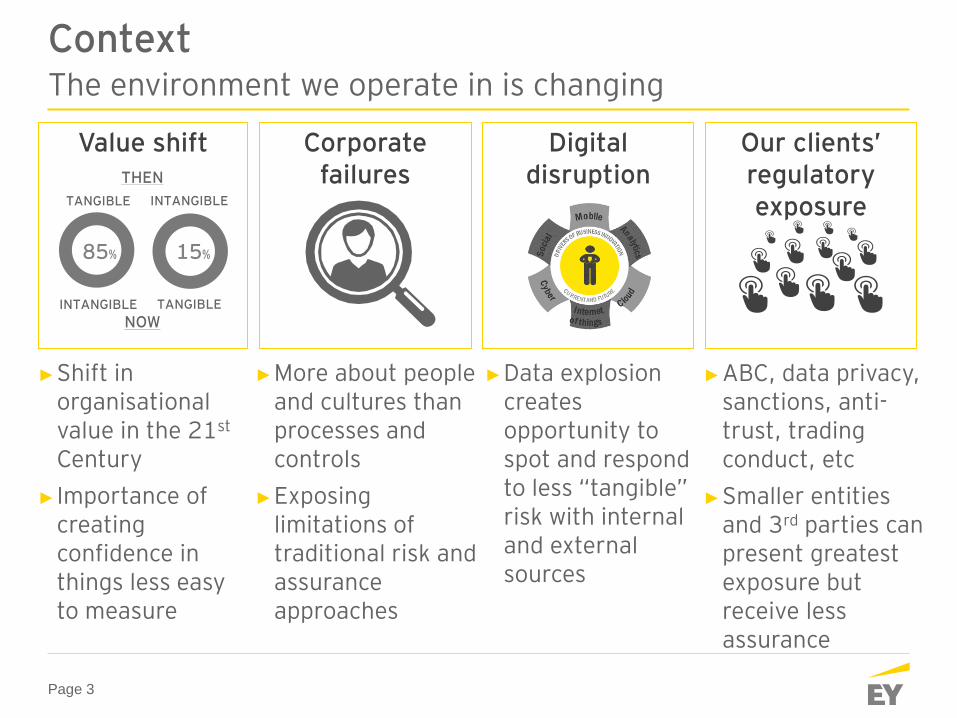
The environment we operate in is changing
Context
Corporate failures
Value shift
►More about people and cultures than processes and controls
►Exposing limitations of traditional risk and assurance approaches
►Shift in organisational value in the 21st Century
► Importance of creating confidence in things less easy to measure
Digital disruption
Our clients’ regulatory exposure
85% 15%
THEN
TANGIBLE INTANGIBLE
NOW INTANGIBLE TANGIBLE
►Data explosion creates opportunity to spot and respond to less “tangible” risk with internal and external sources
►ABC, data privacy, sanctions, anti-trust, trading conduct, etc
►Smaller entities and 3rd parties can present greatest exposure but receive less assurance
Page 4
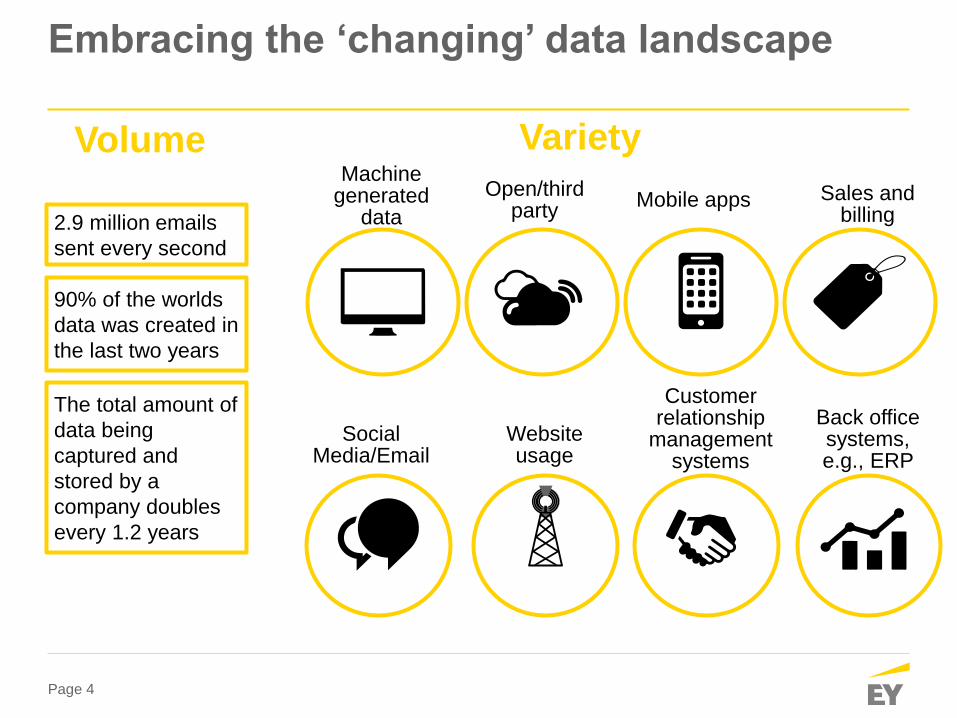
Embracing the ‘changing’ data landscape
The total amount of
data being
captured and
stored by a
company doubles
every 1.2 years
2.9 million emails
sent every second
90% of the worlds
data was created in
the last two years
Machine generated
data
Open/third party
Mobile apps Sales and billing
Social Media/Email
Website usage
Customer relationship
management systems
Back office systems, e.g., ERP
Volume Variety
Page 5
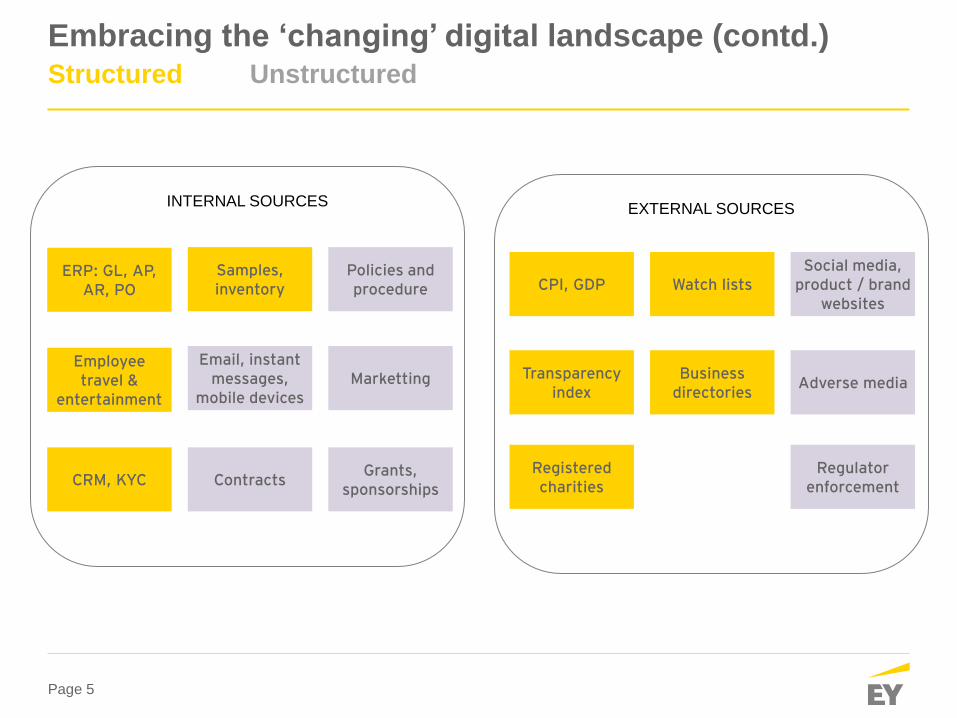
Embracing the ‘changing’ digital landscape (contd.) Structured Unstructured
INTERNAL SOURCES EXTERNAL SOURCES
ERP: GL, AP, AR, PO
Marketting
Policies and procedure
Employee travel &
entertainment
Email, instant messages,
mobile devices
CRM, KYC Contracts
Samples, inventory
Grants, sponsorships
CPI, GDP
Transparency index
Regulator enforcement
Social media, product / brand
websites
Business directories
Registered charities
Watch lists
Adverse media
Page 6
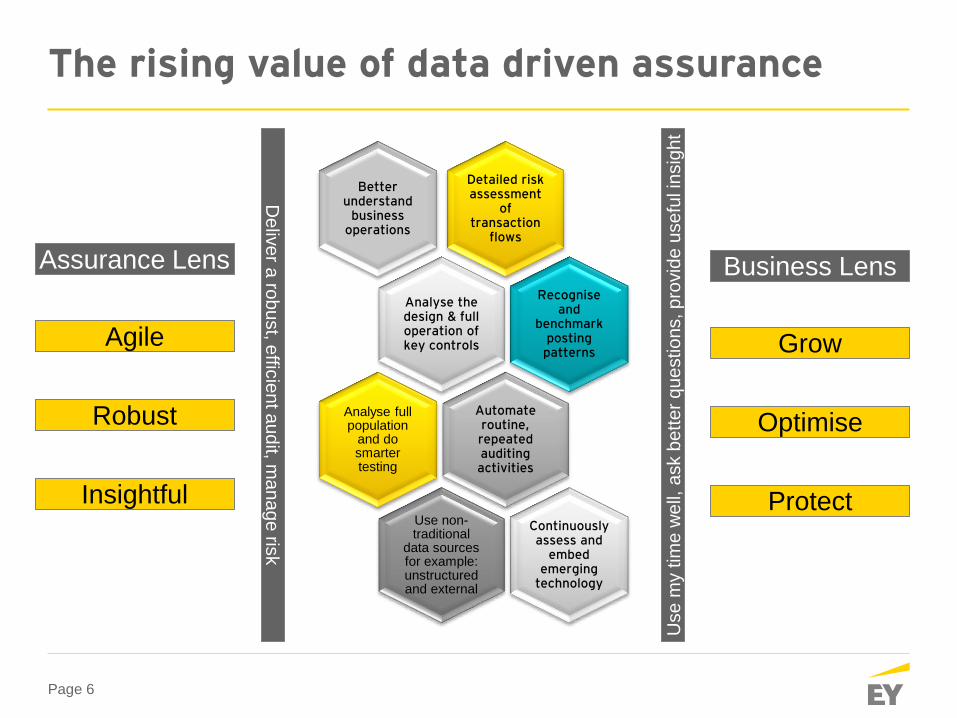
The rising value of data driven assurance
Detailed risk assessment
of transaction
flows
Better understand
business operations
Analyse the design & full operation of key controls
Recognise and
benchmark posting patterns
Automate routine, repeated auditing activities
Analyse full population
and do smarter testing
Use non-traditional
data sources for example: unstructured and external
Continuously assess and
embed emerging
technology
Agile
Assurance Lens
Robust
Insightful
Grow
Business Lens
Optimise
Protect
Use
my t
ime
we
ll, a
sk b
ett
er
qu
estio
ns, p
rovid
e u
se
ful in
sig
ht
De
live
r a ro
bu
st, e
fficie
nt a
ud
it, ma
na
ge
risk
The better the question. The better the answer.�The better the world works.
Where are you on the IA analytics journey?
Page 8
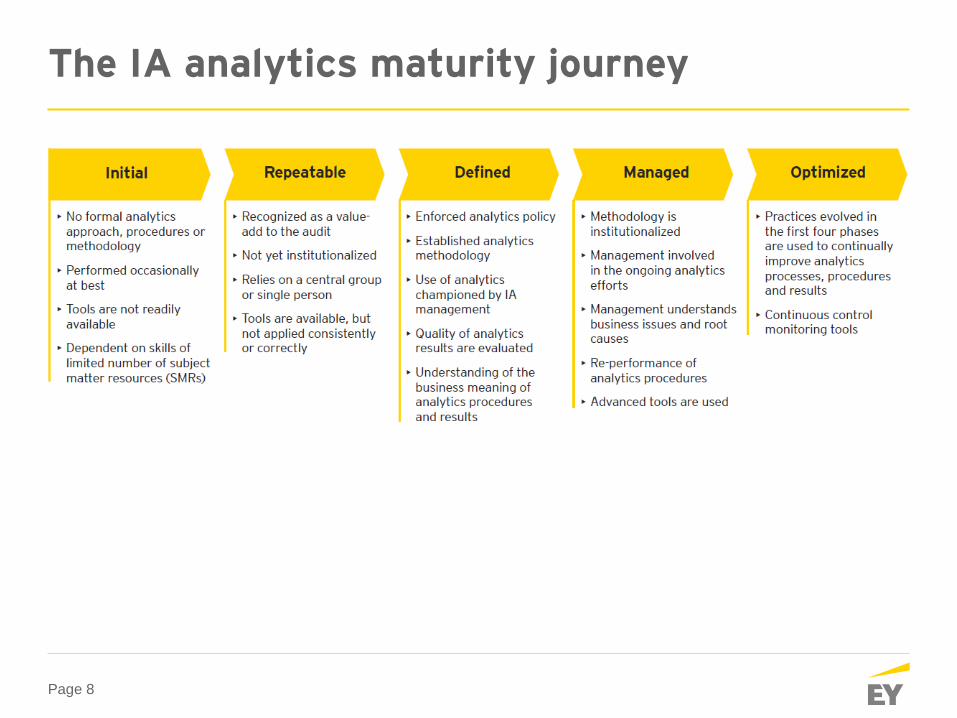
The IA analytics maturity journey
The better the question. The better the answer.�The better the world works.
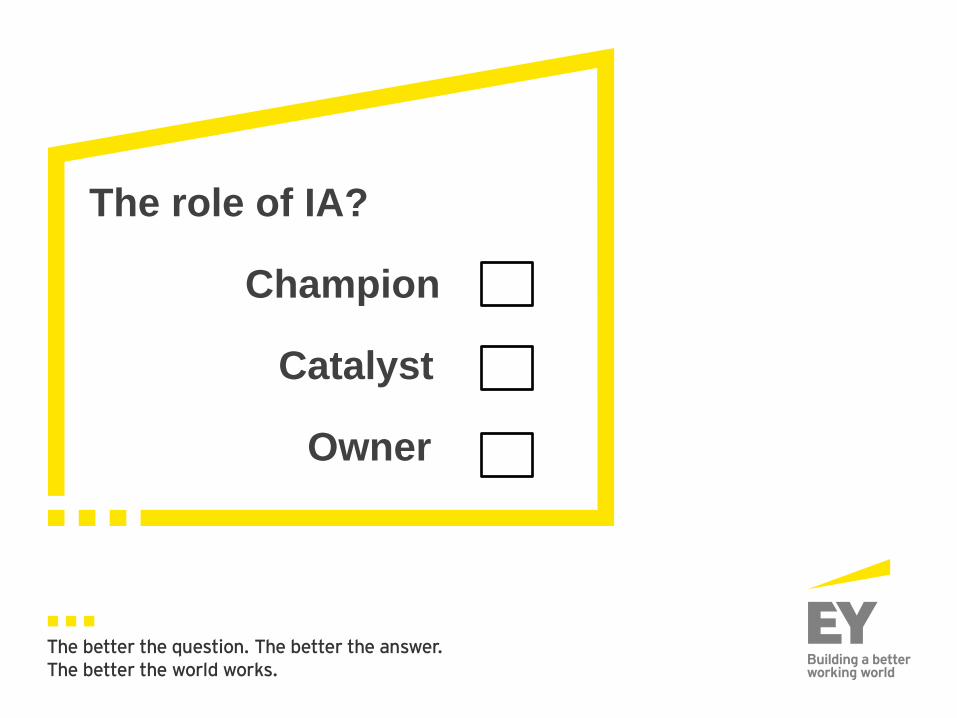
The role of IA? Champion Catalyst Owner
Page 10
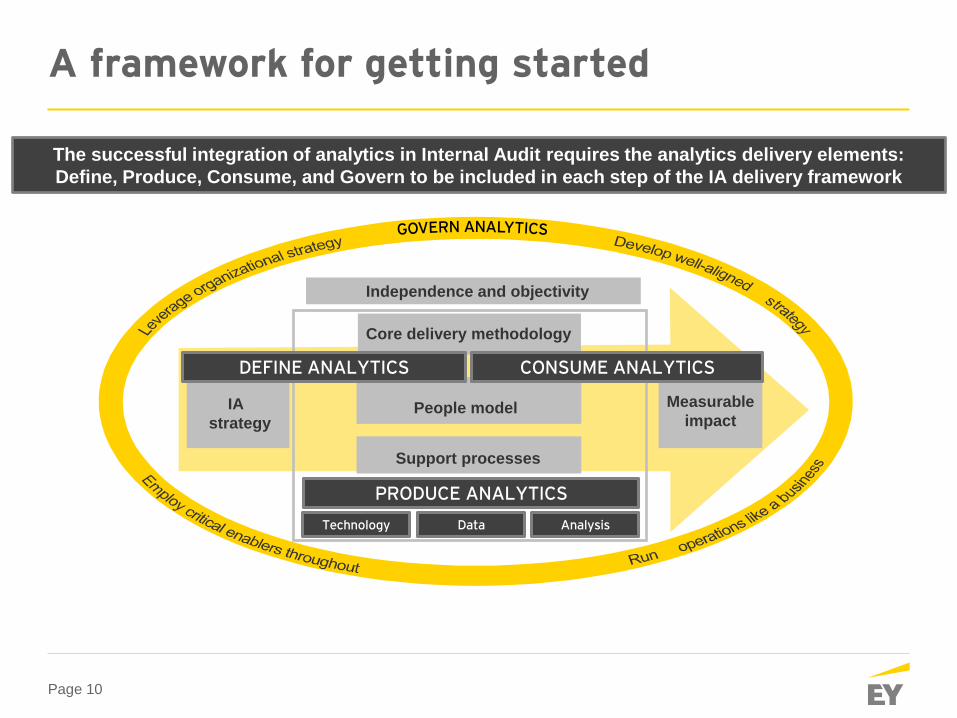
A framework for getting started
Independence and objectivity
Core delivery methodology
People model
Support processes
IA
strategy
Measurable
impact
PRODUCE ANALYTICS
Technology Analysis Data
DEFINE ANALYTICS CONSUME ANALYTICS
The successful integration of analytics in Internal Audit requires the analytics delivery elements:
Define, Produce, Consume, and Govern to be included in each step of the IA delivery framework
Page 11
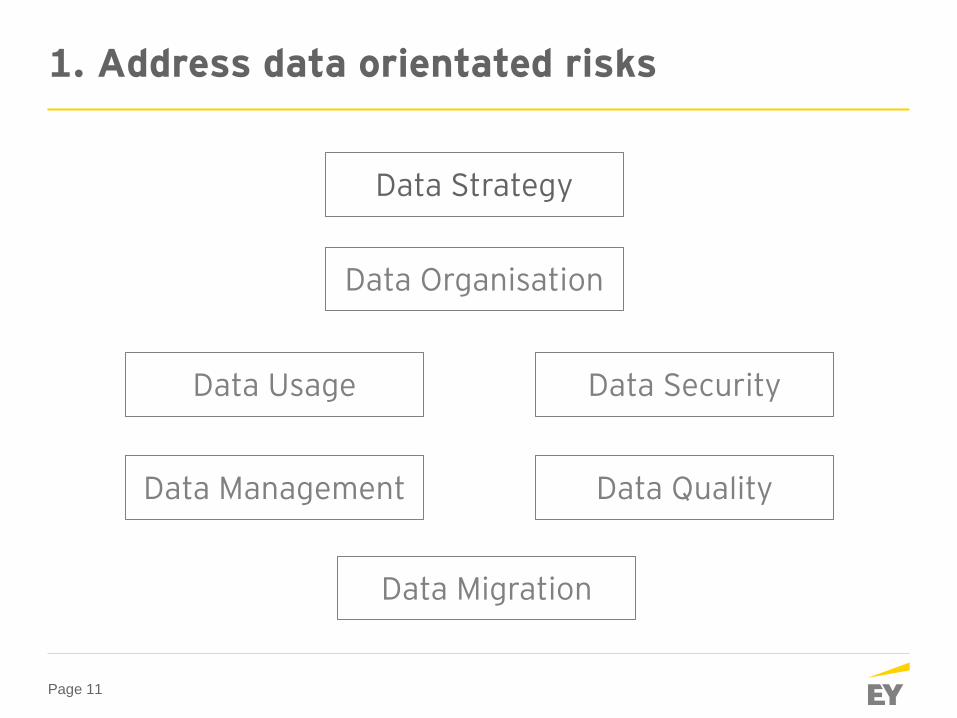
1. Address data orientated risks
Data Strategy
Data Security Data Usage
Data Management Data Quality
Data Organisation
Data Migration
Page 12
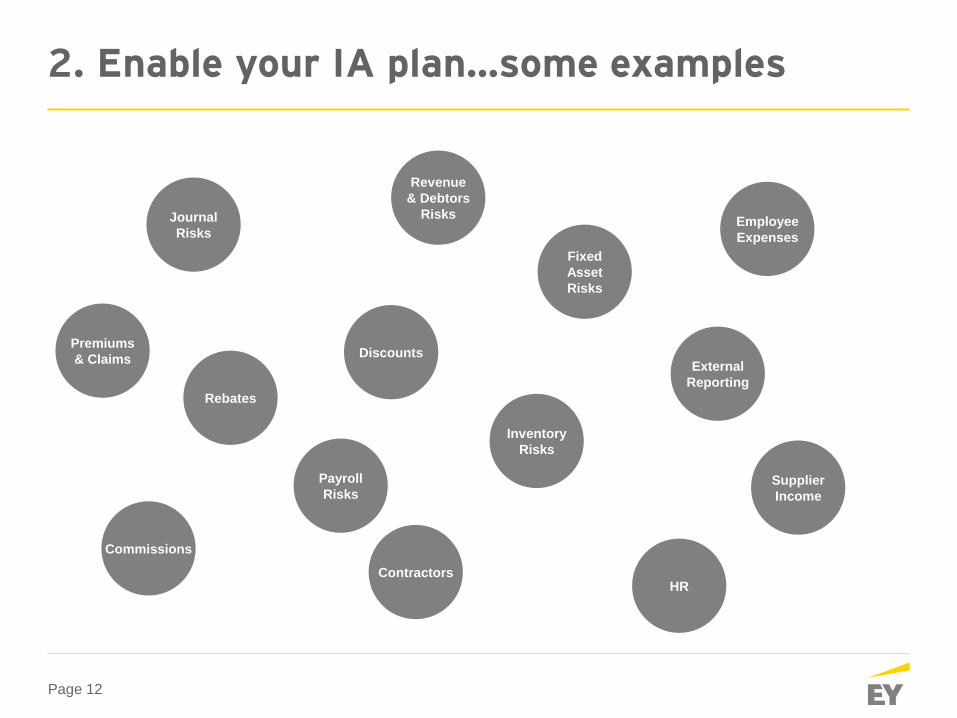
2. Enable your IA plan…some examples
Commissions
Revenue
& Debtors
Risks
Inventory
Risks
Discounts
Journal
Risks
Fixed
Asset
Risks
Employee
Expenses
External
Reporting
HR Contractors
Rebates
Supplier
Income
Payroll
Risks
Premiums
& Claims
Page 13
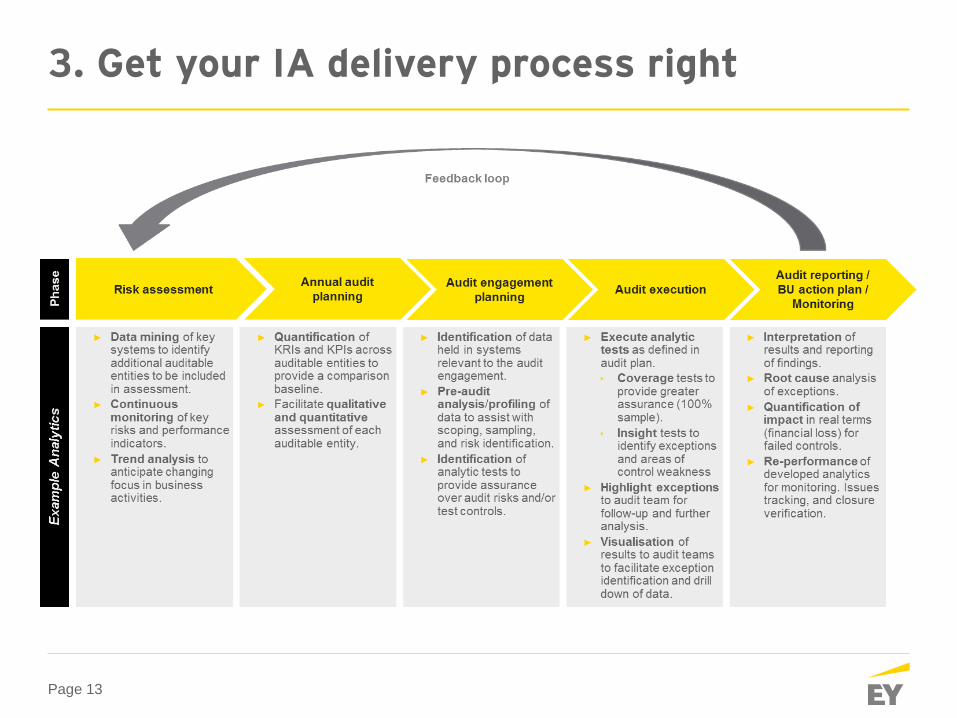
3. Get your IA delivery process right
Page 14
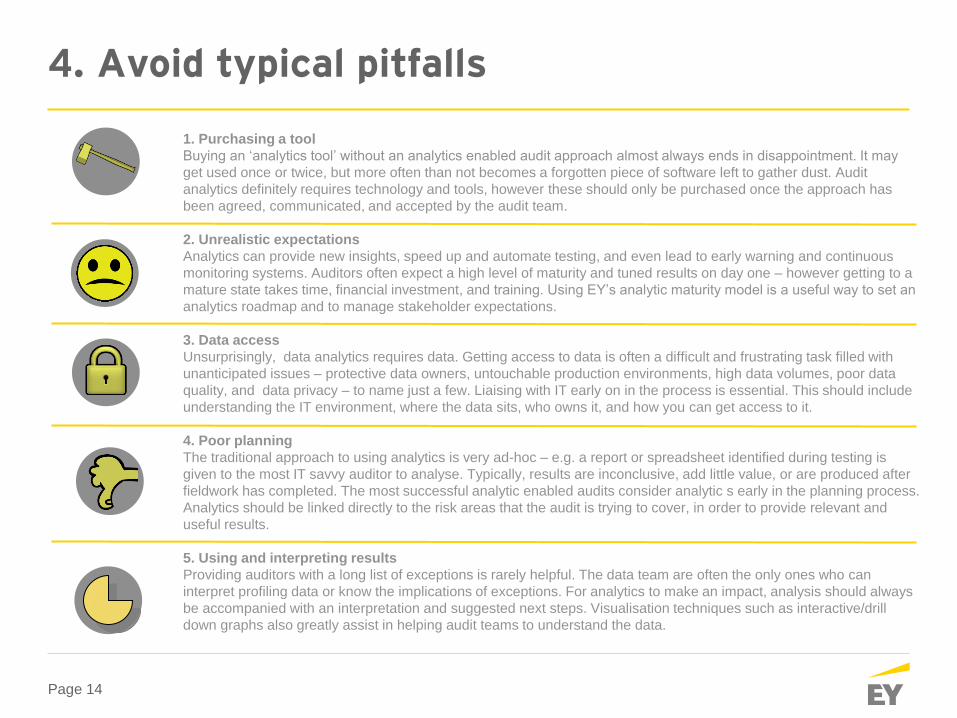
4. Avoid typical pitfalls
1. Purchasing a tool
Buying an ‘analytics tool’ without an analytics enabled audit approach almost always ends in disappointment. It may
get used once or twice, but more often than not becomes a forgotten piece of software left to gather dust. Audit
analytics definitely requires technology and tools, however these should only be purchased once the approach has
been agreed, communicated, and accepted by the audit team.
2. Unrealistic expectations
Analytics can provide new insights, speed up and automate testing, and even lead to early warning and continuous
monitoring systems. Auditors often expect a high level of maturity and tuned results on day one – however getting to a
mature state takes time, financial investment, and training. Using EY’s analytic maturity model is a useful way to set an
analytics roadmap and to manage stakeholder expectations.
3. Data access
Unsurprisingly, data analytics requires data. Getting access to data is often a difficult and frustrating task filled with
unanticipated issues – protective data owners, untouchable production environments, high data volumes, poor data
quality, and data privacy – to name just a few. Liaising with IT early on in the process is essential. This should include
understanding the IT environment, where the data sits, who owns it, and how you can get access to it.
4. Poor planning
The traditional approach to using analytics is very ad-hoc – e.g. a report or spreadsheet identified during testing is
given to the most IT savvy auditor to analyse. Typically, results are inconclusive, add little value, or are produced after
fieldwork has completed. The most successful analytic enabled audits consider analytic s early in the planning process.
Analytics should be linked directly to the risk areas that the audit is trying to cover, in order to provide relevant and
useful results.
5. Using and interpreting results
Providing auditors with a long list of exceptions is rarely helpful. The data team are often the only ones who can
interpret profiling data or know the implications of exceptions. For analytics to make an impact, analysis should always
be accompanied with an interpretation and suggested next steps. Visualisation techniques such as interactive/drill
down graphs also greatly assist in helping audit teams to understand the data.
The better the question. The better the answer.�The better the world works.
Industry 4.0… Innovation… Big Data… Where could (will?) the journey go?
Page 16
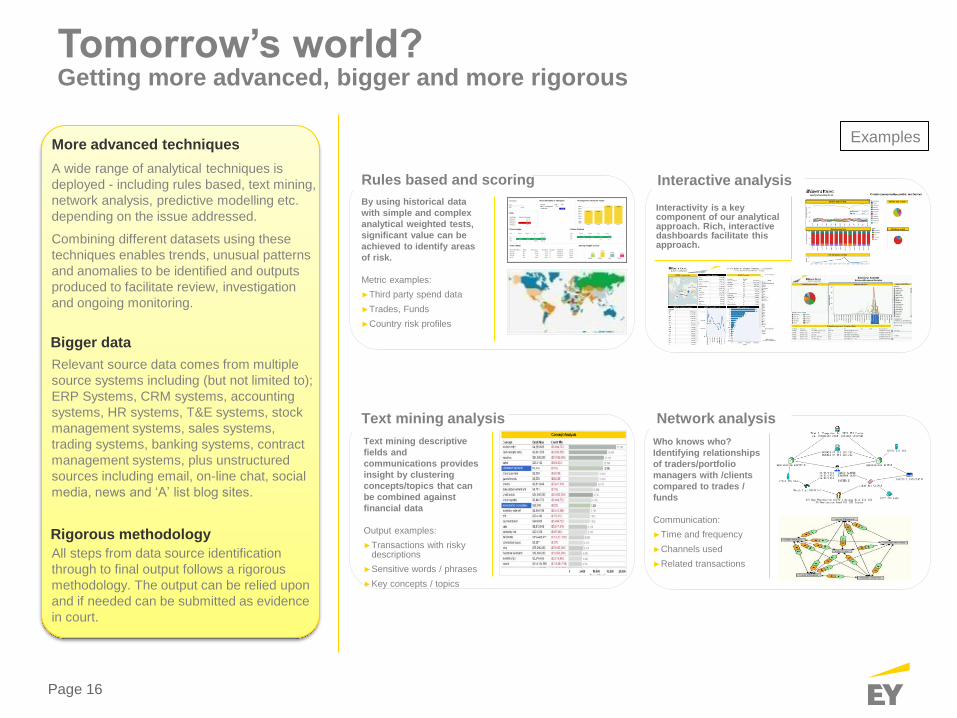
Relevant source data comes from multiple
source systems including (but not limited to);
ERP Systems, CRM systems, accounting
systems, HR systems, T&E systems, stock
management systems, sales systems,
trading systems, banking systems, contract
management systems, plus unstructured
sources including email, on-line chat, social
media, news and ‘A’ list blog sites.
By using historical data
with simple and complex
analytical weighted tests,
significant value can be
achieved to identify areas
of risk.
Metric examples:
►Third party spend data
►Trades, Funds
►Country risk profiles
Rules based and scoring
Bigger data
Interactive analysis
Network analysis
Who knows who?
Identifying relationships
of traders/portfolio
managers with /clients
compared to trades /
funds
Communication:
►Time and frequency
►Channels used
►Related transactions
Interactivity is a key component of our analytical approach. Rich, interactive dashboards facilitate this approach.
More advanced techniques
A wide range of analytical techniques is
deployed - including rules based, text mining,
network analysis, predictive modelling etc.
depending on the issue addressed.
Combining different datasets using these
techniques enables trends, unusual patterns
and anomalies to be identified and outputs
produced to facilitate review, investigation
and ongoing monitoring.
Text mining analysis
Text mining descriptive
fields and
communications provides
insight by clustering
concepts/topics that can
be combined against
financial data
Output examples:
►Transactions with risky descriptions
►Sensitive words / phrases
►Key concepts / topics
All steps from data source identification
through to final output follows a rigorous
methodology. The output can be relied upon
and if needed can be submitted as evidence
in court.
Rigorous methodology
Examples
Tomorrow’s world? Getting more advanced, bigger and more rigorous
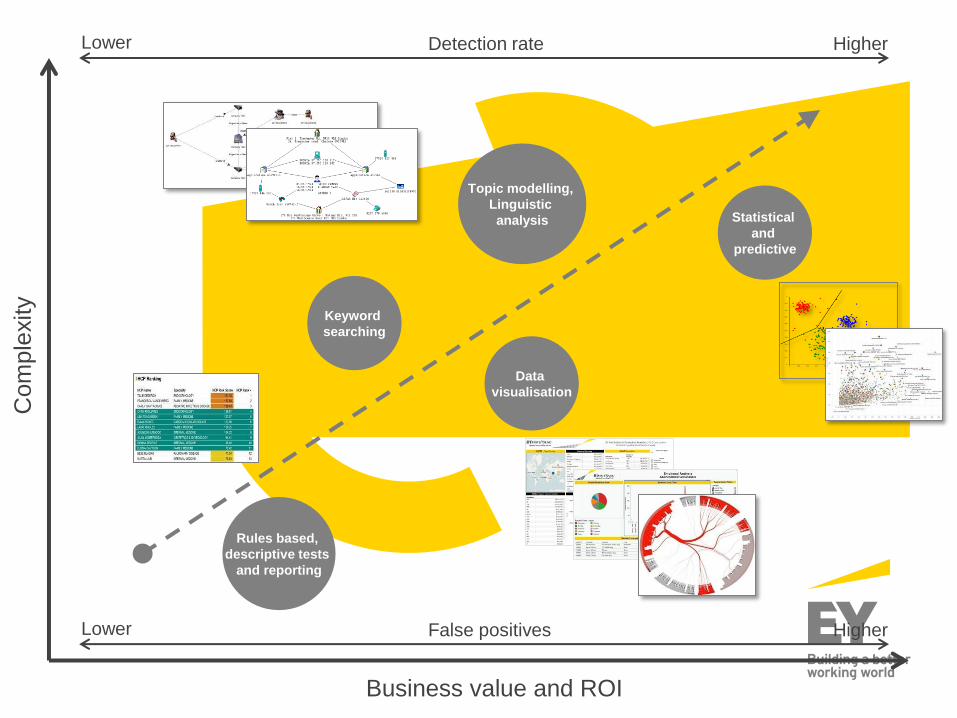
Data
visualisation
Topic modelling,
Linguistic
analysis
Keyword
searching
Rules based,
descriptive tests
and reporting
Statistical
and
predictive
Com
ple
xity
Business value and ROI
Detection rate Lower Higher
False positives Lower Higher
Page 18
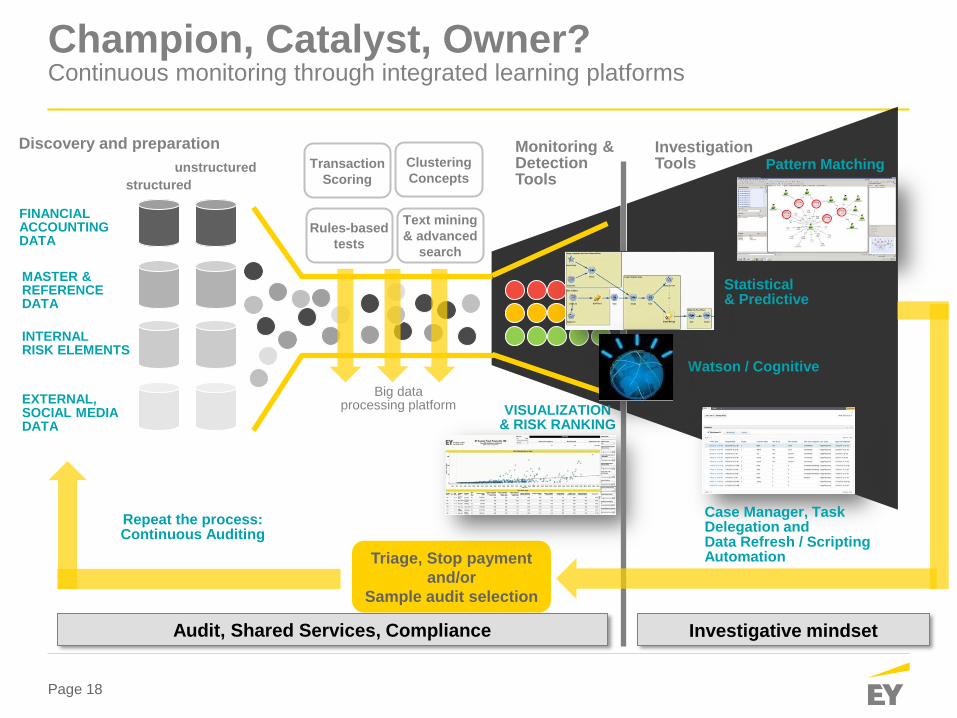
Champion, Catalyst, Owner? Continuous monitoring through integrated learning platforms
FINANCIAL ACCOUNTING DATA
MASTER & REFERENCE DATA
INTERNAL RISK ELEMENTS
EXTERNAL, SOCIAL MEDIA DATA
Rules-based
tests
Text mining
& advanced
search
VISUALIZATION & RISK RANKING
Triage, Stop payment
and/or
Sample audit selection
Big data processing platform
structured
unstructured
Statistical & Predictive
Pattern Matching
Case Manager, Task Delegation and Data Refresh / Scripting Automation
Monitoring & Detection Tools
Investigation Tools
Repeat the process: Continuous Auditing
Audit, Shared Services, Compliance
Watson / Cognitive
Investigative mindset
Discovery and preparation
Transaction
Scoring
Clustering
Concepts
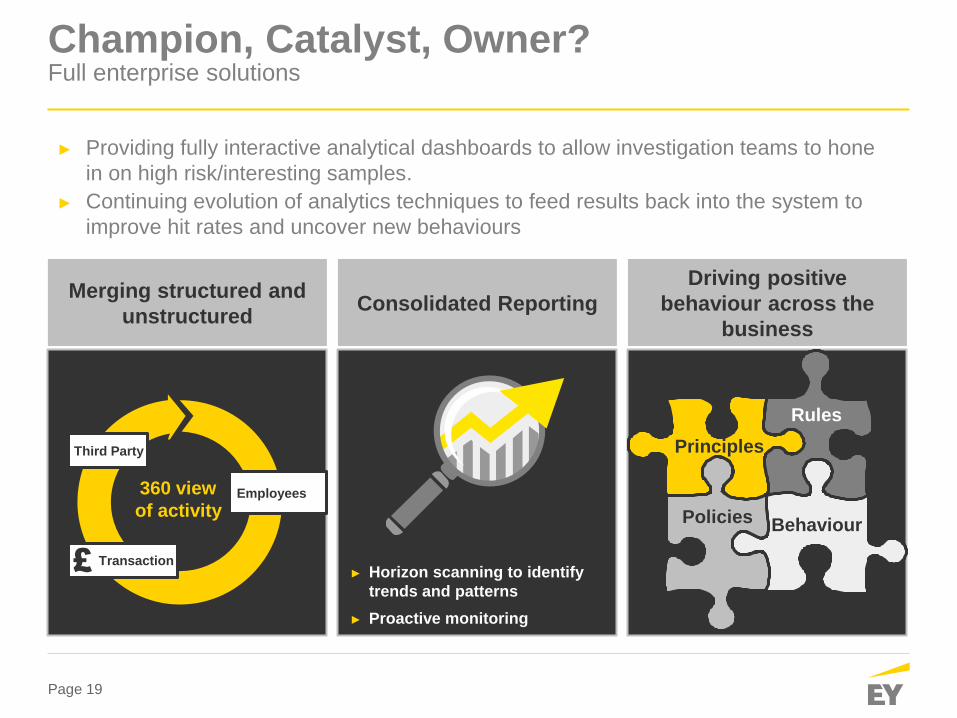
Page 19
Merging structured and
unstructured Consolidated Reporting
Driving positive
behaviour across the
business
360 view
of activity Employees
Transaction
Third Party
► Providing fully interactive analytical dashboards to allow investigation teams to hone
in on high risk/interesting samples.
► Continuing evolution of analytics techniques to feed results back into the system to
improve hit rates and uncover new behaviours
► Horizon scanning to identify
trends and patterns
► Proactive monitoring
Principles
Behaviour
Rules
Policies
Champion, Catalyst, Owner? Full enterprise solutions
Page 20
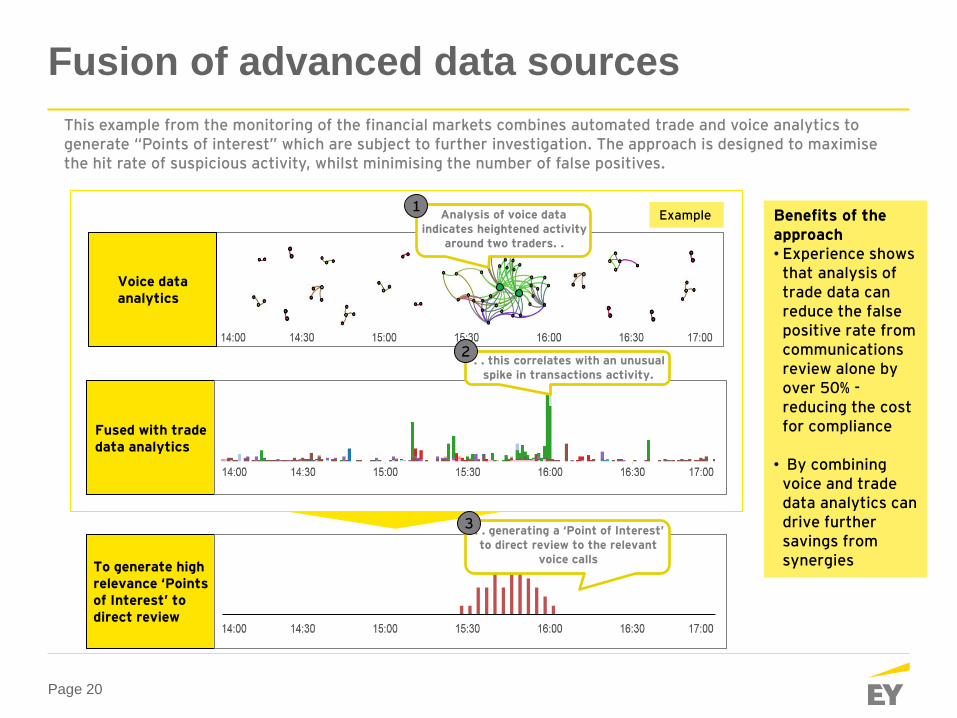
Fusion of advanced data sources
Example Benefits of the approach • Experience shows
that analysis of trade data can reduce the false positive rate from communications review alone by over 50% - reducing the cost for compliance
• By combining voice and trade data analytics can drive further savings from synergies
Voice data analytics
Fused with trade data analytics
Analysis of voice data indicates heightened activity
around two traders. .
To generate high relevance ‘Points of Interest’ to direct review
This example from the monitoring of the financial markets combines automated trade and voice analytics to generate “Points of interest” which are subject to further investigation. The approach is designed to maximise the hit rate of suspicious activity, whilst minimising the number of false positives.
. . this correlates with an unusual spike in transactions activity.
1
2
. . generating a ‘Point of Interest’ to direct review to the relevant
voice calls
3
The better the question. The better the answer.�The better the world works.
Questions / Discussion What’s your next step?