Embed Size (px)
Citation preview
International Journal of Language and Linguistics 2015; 3(5): 313-322
Published online September 16, 2015 (http://www.sciencepublishinggroup.com/j/ijll)
doi: 10.11648/j.ijll.20150305.16
ISSN: 2330-0205 (Print); ISSN: 2330-0221 (Online)
Internal and External Factors Affecting Learning English as a Foreign Language
Soheil Mahmoudi1, Asgar Mahmoudi
2, *
1Department of English Language, Ahar Branch, Islamic Azad University, Ahar, Iran 2Department of English Language, Ardabil Branch, Islamic Azad University, Ardabil, Iran
Email address: [email protected] (S. Mahmoudi), [email protected] (A. Mahmoudi)
To cite this article: Soheil Mahmoudi, Asgar Mahmoudi. Internal and External Factors Affecting Learning English as a Foreign Language. International Journal
of Language and Linguistics. Vol. 3, No. 5, 2015, pp. 313-322. doi: 10.11648/j.ijll.20150305.16
Abstract: This study investigated the effects of internal and external factors on learning English as a foreign language from
Iranian EFL learners’ points of view. Copies of a 30-item Lickert-scale questionnaire, addressing internal and external factors
or principle components, were distributed among about 140 postgraduate students of ELT in three universities in Iran. The
collected data were then subjected to Principle Component Analysis (PCA). The findings revealed that while internal and
external components are distinguishable, many of the variables do not heavily load on the principle component to which they
theoretically belong. After separating the non-correlating variables it became clear that most of these variables are very
important variables. Further analysis indicated that it is possible to divide internal variables to cognitive and affective and
external variables to environmental and curricular. The conclusion reached was that the importance of variables should not be
judged based on their nature but based on the importance accorded to them by the respondents. It was also concluded that
extreme attention paid to internal variables should be balanced against external variables.
Keywords: Principle Component Analysis, Internal Variables, External Variables
1. Introduction
1.1. Overview
This survey study was designed to explore factors or
principle components affecting Iranian EFL learners’ success
from their own perspectives. The study also probed into these
components relationships with variables loading on them.
The roles of internal and external factors or components in
the acquisition of second or foreign language have been
broadly investigated in the past (e.g., Brown, 1995; Ellis,
2008; Nunan, 1988; Ortega, 2009). However, in many cases
the boundaries between these two principle components and
the way their respective variables load on them are left
unexplored. For example, while anxiety and attitude are
internal variables, they can be heightened or weakened by
external variables. On the other hand, shortcomings in the
external variables, such as unfavorable institutional context,
can be compensated for by the autonomy (an internal
variable) that a student has. Therefore, there might be
interactions between these two groups of variables and they
may reciprocally affect each other. Exploring these kinds of
relationships was the main concern of this research.
1.2. Statement of the Problem and Significance of the Study
Looking through research articles, journals, and books one
can see that countless research has been conducted on the
internal and external factors or principle components
affecting second or foreign language acquisition. However,
the question of the interactions between these two groups of
variables is given little attention. Robinson and Ellis (2008)
indicate that all these variables are inextricably intertwined in
a rich, complex, and dynamic way in languages. The purpose
of categorization, therefore, is only to understand the
situation better not to claim that these factors have nothing to
do with each other. Foreign language learners themselves too
have not been asked to express their views over these issues
very frequently, as the majority of research in the field has
been experimental in nature. This study aimed at bridging the
gaps in these two areas feeling that this might provide a
deeper understanding of what is going on in EFL
environments. Moreover, it tried to find out if it is correct to
look at the internal and external factors as separate groups of
variables having no interaction with each other. Still more,
the study tried to investigate the subdivisions of the internal
314 Soheil Mahmoudi and Asgar Mahmoudi: Internal and External Factors Affecting
Learning English as a Foreign Language
and external factors to see if they are further divisible into
cognitive and affective and curricular and environmental,
respectively.
1.3. Significance of the Study
A more profound understanding of the internal and
external principle components, and articulating them at some
detail with a reference to their due shares in developing
second or foreign language proficiency, will certainly help all
stakeholders to make wiser decisions. In particular
administrators and people in charge of directing the
educational system will know where to invest their time,
energy, and money. Students too can regulate their own
learning processes by the enhanced awareness that would
result. Many a time students do not know why they are not
making the progress they think they should with respect to all
their efforts. Parents, too, sometimes get frustrated by their
children’s sluggish progress because of the poor
understanding that they have of the so many variables
affecting their children’s performance. And even many
teachers get bogged down with all good intentions that they
bring to the process of teaching and learning. This study is
significant because it was designed to tell these people why
sometimes things go wrong. It is also significant because it
was an effort to provide clear understanding of the most
important variables that from learners’ perspectives affect
their learning of a foreign language, in this case English.
1.4. Design of the Study
This study was conducted following an ex post facto
design due to the fact that the variables and their clustering
and inter-correlations were thought to be present prior to the
beginning of the study. This means that, the study did not
involve any interference and merely tried to identify the
clustering and patterns of interactions that existed among the
foreign language learning variables from the respondents’
perspectives. Similar to experimental studies this design only
explains the consequent of a condition. Unlike experimental
studies, however, it does not let the researcher manipulate the
variables of the study.
2. Review of the Related Literature
2.1. Introduction
Looking at all variables affecting foreign language
learning simultaneously would be a little bit difficult. It
seems logical to classify these factors into two groups of
internal and external that include elements of the same type
(Madrid, 1995). External factors are largely dealt with in
books dealing with curriculum development and course
design (e.g., Dean Brown, 1995; Lewis & Hill, 1985; Nation
& Macalister, 2010; Nunan, 1988; Richards, 2001; White,
1988) while internal factors are discussed in SLA and
psychology books (e.g., Brown, 2007; Robinson & Ellis,
2008; Gass & Selinker, 2008; Ortega, 2009; Woolfolk, Winne,
& Perri, 2003).
2.2. Internal Variables
Internal variables imply cognitive and affective factors
such as motivation, intelligence, anxiety, risk-taking ability,
etc. Because of space limitation, only some of these variables
are elaborated on here.
Many studies have confirmed that motivation correlates
strongly with proficiency, indicating both that successful
learners are motivated and that success improves motivation.
Motivation has been recognized as an important variable
determining L2 achievement and attainment for a long time.
Motivation is believed to act as an engine generating learning
and then propelling students forward helping them overcome
the difficulties they encounter in learning a foreign language
(Cheng and Dörnyei, 2007; Dörnyei and Csizer, 1998).
Brown (2007) considers motivation as an affective factor that
plays a central role in learning a second or foreign language.
Cohen (2010) sees motivation as a dynamic process that is
not stable but is in a continuous change.
Language learners’ attitudes toward the language being
learned, likewise, can have a significant impact on SLA.
Where the community has a broadly negative view of the
target language and its speakers, or a negative view of its
relations to them, learning is typically much more difficult
(Gardner, 1985; “Attitude,” 2009). According to Siegel
(2003), motivation is affected by learners’ attitudes toward
the L2, its speakers, and the speakers’ culture.
Extraversion and introversion are two personality types
that fall within the brief of internal variables. Studies have
revealed that extraverts acquire a second language better than
introverts. Gregarious people usually tend to communicate
with others even if they are not sure they will succeed
(Kinginger and Farell, 2004).
2.3. External Variables
Among external variables one can refer to such variables
as social class, first language, teachers, early start, L2
curriculum, etc. Generally speaking, external variables can be
categorized into the two groups of environmental and
curricular but the list of external variables referred to here,
like the list of internal variables, is not exhaustive, as in
many other studies. Nation and Macalister (2010), for
example, in discussing the importance of curricular issues,
highlight the importance of needs analysis, sequencing the
course materials, evaluation, format and presentation of
materials. Richards (2001) too emphasizes the roles of
institutions, teachers, and learners in providing for effective
learning.
Teacher behavior definitely influences all kinds of learning
especially learning a foreign language. According to Cheng
and Dörnyei (2007), teachers can fire students’ enthusiasm by
being a personal model in the class. Stipek (2002), also
points to the importance of the teachers’ projection of
enthusiasm. With the development of technology the Internet
is playing a more and more important role in learning English.
English students are downloading English songs, and films
that let them get exposure to real English at a globalized
International Journal of Language and Linguistics 2015; 3(5): 313-322 315
communicational level (Nurul Islam, 2011). The Internet is
much more than this. All people around the globe, especially
students, use it to do research, to access library materials,
online quizzes, podcasts, and the like (Khanchali, & Ziadat,
2011).
It has been agreed on the fact that there should be some
sort of variety in EFL learning. One way of bringing variety
into EFL classes is the use of films (Ismaili, 2013). It is
revealed that L2 learners who do not possess the same
linguistic base as the L1 face a lot of difficulties. The
difficulties get bigger when there is a bigger difference
between L1 and L2 (Karim, 2003; Segalowitz 1986). One of
the ways to cope with this problem is integrating English
films, sometimes manipulated for pedagogical purposes, into
the teaching process.
3. Method
3.1. Introduction
In the case of EFL, a lot of questions can be asked that
roughly can be divided into questions addressing internal or
external variables. However, the loading of each of these
questions on the main construct and its subdivisions will not
be clear unless a PCA is run on the collected data. This is
because responses to questions or the importance assigned to
each variable in a questionnaire are situation and person
specific and vary from one situation and person to the other.
It is only after running a PCA that patterns of groupings in
that particular context emerge. On the other hand, researchers
might be interested in finding out if the principle components
they identify after running a PCA can be further subdivided
into additional specific components. This is possible in two
ways: impressionistically and by running additional PCAs.
Impressionistic grouping of variables has the danger that the
variables might not load on the component that the researcher
thinks they should even if they are conceptually and
theoretically related. Running a PCA, in contrast, increases
the precision and brings to the surface things that otherwise
might remain unnoticed.
3.2. Research Questions and Hypotheses
Following from what was said, this research tried to find
out if all of the variables in each category load on the
principle component to which they are attributed and if not
why. The study, in other words, tried to answer the questions
‘Do all variables that are theoretically considered to be
internal correlate significantly with each other? Do all
variables that are theoretically considered to be external
correlate significantly with each other? Are there any internal
and external variables that correlate significantly with each
other or with the other principle component? Are internal
variables divisible to cognitive and affective? Are external
variables divisible to curricular and environmental? How the
answers to these questions can be justified?
The null research hypotheses that were derived from these
questions are as follows:
H01: All variables that are theoretically considered to be
internal or external do not necessarily correlate significantly
with variables of their own type.
H02: There are no internal and external variables that
correlate significantly with each other or with the principle
component to which they do not belong.
H03: Internal and external variables are not treated, i.e.,
rated differently by EFL learners with respect to their
importance.
H04: Internal and external variables are divisible to
cognitive and affective and curricular and environmental,
respectively, with regard to the amount of importance that
students assign to them.
3.3. Participants
The participants of this study were all Master’s degree
students of English Language Teaching (ELT) in three
universities in northwest Iran, two in the provincial city of
Ardabil, and one in Ahar city. Naturally, all of the students
were above 22 years old and had an English language
learning experience of at least five years. A great majority of
the participants were fluent bilinguals of Persian and Azeri
but there were a few of them who did not know Azeri well.
No screening for proficiency was done before beginning of
the research because the research was not intended to
measure the participants’ gains in proficiency over time
rather to elicit their opinions about the importance of
variables affecting learning English as a foreign language.
3.4. Instruments
The instruments used in this study were of three types. The
first instrument was a 5-point Likert scale questionnaire
containing 30 questions. The questions were of two types
related to internal and external variables that could be further
sub-divided into cognitive and affective in the case of
internal variables and curricular and environmental in the
case of external variables. All of the questions were derived
from research articles and a rough balance was established
with respect to the number of questions addressing each
variable type. The values of responses to each question
ranged from 1 to 5. One represented the least effect and five
represented the most effect. The questionnaire was designed
to give the fullest possible coverage to the variables that,
according to the literature on the field, affect learning English
as a foreign language but the length of the questionnaire was
kept in control not to exceed the limit that might have
discouraged the respondents from answering all of the
questions with enough attention.
Another type of instrument used in this study was
Microsoft Office’s Excel spreadsheet that was used to
calculate the means of responses to each question in the
questionnaire. These means at the later stages of the study,
when the variables were divided into two components, were
used as distributions of mean scores to run an Independent-
samples T-test between the two groups of variables to
discover if according to students’ responses they were

316 Soheil Mahmoudi and Asgar Mahmoudi: Internal and External Factors Affecting
Learning English as a Foreign Language
significantly different from each other.
The last instrument used was the SPSS package that was
used to analyze the collected data. As a prerequisite of
descriptive studies, it was necessary to check for the
reliability of the questionnaire. Further, it was necessary to
run an exploratory PCA to find out if any variable, from
participants’ points of view, was exerting undue influence
upon foreign language learning. The findings would also be
much more understandable if they could be represented
diagrammatically. SPSS was used to do all these things.
3.5. Procedure
Since some respondents answer questions in a
questionnaire superficially, it was decided that if anyone’s
responses were the same for more than one-third of the
questions in the questionnaire, that copy of the questionnaire
be discarded from the study. For this reason, although
initially more than 160 copies of the questionnaire were
distributed among the MA students, the ultimate number of
copies used in the data analysis was 136.
Of the 30 questions in the questionnaire 15 were targeted
at the internal variables and 15 at the external variables but
not to let out the purpose of the study, the questions were
arranged in an odd-even order with odd questions addressing
the internal variables and even questions addressing the
external variables. The organization of the questions relating
to subdivisions of the internal and external variables was
random.
After the questions were answered and the data were
collected, they were entered into SPSS. SPSS recognizes
each question in a questionnaire as a single variable and deals
with it accordingly. After the data inputting and as the first
stage a Chronbach Alpha reliability test was run to find out if
the questionnaire was reliable. After that, a PCA with two
principle components on the overall data and then two more
PCAs on each major group of variables again with two
principle components were run with Scree and Component
plots to test the hypotheses of the study.
PCA, according to Pallant (2013), is a data reduction
technique that looks for a way a huge collection of data may
be reduced or summarized. The purpose of this study,
however, was to single out variables that did not correlate
with each other even though they belong to the same
category theoretically and explain why this might have been
the case.
PCA produces a series of tables and numbers that enable
researchers to find answers to their questions. Two of the
tables include measures of sampling adequacy and measures
of PCA appropriateness. An important number is determinant
of the correlation matrix. This number checks for the
existence of multicolinarity (correlations above .8 between
variables) and singularity (perfect correlations between
variables). SPSS provides this value at the bottom of the
correlation matrix. Determinant’s value should be
significantly different from zero.
PCA also produces two very informative plots. The first of
these plots is called the Scree plot and the other is called the
Component or Factor plot. The Scree plot tells us which
variable or groups of variables are statistically important and
should be retained. The component plot, however, represents
loadings of the variables on the components after they are
extracted.
4. Data Analysis
The questionnaire used in this study was a five-point
Likert scale questionnaire with 30 questions. The reliability
of this data collection instrument was r=.803, as shown in
Table 4.1 below. Pallant (2013) suggests that r values
above .70 are large enough for the reliability of
questionnaires.
Table 4.1. Reliability of the Questionnaire.
Reliability Statistics
Cronbach's Alpha N of Items
.803 30
PCA was used four times in this study. In the first case, it
was used to plot all of the variables on the component plot
and around the vectors. This was done to show that there
might be variables in each category that do not correlate with
each other and do not load on their respective components
rather load on the other component or fall somewhere in
between. In the second case, PCA was run without the
confounding variables, i.e., non-correlating variables. The
confounding variables were the ones whose strength of
correlation with any other variable and the principle
component to which they belonged did not exceed .3, a
criterion set by statisticians. The second instance of running
PCA could have given us a much clearer picture of what was
going on with respect to the loadings of variables on the two
principle components. It should be kept in mind, however,
that many of the non-correlating variables, as their mean
values represented, were very important ones to which
respondents had assigned some of the greatest values. This
means that, the results needed to be interpreted with respect
to the roles that these variables play in relation to foreign
language learning success not just by whether they correlate
with other variables or not. The third and fourth occasions of
running PCAs were related to exploring the variables’
interactions within the external and internal groups. Table 4.2
represents the KMO and Bartlett’s values for the total data in
this study.
Table 4.2. KMO Test of Sampling Adequacy and Bartlett’s Sphericity.
KMO and Bartlett's Test
Kaiser-Meyer-Olkin Measure of Sampling Adequacy. .626
Bartlett's Test of Sphericity
Approx. Chi-Square 998.899
df 435
Sig. .000
According to Field (2009), the value of KMO test of
adequacy of sampling should be above the bare minimum
of .5 for us to be able to run PCA. Bartlett’s measure, tests
whether the correlation matrix is an identity matrix (that is, if
International Journal of Language and Linguistics 2015; 3(5): 313-322 317
there is any variable that does not correlate with any other
variable) or not. Identity matrices are not appropriate for
PCA tests. So, we need some correlations between variables
for PCA to work but this correlation should not be very high
which would result in multicolinarity or singularity.
Another index to be checked for is Determinant of the
correlation. The value of Determinant of the correlation is
important for rejecting multicollinarity and singularity. This
value which is given at the bottom of the Correlation Matrix
(which is not given here for its big size) must be smaller
than .05 for us to be able to reject the existence of
multicollinarity and singularity. In the case of our data the
Determinant’s value was equal to zero.
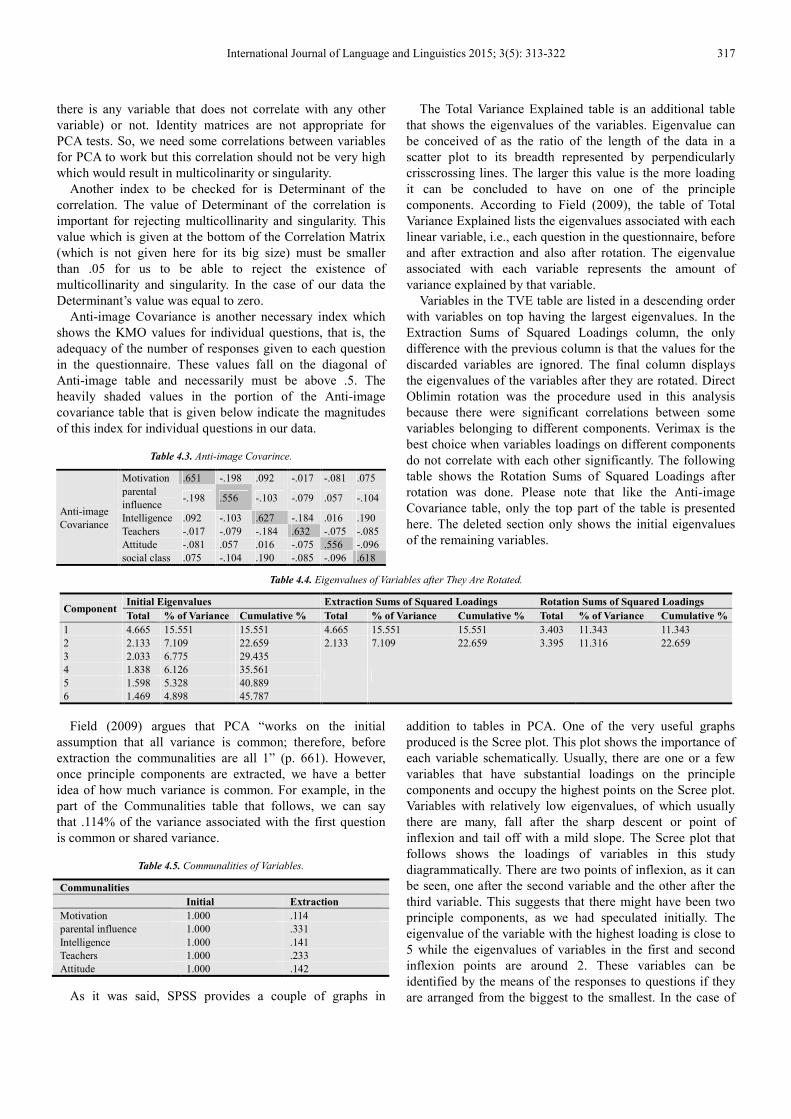
Anti-image Covariance is another necessary index which
shows the KMO values for individual questions, that is, the
adequacy of the number of responses given to each question
in the questionnaire. These values fall on the diagonal of
Anti-image table and necessarily must be above .5. The
heavily shaded values in the portion of the Anti-image
covariance table that is given below indicate the magnitudes
of this index for individual questions in our data.
Table 4.3. Anti-image Covarince.
Anti-image
Covariance
Motivation .651 -.198 .092 -.017 -.081 .075
parental
influence -.198 .556 -.103 -.079 .057 -.104
Intelligence .092 -.103 .627 -.184 .016 .190
Teachers -.017 -.079 -.184 .632 -.075 -.085
Attitude -.081 .057 .016 -.075 .556 -.096
social class .075 -.104 .190 -.085 -.096 .618
The Total Variance Explained table is an additional table
that shows the eigenvalues of the variables. Eigenvalue can
be conceived of as the ratio of the length of the data in a
scatter plot to its breadth represented by perpendicularly
crisscrossing lines. The larger this value is the more loading
it can be concluded to have on one of the principle
components. According to Field (2009), the table of Total
Variance Explained lists the eigenvalues associated with each
linear variable, i.e., each question in the questionnaire, before
and after extraction and also after rotation. The eigenvalue
associated with each variable represents the amount of
variance explained by that variable.
Variables in the TVE table are listed in a descending order
with variables on top having the largest eigenvalues. In the
Extraction Sums of Squared Loadings column, the only
difference with the previous column is that the values for the
discarded variables are ignored. The final column displays
the eigenvalues of the variables after they are rotated. Direct
Oblimin rotation was the procedure used in this analysis
because there were significant correlations between some
variables belonging to different components. Verimax is the
best choice when variables loadings on different components
do not correlate with each other significantly. The following
table shows the Rotation Sums of Squared Loadings after
rotation was done. Please note that like the Anti-image
Covariance table, only the top part of the table is presented
here. The deleted section only shows the initial eigenvalues
of the remaining variables.
Table 4.4. Eigenvalues of Variables after They Are Rotated.
Component Initial Eigenvalues Extraction Sums of Squared Loadings Rotation Sums of Squared Loadings
Total % of Variance Cumulative % Total % of Variance Cumulative % Total % of Variance Cumulative %
1 4.665 15.551 15.551 4.665 15.551 15.551 3.403 11.343 11.343
2 2.133 7.109 22.659 2.133 7.109 22.659 3.395 11.316 22.659
3 2.033 6.775 29.435
4 1.838 6.126 35.561
5 1.598 5.328 40.889
6 1.469 4.898 45.787
Field (2009) argues that PCA “works on the initial
assumption that all variance is common; therefore, before
extraction the communalities are all 1” (p. 661). However,
once principle components are extracted, we have a better
idea of how much variance is common. For example, in the
part of the Communalities table that follows, we can say
that .114% of the variance associated with the first question
is common or shared variance.
Table 4.5. Communalities of Variables.
Communalities
Initial Extraction
Motivation 1.000 .114
parental influence 1.000 .331
Intelligence 1.000 .141
Teachers 1.000 .233
Attitude 1.000 .142
As it was said, SPSS provides a couple of graphs in
addition to tables in PCA. One of the very useful graphs
produced is the Scree plot. This plot shows the importance of
each variable schematically. Usually, there are one or a few
variables that have substantial loadings on the principle
components and occupy the highest points on the Scree plot.
Variables with relatively low eigenvalues, of which usually
there are many, fall after the sharp descent or point of
inflexion and tail off with a mild slope. The Scree plot that
follows shows the loadings of variables in this study
diagrammatically. There are two points of inflexion, as it can
be seen, one after the second variable and the other after the
third variable. This suggests that there might have been two
principle components, as we had speculated initially. The
eigenvalue of the variable with the highest loading is close to
5 while the eigenvalues of variables in the first and second
inflexion points are around 2. These variables can be
identified by the means of the responses to questions if they
are arranged from the biggest to the smallest. In the case of

318 Soheil Mahmoudi and Asgar Mahmoudi: Internal and External Factors Affecting
Learning English as a Foreign Language
our data, the first two largest loadings belonged to motivation
and teachers.
Figure 4.1. Loadings of the variables.
Another important graph that is very informative is the
Component Plot, alternatively called Factor Plot. This plot is
especially easy to draw when there are only two principle
components, because the loadings of variables on them can
be represented by two vertical and horizontal axes or vectors.
In a two-dimensional component plot, variables that relate to
each principle component are plotted around those
components represented by the axes. The coordinates of each
variable represent the strength of the relationship between
that variable and each of the components. That is, the
position of each variable says how much it correlates with
each of the components. The axes lines range from -1 to 1
which are the outer limits of a correlation coefficient (Field,
2009). In Figure 4.2 below a component plot for the data in
this study is given. As it is evident, a cloud of dots covers the
area between the two axes on the right top most quarter of the
graph. The dots falling on the middle of the cloud represent
the variables that not only do not correlate with a particular
principle component strongly enough but also do not
correlate with other variables of their own type. This finding
is confirmed by looking at the Correlations Matrix and
provides evidence for accepting our both first and second
hypotheses. Remember that our first hypothesis stated that
not all variables that are theoretically considered to be
internal or external necessarily correlate significantly with
variables of their own type. In our Correlation Matrix (which
is not given here for its large size) there were at least four
internal variables and seven external variables that did not
correlate with variables of their own type significantly. This
is realizable from the fact that on the component plot
variables are not clustered tightly around their respective
components. And our second hypothesis stated that there are
no internal and external variables that correlate significantly
with each other or with the principle component to which
they do not belong. Again, considering the odd and even
numbers around each vector that represent internal and
external variables, respectively, we can see that there are
variables of each type clustering around both of the axes.
This means that there, indeed, had been variables of different
types that correlated significantly with each other and with
the principle component to which they did not belong.
Figure 4.2. Components and their contributing variables.
Strangely enough, the non-correlating variables are some
of the most important variables as rated by the respondents.
The results obtained in the Rotated Component Matrix below
too show variables of different nature having loadings on the
Component to which they do not belong conceptually.
Table 4.6. Rotated Loadings of Variables on Components.
Rotated Component Matrixa
Component
1 2
Beliefs .738
job market .670
Politics .621
risk-taking ability .506
Personality .499
social class .419
Press .417
first language .338 .310
Autonomy .337
analytical perception .334
Friends .334
degree of hopefulness
group work .610
early start .575
Films .524
parental influence .495
Anxiety .494
participation .352 .443
Age .438
Teachers .431
competitiveness .413
openness to innovation and new
methods .385
Intelligence .373
L2 curriculum .335
Motivation .331
Institution .313
Internet
Attitude
teaching resources
persistence
The non-correlating variables are questions addressing
motivation, intelligence, teachers, social class, autonomy,
institutions, friends, persistence, the Internet, teaching
resources, and L2 curriculum with mean values of 4.80, 3.97,
4.18, 3.42, 3.52, 3.5, 3.15, 4.11, 3.80, 3.68, 3.17, respectively.
Some of these variables are internal and others external. The

International Journal of Language and Linguistics 2015; 3(5): 313-322 319
empty spaces are there because correlations between the
variable and the principle components had been below. 3.
This state of affairs, however, does not reject the idea that,
generally speaking, there are two principle components. To
show that there are specific groups of variables that load on
just one component we can discard our non-correlating
variables and run PCA one more time. The Component Plot
and the Rotated Component Matrix resulting from this
pruning process will be more revealing as can be seen below
in Figure 4.3 and Table 4.7.
Figure 4.3. Components and their contributing variables after pruning.
Table 4.7. Loadings of Variables on Components after Pruning.
Rotated Component Matrixa
Component
1 2
group work .698
Films .672
early start .594
parental influence .555
participation .529
Age .525
first language .478
Press .389
Beliefs .720
job market .647
risk-taking ability .608
personality .569
Politics .527
degree of hopefulness .419
Attitude .400
To test our third research hypothesis we needed to run an
Independent-samples t-test to find out if different variable
types had been treated, i.e., rated, differently by EFL learners
with respect to their importance or not. Before running this
test it would be better for us to know that the grand mean of
the scores assigned to the internal variables was 3.767 and
the grand mean of the scores assigned to the external
variables was 3.499 and this is while only three external
variables, namely, politics, friends, and parental influence, by
mean scores of 2.71, 3.03, and 3.15, respectively, gathered
low mean scores compared to other external variables. If
students had enough information about the role of politicians
in setting educational goals, the role that parents play in their
children’s learning of English as a foreign language, and in
developing positive attitudes toward this language, and the
role that peers play in many cooperative learning contexts,
their responses could have favored external variables. Table
4.8 shows the lack of significant difference in the importance
assigned to internal and external principle components by
respondents in this study.
Table 4.8. Independent-samples T-test Comparing Means of Internal and
External Variables.
Independent Samples Test
Levene's Test for
Equality of Variances
t-test for Equality of
Means
F Sig. t df Sig. (2-tailed)
Equal variances
assumed .990 .328 1.897 28 .068
The result obtained from running Independent-samples t-
test convinces us that the mean values of the students’
responses to different types of questions did not differ from
each other significantly which pushes us to accept our third
hypothesis, that is, the importance of internal and external
variables from the respondents’ perspectives had almost been
the same.
Another thing that could be investigated in relation to the
questions in the questionnaire was if the internal and external
components themselves are divisible. Answering this
question could enable us to either reject our fourth research
hypothesis which was: Internal and external variables are
divisible to cognitive and affective and curricular and
environmental, respectively, or accept it. Since, we have
already become familiar with the workings of PCA, it would
not be very difficult to interpret the results reported below
with minimum explanation needed.
To begin with, the internal and external variables needed to
be separated from each other. It was said in section three that
the questionnaire was divisible to odd-even variables with
odd numbers representing the internal and even numbers
representing the external variables.
Running a PCA on the internal variables returned a non-
significant Determinant value of .124 below the Correlation
Matrix. This meant that the assumptions of multicolinarity
and singularity were not violated and that the data was
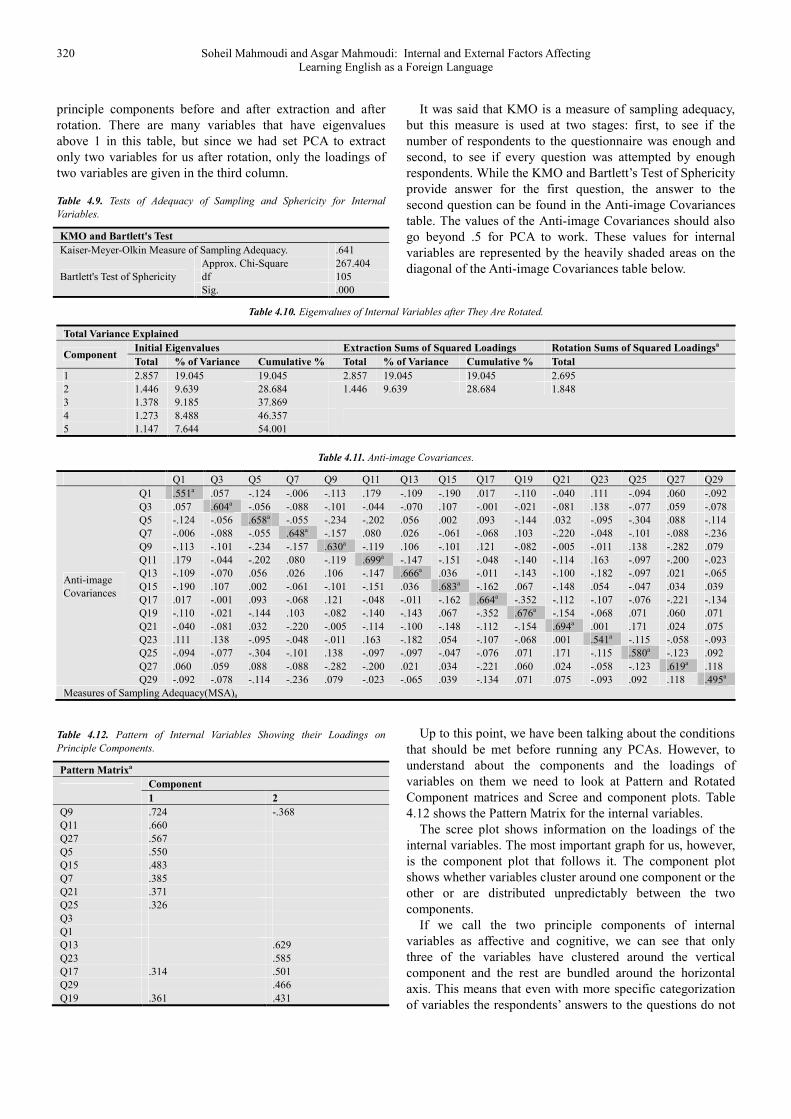
appropriate for running PCA. The KMO test, also, with a
value of .641 was above the bare minimum of .5, which is the
lowest limit for the adequacy of sampling. The significance
level of the Bartlet’s Test of Sphericity, likewise, was
below .05 which meant that all variables correlated with each
other to some extent. Information related to the KMO and
Bartlett’s Sphericity tests are given in Table 4.9 below.
Communalities table for internal variables is ignored here,
as it will be ignored for the external variables, because the
kind of information they provide for us is not vital to our
understanding of the remaining of this study. Table 4.10
represents the eigenvalues or loadings of the variables on the
320 Soheil Mahmoudi and Asgar Mahmoudi: Internal and External Factors Affecting
Learning English as a Foreign Language
principle components before and after extraction and after
rotation. There are many variables that have eigenvalues
above 1 in this table, but since we had set PCA to extract
only two variables for us after rotation, only the loadings of
two variables are given in the third column.
Table 4.9. Tests of Adequacy of Sampling and Sphericity for Internal
Variables.
KMO and Bartlett's Test
Kaiser-Meyer-Olkin Measure of Sampling Adequacy. .641
Bartlett's Test of Sphericity
Approx. Chi-Square 267.404
df 105
Sig. .000
It was said that KMO is a measure of sampling adequacy,
but this measure is used at two stages: first, to see if the
number of respondents to the questionnaire was enough and
second, to see if every question was attempted by enough
respondents. While the KMO and Bartlett’s Test of Sphericity
provide answer for the first question, the answer to the
second question can be found in the Anti-image Covariances
table. The values of the Anti-image Covariances should also
go beyond .5 for PCA to work. These values for internal
variables are represented by the heavily shaded areas on the
diagonal of the Anti-image Covariances table below.
Table 4.10. Eigenvalues of Internal Variables after They Are Rotated.
Total Variance Explained
Component Initial Eigenvalues Extraction Sums of Squared Loadings Rotation Sums of Squared Loadingsa
Total % of Variance Cumulative % Total % of Variance Cumulative % Total
1 2.857 19.045 19.045 2.857 19.045 19.045 2.695
2 1.446 9.639 28.684 1.446 9.639 28.684 1.848
3 1.378 9.185 37.869
4
5
1.273
1.147
8.488
7.644
46.357
54.001
Table 4.11. Anti-image Covariances.
Q1 Q3 Q5 Q7 Q9 Q11 Q13 Q15 Q17 Q19 Q21 Q23 Q25 Q27 Q29
Anti-image
Covariances
Q1 .551a .057 -.124 -.006 -.113 .179 -.109 -.190 .017 -.110 -.040 .111 -.094 .060 -.092
Q3 .057 .604a -.056 -.088 -.101 -.044 -.070 .107 -.001 -.021 -.081 .138 -.077 .059 -.078
Q5 -.124 -.056 .658a -.055 -.234 -.202 .056 .002 .093 -.144 .032 -.095 -.304 .088 -.114
Q7 -.006 -.088 -.055 .648a -.157 .080 .026 -.061 -.068 .103 -.220 -.048 -.101 -.088 -.236
Q9 -.113 -.101 -.234 -.157 .630a -.119 .106 -.101 .121 -.082 -.005 -.011 .138 -.282 .079
Q11 .179 -.044 -.202 .080 -.119 .699a -.147 -.151 -.048 -.140 -.114 .163 -.097 -.200 -.023
Q13 -.109 -.070 .056 .026 .106 -.147 .666a .036 -.011 -.143 -.100 -.182 -.097 .021 -.065
Q15 -.190 .107 .002 -.061 -.101 -.151 .036 .683a -.162 .067 -.148 .054 -.047 .034 .039
Q17 .017 -.001 .093 -.068 .121 -.048 -.011 -.162 .664a -.352 -.112 -.107 -.076 -.221 -.134
Q19 -.110 -.021 -.144 .103 -.082 -.140 -.143 .067 -.352 .676a -.154 -.068 .071 .060 .071
Q21 -.040 -.081 .032 -.220 -.005 -.114 -.100 -.148 -.112 -.154 .694a .001 .171 .024 .075
Q23 .111 .138 -.095 -.048 -.011 .163 -.182 .054 -.107 -.068 .001 .541a -.115 -.058 -.093
Q25 -.094 -.077 -.304 -.101 .138 -.097 -.097 -.047 -.076 .071 .171 -.115 .580a -.123 .092
Q27 .060 .059 .088 -.088 -.282 -.200 .021 .034 -.221 .060 .024 -.058 -.123 .619a .118
Q29 -.092 -.078 -.114 -.236 .079 -.023 -.065 .039 -.134 .071 .075 -.093 .092 .118 .495a
Measures of Sampling Adequacy(MSA)a
Table 4.12. Pattern of Internal Variables Showing their Loadings on
Principle Components.
Pattern Matrixa
Component
1 2
Q9 .724 -.368
Q11 .660
Q27 .567
Q5 .550
Q15 .483
Q7 .385
Q21 .371
Q25 .326
Q3
Q1
Q13 .629
Q23 .585
Q17 .314 .501
Q29 .466
Q19 .361 .431
Up to this point, we have been talking about the conditions
that should be met before running any PCAs. However, to
understand about the components and the loadings of
variables on them we need to look at Pattern and Rotated
Component matrices and Scree and component plots. Table
4.12 shows the Pattern Matrix for the internal variables.
The scree plot shows information on the loadings of the
internal variables. The most important graph for us, however,
is the component plot that follows it. The component plot
shows whether variables cluster around one component or the
other or are distributed unpredictably between the two
components.
If we call the two principle components of internal
variables as affective and cognitive, we can see that only
three of the variables have clustered around the vertical
component and the rest are bundled around the horizontal
axis. This means that even with more specific categorization
of variables the respondents’ answers to the questions do not

International Journal of Language and Linguistics 2015; 3(5): 313-322 321
converge or diverge on the basis of variables’ nature.
Ignoring other details, the Component plot for the external
variables shows even a more confusing picture of the
loadings of this type of variables on the curricular and
environmental components, as can be seen in Figure 4.6.
Figure 4.4. Scree plot for the internal variables.
Figure 4.5. Component plot for the internal variables.
Figure 4.6. Component plot for the external variables.
These findings drive us to the conclusion that our fourth
hypothesis concerning the divisibility of the internal and
external variables to cognitive and affective and curricular
and environmental, respectively, is not tenable with respect to
the amount of importance assigned to them although this
division might be valid theoretically. That is, students do not
accord much importance to a variable simply because it is
internal or external, rather they look back at their own
language experience and try to figure out what it was that
made them a successful learner or what discouraged them
from learning be it internal or external.
5. Conclusion and Discussion
The finding that there were two principle components is not
very important because we already knew about it. What is
important is that to determine the elements of success in foreign
language learning one should not exclusively concentrate on
variables that load on one principle component or the other but
to concentrate on both of them and even variables that load on
none of them heavily. Alternatively, one could focus on variables
that although belonging to a particular category, do not correlate
highly with variables of the same nature.
One reason for this is that variables that theoretically are
related to each other and fall in the same category do not
necessarily correlate highly with each other and even with the
principle component that represents them. For example, in the
case of this study motivation, which had the highest mean
score among all of the variables, did not correlate highly with
the internal variables like intelligence and persistence. It did
not load heavily on the internal principle component either, as
can be seen in Table 4.6. On the other hand, ‘teachers’ variable
which was the second most important variable from the
respondents’ perspective did not correlate highly with teaching
resources and institutions and did not load heavily on the
external component either, as is visible again in Table 4.6.
These findings altogether suggest that categories should not be
the basis of our judgment by saying that, for example, internal
variables are more important than external variables merely
because these are emphasized more in the literature. What
matters, is paying balanced attention to both categories of
variables and exploring their effects.
References
[1] Attitude. (2009). In Encyclopedia Wikipedia online. Retrieved from http://en.wikipedia,org/second_language_acquisition/attitue.
[2] Brown, H. D. (2007). Principles of Language Learning and Teaching (5th ed.). New York: Pearson Education, Inc.
[3] Brown, J. D. (1995). The elements of language curriculum. Boston, Massachusetts: Heinle & Heinle Publishers.
[4] Cheng, H., & Dӧrnyei, Z. (2007). The use of motivational strategies in language instruction: the case of EFL teaching in Taiwan. Innovation in Language Learning and Teaching, 1(1), 153–174.
322 Soheil Mahmoudi and Asgar Mahmoudi: Internal and External Factors Affecting
Learning English as a Foreign Language
[5] Cohen, A. D. (2010). Focus on language learner: Style, strategies, and motivation. In N. Schmitt (Ed.), An introduction to applied linguistics (2nd ed.). London: Hodder & Stoughton Ltd.
[6] Dӧrnyei, Z. and Csizer, K. (1998). Ten commandments for motivating language learners: Results of an empirical study. Language Teaching Research, 2(3), 203–229.
[7] Ellis, R. (2008). The study of second language acquisition (2nd ed.). New York: Oxford University Press.
[8] Field, A. (2009). Discovering statistics using SPSS (3rd ed.). London: Sage Publications Ltd.
[9] Gardner, R. C. (1985). Social psychology and second language learning: The role of attitudes and motivation. London: Edward Arnold.
[10] Gass, S., & Selinker, L. (2008). Second language acquisition (3rd ed.). New York: Routledge.
[11] Ismaili, M., (2013). The effectiveness of using movies in the EFL classroom: A study conducted at South East European University. Academic Journal of Interdisciplinary Studies, 2 (4), 110–118.
[12] Karim, K. (2003). First language (L1) influence on second language (L2) reading: The role of transfer. Proceedings of the 19th Northwest Linguistics Conference. (pp. 324–347). Victoria, B.C.: Victoria.
[13] Khanchali, M., & Zidat, A. (2011). The impact of the Internet on the development of students’ writing. Revue des Sciences Humaines 21, 51–62.
[14] Kinginger, C., & Farrell, K. (2004). Assessing development of meta-pragmatic awareness in study abroad. Frontiers: The Interdisciplinary Journal of Study Abroad, 10, 19–42.
[15] Lewis, M., & Hill, J. (1985). Practical techniques for language teaching. London: Language Teaching Publications.
[16] Madrid, D. (1995). Interanl and external factors in language teaching. Actas de las 1I Jornadas de Estudios Ingleses. Universidad de Jaen, 2 (2), 59–82.
[17] Nation, I. S. P., & Macalister, J (2010). Language curriculum design. New York: Routledge.
[18] Nunan, D. (1988). Syllabus design. New York: Oxford University Press.
[19] Nurul Islam, M. (2011). Independent English learning through the Internet. Journal of Language Teaching and Research, 2 (5), 1080–1085.
[20] Ortega, L. (2009). Understanding second language acquisition. London: Hodder Education.
[21] Pallant, J. (2013). SPSS survival manual. New York: Open University Press.
[22] Richards, J. C. (2001). Curriculum development in language teaching. New York: Cambridge University Press.
[23] Robinson, P., & Ellis, N. C. (2008). An introduction to cognitive linguistics, second language acquisition, and language instruction. In P. Robinson, & N. C. Ellis (Eds.). Handbook of cognitive linguistics and second language acquisition. New York: Routledge.
[24] Segalowitz, N. (1986). Skilled reading in the second language. In J. Vaid (Ed.). Language Processing in bilinguals: Psycholinguistic and Neuropsychological Perspectives. Hillsdale, NJ: Lawrence Erlbaum.
[25] Siegel, J. (2003). Social context. In C. J. Doughthy, & M. H. Long (Eds.). The handbook of second language acquisition. Oxford: Blackwell Publishing Ltd.
[26] Stipek, D. J. (2002). Motivation to learn: Integrating theory and practice (4th ed.). Boston, MA: Allyn and Bacon.
[27] White, R. (1988). The ELT curriculum: Design, innovation and management. Oxford: Basil Blackwell Ltd.
[28] Woolfolk, A. E., Winne, P. H., & Perry, N. E. (2003). Educational Psychology (2nd ed.). Toronto: Pearson Education Canada Inc.