Embed Size (px)
Citation preview
Phase Diagrams—Understanding the BasicsF.C. Campbell, editor
Copyright © 2012 ASM International®
All rights reservedwww.asminternational.org
Chapter 9Intermediate Phases
PhASe DIAgrAMS are often quite complex, with a number of dif-ferent reactions occurring at different compositions and temperatures. In most cases, the appearance of several reactions in a binary phase diagram is the result of the presence of intermediate phases. These are phases whose chemical compositions are intermediate between the two pure metals, and whose crystalline structures are different from those of the pure metals. The difference in crystalline structure distinguishes intermediate phases from primary solid solutions, which are based on pure metals. Some inter-mediate phases can accurately be called intermetallic compounds, when, like Mg2Pb, they have a fixed simple ratio of the two kinds of atoms. How-ever, many intermediate phases that exist over a range of compositions are considered to be intermediate or secondary solid solutions.
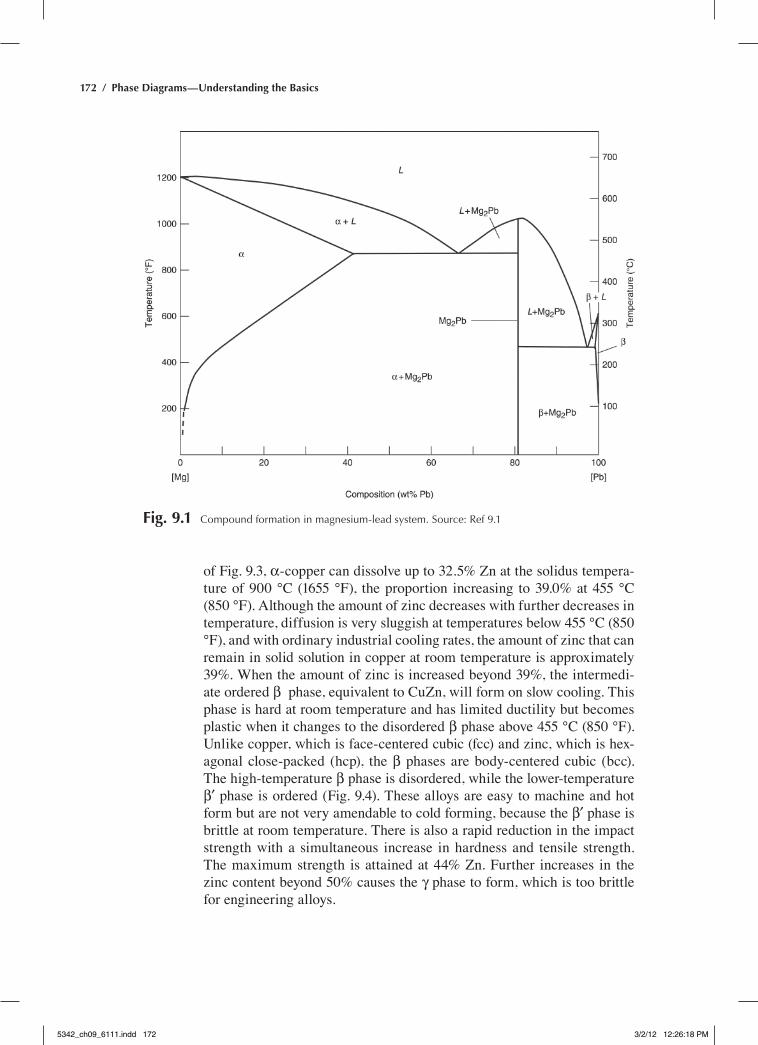
Intermediate phases can be classified based on their melting behavior, either congruent or incongruent melting phases. On heating, an incongru-ent melting phase decomposes into two different phases, usually one solid and one liquid, such as a peritectic transformation. A congruent melting phase melts in the same manner as a pure metal. In this case, the phase diagram is divided into essentially independent sections. In Fig. 9.1, the congruent melting β phase divides the lead-magnesium diagram into two separate eutectic reactions that can be analyzed separately. The β phase is the intermetallic compound Mg2Pb that has a simple fixed ratio of the two kinds of metal atoms. The details of different types of intermetallic compounds were covered in Chapter 2, “Solid Solutions and Phase Trans-formations” in this book. Many intermetallic compounds are avoided in alloying because they tend to be hard and brittle.
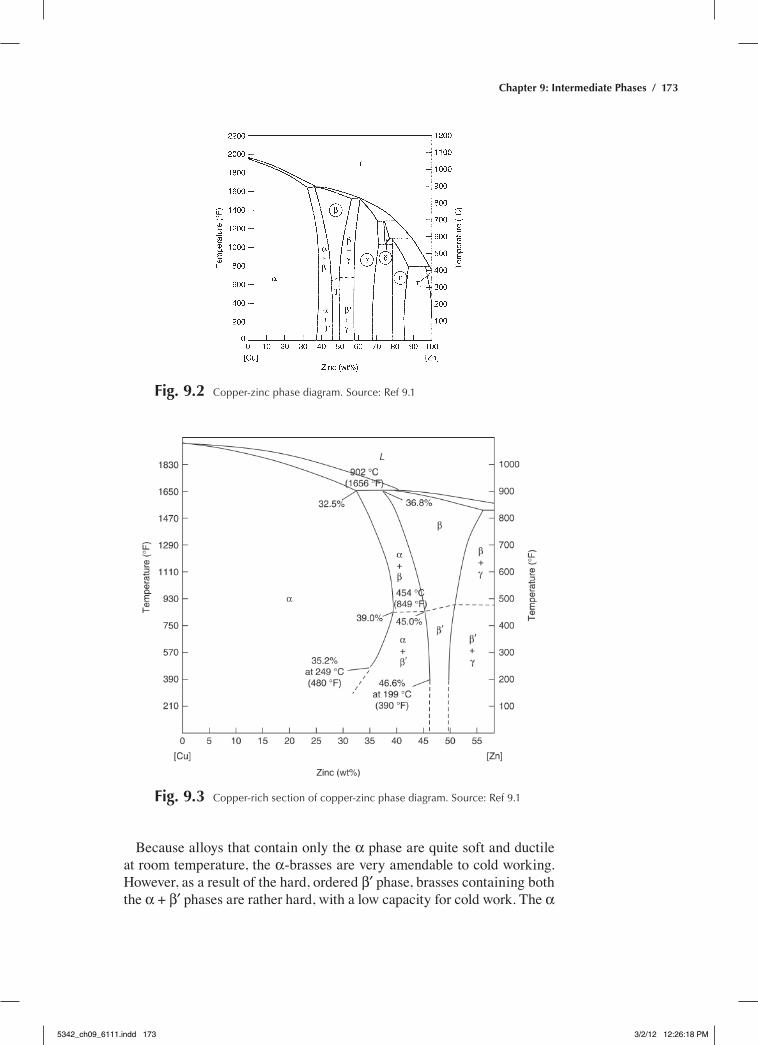
The copper-zinc phase diagram shown in Fig. 9.2 contains intermedi-ate phases with appreciable ranges of solid solubility. In this diagram, the copper-rich α solid solution and the zinc-rich η solid solution are the two terminal phases, and the four intermediate phases are β, γ, δ, and ε. The copper-zinc system forms the basis for the industrially important brass alloys. As shown in the copper-rich portion of the copper-zinc diagram
5342_ch09_6111.indd 171 3/2/12 12:26:17 PM
172 / Phase Diagrams—Understanding the Basics
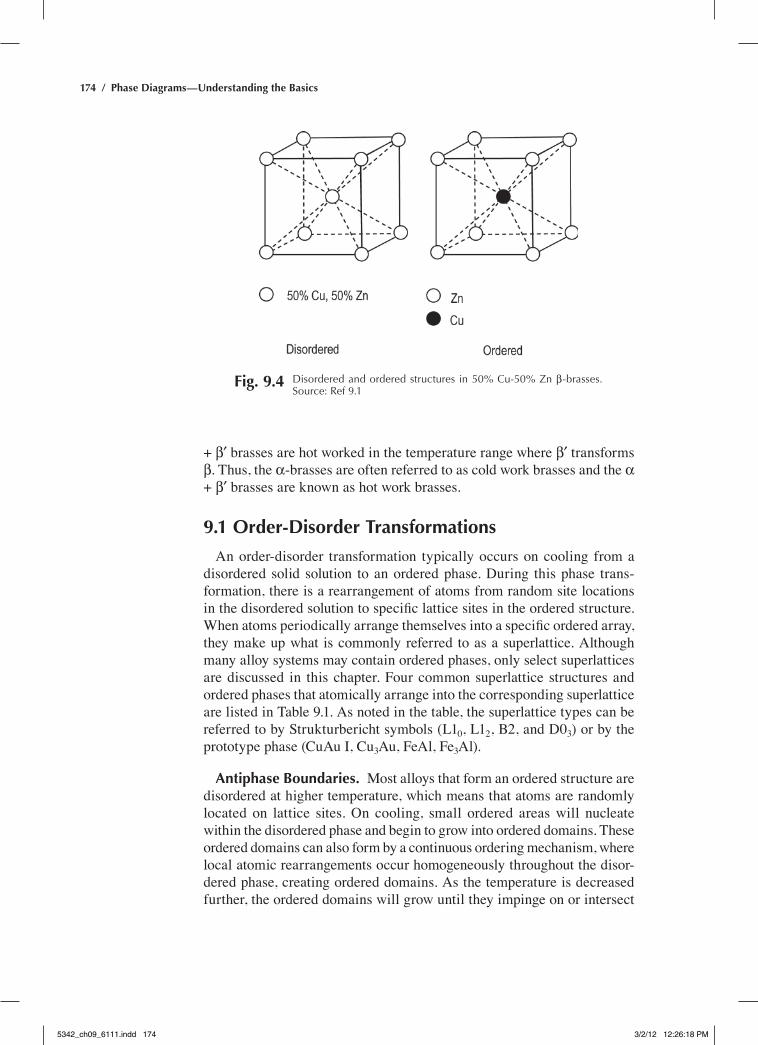
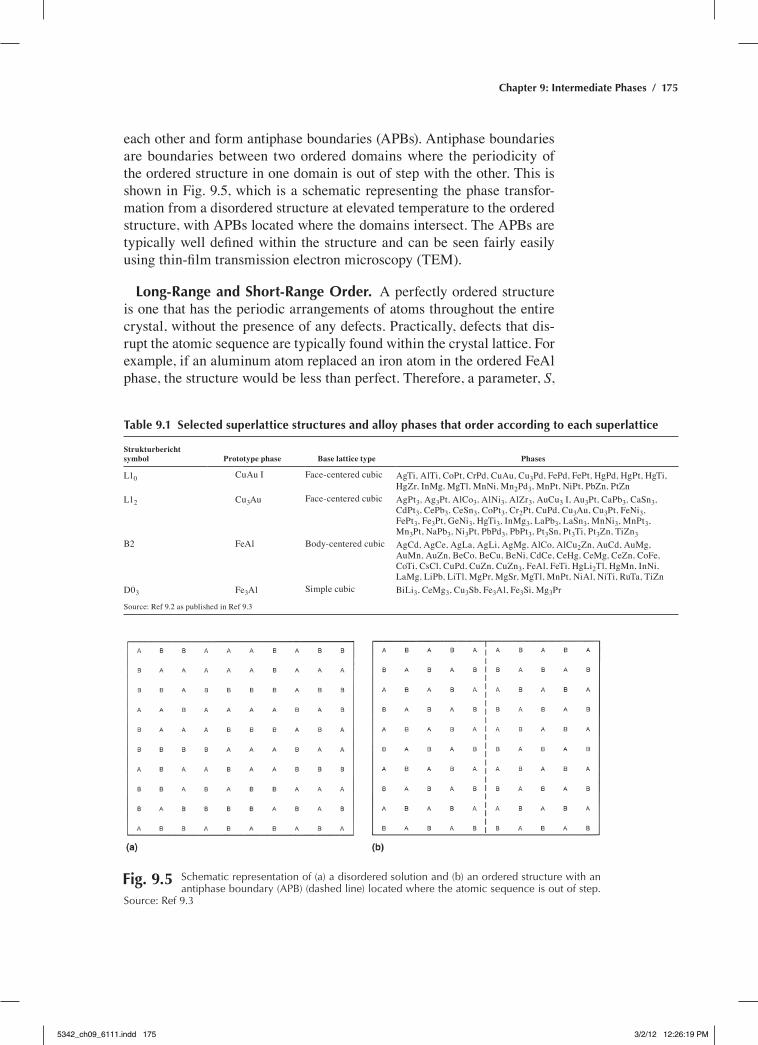
of Fig. 9.3, α-copper can dissolve up to 32.5% Zn at the solidus tempera-ture of 900 °C (1655 °F), the proportion increasing to 39.0% at 455 °C (850 °F). Although the amount of zinc decreases with further decreases in temperature, diffusion is very sluggish at temperatures below 455 °C (850 °F), and with ordinary industrial cooling rates, the amount of zinc that can remain in solid solution in copper at room temperature is approximately 39%. When the amount of zinc is increased beyond 39%, the intermedi-ate ordered β¢ phase, equivalent to CuZn, will form on slow cooling. This phase is hard at room temperature and has limited ductility but becomes plastic when it changes to the disordered β phase above 455 °C (850 °F). Unlike copper, which is face-centered cubic (fcc) and zinc, which is hex-agonal close-packed (hcp), the β phases are body-centered cubic (bcc). The high-temperature β phase is disordered, while the lower-temperature β′ phase is ordered (Fig. 9.4). These alloys are easy to machine and hot form but are not very amendable to cold forming, because the β′ phase is brittle at room temperature. There is also a rapid reduction in the impact strength with a simultaneous increase in hardness and tensile strength. The maximum strength is attained at 44% Zn. Further increases in the zinc content beyond 50% causes the γ phase to form, which is too brittle for engineering alloys.
Fig. 9.1 Compound formation in magnesium-lead system. Source: ref 9.1
5342_ch09_6111.indd 172 3/2/12 12:26:18 PM
Chapter 9: Intermediate Phases / 173
Fig. 9.2 Copper-zinc phase diagram. Source: ref 9.1
Fig. 9.3 Copper-rich section of copper-zinc phase diagram. Source: ref 9.1
Because alloys that contain only the α phase are quite soft and ductile at room temperature, the α-brasses are very amendable to cold working. however, as a result of the hard, ordered β′ phase, brasses containing both the α + β′ phases are rather hard, with a low capacity for cold work. The α
5342_ch09_6111.indd 173 3/2/12 12:26:18 PM
174 / Phase Diagrams—Understanding the Basics
+ β′ brasses are hot worked in the temperature range where β′ transforms β. Thus, the α-brasses are often referred to as cold work brasses and the α + β′ brasses are known as hot work brasses.
9.1 Order-Disorder Transformations
An order-disorder transformation typically occurs on cooling from a disordered solid solution to an ordered phase. During this phase trans-formation, there is a rearrangement of atoms from random site locations in the disordered solution to specific lattice sites in the ordered structure. When atoms periodically arrange themselves into a specific ordered array, they make up what is commonly referred to as a superlattice. Although many alloy systems may contain ordered phases, only select superlattices are discussed in this chapter. Four common superlattice structures and ordered phases that atomically arrange into the corresponding superlattice are listed in Table 9.1. As noted in the table, the superlattice types can be referred to by Strukturbericht symbols (L10, L12, B2, and D03) or by the prototype phase (CuAu I, Cu3Au, FeAl, Fe3Al).
Antiphase Boundaries. Most alloys that form an ordered structure are disordered at higher temperature, which means that atoms are randomly located on lattice sites. On cooling, small ordered areas will nucleate within the disordered phase and begin to grow into ordered domains. These ordered domains can also form by a continuous ordering mechanism, where local atomic rearrangements occur homogeneously throughout the disor-dered phase, creating ordered domains. As the temperature is decreased further, the ordered domains will grow until they impinge on or intersect
Fig. 9.4 Disordered and ordered structures in 50% Cu-50% Zn β-brasses. Source: ref 9.1
5342_ch09_6111.indd 174 3/2/12 12:26:18 PM
Chapter 9: Intermediate Phases / 175
each other and form antiphase boundaries (APBs). Antiphase boundaries are boundaries between two ordered domains where the periodicity of the ordered structure in one domain is out of step with the other. This is shown in Fig. 9.5, which is a schematic representing the phase transfor-mation from a disordered structure at elevated temperature to the ordered structure, with APBs located where the domains intersect. The APBs are typically well defined within the structure and can be seen fairly easily using thin-film transmission electron microscopy (TEM).
Long-Range and Short-Range Order. A perfectly ordered structure is one that has the periodic arrangements of atoms throughout the entire crystal, without the presence of any defects. Practically, defects that dis-rupt the atomic sequence are typically found within the crystal lattice. For example, if an aluminum atom replaced an iron atom in the ordered FeAl phase, the structure would be less than perfect. Therefore, a parameter, S,
Table 9.1 Selected superlattice structures and alloy phases that order according to each superlattice
Strukturbericht symbol Prototype phase Base lattice type Phases
L10 CuAu I Face-centered cubic AgTi, AlTi, CoPt, CrPd, CuAu, Cu3Pd, FePd, FePt, hgPd, hgPt, hgTi, hgZr, InMg, MgTl, MnNi, Mn2Pd3, MnPt, NiPt, PbZn, PtZn
L12 Cu3Au Face-centered cubic AgPt3, Ag3Pt, AlCo3, AlNi3, AlZr3, AuCu3 I, Au3Pt, CaPb3, CaSn3, CdPt3, CePb3, CeSn3, CoPt3, Cr2Pt, CuPd, Cu3Au, Cu3Pt, FeNi3, FePt3, Fe3Pt, geNi3, hgTi3, InMg3, LaPb3, LaSn3, MnNi3, MnPt3, Mn3Pt, NaPb3, Ni3Pt, PbPd3, PbPt3, Pt3Sn, Pt3Ti, Pt3Zn, TiZn3
B2 FeAl Body-centered cubic AgCd, AgCe, AgLa, AgLi, AgMg, AlCo, AlCu2Zn, AuCd, AuMg, AuMn, AuZn, BeCo, BeCu, BeNi, CdCe, Cehg, CeMg, CeZn, CoFe, CoTi, CsCl, CuPd, CuZn, CuZn3, FeAl, FeTi, hgLi2Tl, hgMn, InNi, LaMg, LiPb, LiTl, MgPr, MgSr, MgTl, MnPt, NiAl, NiTi, ruTa, TiZn
D03 Fe3Al Simple cubic BiLi3, CeMg3, Cu3Sb, Fe3Al, Fe3Si, Mg3Pr
Source: ref 9.2 as published in ref 9.3
Fig. 9.5 Schematic representation of (a) a disordered solution and (b) an ordered structure with an antiphase boundary (apB) (dashed line) located where the atomic sequence is out of step.
Source: ref 9.3
5342_ch09_6111.indd 175 3/2/12 12:26:19 PM
176 / Phase Diagrams—Understanding the Basics
was established to quantify the degree of long-range order within a crystal. For binary alloys (alloy A-B), if A atoms occupy the α sublattice, and B atoms occupy the β sublattice:
S f ff
A A
A
= −−
( )α1
where fA is the fraction of all A atoms in the alloy, and fA(α) is the fraction of A atoms that lie on the α sublattice. The term fA(α) can also be described as the probability that an A atom occupies an α site. It can be seen from this equation that the degree of long-range order can be quantified, where a completely disordered solution is present when S = 0, and a perfectly ordered structure is present when S = 1.
Long-range order is used to describe the degree of ordering throughout an entire crystal. There is also a degree of ordering, known as short-range ordering, that is associated with a single atom and its nearest neighbors. In a crystal lattice, each atom has first- and second-order nearest neighbors. In an A-B alloy with a random arrangement of atoms (disordered solu-tion), each A atom should have an average number of B nearest neighbors. In an ordered structure, the number of B nearest neighbors surrounding the A atom should increase. The amount of segregation of B atoms around a single A atom is considered the degree of short-range ordering, σ. The degree of short-range order can be described quantitatively as:
σ = −−
q qq q
r
m r
where q is the total number of A-B pairs, qr is the average number of A-B pairs in a disordered solution (randomly arranged), and qm is the maximum number of A-B pairs that are possible. As was the case with the long-range order parameter, when the degree of short-range order is 0 (σ = 0), a disor-dered alloy is present, and when σ = 1, the alloy is completely ordered.
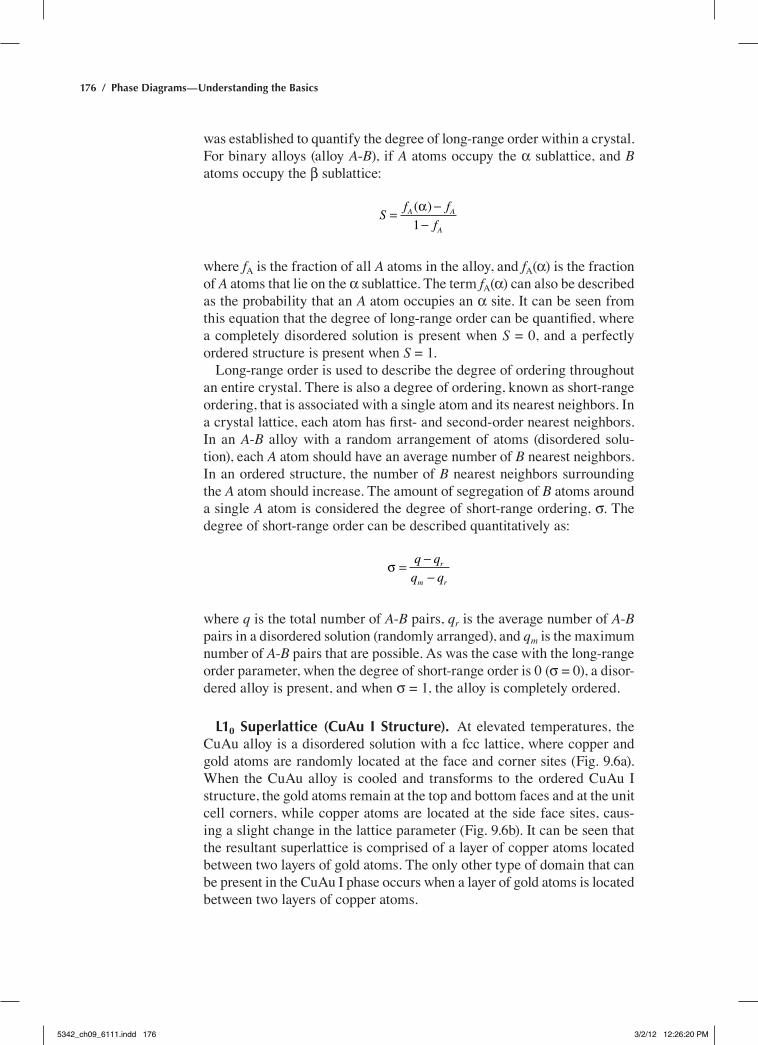
L10 Superlattice (CuAu I Structure). At elevated temperatures, the CuAu alloy is a disordered solution with a fcc lattice, where copper and gold atoms are randomly located at the face and corner sites (Fig. 9.6a). When the CuAu alloy is cooled and transforms to the ordered CuAu I structure, the gold atoms remain at the top and bottom faces and at the unit cell corners, while copper atoms are located at the side face sites, caus-ing a slight change in the lattice parameter (Fig. 9.6b). It can be seen that the resultant superlattice is comprised of a layer of copper atoms located between two layers of gold atoms. The only other type of domain that can be present in the CuAu I phase occurs when a layer of gold atoms is located between two layers of copper atoms.
5342_ch09_6111.indd 176 3/2/12 12:26:20 PM
Chapter 9: Intermediate Phases / 177
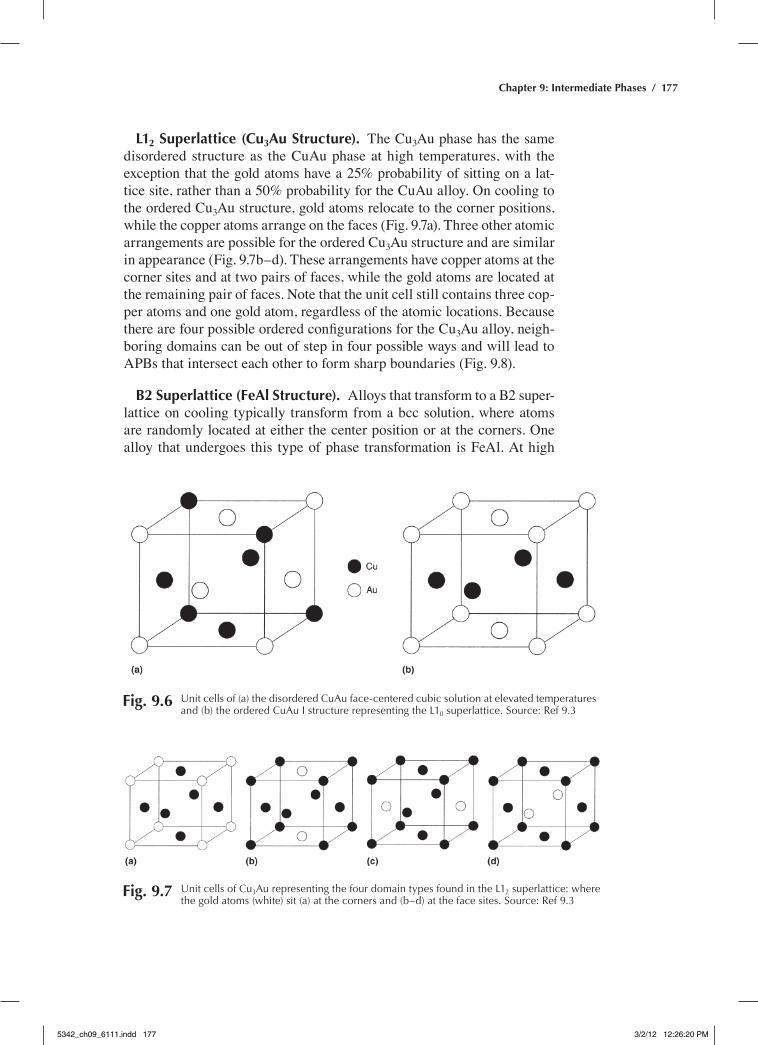
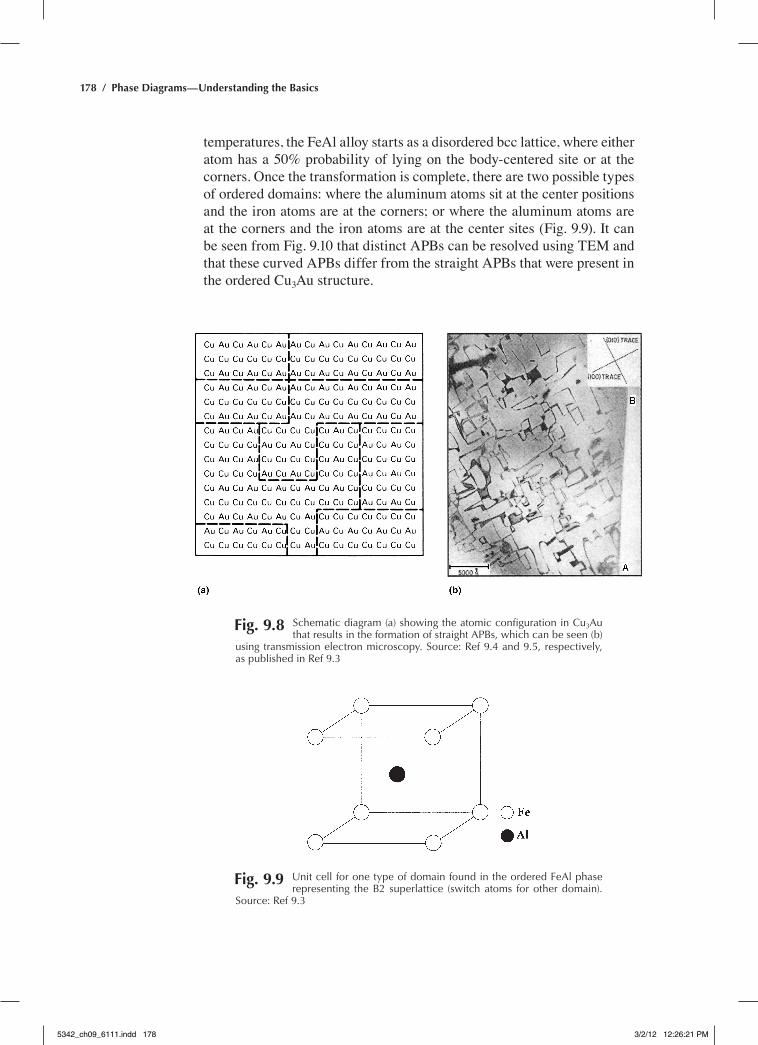
L12 Superlattice (Cu3Au Structure). The Cu3Au phase has the same disordered structure as the CuAu phase at high temperatures, with the exception that the gold atoms have a 25% probability of sitting on a lat-tice site, rather than a 50% probability for the CuAu alloy. On cooling to the ordered Cu3Au structure, gold atoms relocate to the corner positions, while the copper atoms arrange on the faces (Fig. 9.7a). Three other atomic arrangements are possible for the ordered Cu3Au structure and are similar in appearance (Fig. 9.7b–d). These arrangements have copper atoms at the corner sites and at two pairs of faces, while the gold atoms are located at the remaining pair of faces. Note that the unit cell still contains three cop-per atoms and one gold atom, regardless of the atomic locations. Because there are four possible ordered configurations for the Cu3Au alloy, neigh-boring domains can be out of step in four possible ways and will lead to APBs that intersect each other to form sharp boundaries (Fig. 9.8).
B2 Superlattice (FeAl Structure). Alloys that transform to a B2 super-lattice on cooling typically transform from a bcc solution, where atoms are randomly located at either the center position or at the corners. One alloy that undergoes this type of phase transformation is FeAl. At high
Fig. 9.6 Unit cells of (a) the disordered Cuau face-centered cubic solution at elevated temperatures and (b) the ordered Cuau I structure representing the L10 superlattice. Source: ref 9.3
Fig. 9.7 Unit cells of Cu3au representing the four domain types found in the L12 superlattice: where the gold atoms (white) sit (a) at the corners and (b–d) at the face sites. Source: ref 9.3
5342_ch09_6111.indd 177 3/2/12 12:26:20 PM
178 / Phase Diagrams—Understanding the Basics
temperatures, the FeAl alloy starts as a disordered bcc lattice, where either atom has a 50% probability of lying on the body-centered site or at the corners. Once the transformation is complete, there are two possible types of ordered domains: where the aluminum atoms sit at the center positions and the iron atoms are at the corners; or where the aluminum atoms are at the corners and the iron atoms are at the center sites (Fig. 9.9). It can be seen from Fig. 9.10 that distinct APBs can be resolved using TeM and that these curved APBs differ from the straight APBs that were present in the ordered Cu3Au structure.
Fig. 9.8 Schematic diagram (a) showing the atomic configuration in Cu3au that results in the formation of straight apBs, which can be seen (b)
using transmission electron microscopy. Source: ref 9.4 and 9.5, respectively, as published in ref 9.3
Fig. 9.9 Unit cell for one type of domain found in the ordered Feal phase representing the B2 superlattice (switch atoms for other domain).
Source: ref 9.3
5342_ch09_6111.indd 178 3/2/12 12:26:21 PM
Chapter 9: Intermediate Phases / 179
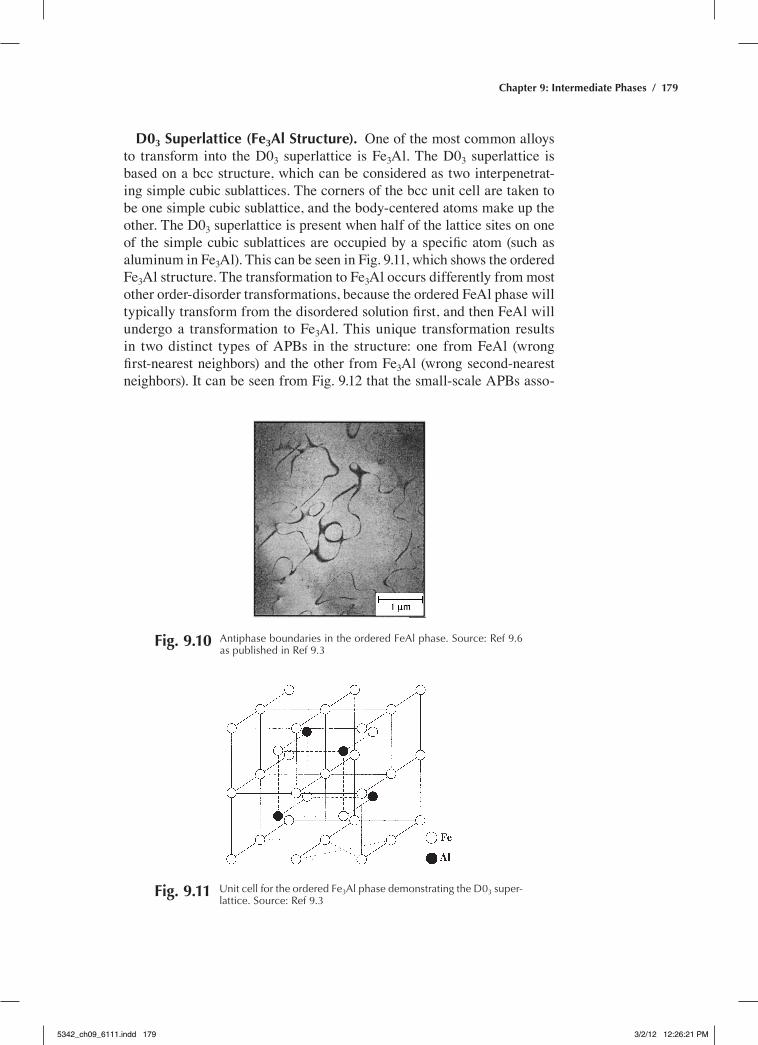
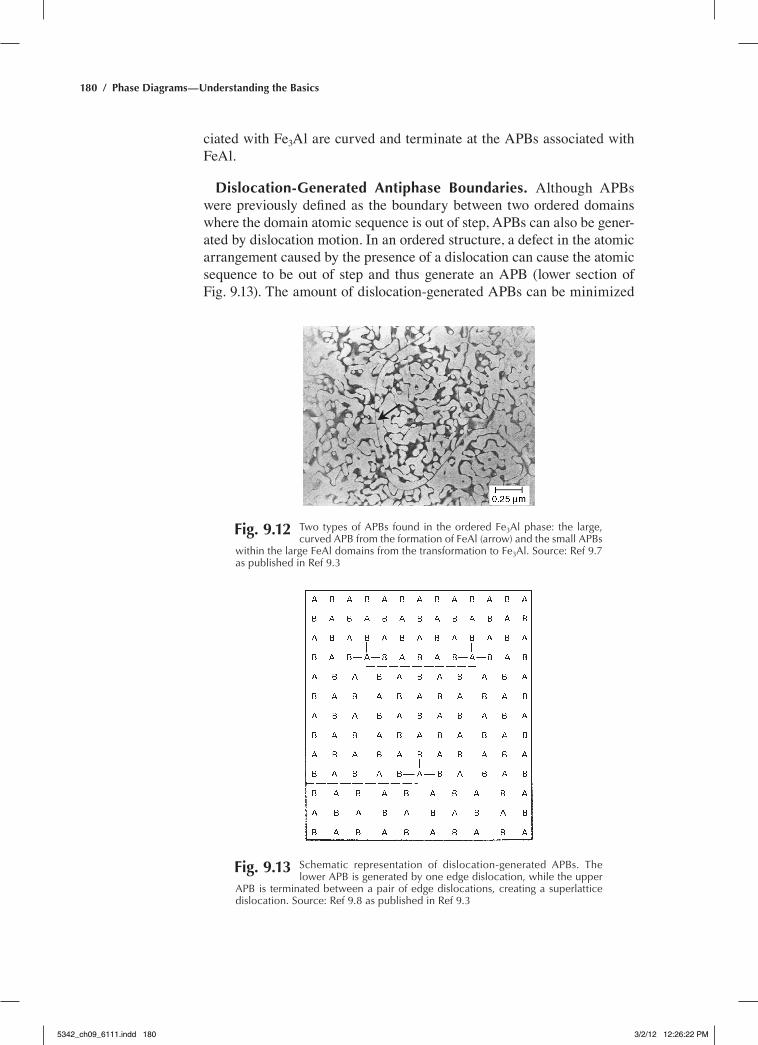
D03 Superlattice (Fe3Al Structure). One of the most common alloys to transform into the D03 superlattice is Fe3Al. The D03 superlattice is based on a bcc structure, which can be considered as two interpenetrat-ing simple cubic sublattices. The corners of the bcc unit cell are taken to be one simple cubic sublattice, and the body-centered atoms make up the other. The D03 superlattice is present when half of the lattice sites on one of the simple cubic sublattices are occupied by a specific atom (such as aluminum in Fe3Al). This can be seen in Fig. 9.11, which shows the ordered Fe3Al structure. The transformation to Fe3Al occurs differently from most other order-disorder transformations, because the ordered FeAl phase will typically transform from the disordered solution first, and then FeAl will undergo a transformation to Fe3Al. This unique transformation results in two distinct types of APBs in the structure: one from FeAl (wrong first-nearest neighbors) and the other from Fe3Al (wrong second-nearest neighbors). It can be seen from Fig. 9.12 that the small-scale APBs asso-
Fig. 9.10 antiphase boundaries in the ordered Feal phase. Source: ref 9.6 as published in ref 9.3
Fig. 9.11 Unit cell for the ordered Fe3al phase demonstrating the D03 super-lattice. Source: ref 9.3
5342_ch09_6111.indd 179 3/2/12 12:26:21 PM
180 / Phase Diagrams—Understanding the Basics
ciated with Fe3Al are curved and terminate at the APBs associated with FeAl.
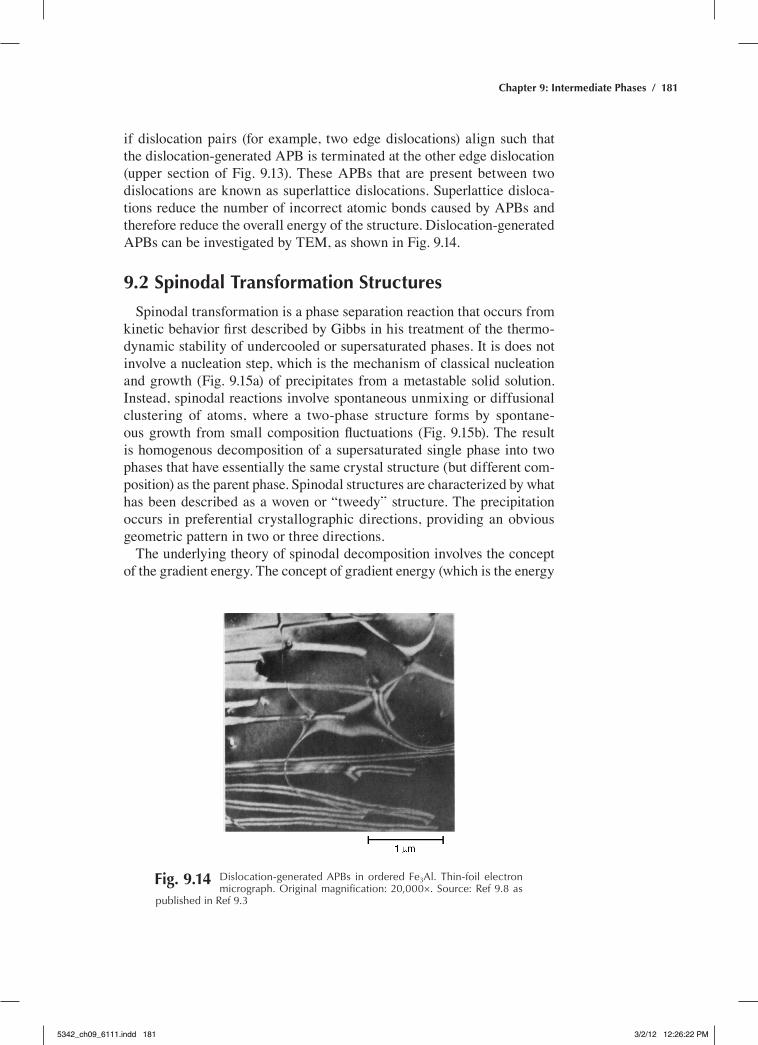
Dislocation-Generated Antiphase Boundaries. Although APBs were previously defined as the boundary between two ordered domains where the domain atomic sequence is out of step, APBs can also be gener-ated by dislocation motion. In an ordered structure, a defect in the atomic arrangement caused by the presence of a dislocation can cause the atomic sequence to be out of step and thus generate an APB (lower section of Fig. 9.13). The amount of dislocation-generated APBs can be minimized
Fig. 9.12 two types of apBs found in the ordered Fe3al phase: the large, curved apB from the formation of Feal (arrow) and the small apBs
within the large Feal domains from the transformation to Fe3al. Source: ref 9.7 as published in ref 9.3
Fig. 9.13 Schematic representation of dislocation-generated apBs. the lower apB is generated by one edge dislocation, while the upper
apB is terminated between a pair of edge dislocations, creating a superlattice dislocation. Source: ref 9.8 as published in ref 9.3
5342_ch09_6111.indd 180 3/2/12 12:26:22 PM
Chapter 9: Intermediate Phases / 181
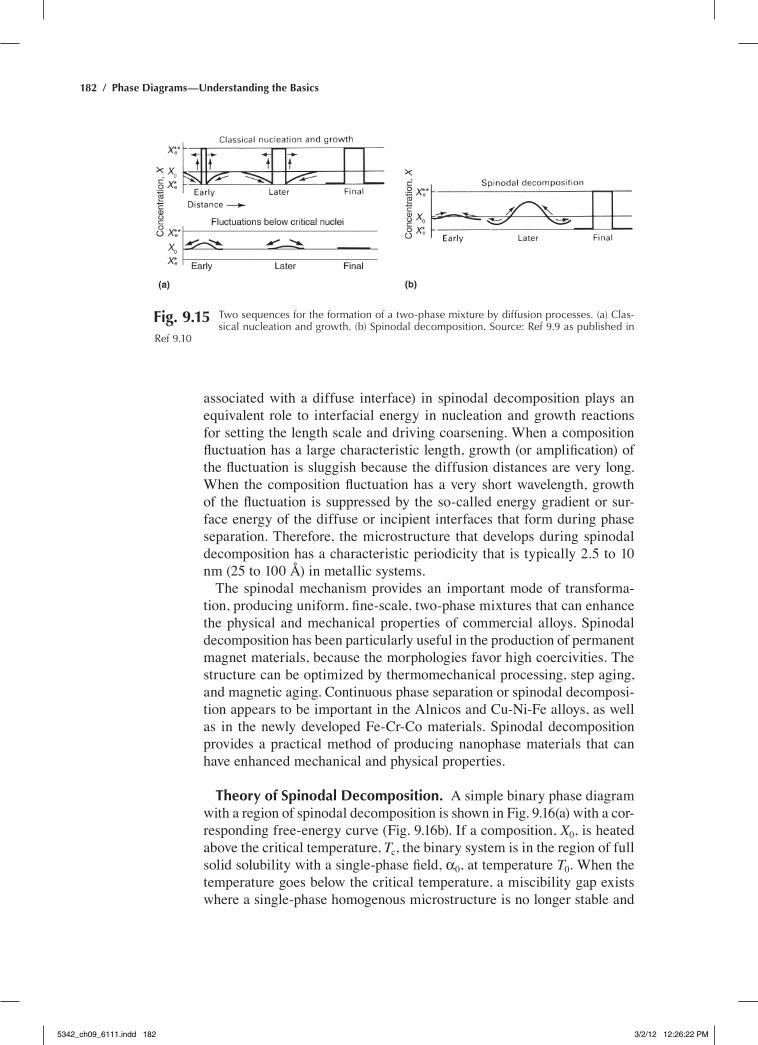
if dislocation pairs (for example, two edge dislocations) align such that the dislocation-generated APB is terminated at the other edge dislocation (upper section of Fig. 9.13). These APBs that are present between two dislocations are known as superlattice dislocations. Superlattice disloca-tions reduce the number of incorrect atomic bonds caused by APBs and therefore reduce the overall energy of the structure. Dislocation-generated APBs can be investigated by TeM, as shown in Fig. 9.14.
9.2 Spinodal Transformation Structures
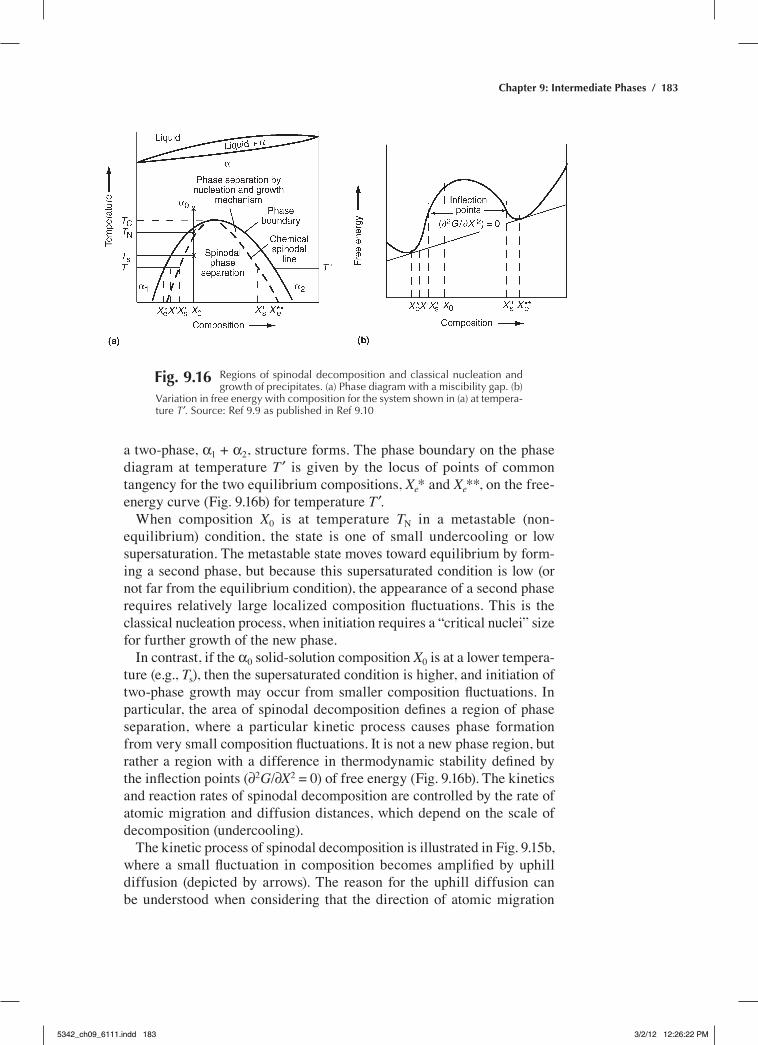
Spinodal transformation is a phase separation reaction that occurs from kinetic behavior first described by Gibbs in his treatment of the thermo-dynamic stability of undercooled or supersaturated phases. It is does not involve a nucleation step, which is the mechanism of classical nucleation and growth (Fig. 9.15a) of precipitates from a metastable solid solution. Instead, spinodal reactions involve spontaneous unmixing or diffusional clustering of atoms, where a two-phase structure forms by spontane-ous growth from small composition fluctuations (Fig. 9.15b). The result is homogenous decomposition of a supersaturated single phase into two phases that have essentially the same crystal structure (but different com-position) as the parent phase. Spinodal structures are characterized by what has been described as a woven or “tweedy” structure. The precipitation occurs in preferential crystallographic directions, providing an obvious geometric pattern in two or three directions.
The underlying theory of spinodal decomposition involves the concept of the gradient energy. The concept of gradient energy (which is the energy
Fig. 9.14 Dislocation-generated apBs in ordered Fe3al. thin-foil electron micrograph. Original magnification: 20,000×. Source: ref 9.8 as
published in ref 9.3
5342_ch09_6111.indd 181 3/2/12 12:26:22 PM
182 / Phase Diagrams—Understanding the Basics
associated with a diffuse interface) in spinodal decomposition plays an equivalent role to interfacial energy in nucleation and growth reactions for setting the length scale and driving coarsening. When a composition fluctuation has a large characteristic length, growth (or amplification) of the fluctuation is sluggish because the diffusion distances are very long. When the composition fluctuation has a very short wavelength, growth of the fluctuation is suppressed by the so-called energy gradient or sur-face energy of the diffuse or incipient interfaces that form during phase separation. Therefore, the microstructure that develops during spinodal decomposition has a characteristic periodicity that is typically 2.5 to 10 nm (25 to 100 Å) in metallic systems.
The spinodal mechanism provides an important mode of transforma-tion, producing uniform, fine-scale, two-phase mixtures that can enhance the physical and mechanical properties of commercial alloys. Spinodal decomposition has been particularly useful in the production of permanent magnet materials, because the morphologies favor high coercivities. The structure can be optimized by thermomechanical processing, step aging, and magnetic aging. Continuous phase separation or spinodal decomposi-tion appears to be important in the Alnicos and Cu-Ni-Fe alloys, as well as in the newly developed Fe-Cr-Co materials. Spinodal decomposition provides a practical method of producing nanophase materials that can have enhanced mechanical and physical properties.
Theory of Spinodal Decomposition. A simple binary phase diagram with a region of spinodal decomposition is shown in Fig. 9.16(a) with a cor-responding free-energy curve (Fig. 9.16b). If a composition, X0, is heated above the critical temperature, Tc, the binary system is in the region of full solid solubility with a single-phase field, α0, at temperature T0. When the temperature goes below the critical temperature, a miscibility gap exists where a single-phase homogenous microstructure is no longer stable and
Fig. 9.15 two sequences for the formation of a two-phase mixture by diffusion processes. (a) Clas-sical nucleation and growth. (b) Spinodal decomposition. Source: ref 9.9 as published in
ref 9.10
5342_ch09_6111.indd 182 3/2/12 12:26:22 PM
Chapter 9: Intermediate Phases / 183
a two-phase, α1 + α2, structure forms. The phase boundary on the phase diagram at temperature T ′ is given by the locus of points of common tangency for the two equilibrium compositions, Xe* and Xe**, on the free-energy curve (Fig. 9.16b) for temperature T ′.
When composition X0 is at temperature TN in a metastable (non-equilibrium) condition, the state is one of small undercooling or low supersaturation. The metastable state moves toward equilibrium by form-ing a second phase, but because this supersaturated condition is low (or not far from the equilibrium condition), the appearance of a second phase requires relatively large localized composition fluctuations. This is the classical nucleation process, when initiation requires a “critical nuclei” size for further growth of the new phase.
In contrast, if the α0 solid-solution composition X0 is at a lower tempera-ture (e.g., Ts), then the supersaturated condition is higher, and initiation of two-phase growth may occur from smaller composition fluctuations. In particular, the area of spinodal decomposition defines a region of phase separation, where a particular kinetic process causes phase formation from very small composition fluctuations. It is not a new phase region, but rather a region with a difference in thermodynamic stability defined by the inflection points (∂2G/∂X2 = 0) of free energy (Fig. 9.16b). The kinetics and reaction rates of spinodal decomposition are controlled by the rate of atomic migration and diffusion distances, which depend on the scale of decomposition (undercooling).
The kinetic process of spinodal decomposition is illustrated in Fig. 9.15b, where a small fluctuation in composition becomes amplified by uphill diffusion (depicted by arrows). The reason for the uphill diffusion can be understood when considering that the direction of atomic migration
Fig. 9.16 regions of spinodal decomposition and classical nucleation and growth of precipitates. (a) phase diagram with a miscibility gap. (b)
Variation in free energy with composition for the system shown in (a) at tempera-ture T′. Source: ref 9.9 as published in ref 9.10
5342_ch09_6111.indd 183 3/2/12 12:26:22 PM
184 / Phase Diagrams—Understanding the Basics
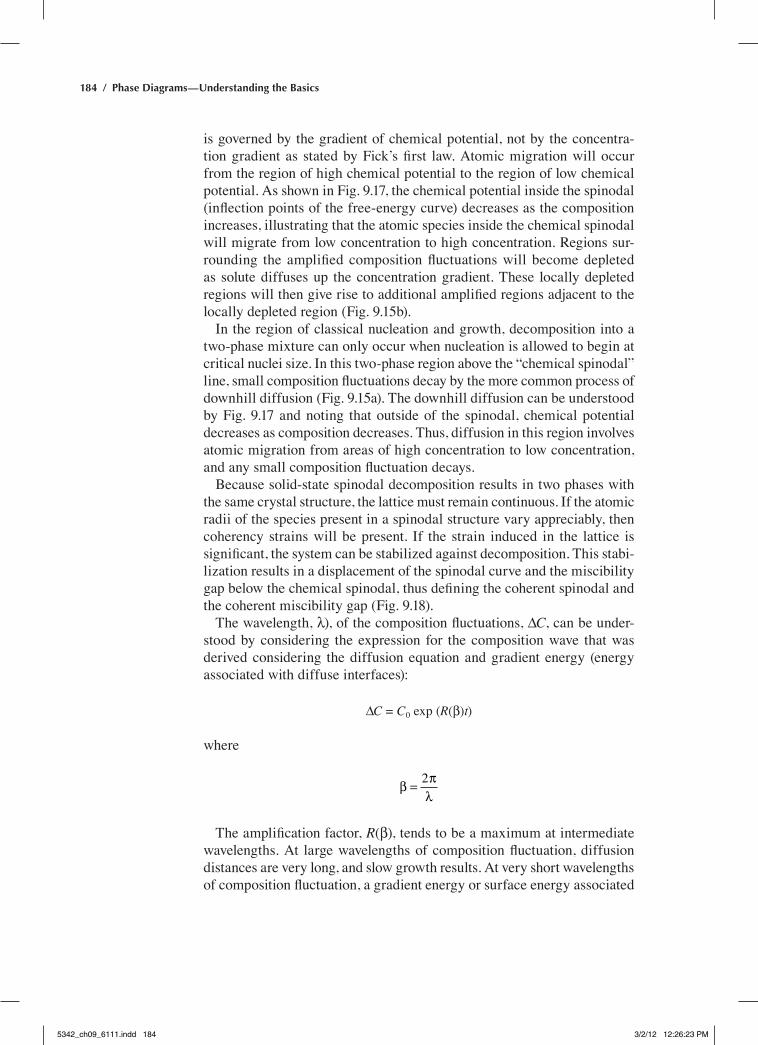
is governed by the gradient of chemical potential, not by the concentra-tion gradient as stated by Fick’s first law. Atomic migration will occur from the region of high chemical potential to the region of low chemical potential. As shown in Fig. 9.17, the chemical potential inside the spinodal (inflection points of the free-energy curve) decreases as the composition increases, illustrating that the atomic species inside the chemical spinodal will migrate from low concentration to high concentration. regions sur-rounding the amplified composition fluctuations will become depleted as solute diffuses up the concentration gradient. These locally depleted regions will then give rise to additional amplified regions adjacent to the locally depleted region (Fig. 9.15b).
In the region of classical nucleation and growth, decomposition into a two-phase mixture can only occur when nucleation is allowed to begin at critical nuclei size. In this two-phase region above the “chemical spinodal” line, small composition fluctuations decay by the more common process of downhill diffusion (Fig. 9.15a). The downhill diffusion can be understood by Fig. 9.17 and noting that outside of the spinodal, chemical potential decreases as composition decreases. Thus, diffusion in this region involves atomic migration from areas of high concentration to low concentration, and any small composition fluctuation decays.
Because solid-state spinodal decomposition results in two phases with the same crystal structure, the lattice must remain continuous. If the atomic radii of the species present in a spinodal structure vary appreciably, then coherency strains will be present. If the strain induced in the lattice is significant, the system can be stabilized against decomposition. This stabi-lization results in a displacement of the spinodal curve and the miscibility gap below the chemical spinodal, thus defining the coherent spinodal and the coherent miscibility gap (Fig. 9.18).
The wavelength, λ), of the composition fluctuations, DC, can be under-stood by considering the expression for the composition wave that was derived considering the diffusion equation and gradient energy (energy associated with diffuse interfaces):
DC = C0 exp (R(β)t)
where
β πλ
= 2
The amplification factor, R(β), tends to be a maximum at intermediate wavelengths. At large wavelengths of composition fluctuation, diffusion distances are very long, and slow growth results. At very short wavelengths of composition fluctuation, a gradient energy or surface energy associated
5342_ch09_6111.indd 184 3/2/12 12:26:23 PM
Chapter 9: Intermediate Phases / 185
with diffuse interfaces will dominate and suppress the amplification of the composition variation.
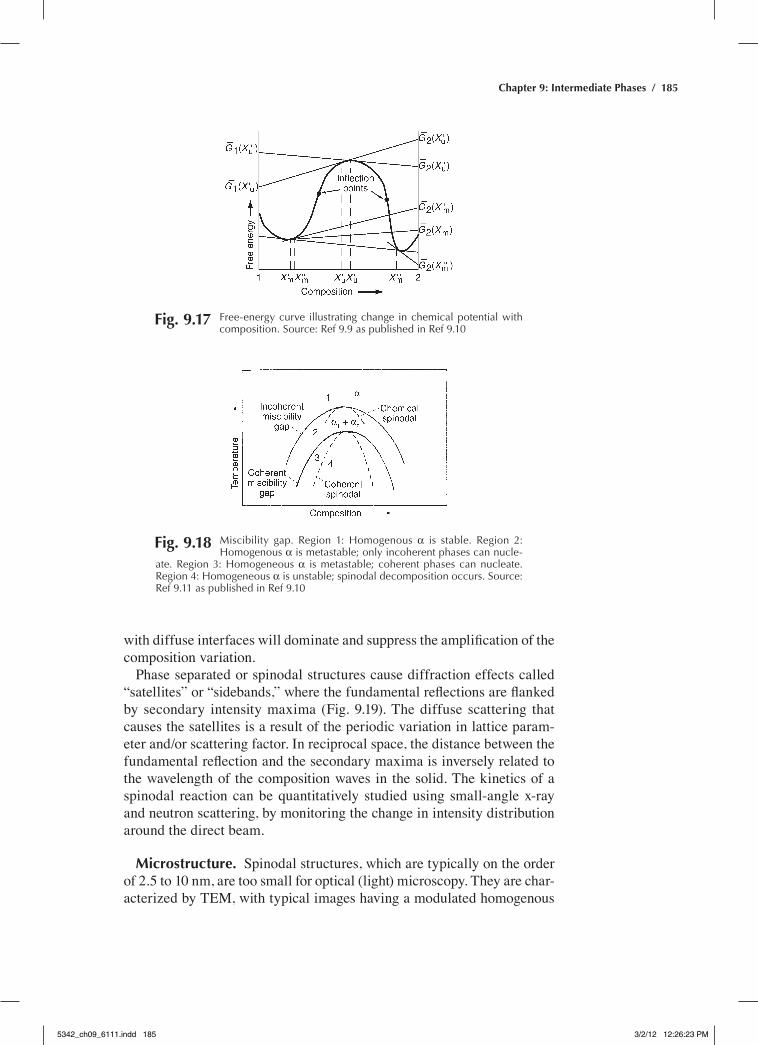
Phase separated or spinodal structures cause diffraction effects called “satellites” or “sidebands,” where the fundamental reflections are flanked by secondary intensity maxima (Fig. 9.19). The diffuse scattering that causes the satellites is a result of the periodic variation in lattice param-eter and/or scattering factor. In reciprocal space, the distance between the fundamental reflection and the secondary maxima is inversely related to the wavelength of the composition waves in the solid. The kinetics of a spinodal reaction can be quantitatively studied using small-angle x-ray and neutron scattering, by monitoring the change in intensity distribution around the direct beam.
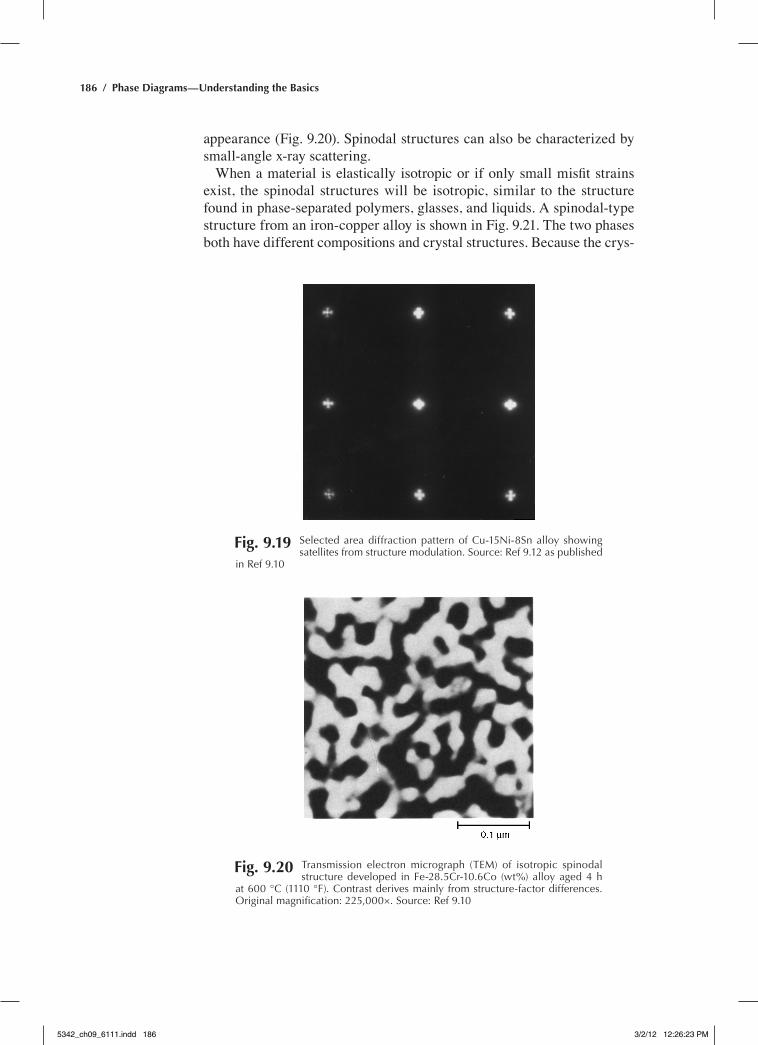
Microstructure. Spinodal structures, which are typically on the order of 2.5 to 10 nm, are too small for optical (light) microscopy. They are char-acterized by TeM, with typical images having a modulated homogenous
Fig. 9.17 Free-energy curve illustrating change in chemical potential with composition. Source: ref 9.9 as published in ref 9.10
Fig. 9.18 Miscibility gap. region 1: homogenous α is stable. region 2: homogenous α is metastable; only incoherent phases can nucle-
ate. region 3: homogeneous α is metastable; coherent phases can nucleate. region 4: homogeneous α is unstable; spinodal decomposition occurs. Source: ref 9.11 as published in ref 9.10
5342_ch09_6111.indd 185 3/2/12 12:26:23 PM
186 / Phase Diagrams—Understanding the Basics
appearance (Fig. 9.20). Spinodal structures can also be characterized by small-angle x-ray scattering.
When a material is elastically isotropic or if only small misfit strains exist, the spinodal structures will be isotropic, similar to the structure found in phase-separated polymers, glasses, and liquids. A spinodal-type structure from an iron-copper alloy is shown in Fig. 9.21. The two phases both have different compositions and crystal structures. Because the crys-
Fig. 9.19 Selected area diffraction pattern of Cu-15Ni-8Sn alloy showing satellites from structure modulation. Source: ref 9.12 as published
in ref 9.10
Fig. 9.20 transmission electron micrograph (teM) of isotropic spinodal structure developed in Fe-28.5Cr-10.6Co (wt%) alloy aged 4 h
at 600 °C (1110 °F). Contrast derives mainly from structure-factor differences. Original magnification: 225,000×. Source: ref 9.10
5342_ch09_6111.indd 186 3/2/12 12:26:23 PM
Chapter 9: Intermediate Phases / 187
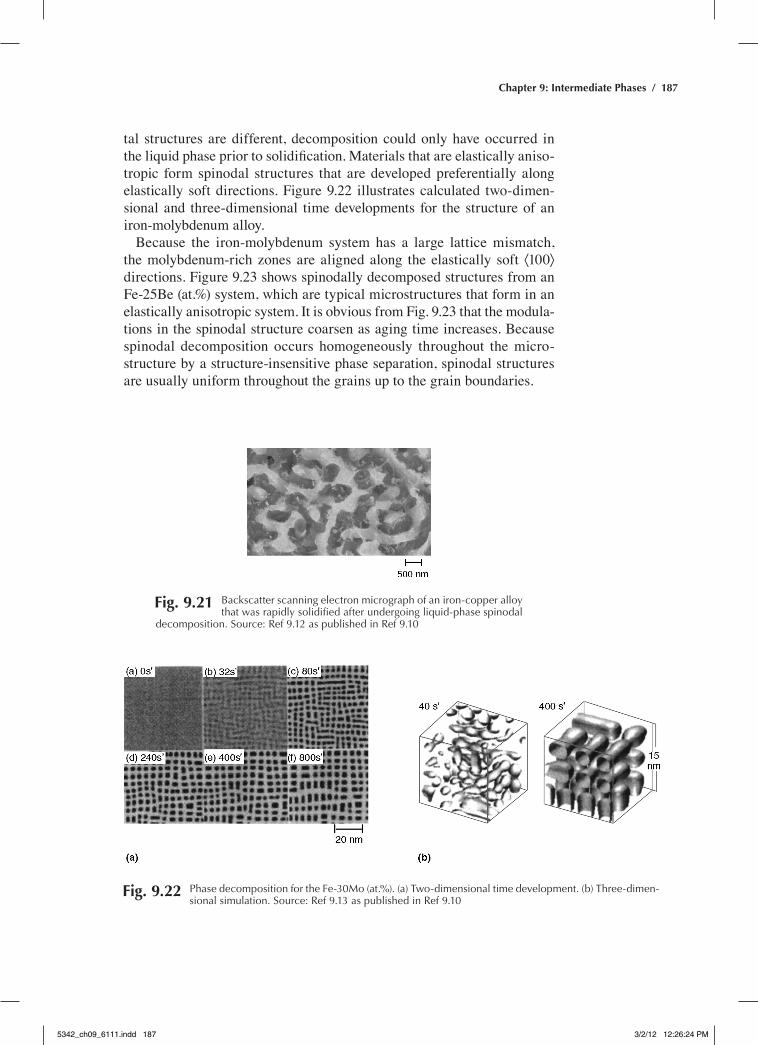
tal structures are different, decomposition could only have occurred in the liquid phase prior to solidification. Materials that are elastically aniso-tropic form spinodal structures that are developed preferentially along elastically soft directions. Figure 9.22 illustrates calculated two-dimen-sional and three-dimensional time developments for the structure of an iron-molybdenum alloy.
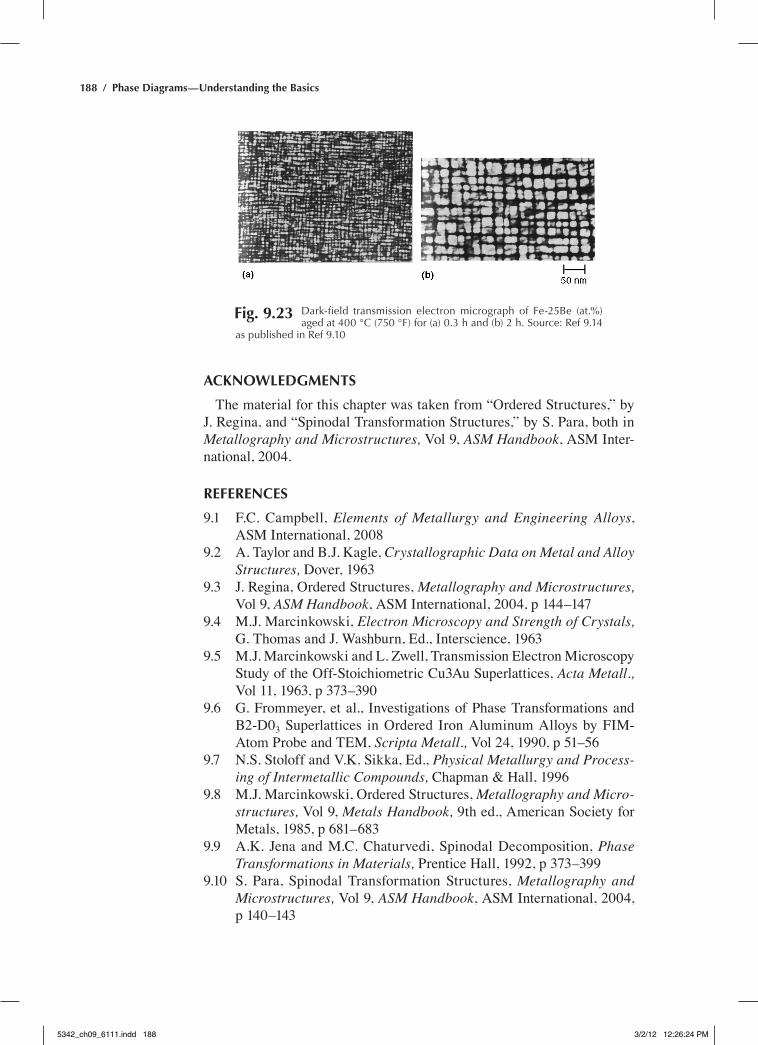
Because the iron-molybdenum system has a large lattice mismatch, the molybdenum-rich zones are aligned along the elastically soft ·100Ò directions. Figure 9.23 shows spinodally decomposed structures from an Fe-25Be (at.%) system, which are typical microstructures that form in an elastically anisotropic system. It is obvious from Fig. 9.23 that the modula-tions in the spinodal structure coarsen as aging time increases. Because spinodal decomposition occurs homogeneously throughout the micro-structure by a structure-insensitive phase separation, spinodal structures are usually uniform throughout the grains up to the grain boundaries.
Fig. 9.21 Backscatter scanning electron micrograph of an iron-copper alloy that was rapidly solidified after undergoing liquid-phase spinodal
decomposition. Source: ref 9.12 as published in ref 9.10
Fig. 9.22 phase decomposition for the Fe-30Mo (at.%). (a) two-dimensional time development. (b) three-dimen-sional simulation. Source: ref 9.13 as published in ref 9.10
5342_ch09_6111.indd 187 3/2/12 12:26:24 PM
188 / Phase Diagrams—Understanding the Basics
ACKNOWLEDGMENTS
The material for this chapter was taken from “Ordered Structures,” by J. regina, and “Spinodal Transformation Structures,” by S. Para, both in Metallography and Microstructures, Vol 9, ASM Handbook, ASM Inter-national, 2004.
REFERENCES
9.1 F.C. Campbell, Elements of Metallurgy and Engineering Alloys, ASM International, 2008
9.2 A. Taylor and B.J. Kagle, Crystallographic Data on Metal and Alloy Structures, Dover, 1963
9.3 J. regina, Ordered Structures, Metallography and Microstructures, Vol 9, ASM Handbook, ASM International, 2004, p 144–147
9.4 M.J. Marcinkowski, Electron Microscopy and Strength of Crystals, g. Thomas and J. Washburn, ed., Interscience, 1963
9.5 M.J. Marcinkowski and L. Zwell, Transmission electron Microscopy Study of the Off-Stoichiometric Cu3Au Superlattices, Acta Metall., Vol 11, 1963, p 373–390
9.6 g. Frommeyer, et al., Investigations of Phase Transformations and B2-D03 Superlattices in Ordered Iron Aluminum Alloys by FIM-Atom Probe and TeM, Scripta Metall., Vol 24, 1990, p 51–56
9.7 N.S. Stoloff and V.K. Sikka, ed., Physical Metallurgy and Process-ing of Intermetallic Compounds, Chapman & hall, 1996
9.8 M.J. Marcinkowski, Ordered Structures, Metallography and Micro-structures, Vol 9, Metals Handbook, 9th ed., American Society for Metals, 1985, p 681–683
9.9 A.K. Jena and M.C. Chaturvedi, Spinodal Decomposition, Phase Transformations in Materials, Prentice hall, 1992, p 373–399
9.10 S. Para, Spinodal Transformation Structures, Metallography and Microstructures, Vol 9, ASM Handbook, ASM International, 2004, p 140–143
Fig. 9.23 Dark-field transmission electron micrograph of Fe-25Be (at.%) aged at 400 °C (750 °F) for (a) 0.3 h and (b) 2 h. Source: ref 9.14
as published in ref 9.10
5342_ch09_6111.indd 188 3/2/12 12:26:24 PM
Chapter 9: Intermediate Phases / 189
9.11 D.A. Porter and K.e. easterling, Phase Transformations in Metals and Alloys, 2nd ed., Chapman and hall, 1997
9.12 D.W. Zeng, C.S. Xie, and K.C. Yung, Mesostructured Composite Coatings on SAe 1045 Carbon Steel Synthesized in situ by Laser Surface Alloying, Mater. Lett., Vol 6, 2002, p 680–684
9.13 T. Miyazaki, T. Koyama, and T. Kozakai, Computer Simulations of the Phase Transformation in real Alloy Systems Based on the Phase Field Model, Mater. Sci. Eng., Vol A312, 2001, p 38–49
9.14 M.g. Burke and M.K. Miller, A Combined TeM/APFIM Approach to the Study of Phase Transformations: Phase Identification in the Fe-Be System, Ultramicroscopy, Vol 30 (No. 1–2), 1989, p 199–209
5342_ch09_6111.indd 189 3/2/12 12:26:24 PM

5342_ch09_6111.indd 190 3/2/12 12:26:24 PM