Embed Size (px)
Citation preview

Logistics Management Institute
Intermediate-Level Repair Cycle Management: Supply and
Maintenance Process Improvements
LG406RD1
iW* Ajsgawsd! tar publte sc£«%.
Larry Klapper Robert Jordan
William McGrath
DTIC QUALITY INSPECTED 4.
19970122102: LMI

June 1996
Intermediate-Level Repair Cycle Management: Supply and
Maintenance Process Improvements
LG406RD1
Larry Klapper Robert Jordan
William McGrath
Prepared pursuant to Department of Defense Contract MDA903-90-C-0006. The views expressed here are those of the Logistics Management Institute at the time of issue but not necessarily
those of the Department of Defense. Permission to quote or reproduce any part except for government purposes must be obtained from the Logistics Management Institute.
Logistics Management Institute 2000 Corporate Ridge
McLean, Virginia 22102-7805

LG406RD1/June 1996
LOGISTICS MANAGEMENT INSTITUTE
Intermediate-Level Repair Cycle Management: Supply and Maintenance Process Improvements
Executive Summary
Supply organizations that directly support personnel who maintain opera- tional weapon systems rely on Intermediate Level (I-Level) maintenance as the major source of resupply for both line replaceable unit and shop replaceable unit (LRU and SRU) reparable assemblies. The time that it takes to repair these items once they are removed from the weapon system (or next higher assembly) is called the I-Level repair cycle time (RCT).
The length of the I-Level RCT has the greatest influence on the inventory in- vestment at the retail level. The longer the RCT, the more serviceable assets the supply organization must stock in retail inventory so that, when an unservice- able is removed from a weapon system, a serviceable can be immediately issued. This procedure reduces weapon system downtime.
We estimate that the retail inventory investment to support the I-Level RCT pipeline exceeds $1.2 billion. Based upon our observations, we believe that I-Level RCT is longer than it should be. DoD policy does not allow includ- ing awaiting parts (AWP) time when measuring RCT because the probability of a similar delay occurring each time is low. When AWP is included, inventory re- quirements increase. Only the Air Force currently excludes AWP time when measuring I-Level RCT. Also, any waiting time that occurs during the RCT needlessly increases the time and increases inventory requirements. We ob- served many instances of unnecessary delay.
The Military Services can improve I-Level RCTs through a series of policy and procedural changes. We recommend that the logistics response time process action team adopt an intermediate repair process improvement program to do the following:
♦ Compute retail reparable item requirements based upon historical average RCTs that exclude AWP time and other delays of a one-time nature.
♦ Establish I-Level RCT performance standards and measure actual times against those standards.
♦ Minimize the length of time that reparable items wait to be moved from place to place. A significant contributor to lengthy awaiting maintenance times is the size of induction quantities. Quantities significantly in excess of
m

LG406RD1/June 1996
capacity should not be inducted because they needlessly lengthen repair cy- cle times.
♦ Ensure that parts removed and replaced at I-Level are stocked at the appro- priate level in the combined wholesale-retail supply system. Long procure- ment lead-times for nonstocked or out of stock parts can shut down repair production lines.
♦ Explore alternative financial models and incentives for I-Level operations. The present model encourages local repair even when the wholesale system has excess serviceable assets and causes unserviceable assets to be held at the I-Level for long periods of time which could adversely impact readiness.
Each day of I-Level RCT results in a DoD inventory investment of more than $180 million. A one day reduction in I-Level RCT would reduce retail require- ments by this amount.
The implementation of these recommendations will require the coordinated action of both supply and maintenance managers.
IV

Contents
Chapter 1. Introduction 1-1
Background 1-1
Study Objectives 1-2
Major Issues 1-2
Discussion 1-3
Can the I-Level Repair Cycle Time be Reduced? 1-3
Are the Services Correctly Measuring and Using I-Level RCT? 1-4
Is Adequate Management Information, including Performance Indicators, Available to Supply and Maintenance Activities? 1-5
Are the Interfaces between Retail Supply and Intermediate Maintenance Activities Conducive to a Responsive and Efficient Repair Process? 1-6
Are AWP Delays Minimal and Adequately Managed? 1-6
How Does Retail-Level Financing (DBOF versus O&M) Have an Impact on Operations and Investment? 1-7
How Does Maintenance Operations Financing (Labor and Materials) Affect Incentives To Repair at the I-Level or Turn-In and Requisition from the Wholesale System? 1-7
Summary Recommendations 1-8
Report Format 1-8
Chapter 2. I-Level RCT Policies and Requirements 2-1
Background 2-1
Policies 2-1
DoD Policies 2-1
Recommendation 2-2
Incorporate I-Level Repair Cycle Time Segment Names and Definitions into the DoD Materiel Management Regulation (DoD 4140.1R) 2-2
Recommendations 2-6

Contents (Continued)
Use Actual Historical Repair Cycle Time Data for the RCT Requirements Determination Process, but Exclude Extended Delays of a One-Time Nature for each Observed Time 2-6
Use RCT as a Factor for Safety-Level Computations 2-6
Current Repair Cycle Times and Requirements 2-7
Chapter 3. I-Level RCT Improvements 3-1
Information Systems and Performance Indicators 3-1
Discussion 3-1
Recommendations 3-3
Supply and Maintenance Interfaces 3-3
Discussion 3-3
Recommendations 3-4
Minimize Processing and Scheduling Times 3-4
Develop Reduction Goals Where Practical 3-5
Repair Parts Support to Maintenance 3-5
Discussion 3-5
Recommendation 3-7
Review Retail Stock Range and Depth Policies and Procedures 3-7
Chapter 4. Reparable Item Financial Practices 4-1
Funding of Levels 4-1
Funding of I-Level Maintenance Operations 4-2
Recommendations 4-4
Explore Alternative Financial Models and Incentives for Combined Depot and I-Level Operations 4-4
Appendix A. Army
Appendix B. Navy
Appendix C. Air Force
VI

Contents (Continued)
Appendix D. Marine Corps
Appendix E. Navy Regional Maintenance
Appendix F. Army Regional Maintenance
Appendix G. Glossary
Vll

Illustrations
1-1. Generalized Reparable Item Flow 1-1
1-2. I-Level Repair Cycle Time Segments 1-5
2-1. Navy AWP Data 2-6
2-2. Service I-Level File RCT 2-9
3-1. Average Repair Times Verus Total RCT for Army Regional Maintenance 3-4
3-2. Awaiting Maintenance Delays 3-5
3-3. Repair Time Versus Awaiting Parts Time Data 3-7
4-1. Service Financial Processes 4-2
4-2. Comparison of Repair Strategies 4-3
IX

Tables
1-1. Average RCT and Pipeline Costs 1-4
2-1. Service Policies 2-3
2-2. Service Repair Cycle Requirement Formulas 2-4
2-3. Navy Sample Awaiting Parts Statistics 2-5
2-4. Repair Cycle Times and Requirements 2-8
3-1. Service ADP Systems 3-2

CHAPTER 1
Introduction
BACKGROUND
Each of the Military Services owns and manages retail reparable item inven- tories to support its operating forces. Many of these retail inventories depend on Intermediate Level (I-Level) maintenance as their principal source for serviceable items. Ideally, each time an operational unit is issued a serviceable item from one of these inventories, the unit returns the unserviceable item to the I-Level maintenance activity for repair. Once repaired, the item is returned to the sup- ply shelf to meet a future demand. When the unit does not return an unservice- able item, or I-Level cannot or does not have the authority to repair or dispose of the item, the retail level requisitions an asset from the wholesale supply system. Figure 1-1 illustrates the general process for issuing and repairing reparable items.
Customer
Serviceable unit from Issue
supply request
Unserviceable unit
Retail inventory >-_=,
of |L_ll repairable
components
Serviceable 1348 unit
Stock replenishment
Unserviceable unit
Serviceable unit
or
Beyond the capability of maintenance (BCM)/not
repairable this station (NRTS) depot Level repairables only
Unserviceable unit
field level repairable only
JL
Wholesale supply system "BCM/NRTS- Wholesale
maintenance depot
Disposal
Figure 1-1. Generalized Reparable Item Flow
1-1

Under Department of Defense (DoD) policy,1 the I-Level repair cycle begins when an organization enters the initial demand for the replacement of an un- serviceable into a supply system and ends when the unserviceable asset is re- stored to serviceable condition and is recorded as such on supply records. The timing of the starting event varies by Service. It always occurs sometime after the failed item has been removed from the weapon system, but no later than when supply receives the unserviceable item. For example, at some Naval avia- tion facilities, the squadron mechanic orders a replacement unit "on line." The supply department then delivers a serviceable item and picks up the unservice- able item for transport to the maintenance facility.
The Services are authorized to stock a level of assets equal to the demands that are likely to occur during the repair cycle time (RCT). This level of assets is known as the retail repair-cycle requirement. The Services may also include the RCT in formulas used to compute a variable safety level and, therefore, establish confidence that backorders will not occur.
STUDY OBJECTIVES
This study has three objectives — quantify the present retail repair cycle re- quirement, describe I-Level repair processes and procedures for each service, and explore the following major issues.
MAJOR ISSUES
This study addresses the following issues:
♦ Can the I-Level repair cycle time be reduced?
♦ Will reducing RCT result in a smaller inventory investment?
♦ Will reduced cycle times also establish a more responsive repair operation and better readiness?
♦ Are the Services correctly measuring and using I-Level RCT?
♦ Is adequate management information, including performance indicators, available to supply and maintenance activities?
♦ Are the interfaces between retail supply and intermediate maintenance ac- tivities conducive to a responsive and efficient repair process?
♦ Are awaiting parts (AWP) delays minimal and adequately managed?
xDoD 4140.1-R, DoD Materiel Management Regulation, January 1993 (pp. 3-10).
1-2
♦ How does retail-level financing [Defense Business Operations Fund (DBOF) versus operations and maintenance (O&M)] have an impact on operations and investment?
♦ How does maintenance operations financing (labor and materials) have an impact on incentives to repair at the I-Level or turn-in and requisition from the wholesale system? This issue also addresses carcass turn-in credit poli- cies.
DISCUSSION
Can the I-Level Repair Cycle Time be Reduced?
Essentially, Services calculate RCT with two different methods. The first method uses the actual time that it takes, on the average, to repair an individual reparable item. This RCT includes all elapsed time from the initial demand for a replacement item until the failed item is repaired and placed back on the shelf. One Service uses a second method to compute retail requirements for spare repa- rable items. This RCT is usually less than the actual RCT because delays of a one-time nature, such as AWP time, are not included in requirements determina- tion computations.2 This "file" RCT must be reduced in order to reduce retail re- quirements. Simply reducing AWP time, according to policy, would not reduce file RCT but would improve responsiveness. On the other hand, reducing move and queue times would result in a reduction in file RCT.
According to our observations, I-Level RCT can be reduce (both file and ac- tual). Conforming to policy, using performance indicators, improving supply and maintenance interfaces, and reducing parts problems can contribute to low- ering both actual and file RCT.
Table 1-1 shows estimated repair cycle requirement times and pipeline costs by Service.3 The times for two of the Services are very low while the times for the other two are very high. We estimate that the total dollar value of the DoD retail repair cycle requirement is approximately $1.2 billion, and the average dollar-weighted repair cycle time is 6.6 days. At the DoD level, reducing the I-Level RCT requirement by one day equates to a $187 million reduced retail re- pair cycle requirement. Details concerning the methodologies used to estimate the RCT values for each service are included in the appendices.
2The policy in DoD 4140.1-R, DoD Materiel Management Regulation, January 1993 (pp. 3-10), excludes using AWP time in requirements determination. In reality, only one Service completely excludes AWP time. One Service is using a fixed parameter for com- puting requirements at a number of installations.
3 Naval ships are not included because currently they do not have I-Level repair of shipboard unserviceable components for return to retail reparable inventories.
1-3

Table 1-1. Average RCT and Pipeline Costs
Dollar-weighted average RCT in days
Value of one day of RCT requirements
(in millions)
Total RCT requirements (in millions)
Army 25.0 8 200
Navy (Air) 6.4 59 378
Air Force 5.0 119 595
Marines 60.8 1 61
DoD total 6.6 187 1,234
Since requirements determination formulas for both the repair cycle quan- tity and safety level use RCT as the key factor in the Service models,4 reducing these times will decrease requirements. The degree to which this reduction can occur varies widely by Service. The RCT times for two of the Services are con- siderably longer than the other two and have the most potential for reductions. Chapter 3 and the Service appendices provide more detail.
Are the Services Correctly Measuring and Using I-Level RCT?
Only the Air Force measures and uses RCT in accordance with DoD policy. AWP time and other one-time delays should be measured but not included in file RCT times. The Navy includes up to 20 days of AWP time. The Marine Corps includes all elapsed time but uses a 90-day cap. The Army uses a fixed parameter of 25 days for both order and shipping time (OST) and RCT at most installations. By eliminating AWP times, the Navy and Marine Corps can imme- diately reduce file times (and therefore requirements). For the Navy, we esti- mate a 45 percent requirements reduction, which would reduce requirements by over $170 million. We could not estimate Marine Corps savings because suffi- cient data were not available. In the case of the Army, eliminating AWP delays from measured actual times would still produce greater requirements than the 25-day parameter (an estimated 33 days, increasing Army requirements by ap- proximately $64 million); however, this formula would more accurately reflect true requirements. If other initiatives can reduce this duration below 25 days, the Army can achieve savings.
4 Appendices A through D discuss Service formulas and procedures for computing re- pair cycle and safety-level requirements.
1-4

Is Adequate Management Information, including Performance Indicators, Available to Supply and Maintenance Activities?
In order to minimize investment in reparable item inventories without jeop- ardizing readiness, the Services must accurately monitor and compute RCT and keep it as low as possible. Figure 1-2 shows the time segments associated with I-Level RCT. By measuring and tracking each individual segment of RCT, using actual historical repair cycle-time data to compute requirements, and excluding extended delays of a one-time nature such as AWP time, the Services can reduce overall repair cycle requirements. The times that should be measured and tracked are
♦ processing (supply to maintenance and maintenance to supply transit times),
♦ awaiting maintenance (time between receipt by maintenance and the begin- ning of actual repair),
♦ repair time, and
♦ AWP time and other logistics delays.
Remove failed unit
Receipt by
supply
Receipt by
maintenance
In repair
Logistics delay
In repair
Receipt by
supply
Posted to
records
Processing Awaiting
maintenance Repair
Awaiting parts other
delays
Repair Processing
RCT
Figure 1-2. I-Level Repair Cycle Time Segments
In most cases, the data needed to monitor performance are available but not routinely used to monitor overall system performance. In addition, times are not captured for all the segments in some Service systems. Performance should be monitored against some reasonable expectations. By establishing standards for each segment of RCT and measuring performance against these standards, RCTs can be reduced.
1-5

Are the Interfaces between Retail Supply and Intermediate Maintenance Activities Conducive to a Responsive and Efficient Repair Process?
To answer this question, we denned a "responsive and efficient repair proc- ess" as one that produces low average repair cycle times. We found that the an- swer to this question is generally yes for Service aviation operations; however, ground force operations need improvement.
Maintenance operations, such as the Service's aviation I-Level maintenance organizations, with tightly integrated supply and maintenance personnel were the most efficient. In such an organization, supply and maintenance personnel work together toward common goals to ensure that readiness at the organiza- tional level remains high while investments in inventory remain low. We did not observe this same level of coordination and integration at ground forces I-Level maintenance organizations.
We observed a tremendous amount of dedication at the facilities that we visited. However, as in any human enterprise, improvements can be made. If local installation supply and maintenance process action teams focus on the processing and scheduling functions, including transit times, improved RCT will result.
Are AWP Delays Minimal and Adequately Managed?
AWP seems to be the largest single problem contributing to long RCTs at the intermediate level. At the I-Level, a significant amount of time is spent expe- diting parts requirements. Algorithms used for range and depth computations for repair parts stocked locally should be reexamined. Delivery times for items that must be ordered from the wholesale system are generally reasonable if the items are in stock. Based on our sampling, wholesale backorders caused the ma- jority of the extended parts-related delays. Some of these backorders are cen- trally managed, low demand items that are not stocked. In other cases, the suppliers have had difficulties meeting required delivery dates. Some of the de- lays were traced to poor initial provisioning of new or modified weapon system components. Parts are not immediately available when required for a variety of other reasons. The retail supply activities and the inventory control points (ICPs) should work together to help reduce AWP problems.
1-6

How Does Retail-Level Financing (DBOF versus O&M) Have an Impact on Operations and Investment?
The method used to account for reparable assets in inventory ledgers (an end-use O&M account or a revolving stock fund account) has little impact on the way reparables are managed because
♦ Under both financial systems, the point of sale between wholesale and retail is essentially the same. No end-use O&M funds are obligated until an un- serviceable is declared beyond the capability of maintenance (BCM) to re- pair or not reparable this station (NRTS), and a replacement is ordered.
♦ Regardless of how the inventory is funded, the I-Level maintenance opera- tion is O&M funded. Under both funding scenarios, end-use O&M funds are only obligated when the unserviceable cannot be repaired locally.
♦ The repair process (the physical act of removing, repairing, and returning items to supply) is virtually the same no matter how the inventory is funded.
Central ownership of assets within a single fund does present advantages because the Services can redistribute assets geographically without processing bills and credits.
How Does Maintenance Operations Financing (Labor and Materials) Affect Incentives To Repair at the I-Level or Turn-In and Requisition from the Wholesale System?
The repair parts consumed during a local repair and civilian labor are the only expense to an O&M account because separate appropriations finance the military labor. The labor of the military workforce appears to be "free." For this reason, repairing locally usually appears to be an economic incentive. If, during the logistics support analysis phase of weapon system design, designers con- ducted a proper level-of-repair analysis, repair at the I-Level was authorized be- cause it was the most economical. If the level of repair analysis (LORA) was not thorough and it is not the most economical, the item should be reclassified as an item that must be repaired at a depot. However, when the wholesale supply sys- tem has excess serviceable assets, repairing locally is not economical from a total systems cost perspective. Even though it appears to the local commander to be the least costly, in reality, it is a suboptimal solution. Also, when serviceable as- sets are readily available from the wholesale system but the I-Level holds un- serviceable items for an extremely long time waiting for parts, local repair can cause support problems. If the true costs for holding and repairing locally were considered, the decision to hold the items would probably change.
Under the current financial structure, the decision whether to repair or re- turn is a local decision that balances available funds, readiness, and wholesale
1-7

stock availability. The DoD should explore alternative wholesale and retail fi- nancial policies (including DBOF pricing policy) and resulting incentives. Get- ting the most readiness for the least dollars from the combined depot and I-Level system should be the goal.
SUMMARY RECOMMENDATIONS
♦ Use actual historically based repair cycle times for the RCT requirements de- termination process.
♦ Exclude AWP.
♦ Exclude other delays of a one-time nature.
♦ Establish standards for RCT and measure against actual times.
♦ Minimize processing and awaiting maintenance times.
♦ Improve repair parts support.
♦ Explore alternative financial models and incentives for combined depot and I-Level operations.
REPORT FORMAT
Chapter 2 of this report discusses I-Level RCT policies, average times, and requirements. Chapter 3 includes a concise treatment of the issues addressed, the conclusions reached, and the recommendations made to improve I-Level re- pair cycle times within DoD. Chapter 4 addresses reparable item financial prac- tices. Appendices A, B, C, and D include a more detailed discussion of the Army, Navy, Air Force, and Marine Corps processes and systems. Appendix E and F describe the Navy and Army regional maintenance concepts and initia- tives.
1-8
CHAPTER 2
I-Level RCT Policies and Requirements
BACKGROUND
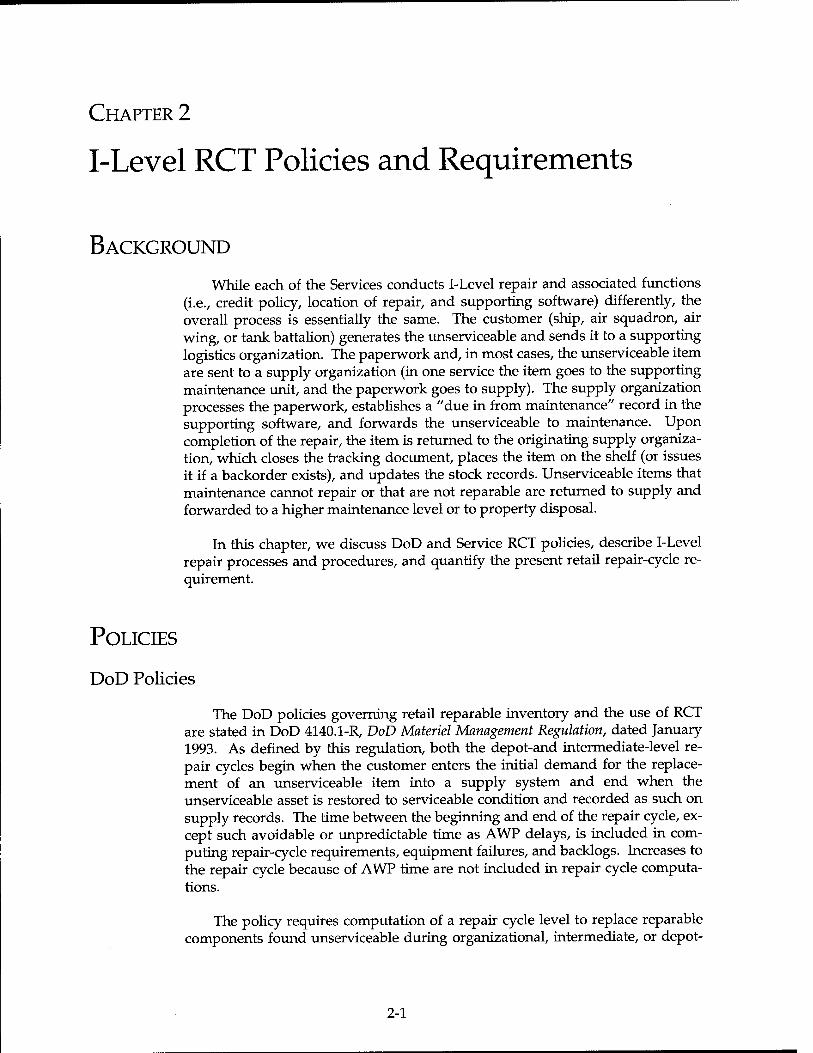
While each of the Services conducts I-Level repair and associated functions (i.e., credit policy, location of repair, and supporting software) differently, the overall process is essentially the same. The customer (ship, air squadron, air wing, or tank battalion) generates the unserviceable and sends it to a supporting logistics organization. The paperwork and, in most cases, the unserviceable item are sent to a supply organization (in one service the item goes to the supporting maintenance unit, and the paperwork goes to supply). The supply organization processes the paperwork, establishes a "due in from maintenance" record in the supporting software, and forwards the unserviceable to maintenance. Upon completion of the repair, the item is returned to the originating supply organiza- tion, which closes the tracking document, places the item on the shelf (or issues it if a backorder exists), and updates the stock records. Unserviceable items that maintenance cannot repair or that are not reparable are returned to supply and forwarded to a higher maintenance level or to property disposal.
In this chapter, we discuss DoD and Service RCT policies, describe I-Level repair processes and procedures, and quantify the present retail repair-cycle re- quirement.
POLICIES
DoD Policies
The DoD policies governing retail reparable inventory and the use of RCT are stated in DoD 4140.1-R, DoD Materiel Management Regulation, dated January 1993. As defined by this regulation, both the depot-and intermediate-level re- pair cycles begin when the customer enters the initial demand for the replace- ment of an unserviceable item into a supply system and end when the unserviceable asset is restored to serviceable condition and recorded as such on supply records. The time between the beginning and end of the repair cycle, ex- cept such avoidable or unpredictable time as AWP delays, is included in com- puting repair-cycle requirements, equipment failures, and backlogs. Increases to the repair cycle because of AWP time are not included in repair cycle computa- tions.
The policy requires computation of a repair cycle level to replace reparable components found unserviceable during organizational, intermediate, or depot-
2-1

level maintenance. In other words, if organizations have a local supply of serv- iceable components (rotatable pool) from which to draw at the same time they turn in a broken one and a local repair organization repairs the unserviceable components for return to the pool, then the pool quantity should roughly equal the number of demands that are expected over the time it takes to repair the item. If, for example, each day there is a demand for an engine and it typically takes five days to repair the engine, then the pool should have about five en- gines. In this case, a repaired engine arrives from maintenance just in time to meet the next demand. Since the repair time can vary, the policy also requires a safety level that includes RCT as a factor to protect against variability. Actual re- pair cycle times should be used to compute repair-cycle requirements. If actual RCTs are unavailable, organizations can substitute time from a comparable item or use standard times.
The DoD regulation does not address the individual segments that make up I-Level RCT. Based upon our review of the Services' systems, we suggest defin- ing the segments as follows:
♦ Processing (supply to maintenance and maintenance to supply transit times),
♦ Awaiting maintenance (time between receipt by maintenance and the begin- ning of actual repair),
♦ Repair time, and
♦ AWP time and other logistics delays.
With formal segment names and definitions defined, the Services can meas- ure their performance against their own goals.
Recommendation
INCORPORATE I-LEVEL REPAIR CYCLE TIME SEGMENT NAMES AND DEFINITIONS INTO THE DOD
MATERIEL MANAGEMENT REGULATION (DOD 4140.1R)
Table 2-1 summarizes RCT policies for each of the Services. The following two observations relate to the Services' compliance with present DoD policy:
♦ Technically, only the Air Force follows the policy that requires using actual times minus avoidable or unpredictable delay time, most importantly AWP time. The Marine Corps includes all times up to 90 days, the Navy uses a 20-day ceiling, and the Army uses a 25-day RCT1 constant for most of their authorized stockage list (ASL) levels.
^or ASLs maintained by the Standard Army Intermediate Level Supply (SAILS) Sys- tem and direct support unit standard supply (DS4) systems. The new Standard Army Retail Supply System (SARSS) uses actual RCT (including awaiting parts) instead of a 25-day constant.
2-2

♦ Three of the four Services use RCT as a factor in computing safety level. The Army safety level quantity is five days of supply based upon average wash- outs only.
Table 2-1. Service Policies
Policy Army Navy Air Force Marine Corps
Name of inventory using RCT for level setting
ASL AVCAL Base supply RIP
Who computes? Local ASO Local and ALC Local
Repair cycle time 25-days fixed for most ASLs
Actuals with 20 cap
Actuals with 4-day floor (critical) and 10-day ceiling (noncritical)
Actuals with 90-day cap
Factor in safety level
No Yes Yes Yes
Hold policy None 60-day review - local decision
None 60 - 120 days
Table 2-2 shows the formulas the Services use to compute retail reparable in- ventory repair cycle-level and safety-level requirements.
2-3

Table 2-2. Service Repair Cycle Requirement Formulas
Service - Army
Repair cycle quantity RCD=^^*RCT*1.25
Safety level Not a function of RCT
Legend RCT = repair cycle level AQRA = Average quantity repaired annually
Constraints (including awaiting parts) All RCT and OST fixed at 25 days for repairables.
Service - Navy
Repair cycle quantity „„^ (RPF)(TAT)(UPA)(NMC90) i^Kl- 90
Safety level Poison distribution function of RPQ to yield either 85 or 90% pro-
tection.
Legend RPQ = raw pool quantity RPF = l-Level repair over one maintenance cycle TAT = turn-around time UPA = units per application NMC90 = number of maintenance cycles in 90 days
Constraints (including awaiting parts) Individual observations restricted to: Removal to IMA (processing ) -1 day Scheduling time - 3 days Awaiting parts - 20 days Actual repair time - 8 days Total constrained time - 20 days
Service - Air Force
Repair cycle quantity
Safety level
RCQ=DDR*PBR*RCT
SLQ=c* 1/3*(RCQ+OSTQ+NCQ)
Legends RCQ = repair cycle quantity DDR = daily demand rate PBR = percent base repair SLQ = safety level quantity OSTQ = order and shipping time quantity NCQ = NRTS/condemned quantity
Constraints (including awaiting parts) Constrains are placed on the average as follows: For critical items, 4 days or greater used. For noncritical, 10 or less days is used. Awaiting parts time is included but tracked separately.
Service - Marine Corps
Repair cycle quantity RCR-RR*RCT
Safety level Poison distribution function of both the repair cycle quantity and the OST quantity to yield 90% protection.
Legends RCR = repair cycle requirement RR = repair rate (per month)
Constraints (including awaiting parts) The file average is capped at 90 days. Awaiting parts time is in- cluded.
2-4

As previously stated, the DoD policy does not authorize including AWP time in the repair cycle level for two reasons. First, the odds of having parts- related delays for the same component on a recurring basis are long. If inven- tory levels are increased to cover an event that is not likely to repeat, then the levels will be too high. Second, it may be cheaper to invest in an inventory of re- pair parts to support maintenance than in an increased level of serviceable com- ponents to support longer repair times. Determining the range, depth, and stocking location of individual repair parts consumed by I-Level repair requires careful analysis of each reparable assembly. Stocking based on historical de- mand does not ensure consistent RCTs. For example, items that fail infrequently but are critical to the operation of the component should be carried somewhere in the system as insurance if the production leadtime is long. To get an item ex- pedited from a wholesale depot may take one or two days versus one or two years of procurement leadtime. On the other hand, items that are frequently used should be positioned as close to the mechanic as possible. In this case, AWP time can be reduced to minutes. Items with chronic procurement related problems, such as bearings, should be analyzed at the national level to ensure in- vestment in enough safety level to compensate for procurement variabilites.
The Navy sample data collected during this study illustrate the variability of parts-related delays. Based on a central computation that includes insurance items for low frequency failure parts, the Navy stocks repair parts to support maintenance and supplements those levels based upon actual local demand his- tories. Table 2-3 shows AWP statistics for the sites that we visited. Although the average AWP delay was almost 4 days, the median time was .4 days. That is, half the national stock numbers (NSNs) repaired had an average less than or equal to .4 days. The average is influenced by a small number of NSNs with long AWP times.
Table 2-3. Navy Sample Awaiting Parts Statistics
Navy Sample Awaiting Parts Analysis Statistic
Mean 3.9
Median 0.4
Standard deviation 14.0
Range 291.0
Minimum 0.0
Maximum 291.0
Figure 2-1, shows the dollar weighted results of excluding AWP time from the Navy data, constraining the AWP to 20 days, and using actuals that include all AWPs. The no AWP policy yields an average RCT of 3.5 days. Under the ex- isting policy, the current average is 6.4 days. At an estimated $59 million per day RCT pipeline, excluding AWP time would reduce requirements by over $170 million. The cost to enhance repair parts availability in order to lower AWP
2-5

times is not known; however, if properly approached, it should be significantly less expensive than increasing levels of expensive reparable assets.
68.5
M Actual
■ File
Marine Corps
Figure 2-1. Navy AWP Data
Recommendations
USE ACTUAL HISTORICAL REPAIR CYCLE TIME DATA FOR THE RCT REQUIREMENTS
DETERMINATION PROCESS, BUT EXCLUDE EXTENDED DELAYS OF A ONE-TIME NATURE FOR
EACH OBSERVED TIME
Under the DoD policy, services should use actual historical repair cycle-time data but exclude delay time of an avoidable or unpredictable and infrequent na- ture. For example, wholesale backorder time for centrally stocked items should be excluded because it is random in nature and not likely to repeat. To do this, maintenance data processing systems must track these times such as "awaiting parts" and essentially "stop the clock." Constants or arbitrary floors or ceilings should not be used.
USE RCT AS A FACTOR FOR SAFETY-LEVEL COMPUTATIONS
All but one of the Services presently use RCT as a factor for safety-level computations. Since repair cycle times can vary, the variable safety level can help protect against deviations.
2-6

CURRENT REPAIR CYCLE TIMES AND REQUIREMENTS
Quantifying Service-wide I-Level repair cycle times and retail reparable re- quirements is not a simple task. Wholesale repair cycle requirements for items repaired at DoD depot maintenance activities are included in the Central Secon- dary Item Stratification (CSIS) budget summaries. Most of these summaries also include average repair cycle times. Except for the Air Force (which includes base levels of reparable requirements in the CSIS), no similar report summarizes retail reparable requirements repaired by I-Level maintenance activities. Therefore, we dedicated much of our effort to gathering data that could be used to estimate I-Level repair cycle times and requirements.
RCTs can be used to compute retail requirements in the following three ba- sic ways:
♦ Use actual times averaged over some period of time,
♦ Use constrained times, or
♦ Use a constant.
Although each uses a completely different approach, the Navy,2 Air Force, and Marine Corps each use constrained times to set retail requirements. The Navy has individual segment constraints that are applied to each repair observa- tion with a total constraint of 20 days. The Air Force uses a floor of 4 days for critical items and a ceiling of 10 days for noncritical items. The Marine Corps caps the average at 90 days. The Army uses a constant 25 days for RCT inde- pendent of actual data. For our analysis, we compared actual times to file times in order to gauge how well the requirements determination system matched the real world.
Table 2-4 shows our estimated RCTs and associated pipeline requirements for each Service. From each installation that we visited, we tried to get NSN data showing a 12-month average of actual RCTs by individual segment, constrained RCTs (those used in the supply system's file for requirements determination purposes), and repair rates. When available, we used these data, along with other information provided by headquarters, to compute actual and file average RCT, dollar weighted RCT, median RCT, total RCT inventory requirements, and a day's worth of RCT pipeline for the Service as a whole.
2 Throughout this report, Navy discussions are limited to Naval and Marine Aviation retail reparable requirements. There are no ship related retail supply levels (rotatable pools) repaired by I-Level repair organizations.
2-7

Table 2-4. Repair Cycle Times and Requirements
Service
File days Actual days Pipeline ($ million)
Average Dollar
weighted Average Dollar
weighted Requirement
($ million) Dollars per
day
Army
Navy
Air Force
Marine Corps
25.0
5.6
4.4
47.6
25.0
6.4
5.0
60.8
54.2
10.7
7.7
68.5
8.9
8.9
200
378
595
61
8
59
119
1
DoD total 6.6 1,233.7 187
Since Service systems did not always collect and maintain the data we needed, we could not complete every cell of Table 2-4. For the Army, we used the 25-day constant RCT and applied it to estimated Army wide total ASL re- quirements provided by the Army Deputy Chief of Staff for Logistics (DCSLOG). We also used some Standard Army Maintenance System (SAMS) RCT reports obtained from the installations to estimate actual times. The Navy's Naval Avia- tion Logistics Command Management Information System (NALCOMIS) pro- vided all necessary installation specific RCT data. We applied the results to estimated requirements data provided by the ASO. For the Air Force, we used the CSIS budget summary for constrained base RCTs and requirements for depot-level reparables and data provided by the Air Force Logistics Manage- ment Agency, Maxwell Air Force Base (AFB), Gunter Annex, for field-level repa- rable items. The installations visited provided us with actual data extracted from the Standard Base Supply System (SBSS). The detailed methodologies used to estimate these times and values are discussed in detail in the appendices.
Given the method used by the Services to compute and use retail RCT, it is clear that the file times are lower than actual experience. This result should al- ways be the case since DoD policy excludes using AWP time to compute RCT re- quirements. Although most of the Services measure AWP time in their systems, all the Services include some, if not all, AWP time in their file times. Because of these constraints, the file times are lower than actual times (almost double in the Navy). The greater the difference, the greater the probability of backorders and readiness degradation.
Local excess serviceable assets prevent backorders. During our field visits and review of the various field-level reparable item stratification, we observed that, in general, most areas have excess serviceable stocks. For example, in March 1995, one Service had a retail-level reparable authorized level for demand supported items of $38 million and an on-hand level of $85 million. Much of the excess can be attributed to draw-down in military structure. The procedures fol- lowed during a period of high inventory will not hold once the excess stocks are consumed. Much greater emphasis will have to be placed on RCT.
2-8

Figure 2-2 shows the actual and file dollar weighted RCTs when they are available. The goal should be to minimize the difference between file times and actual times through improved management practices. Through better manage- ment approaches, organizations can reduce these times. In the next chapter, we explore three areas that can be leveraged to improve RCT management — better information systems with performance indicators, improved supply and mainte- nance interfaces, and improved repair part inventory support for maintenance.
70
S. 60
Q 50 XI | 40
| 30
a 20
10 o o
68.5 60.8
25.0
8.9 6.4 8.9
H Actual
EFile
Army Naw Air Force
Marine Corps
Figure 2-2. Service I-Level File RCT
2-9

CHAPTER 3
I-Level RCT Improvements
INFORMATION SYSTEMS AND PERFORMANCE INDICATORS
Discussion
The key to the I-Level repair process is close coordination and cooperation between retail supply and maintenance operations. Not only must the individu- als involved in the operation work closely together, but the information manage- ment systems that support the two functions must be integrated so that they can pass data from one to the other.
The RCTs used for requirements determination purposes should be based upon actual historical times and must exclude unanticipated delays such as AWP time. To accomplish this, the system must measure and track actual times for each segment of RCT. The RCT segments are processing (supply to mainte- nance and maintenance to supply transit times), awaiting maintenance (time be- tween receipt by maintenance and start of actual repair), repair time, and AWP time and other logistics delays. Ideally, the system will compute historical aver- age RCT with and without delays. If computed by the maintenance system, the data (at the NSN level) should be automatically loaded into the supply system.
Table 3-1 shows the supply and maintenance retail systems involved with RCT management. The Army SAMS does track RCT by NSN, including AWP times, once maintenance receives the item. It does not cover the transportation segments on both ends. SAMS produces a report that supply could use to load RCT data into SAILS/DS4; however, they would have to load the times manu- ally.1 The Marine Corps Integrated Maintenance Management System (MIMMS) transmits monthly RCT data to the supported activities supply system (SASSY) but does not separate AWP time from total time. The Air Force SBSS system maintains constrained RCT data (floors and ceilings) and feeds these data to the appropriate ALC to support their worldwide computation. The Navy NAL- COMIS system is an integrated supply and maintenance system that tracks all segments of RCT and transmits the relevant data monthly to a central processing facility.
^ARSS will track RCT and update supply records automatically; however, SARSS has not yet been widely implemented.
3-1

Table 3-1. Service ADP Systems
Service Supply Maintenance
Army SAILS/DS4, SARSS SAMS
Navy
Ships Shipboard Uniform Automated Data Processing System-Real Time
NALCOMIS
Shore Uniform Automated Data Process System-Stock Point
NALCOMIS
Air Force
Air Combat Command SBSS Core Automated Maintenance System
Air Mobility Command SBSS G081 Maintenance System
Marine Corps SASSY MIMMS
In order to measure performance (the efficiency of the combined supply and maintenance organization) and establish goals for improvement, the system should also measure actual times against a standard. For example, if the "should take" repair time for an avionics black box is one day and the average time over one year is close to that duration, then performance is efficient. If, however, the average starts to creep up to two or more days, then a problem exists. Possibly the skills mix of the shop is changing and more training is required. If the "should take" awaiting maintenance time is one day and the actual times creep up to seven or more days, maybe a capacity shortage is causing the problem. Without standards, management cannot gauge performance. The data process- ing systems should produce performance indicator reports that measure "should take" times to "did take" times. None of the systems we looked at produced such reports.
During our field visits, we found that some of the supporting supply and maintenance automated systems were primarily stovepipes in their functional area; maintenance systems fed other maintenance systems and supporting sup- ply systems fed other supply systems. While some information automatically passed between the two systems and they are somewhat integrated, more can be done in this area. The Services are aware that they must make improvements, and they are investing time and dollars to improve their systems. The Army, for example, is currently fielding a new automated retail supply system (SARSS-O), which will improve the interchange of supply and maintenance information at the level where it is needed to support I-Level maintenance.
3-2

Recommendations
Measure and track the segments of RCT individually.
Establish standards for each segment of RCT and measure against actual times.
These standards can be constants for some segments and variables for oth- ers. For example, when the repair will be accomplished locally, the transporta- tion segment could be set at one day. The repair segment might be established as a variable. It could be set as the average repair time (minus unusual delays) over a long historical period or, alternatively, as a constant that varies by com- modity group. Each installation should set aggressive standards and monitor performance.
SUPPLY AND MAINTENANCE INTERFACES
Discussion
To be efficient, supply and maintenance organizations must work as a team. The most efficient maintenance operations that we observed were the ones in which supply and maintenance personnel were tightly integrated. At these or- ganizations, the traditional lines between supply and maintenance were almost invisible. This attribute is found in both Navy, Marine Corps, and Air Force aviation intermediate maintenance operations. We were very impressed with the close coordination among the supply and maintenance personnel in the 436th Logistics Group at Dover AFB. Biweekly, the supply and maintenance personnel briefed the leadership of the group on the status of all critical items due-in from maintenance and provided analysis of and reasons for any item that did not meet standards. Furthermore, expediters from both supply and mainte- nance worked closely together on a daily basis to solve problems that might pre- vent items from being processed quickly. We also observed this close cooperation at Oceana Naval Air Station with the same positive results.
Ground forces intermediate maintenance operations for both the Army and Marine Corps are not as integrated. The warehouses where the assets are stored tend to be geographically dispersed in relation to the maintenance organizations performing the repair actions. For these activities, processing time (transporta- tion and receiving functions on both ends) becomes an important factor that de- serves management attention.
Figure 3-1 is an example of the long transportation times that can result from geographic dispersion. While the average RCT, or TAT in Army terms, is 60 to 80 days, the average repair time (including scheduling and AWP time) av- erages 38 days. The transportation to and from maintenance (22 to 44 days) ac- counts for the difference.
3-3

Jun Jul Aug Sep Oct Nov Dec Jan Feb Mar Apr May
Average Average TAT MTTR
Note: MTTR = mean time to repair; TAT = turn around time.
Figure 3-1. Average Repair Times Versus Total RCT for Army Regional Maintenance
Another noticeable difference between aviation and ground forces is the awaiting maintenance time (time between receipt by maintenance and beginning of actual repair). The aviation operation tends to repair items as they are re- ceived with little or no delay because of backlogs. The ground forces operation tends to work more like their depot counterparts, has more formal production planning and scheduling exercises, and builds 15 to 30 day in-shop backlogs as a hedge against production line stoppages. Figure 3-2 compares Navy awaiting maintenance times with Army general support times.2
Recommendations
MINIMIZE PROCESSING AND SCHEDULING TIMES
Management should focus attention on these durations and make an effort to reduce them, especially transit times. One justification for having an I-Level maintenance capability is the speed and flexibility of the repair process. If RCT approaches or surpasses order and shipping time from the wholesaler for the
2 Awaiting maintenance times were not available for Air Force and Marine Corps units.
3-4

same item, then RCT requirements are greater than they would be if the item were not repaired locally.
30
25
to cv ■o TJ CD
.S> 15 CD
g
1 10
28.3
2.5
Army Installation GS Maintenance
Navy ArmyAir
Note: GS = ground support.
Figure 3-2. Awaiting Maintenance Delays
DEVELOP REDUCTION GOALS WHERE PRACTICAL
Organizations should use total quality management techniques to develop these goals. If supply and maintenance process improvement teams within each activity look for ways to streamline processing and scheduling, they can realize real reductions.
REPAIR PARTS SUPPORT TO MAINTENANCE
Discussion
Since AWP time should not be included in RCT, the parts needed by mainte- nance must be available when they need them. Otherwise, actual times will ex- ceed requirements and backorders will occur. This important area requires management understanding and attention. Processing and scheduling delays can take months if they are not closely monitored and managed, but parts prob- lems can shut down repair activities for years if long lead-time parts are in- volved.
During our visits to field locations, lack of repair parts and lack of confi- dence in the supply system were frequently mentioned as a cause of extended RCT. In addition, when repair parts shortages exist, organizations tend to
3-5

conduct "controlled cannibalization" to keep the maintenance shop in operation. At one of the field sites, we found a situation in which end items worth hun- dreds of millions of dollars each were rotated through a maintenance status and used as an alternate source of supply to provide serviceable items to keep other aircraft flying. We also found instances where cannibalization took place in shops. In this situation, personnel remove serviceable piece parts from secon- dary items entering the repair process and use them to repair items already in the process.
Generally, organizations should warehouse parts that support I-Level main- tenance as close to maintenance as possible. From the time the technician diag- noses the problem and orders the replacement part to the time he or she receives the part should be measured in hours if not minutes. This duration should hold for most parts that are stocked locally, and most parts that are maintenance coded for removal and replacement at the I-Level should be stocked locally in sufficient quantities to avoid delays. For those repair parts coded for I-Level that have very low mean time between failures, the Service may elect to stock a small number centrally to support multiple I-Level operations. If these parts fail, maintenance is an order and shipping time away from completing the repair; however, if the requirement has a high priority, the part can usually be expe- dited and received within a few days. If the parts are not on hand or on order anywhere in the supply system, then maintenance is an administrative and pro- duction leadtime away from completing the repair, which should never (or rarely) happen.
Problems of this nature most frequently occur when new or modified equip- ment is introduced into the field with inadequate parts provisioning. Weapons System program managers and ICPs must ensure that enough initial spare parts are procured with the equipment or modification kit to support I-Level mainte- nance.
Figure 3-3 compares the Army and Navy in-maintenance delay data (mostly AWP) from the sites we visited.3 AWP times differ because of different stocking policies. The Army's inventory reduction initiatives have affected maintenance operations.
The Services should review the methodology used to determine local range and depth requirements for spare parts. Low failure items should be stocked ei- ther locally or centrally as insurance or numerical stock objective (NSO) items. Organizations should use either a historical demand-based model (either days of supply or economic order quantity) or a material requirements planning (MRP) model that multiplies a projected repair rate by a bill of materials (BOM) listing to stock frequently used items. The use of "parts kits" also lends itself to the MRP and BOM approaches. Under any of the methods, the Services should not reduce these inventories for the sake of "inventory reduction" goals at the ex- pense of longer repair cycle times.
3 We could not obtain AWP data from the Marine Corps systems. The Air Force sys- tem has AWP times but did not separate hands-on time from total time.
3-6

tu
35 -
30 CO ^ln-maintenance
■g 25 - delays H Hands-on time
... j
0) :.■'.:..:,... j -§> 20 -
CD I
Dol
lar
Öl
j
10 - 'i 1
1 5 - I 11
' ^Rtt^^^^^^^M
0 - 22 2.7
Army Navy
Figure 3-3. Repair Time Versus Awaiting Parts Time Data
Recommendation
REVIEW RETAIL STOCK RANGE AND DEPTH POLICIES AND PROCEDURES
Most repair parts that are coded for removal and replacement at the I-Level should be stocked as either insurance and NSO items or demand-based items. Organizations should perform multi-indentured tradeoffs to determine range, depth, and stock location.
3-7

CHAPTER 4
Reparable Item Financial Practices
FUNDING OF LEVELS
During our field trips, we explored how type of funding affects RCT. Ac- cording to our observations, the type of money used to fund field-level reparable items has little impact on I-Level RCT. However, having all these assets in a sin- gle fund has other advantages. Under decentralized ownership, lateral transfers are difficult to arrange and are accompanied by many inventory and financial transactions in order to maintain accountability. Within a single fund, lateral transfers are merely "location changes."
Among the Services, and in one case within one Service, there are different approaches to funding these items. The various combinations are
♦ wholesale DBOF (single stock fund),
♦ wholesale DBOF/intermediate O&M, and
♦ wholesale DBOF/intermediate DBOF (retail stock fund).
Figure 4-1 illustrates the financial policies used by each of the Services. Presently, only the Air Force uses the wholesale DBOF to fund retail reparable inventories. The Army uses a retail stock fund to fund reparable inventory at the installation level. All other reparable inventories are O&M funded; however, most of the Services have future plans to migrate this inventory to either a wholesale or retail DBOF account.
Only the Navy centrally computes and funds all retail reparable require- ments. In the Air Force, each base individually computes its own requirement; however, the total worldwide requirement is centrally computed. Using this method has resulted in imbalances between local requirements and worldwide requirements. The Army and Marine Corps compute requirements locally.
From a repair incentive standpoint there is little difference across these models. If the unserviceable item can be repaired at the I-Level, no customer funds are expended. The physical act of repairing items is virtually the same.
4-1

Army [National inventory control points]
One-price system. Credits given after turn in if active repair program.
Requisition
fPoint-pf^saief
Wholesale
repairables in retail stock fund
Supply support activity (SSA)
Various credit policies exist between SSA and customers
Retail
Below instruction. Repairables in end-use O&M inventory account
Air Force [ÄIcl
Two-price system squadron obligates at standard price! 100 percent credit issued if repaired; at 1-Level; partial credit issued if turned in to ALC:
; :
Requisition
Wholesale
Air Force base supply
Retail
Repairables in DBOF wholesale stock fund
Issue
lPöint-of-sale|l
Squadron
Navy lASOl
Two-price system obfgate at "net" price.
S
1 Issue |Point-of-sale|
** Wholesale
Requisition
Retail
Tum-ln i r
Ships, Air Stations, Marine Air Logistics Squadrons (MALS)
Repairables in end-use O&M inventory account
Marine Corps iMarine Corps Logistics Bases|
One-price system abigate at65 percent standard price '■■::. (35 percent credit).
1
ji L l\ ISSU"
1 |Point-of-säie|
Wholesale
Requisition
Retail
Tum-ln 1 '
RiPS
Repairables in end-use O&M inventory account
Figure 4-1. Service Financial Processes
FUNDING OF I-LEVEL MAINTENANCE OPERATIONS
Since all direct and indirect labor and overhead costs for intermediate main- tenance activity are mission (O&M) funded, I-Level maintenance does not "bill" supply for the repair of unserviceable components as the wholesale system does. When the I-Level cannot immediately effect repairs because of backlogs, AWP, or lack of personnel, the activity can either hold the unserviceable item until such time that repairs can be made or turn it in to the wholesale system with an accompanying requisition. Because of the system, turning items in for credit is very expensive to O&M budgets, so most local activities prefer to hold items un- til, for readiness reasons, they must initiate a turn-in or requisition. The practice of holding can result in carcass shortages at the depot and wholesale backorders, some of which may be critical. It also greatly increases RCT for those Services that include some or all of this time in their retail requirements computations.
Figure 4-2 illustrates how financial incentives in the Marine Corps1 can in- fluence decision-makers to build up retail levels of inventories while holding un- serviceable items for long periods of time. The line graph plots total costs (inventory investment and recurring order charges) to backorder rates under
Separable levels are locally computed for Marine Corps Fleet Marine Force activities based upon actual repair cycle times. Awaiting parts times are included up to 90 days.
4-2

four different hold policies — never holding, waiting 75 days before turn-in, waiting 97 days, and waiting 102.5 days. A computer simulation that varied de- mands and repair over time for a sample item generated the cost curves. At the core of the model is the assumption that I-Level repair costs are only a fraction of the requisition costs because it appears as such to the supply department. Of course, the fallacy of this economic model is that real costs are associated with repairing locally. As the graph shows, using this flawed economic model, the solution that yields the least amount of backorders for the least total cost is the policy that holds unserviceable items the longest period of time.
4500 5000
Cost
5500 6000
!--- Never — ä£ -Wait = 75 — A- Wait = 97.5 «"■•— Wait = 102.S |
Figure 4-2. Comparison of Repair Strategies
This model does not consider the true costs of I-Level maintenance or wholesale asset balances and is, therefore, suboptimized. The incentives will change if the costs to repair at the I-Level are similar to those at the depot level. The incentives will also change if the cost to turn-in and order a replacement item were significantly lower. Under the Navy's new regional maintenance ap- proach (combining depot and intermediate maintenance organizations into a single geographic region), depending upon how the financial policies are ulti- mately implemented, the local incentives may change. The ideal financial model would produce incentives that yield the most readiness for the least investment. Exploring new and innovative models in detail is beyond the scope of this study; however, these and other financial models should be explored.
4-3

RECOMMENDATIONS
Explore Alternative Financial Models and Incentives for Combined Depot and I-Level Operations
Some alternative financial models and incentives are:
♦ Separate appropriations for infrastructure costs. Users pay the actual repair costs for both I-Level and depot-level.
♦ Different depot-level reparable pricing options.
♦ Regional maintenance operations with the same shops doing both depot and I-Level repair.
4-4

APPENDIX A
Army
SYSTEM OVERVIEW
The Army stocks secondary depot reparables (SDR) and field-level repa- rables (FLR) at two inventory levels — wholesale and intermediate. Wholesale reparables for which the Army is the inventory manager are stocked in Defense Logistics Agency (DLA) supply depots, and, in some cases, SDRs are stocked at the maintenance depots that repair the item. Intermediate reparable inventories are stocked at direct support (DS) and general support (GS) supply activities on an authorized stockage list (ASL). Commanders are authorized to consolidate stock of all or part of their reparable inventory at central locations for ease of management and operational conditions. Depending on location and organiza- tion, the inventories of SDRs and FLRs may either be operations and mainte- nance (O&M) or stock funded (SF).
The Standard Army Retail Supply System (SARSS—1,—2,—2B) and the Standard Army Intermediate Level Supply System (SAILS) manage the ASLs. The actual software package used by a supply activity depends on its location and mission. The Standard Army Maintenance System (SAMS—1,—2) manages the I-Level maintenance system, and the location and mission of the mainte- nance unit dictates which software package is used. An all encompassing SARSS—O system is replacing the SARSS—1,-2,—2B software systems.
ARMY PROCESS
When a reparable item needs replacing, the customer sends the unservice- able to the supporting supply support activity (SSA) and submits a requisition for a replacement item. The repair cycle time (RCT) begins at this point and ends when the unserviceable is processed through maintenance and back to supply and the appropriate supply action is initiated.
The Army uses military units (DS and GS), base-level table of distribution and allowance (TDA) organizations and contractors to perform I-Level mainte- nance. Figure A-l shows the process that is generally followed. Within a divi- sion, separate brigade, or similar organization, the unit turns in an unserviceable to the supporting SSA. If the item can be repaired at the DS level, the SSA sends the unserviceable to the supporting DS maintenance company for repair and, af- ter it is repaired, returns it to supply to be placed in stock. The SSA sends un- serviceables that cannot be repaired at the DS level to an exchange point established by the Corps Support Command (where there is one) or the
A-l

Installation Supply Support Division (ISSD), DoL, exchange point for turn-in and submits a request for a replacement. If the item is GS reparable or the support- ing maintenance activity has special repair authority (SRA) for the item, the un- serviceable is sent to maintenance (GS maintenance unit, DoL maintenance division, or contractor) for repair and return to stock. The depot-level reparable (DLRs) and not reparable this station (NRTS) items are evacuated, by either pre- determined routing or item manager (IM) direction, to a depot or contractor fa- cility. The authorized repair activity also has the authority to condemn an item, and, when this occurs, the maintenance organization returns the item to the SSA. It is sent to the Defense Reutilization and Marketing Office (DRMO) for disposal.
Army Automated activitiesuUse fixed 25-day OST/RCT.
Note: IM = item manager; FTE = report of excess; FTR = report of excess response ; DLR = depot-level re- pairable; FLR = field-level reparable; NRFI = not ready for issue; RFI = ready for issue; DoL = director of lo- gistics; DA = Department of the Army ; NRTS = not reparable this station; RCL = repair cycle level; QRA = average quantity repaired annually; RCT = repair cycle time.
Figure A-1. Army I-Level Repair Process
The Army is implementing a Regional Intermediate Maintenance Manage- ment program in which a regional maintenance management manager will re- view the intermediate repair programs of the maintenance activities in the region and will set priorities and redirect workload among the maintenance ac- tivities in coordination with the activities involved and their commanders. GS maintenance activities are repair programs developed by the regional managers and tailored to meet maintenance activity training and proficiency requirements, weapons system availability requirements, and cost. The regional manager also
A-2

develops maintenance programs that support regional requirements not identi- fied by the individual maintenance activities. These regional programs enhance readiness of low-density equipment, which, when requirements are consolidated at the regional level, support a repair program. The regional manager can also address any short fall or excess capacity problem by cross-leveling assets, reas- signing workload, or elevating the issue to the wholesale level. The regional manager also has the authority to designate, for cost, capacity, or other consid- erations, maintenance activities as Centers of Technical Excellence (CTE) where all or most of the intermediate maintenance on a particular item will be per- formed. The current regional efforts are being performed on a repair and return to the initiating installation supply source. Once financial problems are solved, the Army can achieve the ultimate goal of this initiative — a system that repairs and returns to stock at the installation that conducted the repair. Appendix F further discusses the Army regional maintenance approach.
REPAIR CYCLE TIMES AND REQUIREMENTS
How Allowances are Determined
The four types of reparable allowances are
♦ requisitioning objective (RO) (demand based),
♦ provisioning (nondemand based),
♦ local Commander's designated for (nondemand based),
♦ critical low-density equipment,
♦ seasonal, and
♦ operational readiness float (non-demand based).
Each ASL item must have an RO that is recorded in the stock accounting re- cord. The Army uses either days of supply (DOS) or economic order quantity (EOQ) formulas to compute RO. Stockage-level computations for reparable items, at the level where repair is accomplished, differ from the computations for material not repaired at that level. The two computations are the following:
♦ Not repaired at stockage level. RO consists of an operating level (OL), order ship time (OST), and a safety level (SL).
♦ Repaired at stockage level. RO consists of a repair cycle Level (RCL), OL and OST for washouts only, and an SL.
Table A-l and A-2 show how allowances for reparable items are computed.
A-3

Table A-1. Not Repaired at Stockage Level
Factor Period
OL 15 days CONUS
30 days CONUS
OST Average number of actual days over a minimum of 1 year
SL 5 days CONUS
5 days ALOC
15 days OCONUS
Table A-2. Required at Stockage Level
Factor Period Source
RCL Average annual repairs accomplished SAMS
OL Average annual washouts SAMS
SL 5 days based on average washouts
OST Average number of actual days over a minimum of 1 year (washouts only)
SARSS
Tables A-3 and A-4 show the allowance formulas for each computation.
Table A-3. Not Repaired at Stockage Level
Factor Formula
OL Average daily demand X 15 days ALOC X 15 days CONUS X 30 days OCONUS
OST Average daily demand X Average OST days
SL Average daily demand X 5 days ALOC X 5 days CONUS X 15 days OCONUS
A-4

Table A-4. Repaired at Stockage Level
Factor Formula
RCL
OL
SL
OST
Average daily repaired X RCT X 1.25 - RCT (25 days is a standard, SARSS-0 uses actual times)
EOQ formula using average daily washout quantity
Average daily washout quantity X 5 days
Average washout quantity X average OST days
The ROs are recomputed semiannually or when the balance on hand equals zero, whichever occurs first.
I-Level Repair Cycle Times
In order to estimate Army I-Level RCTs, we visited both Fort Hood and Fort Bragg. Fort Hood gave us two sets of data. The first set consisted of 12 months of actual RCT data for all items repaired at the regional maintenance operation. The second set of data consisted of 12 months of RCT data for all items repaired at I-Level organizations located at Fort Hood. Fort Bragg could not give us simi- lar files, so our Army-wide estimates are only based on the Fort Hood data.
Figure A-2 shows the Army regional maintenance RCT statistics in both av- erages and dollar-weighted averages. With the data, we were able to separate repair time from transportation time. The repair time clock starts when the maintenance organization receives the unserviceable item and ends when the serviceable item is picked up for return. This time includes not only the actual hands-on repair time but all time spent in maintenance [awaiting parts (AWP) time, queue time, and setup time]. As the data show, the dollar-weighted aver- age repair time is 80 days with a dollar weighted average transportation time of 27.1 days. The total dollar-weighted average exceeds 107 days.
A-5

Average Dollar-weighted Average Dollar-weighted Average Dollar-weighted
repair repair time transportation transportation total total
time time
Figure A-2. Fort Hood Regional Maintenance RCT Data
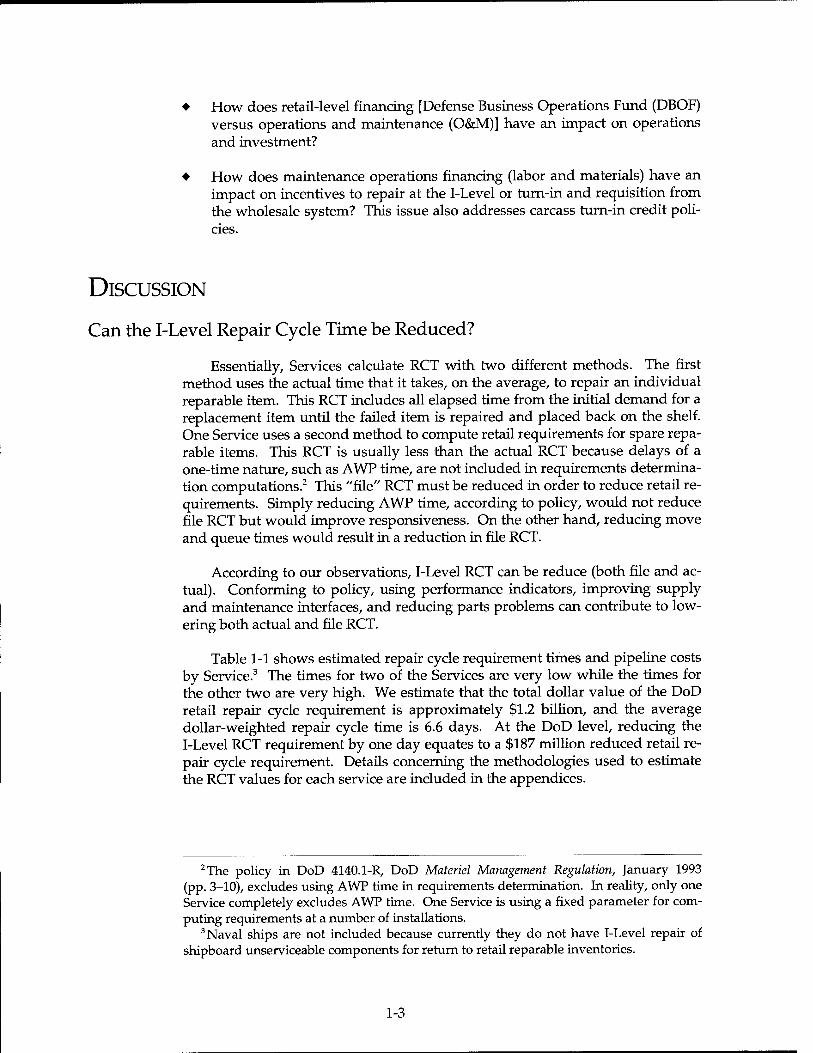
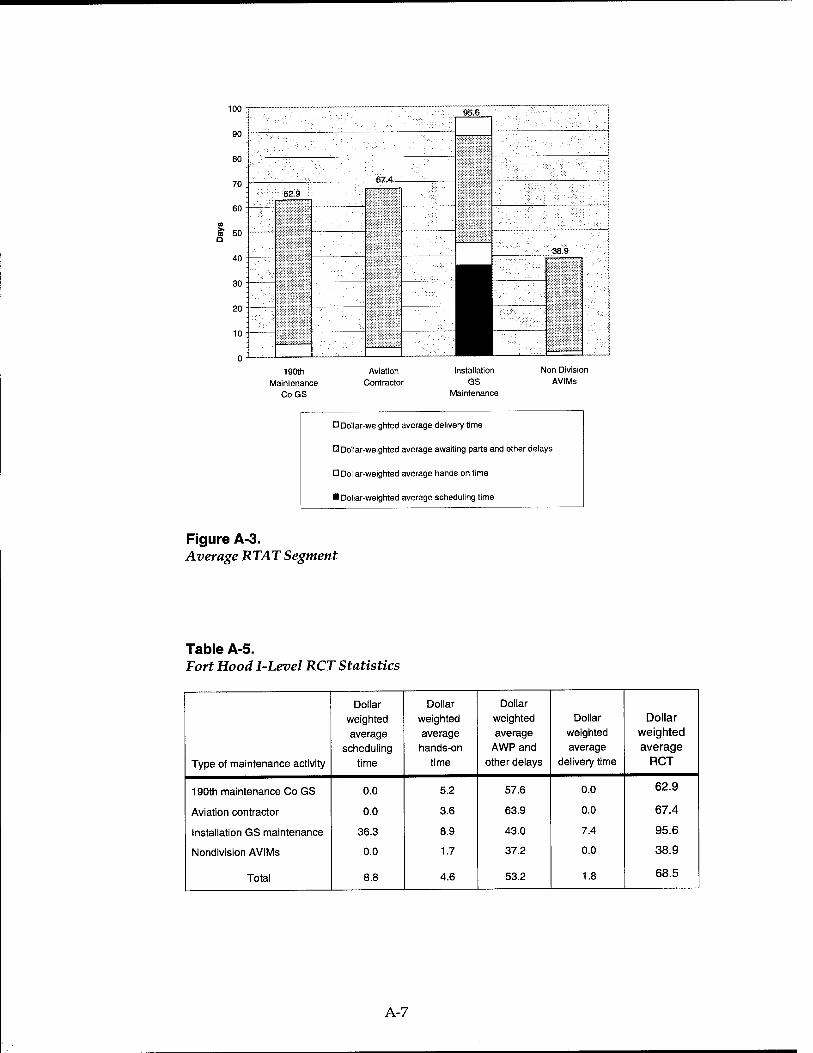
Figure A-3 and Table A-5 both show I-Level RCT statistics for Fort Hood. The overall average dollar weighted RCT is 68.5 days. Of that, only 4.6 days rep- resent actual hands-on repair time. AWP and other in-maintenance delays ac- count for more than 53.2 days or more than 77 percent of the total. The installation GS maintenance has an average 36.3-day scheduling delay (starts af- ter maintenance receives the item and ends after the first repair action begins) in part because of large induction batch sizes (inducting more carcasses than can be worked during the normal RCT.
Pipeline Costs
From the Fort Hood data, we determined the mix of repair activity between depot-level and field-level items as well as the repair rates, NRTS rates, and washout rates. Table A-6 shows the results of this analysis. By applying these rates to Army-wide retail stock fund requirements and assets data,1 we esti- mated the repair cycle requirement (RCR) Army-wide for Army stock-funded activities. As shown in Table A-7, we used the Army standard 25-day RCT used for requirements determination (rather than actual RCT times) to estimate RCR at approximately 116 million.
JThe Army retail stock-fund report shows a single OST reparable requirement of $126 million that we had to split into separate OST and RCT portions using Fort Hood statistics.
A-6
100
90
80
70
60
' 50
40
30
20
10
0
; 95.6 j
; J 1
R7 1
i
62.9
;
i !
38.9 i
1 -
|
i
190th
Maintenance CoGS
Aviation Contractor
Installation GS
Maintenance
Non Division AVIMs
O Dollar-weighted average delivery time
Ü Dollar-weighted average awaiting parts and other delays
Ü Dollar-weighted average hands on time
■ Dollar-weighted average scheduling time
Figure A-3. Average RTAT Segment
Table A-5. Fort Hood I-Level RCT Statistics
Dollar Dollar Dollar
weighted weighted weighted Dollar Dollar
average average average weighted weighted
scheduling hands-on AWP and average average
Type of maintenance activity time time other delays delivery time RCT
190th maintenance Co GS 0.0 5.2 57.6 0.0 62.9
Aviation contractor 0.0 3.6 63.9 0.0 67.4
Installation GS maintenance 36.3 8.9 43.0 7.4 95.6
Nondivision AVIMs 0.0 1.7 37.2 0.0 38.9
Total 8.8 4.6 53.2
1.8 68.5
A-7

Table A-6. Fort Hood Repair Rates
Condemnation level % Mix of items
Depot level
Field level
53.2
46.8
Condemnation level % Repair rate % NRTS rate % Washout rate
Depot
Field level
Total
85.0
95.1
92.3
14.6
4.6
7.3
0.4
0.3
0.3
Table A-7. Army Retail Stock-Fund Level Analysis ($ 000)
Days $ Level Total assets Days demand Report OST Percent
RCL 25 116,637 — 4,665 — 9
OST 25 9,677 — — 126,314 1
SL 5 25,263 — — — 2
OL 35 176,840 — — — 14
War reserve 60,638 — — — 5
NSO 902,441 — — — 70
Total RO 65 1,291,495 449,081 5,053 100
Using the percentages of each level to the total for the stock-funded inven- tory shown in Table A-7, we applied those same percentages to an estimated $900 million O&M ASL requirement in order to derive the RCT portion of the to- tal O&M requirement. Table A-8 shows the results of this analysis. The RCT re- quirement is estimated at approximately $81 million.
A-8

Table A-8. Army O&M-Level Analysis ($ 000)
Days $ Level
RCT 25 81,280
OST 25 6,744
SL 5 17,605
OL 35 123,234
War reserve — 42,257
NSO — 628,881
Total RO 65 900,000
Table A-9 shows the total Army-wide estimated RCT requirement.
Table A-9. Army-Wide-Level Analysis ($ 000)
Days Requirements $ per day
RCL 25 197,917 7,917
OST 25 16,421 657
SL 5 42,868 —
OL 35 300,073 —
War reserve — 102,895 —
NSO — 1,531,322 —
Total RO 65 2,191,495 —
A-9
APPENDIX B
Navy
SYSTEM OVERVIEW
Inventories of reparable items (depot and field level) in the Navy exist at the wholesale level and retail consumer level. Wholesale reparable assets are stocked at the Fleet Industrial Support Centers (FISCs). Retail consumer repara- ble assets are also stocked at the FISCs and at the following activities:
♦ Ships support (nonaviation)
♦ Ships (nonaviation) as authorized by the coordinated shipboard allowance list (COSAL)
♦ Tender and repair ships as authorized by tender and repair ship load lists (TARSLLs)
♦ Supply ships as authorized by fleet issue load lists (FILLs)
♦ Ship related shore activities as authorized by the coordinated shore based allowance list (COSBAL)
♦ Ship related depot and intermediate maintenance activities as authorized by the ships operational support inventory (OSI) stock lists
♦ Aviation support
♦ Ships (aviation) as authorized by the aviation coordinated allowance list (AVCAL)
♦ Naval air stations as authorized by the shore coordinated allowance list (SHORCAL)
♦ Marine Aviation Logistics Squadron (MALS) (AVCAL).
Presently, the consumer-level reparable inventories are operations and maintenance (O&M) funded. In the future, the Navy plans to capitalize these as- sets into the Defense Business Operations Fund (DBOF). The intermediate main- tenance activities are all O&M funded for materials and other expenses.
Intermediate-Level (I-Level) maintenance repairs aviation reparable retail inventories when they have the capability and then returns them to supply stock. For this reason, only the aviation AVCALs and SHORCALS use I-Level
B-l

repair cycle time (RCT), referred to by the Navy as repair turn-around time (RTAT), as a factor for setting retail levels. The wholesale depot or an I-Level or- ganization (on a repair and return basis with no supply involvement) repairs shipboard reparable retail inventories. Therefore, this appendix focuses on retail inventories of aviation reparables.
Both I-Level maintenance and supply use the Naval Aviation Logistics Com- mand Management Information System (NALCOMIS) to manage the aviation I-Level repair process. NALCOMIS also links to Shipboard Uniform Automated Data Processing System-Run Time (SUADPS-RT) and Uniform Automated Data Processing System-Stock Point (UADPS-SP) for shore activities.
NAVY AVIATION PROCESS
The Flow of Unserviceable Assets Through I-Level Maintenance
Figures B-l and B-2 show the general I-Level repair processes for both Navy and Marine activities. These processes are generally the same; the names of the activities performing the supply and maintenance functions are the main differ- ence. When a reparable item fails on an aircraft or at the squadron or operation level, maintenance personnel remove the failed item. If the squadron has NALCOMIS terminals, the mechanic uses the terminal to requisition a replace- ment component and prepare a maintenance action form. For other squadrons, the process is manual. If a serviceable item is in stock, the item is issued, and the unserviceable is sent to maintenance. If maintenance cannot issue a serviceable item, they process the carcass as an expedited repair (EXREP) and then return it to the squadron. EXREP is the highest priority. If a serviceable is issued and the on-hand balance is zero or below a certain level for critical items, they process the repair as a priority two. All others are processed as a priority three.
If an item is inducted and cannot be repaired, it is condemned and disposed of if it is a field-level reparable or turned in to the wholesale system if it is a depot-level reparable. The latter actions are referred to as BCM. Some items are automatically labeled BCM because the I-Level is not authorized to repair the item. Some other reasons for labeling a reparable a BCM include lack of parts, shop backlogs, and lack of skills. Once an item is labeled a BCM, maintenance prepares a stock replenishment requisition and submits it and obligates end-use O&M funds. At this point, NALCOMIS interfaces with SUADPS-RT for ship- board and MALS sites and UADPS-SP for major shore installations to keep the physical and financial inventory records up to date. SUADPS-RT and UADPS-SP do the financial accounting. For this reason, dual stock balances are maintained between these two systems.
B-2

ASO
Customer
Issue
RFI unit from pool
req uest
NRFI unit
NAS Supply SHORCAL CV and L
Class AVCAL
1348 RF|
Stock unit Replenishment
Point-of-sate
BCM NRFI unit
DLRs only
DLA consumables
FISC ASO DLRs
SUADPS-RT Or
UADPS-SP 3M Data
IRR unit
or
SHORCAL/AVCAL Computed By ASO
Negotiated with customer Considers turn-around time (TAT) on an individual item basis constrained to 20 days
Aircraft intermediate maintenance department
(AIMD) NALCOMIS
Designated overhaul point
(DOP)
Figure B-1. Navy Aviation I-Level Repair Process
Customer
t RFI Issue
unit request
from NRFi
pool unit f
Marine aircraft logistics squadron
(MALS) AVCAL
T" RFI
ASO
3M Data
SUADPS-RT
NRFi unit
BCM NRFi unit
SHORCAL/AVCAL Computed By ASO
Negotiated with customer Considers turn-around time (TAT) on an individual item basis constrained to 20 days
MALS intermediate maintenance
activity
1348 Stock unit
Replenishment
Poirtt-of-sale
BCM NRFI unit
DLRs only
FISC
DLA ASO consumables DLRs
Depot overhaul point
(DOP)
Figure B-2. Marine Aviation I-Level Repair Process
B-3

NALCOMIS keeps track of the four separate segments of RTAT — supply processing time, maintenance scheduling time, awaiting parts (AWP) time, and actual repair time. AWP time starts one hour after the parts requests are proc- essed in NALCOMIS and passed to SUADPS-RT or UADPS-SP. NALCOMIS also tracks failure rates, repair rates, and BCM rates. These data are reported by tape to the Navy's 3M system; the ASO uses them to set AVCAL and SHORCAL allowances.
Credit Policies
The Navy uses a two-price system for depot-level reparables. If they have a carcass to return, the activity obligates stock replenishment requisitions at the net, or repair price, published in the Management List-Navy. This event triggers the Navy's carcass tracking system. The retrograde material must be turned in under the same document number as the requisition in order to close the loop. If a carcass is not received within 90 days, a bill is processed for the difference be- tween the standard price and the net price.
REPAIR CYCLE TIMES AND REQUIREMENTS
How Allowances Are Determined
ASO computes allowance levels for retail aviation inventories serviced by an AIMD, or MALS. Attrition, repair rates and RCT are derived from mainte- nance data reported by NALCOMIS to the Naval Aviation Maintenance Office. Allowances are computed as the sum of the rotatable pool and attrition support. The rotatable pool represents the AIMD repair pipeline plus a safety level. TAT is constrained to 20 days and includes the segments and segment constraints shown in Table B-l.
Table B-1. Turn-Around Time Constraints
Element Maximum time allowed
Removal to IMA (processing) 1
Scheduling time 3
AWPs 20
Actual repair time 8
Total constrained time 20
B-4

The methodology for computing allowances for afloat AVCALS, SHORCALS, and MALS is generally the same; however, there are several differ- ences. The basic formulas for computing the repair cycle quantity is as follows:
♦ Attrition quantity = monthly BCM quantity * endurance period in months1
♦ Pool quantity = daily repair quantity * average RTAT
♦ Safety level computed by raw pool quantity poison distribution table
♦ Repair cycle quantity = raw pool quantity + safety level
♦ Allowance quantity = attrition quantity + repair cycle quantity
AFLOAT AVCALS
♦ Collective BCM rates, repair rates, and average RTATs are used.
♦ AVCALS are recomputed before deployment.
♦ Raw pool quantities are adjusted by past and future flying-hour programs.
♦ Safety level uses 85 percent of the protection table.
SHORCALS
♦ Site specific BCM rates, repair rates, and average RTATs are used.
♦ SHORCALS are recomputed on an as-required basis.
♦ Safety level uses 90 percent of the protection table.
MALS
♦ Site-specific BCM rates, repair rates, and average RTATs are used.
♦ MALS AVCALs are reviewed and revised every 36 months.
♦ Safety level uses 85 percent of the protection table.
^ne month CONUS shore, two months OCONUS shore, three months afloat and MALS.
B-5

I-Level Repair Cycle Times
In order to estimate Navy aviation I-Level RCTs, we visited MALS-29 at New River, North Carolina, and (NAS) Oceana in Norfolk, Virginia. At these two sites, we collected a 12-month history of every national stock number (NSN) repaired locally. For each NSN, these histories included the actual and con- strained RTATs, repair rates, BCM rates, and the total number of failures for the period.
Figure B-3 shows the distribution of actual average RTATs across the 1,470 NSNs examined. The average RTAT across the 1,470 NSNs was 10.7 days; however, the median RTAT was only 4 days. The dollar weighted average was 8.9 days. As shown in Figure B-3, the low frequency, long RTAT items drive up the average.
300
Median = 4 days Mean = 10.7 days Dollar-weighted mean = 8.9 days
~ * '- ° » * ? ™ $ % Z ?, % « % % Z, & * '* £ % % 2 % £ S %
Days
Figure B-3. Actual RTAT Distribution
Figure B-4 further breaks down the average RTAT into its component seg- ments. Also shown is the influence of the numeric constraints placed in the file when the actual times exceed the maximum authorized. The largest segment of the RTAT is AWP, averaging 3.9 days. Once the maintenance technician places an order for parts through the NALCOMIS system, the job is placed in AWP status if the parts are not received within one hour. Parts that are in stock are normally received the same day. This demand for parts that are either not stocked or backordered drives this average.
B-6
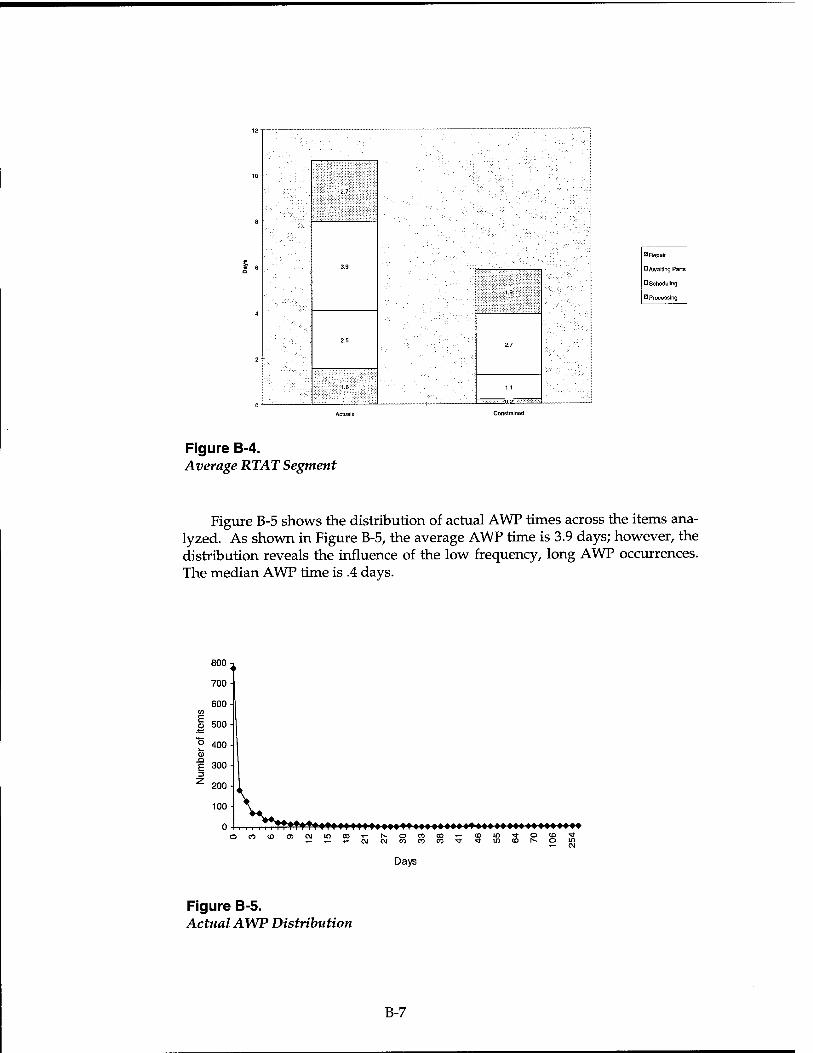
2
0
8
21
39
I 1 1 I 1
19
4
2
25 27
1.6 1.1
n->
^Awaiting Paris
□Scheduling
E Processing
Figure B-4. Average RTAT Segment
Figure B-5 shows the distribution of actual AWP times across the items ana- lyzed. As shown in Figure B-5, the average AWP time is 3.9 days; however, the distribution reveals the influence of the low frequency, long AWP occurrences. The median AWP time is .4 days.
800
Days
Figure B-5. Actual AWP Distribution
B-7

The same pattern of low frequency, long-time also applies to processing, scheduling, and repair times. The average processing time is 1.6 days; the me- dian is 0 days. The average scheduling time is 2.5 days; the median is .5 days. The average repair time is 2.7 days; the median is 1 day.
Figure B-6 shows the distribution of constrained RTAT data. When we ap- ply maximum time constraints to the actual times, the average drops from 10.7 days to 5.6 days. The dollar weighted average was 6.4 days. The repair rate for the two sites over the 12-month period was 75 percent; that is, 3 out of every 4 items were repaired locally. The remaining 25 percent were either washed out (field level) or labeled BCM (depot level).
300 n
250 w
o 200 o CD
o CD n E 3
Median = 3.9 days Mean = 5.6 days Dollar-weighted mean = 6.4 days
150
100
Figure B-6. Constrained RTAT Distribution Data
Pipeline Costs
Table B-2 shows the estimated dollar value of the ASO provided AVCAL and SHORCAL allowances. Of the total, we estimate that approximately 7.564 billion is inventory served by a co-located intermediate maintenance or- ganization.
B-8

Table B-2. Estimated Value of Aviation Retail Requirements
$ Millions
DLR FLR Total
MALS 1,610 190 1,800
Yokosuka 447 52 499
Other 1,360 160 1,520
Lamps 729 86 815
ISAL 233 27 260
Bases 1,715 202 1,917
L class 364 43 407
CVs 2,631 310 2,941
FISC 121 14 135
AIMD supported 6,767 797 7,564
Based on the sample data, we applied a 75 percent local repair factor and a 15 percent demand based versus insurance factor against the total requirement and a 6.4-day dollar weighted RTAT. Table B-3 shows the results. We estimate that a day's worth of pipeline for Navy aviation is approximately $133 million.
Table B-3. Estimated Value of RTAT Pipeline
$ Millions
Dollars Days Per day
AVCAL/SHORCAL
RCT requirement
7,564
852 6.4 133
PIECE PART SUPPORT TO MAINTENANCE
Local inventories of consumable material in support of maintenance are stocked based upon demand. If a reparable is in maintenance and the parts re- quired are more than an hour delayed, the item is considered AWP. The statis- tics for our sample, shown in Table B-4 show that the parts for nearly 85 percent of the repairs arrive in 5 or less days, and over 96 percent arrive within 20 days. The majority of parts requirements are satisfied the same day.
B-9

Table B-4. Awaiting Parts Data
AWP Count Running balance Total (percentage)
0 776 776 52.8
1 179 955 65.0
2 123 1,078 73.3
3 67 1,145 77.9
4 65 1,210 82.3
5 32 1,242 84.5
6 38 1,280 87.1
7 22 1,302 88.6
8 22 1,324 90.1
9 14 1,338 91.0
10 16 1,354 92.1
11 7 1,361 92.6
12 15 1,376 93.6
13 8 1,384 94.1
14 5 1,389 94.5
15 8 1,397 95.0
16 4 1,401 95.3
17 4 1,405 95.6
18 3 1,408 95.8
19 5 1,413 96.1
20 3 1,416 96.3
21 5 1,421 96.7
22 3 1,424 96.9
23 1 1,425 96.9
27 1 1,426 97.0
28 2 1,428 97.1
29 1 1,429 97.2
30 5 1,434 97.6
31 3 1,437 97.8
32 1 1,438 97.8
33 1 1,439 97.9
34 2 1,441 98.0
36 1 1,442 98.1
38 1 1,443 98.2
39 1 1,444 98.2
40 1 1,445 98.3
41 1 1,446 98.4
B-10

Table B-4. Awaiting Parts Data (Continued)
AWP Count Running balance Total (percentage)
42 1 1,447 98.4
45 4 1,451 98.7
46 1 1,452 98.8
47 2 1,454 98.9
52 1 1,455 99.0
55 1 1,456 99.0
57 1 1,457 99.1
62 1 1,458 99.2
64 1 1,459 99.3
66 2 1,461 99.4
67 1 1,462 99.5
70 1 1,463 99.5
77 1 1,464 99.6
88 1 1,465 99.7
106 1 1,466 99.7
112 1 1,467 99.8
146 1 1,468 99.9
254 1 1,469 99.9
291 1 1,470 100.0
OTHER CONSIDERATIONS
Financial Incentives
If maintenance cannot repair a DLR locally, they turn the unserviceable item in and requisition a serviceable item. Under the Navy two-price system, the ac- tivity obligates O&M funds at the net price, which is basically the repair price plus the cost recovery rate. If the item can be fixed locally, the activity expends O&M funds only for the parts consumed. Since O&M budgets are constrained, the incentive is to repair locally whenever possible.
Since the Persian Gulf war, the Navy has decided to transfer the stocks of reparable retail inventories from O&M end-use accounts to the DBOF. Once this process is complete, these assets will be wholesale assets that ASO will manage centrally. However, this change will not have an impact on the financial incen- tive to repair locally. Customer O&M funds will still be obligated at the net price whenever there is a BCM, and, since the I-Level maintenance shop labor is not within the DBOF, local repairs are considered to be "free" to O&M paying cus- tomers.
B-ll

The decision to repair or BCM does not consider the stock position assets at the wholesale level or the workload requirements at the Navy Aviation Depots (NADEPs). For this reason, the I-Level could be repairing items that have a long supply of serviceable assets at the wholesale level. Also, the situation could exist where there are carcass shortages at a NADEP for a funded program that results in increased indirect labor costs at the same time the I-Level is repairing those same assets. In this case, the Navy is essentially paying twice for the same re- pair.
Regional Maintenance
The Navy's move to regional maintenance has the potential to decrease re- curring costs dramatically. Because of the possible longer transit times involved with moving items from the Air Station to a regional shop, the RTATs may in- crease slightly. Appendix E discusses the Navy regional maintenance program in greater detail.
B-12
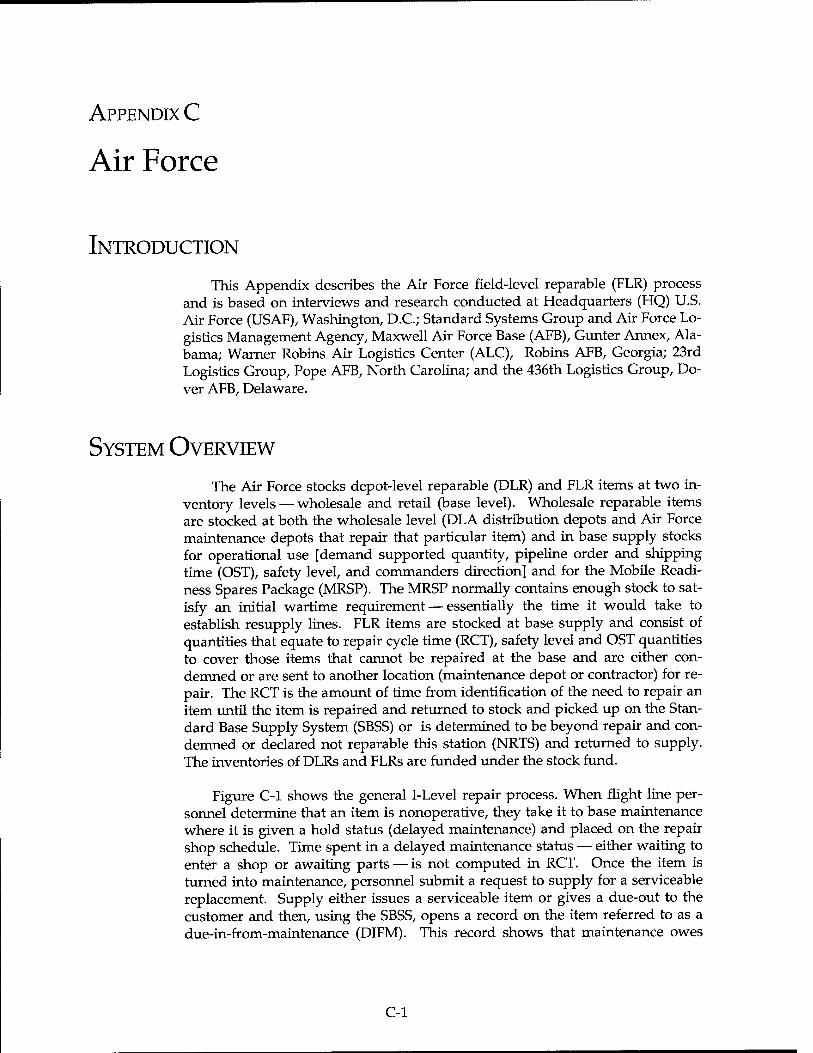
APPENDIX C
Air Force
INTRODUCTION
This Appendix describes the Air Force field-level reparable (FLR) process and is based on interviews and research conducted at Headquarters (HQ) U.S. Air Force (USAF), Washington, D.C.; Standard Systems Group and Air Force Lo- gistics Management Agency, Maxwell Air Force Base (AFB), Gunter Annex, Ala- bama; Warner Robins Air Logistics Center (ALC), Robins AFB, Georgia; 23rd Logistics Group, Pope AFB, North Carolina; and the 436th Logistics Group, Do- ver AFB, Delaware.
SYSTEM OVERVIEW
The Air Force stocks depot-level reparable (DLR) and FLR items at two in- ventory levels — wholesale and retail (base level). Wholesale reparable items are stocked at both the wholesale level (DLA distribution depots and Air Force maintenance depots that repair that particular item) and in base supply stocks for operational use [demand supported quantity, pipeline order and shipping time (OST), safety level, and commanders direction] and for the Mobile Readi- ness Spares Package (MRSP). The MRSP normally contains enough stock to sat- isfy an initial wartime requirement — essentially the time it would take to establish resupply lines. FLR items are stocked at base supply and consist of quantities that equate to repair cycle time (RCT), safety level and OST quantities to cover those items that cannot be repaired at the base and are either con- demned or are sent to another location (maintenance depot or contractor) for re- pair. The RCT is the amount of time from identification of the need to repair an item until the item is repaired and returned to stock and picked up on the Stan- dard Base Supply System (SBSS) or is determined to be beyond repair and con- demned or declared not reparable this station (NRTS) and returned to supply. The inventories of DLRs and FLRs are funded under the stock fund.
Figure C-l shows the general I-Level repair process. When flight line per- sonnel determine that an item is nonoperative, they take it to base maintenance where it is given a hold status (delayed maintenance) and placed on the repair shop schedule. Time spent in a delayed maintenance status — either waiting to enter a shop or awaiting parts — is not computed in RCT. Once the item is turned into maintenance, personnel submit a request to supply for a serviceable replacement. Supply either issues a serviceable item or gives a due-out to the customer and then, using the SBSS, opens a record on the item referred to as a due-in-from-maintenance (DIFM). This record shows that maintenance owes
C-l

supply an item in exchange for the one issued or owed to the customer. Both supply and maintenance use the DIFM record to keep track of the repair cycle process. Daily communication between supply and maintenance enables both parties to update the DIFM record with the latest status and location of the items in maintenance. The repair cycle process has three basic categories: (1) items undergoing repair, (2) items awaiting parts, and (3) items that are intentionally not being repaired. When personnel enter one of these codes into the DIFM re- cord, maintenance personnel can update the item status and indicate to SBSS — the system that calculates RCT — whether the time spent in a certain status is in the repair cycle or delayed maintenance. The Air Force uses only the RCT to compute stock levels. Therefore, the RCT recorded in the DIFM record is one of the key factors used to calculate the quantity of an item that must be on the shelf or in the pipeline to support customer requirements. Once the mainte- nance technicians finish work on an item, they turn it in to supply in either a re- paired (serviceable), condemned, or NRTS condition, and the RCT clock stops. The item is then put on the shelf or issued to a customer to fill a due-out, sent to a depot or contractor based on the Reparable Item Movement Control System (RIMCS) code for repair, or, if in a condemned condition, sent to the Defense Reutilization and Marketing Office (DRMO) for disposal.
AF Form 2005 Issue/turn-in
,, AFTO Form 350 Reparable item processing tag
AF Form 2005 Issue/turn-in
NRTS Code 1 items bypass l-Level and go directly to the
depot
SBSS D002A
RCT
Air Force recoverable assembly management
System D28
RFi NRFI Unit - Non-NRTS Code 1
Unii \ Core Automated Maintenance System
,, Point-of-sale
Shop Services Center (SSC)
Retail stock fund
1348-1 \ (CAMS)
-RFi U:':i?
-RFI Unit —
1348 Stock
replenishment
Worldwinde Stock Balabce and
Consumption Report Consolidation System j (D104)
History Accumulation Subsystem
(D143F)
Repair shops
AWP Excluded \ Disposal
\ DRMO
Recoverable Central Leveling System
(D041)
Note: AFTO = Air Force Technical Order; AWP = awaiting parts; DRMO = Defense Reutilization and Market- ing Office; NRFI = not ready for issue; RFI = ready for issue.
Figure C-1. Air Force I-Level Repair Process
C-2

When the wholesale stock of an item falls below requirements, that item is designated critical, and it will not accumulate RCT in the same manner as non- critical assets. Critical items are expedited through the repair shops, and they have a minimum computed repair time of four days and a maximum of ten days. Items remain in a critical status until supply equals or exceeds requirements.
Normally, when a unit turns in an unserviceable FLR and orders a service- able replacement, the price paid for the serviceable item is the acquisition price plus a surcharge. When the unserviceable is repaired, a review of the Air Force stock status is made, and, if the item is in a buy status or not excess (less than three years of supply), full credit is given to the unit. If the item is in an excess position or the item is NRTS or condemned, the unit does not receive credit.
REPAIR CYCLE TIMES AND REQUIREMENTS
How Allowances are Determined
The consolidated base supply activity is responsible for the overall manage- ment, technical supervision, and maintenance of accountable records for most of the supplies, including FLRs, consumed by the operating units. The system is fully automated and standardized throughout the Air Force. The SBSS is the in- formation management system that runs the process. Operating on a Sperry U2200 computer, SBSS is an automated inventory accounting and control system that is the main line of communication between base units and the wholesale supply system. With the financial programs built into SBSS, the unit and supply personnel can maintain a real-time status of their funds. SBSS also captures maintenance management data pertinent to component repair including repair rates, reasons for nonrepair, repair times, and DIFM status.
SBSS also calculates repair cycle stock levels for all reparable items,1 and the key criteria are based on the unit price and the percentage of the unserviceables of that particular item that are repaired at the base. The repair cycle demand level (RCDL) for reparables is the sum of the repair cycle quantity (RCQ), order and ship time quantity (OSTQ), NRTS/condemned quantity (NCQ), safety level quantity (SLQ), and a half adjustment factor of 0.5 if the item unit price (IUP) is $750.01 or greater or 0.9 if the IUP is $750.00 or less.
lrThe wholesale system (D041) computes worldwide requirements for DLRs. The sum of the individual base SBSS requirements may be greater than the total wholesale computed requirement.
C-3

The Air Force computes the subelements of the RCDL formula as follows:
♦ RCQ = daily demand rate (DDR) * percent of base repair (PBR) * RCT
♦ OSTQ = DDR * (1-PBR) * O&ST 2(note 1)
♦ NCQ = DDR * (1-PBR) * NCT (average # of days it took to determine the item was in an NCT)
♦ SLQ = C (standard deviation: 1 CONUS/2 OCONUS) * the square root of 3(RCQ+OSTQ+NCQ)
♦ DDR = cumulative recurring demands divided by current day of the calen- dar year
♦ PBR = (repaired units * 100) divided by (units repaired + NRTS + con- demned)
I-Level Repair Cycle Times
Since the Air Force computes worldwide base-level requirements for DLRs at the wholesale level based upon actual base RCT data, the central secondary item stratification report includes both the dollar value of the RCT requirement and the average and dollar weighted days. As of 30 July 1995, the average base RCT was 4.4 days; 5.0 days dollar weighted. The Air Force is the only Service that excludes all AWP time in their RCT measurements used for requirements determination. This methodology complies with DoD policy.
As we did with the other Services, we collected data from the two bases vis- ited. Figure C-2 shows the total RCT and AWP times for the two bases. One base was below the Air Force-wide average, and one was significantly above.
Pipeline Costs
As of 15 July 1995, the base RCT requirement for DLRs was $481.4 million. Based on reports prepared by the Air Force Logistics Management Agency, the Air Force had, in March 1995, an additional FLR requirement of $113.3 million. Together, the total RCT requirement for the Air Force is $594.7 million. Using the 5-day average RCT, a day of Air Force I-Level pipeline is estimated at nearly $119 million.
2SBSS excludes from OST computations for any shipment that exceeds a fixed num- ber of days based on the Uniform Materiel Movement and Issue Priority System (UM- MIPS) standard for that region. For most items, the SBSS uses 175 percent of the UMMIPS standard. If the receipt is equal to or less than the 175 percent of the UMMIPS standard for that geographical location and for that priority group, the computer will up- date the calculation for OST days.
C-4

Dover Pope
NET RCT D AWP
Total
Figure C-2. Pope and Dover AFB RCT Data
OTHER
During our visits to both Pope and Dover AFBs, we found a very close working relationship between supply and maintenance personnel. Processing and tracking of unserviceable assets was a major effort for all concerned. The lo- gistics groups used daily status reports and held weekly meetings to review DFIM status and determine what needed to be done to move unserviceable items through the process in a more effective manner. They reviewed each DFIM item that was held up for whatever reason and developed initiatives to solve the problem.
The Air Force has developed certain initiatives to reduce RCT. These initia- tives include splitting base stocks and placing as many high demand and critical items in forward warehouses located as close to the maintenance shops as possi- ble and using spare part expediters and assigned personnel to manage items that show lengthy delayed maintenance or AWP. They have also set new and chal- lenging RCT standards. In a message to the field, the Air Mobility Command es- tablished 4 days as the maximum time it should take to move base repair assets through the repair cycle and only 24 hours for those items designated as critical.
The Air Force has also initiated a program called Lean Logistics to improve support and reduce costs. One aspect of this initiative eliminates or reduces FLRs and moves to a two-level maintenance concept. The first level is the flight line, and the second is wholesale (depot or contractor). This initiative started with avionics and engines and will expand to most, if not all, reparables. The
C-5

Air Force stated that they have realized considerable savings in dollars and peo- ple and are forecasting that, as the program expands, additional savings should be realized.
One area that does need to be addressed is maintenance down time associ- ated with the AWP problem. Personnel at each of the bases commented that this problem of lack of repair parts has been a long-standing issue that continues to be a major obstacle to an efficient operation.
C-6

APPENDIX D
Marine Corps
SYSTEM OVERVIEW
The Marine Corps (nonaviation) secondary depot reparables (SDR) and field-level reparables (FLR) are stocked in two inventory levels — wholesale and intermediate. Wholesale reparables for which Marine Corps Logistics Base (MCLB), Albany, is the inventory manager at the national level are stocked at Al- bany and Barstow. Reparable issue points (RIPs) stock I-Level reparable inven- tories. The RIPs are the sole source for the direct exchange of SDRs and FLRs in support of second, third, and fourth echelon maintenance. The RIP inventory is operations and maintenance (O&M) funded.
The RIPs are located at the three FMF Garrisons — the First Force Service Support Group (FSSG) at Camp Pendleton, the second FSSG at Camp Lejeune, and the third FSSG at Camp Butler. MCLB, Albany and Barstow, support other bases, recruit depots, and schools. The Supported Activities Supply System (SASSY) management unit (SMU) manages RIP items. RIP inventories are O&M funded. The Marine Corps Integrated Maintenance Management System (MIMMS) manages the I-Level maintenance of RIP unserviceable assets. A new system, called Asset Tracking for Logistics and Supply System (ATLASS), will replace both SASSY and MIMMS in the future.
MARINE CORPS PROCESS
The Flow of Unserviceables Through I-Level Maintenance
Figure D-l shows the Marine Corps I-Level repair process. When a repara- ble item needs replacing, the customer brings the unserviceable directly to the Intermediate Maintenance Activity (IMA). At that time, IMA opens an equip- ment repair order (ERO) and enters it into the MIMMS system. The customer then goes to the RIP for a replacement item. Once the item is repaired, the IMA closes out the ERO and returns the serviceable item to the RIP inventory. FLRs that are condemned are sent to disposal, and a corresponding wash-through re- ceipt and issue are entered into SASSY. DLRs that cannot be repaired at the IMA are reported to MCLB Albany on a WIR. MCLB Albany then provides dis- position instructions that include ship to a depot, continue holding, or send to disposal. This WIR process also applies to SDRs that cannot be repaired within 60 days because of awaiting parts (AWP) problems.
D-l

SASSY Maintenance Float
Subsystem
DRMO
NRFi unit Washout ^ I
RIP
Maintenance float allowance Umt
Maintenance Battalion Intermediate Maintenance
Activity
MIMMS
Failure rates repair rates
RCT
MIMMS data
1348
Stock Point-of-sale! replenishment
Disposition
WIR WIR Unit
Marine Corps Logistics Bases Albany Depot
Note: DRMO = Defense Reutilization and Marketing Office; NRFI = not ready for issue; RFI = ready for issue;
WIR = reportable item report.
Figure D-1. Marine Corps I-Level Repair Process
Credit Policies
When a DLR cannot be repaired at the I-Level, the SMU must requisition a serviceable item from the wholesale supply system. If MCLB Albany is the item manager, the item is requisitioned at the repair price. If another Service manages the item, it is requisitioned at the standard price. For these items, the managing Service may or may not issue a credit for the unserviceable. Under the current fiscal year 1995 policy, the Services can issue credits if the carcass is turned in; however, Camp Lejeune is experiencing problems getting credits from some of the Services.
REPAIR CYCLE TIMES AND REQUIREMENTS
How Allowances Are Determined
The five kinds of RIP allowances are
♦ requisitioning objective (RO) (demand based),
♦ mount-out allowance (MOAL),
♦ local commander-designated insurance items for critical low-density (CLD) equipment,
D-2

♦ provisioning allowance (PAL), and
♦ special insurance.
The RO includes a repair cycle requirement (RCR), an order and shipping time requirement (OSR) for the items that wash out or are beyond the capability of maintenance to repair, a safety level (SL), and an operating level (OL). Special allowances may also be included in addition to the RO. The following three ta- bles show how the Marine Corps computes RIP allowances (D-l through D-3).
Table D-1. RIP Allowance Factors
Factor Period Source
Maintenance failure rate (MFR) Average per month MIMMS
Repair rate (RR) Average per month MIMMS
Repair cycle time (RCT) Average number of days over 12 months MIMMS
Operating level time (OLT) 30-days CONUS, 60-days OCONUS
Order and shipping time (OST) Average number of days over 12 months SASSY
MOAL Fixed quantity
Special allowance (SPL) Fixed quantity
CLD/PAL Fixed quantity
Table D-2. RIP Allowance Formulas
Factor Formula Comment
RCR (RR x RCT)/22, capped at 90, includes AWP
Work days in month
Resupply rate (RSR) MFR - RR
OL (RSR x OLT)/30
OSR (RSR x OST)/30
SL RCR + OSR table Poison distribution - 90 percent confidence level
RO RCR + OSR + SL + OL
Mount-out storage level (MOSL) RO + MOAL
Total allowances Larger of MOSL and CLD/PAL + SPL
D-3

Table D-3. RIP Safety Levels
RCR + OSR SL RCR + OSR SL
1 1 144 to 162 16
2 to 3 2 163 to 183 17
4 to 7 3 184 to 205 18
8 to 11 4 206 to 228 19
12 to 17 5 229 to 253 20
18 to 24 6 254 to 279 21
25 to 33 7 280 to 306 22
34 to 42 8 307 to 335 23
43 to 53 9 336 to 365 24
54 to 65 10 366 to 396 25
66 to 79 11 397 to 429 26
89 to 93 12 430 to 463 27
94 to 108 13 464 to 498 28
109 to 125 14 499 to 535 29
126 to 143 15 536 to 573 30
Once each year, the SASSY management unit recomputes allowances and forwards allowance data to MCLB Albany for approval. MCLB Albany ensures that the allowances are properly computed and that total allowances do not ex- ceed available assets.
I-Level Repair Cycle Times
In order to examine Marine Corps nonaviation RCTs, we visited Marine Corps Headquarters; the second FSSG SMU and Maintenance Battalion at Camp Lejeune, North Carolina; and MCLB, Albany, Georgia. Headquarters gave us summary requirements and asset data for each of the three FSSGs. At Camp Le- juene, they gave us a file that contained factors used for the last annual recompu- tation of RIP allowances. At MCLB Albany, we received copies of the formulas used to compute allowances.
Table D-4 shows the results of our analysis of the RIP recomputation file. Be- cause unit prices were not listed, we added unit prices from the March 1995 Fed- eral Logistics Data on CDROM (FEDLOG) application in order to compute requirements by dollar value. The total dollar value of the allowance was more than $77.6 million. The RCR was more than $19 million, or nearly 25 percent of the total and represented an average RCT of over 47 days.
D-4

Table D-4. Analysis of RIP Data
DLR FLR Total
Dollars Days Items Dollars Days Items Dollars Days Items
RCT 17,803,358 47.65 341 1,304,823 46.92 293 19,108,182 47.31 634
OST 17,054,696 29.88 527 1,863,202 29.01 370 18,917,899 29.51 897
SL 17,062,251 584 1,641,089 442 18,703,340 1,026
OL 14,507,970 30 559 1,861,514 30 399 16,369,483 30 958
Other 3,981,417 123 573,176 114 4,554,593 237
Total 70,409,692 706 7,243,804 482 77,653,496 1,188
Figure D-2 shows the distribution of RCTs across the national stock num- bers (NSNs) managed. The figure reveals that over half of the NSNs have repair times greater than 41 days.
140
% 12° S ioo o S 80 o S 60 XI £ 40 3
0 ITTTIIiii1111in11111iiiilliTTiTTIin11>i11iTIiiiTmTfWWfiiiTiTiTmfn^WWTn
Median = 41.5
Mean = 47.6
1 6 11 16 21 26 31 36 41 46 51 56 61 67 73 80 86
Days
Figure D-2. RCT Distribution
D-5

Table D-5 shows the results of applying the average RCT and RCR percent of total from table D-4 to the total allowance and asset data provided by Head- quarters.1
Table D-5. Marine Corps Totals By FSSG
$ in millions
On-hand In
maintenance Excess Activity RO condition /on order Above RO dues
First FSSG
Repair cycle 18.41
OST 18.22
SL 18.02
Operating level 15.77
Other 4.39
Total 74.80 46.60 28.20 5.10 4.80
Second FSSG
Repair cycle 14.00
Order and shipping time 13.86
Safety level 13.70
Operating level 11.99
Other 3.34
Total 56.90 39.30 17.30 7.30 3.20
Third FSSG
Repair cycle 23.38
Order and shipping time 23.14
Safety level 22.88
Operating level 20.03
Other 5.57
Total 95.00 49.90 45.10 4.30 3.30
Grand Total 226.70 135.80 90.90 16.70 11.30
The Marine Corps RCT is long because of a combination of AWP time and maintenance backlog (included in the Marine Corps RCT measurement). The Second Maintenance Battalion is operating at below the authorized level, and, since Battalion personnel are nearly all active duty Marines, they have other
^he total requirement in the second FSSG recomputation file extended at the stan- dard price obtained from FEDLOG was $77.7 million; the total RO for the Second FSSG provided by Headquarters was $56.9 million. For this reason, we used the lower value provided by Headquarters for a total and applied the factors from the recomputation file to compute the various levels.
D-6

military duties to perform in addition to I-Level maintenance. The new ATLASS computer system will relieve some of the administrative time associated with ERO processing and repair part ordering.
By policy, the Marine Corps caps RCT at 90 days. In I-Level RCT terms, this number is high. In fact, 135 of the 634 items having an RCT requirement had 90 days.
The Army generally uses a fixed 25 day RCT; the Navy caps their RCT at 20 days, and the average I-Level RCT in the Air Force is 5 days. If the Marine Corps capped their RCT at 25 days, the average RCT would drop to 22 days. If they capped at 50 days, the average RCT would drop to 36 days. To accomplish this change without having an impact on readiness and without increasing the WIR rates (and thus increasing O&M stock replenishment requirements), the Marine Corps must greatly reduce maintenance backlogs and AWP delays. This change may mean investing more in repair part inventories, especially low de- mand, insurance type items, and eliminating some of the nondirect labor de- mands on the I-Level workforce.
Pipeline Costs
Table D-6, a summary of the data above, shows that the estimate of the total Marine Corps I-Level RCR is $55.78 million. This figure represents an average RCT of 47.65 days and a dollar weighted average of 60.8 days. Therefore, each day of RCT equals approximately $.92 million.
Table D-6. Pipeline Costs
$ in millions
RO Days Days pipeline
Marine Corps Total
Repair cycle 55.78 60.80 0.92
Order and shipping time 55.23 29.88 1.85
Safety level 54.60
Operating level 47.79 30.00
Other 13.30
Total 226.70
PIECE PART SUPPORT TO MAINTENANCE
The SMU also stocks consumable repair parts to support the I-Level mainte- nance effort. They use a days of supply model and build a requisitioning
D-7

objective roughly equal to four months of demand based on the average monthly demand. The MIMMS system closely monitors parts requirements for each open ERO and produces management reports that are used for expediting shortages. The significant AWP problems they encounter are the ones in which the whole- sale system has backorders with long contract delivery dates. The Marine Corps expressed concern at the number of DLA managed items that are migrating to nonstocked status. For these items, they are always a contracting and produc- tion lead-time away from having an order filled. Both DLA and the Marine Corps should work closer together to help alleviate this problem.
FUNDING CONSIDERATIONS
Financial Incentives
The RIP inventory is O&M funded. When an unserviceable allowance item is successfully repaired at the I-Level, the local commander only spends O&M dollars for the repair parts needed to effect repair. Since the great majority of I-Level maintenance personnel are Marines, Military Personnel appropriations cover their direct and indirect labor. Therefore, the total costs associated with re- pair at the I-Level are not visible to the local commander.
However, if the SMU must requisition a serviceable, the local commander's O&M account is charged either the repair price (for MCLB Albany managed items) or the standard price with the possibility of receiving a credit. In either case, the price includes both the labor and the materials as well as a surcharge to cover wholesale operations. Clearly, the financial incentive is to effect repairs lo- cally.
O&M Versus Stock Funding
During our visits with Marine Corps Headquarters, MCLB Albany and Camp Lejeune, we explored the pros and cons associated with O&M funding versus stock funding of the I-Level reparable inventory. Headquarters personnel felt that stock funding might have a slight advantage because it would probably result in lower I-Level inventories through a lower obligation authority to sales ratio. Both MCLB Albany and Camp Lejeune were opposed to stock funding be- cause they felt it would increase the complexity and administrative requirement of operating the SMU.
All three commands felt that the financial incentives to repair at the I-Level versus requisition from the wholesaler would remain unchanged under either funding scenario. If the SMU were retail stock funded, the O-level could buy serviceable items from the SMU at a repair price if they turned in a carcass. The SMU could then spend that income on the direct material needed to accomplish the repair. If the item could not be fixed, the SMU could requisition a serviceable
D-8

and the retail stock fund would be billed by the wholesale stock fund at a higher price than if the repair had been accomplished locally.
D-9

Appendix E
Navy Regional Maintenance
BACKGROUND
The Navy has traditionally operated separate facilities for intermediate and depot-level maintenance support of ships and aircraft. For ships, repair ships (i.e. tenders) and shore-based Ship Intermediate Maintenance Activities (SIMAs) provide I-Level support, and public and private shipyards provide depot-level support. For aircraft, aircraft intermediate maintenance departments located on aircraft carriers afloat and naval air stations ashore provide I-Level support, and Naval Aviation Depots (NADEPs) provide depot-level support. Although many of the Navy's intermediate and depot-level maintenance capabilities are similar, there are significant differences in the types of work required by aircraft, surface ships, and submarines. Accordingly, the Navy has historically used separate maintenance facilities for aviation, surface, and subsurface systems. In addition, separate facilities frequently support different subgroups of ships and aircraft. For instance, a recent study of equipment calibration services in the Tidewater area revealed that several different activities provided similar services within close proximity to each other and that most of these activities were operating at a fraction of their maximum capacity.1
OVERVIEW
In the current era of dramatically reduced force structures and increasingly austere budgets, the Navy cannot afford to retain excess or duplicate mainte- nance capabilities and infrastructure. Consequently, the Chief of Naval Opera- tions (CNO) has decided to consolidate most of the Navy's shore-based intermediate and depot maintenance facilities into eight Regional Maintenance Centers (RMCs) as shown in Figures E-l and E-2.2 The Atlantic Fleet will oper- ate RMCs in the Northeast, Mid-Atlantic, Southeast, and Gulf Coast (Ingleside, Texas). The Pacific Fleet RMCs will be located in the Pacific Northwest, San Di- ego, Hawaii, and Japan. The industrial hub of each RMC will be a Naval Ship- yard (NSY), Ship Repair Facility (SRF), or NADEP. Each RMC will also encompass several Regional Repair Centers (RRCs) that will focus on specific re- pair processes (e.g., propulsion, electrical, and structural). The number of RRCs in each RMC will vary, depending on the specific repair requirements and
1 Regional Maintenance Working Group Tidewater Calibration Consolidation Study Team Re- port, May 1994.
2 Graphics adopted from the Brief to the BRAC Commission Staff presented by RADM Jim Taylor, Chairman, Maintenance Support Quality Management Board, 21 December 1994.
E-l

capabilities in that region. The Naval Capabilities (NAVCAP) model and product-focused database provide the means to identify common products, processes, skills, equipment, and capacities throughout the Navy. The NAVCAP database, which includes both intermediate and depot-level information, con- tains detailed maintenance capability and capacity data on a product-by-product basis. These data are used in business case analyses to determine the efficacy of establishing RRCs for specific workload categories. Based on the results of these analyses, RRCs may be established in stand-alone facilities or co-located with an industrial hub. For example, the Calibration RRC and Material Engineering RRC for the Mid-Atlantic region are located in stand-alone facilities that were for- merly occupied by the NADEP, and the Motor Rewind RRC is co-located with the NSY.
Eliminate excess infratstructure
• Improve maintenance processes
• Integrate supply and maintenance
• Ensure ADP compatability
• Consolidate maintenance training
• Preserve:
• SYSCOM technical control
• Life cycle support
• Responsiveness
• Fleet readiness
Regional Maintenance Center
Figure E-1. RMC Objectives
E-2

Pacific Northwest RMC
Western Pacific RMC
ortheast RMC
Pearl Harbor RMC
Pacific Fleet
Pearl Harbor San Diego Pacific Northwest Western Pacific
Mid Atlantic R\1C fr
Southeast RMC
V Ingleside RMC
Atlantic Fleet
Northeast Mid Atlantic Southeast Ingleside
Figure E-2. RMC Locations
Implementation Plan
The CNO has approved the following RMC implementation plan.3
♦ Phase One (FY95 to FY96)
► identify/establish RMC and RRC prototypes
► consolidate/integrate intermediate maintenance functions
► right-size engineering technical support
► regionalize integrated supply operations
♦ Phase Two (FY96 to FY99)
► consolidate/integrate intermediate and depot maintenance functions
► establish remaining RMCs and RRCs
♦ Phase Three (FY97 to FY99)
3This plan is addressed in NAVOP June 1994 (CNO 282136Z March 1994).
E-3

develop unified maintenance policies/processes
adopt common business practices
integrate management information systems
Organizational Precepts
The following RMC organizational precepts have been approved by the At- lantic and Pacific Fleet Commanders in Chief (CINCs).4
♦ single regional maintenance point of contact
♦ regional industrial consolidation
♦ integrated civilian and military workforce
♦ common management information systems
♦ dual reporting by maintenance commanders
► Fleet Commanders exercise operational/fiscal control
► Systems Commanders retain technical authority
Prototype Activities
RMC prototypes were established in the Mid-Atlantic and Pacific Northwest regions on 1 October 1995.
♦ Mid Atlantic RMC
► Norfolk Naval Shipyard will be the industrial hub
► RRCs will initially be established for the following processes:
♦ electric motor repair
♦ calibration services
♦ materials testing
♦ pump repair and test
♦ machining
4 These precepts were approved at the 15 August 1994 CINCs' Conference.
E-4

♦ avionics/electronics
♦ gas turbine engines
♦ diving/underwater welding
♦ foundry/forging
♦ Pacific Northwest RMC
► Puget Sound Naval Shipyard will be the industrial hub
► RRCs will initially be established for the following processes:
♦ pump repair and test
♦ circuit breaker repair
♦ periscope repair
♦ pump prime mover
♦ calibration services
♦ valve repair
♦ automatic test equipment repair
Implementation Planning and Oversight
A Regional Maintenance Implementation Board (RMIB) has been estab- lished to oversee RMC implementation. The RMIB is chaired jointly by the At- lantic and Pacific Fleet Maintenance Officers (FMOs) and includes representatives of the major Navy commands involved with regional mainte- nance. It has overall responsibility for reengineering Navy and Marine mainte- nance processes, defining and developing RMC business policies and standard operating procedures, and ensuring uniform RMC implementation in both Fleets.
Management Structure
The Navy has developed an Integrated Fleet Maintenance Model (IFMM) to describe how maintenance work is planned and executed at all levels.5 The IFMM is currently being used to evaluate alternative RMC management struc- tures in order to ensure that all applicable maintenance processes and interfaces
5 Integrated Fleet Maintenance Working Group, Integrated Fleet Maintenance Model, February 1994.
E-5

are addressed. Although the evaluation process has not yet been completed, current plans call for establishing the Mid-Atlantic and Pacific Northwest RMC prototypes as direct and mission-funded activities that report directly to their re- spective FMOs.6
Automated Information System Support
The Navy has historically used a variety of stand-alone automated informa- tion systems (AIS) to support specific elements of its intermediate and depot maintenance programs, but currently none of these systems can support an RMC environment. Consequently, the Navy has initiated an intensive effort to inte- grate existing AIS capabilities in order to achieve adequate functionality to en- compass all applicable maintenance processes in the IFMM.
Projected RMC Benefits
By streamlining shore-based maintenance operations and eliminating excess maintenance capabilities, establishing the RMCs will result in significant cost savings even though it may incrementally lengthen some I-Level RCTs and, thereby, slightly increase associated inventory requirements. Although it would be premature to project the overall magnitude of savings at this time, the initial results of prototype consolidations are very encouraging. For example, estab- lishing the Mid-Atlantic Calibration RRC consolidated 32 separate calibration laboratories into one main laboratory with three satellites and reduced the asso- ciated staffing level from 333 to 191/ Similarly, establishing the Mid Atlantic Motor Rewind RRC consolidated nine repair activities into one and reduced the associated staffing level from 167 to 62.8 In addition, integration of supply and maintenance in the Mid-Atlantic RMC has already reduced inventory and expe- dited repair cycles.
Potential Problem Areas
While the general consensus is that the Navy must streamline its mainte- nance infrastructure, there is a broad diversity of opinions on specifically what changes are required and how fast those changes should be implemented. In particular, serious concerns have been raised about RMC ownership and fund- ing. These concerns focus primarily on whether fleet readiness will be enhanced or degraded by dramatic changes in existing maintenance management policies and procedures. For obvious reasons, the ownership issue is highly contentious, but the funding issue may involve more significant readiness implications.
6 Memorandum for Budget Submitting Offices, Guidance for the Preparation and Submis- sion ofFY 1997 Budget Estimates for the Department of the Navy (DON) Budget and Apportion- ment Review, Navy Comptroller, FMB-3/BG 95-6, July 1995.
7 Mid-Atlantic Regional Maintenance Center Development and Operations Plan, January 1995.
8 Ibid.
E-6

Although it might initially seem most appropriate to operate RMCs as mission- funded activities, the Defense Business Operating Fund (DBOF) provides finan- cial flexibility and continuity that are virtually essential for efficient industrial operations. Consequently, some combination of mission funding and DBOF funding for RMCs will probably be required.
Summary
Establishing RMCs provides an extraordinary opportunity to make Navy maintenance support more cost-effective by breaking down some of the barriers that have historically separated the aviation, surface warfare, and submarine communities. However, fundamental reengineering of existing maintenance management processes is necessary so that such a radical change can be success- ful. This reengineering effort is currently underway and making rapid progress, but several major issues (e.g., integrated AIS support, ownership, and funding) still must be resolved.
E-7

APPENDIX F
Army Regional Maintenance
The Army has developed a regional maintenance concept for sustainment maintenance (see Figures F-l and F-2) (all maintenance conducted on Army equipment above the direct support level). A proof of principle (PoP) of the gen- eral support (GS) piece (with some wholesale involvement) of the concept was conducted at Forts Carson, Hood, and Riley; the regional maintenance manager is located at Fort Hood in the 13th Corps Support Command. The Army believes the PoP was successful and has now expanded the original region to include Forts Bliss and Sill and the National Training Center. An additional region is be- ing established in the 18th Airborne Corps; the regional maintenance manager will be located in the 1st Corps Support Command at Fort Bragg.
Fort Carson
Fort Irwin
-m 111
il
Fort Sill
Fort Bliss
S!—!
liBlIR^Jia ^M
Fort Riley
■Ilk
RSSM 13th COSCOM
Fort Hood
Fort Hood
V
&
if? v
§
Figure F-1. Ill Corps Region
F-l

Fort Drum
1 RSMM 1 IstCOSCOM 1 Fort Bragg
Fort Campbell Mi • j Fort Bragg"
Fort Polk Fort Stewart
«»-
Figure F-2. XVIIIth ABN Corps Region
The Army's regional maintenance concept focuses on centralized manage- ment and decentralized execution. The goal of regional maintenance is to maxi- mize repair capability while providing the same or improved readiness at reduced costs. Through resource allocation, workload distribution, and decen- tralized execution of maintenance work, the concept seeks to maximize repair ca- pabilities and optimize use of available resources.
A wide variety of Active and Reserve Component GS maintenance units, nondivisional aviation intermediate maintenance units, Installation Directorate of Logistics (DOLs) maintenance activities, and contractors perform this level of maintenance and, in varying degrees, were involved in the PoP. Local sustain- ment maintenance managers (LSMMs) drawn from each installation's DOL op- erated the local repair programs and managed workloads assigned to the GS activities in their geographic areas. The Regional Sustainment Maintenance Manager (RSMM) located in the Materiel Management Center, managed and set priorities for workload in the region.
The Army uses the Production, Planning, and Control (PP&C) process at the local and regional levels as a major tool to plan and control sustainment mainte- nance requirements and performance. At the local level they use the PP&C proc- ess to review and adjust current year production programs and to identify the requirements for the following fiscal year. The LSMM develops the following year program, based on requirements from supply managers, for all the sustain- ment maintenance activities in the assigned geographical area. They consider all
F-2

of their requirements against their capacity and capability and forwards the pro- gram to the region. The LSMM indicates what work he can execute and high- lights those areas in which he cannot execute his program for lack of capability or capacity and, conversely, those areas which have excess capacity that can be used for regional programs. The RSMM, and representatives from each of the LSSMs use the PP&C process to review each Installation's program, makes ad- justments, and then issues a workload directive to each LSSM to execute the ap- proved program.
Within a region, many of the field-level reparables on the installation repa- rable exchange list are common to more than one installation. Multiple installa- tions repair the same item; a single installation repairs the common item because the others either lack the capacity or capability or do not generate enough assets to justify establishing a repair program, or none of the installations repair the item for lack of capacity or capability or lack of volume to justify establishing a repair program.
Under the regional maintenance concept and for those common or potential common items, each installation will bid (repair parts and labor only) on per- forming all or most of the regions work for that item. The work may be split among installations for many reasons, but the prime reason is a training require- ment. These bids are reviewed during a regional PP&C for readiness impacts, cost avoidance, and annual demands. Based on the review process, they develop a prioritized list of items that will be repaired on a regional basis, designate in- stallations to be Centers of Technical Excellence (CTE), and assign them all or most of the regions workload for a particular item.
Under the regional maintenance concept, installations in the region can use an almost full cost methodology (parts, labor, general and administrative (G&A), and overhead but not deprecation) to set rates and submit bids for selected re- pair tasks. These tasks involve items that the wholesale (National) item manag- ers must have repaired, but, for many reasons, they cannot satisfy their requirements through any other means.
The Army believes that the efficiencies gained through managing reparables on a centralized and integrated basis have clearly been demonstrated. The fol- lowing are the key indicators:
♦ With only one or two isolated anomalies, weapons system readiness rates have been sustained at a level equal or higher than rates before regionaliza- tion.
♦ Initially, the regional manager approved 65 prime national stock numbers (NSNs) for repair by the CTE. Based on the success of this concept and with all participants agreeing, the number of reparables worked by the CTE grew to 150 by the end of the 9 months PoP and now includes 343 items.
♦ The final PoP evaluation report states that the actual net production savings (actual labor and parts costs versus preregionalization labor and parts cost)
F-3

for repair of 1,553 items totaled $723,870. Furthermore, the Army analysis of the original 65 CTE prime NSNs, which factored in additional criteria such as maximizing repairs and minimizing procurement, projected a po- tential cost avoidance of $4,440,000. The report also states that the extrapo- lation of those data to the entire regional repair program identified a potential annual cost avoidance of $11,400,000.
♦ Many of the wholesale item managers who have participated in the regional program have been very impressed with the concept, and, currently, whole- sale directed items are being worked at the regional CTE.
Because of a color of money problem (some installations reparables are funded under a retail stock fund and others are funded with O&M), the CTE process has developed into a CTE repair and return to the originating installa- tion process. Under this procedure, the unit turns in the unserviceable to the ex- change point at its installation where it is processed to the DOL, and the DOL documents it and forwards it to the transportation office. The transportation of- fice packages it and makes the shipping arrangements. The item is then shipped to the CTE installation. At the CTE installation, it is repaired and shipped back to the originating installation for processing to supply, where it is put on the shelf.
Even using premium transportation, the transportation turn-around time is long. Among the installations involved in the region at the end of May 1995 (Forts Carson, Hood, and Riley), the transportation turn-around times have aver- aged a low of 16 days from Fort Carson to Fort Riley and return to Carson to a high of 39 days from Fort Carson to Fort Hood and return to Carson. The trans- portation times added to the average 37 days it takes to process and repair an item at the CTE result in a long repair cycle time. This situation is partially ne- gated by the fact that the region uses a standard 25 days — in some cases 30 days — RCT in calculating order and shipping time (OST). To help solve the transportation problem, the region was directed, in June 1995, to ship all items under 150 pounds by Federal Express. Since approximately 75 percent of all CTE items meet this criterion, there should be a major reduction in the turn-around times. An independent evaluator will conduct a cost-effectiveness analysis on this initiative. The regional and local managers are working on ways to further reduce the overall RCT.
With the actual RCT averaging between 53 to 76 days, and the region using a standard of 25 to 30 days to compute OST driven stock levels, at some point stocks will be depleted, and the procedure will have an impact on readiness. Once the excess stocks are consumed, the only alternatives available will be to use actual RCT in the OST computation and drive up the requirements objective, or drive down the actual RCT to match the 25 - 30 day standard. Reducing the actual RCT seems to be the least costly.
The ultimate goal of the regional maintenance program is to fund all the stocks under the retail stock fund. When this goal is reached, the items will not be returned to the originating installation but will be repaired and put on the shelf at the CTE installation.
F-4

While the Army is currently operating one expanded region (Forts Carson, Bliss, Hood, Riley, Sill, and the National Training Center, Reserve Components, and contractors) and establishing a region in 18th Airborne Corps, the overall di- rection is to expand the regional maintenance concept over the entire Army.
F-5

APPENDIX G
Glossary
AFB
AFTO
AIMD
AIS
ALC
ALOC
AQRA
ASL
ASO
ATLASS
AVCAL
AWP
BCM
BOM
BRAC
CAMS
CINC
CLD
CNO
CONUS
COSAL
Air Force Base
Air Force Technical Order
aircraft intermediate maintenance departments
Automated Information System
Air Logistics Center
Air Lines of Communication
average quantity repaired annually
Authorized Stockage List
Aviation Support Office
Asset Tracking for Logistics and Supply System
aviation coordinated allowance list
awaiting parts
beyond the capability of maintenance
bill of materials
base realignment and closure
Core Automated Maintenance System
Commander in Chief
critical low density
Chief of Naval Operations
Continental United States
coordinated shipboard allowance list
G-l

COSBAL = coordinated shore-based allowance list
COSCOM = core support command
CSIS = Central Secondary Item Stratification
CTE = Center of Technical Excellence
DA = Department of the Army
DBOF = Defense Business Operations Fund
DCSLOG = Deputy Chief of Staff for Logistics
DDR = daily demand rate
DIFM = due-in-from-maintenance
DLA = Defense Logistics Agency
DLR = depot-level reparable
DoD = Department of Defense
DoL = Director of Logistics
DOP = designated overhaul point
DOS = days of supply
DRMO = Defense Reutilization and Marketing Office
DS = direct support
DS4 = direct support unit standard supply system
EOQ = economic order quantity
ERO = equipment repair order
EXREP = expedited repair
FEDLOG = Federal Logistics Data on CDROM
FILL = Fleet Issue Load List
FISC = Fleet Industrial Support Center
G-2

FLR = field-level reparables
FMF = Fleet Marine Force
FMO = Fleet Maintenance Officers
FSSG = Force Service Support Group
FTE = report of excess
FTR = report of excess response
F4 = fiscal year
GS = general support
HQ = Headquarters
I-Level = intermediate level
ICP = inventory control point
IFMM = Integrated Fleet Maintenance Model
IM = item manger
IMA = intermediate maintenance activity
ISSD = Installation Supply Support Division
IUP = item unit price
LORA = level of repair analysis
LRU = line replaceable unit
LSMM = local sustainment maintenance manager
MA-RMC = Mid-Atlantic Regional Maintenance Center
MALS = Marine Aviation Logistics
MCLB = Marine Corps Logistics Base
MFR = maintenance failure rate
MIMMS = Marine Corps Integrated Maintenance Management System
G-3

MMC = Materiel Management Center
MOAL = mount-out allowance
MRP = material requirement planning
MRSP = Mobile Readiness Spares Package
MTTR = mean time to repair
NADEPS = Navy Aviation Depot
NALCOMIS = Naval Aviation Logistics Command Man Information System
NAVCAP = Naval Capabilities
NCQ = NRTS/condemned quantity
NCT = condemned time
NMC90 = number of maintenance cycles in 90 days
NRFI = not ready for issue
NRTS = not reparable this station
NSN = national stock number
NSO = numerical stock objective
NYS = Naval Shipyard
O&M = Operations and Management
OCONUS = outside CONUS
OL = operating level
OLT = operating level time
OSI operational support inventory
OSR = order and shipping time requirement
OST = order and shipping time
OSTQ = order and shipping time quantity
G-4

PBR = percent base repair
PM = program manager
PoP = proof of principle
PP&C = Production, Planning, and Control
RCDL = repair cycle demand level
RCL = repair cycle level
RCQ = repair cycle quantity
RCR = repair cycle requirement
RCT = repair cycle time
RFI = ready for issue
RIMCS = Reparable Item Movement Control System
RIP = reparable issue point
RMC = Regional Maintenance Center
RMIB = Regional Maintenance Implementation Board
RO = requisitioning objective
RPF = I-Level Repair over one maintenance cycle
RPQ = raw pool quantity
RR = repair rate
RRC = regional repair center
RSMM = regional sustainment maintenance manager
RTAT = repair turn-around time
SAILS = Standard Army Intermediate Level Supply
SAMS = Standard Army Maintenance System
SARSS = Standard Army Retail Supply System
G-5

SARSS-0 = Automated retail supply system
SASSY = Supported Activities Supply System
SBSS = Standard Base Supply System
SDR = secondary depot reparables
SF = stock funded
SHORCAL = shore coordinated allowance list
SIMA = Ship Intermediate Maintenance Activity
SL = safety level
SLQ = safety level quantity
SMU = SASSY management unit
SRA = special repair authority
SRF = Ship Repair Facility
SRU = shop replaceable unit
SSA = supply support activity
SSC = supply support center
SUAPS-RT = Shipboard Uniform Automated Data Processing System-Real RunTime
TARSLL = Tender and Repair Ship Load List
TAT = turn-around time
TDA = table of distribution and allowance
UADPS-SP = Uniform Automated Data Processing System-Stock Point
UMMIPS = Uniform Materiel Movement and Issue Priority System
UPA = units per application
USAF = United States Air Force
WIR = Reportable Item Report
G-6

REPORT DOCUMENTATION PAGE Form Approved OPM No.0704-0188
Public reporting burden for this collection of information is estimated to average 1 hour per response, including the time for reviewing instructions, searching existing data sources gathering, and maintaining the data needed, and reviewing the collection of information. Send comments regarding this burden estimate or any other aspect of this collection of information, including suggestions for reducing this burden, to Washington Headquarters Services, Directorate for Information Operations and Reports, 1215 Jefferson Davis Highway, Suite 1204, Arlington, VA 22202-4302, and to the Office of Information and Regulatory Affairs, Office of Management and Budget, Washington, DC 20503.
1. AGENCY USE ONLY (Leave Blank) 2. REPORT DATE
Jun96
3. REPORT TYPE AND DATES COVERED
Final
4. TITLE AND SUBTITLE
Intermediate-Level Repair Cycle Management: Supply and Maintenance Process Improvements
6. AUTHOR(S)
Larry Klapper, Robert Jordan, William McGrath
7. PERFORMING ORGANIZATION NAME(S) AND ADDRESS(ES)
Logistics Management Institute 2000 Corporate Ridge McLean, VA 22102-7805
9. SPONSORING/MONITORING AGENCY NAME(S) AND ADDRESS(ES)
Deputy Under Secretary of Defense (Logistics) The Pentagon, Room 3E114 Washington, DC 20301
5. FUNDING NUMBERS
MDA903-90-C-0006
PE 0902198D
8. PERFORMING ORGANIZATION REPORT NUMBER
LMI- LG406RD1
10. SPONSORING/MONITORING AGENCY REPORT NUMBER
11. SUPPLEMENTARY NOTES
12a. DISTRIBUTION/AVAILABILITY STATEMENT
A: Approved for public release; distribution unlimited
12b. DISTRIBUTION CODE
13. ABSTRACT (Maximum 200 words)
Supply organizations that directly support personnel who maintain operational weapon systems rely on Intermediate Level (I-Level) maintenance as the major source of resupply for both line replaceable and shop replaceable (LRU and SRU) reparable assemblies. The time that it takes to repair these items once they are removed from the weapon system (or next higher assembly) is called the I-Level repair cycle time (RCT).
The length of the RCT has the greatest influence on the inventory investment at the retail level. The longer the RCT, the more serviceable assets the services must stock locally so that, when an unserviceable is removed from a weapon system, a serviceable can be immediately issued. This procedure reduces weapon system downtime.
We estimate that the retail inventory investment to support the I-Level RCT pipeline exceeds $1.2 billion. Based upon our observations, we believe that I-Level RCT is longer than it should be. DoD policy forbids including awaiting parts (AWP) time when measuring RCT because the probability of a similar delay occurring each time is low. When AWP is included, inventory requirements increase. Then, when the parts problem is solved and RCT returns to normal, excess inventory exists. Only the Air Force currently excludes AWP time when measuring and using I-Level RCT. Also, any wasted time that exists from the time an item fails to the time it is restored to working condition and placed back on supply shelves adds to RCT and, therefore, needlessly increases inventory requirements.
The Military Services can significantly improve I-Level maintenance RCTs through a series of policy and procedural changes.
14. SUBJECT TERMS
Maintenance, supply, repair, cycle-times, logistics, retail
15. NUMBER OF PAGES
96
16. PRICE CODE
17. SECURITY CLASSIFICATION OF REPORT
Unclassified
18. SECURITY CLASSIFICATION OF THIS PAGE
Unclassified
19. SECURITY CLASSIFICATION OF ABSTRACT
Unclassified
20. LIMITATION OF ABSTRACT
UL
NSN 7540-01-280-5500 Standard Form 298, (Rev. 2-89) Prescribed by ANSI Std. 239-1B 299-01