Embed Size (px)
Citation preview
Abundance and Distribution of Wolverine in the
Kootenay Region
2014 Field Season Report: Central Selkirk
Mountains
Prepared For:
Ministry of Forests Lands and Natural Resource Operations, Columbia Basin Trust
and Fish and Wildlife Compensation Program- Columbia
Prepared By:
Doris Hausleitner, M.Sc., R.P. Bio.
and
Andrea Kortello M.Sc., R.P. Bio.
Seepanee Ecological Consulting
December 2014
1
Executive Summary
Wolverine (Gulo gulo) is a species of conservation priority provincially and nationally
and is harvested regionally, yet no inventory has been conducted to estimate population
abundance and connectivity in the southern portion of the Kootenays. Thus, a non-
invasive genetic study and collection of trapper carcasses was initiated in the southern
Columbia Mountains in 2012 with the objectives of estimating abundance and assessing
meta-population connectivity to inform harvest management and contribute to
international conservation efforts. Inventory was conducted in the south Selkirk (2012),
south Purcell (2013) and central Selkirk Mountains (2014). This report summarizes
results in the central Selkirk Mountains from 2014. Estimates of occupancy (71%) were
higher than in the south Selkirk (54%) and south Purcell mountains (38%). Our estimates
of population size in the central Selkirk Mountains (19; CI 16-24) were lower than
previously published habitat-based values. We also found evidence of poor genetic
connectivity between sub-ranges within our study. Annual harvest appears to constitute a
high proportion of our estimated population. Given this, the low abundance levels, and
the evidence of genetic isolation, the sustainability of the population may be in question.
2
Table of Contents Executive Summary ............................................................................................................ 1 List of Figures ..................................................................................................................... 3 List of Tables ...................................................................................................................... 3
Introduction ......................................................................................................................... 4 Methods............................................................................................................................... 5 Study Area .......................................................................................................................... 5 Survey methods ................................................................................................................... 5 Results ................................................................................................................................. 9
Discussion ......................................................................................................................... 13
Recommendations ............................................................................................................. 15 Acknowledgements ........................................................................................................... 17 Literature Cited ................................................................................................................. 18

3
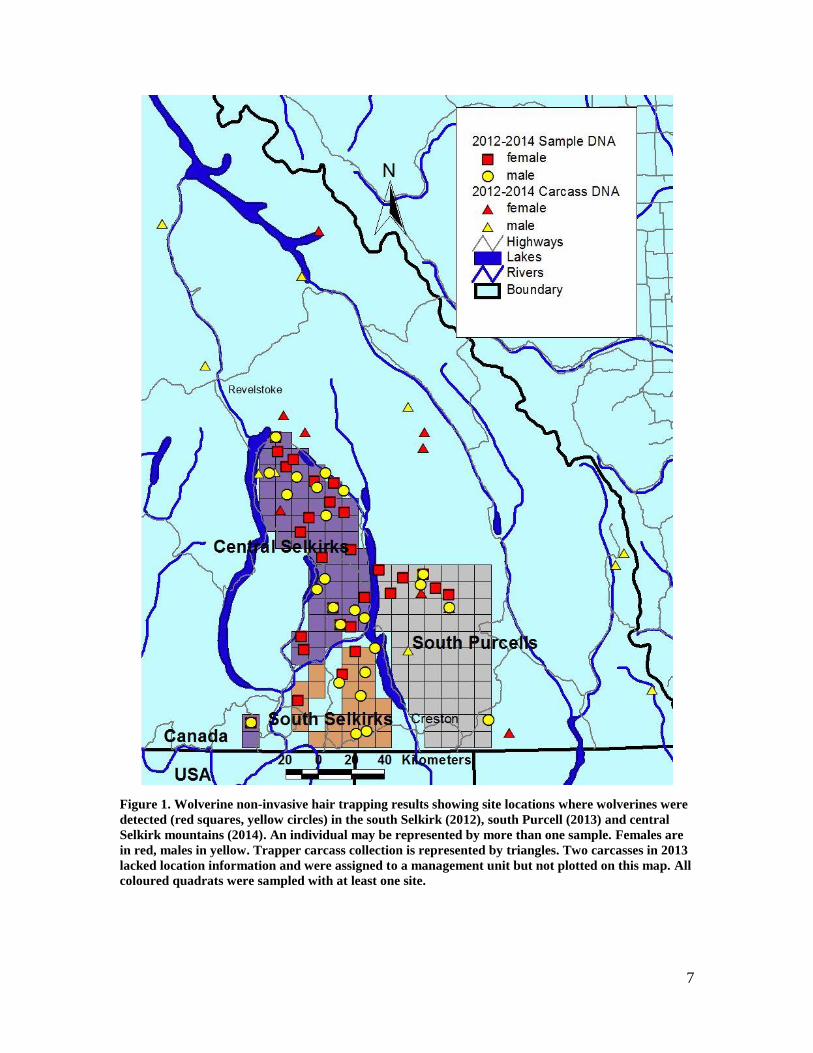
List of Figures Figure 1. Wolverine non-invasive hair trapping results showing site locations where wolverines were
detected (red squares, yellow circles) in the south Selkirk (2012), south Purcell (2013) and central Selkirk mountains (2014). An individual may be represented by more than one sample. Females are in red, males in yellow. Trapper carcass collection is represented by triangles. Two carcasses in 2013 lacked location information and were assigned to a management unit but not plotted on this map. All coloured quadrats were sampled with at least one site. ................................................... 7
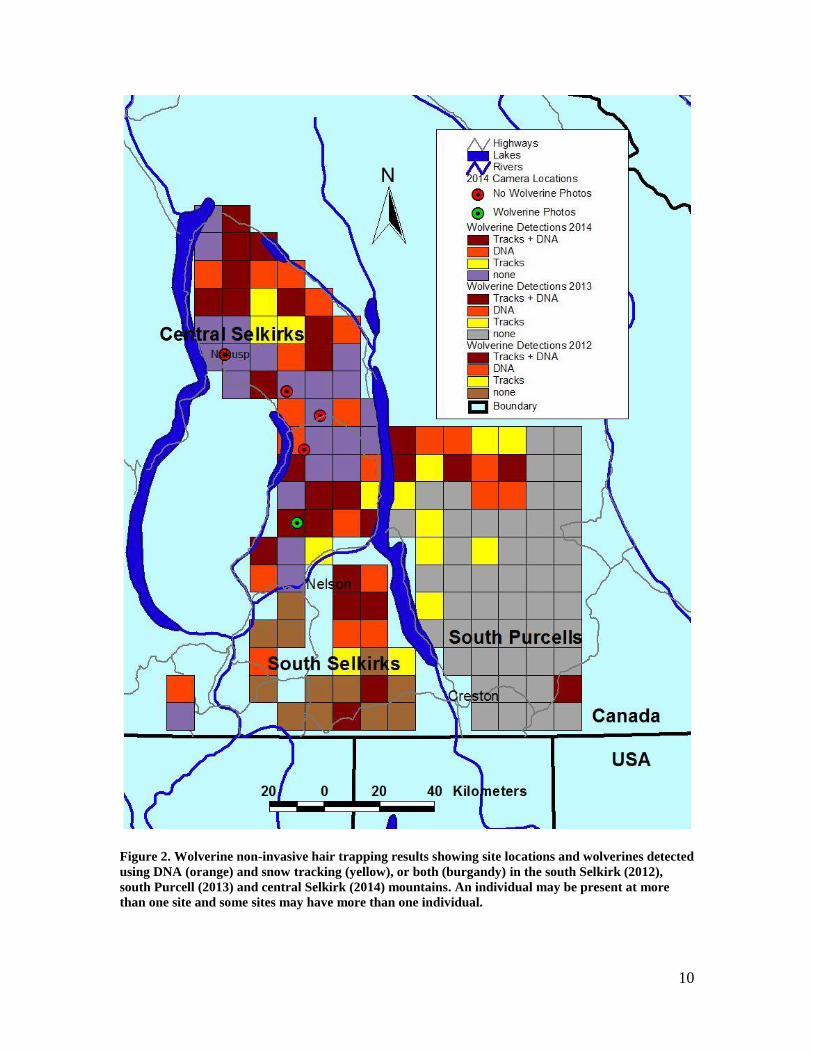
Figure 2. Wolverine non-invasive hair trapping results showing site locations and wolverines detected using DNA (orange) and snow tracking (yellow), or both (burgandy) in the south Selkirk (2012), south Purcell (2013) and central Selkirk (2014) mountains. An individual may be present at more than one site and some sites may have more than one individual. ............................................... 10
Figure 3. Principal Components Analysis (PCA) of 31 wolverine genetic samples from the 3 intensively sampled populations in southeastern British Columbia; central Selkirks (CS), south Purcells (SP), and south Selkirks (SS). ................................................................................................................. 13
List of Tables Table 1. Ranking for models of occupancy (ψ) and detectability (p) for track and genetic data of
wolverine in the central Selkirk Mountains in 2014. Models were developed in Program PRESENCE and compared using AICc weights of evidence (Burnham and Anderson 1998). Δ AICc is the difference between a given model and the model with the lowest AICc
a score, AICc weight (wi)
reflects the relative support for each model, K is the number of parameters estimated by the model. .......................................................................................................................................... 11
Table 2. Comparison of genetic-based and habitat-modeled population estimates (N) and annual harvest for wolverine populations in the south Selkirk, south Purcell and central Selkirk mountains. ................................................................................................................................... 12
4
Introduction
Wolverine (Gulo gulo) is a species of conservation priority provincially and nationally
(BC CDC 2013, COSEWIC 2003) and is classified as Identified Wildlife under the Forest
and Range Practices Act (MWLAP 2004). Population estimates for British Columbia
have been derived from habitat modeling based on mark-recapture in the Omenica and
Northern Columbia Mountains (Lofroth and Krebs 2007) but lack verification for much
of the province, including the southern portion of the Kootenays. Considering that
adjacent U.S. populations are known to be at critically low levels (USFWS 2013), with
wolverine absent from much potentially viable habitat, reliable abundance estimates are
crucial for species conservation in the region.
In the Kootenays, wolverine populations are characterized by small and declining fur
yields (~8 pelts/year) and harvest rates in parts of the region may be unsustainable
(Lofroth and Ott 2007). Populations with high connectivity are resilient to local
overharvest or high mortality from other sources because of source/sink dynamics
(Pulliam 1988). Although genetic evidence indicates increasing population fragmentation
in a north to south gradient in B.C. (Cegelski et al. 2006), the extent of gene flow
between neighboring ranges in the southern Kootenay region is unknown. Hence,
assessing connectivity is important to local population resilience and evaluating harvest
sustainability.
Barriers to dispersal include transportation routes, hydroelectric and residential
development and land use changes (Gardner et al. 2010, Krebs et al. 2007, Slough 2007,
Austin 1998). Similarly, wolverine habitat use and density are associated negatively with
winter recreation, forest harvest, and positively with roadless areas (Fisher et al. 2013,
Krebs et al. 2007). Mapping occupied habitat in the Kootenays and identifying factors
contributing to the persistence of wolverine in these areas is an essential step to
identifying where conservation efforts to improve habitat and connectivity should be
focused. Additionally, the Kootenay region is one of only a few areas identified as a
potential corridor for trans-boundary movement of wolverine into the US (McKelvey et
al. 2011, Schwartz et al. 2009, Singleton et al. 2002). Such movement is critical for the
persistence of US populations, and this project will provide vital information for
wolverine conservation in the trans-boundary region.
Project objectives were to: (1) assess occupancy/abundance of wolverine in the central
Selkirk Mountains; (2) assess genetic connectivity between the Selkirk and Purcell
populations; (3) evaluate current harvest levels; (4) evaluate broad-scale habitat factors
that are associated with wolverine presence and; (5) cooperate inter-jurisdictionally for
wolverine research.
5
Methods
Study Area
The study area was within the central Selkirk mountain range within the Central
Columbia Mountains Ecosection in the southern Interior Mountains Ecoprovince. It was
bounded to the east by Kootenay lake and Highway 31, to the north by the Lardeau
Valley and Trout lake, to the west by Upper Arrow Lake and Slocan Valley and the west
arm of Kootenay lake and Highway 3A to the south (Figure 1). Major land use in this
area was historically mining and forestry and currently there is an expanding recreation
element. Several winter use tenures for ski-based operations exist within the study area.
Two provincial parks Goat Range Provincial Park (78,947 ha) and Kokanee Glacier
Provincial Park (32,035 ha) are within this area. Starting in the valley bottom and
progressing to the mountain peaks, biogeoclimatic ecosystem classification (BEC) units
present are: Interior Cedar-Hemlock dry warm variant (ICHdw1), Interior Cedar
Hemlock moist warm variant (ICHmw2), Engelmann Spruce Subalpine Fir wet, cold
variant (ESSFwc1, ESSFwc4), Engelmann Spruce Subalpine Fir wet cold woodland
(ESSFwcw), and Engelmann Spruce Subalpine Fir wet cold parkland (ESSFwcp).
At lower elevations the forest is composed of western redcedar (Thuja plicata) and
western hemlock (Tsuga heterophylla) interspersed with Douglas fir (Pseudotsuga
menziesii), lodgepole pine (Pinus contorta), trembling aspen (Populus tremuloides) and
western larch (Larix occidentalis). The shrub layer consists of Douglas maple (Acer
glabrum), false box (Paxistima myrsinites), thimbleberry (Rubus parviflorus) and beaked
hazelnut (Crotylus cornuta). False solomon seal (Maianthemum racemosum), horsetail
(Equisetum spp.) and sedges (Carex spp.) made up the herbaceous layer in the mid-
elevation forests). At higher elevations Englemann spruce (Picea engelmannii) and
subalpine fir (Abies lasiocarpa) are the main tree species. Main shrubs include black
huckleberry (Vaccinium membranaceum) false azalea (Menziesia ferruginea), white
rhododendrum (Rhododendrum albiflorum) and heather (Cassiope spp.).
Survey methods
The central Selkirk Mountains study area was partitioned into 10 by 10 km cells that
approximate the minimum size of a female home range. These 56 quadrats were sampled
twice in approximately 21 day sampling intervals, from 10 February to 7 April, 2014
(Figure 1). Within 7 of these quadrats, we sampled two sites. Additionally, two sites from
the south Monashee region were sampled in 2014 (24 November-31 January). Because of
the rugged nature of the terrain, sites within cells were selected for ease of access by
6
helicopter, snow machine or skis, using local knowledge of wildlife movements when
available. Hair trap sites were created by affixing a bait item (beaver or deer quarter or
deer head) to a tree approximately two meters from the ground or snow surface to entice
the animal to climb (Fisher 2004). The bait item was nailed to the tree and the tree
wrapped several times in barb wire to capture hair. During each check, the barb wire was
examined for hairs or hair tufts, and the bait replenished if necessary. Hair was collected
with forceps and stored in paper envelopes in a dry environment. We utilized three
Rencoynx Rapidfire trail cameras (Reconyx Inc., Holmen, WI) and two Bushnell Trophy
cameras (XLT Model No. 110456) during the sampling period. The Bushnell Trophy
cameras were set to take 30-60s video.
Additionally, we collected genetic samples from wolverine carcasses obtained by
trappers. From each carcass a tissue sample was taken and carcasses were necropsied by
Ministry of Forests Lands and Natural Resource Operations.
Genetic Analysis
Six hundred and sixty two hair, tissue and scat samples were submitted to Wildlife
Genetics International (WGI) in Nelson B.C. for genetic identification analysis. Of the
hair samples submitted, 69% were sub-selected for analysis. Samples that did not contain
guard hairs or >5 underfur were screened out because of insufficient genetic material.
From the remaining samples, DNA was extracted using QIAGEN DNeasy Tissue kits,
following the manufacturer’s instructions (Qiagen Inc., Toronto, ON).
Species identification was based on a sequence-based analysis of a segment of the
mitochondrial 16S rRNA gene (Johnson and O’Brien 1997). For samples that yielded
wolverine DNA, WGI utilized multilocus genotyping, consisting of a ZFX/ZFY sex
marker, and 8 additional microsatellite markers for individual identification.
Locations of sampling sites and genetic samples were mapped in ARCVIEW 3.1 (ESRI
Inc. 1998, Jenness 2005).
7
Figure 1. Wolverine non-invasive hair trapping results showing site locations where wolverines were
detected (red squares, yellow circles) in the south Selkirk (2012), south Purcell (2013) and central
Selkirk mountains (2014). An individual may be represented by more than one sample. Females are
in red, males in yellow. Trapper carcass collection is represented by triangles. Two carcasses in 2013
lacked location information and were assigned to a management unit but not plotted on this map. All
coloured quadrats were sampled with at least one site.
8
Occupancy and abundance
We used the single-season model in program PRESENCE (MacKenzie et al. 2002) to
estimate the proportion of sample stations occupied by wolverine. A non-detection at a
surveyed site could have meant wolverine were not present at the site or that we failed to
detect an individual when it was present. PRESENCE uses a joint likelihood model to
estimate the probability of missing a species when it is present at the site (p =
detectability) and the probability that a site is occupied (Ψ = occupancy). To estimate
these parameters repeat observations need to be conducted over a period of time during
which site occupancy is assumed to be constant. In this way, a non-detection from a site
with at least one detection can be treated as a false negative and the detection probability
can be estimated.
We used both track detections (set up, and two checks) and genetic data (check 1, check
2) to estimate occupancy. For the 7 quadrats with more than one hair trap site, we
randomly selected one site for occupancy analysis. We constructed models with group
effects on occupancy and time dependence on detectability.
Estimates of occupancy can act as a surrogate for abundance for territorial species such as
wolverine when the sites sampled approximate territory sizes (MacKenzie et al. 2006).
We selected a grid resolution (10 x 10 km) that corresponded to a minimum home range
size for female wolverine.
We used the genotyped individuals from two encounter occasions (check 1, check 2) to
estimate abundance using a simple Lincoln-Peterson mark-recapture method (N = Mn/R,
where N is the estimated population size, M is the number of animals identified in the
first sampling session, R is the number of animals identified in the first session which are
recaptured in the second session and n is the total number of animals identified in the
second sampling session; Seber 1982).
Population genetics
To visualize genetic relationships amongst study areas we performed a multivariate
ordination using principal component analysis (PCA) in GenAlEx 6.5 (Peakall and
Smouse 2006, Peakall and Smouse 2012). This process finds and plots the major axis of
variation within a multidimensional data set (i.e. multiple samples and multiple loci) to
identify patterns within the data.
9
Results
During the course of the field season we monitored 56 sites in the central Selkirks and
two in the southern Monashee ranges (Figure 1). Thirteen field days were required for
setup and an additional 28 days for site monitoring. Detections of wolverine occurred at
59% of sites by snow tracking and/or genetic analysis (Figure 2). Wolverine tracks were
detected in 39% (n = 22) of quadrats and were the exclusive detection method in 5
quadrats (Figure 2). Wolverine DNA was collected at 51% (n = 29) quadrats and were the
exclusive detection method at 12 of those sites (Figure 2). At 30% percent of quadrats (17
of 56), both wolverine DNA and tracks were detected. Other carnivores detected, using
snow tracking, included wolf (Canis lupis), cougar (Puma concolor), lynx (Lynx
canadensis), and coyote (Canis latrans; Appendix 1).
We collected images using trail cameras at five sites (Figure 2) with a total monitoring
period of 5,952 hours. Species detected included American marten (Martes Americana),
stellars jay (Cyanocitta stelleri), wolverine, dog (Canis familiarus), raven (Corvus corax),
and golden eagle (Aquila chrysaetos). We detected wolverine at 1 site, in the upper
Lemon creek drainage (Figure 2). This site also provided hair samples for DNA analysis.
A second camera, apparently working, in the Silverton creek drainage failed to detect
wolverine, although wolverine DNA was obtained and evidence from the bait tree (deep
scratches) suggested considerable activity.
Genetic analysis
We obtained genetic results from 304 hair, tissue and scat samples. One hundred and
eighty-nine samples were identified by mitochondrial DNA analysis as species other than
wolverine. These species included American marten (n = 176), bobcat (n = 6), cougar (n
=2), northern flying squirrel (n = 2), short-tailed weasel (n = 2) and coyote (n = 1).
Wolverine DNA was detected at 29 of 56 sites in the central Selkirks and at one of two
sites in the southern Monashees. Eighty-four wolverine hair samples were assigned
individual identification. From the 29 sites in the central Selkirks, we were able to
identify 16 individual wolverines, 10 females and 6 males (Figure 2). At the site in the
southern Monashees, we were able to identify a male and female wolverine.
Seven wolverine carcasses (six males, one female) were submitted by the trapping
community in 2014 (Figure 1). This is in addition to four (two males, two females) and
ten (six males and four females) carcasses submitted in 2012 and 2013, respectively
(Figure 1).
10
Figure 2. Wolverine non-invasive hair trapping results showing site locations and wolverines detected
using DNA (orange) and snow tracking (yellow), or both (burgandy) in the south Selkirk (2012),
south Purcell (2013) and central Selkirk (2014) mountains. An individual may be present at more
than one site and some sites may have more than one individual.
11
Occupancy and abundance
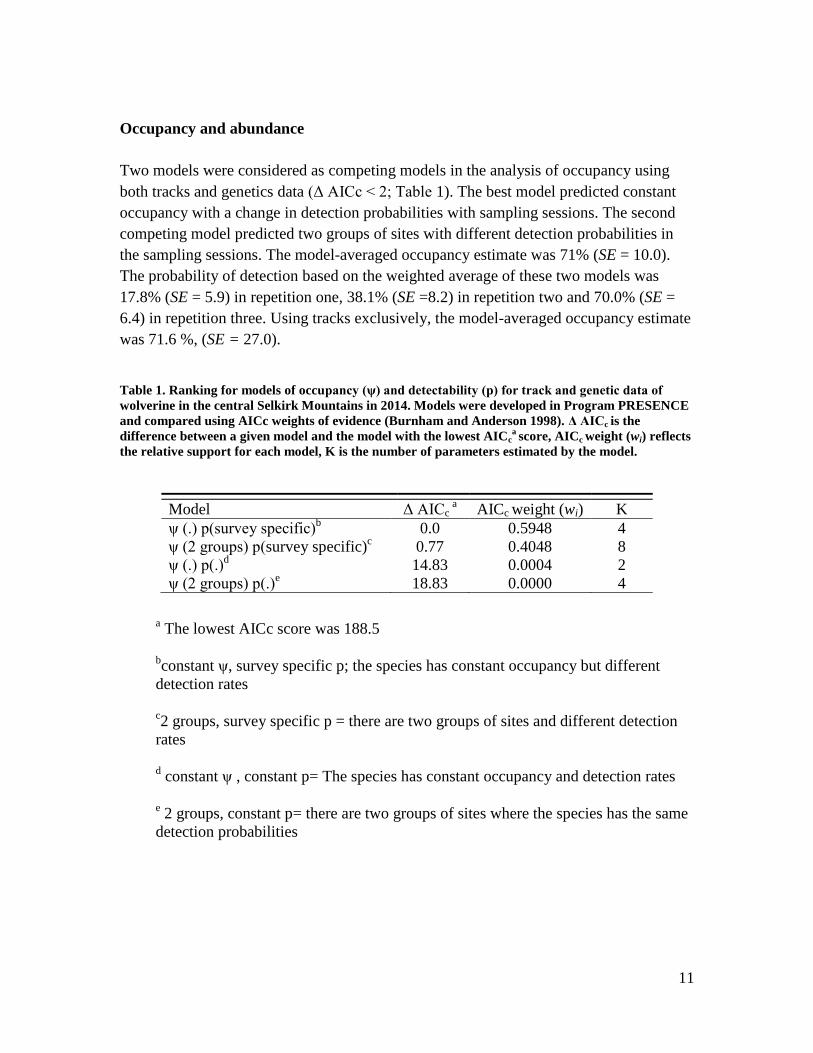
Two models were considered as competing models in the analysis of occupancy using
both tracks and genetics data (Δ AICc < 2; Table 1). The best model predicted constant
occupancy with a change in detection probabilities with sampling sessions. The second
competing model predicted two groups of sites with different detection probabilities in
the sampling sessions. The model-averaged occupancy estimate was 71% (SE = 10.0).
The probability of detection based on the weighted average of these two models was
17.8% (SE = 5.9) in repetition one, 38.1% (SE =8.2) in repetition two and 70.0% (SE =
6.4) in repetition three. Using tracks exclusively, the model-averaged occupancy estimate
was 71.6 %, (SE = 27.0).
Table 1. Ranking for models of occupancy (ψ) and detectability (p) for track and genetic data of
wolverine in the central Selkirk Mountains in 2014. Models were developed in Program PRESENCE
and compared using AICc weights of evidence (Burnham and Anderson 1998). Δ AICc is the
difference between a given model and the model with the lowest AICca score, AICc weight (wi) reflects
the relative support for each model, K is the number of parameters estimated by the model.
Model Δ AICc a AICc weight (wi) K
ψ (.) p(survey specific)b 0.0 0.5948 4
ψ (2 groups) p(survey specific)c 0.77 0.4048 8
ψ (.) p(.)d 14.83 0.0004 2
ψ (2 groups) p(.)e 18.83 0.0000 4
a The lowest AICc score was 188.5
bconstant ψ, survey specific p; the species has constant occupancy but different
detection rates
c2 groups, survey specific p = there are two groups of sites and different detection
rates
d constant ψ , constant p= The species has constant occupancy and detection rates
e 2 groups, constant p= there are two groups of sites where the species has the same
detection probabilities
12
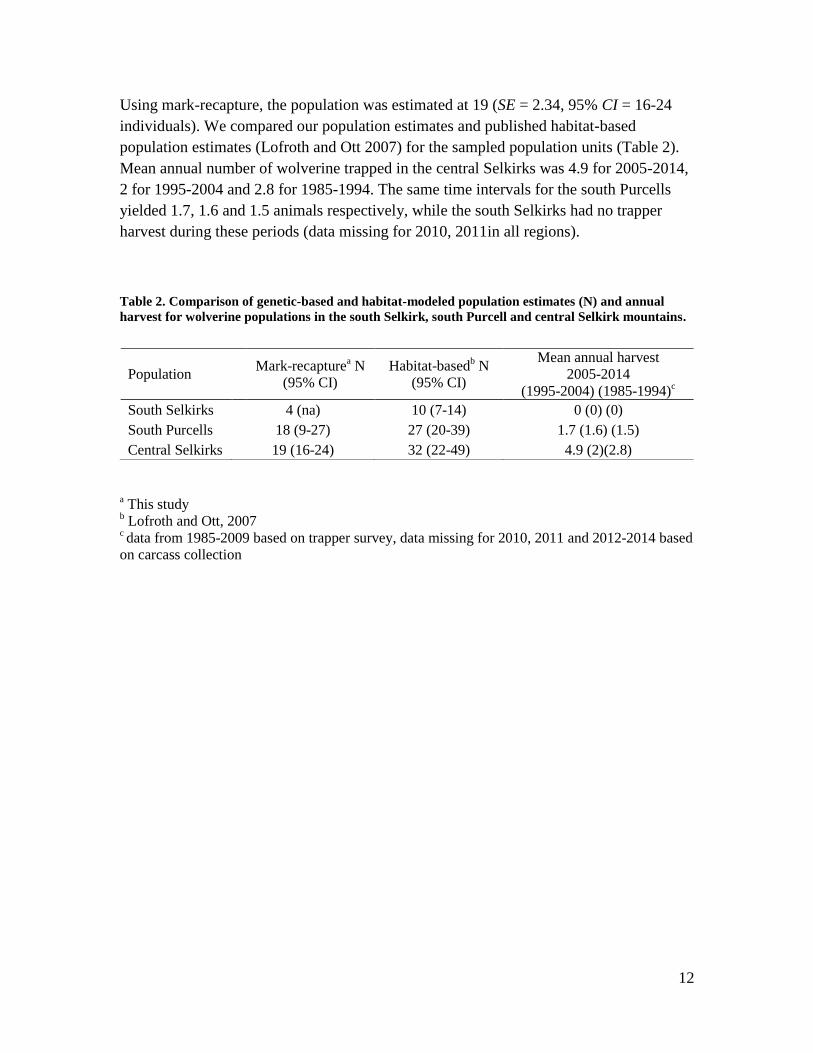
Using mark-recapture, the population was estimated at 19 (SE = 2.34, 95% CI = 16-24
individuals). We compared our population estimates and published habitat-based
population estimates (Lofroth and Ott 2007) for the sampled population units (Table 2).
Mean annual number of wolverine trapped in the central Selkirks was 4.9 for 2005-2014,
2 for 1995-2004 and 2.8 for 1985-1994. The same time intervals for the south Purcells
yielded 1.7, 1.6 and 1.5 animals respectively, while the south Selkirks had no trapper
harvest during these periods (data missing for 2010, 2011in all regions).
Table 2. Comparison of genetic-based and habitat-modeled population estimates (N) and annual
harvest for wolverine populations in the south Selkirk, south Purcell and central Selkirk mountains.
a This study
b Lofroth and Ott, 2007
c data from 1985-2009 based on trapper survey, data missing for 2010, 2011 and 2012-2014 based
on carcass collection
Population Mark-recapture
a N
(95% CI)
Habitat-basedb N
(95% CI)
Mean annual harvest
2005-2014
(1995-2004) (1985-1994)c
South Selkirks 4 (na) 10 (7-14) 0 (0) (0)
South Purcells 18 (9-27) 27 (20-39) 1.7 (1.6) (1.5)
Central Selkirks 19 (16-24) 32 (22-49) 4.9 (2)(2.8)
13
Population genetics
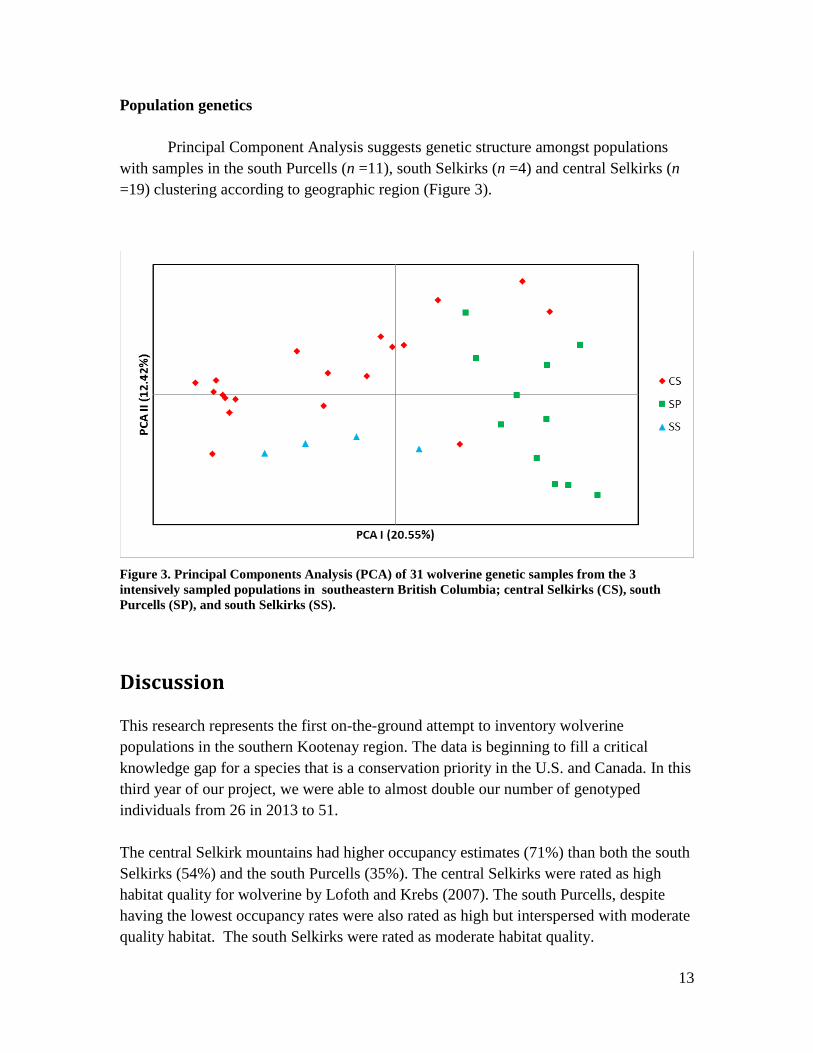
Principal Component Analysis suggests genetic structure amongst populations
with samples in the south Purcells (n =11), south Selkirks (n =4) and central Selkirks (n
=19) clustering according to geographic region (Figure 3).
Figure 3. Principal Components Analysis (PCA) of 31 wolverine genetic samples from the 3
intensively sampled populations in southeastern British Columbia; central Selkirks (CS), south
Purcells (SP), and south Selkirks (SS).
Discussion
This research represents the first on-the-ground attempt to inventory wolverine
populations in the southern Kootenay region. The data is beginning to fill a critical
knowledge gap for a species that is a conservation priority in the U.S. and Canada. In this
third year of our project, we were able to almost double our number of genotyped
individuals from 26 in 2013 to 51.
The central Selkirk mountains had higher occupancy estimates (71%) than both the south
Selkirks (54%) and the south Purcells (35%). The central Selkirks were rated as high
habitat quality for wolverine by Lofoth and Krebs (2007). The south Purcells, despite
having the lowest occupancy rates were also rated as high but interspersed with moderate
quality habitat. The south Selkirks were rated as moderate habitat quality.
14
In all sampling years, detection probability increased as the season progressed (Kortello
and Hausleitner 2012, Kortello and Hausleitner 2014). While our initial detection
probability (17.8%) is quite low, being track-based only, subsequent detection
probabilities (38.1%, 70.0%) are comparable with other studies using similar methods for
hair trapping wolverine (e.g. Fisher et al. 2013). Increases in detectability in later periods
might be attributable to increased mobility due to snow conditions, increased mobility of
denning females, and trap-happy individuals (Fisher et al. 2013).
We detected 2 wolverines using cameras in 2 years (2013 cameras located at 11 %, 7/65
sites in south Purcells and 2014 cameras at 9%, 5/56 of sites in central Selkirks).
Although this information has been useful, cameras have not been an effective tool for
calculating occupancy as we have so few on the landscape. Cameras have been shown to
improve detectability for wolverine occupancy studies in the Rocky Mountains (Fisher et
al. 2014).
Our population estimate based on mark-recapture of 19 (CI 16-24) individuals, is below
the published habitat-based estimate of population size for the central Selkirks: 32 (CI
22-49), although confidence intervals overlap (Lofroth and Ott 2007). Over the past three
seasons, our population estimates (Kortello and Hausleitner 2012, Kortello and
Hausleitner 2014) have consistently been lower than the habitat-based estimates
calculated by Lofroth and Ott (2007). However, we recognize that our non-invasive
sampling may be underestimating occurrence (Fisher et al. 2014), and our mark-recapture
estimates may be biased low because of a positive trap effect. Future analysis will model
the spatial component of capture probability (Efford and Fewster 2013) for improved
estimates.
Harvest rates in the central Selkirks are higher than both south Purcell and south Selkirks.
The average annual harvest over the last 10 years, 4.9, represents a high proportion (26%)
of our estimated population of 19 animals in the central Selkirks. Sustainable harvest of
wolverine is thought to be 10% or less (Hatler and Beal 2003) of the fall population.
Consequently, although the actual number of individuals harvested annually is quite
variable (range 0-17), and our estimate of population is preliminary, these harvest levels
may be risk-prone.
Fisher et al. (2013) found wolverine more abundant in rugged areas protected from
anthropogenic development, similarly, although most of the terrain in our study area is
quite rugged, the majority of wolverine detections (72%) have been within or
immediately adjacent (within 10 km; conservatively one female home range width) to
large protected areas; West Arm Provincial Park, Darkwoods Nature Conservancy,
Purcell Wilderness Conservancy, St. Mary’s Alpine Provincial Park, Kokanee Glacier
Provincial Park and Goat Range Provincial Park. These areas (including the 10 km
15
buffer) encompass approximately 56% of our study area. This suggests that protected
areas may be important for wolverine populations and this relationship warrants further
investigation in future analyses.
None of the individuals detected in the central Selkirks in 2014 have been detected
previously. To date we have been unable to document connectivity between south
Selkirk, central Selkirk and south Purcell populations on the basis of individual
movements. Additionally, our genetic analysis is limited by quite small sample sizes and
the number of markers used. In spite of this, visual representations of genetic relatedness
demonstrates evidence of genetic structure amongst the three subranges (south Selkirks,
central Selkirks, and south Purcells; Figure 3). This data supports other research
suggesting population fragmentation for wolverine in southeastern British Columbia
(Cegelski et al. 2006). Genetically distinct populations imply a low probability of
successful dispersal amongst ranges and consequently, if populations are in decline,
reduced potential for demographic rescue from adjacent ranges.
Recommendations
Our data, suggests lower populations than expected and, surprisingly, low connectivity
between this and other southern British Columbia populations, hence harvest should be
carefully considered and managed with trapper input. The recent provincial effort to
create a genetic database of a sample of harvested wolverine will augment the
information gathered here, by using landscape genetics to identify functional population
units, barriers and harvest sustainability at a larger scale (R. Weir 2014, pers. comm.).
Genetically structured populations point to a need for future efforts to restore
connectivity and distinctly clustered wolverine detections also allude to the possible
impact of land management practices and/or recreational access on wolverine
distribution. This needs to be investigated further.
Data for wolverine harvest in 2012-2014 has come from carcass payments and is at the
discretion of individual trappers. Ongoing, accurate harvest data is necessary to monitor
population sustainability.
Considering tracks only, we would have detected almost 60% of the total occurrences in
our occupancy modeling. Similarly, a concurrent caribou census (MLFNRO data) in the
northern part of our study area under good tracking conditions obtained almost as many
detections as our genetics work. Accordingly, when we based our occupancy estimates on

16
tracks only, rather than tracks and genetics, we produced an almost identical occupancy
rate but with higher variability, suggesting more repetitions would be necessary to
increase precision. Track surveys present a potential time and cost saving avenue for
future monitoring based on occupancy, if genetic information is not a priority and
particularly if census is already underway for other species.
This research is being expanded into the Valhalla and southern Monashee region in 2015.
With continued carcasses collected from trappers, and in collaboration with wolverine
researchers in adjacent regions, we will increase the sample size of genotyped
individuals, and continue to increase the strength of genetic analysis and spatial mark-
recapture.
This information is crucial for identifying viable movement linkages and protecting
habitat. These results will directly inform species harvest management. Further work
should contribute to the management of crown land, acquisition of conservation
properties, linkages and highway mitigation in the region. This study compliments
similar research on grizzly bears to provide a multi-species perspective for regional
conservation planning. Healthy, connected wolverine populations are an important
ecosystem component of the Columbia River watershed, will sustain trapping
opportunities for B.C. residents, and are critical for species persistence in the
conterminous USA (Cegelski et al. 2006).

17
Acknowledgements
We would like to thank Rick Allen and Columbia Basin Trust and Trevor Oussoren and
the Fish and Wildlife Compensation Program on behalf of its program partners BC
Hydro, the Province of BC and Fisheries and Oceans Canada for financial support for this
project. Additional funding was received from Ministry of Forests Lands and Natural
Resource Operations and the Wolverine Foundation.
We wish to thank Garth Mowat, John Krebs, Becky Philips, Aaron Reid and Irene
Teskey from the Ministry of Forests, Lands and Natural Resource Operations for
financial assistance, guidance, logistical support, and assistance in the field. Thank you to
Mike Knapik for guidance on proposals and logistics. Thank you to Michael Lucid and
Lacy Robinson from Idaho Fish and Game, Lisa Larson from Parks Canada, Michelle
McLellan, Jason Fisher and Tony Clevenger for continued collaboration and data sharing.
Thank you also to Lydia Allen, Idaho Panhandle National Forests, who provided cameras
in 2013.
We especially wish to thank the regional trapping community for turning in wolverine
carcasses, assisting in field operations, and providing bait. Thank you to the Ministry of
Forest Lands and Natural Resource Operations in Cranbrook and Invermere and
Conservation Officer Justyn Bell for storing wolverine carcasses. We wish to thank
Conservation Officer Jason Hawke for helping secure bait and assistance in the field.
Thank you to Hugh Ackroyd for volunteering so many hours to set up and monitor field
stations.
Additionally, we had the co-operation and assistance of a number of stakeholders in the
study area, including Nature Conservancy and Darkwoods Forestry, Whitewater Ski
Resort, Wildhorse Cat Skiing, Wyndel Box and Lumber, Canadian Pacific Railway,
Harrop Community Forests, Kalesnikoff Lumber Co. Ltd, Atco Wood Products Ltd.,
Powder Creek Lodge, BC Provincial Parks and Kootenay Trappers Associations.
We wish to thank Cary Gaynor and Leo Degroot for field support and managing
equipment. We would like to thank field technicians and trappers Tom Abraham, Jimmy
Robbins, Colby Lehman, Steve Forrest, Darcy Fear, Stefan Himmer, Andrew Page, Anna
Bourelle, and Dennis Lynch for assistance in setting up and monitoring field stations.
Thank you to Jeff Parker and Kootenay Valley Helicopters for putting up with us and our
stinky cargo! Volunteers from the local community; Verena Shaw, Lisa Tedesco, Kristen
Murphy, Pat Stent, Chris Hiebert, Megan Jamison, Adrian Leslie, Anne Machildon,
Emily Tidmarsh, and Phil Bajneski, Jen Vogel, Cedar Mueller, Sarah Fassina, Robert
18
Lynch, Judiete Bosman, Max Roussow, Sean Buzach, Kristina Kezes, Keyes Lessard,
Maya Abraham, Dawson Abraham and Selkirk College 2013 and 2014 Recreation, Fish
and Wildlife class, contributed approximately 220 hours to the sampling effort.
Thank you to Leanne Harris, Jennifer Weldon, Erin Harmston and Dave Paetkau at the
Wildlife Genetics Lab for assistance in field protocols and for the genetic analysis.
Literature Cited
Austin, M. 1998. Wolverine winter travel routes and response to transportation corridors
in Kicking Horse Pass between Yoho and Banff National Parks. MSc. Thesis.
University of Calgary.
[BC CDC] B.C. Conservation Data Centre. 2013. Species Summary: Gulo gulo luscus.
B.C. Ministry of Environment. Available: http://a100.gov.bc.ca/pub/eswp/ (accessed
Dec 2, 2013).
Burnham, K. P., and D. R. Anderson. 1998. Model selection and inference: a practical
information theoretic approach. Springer-Verlag, New York, New York, 353 pp.
Burnham, K. P., and D. R. Anderson. 2002. Model selection and multimodel inference: a
practical information–theoretic approach. Springer-Verlag, New York, USA.
Cegelski, C.C., L.P. Waits, N.J. Anderson, O. Flagstad, and C.J. Kyle. 2006. Genetic
diversity and population structure of wolverine (Gulo gulo) populations at the
southern edge of their current distribution in North America with implications for
genetic viability. Conservation Genetics 7:197-211.
[COSEWIC] 2003. Assessment and updated status report on the wolverine (Gulo gulo) in
Canada. Committee on the Status of Endangered Wildlife in Canada, Ottawa. 41 pp.
Efford, M.G. and R.M. Fewster. 2013. Estimating population size by spatially explicit
capture-recapture. Oikos 122:918-928
ESRI Inc. 1998. ArcView GIS Version 3.1. – Redlands, CA.
Felsenstein, J. 2013. PHYLIP (Phylogeny Inference Package) version 3.695. Distributed
by the author. Department of Genome Sciences, University of Washington, Seattle.
http://evolution.genetics.washington.edu/phylip.html. (Accessed Dec 18, 2013).
Fisher, J.T. 2004. Alberta Wolverine Experimental Monitoring Project 2003-2004
Annual Report. Vegreville: Sustainable Ecosystems, Alberta Research Council Inc.

19
Fisher, J.T., S. Bradbury, B. Anholt, L. Nolan, L. Roy, J.P. Volpe, and M. Wheatley.
2013. Wolverines (Gulo gulo luscus) on the Rocky Mountain slopes: natural
heterogeneity and landscape alteration as predictors of disturbance. Canadian Journal
of Zoology 91:706- 716.
Fisher, J.T. , N. Heim, and A.P. Clevenger. 2014. Distribution models for wolverine in
Central Canadian Rocky Mountains: An analysis of 2010-11 and 2012-2013 camera
trap data.
Gardner, C.L., J.P. Lawler, J.M. Ver Hoef, A.J. Magoun, K.A. Kellie. 2010. Coarse-scale
distribution surveys and occurrence probability modeling for wolverine in Interior
Alaska. Journal of Wildlife Management 74:1894-1903.
Jenness, J. 2005. Repeating Shapes (repeat_shapes.avx) extension for ArcView 3.x.
Jenness Enterprises. Available at:
http://www.jennessent.com/arcview/repeat_shapes.htm. (Accessed Dec 18 2013)
Johnson, W.E. and S.J. O’Brien.1997. Phylogenetic reconstruction of the Felidae using
16S rRNA and NADH-5 mitochondrial genes. Journal of Molecular Evolution
44:S98–S116.
Hatler, D.F. and A. M. M. Beal. 2003. British Columbia Furbearer Management
Guidelines: Wolverine Gulo gulo.
http://www.env.gov.bc.ca/fw/wildlife/trapping/docs/wolverine.pdf
Kortello, A., and D. Hausleitner. 2014. Abundance and distribution of wolverine in the
Kootenay region. 2013 field season report: Purcell Mountains. Prepared for Ministry
of Forests Lands and Natural Resource Operations and Columbia Basin Trust. 21pp.
Kortello, A., and D. Hausleitner. 2012. Wolverine and habitat assessment in the
Kootenay Region. 2012 field season report. Prepared for Columbia Basin Trust.
15pp.
Krebs, J., E.C. Lofroth and I. Parfitt. 2007. Multiscale habitat use by wolverines in
British Columbia, Canada. Journal of Wildlife Management 68: 493-502.
Langella, O. 1999. POPULATIONS version 1.2.31.
http://bioinformatics.org/~tryphon/populations/ (Accessed Dec 18 2013)
Lofroth, E.C. 2001. Wolverine ecology in plateau and foothill landscapes 1996–2001.
Northern wolverine project: 2000/01 year-end report. Report for B.C. Ministry of
Environment, Lands and Parks, Wildlife Branch, Victoria, B.C. Unpublished
report.
Lofroth, E.C., and J. Krebs. 2007. The abundance and distribution of wolverines in
British Columbia, Canada. Journal of Wildlife Management 71:2159-2169.

20
Lofroth,E.C., and P.K. Ott. 2007. Assessment of the sustainability of wolverine harvest in
British Columbia, Canada. Journal of Wildlife Management 71: 2193-2200.
Lofroth, E.C., J.A. Krebs, W.L. Harrower and D. Lewis. 2007. Food habits of Wolverine
Gulo gulo in montane ecosystems of British Columbia, Canada. Wildlife Biology
13:31-37.
Lucid, M, L. Robinson, S. Cushman, L.Allen, S. Cook. 2010. Inland maritime initiative:
maintaining multi-species connectivity in a changing climate, 2010 Annual Progress
report. Unpublished report. 20pp.
Lucid, M, L. Robinson, S. Cushman, L.Allen, S. Cook. 2011. Inland maritime initiative:
maintaining multi-species connectivity in a changing climate, Winter 2011 update.
Unpublished report. 13pp.
MacKenzie, D. I., J. D. Nichols, G. B. Lachman, S. Droege, J. A. Royle, and C. A.
Langtimm. 2002. Estimating site occupancy rates when detection probabilities are
less than one. Ecology 83:2248–2255.
MacKenzie, D.I., J.D. Nichols, J.A. Royle, K.H. Pollock, L.L. Bailey, J.E. Hines. 2006.
Occupancy estimation and modeling: Inferring patterns and dynamics of species
occurrence. Elsevier, Amsterdam, Netherlands. 324 pp.
McKelvey, K. S., J. P. Copeland, M. K. Schwartz, J. S. Littell, K. B. Aubry, J. R. Squires,
S. A. Parks, M. M. Elsner, and G. S. Mauger. 2011. Climate change predicted to shift
wolverine distributions, connectivity, and dispersal corridors. Ecological
Applications 21: 2882-2897.
[MWLAP] Ministry of Water, Land and Air Protection. 2004. Wolverine, Accounts and
Measures for Managing Identified Wildlife. Version 2004. Biodiversity Branch,
Identified Wildlife Management Strategy, Victoria, B.C.
Otis,D., L.,K. P. Burnham, G.C.White, and D.R. Anderson. 1978. Statistical inference
from capture data on closed animal populations. Wildlife Monographs, 62.
Peakall, R. and Smouse P.E. (2012) GenAlEx 6.5: genetic analysis in Excel. Population
genetic software for teaching and research – an update. Bioinformatics 28, 2537-
2539.
Peakall, R. and Smouse P.E. (2006) GENALEX 6: genetic analysis in Excel. Population
genetic software for teaching and research. Molecular Ecology Notes. 6, 288-295.
Pulliam, H. R. 1988. Sources, sinks, and population regulation. The American Naturalist
132:652-661.
Saitou N., and M. Nei. 1987. The neighbor-joining method: a new method for
reconstructing phylogenetic trees. Molecular Biology and Evolution 4:406-425.
21
Schwartz, M.K., J.P. Copeland, N.J. Anderson, J.R. Squires, R.M. Inman, K.S.
McKelvey, K.L. Pilgrim, L.P. Waits, S.A. Cushman. 2009. Wolverine gene flow
across a narrow climatic niche. Ecology 90: 3222-3232.
Seber, G. A. F. 1982. The Estimation of Animal Abundance (2nd ed.), London:Griffin.
Singleton, P. H., W. L Gaines, and J. F. Lehmkuhl. 2002. Landscape permeability for
large carnivores in Washington: a geographic information system weighted-distance
and least-cost corridor assessment. Res. Pap. PNW-RP-549. Portland, OR: U.S.
Department of Agriculture, Forest Service, Pacific Northwest Research Station. 89
pp.
Slough, B.C. 2007. Status of the wolverine Gulo gulo in Canada. Wildlife Biology 13:76-
82.
[USFWS] United States Fish and Wildlife Service. 2013. Endangered Species Mountain-
Prairie Region. Wolverine. Available: http://www.fws.gov/mountain-
prairie/species/mammals/wolverine/ (accessed Dec 20, 2013).
White, G. C., and K. P. Burnham .1999. Program MARK: survival estimation from
populations of marked animals. Bird Study 46:S120–S139.

22
Appendix 1. Carnivores detected by snow tracking during wolverine surveys in the
central Selkirk and south Monashees November 2013-April 2014.
Location UTM
easting
UTM
northing
Date (s) Species
Beaver Lake 465242 5559810 March 26,
April 20
coyote (1), lynx (1),
wolf (3)
Beton Junction 450480 5616668 March 22 coyote
Gerrard 480379 5595102 April 18 coyote (1)
Kuskanux Creek 445068 5569617 March 23 coyote (1)
Ledrum Creek 503722 5514909 March 14,
April 10
coyote (1)
Poplar Creek 491037 5584408 March 22 wolf (1)
Six mile Lakes 477195 477195 Feb 11 coyote (1)
Sproule Creek 467228 5489123 March 11 cougar (1)
Wilson Creek 473487 5552438 Feb 20,
March 26
lynx (1)
Wilson Lake 451081 5565753 April 16 coyote (1)