Embed Size (px)
Citation preview
1
Interior Wall Design to Promote Driving Safety in Long Tunnel
Zheng, Meng-Cong, Associate Professor Department of Industrial Design, National Taipei University of Technology
Abstract Confined and dull tunnel environment usually makes people feel tired and pressure. Fatigue driving is also reported to be one of the main reasons of traffic accidents. Thus, the purpose of this research is to use the design of wall pictures in tunnels to reduce drivers’ negative emotions and enhance positive ones. Taiwan’s Hsuehshan Tunnel, the second largest in Asia, was selected to be the case of three experiments in this study. The results showed that drivers would have more positive emotions and less negative responses in the tunnel with pictures than in the one without pictures. When the pictures changed, more positive emotions would occur. Pictures with brightness and color changes have better effects than others. The length and brightness of pictures would affect drivers’ spatial feelings. Drivers will have different speed feelings in stages with different pictures. Pictures without a good order will cause negative responses. Besides, pictures that can coordinate with the environment changes are more suitable. Drivers thus have more time to prepare and adjust to different environments. Overall, properly using the design of wall pictures can help ease drivers’ negative emotions and enhance positive ones. Keyword: driving safety, interior design, tunnel environment 1.The purpose of this study The present design of Taiwanese tunnels’ walls are signs or pictures in a fixed frequency (like milestones and aboriginal totems) or changes of the picture on entrances and exits. However, the content and colors of the pictures are not proven to be helpful to road safety. From related studies in Japan, we could conclude that frequencies,
shapes, and colors of pictures are important factors influencing drivers. The length of roads will also affect the quality of the design. Previous studies do not examine whether the length and types of roads will influence the design. A design for improving drivers’ concentration when driving in long tunnels will definitely contribute to road safety. Taiwan’s Hsuehshan Tunnel is a representative tunnel in Asia. The purpose of this study is to figure out what kind of design can efficiently reduce drivers’ tiredness when driving in a 13-kilometer-long road with enclosed landscape. The study will be bring in more humanity into Taiwan’s road planning and help to find the balance between aesthetics and functions. Further, the results could be references for international mid-length and long-length roads design. 2. Method and Procedure Three experiments were implemented in this study. The purpose of the first experiment was to understand the psychological emotional changes of drivers when they drive in Hsuehshan Tunnel. In the second experiment, participants with design background were asked to select several combinations of wall pictures which they considered as appropriate to use in the tunnel. The third experiment utilized a 3D simulated driving experiment with the combinations of wall pictures chosen in the second experiment. Through simulated driving, the participants reported how they feel about the combinations and what improvements should be made. I. First Experiment 20 participants (10 males and 10 females) were invited to join the first experiment. They are students in colleges or in master programs. During the experiment, the real scene of driving
2
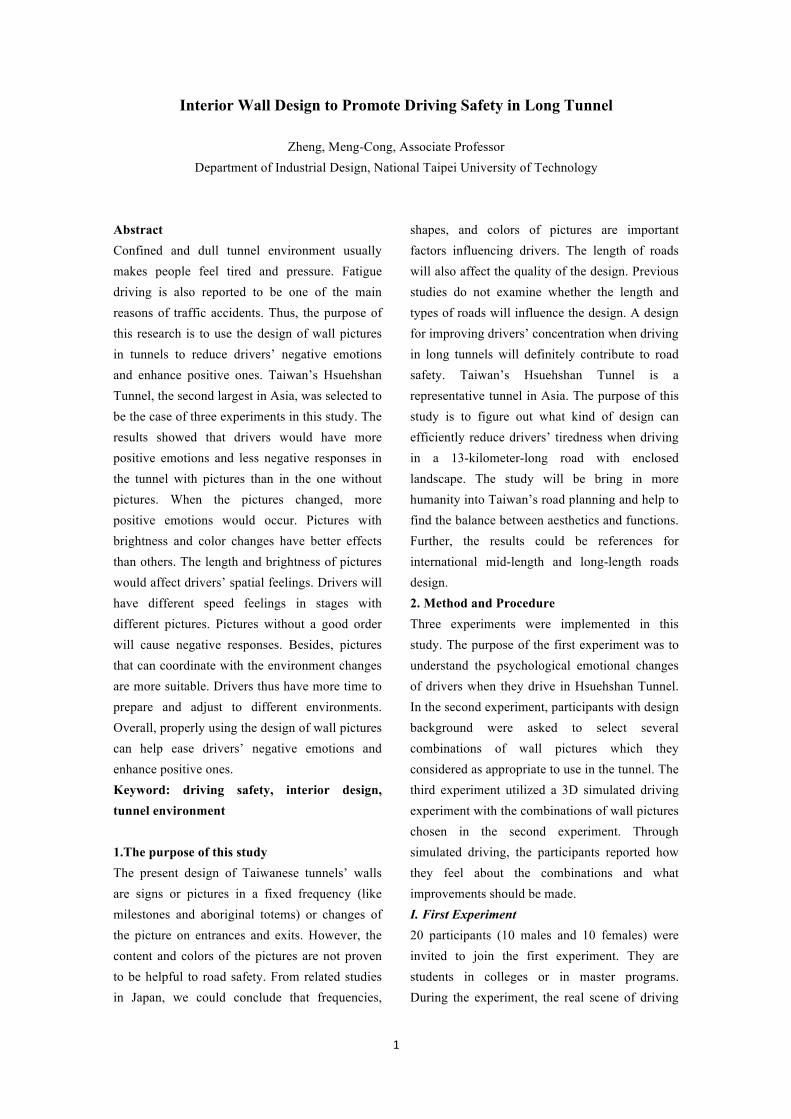
in Hsuehshan Tunnel was displayed (Figure 1). When the scene was being played, participants pressed the counter on the steering wheel according to their anxiety level. The emotional changes were recorded following the time frames and different sections in the tunnel. After the experiment, participants were interviewed about how they felt during the experiment, the facilities they noticed, and what they thought about the environment and their suggestions. Figure 1. The setting of the first experiment
II. Second Experiment Based on Nagami & Nagata (2009) of the design of tunnel wall pictures, the journey in the tunnel can be divided into four stages: Beginning, Relaying, Transferring, and Concluding. Wall pictures are then selected and designed according to the feelings and needs of drivers in different stages. In the second experiment, the journey in Hsuehshan Tunnel was also divided into four stages (Table 1). 30 experts (15 males and 15 females) who had received professional training in design for more than two years were invited to choose the most appropriate wall picture design for each stage. The hundred kinds of wall picture were derived from different changes of basic shapes like lines, rectangles, circles, and arrows. The changes include shape change, vibration change, spacing change, brightness change, and combination. These changes will create different rhythmical images. III. Third Experiment The third experiment utilized the results from the second experiment. The pictures that have been chosen for the most times for each stage were
Table 1 Four stages of journey in Hsuehshan Tunnel
Stage Distance Description
1 Beginning 0~3 KM
The first stage when drivers just enter the tunnel. Their sight transfer from bright space into dark space.
2 Relaying 3~5 KM Drivers enter the tunnel for a certain distance and their eyes get accustomed to the tunnel.
3 Transferring 5~8 KM Drivers start to feel bored and annoyed about the tunnel environment.
4 Concluding 8~12.9 KM
Drivers look forward to exiting the tunnel.
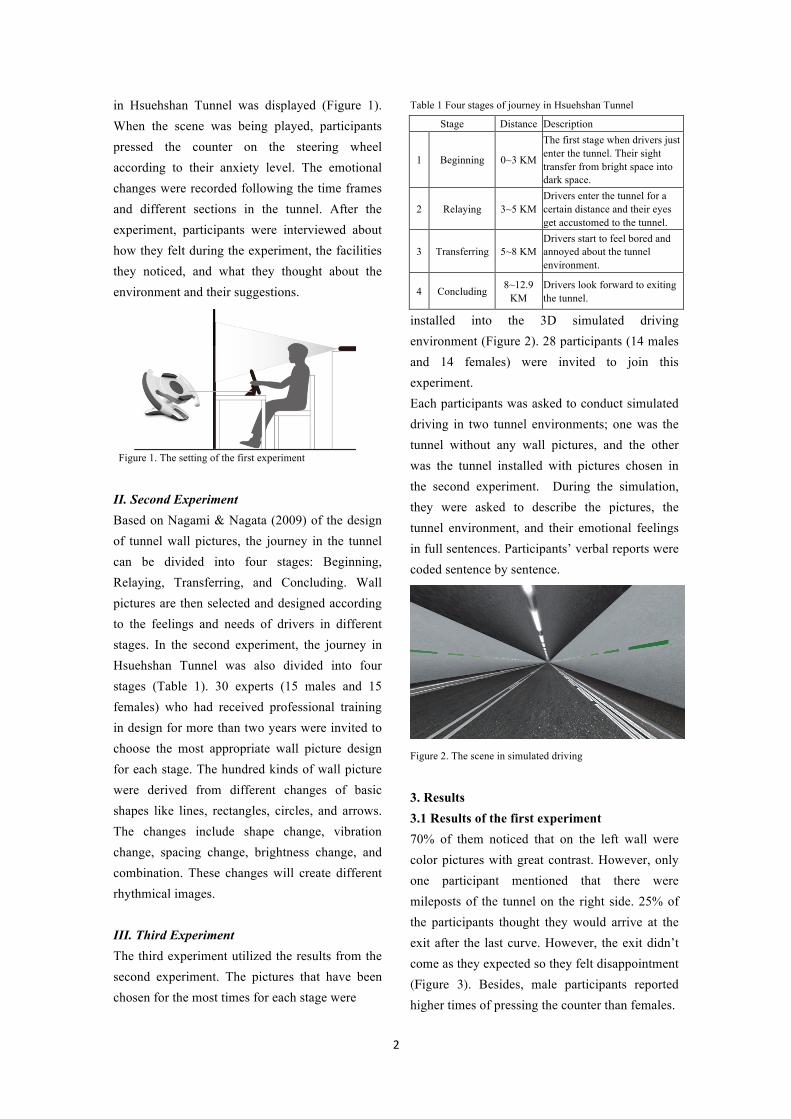
installed into the 3D simulated driving environment (Figure 2). 28 participants (14 males and 14 females) were invited to join this experiment. Each participants was asked to conduct simulated driving in two tunnel environments; one was the tunnel without any wall pictures, and the other was the tunnel installed with pictures chosen in the second experiment. During the simulation, they were asked to describe the pictures, the tunnel environment, and their emotional feelings in full sentences. Participants’ verbal reports were coded sentence by sentence.
Figure 2. The scene in simulated driving
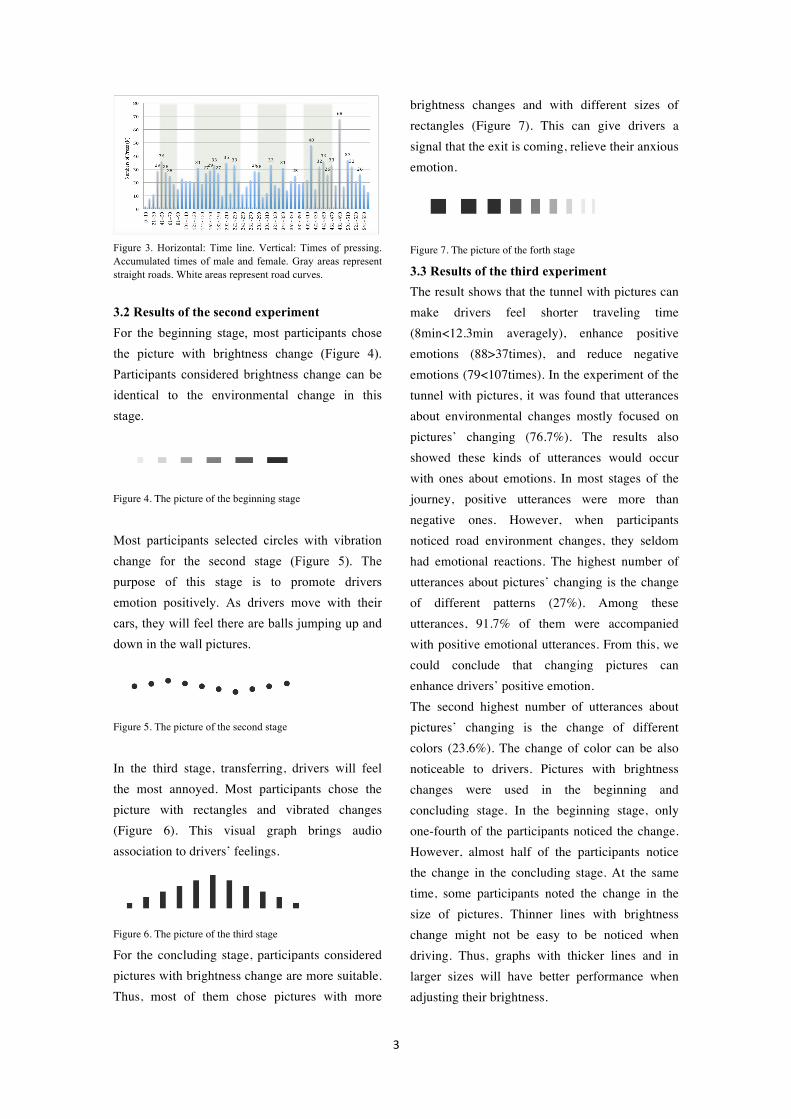
3. Results 3.1 Results of the first experiment 70% of them noticed that on the left wall were color pictures with great contrast. However, only one participant mentioned that there were mileposts of the tunnel on the right side. 25% of the participants thought they would arrive at the exit after the last curve. However, the exit didn’t come as they expected so they felt disappointment (Figure 3). Besides, male participants reported higher times of pressing the counter than females.
3
Figure 3. Horizontal: Time line. Vertical: Times of pressing. Accumulated times of male and female. Gray areas represent straight roads. White areas represent road curves.
3.2 Results of the second experiment For the beginning stage, most participants chose the picture with brightness change (Figure 4). Participants considered brightness change can be identical to the environmental change in this stage.
Figure 4. The picture of the beginning stage
Most participants selected circles with vibration change for the second stage (Figure 5). The purpose of this stage is to promote drivers emotion positively. As drivers move with their cars, they will feel there are balls jumping up and down in the wall pictures.
Figure 5. The picture of the second stage
In the third stage, transferring, drivers will feel the most annoyed. Most participants chose the picture with rectangles and vibrated changes (Figure 6). This visual graph brings audio association to drivers’ feelings.
Figure 6. The picture of the third stage
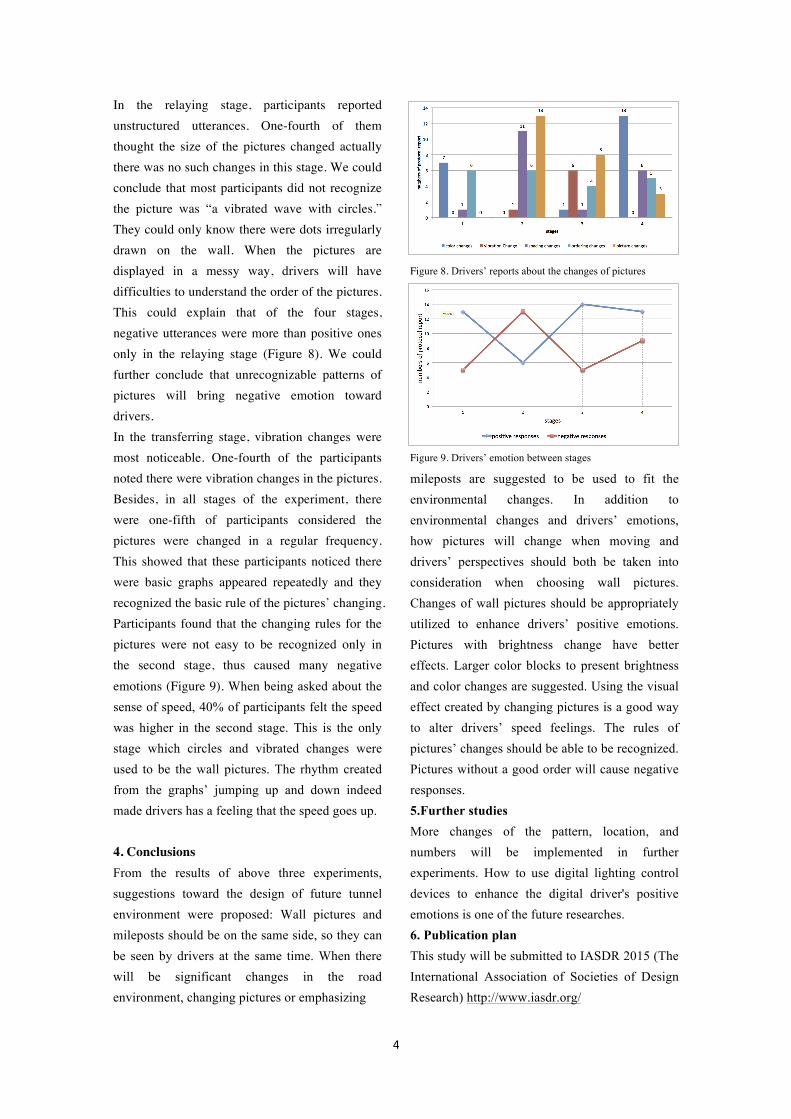
For the concluding stage, participants considered pictures with brightness change are more suitable. Thus, most of them chose pictures with more
brightness changes and with different sizes of rectangles (Figure 7). This can give drivers a signal that the exit is coming, relieve their anxious emotion.
Figure 7. The picture of the forth stage
3.3 Results of the third experiment The result shows that the tunnel with pictures can make drivers feel shorter traveling time (8min<12.3min averagely), enhance positive emotions (88>37times), and reduce negative emotions (79<107times). In the experiment of the tunnel with pictures, it was found that utterances about environmental changes mostly focused on pictures’ changing (76.7%). The results also showed these kinds of utterances would occur with ones about emotions. In most stages of the journey, positive utterances were more than negative ones. However, when participants noticed road environment changes, they seldom had emotional reactions. The highest number of utterances about pictures’ changing is the change of different patterns (27%). Among these utterances, 91.7% of them were accompanied with positive emotional utterances. From this, we could conclude that changing pictures can enhance drivers’ positive emotion. The second highest number of utterances about pictures’ changing is the change of different colors (23.6%). The change of color can be also noticeable to drivers. Pictures with brightness changes were used in the beginning and concluding stage. In the beginning stage, only one-fourth of the participants noticed the change. However, almost half of the participants notice the change in the concluding stage. At the same time, some participants noted the change in the size of pictures. Thinner lines with brightness change might not be easy to be noticed when driving. Thus, graphs with thicker lines and in larger sizes will have better performance when adjusting their brightness.
4
In the relaying stage, participants reported unstructured utterances. One-fourth of them thought the size of the pictures changed actually there was no such changes in this stage. We could conclude that most participants did not recognize the picture was “a vibrated wave with circles.” They could only know there were dots irregularly drawn on the wall. When the pictures are displayed in a messy way, drivers will have difficulties to understand the order of the pictures. This could explain that of the four stages, negative utterances were more than positive ones only in the relaying stage (Figure 8). We could further conclude that unrecognizable patterns of pictures will bring negative emotion toward drivers. In the transferring stage, vibration changes were most noticeable. One-fourth of the participants noted there were vibration changes in the pictures. Besides, in all stages of the experiment, there were one-fifth of participants considered the pictures were changed in a regular frequency. This showed that these participants noticed there were basic graphs appeared repeatedly and they recognized the basic rule of the pictures’ changing. Participants found that the changing rules for the pictures were not easy to be recognized only in the second stage, thus caused many negative emotions (Figure 9). When being asked about the sense of speed, 40% of participants felt the speed was higher in the second stage. This is the only stage which circles and vibrated changes were used to be the wall pictures. The rhythm created from the graphs’ jumping up and down indeed made drivers has a feeling that the speed goes up. 4. Conclusions From the results of above three experiments, suggestions toward the design of future tunnel environment were proposed: Wall pictures and mileposts should be on the same side, so they can be seen by drivers at the same time. When there will be significant changes in the road environment, changing pictures or emphasizing
Figure 8. Drivers’ reports about the changes of pictures
Figure 9. Drivers’ emotion between stages
mileposts are suggested to be used to fit the environmental changes. In addition to environmental changes and drivers’ emotions, how pictures will change when moving and drivers’ perspectives should both be taken into consideration when choosing wall pictures. Changes of wall pictures should be appropriately utilized to enhance drivers’ positive emotions. Pictures with brightness change have better effects. Larger color blocks to present brightness and color changes are suggested. Using the visual effect created by changing pictures is a good way to alter drivers’ speed feelings. The rules of pictures’ changes should be able to be recognized. Pictures without a good order will cause negative responses. 5.Further studies More changes of the pattern, location, and numbers will be implemented in further experiments. How to use digital lighting control devices to enhance the digital driver's positive emotions is one of the future researches. 6. Publication plan This study will be submitted to IASDR 2015 (The International Association of Societies of Design Research) http://www.iasdr.org/