Embed Size (px)
Citation preview

V I T A L S I G N S C U R R I C U L U M M A T E R I A L S P R O J E C T
Marc E. SchilerAssociate Professor, University of Southern CaliforniaShweta A. JapeeGraduate student, University of Southern California
INTERIOR ILLUMINANCE, DAYLIGHT CONTROLSAND OCCUPANT RESPONSE

V I T A L S I G N S C U R R I C U L U M M A T E R I A L S P R O J E C T
THEORY
Lesson One Basic Physiology L-1 1
Lesson Two Concepts, Terms and Basic Physics L-2 5
Lesson Three Illuminance Measurements L-3 11
Lesson Four Luminance Measurements L-4 19
Lesson Five Physical Models L-5 27
Lesson Six Extended Illuminance Measurements L-6 32
Lesson Seven Extended Luminance Measurements L-7 37
Lesson Eight Data Analysis and Presentation L-8 46
Lesson Nine Controls L-9 52
Lesson Ten Occupant Survey L-10 57
TABLE OF CONTENTS
PREFACE
ACKNOWLEDGMENTS
FIELD EXERCISES
Assignment One Vision E-1 1
Assignment Two Self Guided Lighting Tour E-2 8
Assignment Three Instantaneous Illuminance Measurements E-3 14
Assignment Four Luminance Measurements E-4 16
Assignment Five Model Testing E-5 19
Assignment Six Measuring Illuminance over Time E-6 22
Assignment Seven Glare Evaluation E-7 25
V I T A L S I G N S C U R R I C U L U M M A T E R I A L S P R O J E C T
Assignment Eight Data Presentation E-8 27
Assignment Nine Controls E-9 30
Assignment Ten Developing and Conducting an Occupant Survey E-10 32
APPENDICES
Appendix A Answers to Review Questions A-A 1
Appendix B Annotated Bibliography A-B 5
Appendix C List of Necessary Equipment A-C 8
Appendix D Suggested Computer Programs A-D 9
Appendix E List of Sample Buildings A-E 10
Appendix F Glossary A-F 11
Appendix G A Prototype Paper A-G 16
SUMMARY
V I T A L S I G N S C U R R I C U L U M M A T E R I A L S P R O J E C T
PREFACE
"The real subject of every painting is light.” - Claude Monet
“For the rest of my life I want to reflect on what light is.” -Albert Einstein (Clark, p.252)
“Architecture is the masterly correct and magnificent playof masses brought together in light. Our eyes are made tosee forms in light; light and shade reveal these forms;cubes, cones, spheres, cylinders or pyramids are the greatprimary forms which light reveals to advantage.” - LeCorbusier
Vision is the primary sense by which we absorb information about a building. The light which we perceivethen, is the definer of the architecture. This makes the architect particularly interested in understandinglight. Furthermore, most of what goes on inside of buildings requires light. This means that the engineer,owner, user and interior designer are all interested in understanding the way light behaves within abuilding.
The common English word “light” actually covers several different aspects of the behavior and sensing of anarrow but common portion of the electromagnetic spectrum. The following exercises are designed toconvey a progressive understanding of these phenomenon, and how they may be measured, quantified andanalyzed.
As with the other Vital Signs packages, this package follows a general format. The first section is thetheoretical background for the topics to be covered. This goes so far as to include measurement protocols.This section is organized into distinct lessons. Each one is self contained, and builds upon the previouslesson. At the end of each lesson is a series of questions which refer to the concepts of the lesson. Eachlesson is also directly connected to one of the exercises to be found in the main body of the package.
The main body of the package are the measurement assignments. They are divided into three levels. Thefirst level is experiential in nature, helping the student to get an intuitive grasp of the nature of these vitalsigns which are being monitored. The second level uses a range of equipment to measure a range ofvariables, in an instantaneous fashion. The third level introduces the concept of measurement over time,or extended measurement.
There are a glossary, an annotated bibliography, and the answers to the lesson quizzes in appendices.With the equipment available to you through the Vital Signs project, or similar equipment mentioned in thetext, these exercises should prove interesting, challenging, and rewarding. Enjoy.
V I T A L S I G N S C U R R I C U L U M M A T E R I A L S P R O J E C T
ACKNOWLEDGMENTS
We wish to thank Cris Benton, Alison Kwok and Bill Burke for theirguidance throughout the project, and for having had the excellentgood sense to conceive of and organize it to begin with.
We wish to thank Pacific Gas and Electric, the Energy Foundation andall the others who have contributed funds to this project.
We wish to thank all of the reviewers for their excellent suggestions.Russ Leslie, Bruce Haglund, Mary Guzowski, John Kingman, DavidScheatzle and Bill Burke provided additional experiences as well asconstructive advice on the organization of the package.

V I T A L S I G N S C U R R I C U L U M M A T E R I A L S P R O J E C T
THEORY
V I T A L S I G N S C U R R I C U L U M M A T E R I A L S P R O J E C T
L-1 1 INTERIOR ILLUMINANCE, DAYLIGHT CONTROLS AND OCCUPANT RESPONSE
LEVEL I - BASIC PHYSIOLOGY
LESSON ONE - BASIC PHYSIOLOGY
1.1 PERCEPTION AND THEEYES
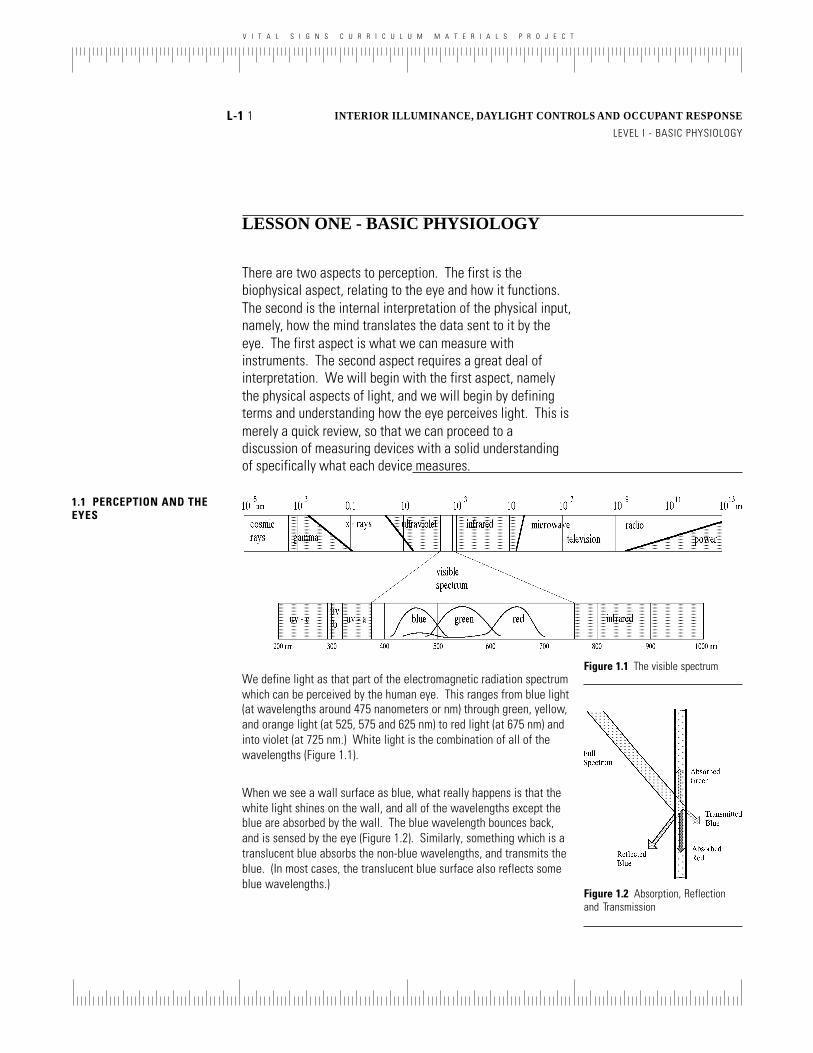
We define light as that part of the electromagnetic radiation spectrumwhich can be perceived by the human eye. This ranges from blue light(at wavelengths around 475 nanometers or nm) through green, yellow,and orange light (at 525, 575 and 625 nm) to red light (at 675 nm) andinto violet (at 725 nm.) White light is the combination of all of thewavelengths (Figure 1.1).
Figure 1.1 The visible spectrum
Figure 1.2 Absorption, Reflectionand Transmission
When we see a wall surface as blue, what really happens is that thewhite light shines on the wall, and all of the wavelengths except theblue are absorbed by the wall. The blue wavelength bounces back,and is sensed by the eye (Figure 1.2). Similarly, something which is atranslucent blue absorbs the non-blue wavelengths, and transmits theblue. (In most cases, the translucent blue surface also reflects someblue wavelengths.)
There are two aspects to perception. The first is thebiophysical aspect, relating to the eye and how it functions.The second is the internal interpretation of the physical input,namely, how the mind translates the data sent to it by theeye. The first aspect is what we can measure withinstruments. The second aspect requires a great deal ofinterpretation. We will begin with the first aspect, namelythe physical aspects of light, and we will begin by definingterms and understanding how the eye perceives light. This ismerely a quick review, so that we can proceed to adiscussion of measuring devices with a solid understandingof specifically what each device measures.

V I T A L S I G N S C U R R I C U L U M M A T E R I A L S P R O J E C T
L-1 2 INTERIOR ILLUMINANCE, DAYLIGHT CONTROLS AND OCCUPANT RESPONSE
LEVEL I - BASIC PHYSIOLOGY
1.2 THE HUMAN EYE The eye is composed of several critical pieces.There is a focusing device called the lens. Thereis a device which controls the amount of lightadmitted to the eye called the iris, and a sensingsurface called the retina. The retina is composedof two types of nerve pickups, the rods whichsense black and white (or simply the presence orabsence of any light) and the cones which sensecolors. The rods work efficiently at very low lightlevels, such as moonlight, or low levels of lightwithin a building. The cones give much morerelative information, but require more light. In avery dark room, you lose the sense of color, evenif you can still see well enough to move withoutbumping into things. Color or cone based visionis called photopic vision, and monochromatic orrod based vision is called scotopic vision (Figure1.3).
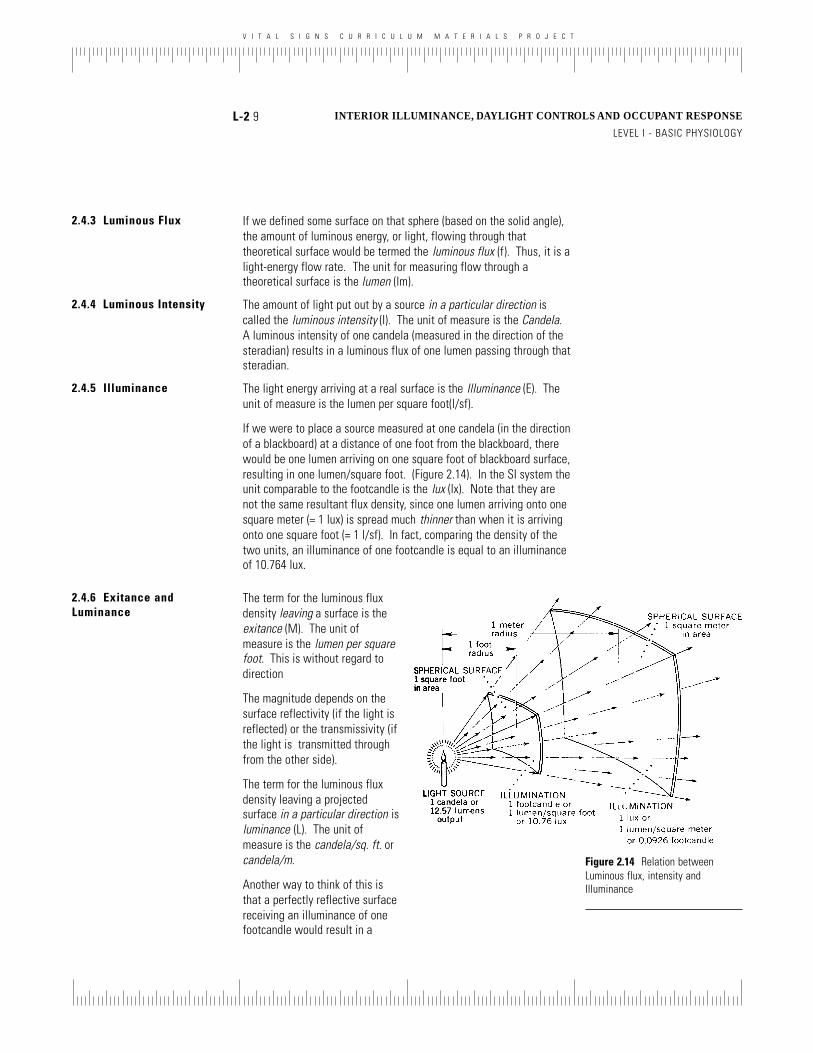
Colors are literally perceived in relation to one another, rather than inan absolute sense. The cones sense red, green and blue spectra, andmeasure the different ratios of those spectra. This means that thecolors are always perceived in relationship to the colors around them,and to the background. Blues are bluer in a red room. This isespecially true of adjacent colors, which give the greatest immediatedifferential reading in terms of adjacent cones on the surface of theretina.
There are some colors which may disappear because of the absenceof a certain wavelength of light in the source which is illuminatingthem. This is true primarily of artificial light sources. The conescannot pick up the differential, and because one of the wavelengths isnot available to be reflected and sensed. The subtleties of colortheory are taken up in several books (ref. Iten, Albers, Munsell & CIE.)
The eye is astoundingly adaptive in range. It can adjust from levelsbelow 1 footcandle, to levels over 10,000 footcandles in moments. Itis only damaged when the change is too rapid, or most of thebackground is dark, but one spot is intensely bright. Such extremecontrasts are known as glare.
Figure 1.3 A cross section of thehuman eye
1.3 GLARE There are two types of glare. One occurs when the eye has adapted toan environment and the environment changes. The other occurs whenthe eye has adapted to an environment and a source of light appearswithin that environment that is much brighter than anything elsewithin the field of view.
V I T A L S I G N S C U R R I C U L U M M A T E R I A L S P R O J E C T
L-1 3 INTERIOR ILLUMINANCE, DAYLIGHT CONTROLS AND OCCUPANT RESPONSE
LEVEL I - BASIC PHYSIOLOGY
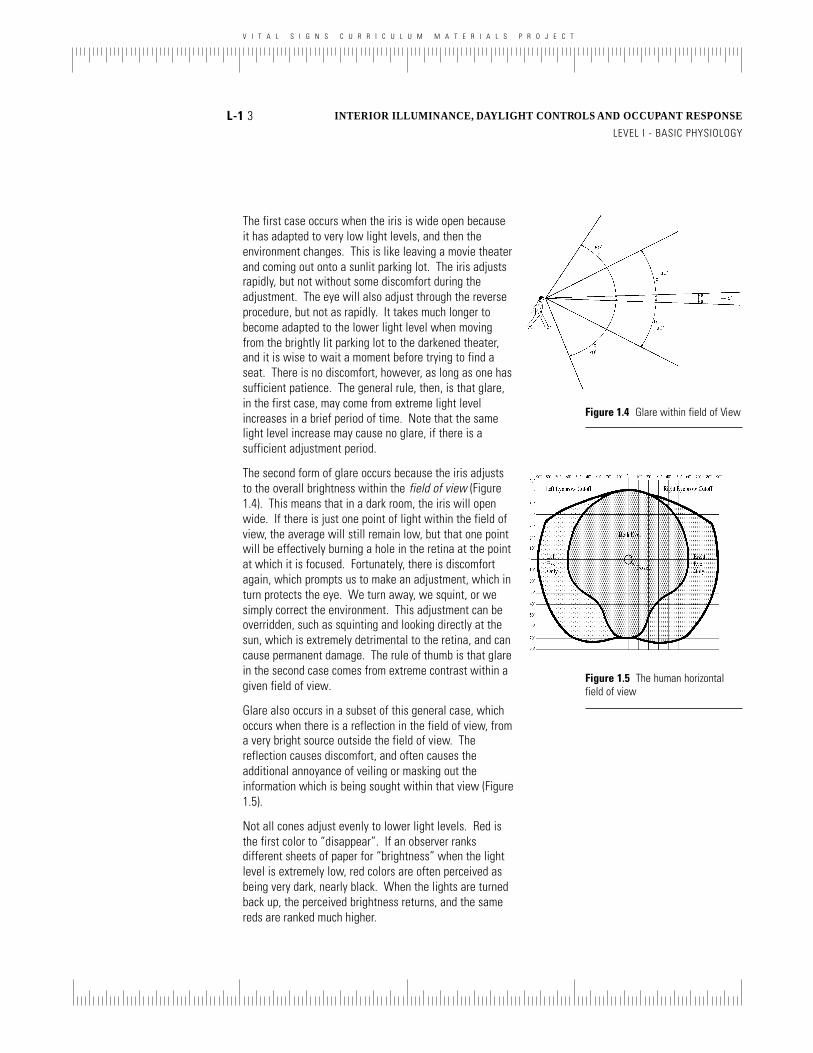
The first case occurs when the iris is wide open becauseit has adapted to very low light levels, and then theenvironment changes. This is like leaving a movie theaterand coming out onto a sunlit parking lot. The iris adjustsrapidly, but not without some discomfort during theadjustment. The eye will also adjust through the reverseprocedure, but not as rapidly. It takes much longer tobecome adapted to the lower light level when movingfrom the brightly lit parking lot to the darkened theater,and it is wise to wait a moment before trying to find aseat. There is no discomfort, however, as long as one hassufficient patience. The general rule, then, is that glare,in the first case, may come from extreme light levelincreases in a brief period of time. Note that the samelight level increase may cause no glare, if there is asufficient adjustment period.
The second form of glare occurs because the iris adjuststo the overall brightness within the field of view (Figure1.4). This means that in a dark room, the iris will openwide. If there is just one point of light within the field ofview, the average will still remain low, but that one pointwill be effectively burning a hole in the retina at the pointat which it is focused. Fortunately, there is discomfortagain, which prompts us to make an adjustment, which inturn protects the eye. We turn away, we squint, or wesimply correct the environment. This adjustment can beoverridden, such as squinting and looking directly at thesun, which is extremely detrimental to the retina, and cancause permanent damage. The rule of thumb is that glarein the second case comes from extreme contrast within agiven field of view.
Glare also occurs in a subset of this general case, whichoccurs when there is a reflection in the field of view, froma very bright source outside the field of view. Thereflection causes discomfort, and often causes theadditional annoyance of veiling or masking out theinformation which is being sought within that view (Figure1.5).
Not all cones adjust evenly to lower light levels. Red isthe first color to “disappear”. If an observer ranksdifferent sheets of paper for “brightness” when the lightlevel is extremely low, red colors are often perceived asbeing very dark, nearly black. When the lights are turnedback up, the perceived brightness returns, and the samereds are ranked much higher.
Figure 1.4 Glare within field of View
Figure 1.5 The human horizontalfield of view

V I T A L S I G N S C U R R I C U L U M M A T E R I A L S P R O J E C T
L-1 4 INTERIOR ILLUMINANCE, DAYLIGHT CONTROLS AND OCCUPANT RESPONSE
LEVEL I - BASIC PHYSIOLOGY
CONCLUSIONS Exercise 1 is directly based on these concepts. It is intended toacquaint the user with their own eyes and the way they function. Itrequires no special equipment or preparation. You may choose to goto the exercise or continue with the basic principles.
REVIEW QUESTIONS 1.1 What wavelengths of electromagnetic radiation can beperceived by the human eye?
1.2 Which receptors in the eye sense colors? They are found onwhat surface?
1.3 What is the focusing device of the eye? What is theexposure adjustment device of the eye?
1.4 Do large amounts of light (high illuminance levels)invariably cause glare? Do small amounts of light never cause glare?Think of some examples.
V I T A L S I G N S C U R R I C U L U M M A T E R I A L S P R O J E C T
INTERIOR ILLUMINANCE, DAYLIGHT CONTROLS AND OCCUPANT RESPONSE
LEVEL I - BASIC PHYSIOLOGYL-2 5
LESSON TWO - CONCEPTS, TERMSAND BASIC PHYSICS
In discussing light, there are several terms which we use inday to day speech which must be defined more carefully ifwe are to deal with them in a quantitative manner, or evenunderstand clearly the qualitative differences. The followingsection provides a basic understanding of the definition oflight, its behavior, and qualitative and quantitativemeasurements. It is a review of those terms, and the morecareful definitions which come from the IES (IlluminatingEngineering Society.)
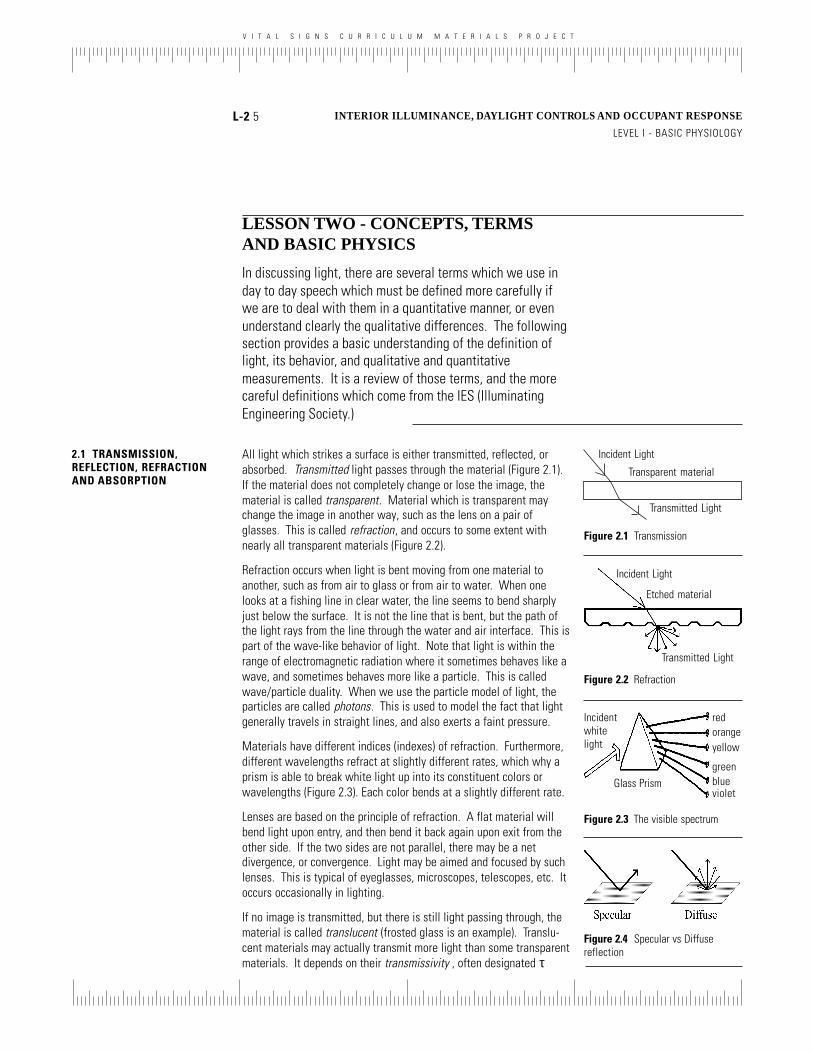
All light which strikes a surface is either transmitted, reflected, orabsorbed. Transmitted light passes through the material (Figure 2.1).If the material does not completely change or lose the image, thematerial is called transparent. Material which is transparent maychange the image in another way, such as the lens on a pair ofglasses. This is called refraction, and occurs to some extent withnearly all transparent materials (Figure 2.2).
Refraction occurs when light is bent moving from one material toanother, such as from air to glass or from air to water. When onelooks at a fishing line in clear water, the line seems to bend sharplyjust below the surface. It is not the line that is bent, but the path ofthe light rays from the line through the water and air interface. This ispart of the wave-like behavior of light. Note that light is within therange of electromagnetic radiation where it sometimes behaves like awave, and sometimes behaves more like a particle. This is calledwave/particle duality. When we use the particle model of light, theparticles are called photons. This is used to model the fact that lightgenerally travels in straight lines, and also exerts a faint pressure.
Materials have different indices (indexes) of refraction. Furthermore,different wavelengths refract at slightly different rates, which why aprism is able to break white light up into its constituent colors orwavelengths (Figure 2.3). Each color bends at a slightly different rate.
Lenses are based on the principle of refraction. A flat material willbend light upon entry, and then bend it back again upon exit from theother side. If the two sides are not parallel, there may be a netdivergence, or convergence. Light may be aimed and focused by suchlenses. This is typical of eyeglasses, microscopes, telescopes, etc. Itoccurs occasionally in lighting.
If no image is transmitted, but there is still light passing through, thematerial is called translucent (frosted glass is an example). Translu-cent materials may actually transmit more light than some transparentmaterials. It depends on their transmissivity , often designated τ
2.1 TRANSMISSION,REFLECTION, REFRACTIONAND ABSORPTION
Figure 2.1 Transmission
Transparent material
Incident Light
Transmitted Light
Incident Light
Etched material
Transmitted Light
Figure 2.2 Refraction
Incidentwhitelight
Glass Prism
Figure 2.3 The visible spectrum
orangered
yellow
greenblueviolet
Figure 2.4 Specular vs Diffusereflection

V I T A L S I G N S C U R R I C U L U M M A T E R I A L S P R O J E C T
INTERIOR ILLUMINANCE, DAYLIGHT CONTROLS AND OCCUPANT RESPONSE
LEVEL I - BASIC PHYSIOLOGYL-2 6
MATERIAL TRANSMISSIVITY (T)
OPTICAL GLASS 95-98%
CLEAR FLOAT GLASS 80-90%
CLEAR PRISMATIC PLASTIC 70-92%
SANDBLASTED, ETCHED, FROSTED GLASS 70-85%
WHITE DIFFUSING PLASTIC 40-75%
FLASHED OPAL GLASS 30-65%
ALABASTER (STONE) 20-50%
SOLID OPAL GLASS 15-40%
TINTED GLASS (SEE MANUFACTURERS) 25%-75%
REFLECTIVE GLASS (SEE MANUFACTURERS) 15-65%
(tau). The transmissivity is the fraction of thelight falling on one side of the surface whichpasses through the material and leaves theother surface. It is sometimes expressed as apercentage (Figure 2.5).
If the light is bounced off the material, thematerial is called reflective. If the reflectedimage is maintained (such as with a mirror)the surface is called specular. If the image isnot maintained (such as a matte white finish)the surface is called diffusing (Figure 2.4).
Again, the reflectance , designated ρ (rho), isthe fraction of light falling on the surfacewhich returns from the surface, in this case,on the same side (Figure 2.6).
If absolutely no light passes through thematerial, it is called opaque. Materials thatare transparent in one wavelength may beopaque in another. Glass is transparent in thevisible spectrum, but nearly opaque in someof the infrared spectra (e.g. 2% transmit-tance.)
Figure 2.5 Common Transmittances
Figure 2.6 Common reflectances
2.2 DIRECT AND DIFFUSELIGHT
Light is usually available to us in two forms.In an outdoor setting, ambient, diffuse light isthe kind of light experienced on an overcastday. There are no distinct shadows, becausethe light is coming from all directions. In abuilding, this is analogous to a ceiling full offluorescent lights, or a white ceiling lit bycoves around the sides. The light is comingfrom all directions, and there are no sharpshadows. The idea is also to light the entire
room or area, and is therefore referred to as area lighting (Figure 2.7).
Direct light is the kind of light which comes directly from the sun on asunny day. There are very sharp shadows, and the light is very strong.There are also very distinct, directional reflections from shiny objects.Inside a building, direct light is analogous to the light from a projector,or more mildly, from a drafting lamp. It is most often useful whenaimed at a task requiring special attention, and when so used is calledtask lighting (Figure 2.8).
Flat surfaces such as murals, paintings and papers or books are bestviewed in diffuse light. There will be fewer veiling reflections orreflected glare. Strongly modeled objects, such as sculptures are
Bright zenith
Figure 2.8 Direct Light
Figure 2.7 Diffuse Light
MATERIAL REFLECTANCE (R)
GLASS MIRROR 80-98%
CLEAR PLASTIC MIRROR 75-95%
POLISHED ALUMINUM 60-70%
POLISHED CHROME 60-65%
POLISHED STAINLESS STEEL 55-65%
WHITE PLASTER 85-90%
WHITE PAINT 75-95%
PORCELAIN ENAMEL 65-90%
WHITE TERRA-COTTA 65-80%
CLEAN LIMESTONE, MARBLE, GRANITE 35-65%
(WHITE SURFACES)
GRAVEL 10-20%
GRASS (HEALTHY) 6%
V I T A L S I G N S C U R R I C U L U M M A T E R I A L S P R O J E C T
INTERIOR ILLUMINANCE, DAYLIGHT CONTROLS AND OCCUPANT RESPONSE
LEVEL I - BASIC PHYSIOLOGYL-2 7
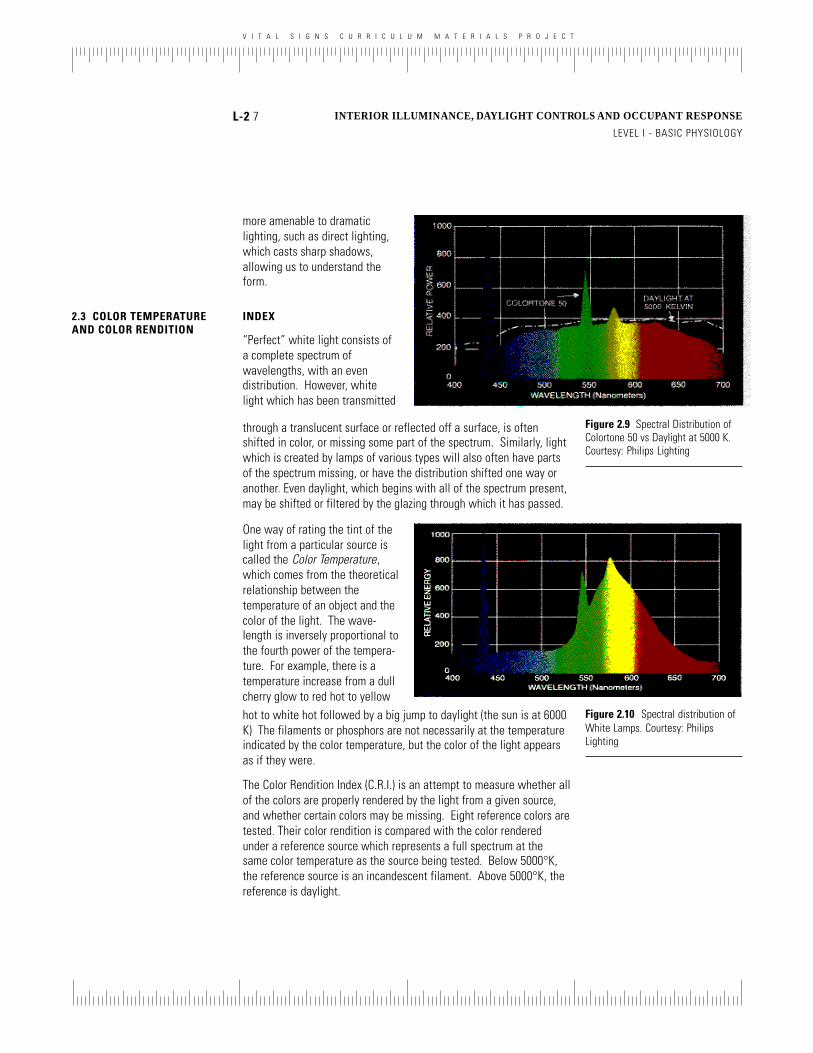
more amenable to dramaticlighting, such as direct lighting,which casts sharp shadows,allowing us to understand theform.
Figure 2.9 Spectral Distribution ofColortone 50 vs Daylight at 5000 K.Courtesy: Philips Lighting
through a translucent surface or reflected off a surface, is oftenshifted in color, or missing some part of the spectrum. Similarly, lightwhich is created by lamps of various types will also often have partsof the spectrum missing, or have the distribution shifted one way oranother. Even daylight, which begins with all of the spectrum present,may be shifted or filtered by the glazing through which it has passed.
2.3 COLOR TEMPERATUREAND COLOR RENDITION
INDEX
“Perfect” white light consists ofa complete spectrum ofwavelengths, with an evendistribution. However, whitelight which has been transmitted
One way of rating the tint of thelight from a particular source iscalled the Color Temperature,which comes from the theoreticalrelationship between thetemperature of an object and thecolor of the light. The wave-length is inversely proportional tothe fourth power of the tempera-ture. For example, there is atemperature increase from a dullcherry glow to red hot to yellow
Figure 2.10 Spectral distribution ofWhite Lamps. Courtesy: PhilipsLighting
hot to white hot followed by a big jump to daylight (the sun is at 6000K) The filaments or phosphors are not necessarily at the temperatureindicated by the color temperature, but the color of the light appearsas if they were.
The Color Rendition Index (C.R.I.) is an attempt to measure whether allof the colors are properly rendered by the light from a given source,and whether certain colors may be missing. Eight reference colors aretested. Their color rendition is compared with the color renderedunder a reference source which represents a full spectrum at thesame color temperature as the source being tested. Below 5000°K,the reference source is an incandescent filament. Above 5000°K, thereference is daylight.
V I T A L S I G N S C U R R I C U L U M M A T E R I A L S P R O J E C T
INTERIOR ILLUMINANCE, DAYLIGHT CONTROLS AND OCCUPANT RESPONSE
LEVEL I - BASIC PHYSIOLOGYL-2 8
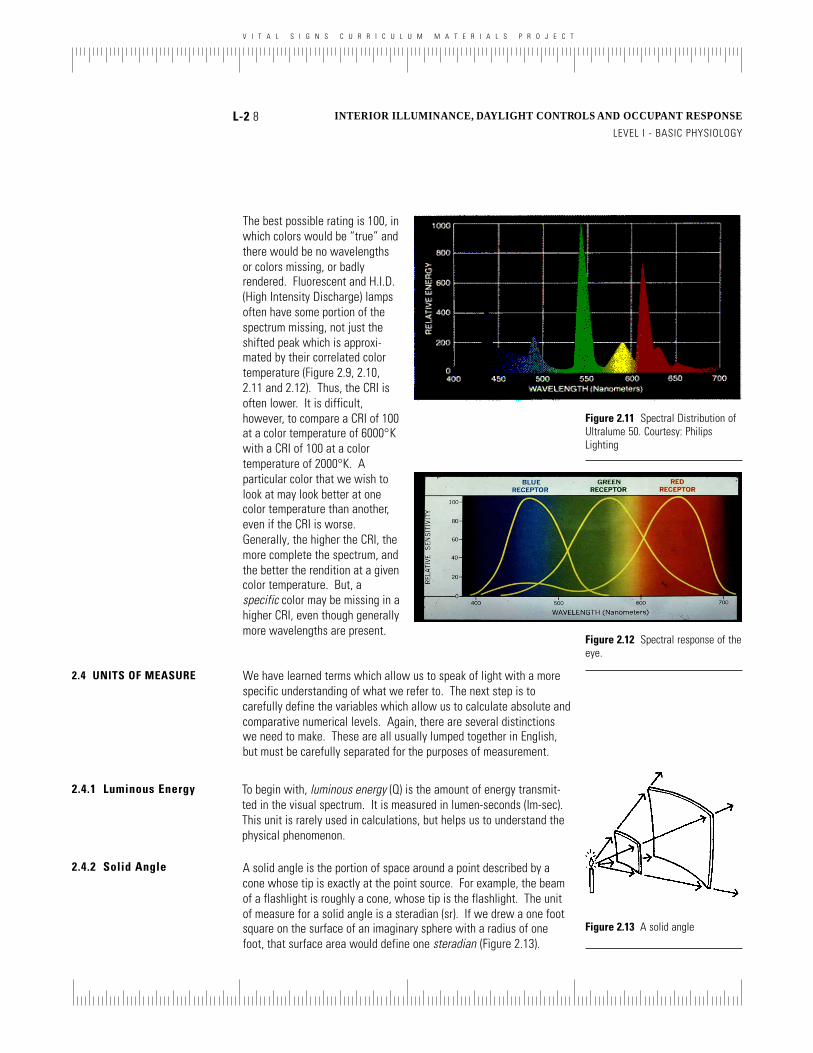
The best possible rating is 100, inwhich colors would be “true” andthere would be no wavelengthsor colors missing, or badlyrendered. Fluorescent and H.I.D.(High Intensity Discharge) lampsoften have some portion of thespectrum missing, not just theshifted peak which is approxi-mated by their correlated colortemperature (Figure 2.9, 2.10,2.11 and 2.12). Thus, the CRI isoften lower. It is difficult,however, to compare a CRI of 100at a color temperature of 6000°Kwith a CRI of 100 at a colortemperature of 2000°K. Aparticular color that we wish tolook at may look better at onecolor temperature than another,even if the CRI is worse.Generally, the higher the CRI, themore complete the spectrum, andthe better the rendition at a givencolor temperature. But, aspecific color may be missing in ahigher CRI, even though generallymore wavelengths are present.
Figure 2.11 Spectral Distribution ofUltralume 50. Courtesy: PhilipsLighting
Figure 2.12 Spectral response of theeye.
We have learned terms which allow us to speak of light with a morespecific understanding of what we refer to. The next step is tocarefully define the variables which allow us to calculate absolute andcomparative numerical levels. Again, there are several distinctionswe need to make. These are all usually lumped together in English,but must be carefully separated for the purposes of measurement.
2.4 UNITS OF MEASURE
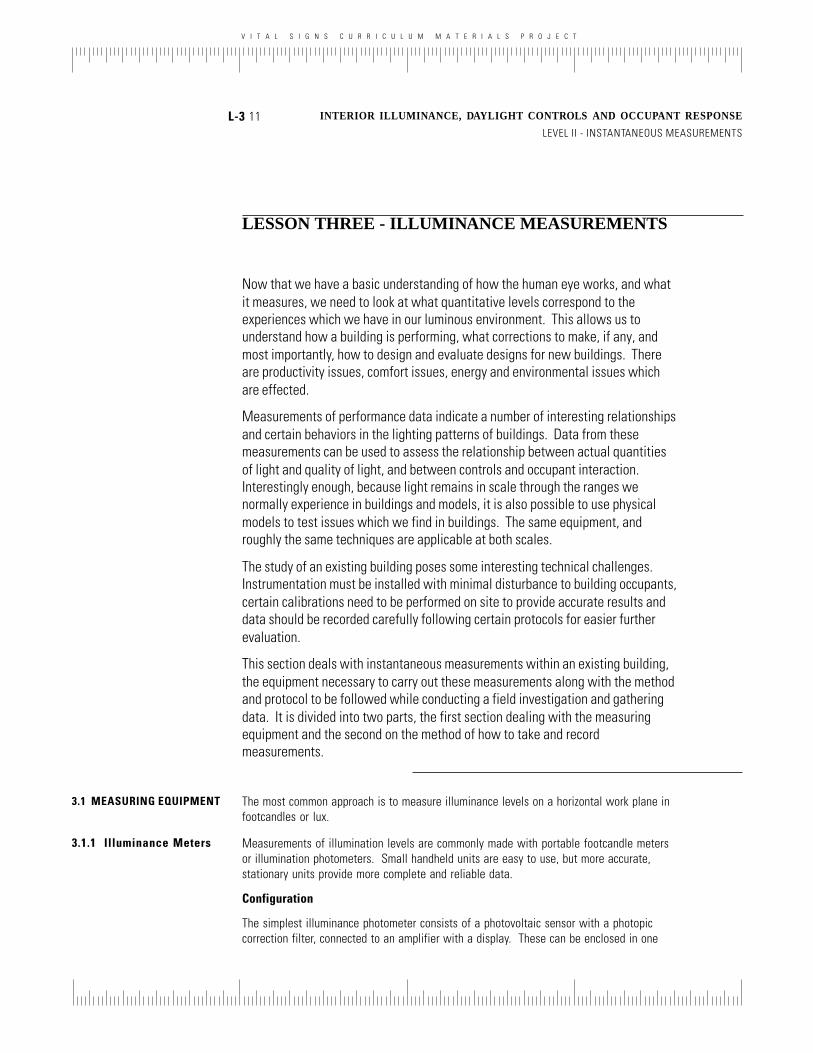
A solid angle is the portion of space around a point described by acone whose tip is exactly at the point source. For example, the beamof a flashlight is roughly a cone, whose tip is the flashlight. The unitof measure for a solid angle is a steradian (sr). If we drew a one footsquare on the surface of an imaginary sphere with a radius of onefoot, that surface area would define one steradian (Figure 2.13).
To begin with, luminous energy (Q) is the amount of energy transmit-ted in the visual spectrum. It is measured in lumen-seconds (lm-sec).This unit is rarely used in calculations, but helps us to understand thephysical phenomenon.
2.4.1 Luminous Energy
2.4.2 Solid Angle
Figure 2.13 A solid angle
V I T A L S I G N S C U R R I C U L U M M A T E R I A L S P R O J E C T
INTERIOR ILLUMINANCE, DAYLIGHT CONTROLS AND OCCUPANT RESPONSE
LEVEL I - BASIC PHYSIOLOGYL-2 9
2.4.3 Luminous Flux If we defined some surface on that sphere (based on the solid angle),the amount of luminous energy, or light, flowing through thattheoretical surface would be termed the luminous flux (f). Thus, it is alight-energy flow rate. The unit for measuring flow through atheoretical surface is the lumen (lm).
2.4.4 Luminous Intensity The amount of light put out by a source in a particular direction iscalled the luminous intensity (I). The unit of measure is the Candela.A luminous intensity of one candela (measured in the direction of thesteradian) results in a luminous flux of one lumen passing through thatsteradian.
2.4.5 Illuminance The light energy arriving at a real surface is the Illuminance (E). Theunit of measure is the lumen per square foot(l/sf).
If we were to place a source measured at one candela (in the directionof a blackboard) at a distance of one foot from the blackboard, therewould be one lumen arriving on one square foot of blackboard surface,resulting in one lumen/square foot. (Figure 2.14). In the SI system theunit comparable to the footcandle is the lux (lx). Note that they arenot the same resultant flux density, since one lumen arriving onto onesquare meter (= 1 lux) is spread much thinner than when it is arrivingonto one square foot (= 1 l/sf). In fact, comparing the density of thetwo units, an illuminance of one footcandle is equal to an illuminanceof 10.764 lux.
Figure 2.14 Relation betweenLuminous flux, intensity andIlluminance
2.4.6 Exitance andLuminance
The term for the luminous fluxdensity leaving a surface is theexitance (M). The unit ofmeasure is the lumen per squarefoot. This is without regard todirection
The magnitude depends on thesurface reflectivity (if the light isreflected) or the transmissivity (ifthe light is transmitted throughfrom the other side).
The term for the luminous fluxdensity leaving a projectedsurface in a particular direction isluminance (L). The unit ofmeasure is the candela/sq. ft. orcandela/m.
Another way to think of this isthat a perfectly reflective surfacereceiving an illuminance of onefootcandle would result in a

V I T A L S I G N S C U R R I C U L U M M A T E R I A L S P R O J E C T
INTERIOR ILLUMINANCE, DAYLIGHT CONTROLS AND OCCUPANT RESPONSE
LEVEL I - BASIC PHYSIOLOGYL-2 10
exitance of one lumen per square foot. If the surface lined up with thesource and the viewpoint, and the illuminance were one footcandle,the luminance would be one footLambert (fL).
Luminance may also refer to the amount of light passing through atranslucent surface. For example, a white surface with a reflectanceof 0.65 and a white material with a transmittance of 0.65 will bothhave the same “brightness” if exposed to the same illumination. Thetranslucent surface will simply have that brightness when seen fromthe far side, rather than the same side as the source.
2.4.7 Contrast When we see a surface, we are sensing the luminance of thatsurface. It is useful to recognize that the way we see the surface,infer things about it, or read things from it is by the variation in theluminance.
For example, if a surface has words printed on it in black ink, then theluminance of that surface varies based on the variation in thereflectance of the surface and the black ink. This is called contrast.In the end, it may be that contrast is the most important thing. Glaremay come from too much contrast, but information is conveyed bysufficient contrast, and sometimes most easily conveyed by a sharp,low level, contrast, such as a diffusely lit, matte surface, printed page.
Contrast may be calculated by comparing the luminance of theadjacent surfaces or the luminance of adjacent reflectances on agiven surface.
CONCLUSIONS Exercise two directly tests your understanding of these terms andconcepts. You may choose to go to the exercise or continue withLevel II, which deals with making measurements with simpleinstrumentation.
REVIEW QUESTIONS 2.1 Must a material be transparent in order to producerefraction?
2.2 Which is less likely to produce glare and veiling reflections,diffuse or direct light?
2.3 What is the difference between color temperature and colorrendition index.
2.4 What is the unit of measure for a solid angle?
2.5 What is the unit of measure of illuminance? What is theunit of measure of luminance? What is the physical difference?
V I T A L S I G N S C U R R I C U L U M M A T E R I A L S P R O J E C T
L-3 11 INTERIOR ILLUMINANCE, DAYLIGHT CONTR OLS AND OCCUPANT RESPONSE
LEVEL II - INSTANTANEOUS MEASUREMENTS
LESSON THREE - ILLUMINANCE MEASUREMENTS
Now that we have a basic understanding of how the human eye works, and whatit measures, we need to look at what quantitative levels correspond to theexperiences which we have in our luminous environment. This allows us tounderstand how a building is performing, what corrections to make, if any, andmost importantly, how to design and evaluate designs for new buildings. Thereare productivity issues, comfort issues, energy and environmental issues whichare effected.
Measurements of performance data indicate a number of interesting relationshipsand certain behaviors in the lighting patterns of buildings. Data from thesemeasurements can be used to assess the relationship between actual quantitiesof light and quality of light, and between controls and occupant interaction.Interestingly enough, because light remains in scale through the ranges wenormally experience in buildings and models, it is also possible to use physicalmodels to test issues which we find in buildings. The same equipment, androughly the same techniques are applicable at both scales.
The study of an existing building poses some interesting technical challenges.Instrumentation must be installed with minimal disturbance to building occupants,certain calibrations need to be performed on site to provide accurate results anddata should be recorded carefully following certain protocols for easier furtherevaluation.
This section deals with instantaneous measurements within an existing building,the equipment necessary to carry out these measurements along with the methodand protocol to be followed while conducting a field investigation and gatheringdata. It is divided into two parts, the first section dealing with the measuringequipment and the second on the method of how to take and recordmeasurements.
3.1 MEASURING EQUIPMENT The most common approach is to measure illuminance levels on a horizontal work plane infootcandles or lux.
3.1.1 Illuminance Meters Measurements of illumination levels are commonly made with portable footcandle metersor illumination photometers. Small handheld units are easy to use, but more accurate,stationary units provide more complete and reliable data.
Configuration
The simplest illuminance photometer consists of a photovoltaic sensor with a photopiccorrection filter, connected to an amplifier with a display. These can be enclosed in one

V I T A L S I G N S C U R R I C U L U M M A T E R I A L S P R O J E C T
L-3 12 INTERIOR ILLUMINANCE, DAYLIGHT CONTR OLS AND OCCUPANT RESPONSE
LEVEL II - INSTANTANEOUS MEASUREMENTS
single case or the sensor and filter can be in onemodule which is connected by a cable to a secondmodule which contains the amplifier and display(Figure 3.1). Because the human eye is so adapt-able, photometers typically detect light over a largerange. Since the illuminance on a surface maycome from anywhere “in front of” the surface, thesensors also typically cover a 180° angle, effec-tively the entire hemisphere which faces the sensor.There are several corrections necessary to give anappropriate reading.
Corrections A B
Figure 3.1 Illuminance Meters, (A)Portable digital Illuminance Meter,(B) Digital meter with remotereceptor. (Courtesy: Minolta )
Color correction
The human eye is not equally sensitive to all the wavelengths i.e.colors. Therefore if a meter should be useful in terms of human eyeresponse, its inherent response must be corrected to that of the eye.Most meters are currently corrected to mimic human eye sensitivityin the photopic range, since this includes both pattern recognitionand color differentiation. Some meters follow the Purkinje shift, andare calibrated to the human eye’s scotopic range. Such meters arerare, and will be specially labeled.
Cosine Correction
The meters must also be corrected for light incident at obliqueangles, and which does not reach the cell due to reflection from thesurface of the sensor or housing. The Cosine Law states that light
Normal to surface
Incident Light
Figure 3.2 The Cosine Law
energy impinging on a surface atan angle q other than the normalis distributed over a greaterarea. For example, area E2 isgreater than area E1 as shown inFigure 3.2. This requires that thesurface of the meter receivinglight be flat, which ensures thatlight reaching the meter fromoblique angles is measured ascontributing less illuminancethan more direct light inaccordance with the Cosine Law(Figure 3.3). Figure 3.3 Geometry of Cosine Correction: (A)
Hemispheric meter is equally sensitive to light from alldirections, (B) Simple flat diffuser approximates cosine-correction but reflects too much light at low angles, and(C) fully cosine corrected meter allows extra light tostrike side of diffuser to compensate for higher diffuserreflectance at lower angle.
The Cosine Law states that E2 = E1 cos(q)
where E = Illumination level in footcandles
and q = angle between the ray of light and thenormal to the surface in degrees
V I T A L S I G N S C U R R I C U L U M M A T E R I A L S P R O J E C T
L-3 13 INTERIOR ILLUMINANCE, DAYLIGHT CONTR OLS AND OCCUPANT RESPONSE
LEVEL II - INSTANTANEOUS MEASUREMENTS
Leveling
For accurate measurements, it is necessary tolevel the photometer, while measuring on unevenor sloping surfaces.
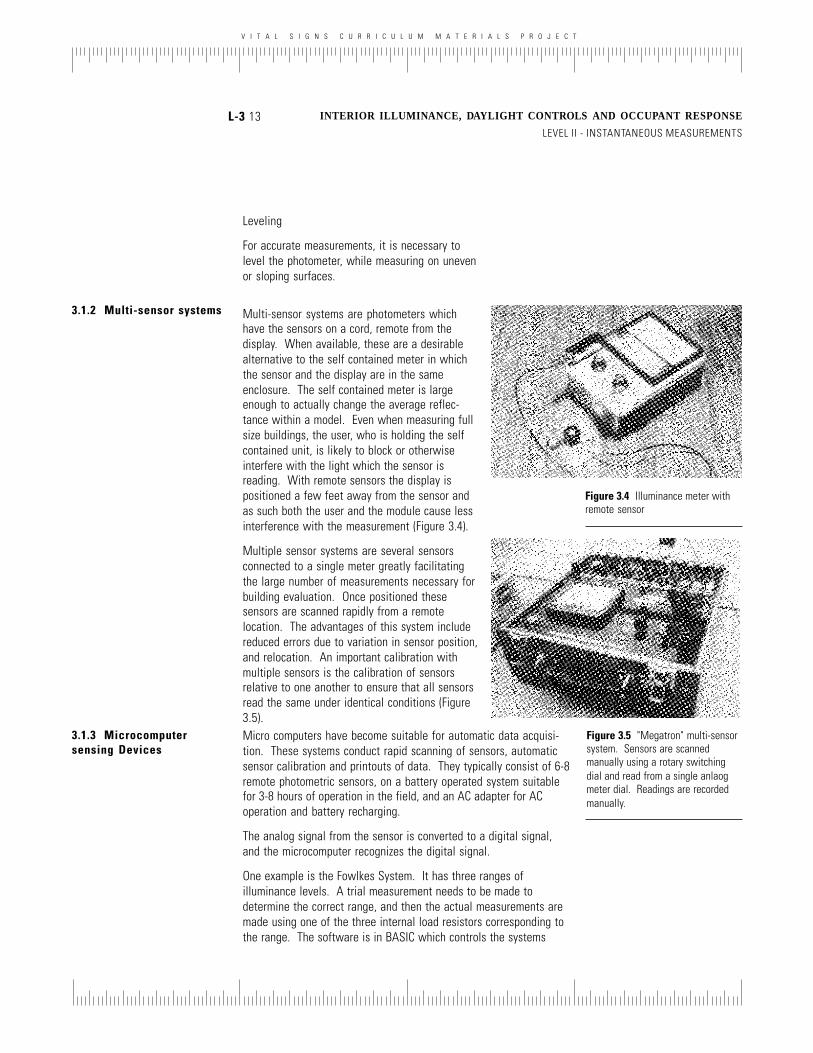
3.1.2 Multi-sensor systems
Figure 3.4 Illuminance meter withremote sensor
Figure 3.5 "Megatron" multi-sensorsystem. Sensors are scannedmanually using a rotary switchingdial and read from a single anlaogmeter dial. Readings are recordedmanually.
Multi-sensor systems are photometers whichhave the sensors on a cord, remote from thedisplay. When available, these are a desirablealternative to the self contained meter in whichthe sensor and the display are in the sameenclosure. The self contained meter is largeenough to actually change the average reflec-tance within a model. Even when measuring fullsize buildings, the user, who is holding the selfcontained unit, is likely to block or otherwiseinterfere with the light which the sensor isreading. With remote sensors the display ispositioned a few feet away from the sensor andas such both the user and the module cause lessinterference with the measurement (Figure 3.4).
Multiple sensor systems are several sensorsconnected to a single meter greatly facilitatingthe large number of measurements necessary forbuilding evaluation. Once positioned thesesensors are scanned rapidly from a remotelocation. The advantages of this system includereduced errors due to variation in sensor position,and relocation. An important calibration withmultiple sensors is the calibration of sensorsrelative to one another to ensure that all sensorsread the same under identical conditions (Figure3.5).
3.1.3 Microcomputersensing Devices
Micro computers have become suitable for automatic data acquisi-tion. These systems conduct rapid scanning of sensors, automaticsensor calibration and printouts of data. They typically consist of 6-8remote photometric sensors, on a battery operated system suitablefor 3-8 hours of operation in the field, and an AC adapter for ACoperation and battery recharging.
The analog signal from the sensor is converted to a digital signal,and the microcomputer recognizes the digital signal.
One example is the Fowlkes System. It has three ranges ofilluminance levels. A trial measurement needs to be made todetermine the correct range, and then the actual measurements aremade using one of the three internal load resistors corresponding tothe range. The software is in BASIC which controls the systems

V I T A L S I G N S C U R R I C U L U M M A T E R I A L S P R O J E C T
L-3 14 INTERIOR ILLUMINANCE, DAYLIGHT CONTR OLS AND OCCUPANT RESPONSE
LEVEL II - INSTANTANEOUS MEASUREMENTS
operation. It is menu driven and controls the scanning of sensors,automatic calibration and computes illuminance and daylight factorsas percentages of exterior illuminance. It is also capable ofcalibrating the sensors on the field.
Another example is the SAM system with Datalit Software fromUCLA. A third example is a Lawson Labs Model 201, 24 bit A/D dataacquisition, which can be connected to any laptop.
Systems which use a computer are usually used for measurementswhich continue over an extended period of time. For more informa-tion, see Lesson 6 - Long Term Illuminance Measurements.
3.2 PROCEDURE FORMEASUREMENT
3.2.1. Preparation Preparing a Hypothesis
Any effective investigation requires careful advance preparation. Itis a good practice to write down a hypothesis or statement of exactlywhat you intend to measure and list out all the variable factorswhich affect the particular behavior you are intent on measuring.You might choose to measure the quantity of light at some criticalpoint in a room, for example, where you expect it to be a minimum.You might intend to plot the distribution of light across the room inthe form of graphs of contours. You may wish to check userproductivity or comfort at various workstations. Prepare a definitionor statement of your objective. Visit the site and estimate spacing,equipment, and possible obstacles. Observe the occupants and tryto predict what surfaces would result in interference between theiractivities and your equipment placement.
Laying out the Grid
Your next step would be to draw out a plan of the space you aremeasuring and mark the points identified for measurement. It isoften useful to make the grid correspond to the physical grid in thespace, for example drop the ceiling grid, lighting grid or follow thefloor tile grid. Make a number of copies of this, to record measure-ments made at various times, and in different situations, e.g. withand without the artificial lights turned on, at 9 a.m. or 5 p.m. etc.The number of points to measure depends on the accuracy required.If testing natural light, the changing sky conditions need to be notedover the period of time taken to measure all the points, including theexterior point.
Equipment
Make a list of equipment necessary to carry out the measurements,depending on the type of measurement to be undertaken. Standardhand held meters (e.g. GE meters) or multi-sensor systems can be
V I T A L S I G N S C U R R I C U L U M M A T E R I A L S P R O J E C T
L-3 15 INTERIOR ILLUMINANCE, DAYLIGHT CONTR OLS AND OCCUPANT RESPONSE
LEVEL II - INSTANTANEOUS MEASUREMENTS
used, and placed corresponding to the grid whichhas been laid out for the particular space.
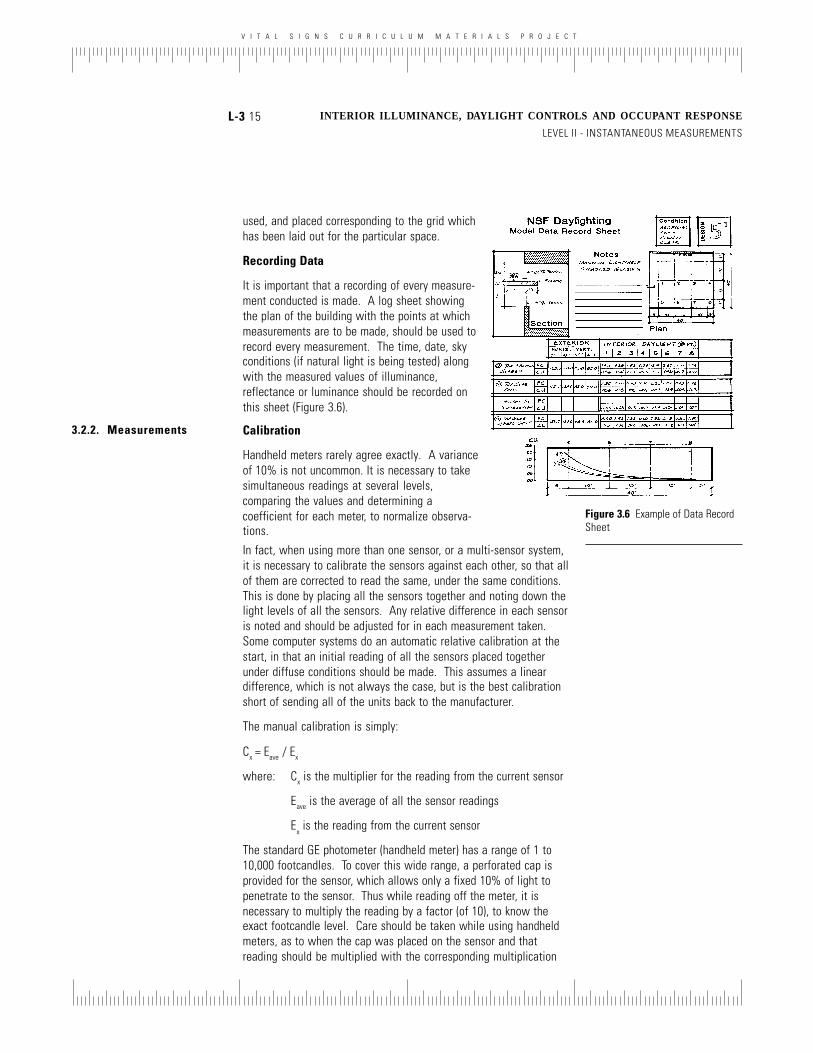
Recording Data
It is important that a recording of every measure-ment conducted is made. A log sheet showingthe plan of the building with the points at whichmeasurements are to be made, should be used torecord every measurement. The time, date, skyconditions (if natural light is being tested) alongwith the measured values of illuminance,reflectance or luminance should be recorded onthis sheet (Figure 3.6).
3.2.2. Measurements
Figure 3.6 Example of Data RecordSheet
Calibration
Handheld meters rarely agree exactly. A varianceof 10% is not uncommon. It is necessary to takesimultaneous readings at several levels,comparing the values and determining acoefficient for each meter, to normalize observa-tions.
In fact, when using more than one sensor, or a multi-sensor system,it is necessary to calibrate the sensors against each other, so that allof them are corrected to read the same, under the same conditions.This is done by placing all the sensors together and noting down thelight levels of all the sensors. Any relative difference in each sensoris noted and should be adjusted for in each measurement taken.Some computer systems do an automatic relative calibration at thestart, in that an initial reading of all the sensors placed togetherunder diffuse conditions should be made. This assumes a lineardifference, which is not always the case, but is the best calibrationshort of sending all of the units back to the manufacturer.
The manual calibration is simply:
Cx = Eave / Ex
where: Cx is the multiplier for the reading from the current sensor
Eave is the average of all the sensor readings
Ex is the reading from the current sensor
The standard GE photometer (handheld meter) has a range of 1 to10,000 footcandles. To cover this wide range, a perforated cap isprovided for the sensor, which allows only a fixed 10% of light topenetrate to the sensor. Thus while reading off the meter, it isnecessary to multiply the reading by a factor (of 10), to know theexact footcandle level. Care should be taken while using handheldmeters, as to when the cap was placed on the sensor and thatreading should be multiplied with the corresponding multiplication
V I T A L S I G N S C U R R I C U L U M M A T E R I A L S P R O J E C T
L-3 16 INTERIOR ILLUMINANCE, DAYLIGHT CONTR OLS AND OCCUPANT RESPONSE
LEVEL II - INSTANTANEOUS MEASUREMENTS
factor and recorded simultaneously in the record sheet. Thishappens particularly when you move from indoors to outdoors andthe light levels change considerably. Other meters have ranges setelsewhere on the display, and some are auto ranging, which meansthey reset themselves.
Making Measurements
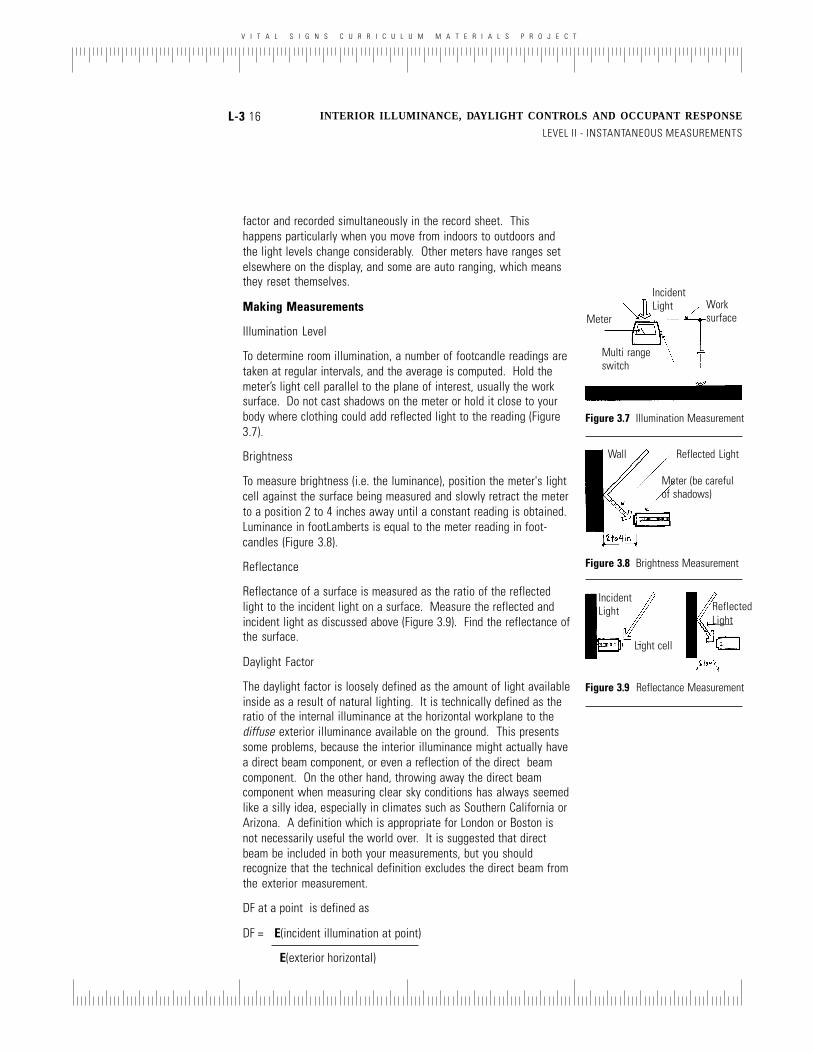
Illumination Level
To determine room illumination, a number of footcandle readings aretaken at regular intervals, and the average is computed. Hold themeter’s light cell parallel to the plane of interest, usually the worksurface. Do not cast shadows on the meter or hold it close to yourbody where clothing could add reflected light to the reading (Figure3.7).
Brightness
To measure brightness (i.e. the luminance), position the meter's lightcell against the surface being measured and slowly retract the meterto a position 2 to 4 inches away until a constant reading is obtained.Luminance in footLamberts is equal to the meter reading in foot-candles (Figure 3.8).
Reflectance
Reflectance of a surface is measured as the ratio of the reflectedlight to the incident light on a surface. Measure the reflected andincident light as discussed above (Figure 3.9). Find the reflectance ofthe surface.
Daylight Factor
The daylight factor is loosely defined as the amount of light availableinside as a result of natural lighting. It is technically defined as theratio of the internal illuminance at the horizontal workplane to thediffuse exterior illuminance available on the ground. This presentssome problems, because the interior illuminance might actually havea direct beam component, or even a reflection of the direct beamcomponent. On the other hand, throwing away the direct beamcomponent when measuring clear sky conditions has always seemedlike a silly idea, especially in climates such as Southern California orArizona. A definition which is appropriate for London or Boston isnot necessarily useful the world over. It is suggested that directbeam be included in both your measurements, but you shouldrecognize that the technical definition excludes the direct beam fromthe exterior measurement.
DF at a point is defined as
DF = E(incident illumination at point)
E(exterior horizontal)
Multi rangeswitch
MeterWorksurface
IncidentLight
Figure 3.8 Brightness Measurement
Reflected LightWall
Meter (be carefulof shadows)
Figure 3.7 Illumination Measurement
IncidentLight
Light cell
ReflectedLight
Figure 3.9 Reflectance Measurement
V I T A L S I G N S C U R R I C U L U M M A T E R I A L S P R O J E C T
L-3 17 INTERIOR ILLUMINANCE, DAYLIGHT CONTR OLS AND OCCUPANT RESPONSE
LEVEL II - INSTANTANEOUS MEASUREMENTS
Obviously, the daylight factor is defined only when the interiorelectrical illumination sources are turned off. It is useful becauseeven though the absolute level of light available outside mightchange drastically, the daylight factor for a given time of day and skycondition remains fairly constant. Indeed, in overcast skies, the timeof day does not seem to be a factor. The only variable is the actualexterior illuminance, and the interior illuminance remains a fairlyconstant fraction.
Protocols
1. Make a trial measurement at the start of any investigationto establish illuminance ranges.
2. Calibrate the sensors (refer section 3.2.2).
3. While placing photocells, either indoors or outdoors, makesure that the plane of the photocells is parallel to the plane of thesurface you are testing. If they cannot be held in that relationship,then try to mount them on a surface which can be placed in thatrelationship. Some Licor and Eppley sensors come with small selfleveling podiums.
4. Read all measurements on the appropriate scale. If themeasurement is at the end of one range, use both of the overlappingranges, and record the fact. If possible, use the values from thesame range on all of the internal measurements. If not, make certainthat there is a record of which range produced which measurement.
5. When making any interior measurements which includedaylight, repeat the measurement, shutting off the lights, and takinga simultaneous measurement of the exterior light levels, to helpdetermine daylight factors, sky luminances etc. This is done byplacing 2 of the 8 sensors outside, one measuring the direct anddiffuse component of sunlight (by placing it in direct sunlight), theother measuring just the diffuse component (by shading it from directbeam sunlight without reducing diffuse radiation). If you are usingonly one sensor, take the outside measurements at the beginning ofthe sequence of measurements, proceed through the series asrapidly as possible, and take an outside measurement again at theend. If there is greater than 10% variance, repeat the series. Ifthere is less than 10%, use an average of the first and last measure-ments as the outside value.

V I T A L S I G N S C U R R I C U L U M M A T E R I A L S P R O J E C T
L-3 18 INTERIOR ILLUMINANCE, DAYLIGHT CONTR OLS AND OCCUPANT RESPONSE
LEVEL II - INSTANTANEOUS MEASUREMENTS
CONCLUSIONS Instantaneous illuminance measurements are necessary not only forpredicting the quantity of light available at the point for performingthe task, but can also to allow an evaluation of the comparativedistribution of light levels within the space. You have learned howto make instantaneous illuminance measurements. You may beastounded by the amount of data you can collect by just making onerun of measurements. In Exercise 3 you may experience how torecord and more importantly, how to analyze the resultant data toobtain useful information from your measurements.
REVIEW QUESTIONS 3.1 Sensors are usually color corrected. What do they matchwhen the color correction is complete?
3.2 Why is the daylight factor a useful calculation? (Whereand why might it be less useful?)
3.3 Why is it necessary to normalize (or cross calibrate)sensors if you are using more than one?
3.4 What formula would you use to calibrate manually?
REFERENCES 1. “1994 IESNA Survey of Illuminance and Luminance Meters”, Lighting Design and Application,June 1994.2. “Measurement of Light and other Radiant Energy”, IES Lighting Design Handbook.3. Orfield, Steven J., “Photometry and luminance distribution: Conventional Photometry versusCAPCALC”, Lighting Design and Application, Jan. 1990, Pg. 8.4. Lynes, J. A. “Principles of Natural Lighting”, Elsevier Publishing Co. Ltd., London, 1968.5. DNNA/Schiler, “Simulating Daylight with Architectural Models”, Chapter 4.6. McGuinness, William J., Stein, Benjamin, and Reynolds, John S., “Mechanical and Electricalequipment for buildings”, John Wiley and Sons Inc.

V I T A L S I G N S C U R R I C U L U M M A T E R I A L S P R O J E C T
L-4 19 INTERIOR ILLUMINANCE, DAYLIGHT CONTROLS AND OCCUPANT RESPONSE
LEVEL II - INSTANTANEOUS MEASUREMENTS
LESSON FOUR - LUMINANCE MEASUREMENTS
Now that we have understood illuminance, and illuminance measurementtechniques, it is time to realize that what we see is not the illuminance of asurface, but the luminance. Vision is about luminances, contrasts and brightnessof surfaces in the field of view. What we perceive is not the illuminance on asurface, but the light that is leaving that surface or the luminance of the surface.To be able to accurately evaluate the visual environment, it is necessary tounderstand this distinction. A good lighting environment is not just one whichhas adequate levels of light (illumination) to complete the task, but also whichhas no excessive contrasts, and bright areas in the field of view. Furthermore,any creative design done with lighting, is really done with the luminance of thesurfaces.
When light falls on a surface, the luminous flux is spread over the surface. Thisis illuminance. This, however, does not yet cause a visual response. The lighthas to be reflected back to the eye, where the retina receives it and compares thelight received from all the surfaces, to generate a visual response. This is calledthe luminance of the surface. It is a physical, measurable quantity, and dependson the illumination on the surface and the material property of the surface.Brightness is one more term used while describing a visual environment. It isoften confused with luminance, but their difference needs to be understood. It isa nonphysical quantity and is defined as the subjective or comparative appraisalof the luminance at a given adaptation level. An automobile headlight isconsidered very bright at night, when the background luminances are very low.The same headlight has the same luminance during the day, but it is notconsidered very bright, because the eye has adjusted to the backgroundluminances of daylight, which are much higher.
When we evaluate the visual environment in terms of comfort, excessivebrightness, glare etc. we are talking of our perception of the luminances in thefield of view. Hence to be able to quantify glare and contrasts in the field of viewand the overall visual comfort within the space, it is necessary to measure theluminances within the space and also to comprehend how we respondperceptually to these luminous distributions.
This section deals with luminance measurements and protocols for makingmeasurements as well as a discussion of visual comfort, glare and glareevaluators.
V I T A L S I G N S C U R R I C U L U M M A T E R I A L S P R O J E C T
L-4 20 INTERIOR ILLUMINANCE, DAYLIGHT CONTROLS AND OCCUPANT RESPONSE
LEVEL II - INSTANTANEOUS MEASUREMENTS
4.1 LUMINANCE METERS
4.1.1 Configuration
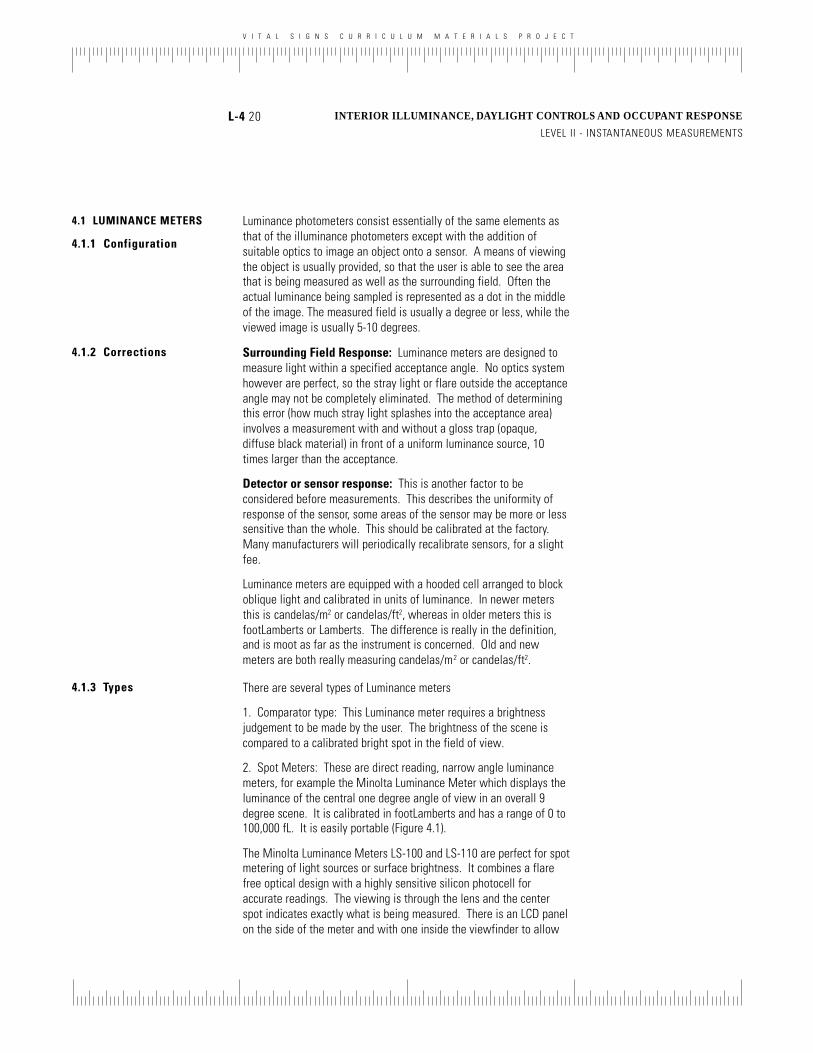
Luminance photometers consist essentially of the same elements asthat of the illuminance photometers except with the addition ofsuitable optics to image an object onto a sensor. A means of viewingthe object is usually provided, so that the user is able to see the areathat is being measured as well as the surrounding field. Often theactual luminance being sampled is represented as a dot in the middleof the image. The measured field is usually a degree or less, while theviewed image is usually 5-10 degrees.
4.1.2 Corrections Surrounding Field Response: Luminance meters are designed tomeasure light within a specified acceptance angle. No optics systemhowever are perfect, so the stray light or flare outside the acceptanceangle may not be completely eliminated. The method of determiningthis error (how much stray light splashes into the acceptance area)involves a measurement with and without a gloss trap (opaque,diffuse black material) in front of a uniform luminance source, 10times larger than the acceptance.
Detector or sensor response: This is another factor to beconsidered before measurements. This describes the uniformity ofresponse of the sensor, some areas of the sensor may be more or lesssensitive than the whole. This should be calibrated at the factory.Many manufacturers will periodically recalibrate sensors, for a slightfee.
Luminance meters are equipped with a hooded cell arranged to blockoblique light and calibrated in units of luminance. In newer metersthis is candelas/m2 or candelas/ft2, whereas in older meters this isfootLamberts or Lamberts. The difference is really in the definition,and is moot as far as the instrument is concerned. Old and newmeters are both really measuring candelas/m2 or candelas/ft2.
4.1.3 Types There are several types of Luminance meters
1. Comparator type: This Luminance meter requires a brightnessjudgement to be made by the user. The brightness of the scene iscompared to a calibrated bright spot in the field of view.
2. Spot Meters: These are direct reading, narrow angle luminancemeters, for example the Minolta Luminance Meter which displays theluminance of the central one degree angle of view in an overall 9degree scene. It is calibrated in footLamberts and has a range of 0 to100,000 fL. It is easily portable (Figure 4.1).
The Minolta Luminance Meters LS-100 and LS-110 are perfect for spotmetering of light sources or surface brightness. It combines a flarefree optical design with a highly sensitive silicon photocell foraccurate readings. The viewing is through the lens and the centerspot indicates exactly what is being measured. There is an LCD panelon the side of the meter and with one inside the viewfinder to allow

V I T A L S I G N S C U R R I C U L U M M A T E R I A L S P R O J E C T
L-4 21 INTERIOR ILLUMINANCE, DAYLIGHT CONTROLS AND OCCUPANT RESPONSE
LEVEL II - INSTANTANEOUS MEASUREMENTS
readings to be taken while viewing the object. Ithas a wide measuring range, with two modes ofmeasurement available, cd/sq.m. or infootLamberts and in percentages to compare theluminance of two light sources. Peak measure-ment can also be displayed. It has a one degreeacceptance angle within a nine degree field ofview. One of the most important considerations inthe construction fo the spot luminance meter is inthe reduction of the influence from light outsidethe photocell’s angle of acceptance. The objectlens focusses the light entering the meterprecisely so that only the light within the centerspot is measured (Figure 4.2). Figure 4.1 The Minolta Luminance
Meter3. Laboratory Unit: This is a more sophisticated unit, which readsboth luminance and contrast. It is useful in determining the effect ofveiling reflections and contrast reduction, luminance ratios etc. It is avery accurate instrument and measures in the range of 0 to 56,400footLamberts.
Figure 4.2 The Viewfinder - MinoltaLuminance meter
4.2 GLARE AND VISUALCOMFORT
Visual comfort is taken to mean the absence of a sensation ofphysiological pain, irritation or distraction. Visual Comfort within aspace depends on the contrast levels and luminance variations acrossthe space. Glare is the chief cause of visual discomfort and can resultin the occupant interacting with the lighting system. Occupantinteraction with lighting and lighting control systems can significantlyimpact the energy use patterns of spaces. If issues of glare and visualdiscomfort are understood during the initial design process, they couldbe designed for and hence affect the predicted energy requirements ofa space.
4.3 DEFINITIONS
4.3.1 Luminance
The light energy leaving a surface in a particular direction is calledluminance. It is described physically as the portion of the illuminanceof the surface which is reflected or transmitted.
L = E x ρ, or L = E x τ
where ρ = reflectivity of surface and τ = transmissivity of surface
It is an absolute value, and its technical definition is
L = d2φ
dωdAθ
where Aθ = area viewed from angle q and
ω = solid angle taken in the direction of the viewer
and φ = the luminous flux
V I T A L S I G N S C U R R I C U L U M M A T E R I A L S P R O J E C T
L-4 22 INTERIOR ILLUMINANCE, DAYLIGHT CONTROLS AND OCCUPANT RESPONSE
LEVEL II - INSTANTANEOUS MEASUREMENTS
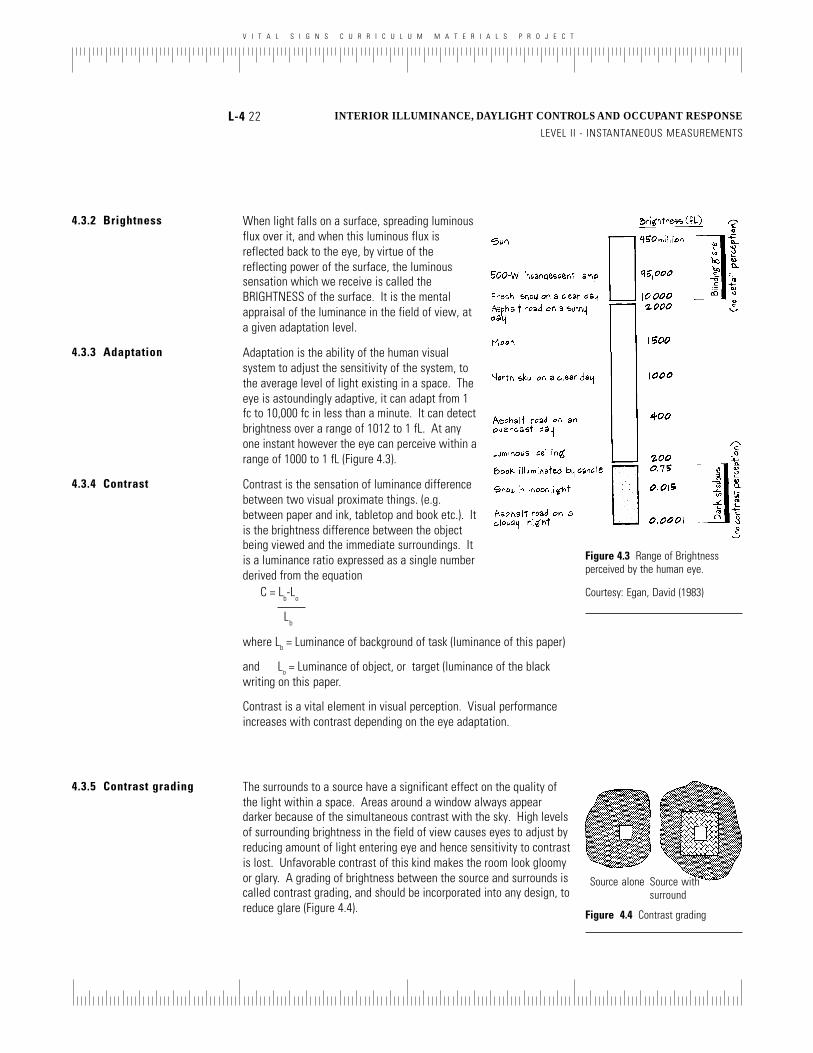
4.3.2 Brightness When light falls on a surface, spreading luminousflux over it, and when this luminous flux isreflected back to the eye, by virtue of thereflecting power of the surface, the luminoussensation which we receive is called theBRIGHTNESS of the surface. It is the mentalappraisal of the luminance in the field of view, ata given adaptation level.
4.3.3 Adaptation Adaptation is the ability of the human visualsystem to adjust the sensitivity of the system, tothe average level of light existing in a space. Theeye is astoundingly adaptive, it can adapt from 1fc to 10,000 fc in less than a minute. It can detectbrightness over a range of 1012 to 1 fL. At anyone instant however the eye can perceive within arange of 1000 to 1 fL (Figure 4.3).
4.3.4 Contrast Contrast is the sensation of luminance differencebetween two visual proximate things. (e.g.between paper and ink, tabletop and book etc.). Itis the brightness difference between the objectbeing viewed and the immediate surroundings. Itis a luminance ratio expressed as a single numberderived from the equation
Figure 4.3 Range of Brightnessperceived by the human eye.
Courtesy: Egan, David (1983) C = Lb-L
o
Lb
where Lb = Luminance of background of task (luminance of this paper)
and Lo = Luminance of object, or target (luminance of the blackwriting on this paper.
Contrast is a vital element in visual perception. Visual performanceincreases with contrast depending on the eye adaptation.
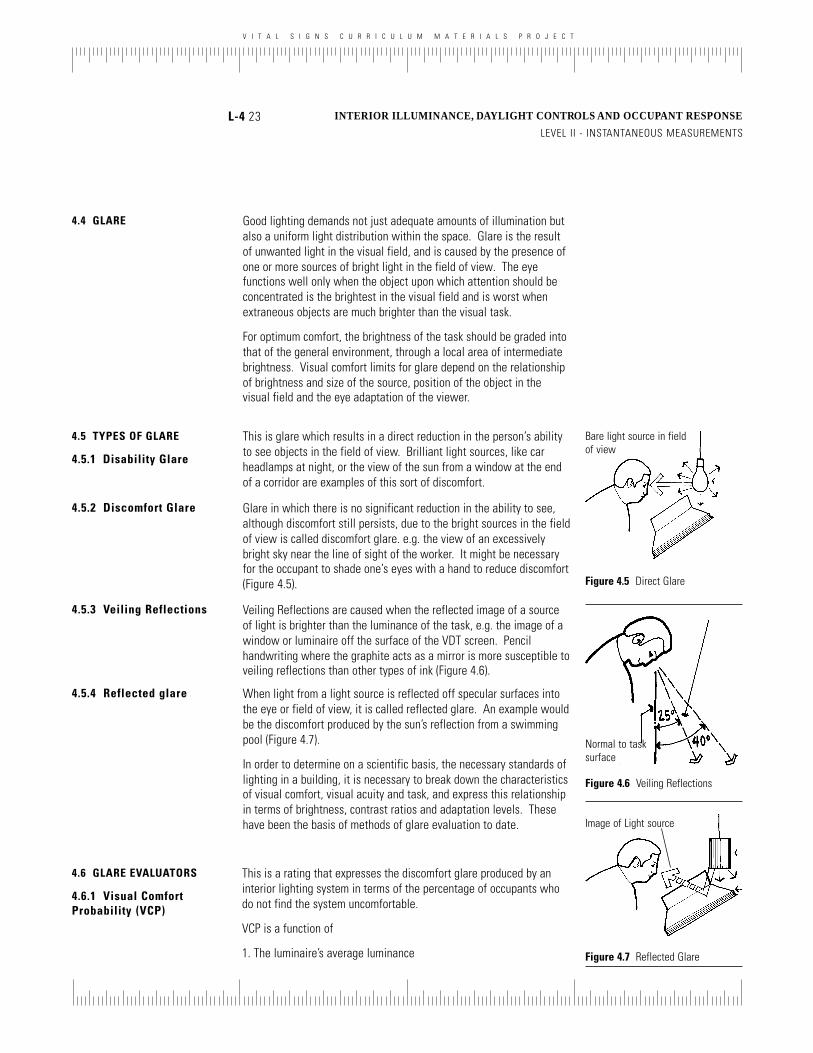
4.3.5 Contrast grading The surrounds to a source have a significant effect on the quality ofthe light within a space. Areas around a window always appeardarker because of the simultaneous contrast with the sky. High levelsof surrounding brightness in the field of view causes eyes to adjust byreducing amount of light entering eye and hence sensitivity to contrastis lost. Unfavorable contrast of this kind makes the room look gloomyor glary. A grading of brightness between the source and surrounds iscalled contrast grading, and should be incorporated into any design, toreduce glare (Figure 4.4).
Source alone
Figure 4.4 Contrast grading
Source withsurround
V I T A L S I G N S C U R R I C U L U M M A T E R I A L S P R O J E C T
L-4 23 INTERIOR ILLUMINANCE, DAYLIGHT CONTROLS AND OCCUPANT RESPONSE
LEVEL II - INSTANTANEOUS MEASUREMENTS
4.4 GLARE Good lighting demands not just adequate amounts of illumination butalso a uniform light distribution within the space. Glare is the resultof unwanted light in the visual field, and is caused by the presence ofone or more sources of bright light in the field of view. The eyefunctions well only when the object upon which attention should beconcentrated is the brightest in the visual field and is worst whenextraneous objects are much brighter than the visual task.
For optimum comfort, the brightness of the task should be graded intothat of the general environment, through a local area of intermediatebrightness. Visual comfort limits for glare depend on the relationshipof brightness and size of the source, position of the object in thevisual field and the eye adaptation of the viewer.
4.5 TYPES OF GLARE
4.5.1 Disability Glare
This is glare which results in a direct reduction in the person’s abilityto see objects in the field of view. Brilliant light sources, like carheadlamps at night, or the view of the sun from a window at the endof a corridor are examples of this sort of discomfort.
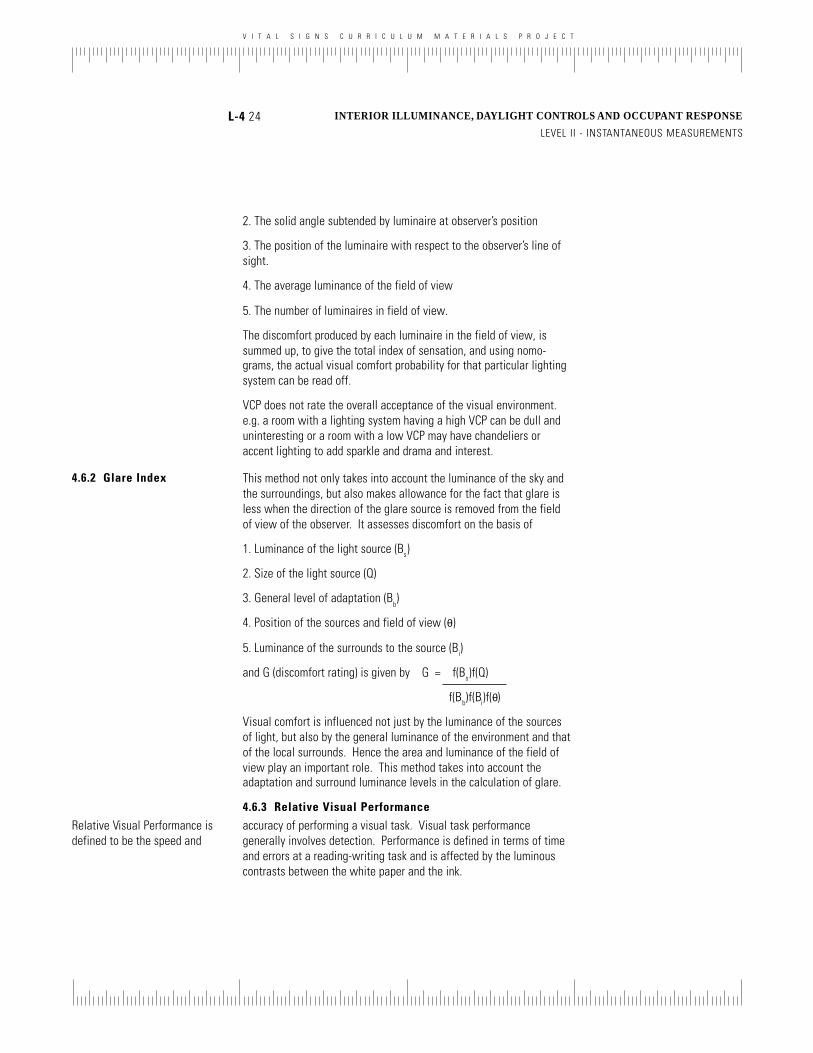
4.5.2 Discomfort Glare Glare in which there is no significant reduction in the ability to see,although discomfort still persists, due to the bright sources in the fieldof view is called discomfort glare. e.g. the view of an excessivelybright sky near the line of sight of the worker. It might be necessaryfor the occupant to shade one’s eyes with a hand to reduce discomfort(Figure 4.5).
4.5.3 Veiling Reflections Veiling Reflections are caused when the reflected image of a sourceof light is brighter than the luminance of the task, e.g. the image of awindow or luminaire off the surface of the VDT screen. Pencilhandwriting where the graphite acts as a mirror is more susceptible toveiling reflections than other types of ink (Figure 4.6).
Bare light source in fieldof view
Figure 4.5 Direct Glare
Normal to tasksurface
Figure 4.6 Veiling Reflections
4.5.4 Reflected glare When light from a light source is reflected off specular surfaces intothe eye or field of view, it is called reflected glare. An example wouldbe the discomfort produced by the sun’s reflection from a swimmingpool (Figure 4.7).
In order to determine on a scientific basis, the necessary standards oflighting in a building, it is necessary to break down the characteristicsof visual comfort, visual acuity and task, and express this relationshipin terms of brightness, contrast ratios and adaptation levels. Thesehave been the basis of methods of glare evaluation to date.
Figure 4.7 Reflected Glare
Image of Light source
4.6 GLARE EVALUATORS
4.6.1 Visual ComfortProbability (VCP)
This is a rating that expresses the discomfort glare produced by aninterior lighting system in terms of the percentage of occupants whodo not find the system uncomfortable.
VCP is a function of
1. The luminaire’s average luminance
V I T A L S I G N S C U R R I C U L U M M A T E R I A L S P R O J E C T
L-4 24 INTERIOR ILLUMINANCE, DAYLIGHT CONTROLS AND OCCUPANT RESPONSE
LEVEL II - INSTANTANEOUS MEASUREMENTS
2. The solid angle subtended by luminaire at observer’s position
3. The position of the luminaire with respect to the observer’s line ofsight.
4. The average luminance of the field of view
5. The number of luminaires in field of view.
The discomfort produced by each luminaire in the field of view, issummed up, to give the total index of sensation, and using nomo-grams, the actual visual comfort probability for that particular lightingsystem can be read off.
VCP does not rate the overall acceptance of the visual environment.e.g. a room with a lighting system having a high VCP can be dull anduninteresting or a room with a low VCP may have chandeliers oraccent lighting to add sparkle and drama and interest.
4.6.2 Glare Index This method not only takes into account the luminance of the sky andthe surroundings, but also makes allowance for the fact that glare isless when the direction of the glare source is removed from the fieldof view of the observer. It assesses discomfort on the basis of
1. Luminance of the light source (Bs)
2. Size of the light source (Q)
3. General level of adaptation (Bb)
4. Position of the sources and field of view (θ)
5. Luminance of the surrounds to the source (Bi)
and G (discomfort rating) is given by G = f(Bs)f(Q)
f(Bb)f(Bi)f(θ)
Visual comfort is influenced not just by the luminance of the sourcesof light, but also by the general luminance of the environment and thatof the local surrounds. Hence the area and luminance of the field ofview play an important role. This method takes into account theadaptation and surround luminance levels in the calculation of glare.
4.6.3 Relative Visual Performance
Relative Visual Performance isdefined to be the speed and
accuracy of performing a visual task. Visual task performancegenerally involves detection. Performance is defined in terms of timeand errors at a reading-writing task and is affected by the luminouscontrasts between the white paper and the ink.
V I T A L S I G N S C U R R I C U L U M M A T E R I A L S P R O J E C T
L-4 25 INTERIOR ILLUMINANCE, DAYLIGHT CONTROLS AND OCCUPANT RESPONSE
LEVEL II - INSTANTANEOUS MEASUREMENTS
Contrast measurements of the ink calibration squares is calculated by
Cv = L
b - L
t
Lb
where Lt is the luminance of the calibration square
Lb is the luminance of the paper adjacent to the calibrationsquare.
The relationship between each performance measure and contrast ata given adaptation level and ‘S’, the time taken to complete a task, isused to evaluate conditions of visual comfort within a space.
4.7 LUMINANCEMEASUREMENTS
It may be necessary not only to know the individual luminances ofsmall areas of an interior, but also the average luminance of a largerarea. To evaluate the visual environment and visual comfort within it,it is necessary to be able to see the entire view, and measure a sort ofaverage luminance of the view. This can be done with the help of thevisual luminance photometer. The advantage of this is that theparticular area whose luminance is being measured can be seen atthe time of measurement. This becomes extremely important whentrying to evaluate comfort at specific task locations.
To determine the Glare Index for any building, it is necessary to takemeasurements of the luminances of the glary sources, e.g. a windowor a lamp, using the luminance photometer and also the generalbackground luminance or what can be called the adaptation level.The adaptation level can be measured with the same photometers,after deciding which parts of the view should be included in thebackground to constitute the field of view.
Luminance meters give average luminances for surfaces. There isvery little or almost no calibration involved. The number of samplingpoints is limited to the number of meters which are available. Thesemeasurements are instantaneous and need to be recorded separatelyto measure over a period of time.
CONCLUSIONS Luminance is that which we actually see. It is strongly related toilluminance and reflectance. Brightness is a sensation related to thecomparative luminances of object and background, and not to absoluteilluminance and luminance. Understanding the difference betweenilluminance and luminance is critical to an understanding of the visualenvironment. Handheld luminance meters can provide a sense of theranges in luminance which are experienced in different environments.It is especially important to understand the relationship betweencontrast, brightness and glare.
V I T A L S I G N S C U R R I C U L U M M A T E R I A L S P R O J E C T
L-4 26 INTERIOR ILLUMINANCE, DAYLIGHT CONTROLS AND OCCUPANT RESPONSE
LEVEL II - INSTANTANEOUS MEASUREMENTS
REVIEW QUESTIONS 4.1 What is the difference between illuminance and luminance?Which is measured by aiming a device at a workspace, as opposed toplacing the device within the workspace?
4.2 Do all reflections cause glare?
4.3 Why is adaptation so important in determining glare? Howis it taken into account in the Glare Index?
REFERENCES 1. Hopkinson, R. G., “Evaluation of Glare”, Illuminating Engineering, June 1957, Pg. 3052. Robbins, C.L., “Daylighting Design and Analysis”, VonNostrand Reinhold Book, 1986.3. Hopkinson, R. G., “Architectural Physics: Lighting”, Her Majesty’s Stationery Office, 1963.4. DiLaura, David, L., “On the Computation of visual comfort probability”, IES Transaction, Journalof the Illuminating Engineering Society, July 1976, Pg. 207.5. Subcom. on Direct Glare(1972), Preamble by Calculation Procedures Com.(1991), “ComputingVisual Comfort Ratings for Interior Lighting”, RQQ Report No.2 with the 1991 Preamble Outline ofa Standard Procedure for Computing Visual Comfort Ratings for Interior Lighting, IES LM42, 1991.6. Gary, Gillette, “A Daylighting Model for Building Energy Simulation”, NBS Building ScienceSeries 152, U.S. Dept. of Comm.7. Lynes, J.A., “Principles of Natural Lighting”, Elsevier Publishing Co. Ltd., London, 1968.8. Rea, M. S., “Towards a Model of Visual Performance: Foundations and Data”, Journal of theIlluminating Engineering Society, Summer 1986, Pg. 41.9. Rea, M. S., “Toward a Model of Visual Performance: A Review of Methodologies”, Journal ofthe Illuminating Engineering Society, Winter 1987, Pg. 128.10. Kambich, D. G., “An Alternative Relative Visual Performance Model”, Journal of theIlluminating Engineering Society, Winter 1991, Pg. 19.11. Hopkinson, R. G., Petherbridge, P., Longmore, J., “Daylighting”, Heinemann, London, 1966.12. McGuinness, William J., Stein, Benjamin, and Reynolds, John S., “Mechanical and Electricalequipment for buildings”, John Wiley and Sons Inc.13. Egan, David M., “Concepts in Architectural Lighting”, McGraw-Hill Book Company.14. Subcom. on Guide for Measurement of Photometric Brightness of the Com. on TestingProcedures of the Illuminating Engineering Society, “IES Guide for Measurement of PhotometricBrightness (Luminance)”, Illuminating Engineering, July 1961, Pg. 457.15. “1994 IESNA Survey of Illuminance and Luminance Meters”, Lighting Design and Application,June 1994.16. “Measurement of Light and other Radiant Energy”, IES Lighting Design Handbook.17. Orfield, Steven J., “Photometry and luminance distribution: Conventional Photometry versusCAPCALC”, Lighting Design and Application, Jan. 1990, Pg. 8.18. DNNA/Schiler, “Simulating Daylight with Architectural Models”, Chapter 4.

V I T A L S I G N S C U R R I C U L U M M A T E R I A L S P R O J E C T
L-5 27 INTERIOR ILLUMINANCE, DAYLIGHT CONTROLS AND OCCUPANT RESPONSE
LEVEL II - INSTANTANEOUS MEASUREMENTS
Physical models can be used to test measurementtechniques and ideas. Building physical modelsand measuring within them has been a methodwhich has been actively recognized over the pastfew years. Scale models can be used for avariety of tasks, from actual quantitativemeasurements to providing a visual andphotographic record of the space. They can alsobe used to test various daylighting options earlyin the design stage and how each affects thequantity of light and perception of the space. Itoffers a way to evaluate light levels in an areawhere design with numbers alone does notensure a fine building.
The principal reason why daylighting models arebeing used to test lighting strategies is becauseof their accuracy in predicting light behavior anddistribution within a space. Light waves(electromagnetic waves) have extremely smallwavelengths (380-750 nm) compared to the sizeof a model or that of a real space. Therefore theybehave in the same way within a model as theywould in an actual space (Figure 5.1). If theactual space is modeled accurately, all surfaces,furniture, fixtures and textures scaled exactly, the
Figure 5.1 Model of a space
LESSON FIVE - PHYSICAL MODELS
model’s lighting characteristics will be exactly similar to that of the actual space (Figure 5.2).
Perhaps the most important benefit is that models can be used to answer questions about variousaspects of the building design. Various design options can be quickly and accurately studied in thesmall period of time taken to change the model to reflect the design. Quantitative data about lightdetermines its adequacy for meeting visual needs. With this information projections about electriclighting and conditioning can be proposed. It provides information about visual comfort, glare andcontrasts within a space. It provides a clear picture of how the daylighting system will providelight in the building and how different materials, furniture layouts, colors etc. will affect thisdistribution of light within the space.
This section describes in short how to make models and decide upon the scale of the model, testthe model under artificial or natural sky as well as develop guidelines to follow whilephotographing or recording within the space.
Figure 5.2 The actual space
V I T A L S I G N S C U R R I C U L U M M A T E R I A L S P R O J E C T
L-5 28 INTERIOR ILLUMINANCE, DAYLIGHT CONTROLS AND OCCUPANT RESPONSE
LEVEL II - INSTANTANEOUS MEASUREMENTS
5.1 QUANTITATIVEEVALUATION
Before starting to model and measure light within the space a fewdecisions need to be made. This will reduce unnecessary changesand modifications later in the measurement stages.
5.1.1 What to measure? This will decide the scale of your model as well as all the variablesyou wish to investigate.
5.1.2 Scale of Model Models can range from simple massing models ( to study shade andshadow patterns) to full scale mockups of rooms (to evaluate furniturepatterns, colors and textures and their effect on the lighting).Depending on what you intend to test, the scale and type of modelsshould be decided upon. An important consideration to be madewhile deciding the scale of the model is the kind of direct, visualobservation that will be employed to evaluate the model, e.g. a viewport for photographing the interior. The level of data needed andevaluation techniques used also affect the scale of the model. Simplequestions about two or three skylight alternatives can often be doneat 1/2" = 1"-0". Qualitative models, for photographing interiors, are 1"= 1'-0" or larger.
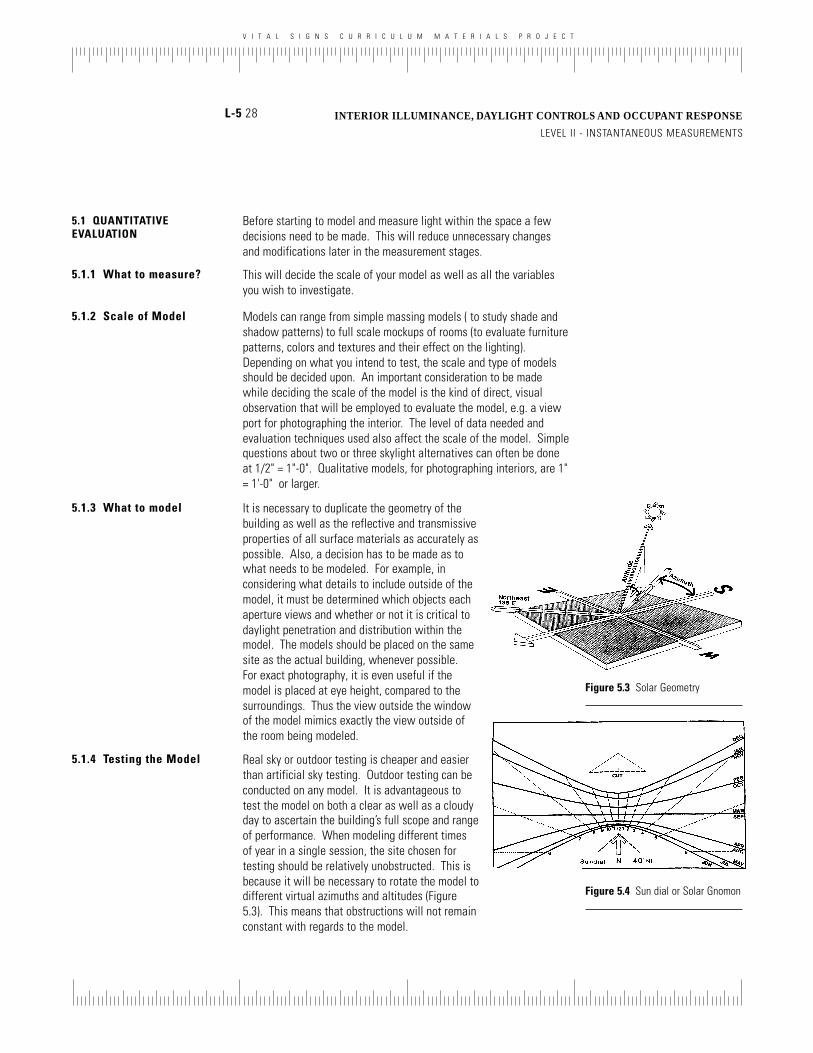
5.1.3 What to model It is necessary to duplicate the geometry of thebuilding as well as the reflective and transmissiveproperties of all surface materials as accurately aspossible. Also, a decision has to be made as towhat needs to be modeled. For example, inconsidering what details to include outside of themodel, it must be determined which objects eachaperture views and whether or not it is critical todaylight penetration and distribution within themodel. The models should be placed on the samesite as the actual building, whenever possible.For exact photography, it is even useful if themodel is placed at eye height, compared to thesurroundings. Thus the view outside the windowof the model mimics exactly the view outside ofthe room being modeled.
Figure 5.3 Solar Geometry
Figure 5.4 Sun dial or Solar Gnomon
5.1.4 Testing the Model Real sky or outdoor testing is cheaper and easierthan artificial sky testing. Outdoor testing can beconducted on any model. It is advantageous totest the model on both a clear as well as a cloudyday to ascertain the building’s full scope and rangeof performance. When modeling different timesof year in a single session, the site chosen fortesting should be relatively unobstructed. This isbecause it will be necessary to rotate the model todifferent virtual azimuths and altitudes (Figure5.3). This means that obstructions will not remainconstant with regards to the model.
V I T A L S I G N S C U R R I C U L U M M A T E R I A L S P R O J E C T
L-5 29 INTERIOR ILLUMINANCE, DAYLIGHT CONTROLS AND OCCUPANT RESPONSE
LEVEL II - INSTANTANEOUS MEASUREMENTS
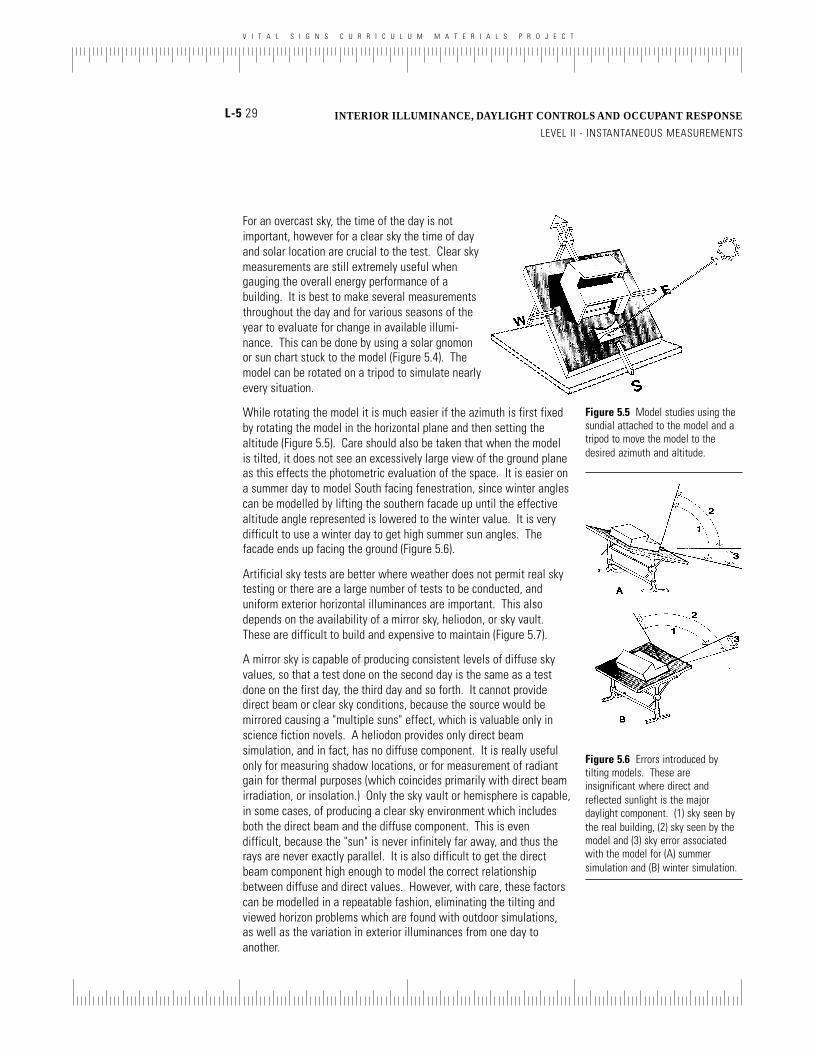
Figure 5.5 Model studies using thesundial attached to the model and atripod to move the model to thedesired azimuth and altitude.
Figure 5.6 Errors introduced bytilting models. These areinsignificant where direct andreflected sunlight is the majordaylight component. (1) sky seen bythe real building, (2) sky seen by themodel and (3) sky error associatedwith the model for (A) summersimulation and (B) winter simulation.
For an overcast sky, the time of the day is notimportant, however for a clear sky the time of dayand solar location are crucial to the test. Clear skymeasurements are still extremely useful whengauging the overall energy performance of abuilding. It is best to make several measurementsthroughout the day and for various seasons of theyear to evaluate for change in available illumi-nance. This can be done by using a solar gnomonor sun chart stuck to the model (Figure 5.4). Themodel can be rotated on a tripod to simulate nearlyevery situation.
While rotating the model it is much easier if the azimuth is first fixedby rotating the model in the horizontal plane and then setting thealtitude (Figure 5.5). Care should also be taken that when the modelis tilted, it does not see an excessively large view of the ground planeas this effects the photometric evaluation of the space. It is easier ona summer day to model South facing fenestration, since winter anglescan be modelled by lifting the southern facade up until the effectivealtitude angle represented is lowered to the winter value. It is verydifficult to use a winter day to get high summer sun angles. Thefacade ends up facing the ground (Figure 5.6).
Artificial sky tests are better where weather does not permit real skytesting or there are a large number of tests to be conducted, anduniform exterior horizontal illuminances are important. This alsodepends on the availability of a mirror sky, heliodon, or sky vault.These are difficult to build and expensive to maintain (Figure 5.7).
A mirror sky is capable of producing consistent levels of diffuse skyvalues, so that a test done on the second day is the same as a testdone on the first day, the third day and so forth. It cannot providedirect beam or clear sky conditions, because the source would bemirrored causing a "multiple suns" effect, which is valuable only inscience fiction novels. A heliodon provides only direct beamsimulation, and in fact, has no diffuse component. It is really usefulonly for measuring shadow locations, or for measurement of radiantgain for thermal purposes (which coincides primarily with direct beamirradiation, or insolation.) Only the sky vault or hemisphere is capable,in some cases, of producing a clear sky environment which includesboth the direct beam and the diffuse component. This is evendifficult, because the "sun" is never infinitely far away, and thus therays are never exactly parallel. It is also difficult to get the directbeam component high enough to model the correct relationshipbetween diffuse and direct values. However, with care, these factorscan be modelled in a repeatable fashion, eliminating the tilting andviewed horizon problems which are found with outdoor simulations,as well as the variation in exterior illuminances from one day toanother.

V I T A L S I G N S C U R R I C U L U M M A T E R I A L S P R O J E C T
L-5 30 INTERIOR ILLUMINANCE, DAYLIGHT CONTROLS AND OCCUPANT RESPONSE
LEVEL II - INSTANTANEOUS MEASUREMENTS
Figure 5.7 Schematic section of skysimulator
5.1.5 Measuring the Results Photometric evaluation of a daylighting model isthe measurement of absolute illuminance withinthe space. It can be done by handheld lightmeters or ones in which the probe is separatefrom the meter. It is necessary to take bothinterior and exterior illumination readings to beable to compare DF factors.
Establish a pattern of measurement in the model.The single point, line or grid measurements can beperformed with single or multiple probes (Figure5.8). If only one probe is available, it should bemoved around systematically within the model tocover all the points and the exterior value shouldbe measured at the beginning and the end of the
sequence. They should be placedat the height of the plane beingstudied, in scale (Figure 5.9).
Since the illuminance of thesource of light in an artificial skydoes not match that of the sun,absolute measurements ofilluminance are not possible.However simultaneous exteriorand interior illuminancemeasurements will establish theDF which can then be used todetermine performance underovercast or minimum skyconditions.
Figure 5.8 Single point, line or gridmeasurements
Work plane
Figure 5.9 (A) Improper match ofsensor at workplane, (B) matchingmodel scale to sensor.
A B
5.1.6 Recording Data Documenting the results is extremely valuable for later analysis.Since outdoor testing may take several hours or days and needs to beconducted on both clear and overcast days, it is helpful to keep arecord of observed sky conditions as well as the illuminance data.Observed information about reflectivity of ground surface, and othertest conditions should be recorded.
Since the exterior illuminance changes with solar location on a clearday, an accurate record of the sun position should be maintained. It isalso a good idea to measure diffuse light as well as total exteriorillumination. This can be done by shading the probe and taking areading. On overcast days exterior illuminance readings should bechecked periodically since changes in cloud density alter the amountof available light. The record sheet should be a fairly organized recordof the various tests and will prove useful for evaluating differentlighting strategies.

V I T A L S I G N S C U R R I C U L U M M A T E R I A L S P R O J E C T
L-5 31 INTERIOR ILLUMINANCE, DAYLIGHT CONTROLS AND OCCUPANT RESPONSE
LEVEL II - INSTANTANEOUS MEASUREMENTS
5.2 VISUAL ANDPHOTOGRAPHIC EVALUATION
Visual and photographic evaluation also provide some clues as to thequantity of light in the space as well as the quality. In fact, visualobservation is crucial in establishing the quality of light in adaylighting model as no instrument can adequately measure orduplicate the response of the human eye to the light in the space.Viewing ports large enough to allow both visual and photographicinspection should be made in the model (Figure 5.10). They should beplaced in the model in such a way that the model can be viewed at ascaled eye level. View ports should be placed on as many surfaces aspossible, since the orientation and direction of view is important toget a full understanding of the quality, penetration and distribution oflight in the model. Viewports should coincide with doors, paintings,shelves, or other internal discontinuities in the wall surface. Thus, theviewport becomes invisible when it is replaced, which is important forthe photographs taken from the other viewports. Use a hood to blocklight entering the model through the view ports while makingobservations. While taking photographs a separate record of thephotographs including camera setting, date time etc., should bepreferably made.
To make identification easier at later stages, a card with the simu-lated date and time for which the model is being tested can beintroduced into the model itself, and incorporated into the photograph.Conversely, include the proper time on a clock within the scene, andsome other factor which identifies date. Visual observations areprobably the designer's best feedback tool and should not be curtailedfor quantitative performance. A well designed daylighting systemperforms best when both the quantity and quality of light in the spacehave been carefully balanced (Figure 5.11). Model testing makes itpossible to evaluate this balance simultaneously as it combines bothvisual as well as photometric measurements.
Eye level Minimumof 5"
Figure 5.10 Position of camerainside model
Figure 5.11 Use of hood to blocklight from observation point
REVIEW QUESTIONS 5.1 Why is there usually no difference between a model of thespace and the space itself?
5.2 Given that you wish to photograph a model. Why is itimportant to include the simulated date and time on something whichis visible inside the model?
5.3 What scale is an effective minimum size for photographinginteriors?
5.4 What is the biggest problem with an oversized sensor inplacing it inside a model? Can you think of another problem?
Many situations can be studied in a model as well as at full scale. Infact, it is often useful to look at possible changes that could be madeto the building, by constructing a model, and making the designchanges in the model. If the model has been calibrated to the buildingby getting the same measurements in both, then any changes madewill be measured extremely accurately.
CONCLUSIONS

V I T A L S I G N S C U R R I C U L U M M A T E R I A L S P R O J E C T
L-6 32 INTERIOR ILLUMINANCE, DAYLIGHT CONTROLS AND OCCUPANT RESPONSE
LEVEL III - EXTENDED MEASUREMENTS
LESSON SIX - EXTENDED ILLUMINANCEMEASUREMENTS
Having developed a reasonable understanding of how to take measurements andwhat measurements to take, the question of dynamic change arises. We mightknow how a space is illuminated at a particular moment in time, but we also knowthat it changes over time. To make any assessment of the effect of lighting onenergy usage, it is necessary to know how the lighting changes over the entireperiod of time in question, or at least a reasonably representative period.
The protocols and the equipment for extended measurement are similar to theequipment for instantaneous measurement, with the addition of a few key factors.The most significant is the way in which the data from multiple sensors is recorded.In the 70’s and 80’s there was a significant shift from analog recording devices suchas paper and magnetic tape to digital devices such as magnetic tape of digital data,direct serial connections to personal computers, phone connections to remotecomputers, and extended time storage in local RAM, to be downloaded ontocomputer. Most recently there has been the development of unitary sensors/storage devices which may be individually placed and later collected anddownloaded.
6.1 DATALOGGERS The most common method of sampling data overtime is to connect one or more sensors to a digitaldatalogging device. These devices are typicallycapable of simple mathematical functions, such asaveraging a series of samples at varying timeintervals, and then recording the average. Theymay be programmed to various ranges insensitivity, and also to do data processing such asthe sampling of a difference between two values,the multiplication of one of the sampled values byone of the other values, or a ratio of samples, suchas one sample of temperature followed by tensamples of illuminance. They are capable ofrecording induced current to detect when lightsare on, while also recording the illuminance levelsproduced. It is even possible to record thetemperature of the luminaires, as a proxy for their
Figure 6.1 Daylighting DataAcquisition System (Courtesy:Fowlkes Engineering).
on/off state, since most luminaires get quite hot when they are turned on. Measure thetemperature of a luminaire which has been on for a minute, and whenever the temperatureexceeds that value, assume that the fixture is "on". The manipulated data is stored for anextended period of time, depending on available RAM, sample rate, and battery life. It can beregularly downloaded by modem or direct connection to a computer (Figure 6.1).

V I T A L S I G N S C U R R I C U L U M M A T E R I A L S P R O J E C T
L-6 33 INTERIOR ILLUMINANCE, DAYLIGHT CONTROLS AND OCCUPANT RESPONSE
LEVEL III - EXTENDED MEASUREMENTS
Dataloggers are extremely powerful. Early versions required that theuser learn the language of the particular datalogger, which consistedsolely of numbers representing certain functions, numbers represent-ing certain data locations in memory and other arcane conventionsestablished by the equipment manufacturer. Indeed, manydataloggers required that the program be manually loaded by loadinga series of numbers. In some instances, such equipment is morereadily available, and is worth the effort of learning the language, orcalling someone who has used that particular type of datalogger, andhas the programs already written.
Most dataloggers now come with software which allows the programto be written separately on a computer in a more user friendlylanguage, or most recently in graphic formats, and then the programitself may be downloaded onto the datalogger.
The remaining consideration with dataloggers is the compatibility ofthe devices and the loggers. For example, Licor sensors producecurrent in the microampere range. Campbell dataloggers sensevoltage in the milliampere range. In order to log data from Licorsusing an Campbell datalogger, it is necessary to include a bridgingresistor in the circuit. The resistor closes the circuit of the Licor(connects the two ends of the wires from the Licor) and then thevoltage drop across the resistor is measured by connecting that to theCampbell.
It is possible, of course, to use Licors with a Licor datalogger, but thatwould be too simple. In point of fact, manufacturers sometimes makeexcellent sensors, and mediocre and overpriced dataloggers, and viceversa. In any case, it is necessary to provide a wiring harness tocollect the input from all of the sensors, convert it if necessary, andmake the connection to the data logger.
6.1.1 Licor Dataloggers The LI-1000 has 6 channels for current or voltagesensors, and a wide variety of sensors can beused with this datalogger. It operates on a menudriven software which can be configured to suitany application. The LI-1000 datalogger has auto-ranging capability, which provides a wide range ofmeasurements and eliminates the need for switchselection. Data can be collected as integrated,averaged or point values over logging periodsranging from 1 minute to 24 hours. Each datum isstored with a time stamp. It is also capable ofcollecting, maximum and minimum values etc.The LI-1000 datalogger has 32 K RAM and canstore data covering 6000 points. Data stored inthe memory is output to a computer or printerusing a RS-232C serial port (Figure 6.2).
Figure 6.2 LI-1000 Datalogger(Courtesy: LI-COR)

V I T A L S I G N S C U R R I C U L U M M A T E R I A L S P R O J E C T
L-6 34 INTERIOR ILLUMINANCE, DAYLIGHT CONTROLS AND OCCUPANT RESPONSE
LEVEL III - EXTENDED MEASUREMENTS
6.2 DOWNLOADING DATA Subsequent downloading of data is done onto a computer or acassette tape. Most datalogger software now allows downloading tocomputer without reprogramming the datalogger. Some dataloggerprograms will even make regular phone calls from the datalogger to aremote computer location, or answer remote phone calls from acomputer, establish a connection and download data.
Again, it is necessary to be certain that the communications protocolbetween datalogger and computer matches. For example, if using aphone line connection, normal modem settings must be considered.Be certain that the number of bits, even or odd parity and datatransfer rates are equal. Using a serial port on site is usually lesscomplex, and allows for regular inspection of the sensing equipment,but there are times when this is not practical.
6.3 UNITARY DEVICES Most recently, independent sensing devices have become available.These devices contain a sensor, a small battery and a small amount ofRAM. There is a very simple port which connects to a docking station,embedded as a card in the computer, or directly to a serial port. Thesensor is “launched” by connecting it to the computer and program-ming the sample rate from the computer host. After sampling iscomplete, the sensor is again connected to the computer host todownload data, and typical programs then convert data into graphicformat. Several of the programs will also dump information inspreadsheet format, and all will dump in ASCII. One such example isthe HOBO, which is available to sense illuminance (and in otherversions to sense other "vital signs.")
6.3.1 Hobo Hobo dataloggers are miniature remote recorders, with BoxCar as itscompanion software for DOS, Windows and the Macintosh, providingthe HOBO with a graphical interface useful for launching, reading andplotting data. The HOBO runs on a single lithium battery which canpower the logger for 2 years. The HOBO is capable of storing 1800measurements with launch time, and interval measurements. It canbe deployed to measure for as long as 360 days, and can operate at atemperature range of -40 degree Celsius to 75 degree Celsius. SomeHobo’s have the extended features of delayed start, and external start.They have multiple sampling, it can sample average, minimum ormaximum values. Data is read out by connecting the HOBO back tothe computer with the readout cable and running the BoxCar software(Figure 6.3).
The illuminance sensor on the illuminance HOBO is a diode, which isapparently more sensitive to infrared than to ultraviolet, which meansthat the contribution of fluorescent lights is underestimated. Thismay be corrected at a future date. Since the Hobo’s are so easy touse, they seem to be the instrument of choice for learning the process.
Figure 6.3 Hobo Light IntensityLogger
V I T A L S I G N S C U R R I C U L U M M A T E R I A L S P R O J E C T
L-6 35 INTERIOR ILLUMINANCE, DAYLIGHT CONTROLS AND OCCUPANT RESPONSE
LEVEL III - EXTENDED MEASUREMENTS
The spectral sensitivity of a sensor is always a concern. The Hobo’sfaults will become more significant if the IES shifts to a measure ofscotopic instead of photopic curves, since the scotopic curve isgenerally shorter wavelengths (shifted toward the UV.)
6.4 PROTOCOLS Choosing the time
There are two chronological aspects to extended sensing. The firstquestion is the number of samples and the time interval betweensamples. The second is the overall duration of the experiment.
Interval
If there are momentary surges in the value of the sample, thenfrequent samples averaged over a period of time are most useful.This submerges the surge in the data, with little change. It alsoallows extended sampling periods without the penalty of excessivedata storage. However, if the surges are other than momentary, thedata can be significantly disturbed, and it is preferable to actuallynote the anomaly in the original sample. It is better to find the causeand throw out the one pathological observation (carefully!) than it isto estimate the shift in the averaged data created by the anomalousobservation. In addition, with step functions (on/off, etc.) it is betterto know the state of the device, which can be smudged if the averageextends over a period of time. It may be most critical to know exactlywhen a particular device turned or was turned on. Averaging data canlose that information.
Many sensing devices themselves have a finite response time, andthe time interval between samples should always be longer than theresponse time of the sensor, unless it is the sensor itself which isbeing tested.
Duration
For the extended measurements to be useful, it is necessary that asufficient period of time be covered, and furthermore, that representa-tive times be considered. If the illuminance measurements are toinclude occupant interaction, normal working hours must be covered,off hours, and weekend or holiday times need not be included. It isuseful to include at least a week’s worth of data, since many patternschange depending on the day of the week.
If natural lighting is a factor (and it should be) then the seasonalvariations must also be considered. The prototypical solution is toinclude a week around each solstice and at least one equinox. Giventhe confusion during the Christmas holiday season, several weeksmight be in order, especially in academic institutions where thiscoincides with a semester or quarter break.
V I T A L S I G N S C U R R I C U L U M M A T E R I A L S P R O J E C T
L-6 36 INTERIOR ILLUMINANCE, DAYLIGHT CONTROLS AND OCCUPANT RESPONSE
LEVEL III - EXTENDED MEASUREMENTS
CONCLUSIONS Extended data sampling is necessary for most applications ofilluminance data and occupant interaction. The primary difficulty is inthe connection between the datalogger and the equipment, and indownloading digital data. Recent developments in technology andsoftware have made the problems comparatively insignificant, andallow creative correlation between varying factors which indicatebehavior. It is up to the designer of the experiment to use theprinciples of scientific investigation, and a little creativity, to recordthe variables which should be considered together.
REVIEW QUESTIONS 6.1 What is a resistor bridge and what is its purpose?
6.2 What is the minimum interval between samples inextended sampling?

V I T A L S I G N S C U R R I C U L U M M A T E R I A L S P R O J E C T
L-7 37 INTERIOR ILLUMINANCE, DAYLIGHT CONTROLS AND OCCUPANT RESPONSE
LEVEL III - EXTENDED MEASUREMENTS
LESSON SEVEN - EXTENDED LUMINANCEMEASUREMENTS
While evaluating glare and visual comfort, it may be necessary to know,not only the individual luminances of small areas of an interior, but alsothe average luminance of a larger area and measure a sort of averageluminance of the view. Typical luminance measurements do notdescribe the visual phenomenon, rather luminance meters eitheraverage the visual field at some angle of view to provide a singlenumber value or measure the detail within the visual field to describesome specifically interesting value e.g. a maximum or minimumluminance value. With these measurements, calculations for DirectGlare ratio etc., could be performed. Unfortunately, these results areonly roughly proportional to the complex visual environment. Toevaluate the complex behavior of adaptation levels, field of view andsource luminances, it is necessary to make use of video photometry,whereby the luminance of an entire view, (general background level)and individual surface luminances can be measured simultaneously.
7.1 VIDEO PHOTOMETRY Video photometry offers the capability to map and characterize the visualenvironment. This process uses video cameras incorporating CCD’s (charge-coupled devices). The system typically consists of a camera, an image acquisitionboard (IAB) and a microcomputer. On instruction from the software, the IABfreezes and digitizes the luminance pattern viewed by the camera. The analogsignal is converted to digitized signal by the converter, and consists of manythousands of individual bit values corresponding to each pixel of the camera’s CCDarray. By suitable calibration, the bit values are processed by the microcomputerto provide the luminance values at the corresponding points in the field of view.Typical video cameras scan 250-500 horizontal lines with analog information ineach horizontal line roughly equal to 500 points. This is equivalent to 125,000individual luminance meters distributed over the area of view (Figure 7.1).
Video photometry is fast and convenient, especially where it is necessary toobtain a large number of luminance values. One such system is ‘CapCalc’, calledthe Capture/Calculate system, which was developed by Dr. Mark Rea at theNational Research Council of Canada. It provides photometry by the followingfive step procedure
1. Capture a video image on the camera.
2. Scan the image for digitization.
3. Calibrate the image based on the zoom and aperture settings.

V I T A L S I G N S C U R R I C U L U M M A T E R I A L S P R O J E C T
L-7 38 INTERIOR ILLUMINANCE, DAYLIGHT CONTROLS AND OCCUPANT RESPONSE
LEVEL III - EXTENDED MEASUREMENTS
Filters Lens
Video Monitor
Computer Monitor
Keyboard
Video Camera
Image Capture Board (IAB)
Computer
Figure 7.1 Components of VideoPhotometry
4. Develop the photometric values of the 250,000 or so luminancepoints on the digitized image.
5. Call up and analyze the video image.
A major disadvantage of this system is the extensive calibrationrequired to offset all camera gains, settings and spectral responsivityetc. The effect of temperature also needs to be considered. Theresultant system is accurate, but expensive.
CapCalc also includes analysis software to give the average lumi-nance within any designated area or the relative visual performance(RVP), expressing the probability that an observer can see a task. Thisallows a direct comparison of task performance under differentlighting schemes.
7.2 LUMINANCEDISTRIBUTION METHOD
The Luminance Distribution method is one step further in videophotometry. It offers a solution to the prevalent drawbacks in videophotometry like recording f-stop, range etc. Video cameras are notexactly linear in their response. Each sample point results in ananalog reading which can be digitized on a relative scale of 0-255.Any scale could be chosen, but the sensitivity and scanning responseof most cameras does not justify a greater spread. The brightest point(say 1000 cd/ft2) would turn up as 255 in intensity and the 0 cd/ft2 areawould turn up as 0 in intensity. The middle value (125) would beapproximately 500 cd/ft2. The nonlinearity, however, means that thevalue might be slightly above or below that. Most cameras are least
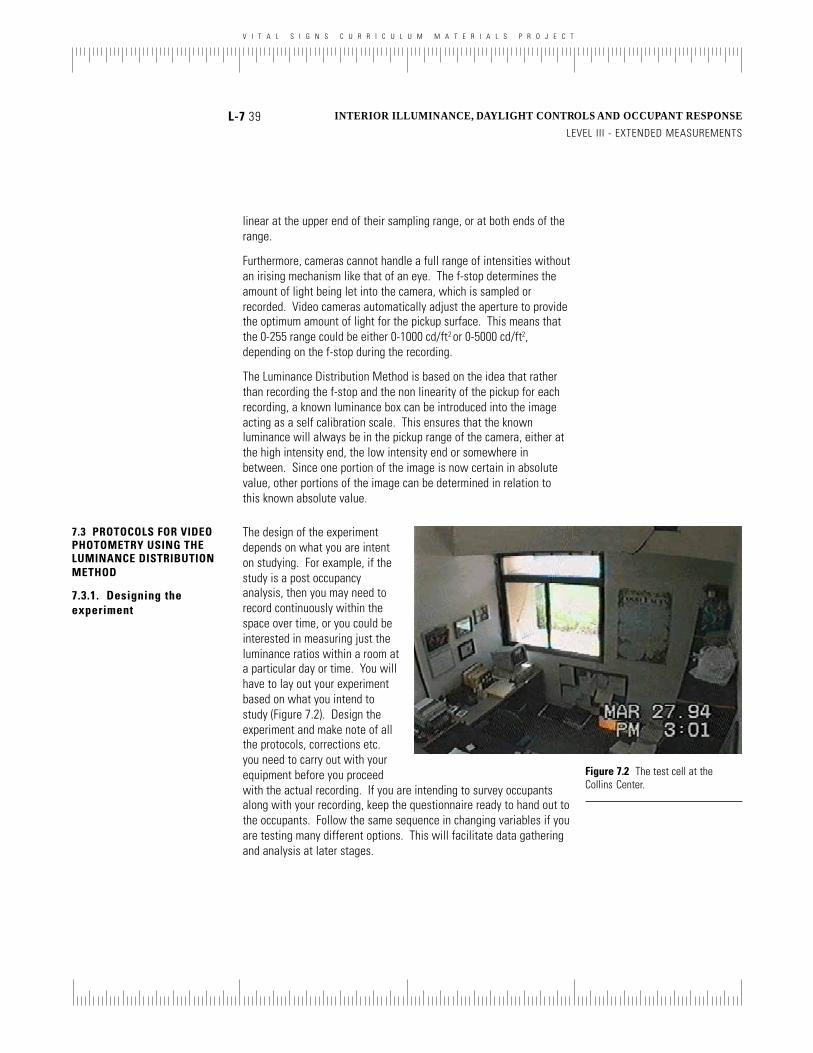
V I T A L S I G N S C U R R I C U L U M M A T E R I A L S P R O J E C T
L-7 39 INTERIOR ILLUMINANCE, DAYLIGHT CONTROLS AND OCCUPANT RESPONSE
LEVEL III - EXTENDED MEASUREMENTS
linear at the upper end of their sampling range, or at both ends of therange.
Furthermore, cameras cannot handle a full range of intensities withoutan irising mechanism like that of an eye. The f-stop determines theamount of light being let into the camera, which is sampled orrecorded. Video cameras automatically adjust the aperture to providethe optimum amount of light for the pickup surface. This means thatthe 0-255 range could be either 0-1000 cd/ft2 or 0-5000 cd/ft2,depending on the f-stop during the recording.
The Luminance Distribution Method is based on the idea that ratherthan recording the f-stop and the non linearity of the pickup for eachrecording, a known luminance box can be introduced into the imageacting as a self calibration scale. This ensures that the knownluminance will always be in the pickup range of the camera, either atthe high intensity end, the low intensity end or somewhere inbetween. Since one portion of the image is now certain in absolutevalue, other portions of the image can be determined in relation tothis known absolute value.
7.3 PROTOCOLS FOR VIDEOPHOTOMETRY USING THELUMINANCE DISTRIBUTIONMETHOD
7.3.1. Designing theexperiment
Figure 7.2 The test cell at theCollins Center.
The design of the experimentdepends on what you are intenton studying. For example, if thestudy is a post occupancyanalysis, then you may need torecord continuously within thespace over time, or you could beinterested in measuring just theluminance ratios within a room ata particular day or time. You willhave to lay out your experimentbased on what you intend tostudy (Figure 7.2). Design theexperiment and make note of allthe protocols, corrections etc.you need to carry out with yourequipment before you proceedwith the actual recording. If you are intending to survey occupantsalong with your recording, keep the questionnaire ready to hand out tothe occupants. Follow the same sequence in changing variables if youare testing many different options. This will facilitate data gatheringand analysis at later stages.
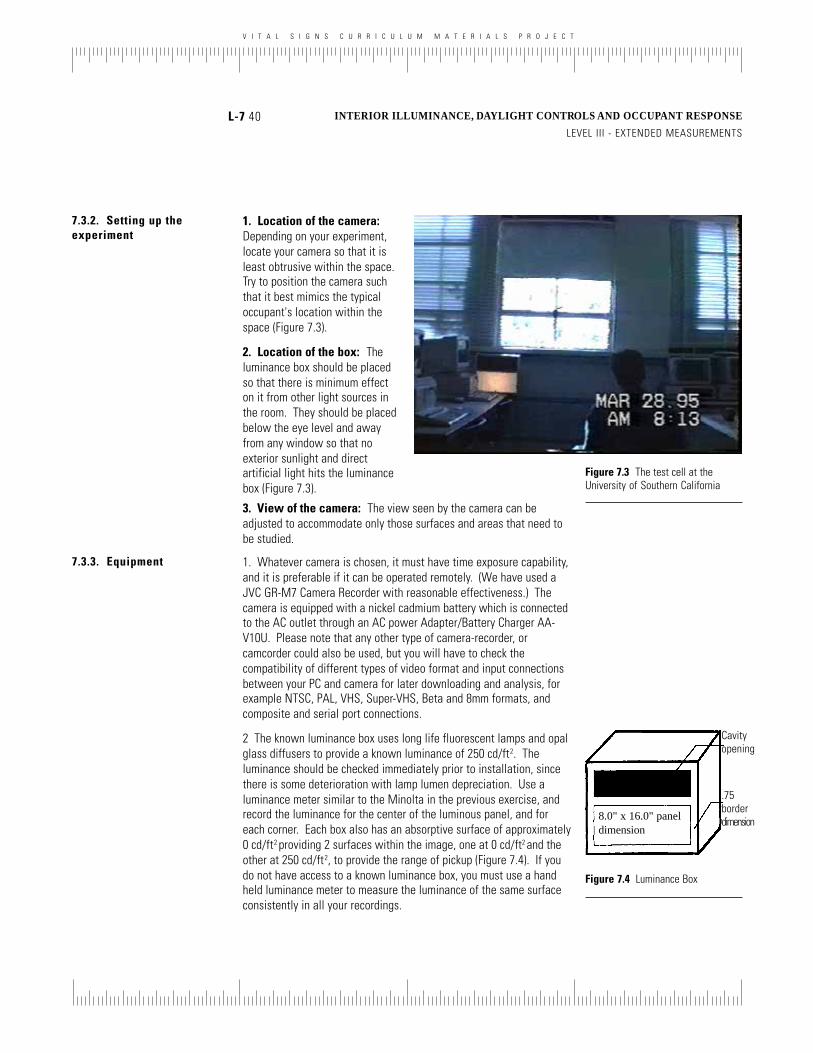
V I T A L S I G N S C U R R I C U L U M M A T E R I A L S P R O J E C T
L-7 40 INTERIOR ILLUMINANCE, DAYLIGHT CONTROLS AND OCCUPANT RESPONSE
LEVEL III - EXTENDED MEASUREMENTS
7.3.2. Setting up theexperiment
1. Location of the camera:Depending on your experiment,locate your camera so that it isleast obtrusive within the space.Try to position the camera suchthat it best mimics the typicaloccupant's location within thespace (Figure 7.3).
2. Location of the box: Theluminance box should be placedso that there is minimum effecton it from other light sources inthe room. They should be placedbelow the eye level and awayfrom any window so that noexterior sunlight and directartificial light hits the luminancebox (Figure 7.3).
Figure 7.3 The test cell at theUniversity of Southern California
3. View of the camera: The view seen by the camera can beadjusted to accommodate only those surfaces and areas that need tobe studied.
7.3.3. Equipment 1. Whatever camera is chosen, it must have time exposure capability,and it is preferable if it can be operated remotely. (We have used aJVC GR-M7 Camera Recorder with reasonable effectiveness.) Thecamera is equipped with a nickel cadmium battery which is connectedto the AC outlet through an AC power Adapter/Battery Charger AA-V10U. Please note that any other type of camera-recorder, orcamcorder could also be used, but you will have to check thecompatibility of different types of video format and input connectionsbetween your PC and camera for later downloading and analysis, forexample NTSC, PAL, VHS, Super-VHS, Beta and 8mm formats, andcomposite and serial port connections.
2 The known luminance box uses long life fluorescent lamps and opalglass diffusers to provide a known luminance of 250 cd/ft2. Theluminance should be checked immediately prior to installation, sincethere is some deterioration with lamp lumen depreciation. Use aluminance meter similar to the Minolta in the previous exercise, andrecord the luminance for the center of the luminous panel, and foreach corner. Each box also has an absorptive surface of approximately0 cd/ft2 providing 2 surfaces within the image, one at 0 cd/ft2 and theother at 250 cd/ft2, to provide the range of pickup (Figure 7.4). If youdo not have access to a known luminance box, you must use a handheld luminance meter to measure the luminance of the same surfaceconsistently in all your recordings.
Cavityopening
8.0" x 16.0" paneldimension
.75borderdimension
Figure 7.4 Luminance Box

V I T A L S I G N S C U R R I C U L U M M A T E R I A L S P R O J E C T
L-7 41 INTERIOR ILLUMINANCE, DAYLIGHT CONTROLS AND OCCUPANT RESPONSE
LEVEL III - EXTENDED MEASUREMENTS
3 Compact VHS-C tapes
The easiest format is a compact format, such as VHS-C cassette tapesto record using your camera recorder. Check for the types of tapesyour camera is compatible with.
7.3.4. Recording Record the space within which you wanted to measure the lumi-nances. Mount the camera on a tripod or suspend it from the ceilingor a duct, so that it is stationary, and does not obstruct normalmovement and activity within the space. Remember to keep the date-time function on, when setting up the camera so that you have arecord of the time and date of the observation.
7.3.5 Capturing therecorded images
Once you have the recorded observations on tape, you would need tocapture and digitize these images.
1. Capturing and digitizing can be done in two ways. For option one,you will need a video digitizer board within your PC, as well assoftware such as Video for Windows, which will allow you to replayyour cassette and capture the scenes while digitizing them. The otheralternative is the Snappy digitizer, which is a piece of battery operatedhardware which acts as the video digitizer. It is plugged into yourcomputer on its parallel port, i.e. the port on which most printers areconnected to. If such a port is not feasible, you could connect it to aparallel switch box. Check Snappy manuals for further details, theyare pretty self explanatory. A cable is connected from the Snappy orthe video digitizer board to the video camera. Replay your cassette. Itis preferable to use the preview mode on the snappy software, andthen snap when you have the exact frame on the screen, which youwant captured. You will observe that some images are clearer andmore stable than others. After capturing, you need to save the image.You can use any of the formats offered by Snappy which include .BMP,.PCX etc. We suggest the .PCX format.
2. Your next step would be to obtain the luminance distributionswithin the space, both in relative scale as well as in absolute scale.You will need to convert the .PCX file into a .PPM format which isacceptable by the software VIDEO11, which runs the .PPM file and inthe process generates an .XLS file which gives the intensity of eachpixel within a range of 1-225. This conversion (i.e. from .PCX to .PPM)is done by using software packages like COREL, ImagePRO,Photoshop, or other small utilities often available from bulletinboards. The particular one for this conversion is called ‘pcxtoppm’.The .XLS file allows detailed examination of the data using EXCEL or asimilar spreadsheet program.
Another option would be to use Photoshop, a program which makesinstantaneous histograms of the image. However there is a disadvan-tage here: Photoshop makes histograms of the images, but it is notpossible to save the data or export it. For initial experimentation thesecould be used to understand the distribution of intensities within the 1 VIDEO1 was developed at California
Polytechnic Institute at Pomona under fundingby Southern California Edison.

V I T A L S I G N S C U R R I C U L U M M A T E R I A L S P R O J E C T
L-7 42 INTERIOR ILLUMINANCE, DAYLIGHT CONTROLS AND OCCUPANT RESPONSE
LEVEL III - EXTENDED MEASUREMENTS
March 27, 3:00pm, Room 1
0
1000
2000
3000
4000
5000
6000
7000
8000
9000
10000
1 9 17 25 33 41 49 57 65 73 81 89 97 105
113
121
129
137
145
153
161
169
177
185
193
201
209
217
225
233
241
249
Intens ity
Num
ber
of P
ixel
s
space, but you need to remember that they are relative and there is noway to find out which pixel in the image is at which intensity.
3. There is an additional utility offered by the VIDEO1 software. Itworks out a color coded image which shows each pixel in a particularcolor depending on its intensity. With this color coded image, thehistograms generated from the .XLS files and the actual .PCX (imagefiles), it is possible to make observations about luminance distribu-tions within the space.
The analysis can be carried out in terms of
1. Histograms of the intensity distributions within the space both interms of distribution and numerical analysis.
2. Color coded images showing the intensity of each pixel.
3. Recorded images of the space
7.3.6 Analysis
Analysis of histograms
The histogram of a scanned videoimage is analyzed in terms of itsdistribution and absolute rangeof intensities (Figure 7.5). Mostimages include a bell curve, andsometimes a spike or two outsideof the bell curve. The relationbetween the bell curve and aspike presents a way to find outthe relationship between thebackground adaptation level andvarious intensities within thespace.
Figure 7.5 Histogram of intensitydistribution
1. Shape and distribution of bell curve: There is a distinct bellcurve observed in the histograms of images. This bell curve can beassumed to be representative of the background level. The shape ofthe bell curve is also sensitive to the luminance distributions withinthe space. A wider bell curve implies a more uniform distribution oflight intensities over the space. A narrow bell curve implies that mostof the background is at a smaller range of intensities.
2. Field of View: From the histograms it is possible to evaluate thenumber of pixels within that field of view. For a given field of view,there is a linear relationship between the number of pixels in animage and the actual steradians of the field of view. Hence byevaluating the number of pixels at the background intensity or at thehigh intensity level, and comparing them to the total number of pixelsin the image, the percentage of the field of view which either the

V I T A L S I G N S C U R R I C U L U M M A T E R I A L S P R O J E C T
L-7 43 INTERIOR ILLUMINANCE, DAYLIGHT CONTROLS AND OCCUPANT RESPONSE
LEVEL III - EXTENDED MEASUREMENTS
background or the glare source occupies can be established. Sincethere can be a relation established between number of pixels andsteradians in field of view, the histogram can provide criticalinformation about the percentage of field of view.
3. Relative Range of Intensities: The histograms also provide arelative range of light intensities which are present in the space.These are then correlated with the color coded images of the space toget the absolute values of the intensities. However, just their relativerange of intensities provides useful information. There are ratios of1:200 to 1:250 between the highest intensity and lowest intensitylevels within the image. Not all of them produce discomfort. Theratio of intensities between the background level and the highestintensity is more critical to glare analysis, which can be establishedfrom the histograms. This is especially true if the background iscomposed of the lower intensities.
4. The spike: The spike indicates a significant area at some intensityoutside the background level of the image. The position of the spikeon the histogram and its relation to the bell curve determines thevisual comfort within the room. A spike at the low intensity indicatesthat there is a significant area at a lower intensity. This is typicallynot a problem, since large contrasts below the adaptation level arenot problematic. The problem arises when there is a spike at the highintensity end on the histogram. This spike could be a potential highintensity glare source like the window, or table top or wall surface, orthe known luminance box itself. The source can be determinedexactly by examining the color coded images, and can be reasonablyascertained even using the unprocessed image. The relation betweenthe spike at the high end and the bell curve establishes the contrastbetween the background levels and potential high intensity glaresource, which is consistent with the conclusion that it is the ratiobetween the background level and the high end source which definesglare or no glare situations. The percentage of field of view which thehigh intensity occupies is also determined from the histograms.
Numerical Analysis
1. Median Pixel Intensity: This is the relative intensity of the medianpixel in the bell curve distribution (Figure 7.6).
2. Weighted average Intensity: This is the average of the product ofeach intensity level and the number of pixels at that intensity. Thisgives equal importance to each pixel and its intensity.
3. Number of Background Pixels: The total number of pixels whichconstitute the background or correspond to the bell curve portion ofthe histogram.
4. Total number of Pixels: This is the total number of pixels in theimage.

V I T A L S I G N S C U R R I C U L U M M A T E R I A L S P R O J E C T
L-7 44 INTERIOR ILLUMINANCE, DAYLIGHT CONTROLS AND OCCUPANT RESPONSE
LEVEL III - EXTENDED MEASUREMENTS
Figure 7.6 Numerical analysis ofHistograms
5. Percentage of view: This is the percentage of the entire field ofview which the background pixels occupy.
6. Maximum Intensity: This corresponds to the intensity of the medianpixel of the possible glare source.
7. Ratio: This is the contrast between the intensity of the medianpixel of the glare source and the median pixel of the background level.
8. Percentage of View: This is the percentage of the field of view thepossible glare source or any surface at the highest intensity occupies.
Analysis of recorded images
The absolute values of luminances are available from the images. Theimages are color coded, each color corresponding to a specific rangeof intensities. With this code, the luminances of various surfaces,within the room and specifically in the field of view of the occupantcan be identified. The color of the known luminance box gives us therelative scale needed to establish the absolute values of othersurfaces in the field of view. The image is then analyzed to find outwhich surface corresponds to the highest intensity, which could eitherbe the window, or a patch of light on the wall above the monitor or apatch of sunlight on the floor. By identifying the surface which is atthe highest intensity, we can then evaluate its importance in the fieldof view of the occupant, and whether it could be a potential glaresource.
The image also shows us the occupant’s interaction with the visualenvironment. The position of blinds, and obvious change of tasklocation or any other occupant response can also be studied fromthese images.
The images can be analyzed in terms of overall luminance, luminancedistribution, contour maps or histograms, individual luminance,contrasts, luminance ratios etc. Apart from these it is also possible torecord the view outside the window, position of the blinds, solarposition and resulting shadows and sunspots and the resultingoccupant behavior in the space. The luminance readings from thedigitized images can be correlated with the simultaneous recording ofilluminance and occupant behavior within the space. The ability tomake recordings over time, and to be able to record user interaction
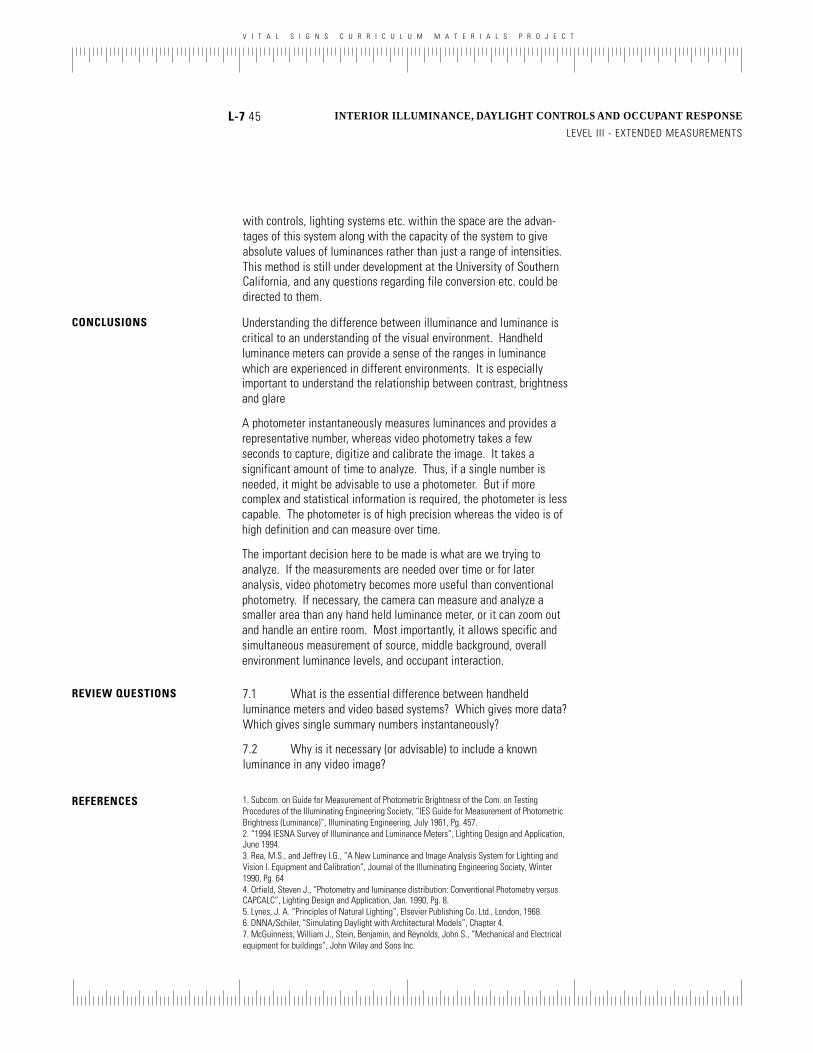
V I T A L S I G N S C U R R I C U L U M M A T E R I A L S P R O J E C T
L-7 45 INTERIOR ILLUMINANCE, DAYLIGHT CONTROLS AND OCCUPANT RESPONSE
LEVEL III - EXTENDED MEASUREMENTS
with controls, lighting systems etc. within the space are the advan-tages of this system along with the capacity of the system to giveabsolute values of luminances rather than just a range of intensities.This method is still under development at the University of SouthernCalifornia, and any questions regarding file conversion etc. could bedirected to them.
CONCLUSIONS Understanding the difference between illuminance and luminance iscritical to an understanding of the visual environment. Handheldluminance meters can provide a sense of the ranges in luminancewhich are experienced in different environments. It is especiallyimportant to understand the relationship between contrast, brightnessand glare
A photometer instantaneously measures luminances and provides arepresentative number, whereas video photometry takes a fewseconds to capture, digitize and calibrate the image. It takes asignificant amount of time to analyze. Thus, if a single number isneeded, it might be advisable to use a photometer. But if morecomplex and statistical information is required, the photometer is lesscapable. The photometer is of high precision whereas the video is ofhigh definition and can measure over time.
The important decision here to be made is what are we trying toanalyze. If the measurements are needed over time or for lateranalysis, video photometry becomes more useful than conventionalphotometry. If necessary, the camera can measure and analyze asmaller area than any hand held luminance meter, or it can zoom outand handle an entire room. Most importantly, it allows specific andsimultaneous measurement of source, middle background, overallenvironment luminance levels, and occupant interaction.
7.1 What is the essential difference between handheldluminance meters and video based systems? Which gives more data?Which gives single summary numbers instantaneously?
7.2 Why is it necessary (or advisable) to include a knownluminance in any video image?
1. Subcom. on Guide for Measurement of Photometric Brightness of the Com. on TestingProcedures of the Illuminating Engineering Society, “IES Guide for Measurement of PhotometricBrightness (Luminance)”, Illuminating Engineering, July 1961, Pg. 457.2. “1994 IESNA Survey of Illuminance and Luminance Meters”, Lighting Design and Application,June 1994.3. Rea, M.S., and Jeffrey I.G., “A New Luminance and Image Analysis System for Lighting andVision I. Equipment and Calibration”, Journal of the Illuminating Engineering Society, Winter1990, Pg. 644. Orfield, Steven J., “Photometry and luminance distribution: Conventional Photometry versusCAPCALC”, Lighting Design and Application, Jan. 1990, Pg. 8.5. Lynes, J. A. “Principles of Natural Lighting”, Elsevier Publishing Co. Ltd., London, 1968.6. DNNA/Schiler, “Simulating Daylight with Architectural Models”, Chapter 4.7. McGuinness, William J., Stein, Benjamin, and Reynolds, John S., “Mechanical and Electricalequipment for buildings”, John Wiley and Sons Inc.
REVIEW QUESTIONS
REFERENCES
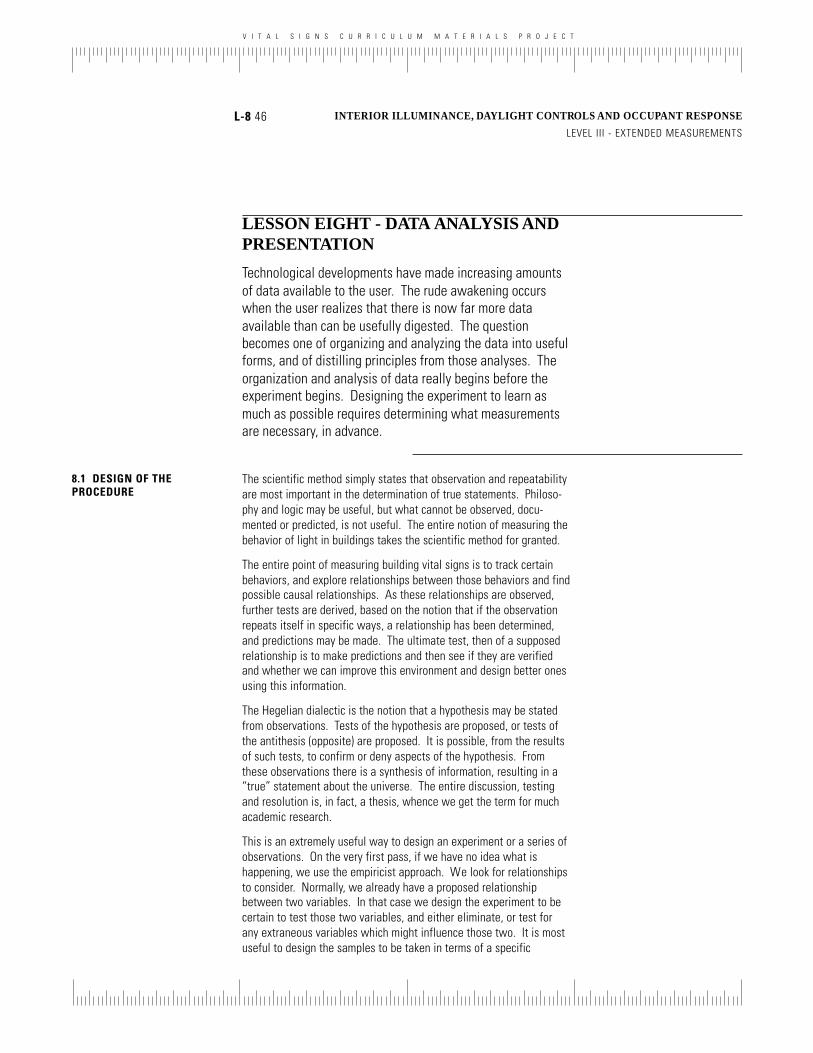
V I T A L S I G N S C U R R I C U L U M M A T E R I A L S P R O J E C T
L-8 46 INTERIOR ILLUMINANCE, DAYLIGHT CONTROLS AND OCCUPANT RESPONSE
LEVEL III - EXTENDED MEASUREMENTS
LESSON EIGHT - DATA ANALYSIS ANDPRESENTATION
Technological developments have made increasing amountsof data available to the user. The rude awakening occurswhen the user realizes that there is now far more dataavailable than can be usefully digested. The questionbecomes one of organizing and analyzing the data into usefulforms, and of distilling principles from those analyses. Theorganization and analysis of data really begins before theexperiment begins. Designing the experiment to learn asmuch as possible requires determining what measurementsare necessary, in advance.
8.1 DESIGN OF THEPROCEDURE
The scientific method simply states that observation and repeatabilityare most important in the determination of true statements. Philoso-phy and logic may be useful, but what cannot be observed, docu-mented or predicted, is not useful. The entire notion of measuring thebehavior of light in buildings takes the scientific method for granted.
The entire point of measuring building vital signs is to track certainbehaviors, and explore relationships between those behaviors and findpossible causal relationships. As these relationships are observed,further tests are derived, based on the notion that if the observationrepeats itself in specific ways, a relationship has been determined,and predictions may be made. The ultimate test, then of a supposedrelationship is to make predictions and then see if they are verifiedand whether we can improve this environment and design better onesusing this information.
The Hegelian dialectic is the notion that a hypothesis may be statedfrom observations. Tests of the hypothesis are proposed, or tests ofthe antithesis (opposite) are proposed. It is possible, from the resultsof such tests, to confirm or deny aspects of the hypothesis. Fromthese observations there is a synthesis of information, resulting in a“true” statement about the universe. The entire discussion, testingand resolution is, in fact, a thesis, whence we get the term for muchacademic research.
This is an extremely useful way to design an experiment or a series ofobservations. On the very first pass, if we have no idea what ishappening, we use the empiricist approach. We look for relationshipsto consider. Normally, we already have a proposed relationshipbetween two variables. In that case we design the experiment to becertain to test those two variables, and either eliminate, or test forany extraneous variables which might influence those two. It is mostuseful to design the samples to be taken in terms of a specific
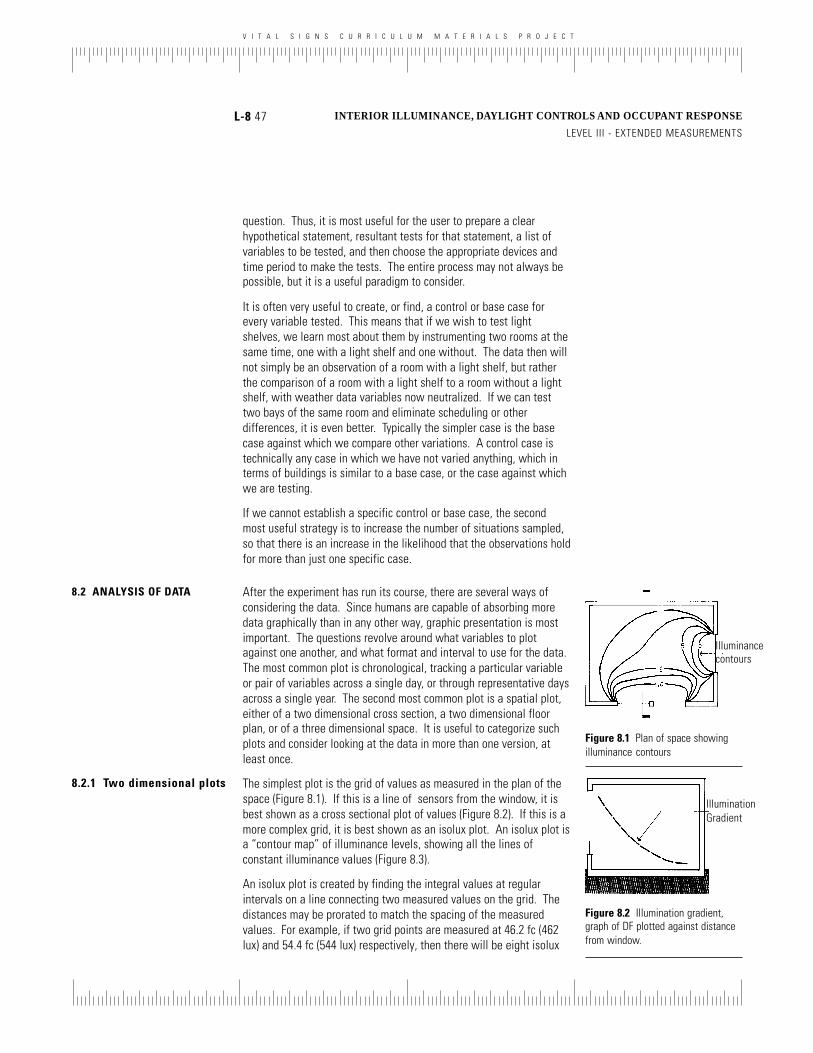
V I T A L S I G N S C U R R I C U L U M M A T E R I A L S P R O J E C T
L-8 47 INTERIOR ILLUMINANCE, DAYLIGHT CONTROLS AND OCCUPANT RESPONSE
LEVEL III - EXTENDED MEASUREMENTS
question. Thus, it is most useful for the user to prepare a clearhypothetical statement, resultant tests for that statement, a list ofvariables to be tested, and then choose the appropriate devices andtime period to make the tests. The entire process may not always bepossible, but it is a useful paradigm to consider.
It is often very useful to create, or find, a control or base case forevery variable tested. This means that if we wish to test lightshelves, we learn most about them by instrumenting two rooms at thesame time, one with a light shelf and one without. The data then willnot simply be an observation of a room with a light shelf, but ratherthe comparison of a room with a light shelf to a room without a lightshelf, with weather data variables now neutralized. If we can testtwo bays of the same room and eliminate scheduling or otherdifferences, it is even better. Typically the simpler case is the basecase against which we compare other variations. A control case istechnically any case in which we have not varied anything, which interms of buildings is similar to a base case, or the case against whichwe are testing.
If we cannot establish a specific control or base case, the secondmost useful strategy is to increase the number of situations sampled,so that there is an increase in the likelihood that the observations holdfor more than just one specific case.
8.2 ANALYSIS OF DATA After the experiment has run its course, there are several ways ofconsidering the data. Since humans are capable of absorbing moredata graphically than in any other way, graphic presentation is mostimportant. The questions revolve around what variables to plotagainst one another, and what format and interval to use for the data.The most common plot is chronological, tracking a particular variableor pair of variables across a single day, or through representative daysacross a single year. The second most common plot is a spatial plot,either of a two dimensional cross section, a two dimensional floorplan, or of a three dimensional space. It is useful to categorize suchplots and consider looking at the data in more than one version, atleast once.
8.2.1 Two dimensional plots The simplest plot is the grid of values as measured in the plan of thespace (Figure 8.1). If this is a line of sensors from the window, it isbest shown as a cross sectional plot of values (Figure 8.2). If this is amore complex grid, it is best shown as an isolux plot. An isolux plot isa “contour map” of illuminance levels, showing all the lines ofconstant illuminance values (Figure 8.3).
An isolux plot is created by finding the integral values at regularintervals on a line connecting two measured values on the grid. Thedistances may be prorated to match the spacing of the measuredvalues. For example, if two grid points are measured at 46.2 fc (462lux) and 54.4 fc (544 lux) respectively, then there will be eight isolux
IlluminationGradient
Figure 8.2 Illumination gradient,graph of DF plotted against distancefrom window.
Figure 8.1 Plan of space showingilluminance contours
Illuminancecontours

V I T A L S I G N S C U R R I C U L U M M A T E R I A L S P R O J E C T
L-8 48 INTERIOR ILLUMINANCE, DAYLIGHT CONTROLS AND OCCUPANT RESPONSE
LEVEL III - EXTENDED MEASUREMENTS
lines between them, at 47, 48, 49, 50, 51, 52, 53and 54 fc. If such crossing points are notedbetween all of the measured grid points, thecrossing points may be connected to form theisolux plot lines. Some smoothing may beappropriate, since the actual illuminancedistribution rarely contains points or corners.
However, when comparing solutions it is oftenuseful to plot different situations on the samegraph, allowing direct comparison. If there was acontrol case, the simplest is to overlap the controlcase and the variations on a simple cross sectionof the space. It might also be useful to plot asingle point in the space, over a period of time,overlapping the control case and the variations toconsider the behavior in a chronological sense. Figure 8.3 An isolux plot
Parallel variables, or variables in which we expect to see a relation-ship may also be plotted the same way. The relationship may becausal (one causes the other), or several variables may be simulta-neously tracking an external variable. Finding similarities in behaviordo not necessarily prove that one is driving the other. Cause andeffect variables, or trigger and responding variables, should always betracked over a period of time. The case for cause and effect becomesstrongest when one variable slightly precedes the other in itsbehavior, but even then, it might simply be the more responsive of thetwo variables to some external factor.
8.2.2 Three dimensionalplots
It is possible to plot all the values of a variable in an entire threedimensional space at a particular point in time. This results in alandscape of the illuminance levels, for example, which is similar tothe isolux plot (Figure 8.4). It is conversely possible to plot a singlepoint in space over an extended period of time. This results in achronological map which shows at what point in time the highestlevel is achieved for that spot, and often yields a great deal ofinformation about shading and other events which might not be visibleon any one given instantaneous plot. Either plot is three dimensional.
It is also sometimes useful to mathematically subtract the values ofone variable from the other, resulting in a plot of the differencebetween the two variables. When plotting a base case and a variant,the user can immediately see the difference resulting from thevariation, instead of visually trying to find the detailed differencebetween two complex three dimensional plots.

V I T A L S I G N S C U R R I C U L U M M A T E R I A L S P R O J E C T
L-8 49 INTERIOR ILLUMINANCE, DAYLIGHT CONTROLS AND OCCUPANT RESPONSE
LEVEL III - EXTENDED MEASUREMENTS
An extremely useful variation has been introduced by Murray Milne atUCLA (Figure 8.5). A contour plot of one variable is color coded at key
levels. This results in a banded contour plot. This banding is thenmapped onto the contour plot of the next variable, allowing thesuperposition of two three dimensional maps on top of one another.This can prove extremely useful.
If the equipment is available, it is possible to record successiveinstantaneous three dimensional plots to create a video of thebehavior of a variable over time in a three dimensional space. Thislooks like a room with wave behavior as the sun moves around thespace, or as occupants turn lights on and off. Again, it is possible toidentify behavior patterns that are not apparent from any singlesampling. It is also possible to color code the contour levels so that itis immediately apparent when a particular level is exceeded. Aclassic version of such an illuminance plot video was produced bySumption et al at University of Idaho.
facing window
mid
back
0
10
20
30
40
50
60
70
80
Illum
inan
ce in
foot
cand
les
Position within roomDistance from window
Illuminance Distribution across room
Figure 8.4 Output from MicrosoftExcel Spreadsheet program: A threedimensional plot showingdistribution of illuminance levelsacross space.
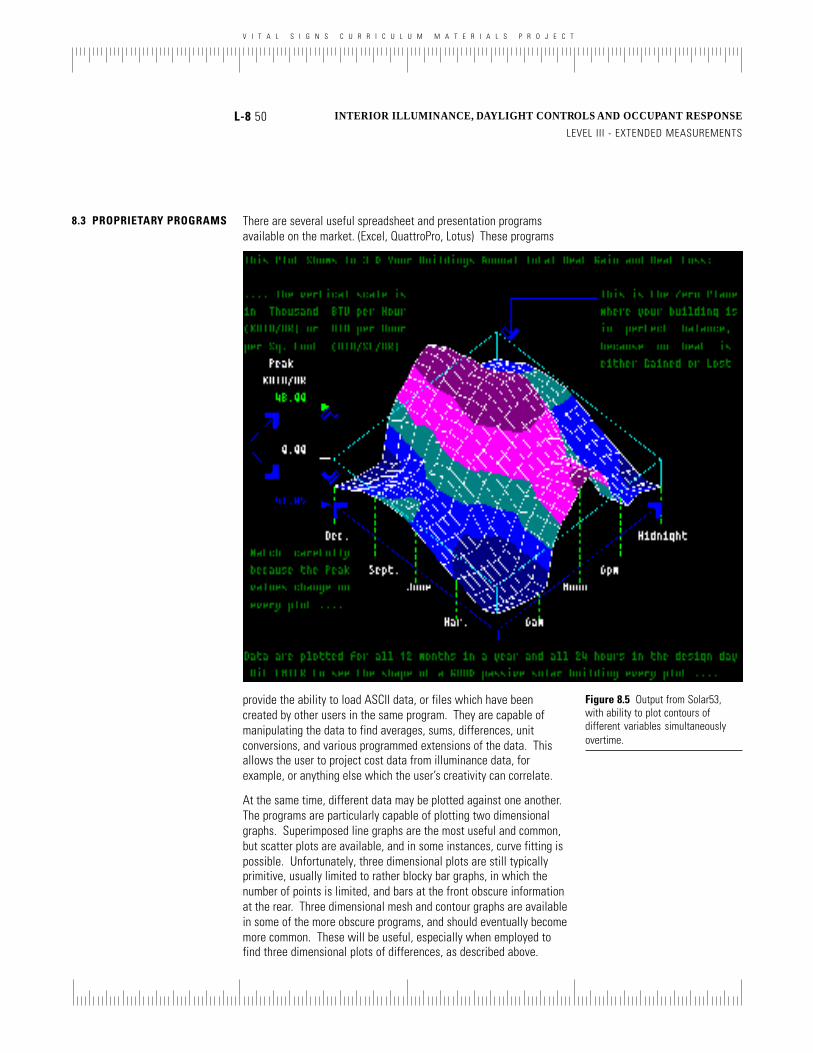
V I T A L S I G N S C U R R I C U L U M M A T E R I A L S P R O J E C T
L-8 50 INTERIOR ILLUMINANCE, DAYLIGHT CONTROLS AND OCCUPANT RESPONSE
LEVEL III - EXTENDED MEASUREMENTS
8.3 PROPRIETARY PROGRAMS There are several useful spreadsheet and presentation programsavailable on the market. (Excel, QuattroPro, Lotus) These programs
provide the ability to load ASCII data, or files which have beencreated by other users in the same program. They are capable ofmanipulating the data to find averages, sums, differences, unitconversions, and various programmed extensions of the data. Thisallows the user to project cost data from illuminance data, forexample, or anything else which the user’s creativity can correlate.
At the same time, different data may be plotted against one another.The programs are particularly capable of plotting two dimensionalgraphs. Superimposed line graphs are the most useful and common,but scatter plots are available, and in some instances, curve fitting ispossible. Unfortunately, three dimensional plots are still typicallyprimitive, usually limited to rather blocky bar graphs, in which thenumber of points is limited, and bars at the front obscure informationat the rear. Three dimensional mesh and contour graphs are availablein some of the more obscure programs, and should eventually becomemore common. These will be useful, especially when employed tofind three dimensional plots of differences, as described above.
Figure 8.5 Output from Solar53,with ability to plot contours ofdifferent variables simultaneouslyovertime.
V I T A L S I G N S C U R R I C U L U M M A T E R I A L S P R O J E C T
L-8 51 INTERIOR ILLUMINANCE, DAYLIGHT CONTROLS AND OCCUPANT RESPONSE
LEVEL III - EXTENDED MEASUREMENTS
CONCLUSIONS Extended data sampling is necessary for nearly all useful applicationsof illuminance data and occupant interaction. The primary difficulty isin the connection between the datalogger and the equipment, and indownloading digital data. Recent developments in technology andsoftware have made the problems comparatively insignificant, andallow creative correlation between varying factors which indicatebehavior. It is up to the designer of the experiment to use theprinciples of scientific investigation, and a little creativity, to recordthe variables which should be considered together.
REVIEW QUESTIONS 8.1 What is an isolux plot, and how is it created from a grid ofdata points?
8.2 What is a control case? What is a base case?
8.3 What is a thesis? Give an example which is in relation tobuilding diagnosis.
V I T A L S I G N S C U R R I C U L U M M A T E R I A L S P R O J E C T
L-9 52 INTERIOR ILLUMINANCE, DAYLIGHT CONTROLS AND OCCUPANT RESPONSE
LEVEL III - EXTENDED MEASUREMENTS
LESSON NINE - CONTROLS
To understand the interaction of controls and light, it isnecessary to have a better understanding of the range ofcontrol devices and how they function. There are twogeneral categories of controls. There are controls ofincoming natural light, which are typically a manipulation ofthe building’s skin. There are controls of the electric lightingsources, which may be manual or automatic.
9.1 PLACEMENT ANDORIENTATION
The simplest and most often used strategies are really quite simple.Critical tasks requiring high light levels and reflected light, are usuallyplaced near the fenestration. We are all familiar with the wonderfulVermeer paintings showing the women of the period working atcritical tasks close to windows.
When there was too much glare, people simply moved the task awayfrom the windows. Reflective surfaces were oriented away from thewindow, or conversely, the observer tried to stay between the windowand the specular surface, or to the side of the surface.
With the advent of luminous screens, such as television monitors andcomputer display terminals, the issue became considerably morecomplex. They are specularly reflective, which makes veilingreflections likely, and they are also luminous, but at low levels. Thismeans that they cannot be between the viewer and the fenestration,because the background field of view (discussed earlier) is too bright,and the information on the screen is lost. It is not a direct form ofglare, it is merely a loss of information, or signal-to-noise ratio.Conversely, luminous display terminals cannot be oriented directlyaway from luminous surfaces, because the reflection of surface fromthe screen again obscures information at best, and causes outrightglare, at worst.
Placement at angles to the fenestration or at a distance is usually thebest, and other controls e.g. glare screens must often be employed.
9.2 BLINDS AND SHADES The second “layer” of physical controls are the modifications to thebuilding skin. These may be external modifications of a static nature,such as louvers, overhangs, fins, or light shelves (Figure 9.1 and 9.2).These are discussed in many excellent references on daylighting inbuildings.1 2 Venetian blinds, vertical blinds and rolling shades are farmore common.
Rolling blinds are actually effective only if they are completelyopaque. Translucent blinds are probably the greatest source of glarewhenever they are employed. They reduce the level of light within the
1. Daylighting” in Passive Solar Commercialand Institutional Buildings: A Sourcebook ofExamples and Design Insights; edited byRobert Hastings, John Wiley & Sons, Ltd. ,Chichester, UK, January 1994.
2. Simplified Design of Building Lighting; JohnWiley and Sons, August 1993, New York.

V I T A L S I G N S C U R R I C U L U M M A T E R I A L S P R O J E C T
L-9 53 INTERIOR ILLUMINANCE, DAYLIGHT CONTROLS AND OCCUPANT RESPONSE
LEVEL III - EXTENDED MEASUREMENTS
space, but in the process become a tremendously bright glowing lightsource, in themselves. Since they are almost always in the field ofview, this is a major mistake. Opaque blinds with tiny holes are animprovement. The light coming through the holes is rarely perceivedas a very bright surface, depending on what material is in view behindthe blinds, outside the window. Such blinds reduce the light levelwithin the space, as well as reflecting some heat, to mitigate heatgain.
Venetian blinds are the best of the internal skin controls, because theyare able to redirect some light to the ceiling, are able to tilted in sucha manner that the inside of the space sees only the comparativelydark underside of the reflectors, and transmissivity may be continu-ously adjusted from 100% to nearly zero, uniformly across the window(Figure 9.3). Horizontal venetian blinds are by far the best forsouthern exposures and vertical blinds are slightly preferred for East,West and North exposures.
All of the above devices may be controlled manually, or by sensors,computer input or other building programming.
9.3 DISCRETE CONTROLS Most electrical controls are simple on/off switches. They aremanually controlled by the occupants. Good switching allows portionsof the room to be dark while other portions are lit, and allows theportions of the room lit with natural light to be switched off whileother portions remain on.
9.4 SCHEDULERS Many larger buildings have lights on automatic controls controlled bya central schedule. At a preselected time of day, the entire building isshut down. Some lights are left on for security, but anyone stillworking in the building has to contact the building maintenancesuperintendent, or dial into the controller itself, to override the shutdown order. This must be done repeatedly at regular intervals.
9.5 OCCUPANCY SENSORS Perhaps the most effective development has been the development ofoccupancy sensing devices, which are capable of recognizingmovement, and keeping the lights on as long as there is movement.These sensing devices typically measure a change in the infrareddistribution in front of the device, or send out high frequency sonarwaves, and recognize a change in the reflection pattern. All occu-pancy sensors are on/off devices, and can be used in conjunction withany of the other devices. For example, an occupancy sensor will turnon the lights when the room is occupied, but a daylight sensor willdim the lights appropriately (or in some cases, override the occupancysensor and not turn on the lights at all.)
One variation is manual on/auto off motion sensors, which require amanual touch to turn them on, but switch off after a period of no
Figure 9.1 Overhang
Figure 9.2 Light shelves
Figure 9.3 Venetian blinds
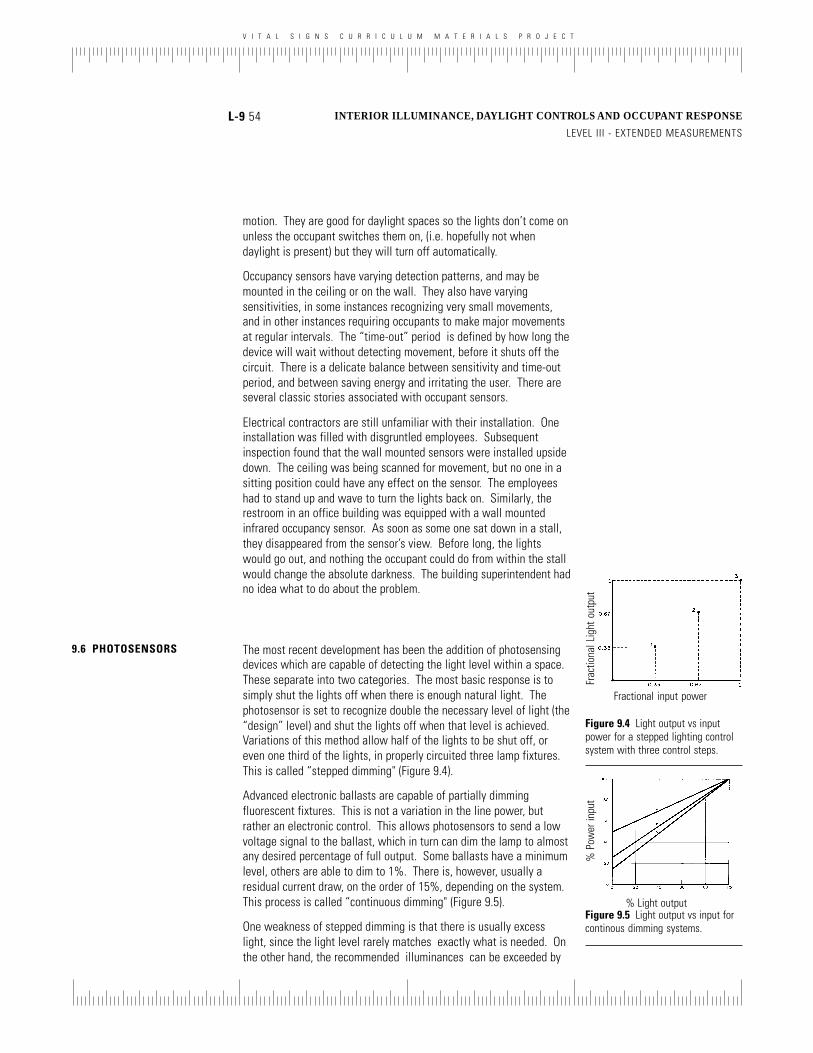
V I T A L S I G N S C U R R I C U L U M M A T E R I A L S P R O J E C T
L-9 54 INTERIOR ILLUMINANCE, DAYLIGHT CONTROLS AND OCCUPANT RESPONSE
LEVEL III - EXTENDED MEASUREMENTS
motion. They are good for daylight spaces so the lights don’t come onunless the occupant switches them on, (i.e. hopefully not whendaylight is present) but they will turn off automatically.
Occupancy sensors have varying detection patterns, and may bemounted in the ceiling or on the wall. They also have varyingsensitivities, in some instances recognizing very small movements,and in other instances requiring occupants to make major movementsat regular intervals. The “time-out” period is defined by how long thedevice will wait without detecting movement, before it shuts off thecircuit. There is a delicate balance between sensitivity and time-outperiod, and between saving energy and irritating the user. There areseveral classic stories associated with occupant sensors.
Electrical contractors are still unfamiliar with their installation. Oneinstallation was filled with disgruntled employees. Subsequentinspection found that the wall mounted sensors were installed upsidedown. The ceiling was being scanned for movement, but no one in asitting position could have any effect on the sensor. The employeeshad to stand up and wave to turn the lights back on. Similarly, therestroom in an office building was equipped with a wall mountedinfrared occupancy sensor. As soon as some one sat down in a stall,they disappeared from the sensor’s view. Before long, the lightswould go out, and nothing the occupant could do from within the stallwould change the absolute darkness. The building superintendent hadno idea what to do about the problem.
Figure 9.4 Light output vs inputpower for a stepped lighting controlsystem with three control steps.
Figure 9.5 Light output vs input forcontinous dimming systems.
Fractional input power
Frac
tiona
l Lig
ht o
utpu
t
% Light output
% P
ower
inpu
t
9.6 PHOTOSENSORS The most recent development has been the addition of photosensingdevices which are capable of detecting the light level within a space.These separate into two categories. The most basic response is tosimply shut the lights off when there is enough natural light. Thephotosensor is set to recognize double the necessary level of light (the“design” level) and shut the lights off when that level is achieved.Variations of this method allow half of the lights to be shut off, oreven one third of the lights, in properly circuited three lamp fixtures.This is called “stepped dimming" (Figure 9.4).
Advanced electronic ballasts are capable of partially dimmingfluorescent fixtures. This is not a variation in the line power, butrather an electronic control. This allows photosensors to send a lowvoltage signal to the ballast, which in turn can dim the lamp to almostany desired percentage of full output. Some ballasts have a minimumlevel, others are able to dim to 1%. There is, however, usually aresidual current draw, on the order of 15%, depending on the system.This process is called “continuous dimming" (Figure 9.5).
One weakness of stepped dimming is that there is usually excesslight, since the light level rarely matches exactly what is needed. Onthe other hand, the recommended illuminances can be exceeded by
V I T A L S I G N S C U R R I C U L U M M A T E R I A L S P R O J E C T
L-9 55 INTERIOR ILLUMINANCE, DAYLIGHT CONTROLS AND OCCUPANT RESPONSE
LEVEL III - EXTENDED MEASUREMENTS
50% without detrimental effect, anyway. An additional annoyance,however, is the discontinuous jump which occurs when one of the setlevels is passed. However, there is no residual electrical draw whenthe lights are completely off, and the systems are typically cheaper. Ina room where there is ample light for most of the time, the continuousdimming is a moot point. Under such circumstances, the residualcurrent draw is an excessive penalty and the stepped systems aremore efficient.
The most significant factor in favor of continuous dimming is actuallythe psychological one. The occupants do not notice the gradualdimming of the system, and are not annoyed. They are particularlyannoyed if the stepped system shuts on and off, even with a timedelay.
The biggest challenge in employing the photosensors is to coordinatewhat the sensor sees in its field of view (luminance) and what is theactual illuminance on the task areas.
9.7 MEASUREMENT There are several ways to determine whether the sensing devices arefunctioning, depending on what resolution is required. The simplestmeasure is to put a time summing device on the same circuit asstepped fixtures. This will simply record how long the fixtures are inuse. There are several variations on this, including induction coilswhich sense the current, without being in the circuit. These areminuscule electromagnetic devices attached to the circuit withoutbreaking the insulation, and they sense the change in the field causedby the current passage.
Dimming sensors are more difficult to meter. These can be meteredby measuring the level of current in the circuit (much more difficultthan the on/off measurement) or by connecting a device to the lowvoltage signal wire from the sensor to the ballast.
The most inclusive measurement of the on/off sensors is videorecording. It is possible to see from the image whether or not thelights are on. Unfortunately, it then requires the observer to enter thedata manually. The benefit of the video recording is that the reasonsthat the lights are on or off are simultaneously recorded. Again, thisis much more difficult for the continuous dimming systems, sincedetermining the percentage dimming form the video requires analyzingthe surface luminance of the fixture.
CONCLUSIONS Controls represent a great opportunity for saving energy, both inoccupancy sensing and in daylight harvesting. The optimum interac-tions depend on the occupants, their function, their level of controlover the system, and other factors as yet not fully explored.
V I T A L S I G N S C U R R I C U L U M M A T E R I A L S P R O J E C T
L-9 56 INTERIOR ILLUMINANCE, DAYLIGHT CONTROLS AND OCCUPANT RESPONSE
LEVEL III - EXTENDED MEASUREMENTS
REVIEW QUESTIONS 9.1 Why are vertical louvers better for East, West or Northexposures?
9.2 For an on/off system, why do we shut off the lights whenthere is twice as much light in the space as is necessary?
9.3 What are some variations on occupancy sensors?
9.4 What is the benefit of a stepped photosensing system?What are the primary liabilities?

V I T A L S I G N S C U R R I C U L U M M A T E R I A L S P R O J E C T
L-10 57 INTERIOR ILLUMINANCE, DAYLIGHT CONROLS AAND OCCUPANT RESPONSE
LEVEL III - EXTENDED MEASUREMENTS
LESSON TEN - OCCUPANT SURVEY
The primary purpose of an occupant survey is to analyze andunderstand how to design optimum environments for peopleby evaluating existing buildings. This need may develop inresponse to complaints from building occupants or in reactionto some unexpected incident in the building performance. Alighting evaluation study finds and analyses ways in whichthe luminous environment does or does not meet user needsand satisfaction. It also establishes criteria for betterlighting designs which are responsive to human needs andcomforts, and for formulating future standards and buildinglighting codes.
10.1 A BUILDING LIGHTINGEVALUATION
It is the systematic evaluation of a building to acquire knowledge anddata on how the luminous environment affects people’s behavior.There are quite a few reasons why we need to evaluate buildings.
1. To gather information for a particular problem which needsto be solved for example occupants complaining about bad headachesdue to bad lighting.
2. To gather generic data and information about the relation-ship between people and the building.
3. To make the design process more of a feedback mechanismwhereby evaluative data is included in the design making process.
There are many ways of going about conducting a building evaluation.Some of the methods apply analytic approaches, others take a moredynamic stand viewing people and buildings as interactive andmutually dependent. There are some models which simply elicitinformation on how best to respond to user’s complaints and recom-mend building improvements for those problems, without incorporat-ing the technical aspects of building performance.
10.2 SURVEY METHODS The traditional way of conducting a building evaluation(and what wehave been doing till this stage) has been to go and measure everymeasurable quantity. It is an onslaught of tests on a building toanalyze and assess the quality of its performance. However the majorlimitations of conventional approaches to building performancemeasurement are
1. That it is based on laboratory research, which when appliedto field studies of human comfort and performance, do not serve asaccurate indicators of comfort.
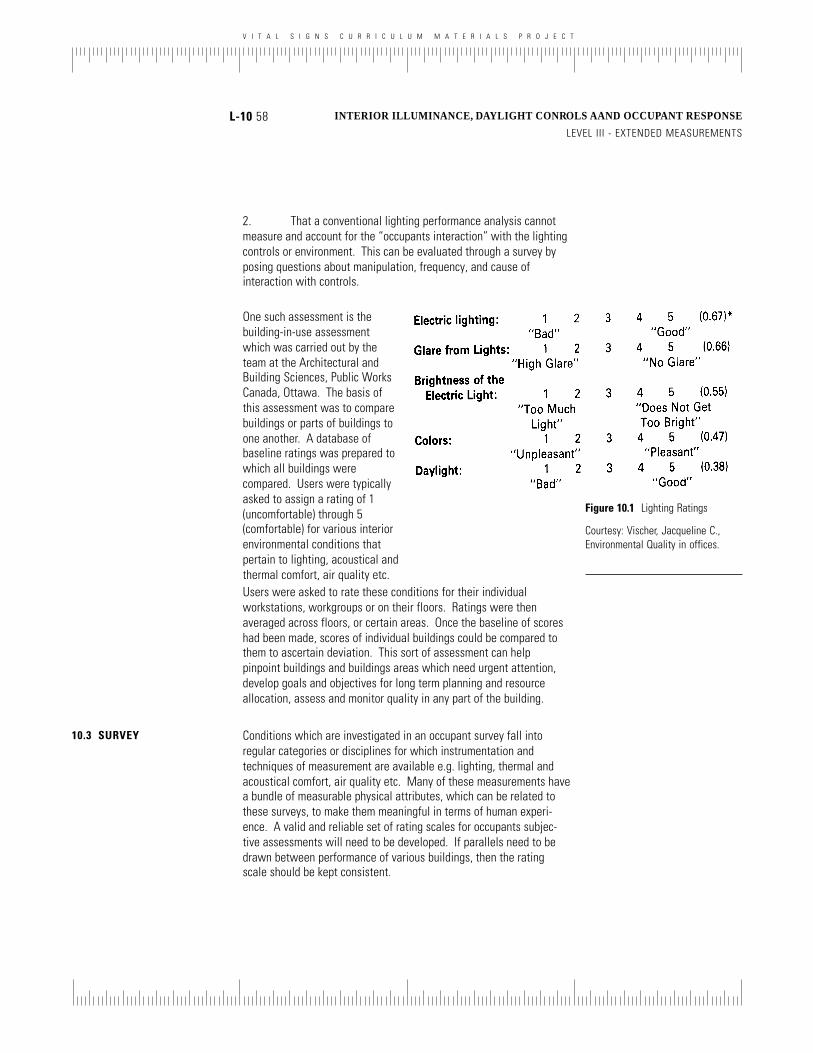
V I T A L S I G N S C U R R I C U L U M M A T E R I A L S P R O J E C T
L-10 58 INTERIOR ILLUMINANCE, DAYLIGHT CONROLS AAND OCCUPANT RESPONSE
LEVEL III - EXTENDED MEASUREMENTS
2. That a conventional lighting performance analysis cannotmeasure and account for the “occupants interaction” with the lightingcontrols or environment. This can be evaluated through a survey byposing questions about manipulation, frequency, and cause ofinteraction with controls.
One such assessment is thebuilding-in-use assessmentwhich was carried out by theteam at the Architectural andBuilding Sciences, Public WorksCanada, Ottawa. The basis ofthis assessment was to comparebuildings or parts of buildings toone another. A database ofbaseline ratings was prepared towhich all buildings werecompared. Users were typicallyasked to assign a rating of 1(uncomfortable) through 5(comfortable) for various interiorenvironmental conditions thatpertain to lighting, acoustical andthermal comfort, air quality etc.
Figure 10.1 Lighting Ratings
Courtesy: Vischer, Jacqueline C.,Environmental Quality in offices.
Users were asked to rate these conditions for their individualworkstations, workgroups or on their floors. Ratings were thenaveraged across floors, or certain areas. Once the baseline of scoreshad been made, scores of individual buildings could be compared tothem to ascertain deviation. This sort of assessment can helppinpoint buildings and buildings areas which need urgent attention,develop goals and objectives for long term planning and resourceallocation, assess and monitor quality in any part of the building.
10.3 SURVEY Conditions which are investigated in an occupant survey fall intoregular categories or disciplines for which instrumentation andtechniques of measurement are available e.g. lighting, thermal andacoustical comfort, air quality etc. Many of these measurements havea bundle of measurable physical attributes, which can be related tothese surveys, to make them meaningful in terms of human experi-ence. A valid and reliable set of rating scales for occupants subjec-tive assessments will need to be developed. If parallels need to bedrawn between performance of various buildings, then the ratingscale should be kept consistent.
V I T A L S I G N S C U R R I C U L U M M A T E R I A L S P R O J E C T
L-10 59 INTERIOR ILLUMINANCE, DAYLIGHT CONROLS AAND OCCUPANT RESPONSE
LEVEL III - EXTENDED MEASUREMENTS
CONCLUSIONS One might wonder why we need to go into such an extensiveevaluation. An occupant survey simultaneously measures the qualityof the environment as experienced by the users and the actualphysical dimensions of the environment (measurement). It yields anunderstanding of the quality of the space. The ratings are based onhow people judge the interior work environment and how thesepsychological dimensions assess environmental quality within thespace. Lighting rating questions as part of a building lightingevaluation are included as an example (Figure 10.1). You could alsorefer the generic questionnaire presented as an appendix in "Environ-mental quality in offices" by Jacqueline C. Vischer, Pg. 230.
The most useful building evaluation model is that which incorporatesuser-building interaction. It attributes a psychological component tothe environmental quality. The building is studied through the eyes ofthose using it. It uses occupant judgment to focus on the evaluationof the building rather than on the user and uses norms or standardsderived from existing buildings.
REVIEW QUESTIONS 10.1 Why are post occupancy surveys important?
10.2 Why are test cell surveys important?
10.3 Do surveys sample the experience of a moment or theoverall experiences in a spatial environment?

V I T A L S I G N S C U R R I C U L U M M A T E R I A L S P R O J E C T
FIELD EXERCISES
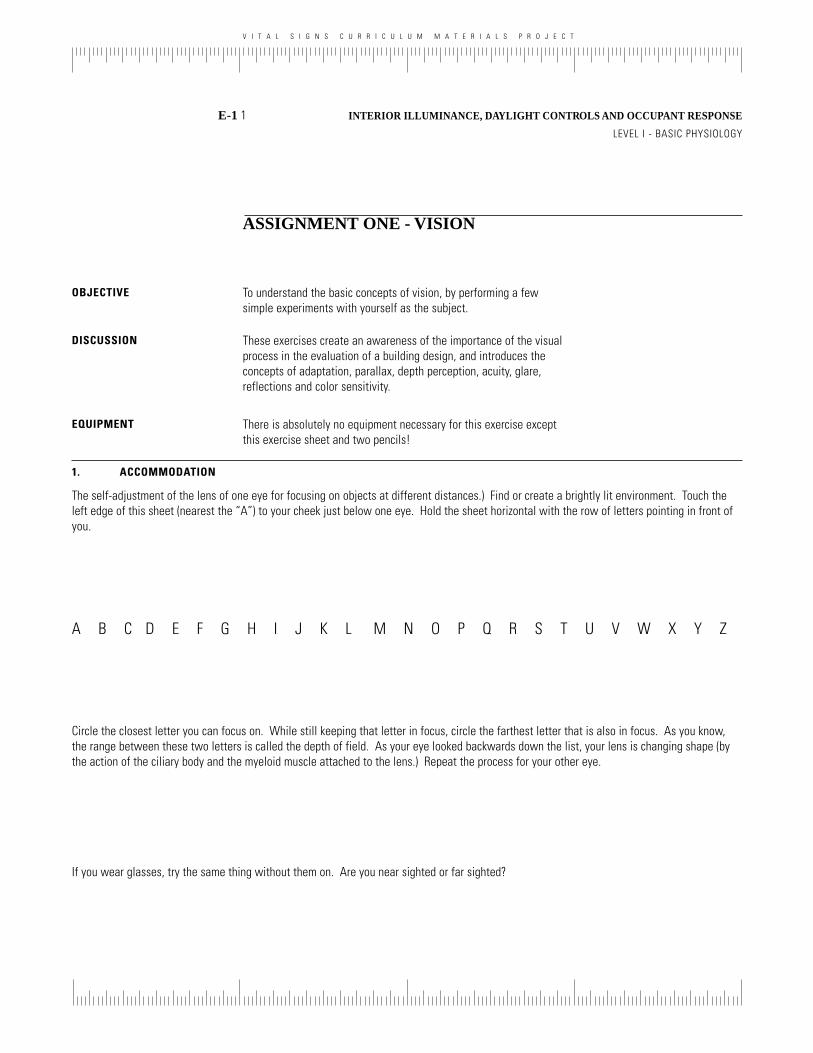
V I T A L S I G N S C U R R I C U L U M M A T E R I A L S P R O J E C T
INTERIOR ILLUMINANCE, DAYLIGHT CONTROLS AND OCCUPANT RESPONSE
LEVEL I - BASIC PHYSIOLOGY
E-1 1
ASSIGNMENT ONE - VISION
To understand the basic concepts of vision, by performing a fewsimple experiments with yourself as the subject.
These exercises create an awareness of the importance of the visualprocess in the evaluation of a building design, and introduces theconcepts of adaptation, parallax, depth perception, acuity, glare,reflections and color sensitivity.
There is absolutely no equipment necessary for this exercise exceptthis exercise sheet and two pencils!
OBJECTIVE
DISCUSSION
EQUIPMENT
1. ACCOMMODATION
The self-adjustment of the lens of one eye for focusing on objects at different distances.) Find or create a brightly lit environment. Touch theleft edge of this sheet (nearest the “A”) to your cheek just below one eye. Hold the sheet horizontal with the row of letters pointing in front ofyou.
A B C D E F G H I J K L M N O P Q R S T U V W X Y Z
Circle the closest letter you can focus on. While still keeping that letter in focus, circle the farthest letter that is also in focus. As you know,the range between these two letters is called the depth of field. As your eye looked backwards down the list, your lens is changing shape (bythe action of the ciliary body and the myeloid muscle attached to the lens.) Repeat the process for your other eye.
If you wear glasses, try the same thing without them on. Are you near sighted or far sighted?

V I T A L S I G N S C U R R I C U L U M M A T E R I A L S P R O J E C T
INTERIOR ILLUMINANCE, DAYLIGHT CONTROLS AND OCCUPANT RESPONSE
LEVEL I - BASIC PHYSIOLOGY
E-1 2
Now, shut off most of the lights (or find a dimly lit environment.) You should just be able to see the letters after a period of adjustment. Repeatthe experiment. Do you have a greater or shorter depth of field?
Depth of field is effected by age and irregularities such as cataracts. The lens begins to stiffen and it is more difficult tofocus it exactly. When there is plenty of light, the iris closes and the eye uses only the middle of the lens, which allowsa greater depth of field, and is more forgiving of irregularities. This is why brightly lit environments become important tovisual acuity, especially for older eyes.
2. CONVERGENCE
(The act of aiming both eyes at the same point.) This is the mechanism by which we perceive depth stereoscopically. Hold up two pencilsvertically; A at arms length and B half way between A and your nose. Focus on A with both eyes; you should see two out-of-focus images of B.Draw what you see below. Close your left eye and label the remaining image of B as BR. Close your right eye and label BL.
Now focus with both eyes on B; you should see two out-of- focus images of A. Close your left eye and label the remaining image of A as AR.Close your right eye and label AL.

V I T A L S I G N S C U R R I C U L U M M A T E R I A L S P R O J E C T
INTERIOR ILLUMINANCE, DAYLIGHT CONTROLS AND OCCUPANT RESPONSE
LEVEL I - BASIC PHYSIOLOGY
E-1 3
Compare the location of the left and right images in the two drawings above.
This effect is called parallax. It is not effected by light level, because it is not dependent on the iris at all. It comes fromthe fact that the eyes are separated. This is where our sense of depth perception comes from. Our minds process the eyeaiming angle at which the images coincide, which gives us the approximate distance to the object.
3. ACUITY
(The resolving power of the eye.) Acuity is a measure of our ability to see very small details, for instance you should be able to see a fine linethat subtends a visual angle as small as 0.01 minutes (with a very bright background.) To demonstrate this, find the greatest distance at whichyou can see a single human hair; you will have to experiment to find the best lighting and background (contrast) conditions. Record the distanceand the lighting conditions below. (You might also try this with different color hairs, or with a textured material to see when it reads as a solid.)
DISTANCE FT.
DESCRIBE OR SKETCH.
Contrast is a useful factor here, since the greater the contrast, the easier it is to see the hair. Most people cannot seesomething that fine from a distance greater than 60 feet, however, since the image falls between the spacing of theinternal receptors of the eye. Sneaky students can use a blond (fairly translucent) hair and shine a bright light at it, andget some diffusion, which lets the hair be seen at up to 120 feet. It isn't really the hair you see, but rather something likea lens flare in a camera.

V I T A L S I G N S C U R R I C U L U M M A T E R I A L S P R O J E C T
INTERIOR ILLUMINANCE, DAYLIGHT CONTROLS AND OCCUPANT RESPONSE
LEVEL I - BASIC PHYSIOLOGY
E-1 4
4. PUPILLARY ADAPTATION
Adaptation is the ability of the eye to adjust to light of various intensities. There are two mechanisms of adaptation: retinal and pupillary. Thelatter is accomplished by a sphincter muscle in the front of the eye called the iris. It is capable of responding very rapidly to up to a seventeenfold change in illumination levels. The pupil is able to dilate from 2 mm to 8 mm in diameter. You can demonstrate this as follows: set up asmall very bright light (against a dark background), close or cover one eye, with a small hand mirror watch how the other pupil changes as youcover and uncover the light source with the mirror. In the margin to the left, draw your best estimate of the actual size of the pupil at thesmallest and largest diameters you can observe. How much time does each size change take? How does this affect the way things “look”?Can you explain why it is more difficult to see the large diameter case? (It is interesting to look for this reflex in someone else’s eye).
While still facing the light source, open the other eye but shade it with the mirror and observe the pupil of the other eye while you alternatelyshade and unshade the other eye. What happens? (This is called the conscentual reflex).
Understanding the response time of pupillary adaptation will give you the basis for understanding many of the causes ofglare in architectural spaces. The eye requires time for adaptation, since it must cover such a broad range of lightlevels.
5. RETINAL ADAPTATION
The second kind of adaptation is called retinal adaptation. Unfortunately, you can’t watch how it operates but you can experience its results.The response time of retinal adaptation is much slower (on the order of 20 minutes) but it is capable of adapting to a fantastic range of energylevels (one hundred million fold). To experience this (and also to answer question 6) you will need a watch and five or six objects which are thesame shape but different colors (pieces of paper, pencils, or box of pastels). Go into a dark room that has only a tiny sliver of light entering.Note the time before you enter the darkness and record the elapsed time before you can see the objects if it takes less than two minutes, find adarker room). After 20 minutes, arrange the objects in your hand from lightest to darkest and record the results. Can you detect any color orcolor differences? (BRING THE OBJECTS TO CLASS). You will find it most interesting if you take along objects which are yellow, yellow-orange, yellow-green, red, blue, and gray.

V I T A L S I G N S C U R R I C U L U M M A T E R I A L S P R O J E C T
INTERIOR ILLUMINANCE, DAYLIGHT CONTROLS AND OCCUPANT RESPONSE
LEVEL I - BASIC PHYSIOLOGY
E-1 5
TIME: MIN. COLOR DETECTED? (YES) (NO).
ORDER OF COLOR SAMPLES:
This is called scotopic vision; at low levels you see using primarily the rods in your eye .
6. COLOR SENSITIVITY
After you come out of the dark room with your color samples and record their order, arrange them again and in room light from lightest todarkest and record the results. As you have probably realized by now, your visual color sensitivity shifts as a function of light level. The changein color sensitivity is called the Purkinje Shift and is due to the differential sensitivity of the rods vs. the cones in the retina.
DARK ADAPTED ORDER (ROD VISION):
LIGHT ADAPTED ORDER (CONE VISION):
Color differentiation occurs only at higher light levels, when the cones can function. This is called the photopic range.Not only is the order of brightness different, but the ability to tell yellow grays from blue grays, or color patterns, oranalyze skin tones for diagnosis, all occur only at the higher light levels.
7. AFTER IMAGES
In situations of extreme glare (i.e. luminance in the visual field that is too great for the retina and the ability of the iris to constrict sufficiently)the receptors in the retina are temporarily fatigued. In this situation you “see” an image that does not exist! Set up a seeing task in the mostglare-producing situation you can think of which produces an after image, such as looking at a bright overhead light bulb. To get an after image,keep your gaze steady on the bright image until you begin to experience discomfort, then turn your head and look at a plain, medium valuesurface (wall?) and blink your eyes rapidly. Draw a sketch of the task set-up and describe (sketch) what you see; what color is it? Is it positiveor negative?

V I T A L S I G N S C U R R I C U L U M M A T E R I A L S P R O J E C T
INTERIOR ILLUMINANCE, DAYLIGHT CONTROLS AND OCCUPANT RESPONSE
LEVEL I - BASIC PHYSIOLOGY
E-1 6
How does your perception of the after image change when you tip your head from side to side? Don't think, just look.
(Now think.) The pattern remains constant because the sensors which were affected remain in the same spot on theretina. The cones detect color by sensing difference. They are not absolute sensors, so when they are fatigued in acertain color, a neutral color is perceived as shifted. The rods become fatigued as well, resulting in the dark/lightdisplacement.
8. COLOR CONSTANCY
Find a space or work station where you can instantly switch from fluorescent to incandescent lighting with approximately the same illuminationlevel from each on a reading task (black ink on white paper). Spend about ten minutes under one source, then instantly switch to the other.Look at the white paper. After 10 to 20 minutes more, switch back to the original source.
WHAT WAS THE FIRST SOURCE? THE SECOND?
WHAT DID THE WHITE PAPER LOOK LIKE AFTER YOU SWITCHED?
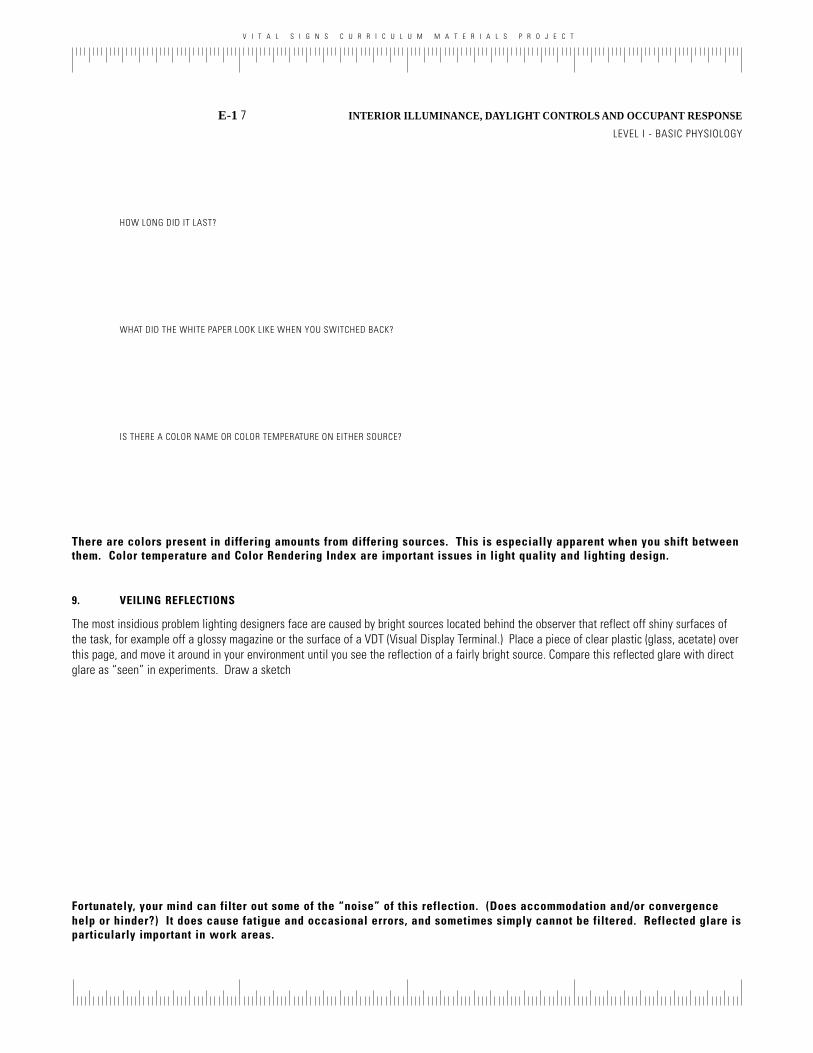
V I T A L S I G N S C U R R I C U L U M M A T E R I A L S P R O J E C T
INTERIOR ILLUMINANCE, DAYLIGHT CONTROLS AND OCCUPANT RESPONSE
LEVEL I - BASIC PHYSIOLOGY
E-1 7
HOW LONG DID IT LAST?
WHAT DID THE WHITE PAPER LOOK LIKE WHEN YOU SWITCHED BACK?
IS THERE A COLOR NAME OR COLOR TEMPERATURE ON EITHER SOURCE?
There are colors present in differing amounts from differing sources. This is especially apparent when you shift betweenthem. Color temperature and Color Rendering Index are important issues in light quality and lighting design.
9. VEILING REFLECTIONS
The most insidious problem lighting designers face are caused by bright sources located behind the observer that reflect off shiny surfaces ofthe task, for example off a glossy magazine or the surface of a VDT (Visual Display Terminal.) Place a piece of clear plastic (glass, acetate) overthis page, and move it around in your environment until you see the reflection of a fairly bright source. Compare this reflected glare with directglare as “seen” in experiments. Draw a sketch
Fortunately, your mind can filter out some of the “noise” of this reflection. (Does accommodation and/or convergencehelp or hinder?) It does cause fatigue and occasional errors, and sometimes simply cannot be filtered. Reflected glare isparticularly important in work areas.
V I T A L S I G N S C U R R I C U L U M M A T E R I A L S P R O J E C T
INTERIOR ILLUMINANCE, DAYLIGHT CONTROLS AND OCCUPANT RESPONSE
LEVEL I - BASIC PHYSIOLOGY
E-2 8
ASSIGNMENT TWO - SELF GUIDEDLIGHTING TOUR
To establish a direct encounter with the lighting environment of abuilding and various light sources within it. To create an awarenessof the issues in a lighted space, i.e. illumination (amount of light),luminances (brightness), glare, luminaire design, layout and suitabilityfor each space and task.
In this exercise you will note the physical characteristics of thelighting system, and other features of the space, for examplematerials, surfaces etc. that might be related to the luminousperformance of the space. There are several basic questions whichunderlie all your experiences in buildings:
· is the amount of light available sufficient for the task, e.g. reading,socializing, display?
· are there excessively bright surfaces causing discomfort?
· is there any direct glare through the windows?
· are there any lamps directly visible to the eye causing extremediscomfort?
· or are there any reflections which veil important information?
When you observe the specific spaces and tasks, look for clues in thesurfaces and features of the room, window location and luminairelocation. Feel free to note down suggestions as to how to improve thenegatives in the design when you rate it negatively and how you feelthe design has succeeded in creating a positive luminous environ-ment.
Bring along a glossy surface, such as a magazine. Keep extra sheetsof paper to make sketches and notes. In fact, many lighting designersand architects keep sketchbooks to record observations for futurereference. You may bring a camera, if you wish to make a morecomprehensive visual report. Use a 400 ASA film, or faster. Slidesoften show lighting better than prints, but this depends on the finalpresentation medium.
OBJECTIVES
DISCUSSION
EQUIPMENT
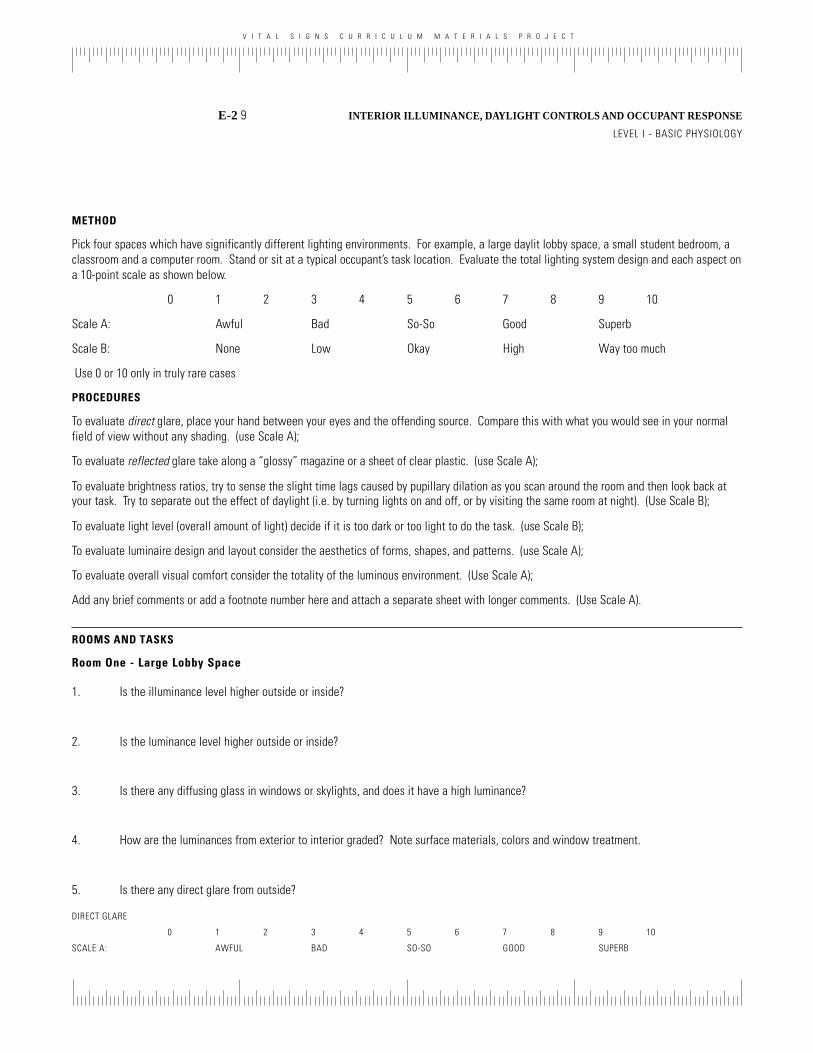
V I T A L S I G N S C U R R I C U L U M M A T E R I A L S P R O J E C T
INTERIOR ILLUMINANCE, DAYLIGHT CONTROLS AND OCCUPANT RESPONSE
LEVEL I - BASIC PHYSIOLOGY
E-2 9
METHOD
Pick four spaces which have significantly different lighting environments. For example, a large daylit lobby space, a small student bedroom, aclassroom and a computer room. Stand or sit at a typical occupant’s task location. Evaluate the total lighting system design and each aspect ona 10-point scale as shown below.
0 1 2 3 4 5 6 7 8 9 10
Scale A: Awful Bad So-So Good Superb
Scale B: None Low Okay High Way too much
Use 0 or 10 only in truly rare cases
PROCEDURES
To evaluate direct glare, place your hand between your eyes and the offending source. Compare this with what you would see in your normalfield of view without any shading. (use Scale A);
To evaluate reflected glare take along a “glossy” magazine or a sheet of clear plastic. (use Scale A);
To evaluate brightness ratios, try to sense the slight time lags caused by pupillary dilation as you scan around the room and then look back atyour task. Try to separate out the effect of daylight (i.e. by turning lights on and off, or by visiting the same room at night). (Use Scale B);
To evaluate light level (overall amount of light) decide if it is too dark or too light to do the task. (use Scale B);
To evaluate luminaire design and layout consider the aesthetics of forms, shapes, and patterns. (use Scale A);
To evaluate overall visual comfort consider the totality of the luminous environment. (Use Scale A);
Add any brief comments or add a footnote number here and attach a separate sheet with longer comments. (Use Scale A).
ROOMS AND TASKS
Room One - Large Lobby Space
1. Is the illuminance level higher outside or inside?
2. Is the luminance level higher outside or inside?
3. Is there any diffusing glass in windows or skylights, and does it have a high luminance?
4. How are the luminances from exterior to interior graded? Note surface materials, colors and window treatment.
5. Is there any direct glare from outside?
DIRECT GLARE
0 1 2 3 4 5 6 7 8 9 10
SCALE A: AWFUL BAD SO-SO GOOD SUPERB
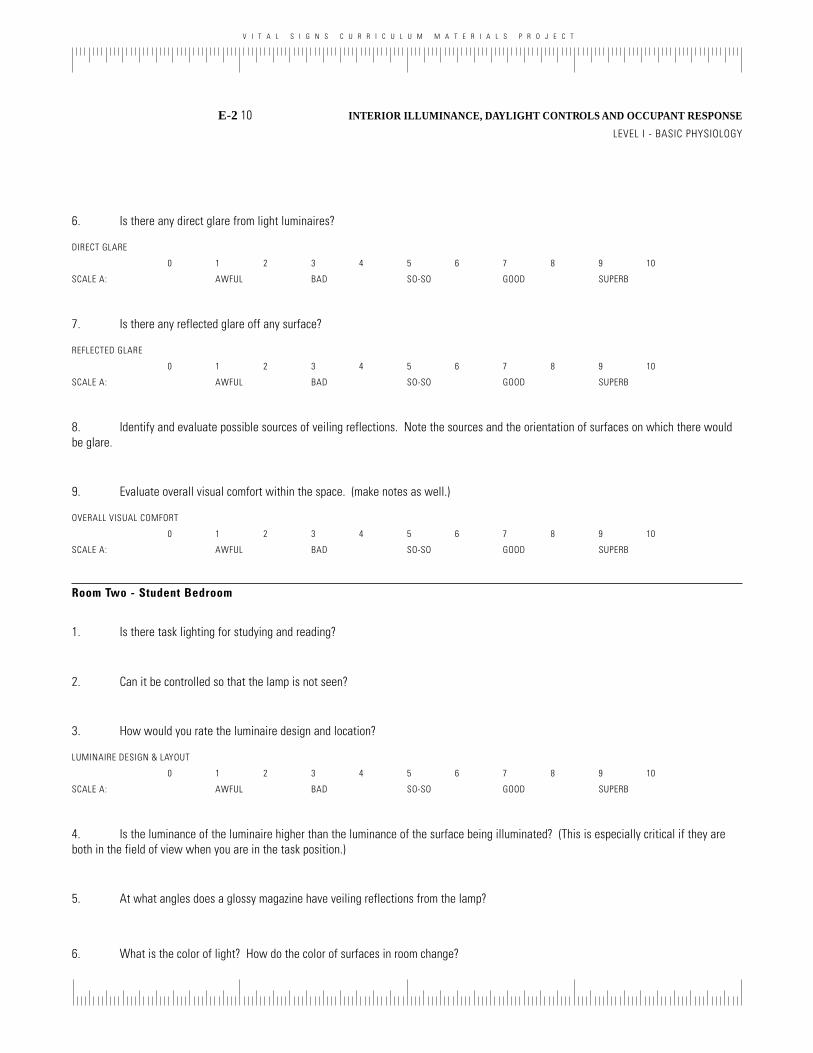
V I T A L S I G N S C U R R I C U L U M M A T E R I A L S P R O J E C T
INTERIOR ILLUMINANCE, DAYLIGHT CONTROLS AND OCCUPANT RESPONSE
LEVEL I - BASIC PHYSIOLOGY
E-2 10
6. Is there any direct glare from light luminaires?
DIRECT GLARE
0 1 2 3 4 5 6 7 8 9 10
SCALE A: AWFUL BAD SO-SO GOOD SUPERB
7. Is there any reflected glare off any surface?
REFLECTED GLARE
0 1 2 3 4 5 6 7 8 9 10
SCALE A: AWFUL BAD SO-SO GOOD SUPERB
8. Identify and evaluate possible sources of veiling reflections. Note the sources and the orientation of surfaces on which there wouldbe glare.
9. Evaluate overall visual comfort within the space. (make notes as well.)
OVERALL VISUAL COMFORT
0 1 2 3 4 5 6 7 8 9 10
SCALE A: AWFUL BAD SO-SO GOOD SUPERB
Room Two - Student Bedroom
1. Is there task lighting for studying and reading?
2. Can it be controlled so that the lamp is not seen?
3. How would you rate the luminaire design and location?
LUMINAIRE DESIGN & LAYOUT
0 1 2 3 4 5 6 7 8 9 10
SCALE A: AWFUL BAD SO-SO GOOD SUPERB
4. Is the luminance of the luminaire higher than the luminance of the surface being illuminated? (This is especially critical if they areboth in the field of view when you are in the task position.)
5. At what angles does a glossy magazine have veiling reflections from the lamp?
6. What is the color of light? How do the color of surfaces in room change?

V I T A L S I G N S C U R R I C U L U M M A T E R I A L S P R O J E C T
INTERIOR ILLUMINANCE, DAYLIGHT CONTROLS AND OCCUPANT RESPONSE
LEVEL I - BASIC PHYSIOLOGY
E-2 11
7. What is the illuminance at the task surface?
LIGHT LEVEL (AMOUNT OF LIGHT)
0 1 2 3 4 5 6 7 8 9 10
SCALE B: NONE LOW OKAY HIGH WAY TO MUCH
8. Evaluate overall comfort within the space.
OVERALL VISUAL COMFORT
0 1 2 3 4 5 6 7 8 9 10
SCALE A: AWFUL BAD SO-SO GOOD SUPERB
Room Three - Classroom
1. Is the room evenly and diffusely lit? Are there any shadows thrown by the lighting system?
2. Are the illuminances pretty even on all of the note taking surfaces?
LIGHT LEVEL (AMOUNT OF LIGHT)
0 1 2 3 4 5 6 7 8 9 10
SCALE B: NONE LOW OKAY HIGH WAY TOO MUCH
3. Is the blackboard strongly illuminated?
LIGHT LEVEL (AMOUNT OF LIGHT)
0 1 2 3 4 5 6 7 8 9 10
SCALE B: NONE LOW OKAY HIGH WAY TOO MUCH
4. What is the luminance of the blackboard compared to the wall around it? (This is considered a trick question by some. Be careful.)
LUMINANCE RATIO (CONTRAST)
0 1 2 3 4 5 6 7 8 9 10
SCALE B: NONE LOW OKAY HIGH WAY TOO MUCH
5. What are the luminances of the chalk compared to the board? (In some cases, this might be the luminances of the marker comparedto the board.) If there are slides shown, what is the luminance of the slide compared to the surrounding background?
LUMINANCE RATIO (CONTRAST)
0 1 2 3 4 5 6 7 8 9 10
SCALE B: NONE LOW OKAY HIGH WAY TOO MUCH

V I T A L S I G N S C U R R I C U L U M M A T E R I A L S P R O J E C T
INTERIOR ILLUMINANCE, DAYLIGHT CONTROLS AND OCCUPANT RESPONSE
LEVEL I - BASIC PHYSIOLOGY
E-2 12
6. Are there any windows or skylights in the room? Is there any diffusing glass on them? What is its luminance compared to the rest ofthe room?
LUMINANCE RATIO (CONTRAST)
0 1 2 3 4 5 6 7 8 9 10
SCALE B: NONE LOW OKAY HIGH MAXED OUT
7. What are the surfaces, sills around the window? How are they colored and what are their material properties?
8. Is there any gradation (transition) in brightness between the window itself and the wall in which it is set, or from the wall to theinterior surfaces of the space?
9. What is the position of blinds or curtains on the windows, if any? Try changing window blind and curtain position and note anychange at task location.
OVERALL VISUAL COMFORT
0 1 2 3 4 5 6 7 8 9 10
SCALE A: AWFUL BAD SO-SO GOOD SUPERB
Room Four - Computer Room
1. Is the room evenly and diffusely lit?
2. Is the light level (illuminance) sufficient on desktop for reading?
LIGHT LEVEL (AMOUNT OF LIGHT)
0 1 2 3 4 5 6 7 8 9 10
SCALE B: NONE LOW OKAY HIGH WAY TOO MUCH
3. What is the luminance of the screen compared to the typing on screen?
LUMINANCE RATIO (CONTRAST)
0 1 2 3 4 5 6 7 8 9 10
SCALE B: NONE LOW OKAY HIGH WAY TOO MUCH
4. What is the luminance of the screen compared to the rest of the room?
LUMINANCE RATIO (CONTRAST)
0 1 2 3 4 5 6 7 8 9 10
SCALE B: NONE LOW OKAY HIGH WAY TOO MUCH
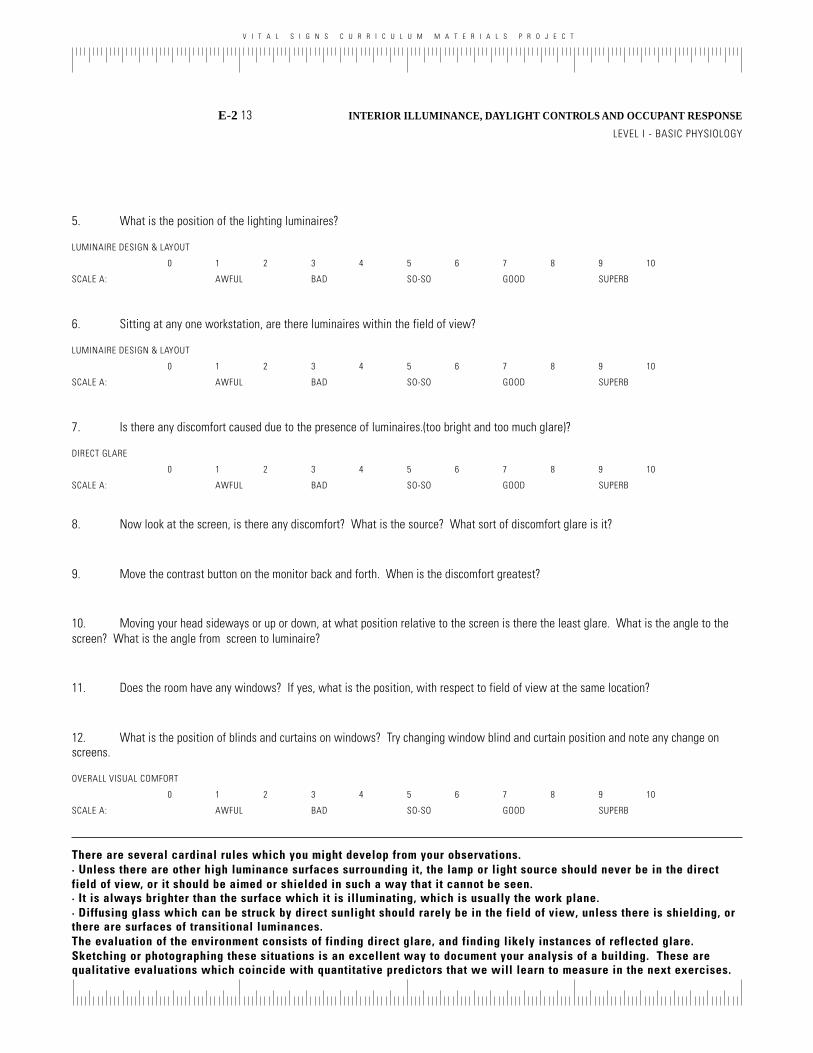
V I T A L S I G N S C U R R I C U L U M M A T E R I A L S P R O J E C T
INTERIOR ILLUMINANCE, DAYLIGHT CONTROLS AND OCCUPANT RESPONSE
LEVEL I - BASIC PHYSIOLOGY
E-2 13
5. What is the position of the lighting luminaires?
LUMINAIRE DESIGN & LAYOUT
0 1 2 3 4 5 6 7 8 9 10
SCALE A: AWFUL BAD SO-SO GOOD SUPERB
6. Sitting at any one workstation, are there luminaires within the field of view?
LUMINAIRE DESIGN & LAYOUT
0 1 2 3 4 5 6 7 8 9 10
SCALE A: AWFUL BAD SO-SO GOOD SUPERB
7. Is there any discomfort caused due to the presence of luminaires.(too bright and too much glare)?
DIRECT GLARE
0 1 2 3 4 5 6 7 8 9 10
SCALE A: AWFUL BAD SO-SO GOOD SUPERB
8. Now look at the screen, is there any discomfort? What is the source? What sort of discomfort glare is it?
9. Move the contrast button on the monitor back and forth. When is the discomfort greatest?
10. Moving your head sideways or up or down, at what position relative to the screen is there the least glare. What is the angle to thescreen? What is the angle from screen to luminaire?
11. Does the room have any windows? If yes, what is the position, with respect to field of view at the same location?
12. What is the position of blinds and curtains on windows? Try changing window blind and curtain position and note any change onscreens.
OVERALL VISUAL COMFORT
0 1 2 3 4 5 6 7 8 9 10
SCALE A: AWFUL BAD SO-SO GOOD SUPERB
There are several cardinal rules which you might develop from your observations.· Unless there are other high luminance surfaces surrounding it, the lamp or light source should never be in the directfield of view, or it should be aimed or shielded in such a way that it cannot be seen.· It is always brighter than the surface which it is illuminating, which is usually the work plane.· Diffusing glass which can be struck by direct sunlight should rarely be in the field of view, unless there is shielding, orthere are surfaces of transitional luminances.The evaluation of the environment consists of finding direct glare, and finding likely instances of reflected glare.Sketching or photographing these situations is an excellent way to document your analysis of a building. These arequalitative evaluations which coincide with quantitative predictors that we will learn to measure in the next exercises.
V I T A L S I G N S C U R R I C U L U M M A T E R I A L S P R O J E C T
INTERIOR ILLUMINANCE, DAYLIGHT CONTROLS AND OCCUPANT RESPONSE
LEVEL II- INSTANTANEOUS MEASUREMENTS
E-3 14
ASSIGNMENT THREE -INSTANTANEOUS ILLUMIN ANCEMEASUREMENTS
OBJECTIVE To be able to make illuminance measurements. To learn to record theimportant observations and data. To learn about calculated andderived measurements, such as daylight factors.
DISCUSSION Illuminance is light arriving at a surface and is a measure of howmuch light is available to perform a task. The most commonilluminance measurements involve measuring light arriving at ahorizontal work surface. It is easy to take data. It is unfortunately noteasy to make certain that you have all the critical data, especiallywhen measuring daylight, since the available light and weatherconditions are also important. Being unfamiliar with the equipmentand methods can cause problems. A lack of experience in recordingtrivial but critical events, conditions and setup may result in leavingout the most important piece. It is also possible to corrupt the data inthe process of measuring it. The observer often blocks incoming lightwith their body, or the metering equipment itself. If you stand next tothe metering device, you occupy a large portion of the field of view ofthe device.
This exercise deals not only with making instantaneous illuminancemeasurements but also with learning how to record and gather data.You will measure whatever light is available in the space, but youmust measure the space during daylight hours, and turn off theinternal lights. This allows you to learn about daylight factor andother calculated derivatives of the actual data. (Refer to Lesson 3, fordetails on measuring equipment, method and protocols to befollowed.)
EQUIPMENT You should use either hand held GE meters or similar meters to makethese measurements, along with field data sheets to record data.
METHOD Choose any two of the spaces you surveyed in your lighting tour,(Refer to Assignment 2). Fill in the top of the data record sheet torecord your observations, beforehand. (Refer Figure 3.6 in LessonThree for an example of a record data sheet.) At the beginning andend of each test measure the total sky illuminance, the diffuse skycomponent (with direct sun beam blocked.) Record illumination at 2foot intervals measured perpendicular from the window. In a skylitspace, measure across the room perpendicular to the primary axis ofthe skylight. Hold the meter 30 inches from the floor, with the sensorlooking straight up. Be very careful to keep your body below the planeof the sensor. If you are looking down on the sensor, you arecorrupting the reading. When you change scales on the meter make a
V I T A L S I G N S C U R R I C U L U M M A T E R I A L S P R O J E C T
INTERIOR ILLUMINANCE, DAYLIGHT CONTROLS AND OCCUPANT RESPONSE
LEVEL II- INSTANTANEOUS MEASUREMENTS
E-3 15
reading on both scales without changing the location of the photo cell.Repeat the procedure for the second space.
Later, working with your data, first correct for any differences in yourmeter’s scales by multiplying all lower readings by the differenceratio, if any. Next calculate the Daylight Factor (DF) by dividingfootcandles (or the measured readings) at each point by the averageof the diffuse sky readings. Note that the advantage of the daylightfactor is that even if the outdoor illumination changes greatly, twodifferent designs can be compared equally. Many design rules-of-thumb give daylight factors. If you try to associate your visualexperience in the space with the numbers you are recording, thisexperimental data will translate directly back to your designs.
EVALUATION 1. Write a report which includes the method of testing andsetting up the experiment, the time of day, observations about skyconditions, weather conditions, window location, surroundingobstacles, if any, and anything else which might later prove to be ofimportance. (When measuring “artificial” light, you must record thetype or manufacturer and model of the light sources, since meterssometimes vary in their spectral sensitivity.)
2. Draw sections through your space (1/8" = 1’0") with thewindow to the left, and plot the actual measured illumination levelsand corrected daylight factors. Repeat this for readings made in thesecond space.
3. Compare the graphs of the two spaces, and note the changein the daylight factors. Evaluate it in terms of difference in windoworientation, size, sill height, window area, internal room reflectances,and internal shading devices such as blinds, etc. Attach your fielddata sheets.
4. Include your observations about:whether light levels are lower than recommended levels,their relation to sky condition, solar position, window area andlocation, and visual comfort within the space and speculations as towhat could be done to improve the improve them if necessary.
5. Attach a data sheet witha. fc (both raw and corrected)b. DF (show calculations)
V I T A L S I G N S C U R R I C U L U M M A T E R I A L S P R O J E C T
INTERIOR ILLUMINANCE, DAYLIGHT CONTROLS AND OCCUPANT RESPONSE
LEVEL II - INSTANTANEOUS MEASUREMENTS
E-4 16
ASSIGNMENT FOUR - LUMINANCEMEASUREMENTS
OBJECTIVE To measure luminances and compare with illuminance measurementsand to make simple glare measurements.
DISCUSSION Defined simply, illuminance is light arriving at a surface and lumi-nance is light leaving a surface. Illuminance measurements provideinformation about light levels and their adequacy for performing tasks.However luminance measurements provide information aboutcontrasts, brightness, reflectance and glare within a space. In thisexercise you will learn how to make luminance measurements andcompare them to the illuminance measurements.
EQUIPMENT GE meter, Minolta meter and sketch paper to draw views and sketchesof the space.
METHOD Choose any one of the spaces in which you made instantaneousilluminance measurements. Identify any five surfaces within viewfrom a typical task location in that space and measure the illuminance(using GE meter or similar) arriving at those surfaces. Measure thereflected illuminance on a theoretical surface a small distance fromeach of the surfaces. The reflectance of the surface is theoreticallythe ratio of the two illuminances. Then return to the reference pointand measure the luminance of the surface as seen from that point.Again, the reflectance should be the ratio of the luminance to theilluminance of the surface. Then also measure the luminance of theglaring source and background luminance to determine glare withinthe space. For detailed procedures refer lesson 3, (3.2.2).
1. To determine illuminance, using a light meter, hold themeter’s light cell parallel to the plane of the surface you are interestedin measuring. Usually this means placing the base of sensor flat onthe surface to be measured. Remember, do not bring bright objectsclose to the meter or do not cast shadows on it.
2. Measure the illuminance of a theoretical surface in front ofthe surface. Hold the light meter’s cell close to the surface of interestand then draw it back 2 to 4 inches until the reading remains aconstant. Aim the sensor at the surface you just measured. Ideally,the meter should be seeing nothing but the reflecting surface, and yetbe far enough away so as not to shade the surface. The luminance isequal to the meter reading in foot-candles. Try to shade the surfaceas little as possible with your body.
V I T A L S I G N S C U R R I C U L U M M A T E R I A L S P R O J E C T
INTERIOR ILLUMINANCE, DAYLIGHT CONTROLS AND OCCUPANT RESPONSE
LEVEL II - INSTANTANEOUS MEASUREMENTS
E-4 17
3. Calculate the reflectance of the surface. The ratio of thesecond illuminance to the first illuminance is the reflectance of thesurface. Calculate the reflectance of the surface as a percentage.(Note that this is approximate, since the meter itself is blocking somelight, you are blocking some light, and the meter sees more than justthe reflecting surface.)
4. Now, turn off the lights, or let down the blinds, to make theroom comparatively darker than the previous set up. Repeat the entireprocedure. Note that you might have to change the ranges on yourlight meter. Recalculate the reflectances. They should be approxi-mately the same. Average the two reflectances calculated for eachsurface.
5. Now turn the lights back on, or raise the blinds again.Using a Minolta meter, measure the luminances of the surfaces. Pointthe Luminance meter towards the surface whose luminance you wantto measure, to make sure that it is in the field of view. Note thereading on the LCD display, and the range of the reading.
6. Compare these values with those originally measured withthe illuminance meter. How do these readings compare? Calculatethe reflectance of each surface based on the ratio of the luminancedivided by the illuminance. Compare these calculated reflectanceswith the reflectances calculated in step 4. If they are pretty close, youhave made accurate measurements and your spot meter is prettyaccurate! In fact, if they are within 10% of each other, you are doingwell.
7. Now with the luminance meter measure the luminance ofthe glaring source of light. Also the background or environmentalluminance needs to be measured. Try to average it out by measuringluminances across the space, or if a meter with a wider acceptanceangle is available, this averaging is not necessary. Measure theluminances of surfaces near the source of glare. For example the wallnear the window, or wall surrounding the blackboard in the classroom.
EVALUATION 1. The measured values of illuminance, luminance andreflectance for all the surfaces identified within the room for eachsituation (lights on and lights off.)
2. Rank the five surfaces in terms of highest to lowestbrightness for each background condition. Remember brightness isthe perceived luminance of the space. It is your subjective response.
3. What was the effect of the change in lighting on theilluminance, luminance and reflectances of the surfaces.

V I T A L S I G N S C U R R I C U L U M M A T E R I A L S P R O J E C T
INTERIOR ILLUMINANCE, DAYLIGHT CONTROLS AND OCCUPANT RESPONSE
LEVEL II - INSTANTANEOUS MEASUREMENTS
E-4 18
4. Your observations about
Ratio of luminance of glare source and background.
Comparison of the luminance of the source, surround andbackground for each view considered. Also sketch this view and showcontrast grading. Did you feel that the level of contrast was uncom-fortable in either case?
5. Would you go so far as to say there is glare in the space? Ifso, describe the cause.

V I T A L S I G N S C U R R I C U L U M M A T E R I A L S P R O J E C T
INTERIOR ILLUMINANCE, DAYLIGHT CONTROLS AND OCCUPANT RESPONSE
LEVEL II - INSTANTANEOUS MEASUREMENTS
E-5 19
ASSIGNMENT FIVE - MODEL TESTING
DISCUSSION The goals of designing good comfortable visual environments apply asdirectly to daylit spaces as to artificially lit spaces.
First: The absolute levels of illumination sufficient for seeing tasksshould be provided as deeply as possible into the interior.
Second: Brightness ratios in the visual field should be kept withincomfort limits just as with artificial lights (i.e., 1:3, 1:10, 1:20, 1:40depending on location in the visual field). Because sky brightness isusually part of the visual environment of the occupants, the control ofsurface reflectances is even more critical than in artificially lit spaces.Patches of direct sunlight reaching a work-surface would be devastat-ing. (See the IES recommended levels, and previous lessons.)1
Third: Location of fenestration in the visual field in daylit spaces hasa profound impact, because the source can be very bright, and mayhave moved from the ceiling to one wall and its brightness level ismany times higher. This means also that dynamic reflections are verydifficult to anticipate and eliminate.
Fourth: Apparent size or visual angle of the source of daylight is muchbigger than anything normally encountered in artificially lit spaces,however, its visual content (image) is far more interesting, which canbe turned to the designer’s advantage.
OBJECTIVE To design and build a scale model of an interior space which will betested outdoors with a light meter. The criterion is to compare variousdesign strategies to bring as much comfortable daylight indoors and toachieve comfortable lighting within the space.
EQUIPMENT The model you build should be fairly robust. If you try differentalternatives, then it will be modified several times. It should bedesigned so that the exposed facade can be easily removed andmodified. The scale should be 1/2"= 1'-0" or 1" = 1'-0". The materialmust be opaque, easily cut, and rigid (foam board must be coveredwith opaque black paper or aluminum foil). You will also need tobring along to class other materials like tape, glue, sheets of coloredpaper and possibly vellum, aluminum foil, and tinted acetates. Designexterior sun controls to be removable. Cut an access port largeenough for your sensor, from which you can move the sensor around.It should also accommodate your camera lens. You may choose to cutseveral viewports, but do so carefully.
1. IESNA, Handbook of Lighting Fundamen-tals, 1994, IESNA, New York

V I T A L S I G N S C U R R I C U L U M M A T E R I A L S P R O J E C T
INTERIOR ILLUMINANCE, DAYLIGHT CONTROLS AND OCCUPANT RESPONSE
LEVEL II - INSTANTANEOUS MEASUREMENTS
E-5 20
Bring a model-testing sundial for your latitude if you have one, orphotocopy one from Simulating Daylight with Architectural Models.2
You may wish to record the actual process, photographing a view asseen through the “double doors”, and also a photo of your facade withthe sundial showing time and orientation.
METHOD Choose any one of the spaces you measured in the exercise onInstantaneous Illuminance Measurements (Assignment Three). Builda model of the space. Based on your observations from that exercise,propose an alternative design scheme for the space which you feelwould be more successful in achieving a comfortable lightingenvironment within the space. First build the model to match thespace, and adjust it until readings from the model match readingsfrom the space. (Use DF if the weather is different from your originalobservations.) Keep the modifications and alterations to your modelready before starting to measure so that you can test both optionssuccessively.
Fill in the top of the data record sheet beforehand. At the beginningand end of each test, measure sky total, sky diffuse (with sun beamblocked) and so forth, exactly as you did for the Illuminance Measure-ments exercise. Record illumination every inch from the window.When you change scales on the meter make a reading on both scaleswithout changing the location of the photo cell.
Later, working with your data, first correct for any differences in yourmeter’s scales by multiplying all lower readings by the differenceratio, if any. Next calculate the Daylight Factor (DF) by dividingfootcandles at each point by the average of the diffuse sky readings.Note that the advantage of the daylight factor is that even if theoutdoor illumination changes greatly, two different designs can becompared equally.
Glare evaluation of your design can also be done, if there is time,using the luminance meter. Before beginning to measure, make a one-point perspective line drawing sketch of the interior space from theviewports. After you have made the illumination readings (above), usethe spot meter to read the luminance of a dozen of the brighter anddarker surfaces or area.
EVALUATION 1. Write a report which includes the scale of the model,drawings of the space showing your design alternatives, observationsabout sky conditions, weather conditions, window location and pointsat which measurements were taken.
2. Schiler, et al; Simulating Daylight withArchitectural Models, DNNA/USC, LosAngeles CA.

V I T A L S I G N S C U R R I C U L U M M A T E R I A L S P R O J E C T
INTERIOR ILLUMINANCE, DAYLIGHT CONTROLS AND OCCUPANT RESPONSE
LEVEL II - INSTANTANEOUS MEASUREMENTS
E-5 21
2. Draw sections through your building (1/8" = 1’0") and plotthe actual measured illumination levels, corrected daylight factor, justas you did with the real building.
3. Compare the graphs of your two design options, in terms ofavailable daylight factors using different colors or symbols. You alsomight want to indicate on the section drawing how the two facades ordesign schemes differed. Attach your field data sheet.
4. On your one-point perspective sketch, show brightness, thehighest contrast ratio, plus your notes and observations about visualcomfort in both spaces, and which you feel is more suitable and why.
5. Examine which option would you prefer for the space andexplain why, both qualitatively and quantitatively.

V I T A L S I G N S C U R R I C U L U M M A T E R I A L S P R O J E C T
INTERIOR ILLUMINANCE, DAYLIGHT CONTROLS AND OCCUPANT RESPONSE
LEVEL III - EXTENDED MEASUREMENTS
E-6 22
ASSIGNMENT SIX - MEASURINGILLUMINANCE OVER TIME
OBJECTIVE To collect data over time. The general criterion is to evaluate andcompare the lighting environment in spaces with different designfeatures. Collecting data over time allows analysis under a variety ofconditions which the space will experience.
DISCUSSION It is necessary to measure data over an extended period of time, if anyuseful information in terms of lighting levels, energy considerationsand occupant interaction is to be obtained. It is particularly useful ifyou wish to make predictions over a period of time, e.g. seasonalenergy usage. Make any necessary observations about lightingcontrols, window blind positions etc. over the course of thesemeasurements. This may be done with or without electric lights.
EQUIPMENT Hobo recording sensors along with the accompanying BoxCarsoftware, access to a PC or Mac where the BoxCar software can beinstalled, and tape to fix the Hobo’s at their locations. It must benoted that the Hobo’s are not very sensitive to shorter wavelengths,and there will be some inaccuracy, notably an underestimation of theluminance contributed by fluorescent sources. As a note, thealternative setup consists of a set of Licor sensors and a Licor orCampbell datalogger, or similar. These are more accurate, but muchmore difficult to program. The design of the experiment is the same.
METHOD 1. Draw a rough sketch of the place you wish to investigate.Decide the positions within the room where you want to place yourHobos. Remember, however, that you need to place one Hobo outsideto measure the exterior illuminance. Hence depending on the numberof Hobos available, decide on the positions within the space.
2. Launching the Hobo: To use the Hobos you have to installthe BoxCar software available with the sensors onto your computer.The package comes along with a cable, whose one end is connectedto your computer serial port and the other end to each individual Hobosuccessively. Once you have connected the cable, choose the Launchoption from under the Hobo menu.
(You might have some trouble here about your computer not recogniz-ing the port correctly. The software will prompt you to choose yourport again.)
V I T A L S I G N S C U R R I C U L U M M A T E R I A L S P R O J E C T
INTERIOR ILLUMINANCE, DAYLIGHT CONTROLS AND OCCUPANT RESPONSE
LEVEL III - EXTENDED MEASUREMENTS
E-6 23
3. Setting duration and Interval: Hobos are capable of takingup to 1800 measurements. When you launch a Hobo you will be givena choice to enter the duration of your test. In our case it is going to befor a week. The Hobo will automatically set the sensing interval forthis duration, with the total number of readings amounting to 1800.
Repeat this launching procedure for each Hobo.
Once each Hobo is launched, a flashing red light appears on the Hobo.This means that it is recording data.
4. The BoxCar software also gives you an option for a delayedstart for some types of Hobo's. Once you enter the date and time youwant to start making measurements, it will start measuring from thatinstant onwards. This is useful if there is no portable computer totake with you to the site of measurement.
5. Place these Hobos in the predetermined positions. Placeone outside for measuring exterior illuminance. Remember to notethe Hobo numbers for each position. The outside Hobo should beplaced in a position where there is little obstruction of the sky, forexample, on the roof parapet of the building being measured. If youreally want to do accurate DF measurements, it is necessary to makea sunshading strip which blocks the sun's path and nothing else, forthe dates being measured. For the purposes of this experiment, youmay skip that.
Note: While carrying the Hobos to the place of measurement, makesure to keep them away from direct sunlight, as this will affect thescale of the output at a later stage.
6. Retrieving data: After the test is completed, connect eachHobo back to the computer and choose the readout option under theHobo menu. The software gives you options as to how you want toread the data. For now the intensity or L/sf would be suitable. It alsoallows you to export your data to other formats like Microsoft Exceletc., which can be used to plot graphs, charts etc.
ASSIGNMENTPick any one of the following behaviors you wish to investigate.(Please note that these are just examples. You may wish to test yourown hypothesis).
1. The effect of light shelves on the light levels within aspace. Choose one space with a light shelf and compare it to anotherspace without a light shelf. However, try to keep the windoworientation and location similar to make it possible to draw conclu-sions.
2. The effect of vegetation on light levels within a space.Choose a space which is shaded by a tree or vegetation and onewhich has no such obstruction.
V I T A L S I G N S C U R R I C U L U M M A T E R I A L S P R O J E C T
INTERIOR ILLUMINANCE, DAYLIGHT CONTROLS AND OCCUPANT RESPONSE
LEVEL III - EXTENDED MEASUREMENTS
E-6 24
EVALUATION 1. A report including method of testing and setting up theexperiment, time of day, observations about the environment, roomoccupants etc.
2. Sections of your spaces at three different points in time,with absolute illuminance values at each point. If the there is aversion of the space with the lights off, then calculate the DF basedon the ratio of the interior illuminance to the exterior illuminance ateach given moment in time. Note that this is more universallycomparable than a plot of the absolute values would be, althoughboth are important pieces of information.
3. Sections of the spaces showing positions where lightinglevels within the space fall below IES recommended levels1 along withthe time and date.
4 The graphs obtained from the BoxCar software showing thechange in available illumination over the one week period.
5. Your observations about
When light levels are lower than recommended levels andtheir relation to sky condition, solar position and location.
When light levels within the space seem to be excessive,and if there is any relation with solar location.
Discussion of method, and behavior of light within thespace over time.
Conclusions as to whether or not your hypothesis issupported by the data.
Obviously, planning becomes most important when doingextended measurements, since a great deal of time can bewasted. Furthermore, we tend to measure critical periodssuch as the two weeks around the winter solstice. Sincethis comes only once a year, it is worth doing a dry run asdescribed in this exercise.
1. IESNA, Lighting Handbook, IESNA, NewYork, 1994. p 460-475.
3. The effect of an atrium or an open court on a spaceadjacent to it. Pick a space adjacent to an atrium and a similar spacewhich is entirely embedded. The perfect comparison (but hard to find)is a space which is adjacent to an outside wall on one side, and thena similar space which is adjacent to an outside wall on one side andan atrium wall on the other.
V I T A L S I G N S C U R R I C U L U M M A T E R I A L S P R O J E C T
INTERIOR ILLUMINANCE, DAYLIGHT CONTROLS AND OCCUPANT RESPONSE
LEVEL III - EXTENDED MEASUREMENTS
E-7 25
ASSIGNMENT SEVEN - GLAREEVALUATION
OBJECTIVE To measure and evaluate glare and visual comfort within interiorspaces, in terms of sufficient light for efficient visual performance anda comfortable and pleasing environment. This exercise also intro-duces the method of video photometry and advanced video capturingand data processing.
DISCUSSION Glare is a subjective phenomenon and is an expression of a form ofvisual sensation. This sensation cannot be measured. However thephysical factors which determine this sensation can be measured.This is not the same thing as measuring the sensation itself, howeverwith the aid of a statistically significant relation between theobjective measurement of physical factors and the subjectiveestimates of the magnitude of the corresponding sensation, a methodof evaluation of glare can be followed. This exercise is about themeasurement of the physical factors, which should be reinforced withyour subjective evaluations of the space (from Assignment Four) todetermine comfort within the space.
EQUIPMENT Video camera, digitizer board or “Snappy” digitizer, Photoshop ortranslator program, Excel or similar spreadsheet. Use a Minoltaluminance meter in lieu of a known luminance box (or build a box, ifyou have the time.)
METHOD 1. You can continue studying one of the spaces you measuredin Assignment Four. Sit at a typical task location, and look at the tasksurface. Now look around the space, and find a view with glare in it.This is again subjective, and some will find very glary views, andothers will find that the space is well designed, and there is little orno glare. Set up the experiment to simulate a typical task location.
2. We will take a single exposure of the view, and digitize thisinformation, but the procedure can be extrapolated for measurementover time. The protocols and method of recording, capturing andprocessing data remain the same except that here we would have onesingle image to analyze, and while conducting the experiment overtime you would have many more images.
3. Record, capture and digitize the image. Please refer toLesson Seven for protocols.
4. From the data obtained, find out the absolute luminance ofthe glare source, the background or environmental luminance as well
V I T A L S I G N S C U R R I C U L U M M A T E R I A L S P R O J E C T
INTERIOR ILLUMINANCE, DAYLIGHT CONTROLS AND OCCUPANT RESPONSE
LEVEL III - EXTENDED MEASUREMENTS
E-7 26
as the luminance of the surround to the glare source for example, thewall near the window. Refer Lesson Seven.
5. Prepare a matrix of observations showing intensity ofsource, background, percentage of view occupied by the source andbackground, as well as the contrast between the high intensity andbackground and any other interesting relationships you can think of.
EVALUATIONS 1. A Matrix of observations.
2. A report of the subjective evaluation. This will include thesketch of the view as well as the rendering of the brightnesses asseen by you.
3. A report explaining visual comfort in each situationcarefully, in terms of measured luminances and contrast ratiosbetween source and background levels, angle of view, distance fromsource (solid angle), contrast grading around probable glare source,illumination levels at task etc. This will be based on your measuredas well as subjective conclusions. Also explain why you thought thatdiscomfort was felt or could be experienced. (For example, highcontrasts within field of view, low background luminance, time of theday, position of sun, materials used etc.)
V I T A L S I G N S C U R R I C U L U M M A T E R I A L S P R O J E C T
INTERIOR ILLUMINANCE, DAYLIGHT CONTROLS AND OCCUPANT RESPONSE
LEVEL III - EXTENDED MEASUREMENTS
E-8 27
ASSIGNMENT EIGHT - DATAPRESENTATION
OBJECTIVE Presentation of complex data in several different formats.
DISCUSSION Producing data is of surprisingly little value. It is necessary toorganize data, and to present it, in order to understand it and conveythis understanding to others. What variables should be plottedagainst what, and what format should they be in? In order tounderstand the strength of different presentation formats it is usefulto look at data in several different formats.
EQUIPMENT Access to a computer (either a PC or a MAC), with some statisticalsoftware like Quattropro, Excel etc. Also software like DAYLIT,SUPERLITE, or Lumen Micro are optional. If available it would be agood idea to look them through.
METHOD State a hypothesis: What is the idea that you are testing? Forexample, you expect the distribution to be more even if there is a lightshelf, or you expect the light levels at the rear of the space to behigher. These both can be proven or disproven with rather simpleplots.
Choose a base case: It is usually useful to state which condition isthe base case. For example, in the hypotheses above, the base casewould be a room without a light shelf. The secondary cases are caseswith light shelves. To be certain that the hypothesis is proven true, ordisproven, you might have to try several different variations. Findingone case which matches the hypothesis and other cases which don’tleaves you with a modified hypothesis, namely, “light shelves mayimprove the distribution (or absolute level) of light within a space.”Finding the hypothesis to be wrong in all cases is just as valuable asfinding it to be right in all cases. It is the middle ground which getsmessy, and requires a lot more study. If some cases are improved, andsome are worse, then you must determine the behavior of all of thevariables.
You have manually drawn a cross section in an earlier exercise. Thistime the idea is to use the data stream output from the BOXCAR orsimilar software, or from a datalogger, as input for a data processingsoftware, such as the common spreadsheets EXCEL or Quattropro.
V I T A L S I G N S C U R R I C U L U M M A T E R I A L S P R O J E C T
INTERIOR ILLUMINANCE, DAYLIGHT CONTROLS AND OCCUPANT RESPONSE
LEVEL III - EXTENDED MEASUREMENTS
E-8 28
Load the data file into the spreadsheet: You will note that thereare several possibilities for loading the data. The files are typicallypositional. This means that the data is in the order in which it wasrecorded. Often there are positional records, as well. For example,position one is recorded as position one. You may delete this column,since it will plot as an extraneous and linearly increasing variable.(Position 1 has a value of 1, position 2 has a value of 2 ...)
The simplest plots are the bar chart plots and the line graphs. Withthe data from a single point, the line graph is the clearest. (Hobo datacomes in four columns; highlight only the illuminance column whenmaking the plot.) With the data from a second point, it is possible tocompare the readings over time for two different points. You may adda third, fourth and fifth point. Most programs (Excel, for example)allow you to open two or three files at once. It is fairly straightfor-ward to copy one column from one file an paste it into a new file,which will collate and present the new graph, when all the columnshave been pasted in. It is much easier, however, to use the samechronological starting point when cutting the data from the sourcefiles (i.e. prior to pasting it into the new file) since matching dates isquite annoying if the columns have different start points.
However, something becomes apparent. You are able to comparedifferent points over time, but that is not what you want. You wish tosee different points in the room at the same point in time. Thisrequires an exchange between row and column information. This canbe done be retyping, for a small number of values, but for automatedfiles, such as a Hobo file ( which may contain up to 1088 values) thisis prohibitive. In some instances the program will allow a reversalsuch that all the rows become columns and all the columns becomerows.
Finally, if you placed a three dimensional grid in the room, such asthat which provides an isolux plot, you would want to show a threedimensional plot. The x and y values of the plot would be the positionof the points in the plane of the floor, and the z value would be thedaylight factor or the absolute illuminance. These are difficult, butpossible in most spreadsheets, although typically they are shown as athree dimensional collection of bar charts. It is also possible to dosuccessive cross sectional graphs, if the x dimension corresponds tothe cross sectional measurement and the y direction corresponds tothe position parallel to the window.
There are more complex plots, which plot a point over a period oftime. These must be generated by specialized software, such asDAYLIT (Milne, et al, UCLA) or LIGHTSCAPES (Haglund and Sumption,U of Idaho.)
V I T A L S I G N S C U R R I C U L U M M A T E R I A L S P R O J E C T
INTERIOR ILLUMINANCE, DAYLIGHT CONTROLS AND OCCUPANT RESPONSE
LEVEL III - EXTENDED MEASUREMENTS
E-8 29
EVALUATION 1. Create a simple plot of a single point over a period of time.Show the values in at least two versions such as line plot and barchart. Experiment with legends, axis labels and a title for the entireplot. Learn the variations in the labeling on these, the simplest cases.In some programs, you can display a range of samples for a singlepoint, if you took more than one, and they were different. (Some willdisplay the average value, and the range of values, for example.)
2. Create a plot of three different points over a period of time.Input the data for the point nearest the window first, then the middlepoint, and then the point furthest from the window. Then do the samefor the next point in time. Show the data as bar charts and then asplots. Notice that the bar charts allow an interpretation as if we werestanding at the window and looking at cross sections, from the end ofeach cross section.
3. Manipulate the data to show a three dimensional grid ofpoints at a specific moment in time. This requires bar charts in mostspreadsheets, but some will allow other three dimensional plots.
4. (Optional) Use DAYLIT to model your space. Plot a series ofcross sections through the space at different times. First plot noon foreach month. Then plot all daylit hours for a single day, such asDecember 21.
5. (Optional) Plot a three dimensional graph of the illuminancefrom daylight at the midpoint of the space over an entire year. Plot theilluminance from electric lighting sources for the same point. Noticethat the one plot is the negative of the other, but clipped off at theends. Why is that?
6. (Really optional) Write a piece of software in Visual Basicor Visual C++ which plots the data from Hobo’s or a datalogger in thethree dimensional form that DAYLIT plots the calculated data.

V I T A L S I G N S C U R R I C U L U M M A T E R I A L S P R O J E C T
INTERIOR ILLUMINANCE, DAYLIGHT CONTROLS AND OCCUPANT RESPONSE
LEVEL III - EXTENDED MEASUREMENTS
E-9 30
ASSIGNMENT NINE - CONTROLS
OBJECTIVE To be able to correlate position and manipulation of lighting controlsto illuminance levels and occupant behavior within the space.
DISCUSSION The goal of this exercise is to combine an understanding of theconcepts of lighting controls, illuminance levels and occupantinteraction. You will be measuring and recording:
1. The illuminance levels within a space.
2. Position and manipulation of lighting controls.
3. Occupant interaction with controls as well as artificial light.
EQUIPMENT A JVC camera or any other camera recorder with time exposurecapability along with the Snappy Digitizer, light intensity Hobos aswell as temperature Hobos along with their accompanying Boxcarsoftware. Please refer to Assignment 6 and 7 for further details onequipment and accessories.
METHOD 1. Choose a space which has some form of operable lightingcontrols, for example, venetian blinds or rolling shades. Draw asketch of the room and decide on Hobo positions as well as cameraposition.
2. Set up the camera within the space, so that it can recordwindow position, occupant location and movement, and window blindposition and manipulation. Try to place the camera in an unobtrusiveplace within the room, either hanging from the ceiling, or fixed to thewall, so that it does not affect the normal behavior within the space.You will have to set the time recording facility on the camera to makeit record at the same time as the Hobo’s, for example every one hour.Refer Exercise 7 for detailed information on video setup, recording anddownloading using Snappy.
3. Set up the temperature Hobos, attached to the upper or inthe side surface of the light fixtures within the room. You will need tomake a decision here as to how many light fixtures there are withinthe room and where you want to place the temperature Hobo. Youcan place one above each fixture (if each fixture is operated sepa-rately and you have a number of Hobo’s), or else place one Hobo oneach representative row of fixtures, for example one for each rowaway from the window. Using a temperature Hobo is a proxy for
V I T A L S I G N S C U R R I C U L U M M A T E R I A L S P R O J E C T
INTERIOR ILLUMINANCE, DAYLIGHT CONTROLS AND OCCUPANT RESPONSE
LEVEL III - EXTENDED MEASUREMENTS
E-9 31
connecting an ammeter into the electrical circuit of that fixture togovern when the lights are turned on and off. You can use thetemperature Hobo’s as you are already familiar with launching anddownloading data from them. They serve as good indicators of whenthe lights were turned on and off within the space by noting the jumpand drop in temperatures recorded.
4. Record at least two days worth of data so that you have arecording of the diurnal change in illuminance levels within the space.Another important consideration is to synchronize the data from thevarious Hobos. If you have a Hobo with the delayed start option, thisis not an issue, but if such an option is not available, you will need tofake a start point, so that both the Hobos are correlated. This can bedone by turning the lights off in the space, for some time just afterlaunching. When the lights are turned on the various Hobos can besynchronized by lining up the data to the point where the jump in lightlevels is seen in the data.
EVALUATION 1. A report including a statement of exactly what you areexamining, method of testing and setting up the experiment, drawingsof the space showing location of the light Hobo’s as well as fixturelocation and temperature Hobo positions.
2. Sections, 3-d plots and graphs of the space showingilluminance levels over time within the space, illuminance levels atone point etc. Correlate these to the data obtained from the tempera-ture Hobo’s to determine whether the light is natural or electrical insource.
3. Try to graph the relation between illuminance levels withinthe space (data from Light Hobo’s) and the manipulation of artificiallights as well as controls within the room.
4. Your observations about
When were light controls manipulated, and their relation tosolar position and location. Use the captured video images for thisanalysis.
What were the light levels within the space, and theirvariation with any manipulation in the lighting controls.
When and where were the lights turned on in the space.
Discussion about method, behavior of light, performance oflighting controls and occupant interaction with the controls as well asartificial light over the period. Also discuss whether the blinds werebeing used effectively by the user within the space. Prepare acomprehensive report of the same.

V I T A L S I G N S C U R R I C U L U M M A T E R I A L S P R O J E C T
INTERIOR ILLUMINANCE, DAYLIGHT CONTROLS AND OCCUPANT RESPONSE
LEVEL III - EXTENDED MEASUREMENTS
E-10 32
ASSIGNMENT TEN - DEVELOPING ANDCONDUCTING AN OCCUPANT SURVEY
OBJECTIVE To conduct an occupant survey to evaluate the quality of the visualenvironment and occupant satisfaction within the space.
DISCUSSION The primary purpose of an occupant survey is to analyze and under-stand how to design optimum environments by evaluating existingconditions in buildings. In Assignment Six you measured light levelsin spaces over time. However you have no record of whether theoccupants within the space were comfortable with their lightingenvironment. This information is necessary to be able to extrapolateuseful information from the data, and make recommendations aboutlighting levels and occupant comfort within the space.
By now you have developed a reasonable understanding of whichissues are critical to visual comfort within a space. Prepare a surveyto evaluate the quality of the lighting environment in the space whichyou chose to measure from assignment six.
EQUIPMENT You do not need any equipment. Keep copies of your blank surveyform along with pencils to hand out to survey participants.
METHOD 1. State the hypothesis you wish to test.
2. List all the criteria you want the occupant to rate.
3. It is preferable to keep the scaling constant in any one survey.Develop a rating scale for your questions.
4. Develop the survey questions in terms of light adequacy, reasonsfor discomfort within the space, manipulation of lighting controls andoverall comfort within the space. Refer the generic questionnairepresented as an appendix in "Environmental quality in offices" byJacqueline C. Vischer, Pg. 230.
First draft the survey. Then go and survey 10 occupants in thebuildings you had measured earlier in Assignment Six.
1. One blank survey form.
2. Analysis of survey results: This could be in the form ofgraphs, charts etc., identifying problem areas, complaints and comfortrequirements within the space.
EVALUATION

V I T A L S I G N S C U R R I C U L U M M A T E R I A L S P R O J E C T
APPENDICES
V I T A L S I G N S C U R R I C U L U M M A T E R I A L S P R O J E C T
A-A 1 INTEROR ILLUMINANCE, DAYLIGHT CONTROLS AND OCCUPANT RESPONSE
APPENDICES
APPENDIX A - ANSWERS TO REVIEWQUESTIONS
Lesson One1.1 The eye can detect wavelengths from around 475 nanometers (nm) through 725 nm.
1.2 The cones in the eye sense colors. They are found on the retina.
1.3 The lens is the focusing device of the eye. The iris is the exposure adjustment device of the eye.
1.4 Large amounts of light (high illuminance levels) do not invariably cause glare. Small amounts oflight sometimes do cause glare. It depends on what the eye has adapted to. A flashlight can cause glareon a dark night, but it is difficult to note whether or not it is turned on a sunny day.
Lesson Two2.1 A material must be transparent in order to produce refraction, since the light must pass throughit in order to be refracted. Note that mirrors can focus light as well as lenses, but they do so by reflection,not by refraction.
2.2 Diffuse light is much less likely to produce glare and veiling reflections, because it comes fromall directions, and more or less creates the background adaptation level.
2.3 Color temperature describes the color shift of the light, towards blue or towards red. Colorrendering index describes the accuracy of different subsets of the spectrum.
2.4 The steradian is the unit of measure for a solid angle.
2.5 The lux (SI) or the footcandle (SAE) is the unit of measure of illuminance. The candela/m2 orcandela /ft2 is the unit of measure of luminance. Illuminance is the measure of light arriving at a surface,luminance is the measure of light leaving the surface.
Lesson Three3.1 Color corrected sensors match the visual sensitivity of the human eye in the photopic range.
3.2 Daylight factor is a useful calculation because it measures the fraction or percentage of the lightavailable on an exterior horizontal which will arrive at an interior workplane. This is useful because the DFdoesn't change very much for a given geometry, which gives us a single number to associate with the roombeing examined. It is especially useful in cloudy climates, where it gives a reasonably accurate measure ofthe illuminance for most of the time.
3.3 It is necessary to normalize (or cross calibrate) sensors if you are using more than one, becausesensors drift out of adjustment in different directions and at different rates. In fact, most sensors are notexactly accurate even when new.
3.4 You may calibrate manually using the formula:
Cx = E
ave / E
x
where:
Cx is the multiplier for the reading from the current sensor

V I T A L S I G N S C U R R I C U L U M M A T E R I A L S P R O J E C T
A-A 2 INTEROR ILLUMINANCE, DAYLIGHT CONTROLS AND OCCUPANT RESPONSE
APPENDICES
Eave is the average of all the sensor readings
Ex is the reading from the current sensor
This calibration is not perfect, but is very useful, nonetheless. Nonlinear behavior causes further complica-tions, but there is no simple manual way to account for that, nor is the nonlinearity function commonlyavailable. It also varies from meter to meter.
Lesson Four4.1 Illuminance is the light arriving at a surface. Luminance is the light leaving a surface. Weactually see luminance, not illuminance. Aiming a device at a workspace is measuring the luminanceswithin the workspace. Placing a device within the workspace could measure luminance, but is more likelyto be measuring the illuminance arriving on the surface on which the device has been placed.
4.2 Reflections do not always cause glare. In fact, you are probably reading these words from thelight reflected from this paper. If you are reading a display screen, the reflection is more likely to beannoying.
4.3 Adaptation establishes the size of the iris opening and the amount of light admitted to the eye.Glare occurs when there is too much light admitted and sensors are overloaded. The Glare Index includes afactor in the denominator, the general level of adaptation (Bb), which accounts for that factor. The formulafor the discomfort rating is given by
G = f(Bs)f(Q)
f(Bb)f(B
i)f(θ)
Where:
(Bs) is the luminance of the light source
(Q) is the size of the light source
(Bb) is the general level of adaptation
(θ) is the position of the sources and field of view
(Bi) is the luminance of the surrounds to the source
Lesson Five5.1 There is usually no difference between a model of the space and the space itself because lightbehaves uniformly in the scale of the model and the scale of the real building. Both scales are largecompared to typical visible wavelengths.
5.2 When photographing a model, it is important to include the simulated date and time onsomething which is visible inside the model because it is too easy to mix up photographs and slides, losingcomplete track of which one simulated which time and event. If the information is within the slide itself, itis always possible to sort the data again.
5.3 One inch to one foot (or 10:1 metric) is an effective minimum size for photographing interiors.This allows for fairly detailed surface and furniture treatments which makes a huge difference in theperception of the space.

V I T A L S I G N S C U R R I C U L U M M A T E R I A L S P R O J E C T
A-A 3 INTEROR ILLUMINANCE, DAYLIGHT CONTROLS AND OCCUPANT RESPONSE
APPENDICES
5.4 The biggest problem with an oversized sensor in inside a model is that it disturbs the light levelby changing the average reflectances. A second problem comes from trying to measure illuminance at thework plane when the sensor is larger than 30 inches in scale. It becomes necessary to punch holes in thefloor in order to drop the sensing surface down to the scaled workplane height.
Lesson Six6.1 A resistor bridge converts amps to volts. It is a resistor of known value placed within a circuit,with the voltage being read on both sides of the resistor.
6.2 The minimum interval between samples in extended sampling depends on the number of datapoints which can be stored and the length of time over which the behavior should be recorded. Interval islength divided by number of observations which can be stored.
Lesson Seven7.1 A handheld meter can be carefully calibrated and gives single number answers rapidly andeasily; video based systems are more difficult to calibrate and require longer processing times but yieldmuch more data.
7.2 A known luminance in a video image vastly simplifies the processing, and provides a permanentrecord of a base value in each image.
Lesson Eight8.1 An isolux plot is a contour plot showing illuminance levels, or lines of constant lux value. It iscreated by interpolating for integral values between grid points, in order to find where the isolux linewould cross the grid line. Then all the crossing points of a particular value are connected to one anotherforming the isolux line. Some guessing of curves is done to avoid discontinuities, which are quite rare inreal experience.
8.2 A control case is a version of the room to be sampled in which there are no alterations and inwhich the pattern of behavior is the same as the room to be sampled. A base case is the version againstwhich other variants are going to be compared. They are usually the same.
8.3 A thesis is a complete discussion composed of hypothesis, antithesis, testing, and synthesis.Perhaps the most important aspect is the idea that the experiment is designed to test something specific,and thus we make certain that we test the values of that variable or variables and minimize the variationsin the values we are not testing. Such a discussion might begin with the hypothesis when naturalilluminance is sufficient, the occupants will turn off the lights. (The antithesis is that they would not turnthe lights off when there is sufficient natural illuminance. The fact that they turn them off for some otherreason does not disprove the hypothesis.) The test is to monitor illluminance levels from natural light(which may require some careful thought if artificial light is mixed into the environment) and to check whathappens when the recommended values are exceeded. The conclusions will have to sort out the observa-tions and make careful sense of them.

V I T A L S I G N S C U R R I C U L U M M A T E R I A L S P R O J E C T
A-A 4 INTEROR ILLUMINANCE, DAYLIGHT CONTROLS AND OCCUPANT RESPONSE
APPENDICES
Lesson Nine9.1 Solar gain on East, West or North exposures is best controlled by using the difference betweensummer and winter azimuth angles, whereas South exposures are best controlled using differences inaltitude angles. Use of vertical controls relate to azimuth angles.
9.2 If you shut off the lights when there is only 1.5 times the design level present, then there will beonly .5 times the design level after the lights are off, which is not sufficient. (The correct solution is toshut half of the lights off, or to design lighting systems which allow that.)
9.3 Occupancy sensors may be infrared or ultrasonic, and may be wall mounted, scanning the roomhorizontally, or ceiling mounted, scanning the room vertically. Wall mounted sensors can be blocked bypartitions, ceiling mounted sensors can miss movement in corners.
9.4 The benefit of a stepped photosensing system relates to question #2 and to the fact that when itis completely shut off, there is no residual power usage. The primary liability is that it cannot exactlymatch the variations in natural lighting very efficiently, and the occupants usually notice each step changein the overall level.
Lesson Ten10.1 Post occupancy surveys are important because there is often a phenomenon which can berectified with simple changes, if it is known. This is true both in the existing building, and in the nextbuildings which the designer will design.
10.2 Test cell surveys are important because there are some questions which can be answered onlyunder controlled circumstances, so that external variables can be more nearly eliminated or held constant,while precise measurements are taken of the interaction of the variables being studied.
10.3 Surveys sample the experience of a moment and the overall experiences in a spatial environ-ment. In fact, some of the problems with making sense out of a survey is sorting out which experience theuser is commenting on during the survey, since occupants do not usually divorce the two unless they arecareful.
V I T A L S I G N S C U R R I C U L U M M A T E R I A L S P R O J E C T
INTERIOR ILLUIMINANCE, DAYLIGHT CONTROLS AND OCCUPANT RESPONSE
APPENDICESA-B 5
APPENDIX B - ANNOTATEDBIBLIOGRAPHY
BOOKS
MCGUINESS, WILLIAM J., STEIN, BENJAMIN, REYNOLDS, JOHN S., MECHANI-CAL AND ELECTRICAL EQUIPMENT FOR BUILDINGS, JOHN WILEY AND SONS,8TH EDITION, 1992
A useful reference text for lighting fundamentals, especially Chapter18, Page 911. The latter half of the section on Illumination deals withlighting design and lighting applications. The first two chapters onLighting fundamentals and Light sources and their characteristics areparticularly useful for understanding the fundamentals of the lightingenvironment. This is one of the few books which deal with illumi-nance, luminance, reflectance and intensity measurements and how tomake them. It also embarks on a discussion on the subject of lightingquality and quantity, glare and glare control, which is trenchant aswell as informative.
DNNA/SCHILER, MARC E., SIMULATING DAYLIGHT WITH ARCHITECTURALMODELS, DNNA.
This is an excellent guide on how to use physical models to developand study daylighting in buildings. The text is well supported withphotographs, illustrations and appendices. The information isorganized in a progressive manner with very few assumptions madeabout the reader. It is an extremely useful guide to have if you areintending to use physical models to study light in buildings.
SCHILER, MARC E., SIMPLIFIED DESIGN OF BUILDING LIGHTING, JOHN WILEY &SONS, INC., 1992
A compact and very useful text to understand the behavior of light,light availability, calculation methods and the actual process oflighting design written with a practical and concise approach. Bothnatural and electrical lighting issues are covered along with IESrecommended methods and definitions. The book is light to read andcovers all terms and conventions commonly heard of in the profession.
EGAN, DAVID M., CONCEPTS IN ARCHITECTURAL LIGHTING, MCGRAW-HILLBOOK COMPANY, 1983
A valuable collection of the principles of vision and the behavior oflight in the built environment in a graphical format. The illustrationsare particularly useful, they are not as supplements to the text butrather as a core to the coverage of the principles of vision, natural andelectric light sources as well as lighting measurements and controls.This is a handy book to have as it also contains an illustrated glossaryof lighting terms and definitions. The technical definitions are slightlyout of date.

V I T A L S I G N S C U R R I C U L U M M A T E R I A L S P R O J E C T
INTERIOR ILLUIMINANCE, DAYLIGHT CONTROLS AND OCCUPANT RESPONSE
APPENDICESA-B 6
ROBBINS, CLAUDE L., DAYLIGHTING DESIGN AND ANALYSIS, VAN NOSTRANDREINHOLD COMPANY, NEW YORK, 1986
Although essentially a book on design and analysis of daylightingsystems, it offers a useful discussion on vision and perception as wellas analysis techniques necessary to determine lighting, visual comfortand energy performance characteristics in daylighting systems.Chapter 11 offers a condensed view of the process of employingphysical scale modeling and chapter 14 talks of daylighting andelectric lighting integration which includes a discussion of electricalcontrol systems.
IES, LIGHTING HANDBOOK REFERENCE AND APPLICATION, 8TH EDITION, IESNA,NEW YORK, 1993
The Illuminating Engineering Society is the recognized authority in thefield of illumination engineering. This handbook provides carefuldefinitions and standards employed in the field of lighting design. Tobe used as a reference for standards and codes as well as for formsfor recording measurements, lighting calculations, light sources andenergy management etc.
VISCHER, JACQUELINE C., ENVIRONMENTAL QUALITY IN OFFICES, VANNOSTRAND REINHOLD, NEW YORK, 1989
A compact and very useful guide to understanding the process of acomplex building-in-use assessment. Although this deals with allaspects of a building diagnosis, the book is good reading to under-stand the actual process of building performance measurement andenvironmental psychology and to recommend courses of action toremedy assessed weaknesses. Rating questions and concerns for alighting system evaluation are directly useful and applicable.
PAPERS
BENTON, CHARLES C., DIMINUTIVE DESIGN, LIGHTING DESIGN + APPLICATION,MAY 1990, PG. 4
This is a good article written on the use of physical models fordaylighting analysis, and demonstrates the power of these models inaccurately modeling the daylighting distribution within a space. Itdefines techniques for accurate modeling as well as a brief descrip-tion of 10 projects in which daylighting models played an importantrole during the design stage. Models were used in these buildings topredict quantities of daylight in interior spaces as well as to assessthe qualitative aspects of daylight distribution. The usefulness of thisarticle is further strengthened if these projects could be used asexamples of well lit daylit buildings and field measurementsconducted in each of these buildings to determine the actualperformance of the daylighting systems.
BENTON, C., WARREN, M., SELKOWITZ, S., JEWELL, J., LIGHTING SYSTEMPERFORMANCE IN AN INNOVATIVE DAYLIGHTED STRUCTURE: AN INSTRU-MENTED STUDY, INTERNATIONAL DAYLIGHTING CONFERENCE, LONG BEACH,CALIFORNIA, NOVEMBER 1986
This is an excellently written paper which presents the results of aone-year instrumented study of the daylighting performance of anoffice structure. It describes the monitoring program followed tomeasure within the building, although a more detailed explanation ofmethods, protocols followed and data gathering process would havebeen more useful.
BENTON, C., ERWINE, B., WARREN, M., SELKOWITZ, S., FIELD MEASUREMENTSOF LIGHT SHELF PERFORMANCE IN A MAJOR OFFICE INSTALLATION, PROCEED-INGS OF THE 11TH NATIONAL PASSIVE SOLAR CONFERENCE, BOULDER,COLORADO, 1986
This is yet another useful paper on field measurement and instrumen-tation of existing buildings. The paper evaluates the monitoredperformance of an integrated lighting system of an existing building.Decentralised data acquisition systems at 62 different locations in thebuilding monitored the lighting systems for a year, recording averageilluminance levels and light power usage. The section whichdescribes the quantitative evaluation is particularly interesting as itdescribes the actual instrumentation and installation on site. This is avaluable paper to keep as a reference while undergoing extended fieldmeasurements.
DULANSKI, GARY, AN OVERVIEW OF MANAGING ENERGY WITH LIGHTINGCONTROLS, LIGHTING DESIGN AND APPLICATION, NOVEMBER 1987, PG. 44
This is a good article on the use of lighting controls in a good lightingdesign to deliver energy efficient designs. It discusses somedevelopments in control equipment utilizing on/off switching andolder time clock controls, occupancy sensors, photosensor switchingetc. It however does not discuss dimmable lighting controls. It isuseful as an introduction to lighting control systems.
EDWARDS, IAN K., COUNTING COUP, LIGHTING DESIGN AND APPLICATION,DECEMBER 1993
This is an excellent paper describing the basic principles of photom-etry as applied to hand held photometric equipment. In a very simpleto understand format, it discusses the foundations of photometry aswell as the various corrections and calibrations which need to beaccounted for while using these equipment.
IES, 1994 SURVEY OF ILLUMINANCE AND LUMINANCE METERS, LIGHTINGDESIGN + APPLICATION, JUNE 1994
This is a digest of the IESNA survey of Illuminance and LuminanceMeters. 53 meters from 18 different companies are described. Alongwith the general characteristics and functions of the photometers,there is also a list of some standard and optional features. Anotheradded attraction is the retail price range listed for each type of meter.This can serve as an excellent guide for equipment description.

V I T A L S I G N S C U R R I C U L U M M A T E R I A L S P R O J E C T
INTERIOR ILLUIMINANCE, DAYLIGHT CONTROLS AND OCCUPANT RESPONSE
APPENDICESA-B 7
MOORE, B. E., LEAVER III, J. F., MCQUEEN, T., LIGHTING SCHOOLS IN HOT HUMIDCIMATES: A CASE STUDY, INTERNATIONAL DAYLIGHTING CONFERENCE, LONGBEACH, CALIFORNIA, NOVEMBER 1987
This paper is a case study which explores existing schools in BatonRouge, Louisiana. The schools were studied in terms of physicalconfiguration as well as computer simulations on DOE 2.B todetermine most energy efficient window and lighting configurations.Additionally each window configuration was also studied in terms ofvisual comfort to determine a balance between energy efficiency andlight quality. This study is important in understanding the broaderimplications of performing a building lighting evaluation. The paper isa good example of what a lighting study entails, and what analysis isdrawn from such a study. This paper is not about physical measure-ments within the building, but it succeeds in developing protocols forcomputer simulations and analysis.
WHITE, R., AN ANALYSIS OF DAYLIGHT IN BUILDINGS DESIGNED BY LOUISKAHN, INTERNATIONAL DAYLIGHTING CONFERENCE, LONG BEACH, CALIFORNIA,NOVEMBER 1986
This paper presents the performance analysis of five daylightedbuildings designed by Louis Kahn. The measurements includedilluminance and color temperatures on vertical and horizontal planesas well as luminance variations perceived in different observerpositions and glare areas from sky sources. The project looksobjectively at how key buildings can teach us about the lightinteraction with the building surfaces as seen by the observer and thelimits of physical measurements of lighting which are unable todescribe this interaction in essence. The paper is valuable in that itdescribes the field measurement techniques as well as the occupantsurvey which was conducted.
OTHER RECOMMENDED READINGS
GILLETTE, GARY, EVALUATING OFFICE LIGHTING ENVIRONMENTS, LIGHTINGDESIGN + APPLICATION, MAY 1987, PG. 4
ERHARDT, LOUIS, THE VISUAL TASK, LIGHTING DESIGN + APPLICATION, JUNE1991, PG. 2
DIEMER, HELEN K., PHOTOMETRICS IS A DESIGN TOOL, LIGHTING DESIGN +APPLICATION, JANUARY 1988, PG. 25
DILAURA, D. L. (1975). ON THE COMPUTATION OF EQUIVALENT SPHEREILLUMINATION, JOURNAL OF THE ILLUMINATING ENGINEERING SOCIETY, JAN.1975.
DILAURA, D. L. (1976). ON THE COMPUTATION OF VISUAL COMFORT PROBABIL-ITY, JOURNAL OF THE ILLUMINATING ENGINEERING SOCIETY, VOL. 5, P.207, JULY1976
HELMS, RONALD, AND BELCHER, M. CLAY (1991), LIGHTING FOR ENERGYEFFICIENT LUMINOUS ENVRIRONMENTS, ENGLEWOOK CLIFFS, NJ, PRENTICEHALL.
IES SUBCOMMITTEE ON GUIDE FOR MEASUREMENT OF PHOTOMETRICBRIGHTNESS OF THE COMMITTEE ON TESTING PROCEDURES OF THE ILLUMI-NATING ENGINEERING SOCIETY, IES GUIDE FOR MEASUREMENT FOR PHOTO-METRIC BRIGHTNESS (LUMINANCE), ILLUMINATING ENGINEERING, JULY 1961,PG. 457
NAVVAB, MOJTABA, INTEGRATION OF DAYLIGHTING DESIGN TOOLS, LIGHTINGDESIGN + APPLICATION, MARCH 1991, PG. 13
ORFIELD, STEVEN J., PHOTOMETRY AND LUMINANCE DISTRIBUTION:CONVENTIONAL PHOTOMETRY VERSUS CAPCALC, LIGHTING DESIGN +APPLICATION, JANUARY
REA, M. S., PASINI IVALDO, JUTRAS LOUISE, LIGHTING PERFORMANCEMEASURED IN A COMMERCIAL BUILDING, LIGHTING DESIGN + APPLICATION,JANUARY 1990, PG. 22

V I T A L S I G N S C U R R I C U L U M M A T E R I A L S P R O J E C T
A-C 8 INTERIOR ILLUMINANCE, DAYLIGHT CONTROLS AND OCCUPANT RESPONSE
APPENDICES
APPENDIX C - LIST OF NECESSARYEQUIPMENT
MINIMAL LIST OF EQUIPMENT
GE Illuminance meters
Minolta Luminance meter
Campbell or Licor datalogger
Hobo Light Intensity Loggers
Known intensity Luminance boxes (can be manufactured or borrowedfrom other sites.)
JVC Video camera, or other camera suitable for time lapse video.
Video board for the PC or a ‘Snappy’ digitizer.
(access to a PC or Mac computer)
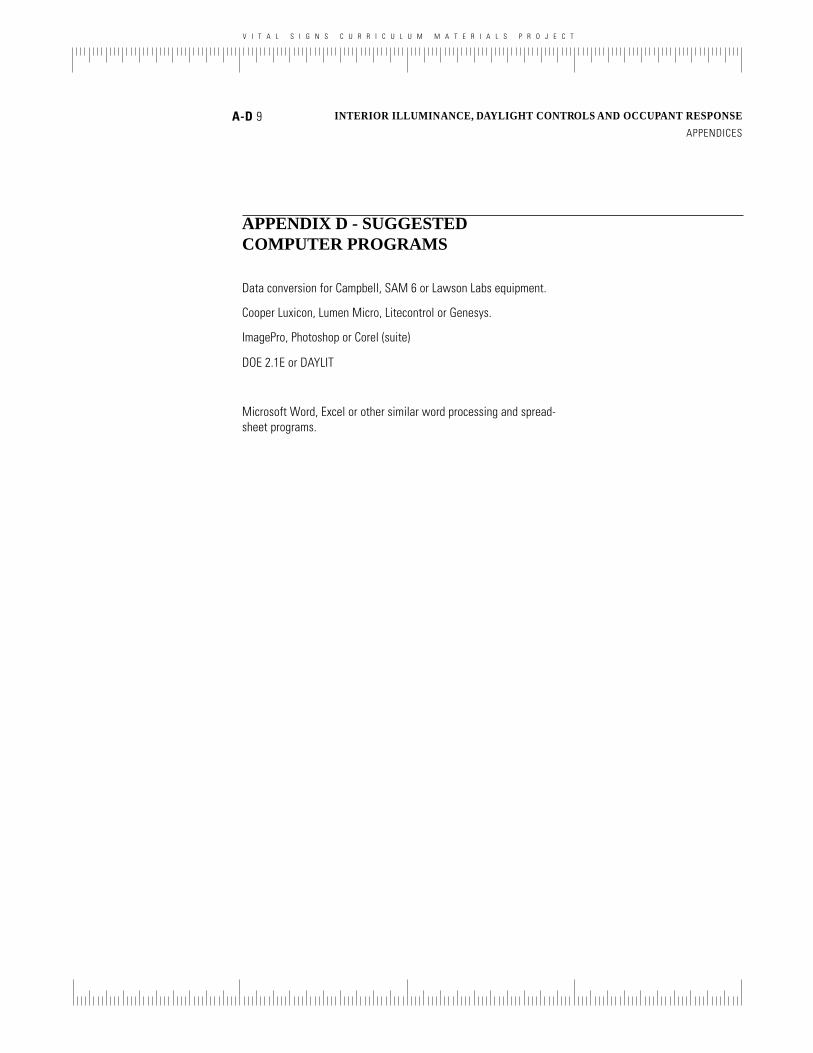
V I T A L S I G N S C U R R I C U L U M M A T E R I A L S P R O J E C T
A-D 9 INTERIOR ILLUMINANCE, DAYLIGHT CONTROLS AND OCCUPANT RESPONSE
APPENDICES
APPENDIX D - SUGGESTEDCOMPUTER PROGRAMS
Data conversion for Campbell, SAM 6 or Lawson Labs equipment.
Cooper Luxicon, Lumen Micro, Litecontrol or Genesys.
ImagePro, Photoshop or Corel (suite)
DOE 2.1E or DAYLIT
Microsoft Word, Excel or other similar word processing and spread-sheet programs.

V I T A L S I G N S C U R R I C U L U M M A T E R I A L S P R O J E C T
A-E 10 INTERIOR ILLUMINANCE, DAYLIGHT CONTROLS AND OCCUPANT RESPONSE
APPENDICES
APPENDIX E - LIST OF SAMPLEBUILDINGS
Case studies of Salk Institute or San Juan Capistrano Library.
Coastal Commission Building by Scott Ellinwood.
Huntington Park Elementary School by CHCG Architects.
Verifone Worldwide Distribution Center by Croxton CollaborativeArchitects.
George Washington Carver Elementary School by RTA/ BlurockArchitects Inc.
The Environmental Showcase Home, Consultants: David Scheatzle.
Moca, Los Angeles, by Isozahi.
Los Angeles Public Library by Goodhue/HHP.
Bradbury Building.
Santa Monica Arts Center, Gehry.
Temporary Library, UCLA.
Pacific Design Center.

V I T A L S I G N S C U R R I C U L U M M A T E R I A L S P R O J E C T
INTERIOR ILLUMINANCE, DAYLIGHT CONTROLS AND OCCUPANT RESPONSE
APPENDICES
A-F 11
APPENDIX F - GLOSSARY
Absorption coefficient The percentage of the incoming energywhich is absorbed. In measuring radiant energy (light or heat) it is aunit less ratio which may vary depending on wavelength.
AC or A/C The abbreviation for either Air Conditioning or AlternatingCurrent, depending on the context.
Accent lighting Lighting which is intended to draw attention to aspecific object rather than to create ambient lighting.
After image The image or negative image which remains on theretina as a result of adaptation, after the original stimulus is removed.
Alternating current An electric current which changes direction,back and forth, 60 times per second (Hz) in the U.S. and 50 Hz inEurope. A plot of the voltage over time looks like a sine wave.
Altitude angle The angle which measures the height of the sun upfrom the horizon. Altitude angles range from 0 degrees at the horizonto 90 degrees at the zenith. They are always taken in the plane of theazimuth.
Ambient A general or all surrounding condition. In lighting it refersto the background light level, as distinct from light from a visiblesource.
Azimuth The angle which measures the compass orientation of thesun, a wall (based on the normal to the wall) or anything else. Inarchitectural convention, it is measured from due South. East isnegative. West is positive.
ASHRAE The American Society of Heating, Refrigerating and AirConditioning Engineers.
Aspect ratio The ratio of the height to width of a room (relates tolight reflection) or of anything examined.
Back light Light which comes from behind a target, usually intendedto light up just the edge of the form from the viewed side.
Baffle A louver or fin which shields a light source from viewers toavoid glare.
Ballast A voltage and current (and sometimes frequency) regulatingdevice.
V I T A L S I G N S C U R R I C U L U M M A T E R I A L S P R O J E C T
INTERIOR ILLUMINANCE, DAYLIGHT CONTROLS AND OCCUPANT RESPONSE
APPENDICES
A-F 12
Barn doors Beam adjusting flaps which are sometimes placed infront of and at the edge of spot lights. Barn doors allow the edges ofa beam to be exactly matched to the edges of a rectangular targetsuch as a painting.
Beam spread The angle which measures the width of the beam.This is usually measured to a specific beam intensity such as 10%.
Black light Another term for ultraviolet light, typically in the near orA range.
Bulb The glass envelope for incandescent lamps.
Candela (cd) The unit measure of luminous intensity. See Chapter 2for exact definition.
Candlepower (cp) The old designation for luminous intensity in theEnglish system. May still be found in manufacturers literature. SeeChapter 2 for exact definition.
Candlepower distribution curve A portion of the photometricswhich gives the intensity of a source in any given direction. It isusually a polar plot, but can be a Cartesian plot, as well.
CBM or Certified Ballast Manufacturers The CBM is themanufacturers’ association which attempts to enforce the standardsset by the USASI or USA Standards Institute for ballast classifica-tions.
Clerestory A vertical plane of glass above the viewing pane, such asthe high windows in a cathedral, or daylighting windows in an officespace.
Code A set of rules or prescriptions for the process and product.Building code covers buildings and fire safety. Plumbing code coversplumbing, etc.
Coefficient of Utilization The ratio of useful light arriving at theworkplane compared to the amount of light emitted by the lamps, oradmitted by the window, or skylight. The CU depends on thereflectivity of different surfaces and the aspect ratios of the ceiling,wall, and floor cavities.
Color Correction Most meters are currently corrected to mimichuman eye sensitivity in the photopic range, since this includes bothpattern recognition and color differentiation. Some meters follow thePurkinje shift, and are calibrated to the human eye's scotopic range.Such meters are rare, and will be specially labeled.
Cones The color sensitive receptors in the eye. See section 1.2and Figure 1.3.
Contrast Rendition Factor (CRF) A measure of the level of contrastin a particular situation.
Cosine Correction A meter correction for light incident at obliqueangles and which does not reach the cell due to reflection from thesurface of the sensor or housing.
Cosine Law Another name for the point method of calculation,referring to the cosine factor applied to the angle between the normalto the receiving surface and the incoming ray.
CSA or Canadian Standards Association CSA approved meansthat an independent testing agency, the Canadian Standards Associa-tion, has tested representative samples of the labeled device, andcertifies that it meets the criteria of the classification for which it islabeled. The equivalent in the U. S. is the UL, or U.L. or Underwriters’Laboratories.
Cut off angle The angle (measured from beam centerline) beyondwhich the lamp is no longer visible, and is shielded by the diffuser orthe edge of the luminaire, or the point at which a collimated bulb hasbeen reduced to 10% of its luminous intensity.
Cps or cycles per second A measure of frequency, in electriccurrent or in acoustics, i.e. the number of times something occurs persecond. The term has been largely replaced by Hertz. 1 cps = 1 Hz.
Datalogger A device which records data from other sensors, over anextended period of time.
Daylighting The term for the practice of using light from outside toreplace electrically generated light indoors. It produces energysavings in electrical and in cooling costs when properly done, but cancause excessive heat gain when improperly done.
Daylight Factor (DF) The fraction of the exterior horizontalilluminance which is present at a particular location inside a space.
Diffuser A device through which the light from a fixture is diffusedinto a space. The diffuser usually effects the distribution of the lightand often reduces the concentration, or luminance at the fixture.
Dimmer A control which allows the amount of light from a fixture tobe reduced some percentage. On incandescent fixtures this may be asimple rheostat which reduces voltage, on fixtures with ballasts thismay be quite complex.
Downlight A light designed to illuminate a horizontal surface belowit.
Efficacy The ratio of the lumens emitted from a lamp to the wattsused to create those lumens, or the number of lumens of visible lightproduced by a lamp divided by the number of watts required toproduce it.
Efficiency The amount of light which leaves a luminaire divided bythe amount of light produced by the lamps inside it.
V I T A L S I G N S C U R R I C U L U M M A T E R I A L S P R O J E C T
INTERIOR ILLUMINANCE, DAYLIGHT CONTROLS AND OCCUPANT RESPONSE
APPENDICES
A-F 13
Emissivity A factor which represents the rate at which a givensurface material releases or emits radiant energy. The emissivityvaries from 0.0 to 1.0, where 1.0 is the theoretical emissivity of aperfect black box at the same temperature.
ESI or Equivalent Sphere Illumination The illuminance of asurface from a surrounding sphere which equals the same seeingcondition generated by a given illuminance from a given source.
Fill Light The secondary light source(s) which is(are) used to easeshadows created by the primary source. This softens a scene withoutlosing the three dimensional information which comes from having astrong primary source.
Flood A short term which refers to a lamp with a wide beam spread,used to flood an area with light.
Fluorescent An efficient, long lived light source.
Footcandle The basic unit of illumination arriving at a workplane orother surface. One footcandle = one lumen per square foot.
FootLambert The basic unit of illumination leaving a surface. OnefootLambert = one lumen per square foot.
Fovea The area at the back of the retina which has the highestconcentration of cones, and therefore the best color sensing capabili-ties.
Fresnel lens A lens which has been collapsed to a thin wafer. Thesurface is broken into concentric circles or horizontal slices, while theproper angular relationship of the original lens surfaces has beenmaintained. Images are broken up in transmission, but light beamsare generally still focused much like the original lens. The mostcommon examples are automobile headlights.
Fuse The piece of metal which melts at a predetermined temperatureor amperage, disconnecting an electrical circuit.
Glare Objectionable levels of contrast or brightness. It is theresult of unwanted light in the visual field, and is caused by thepresence of one or more sources of bright light in the field of view.
Herz or hertz The basic measure of frequency in acoustics, equiva-lent to the number of cycles per second.
HID or High Intensity Discharge A family of lamps which consistof a quartz envelope inside a glass envelope. The inner quartz tubecan stand higher temperatures, and allows for the current to arcbetween the two electrodes exciting a plasma of either mercury,metal halide or high pressure sodium. (The three lamp types in thefamily.)
High Pressure Sodium A high intensity discharge lamp.
Index of refraction A comparative number which allows thecalculation of the bending of a ray of light as it passes through thesurface between two materials.
Indirect lighting Lighting which is bounced off of a surface beforestriking the workplane.
Incandescent The original electric light source. Incandescents havegrown to a large group of lamp types, characterized by a filament,short lamp life, good optical control, and excellent color rendition.
Illuminance and Illumination The amount of light, or the intensity,falling on a surface, usually expressed in lumens/square foot (used tobe footcandles) (English) or lux (SI). This is similar to the luminousflux, but different, in that luminous flux was a light energy flow rate(dQ/dt). Illuminance is a flux (or flow rate) density.
E = df (arriving)
dA
It used to be called the illumination, and was defined as
E = F (arriving)
A
where F was the flux and A was the receiving surface area.
Infrared The wavelengths which are longer than the those of thevisible spectrum, which we perceive as warmth or heat, and whichresult from lower temperatures than visible light sources.
Inverse Square Law A physical principle which states that theintensity of a phenomenon is inversely proportional to the square ofthe distance from the source to the measuring device. It is true ofpoint sources of light, and many other natural phenomena.
Iris The portion of the eye which controls the amount of light whichenters, or the equivalent portion on a camera or theatrical spot light.
Key light The dominant light source, from which most of the shadowsare generated.
Lambert An SI unit of measure for luminance.
Lambertian surface A surface which emits or bounces light so thatit has the same brightness viewed from any angle.
Laser An acronym for Light Amplification by Stimulated Emission ofRadiation. Lasers are characterized by exact spectrum, exact beamcollimation, and all the waves being exactly in phase.
V I T A L S I G N S C U R R I C U L U M M A T E R I A L S P R O J E C T
INTERIOR ILLUMINANCE, DAYLIGHT CONTROLS AND OCCUPANT RESPONSE
APPENDICES
A-F 14
Luminance (L) The luminous flux leaving a projected surface in aparticular direction is luminance (L). The unit of measure is candela/sq. ft. or candela/sq. m.
Luminous Intensity (I) The amount of light put out by a source in aparticular direction is called the luminous intensity (I). The Candela isthe unit of measure. The magnitude of the unit is basically the sameas a candlepower, but the meaning is slightly different, and is a moreaccurate way of thinking about the process
I = df / dw
Lux The SI unit of measure for illuminance.
Mercury vapor A high intensity discharge lamp.
Metal Halide A high intensity discharge lamp.
Mounting height The height above the work plane at which afixture is mounted.
Munsell system A system for cataloging colors based on thesmallest discrete increment of color change recognizable by a human.The Munsell system uses hue, chroma, and value to organize thecomplete range of possible colors.
Nanometer (nm) The distance unit used to measure wavelengths,equivalent to 10-9 meter.
Near infrared The portion of the infrared spectrum nearest thevisible spectrum, namely 770 through 1400 nanometers.
Near ultraviolet The portion of the ultraviolet spectrum nearestthe visible spectrum, namely 300 through 380 nanometers.
NEC National Electrical Code
Occupancy sensor A device which is capable of sensing whetherthe room is currently occupied, typically used to control lighting.
Parabolic Aluminized Reflector (PAR) A lamp made of two glassparts, one is the reflector, welded together.
Photometrics The data which describes the beam characteristics ofa lamp, or lamp and fixture. See also candlepower distribution curve.
Photosensor A device which is capable of detecting the illuminanceon a prticular surface, or the average luminance of a space, typicallyused to control light levels.
Point method The most basic method of calculating the directcontribution of a light source to the illuminance on a given surface.
Post Occupancy Evaluation Checking the behavior of a buildingafter it has been occupied by the client.
Lens An object used to focus a beam of light, usually because it hasan index of refraction different from its surrounding medium, and anadjustable shape.
Libbey-Owens-Ford method (L-O-F) Another name for the lumenmethod of calculating daylighting.
Light Emitting Diode (LED) A display grid made of componentswhich glow depending on an electric charge. LED’s are visible atnight, but decrease in comparative visibility when external light levelsincrease. LED’s are generally invisible in direct sunlight.
Light shelf An overhang, either outside or inside or both, which isused with a clerestory to reflect light up onto the ceiling, and reducedirect light adjacent to the window below.
Line Frequency The line frequency is the term for the frequency ofthe alternating current in the circuit to which a fixture is attached.
Line Voltage The line voltage is the term for the voltage available inthe circuit to which a fixture is attached. Circuits often have 110, 208,220, 277 and other voltages, depending on building supply, trans-former and wiring.
Liquid Crystal Display (LCD) A display grid made of componentswhose transmissivity varies between clear and opaque levelsdepending on an electric charge. LCD’s must be lit by some othersource, or backlit, but they remain perfectly visible in high light levels.
Low Pressure Sodium An extremely efficient, monochromaticsource lamp.
Lumen A unit of light, defined as the amount of light passing throughone steradian from a one candela source.
Lumen method The method used for calculating illuminance levelsin uniform situations (of artificial and natural lighting sources) whichtakes room shape and internal reflection into account.
Luminaire A complete light fixture, including lamps.
Luminous Energy (Q) The amount of energy transmitted in thevisual spectrum. It is measured in lumen-seconds (lm-sec), oroccasionally in Talbots (T).
Luminous Flux (φφφφφ) The amount of luminous energy, or light, flowingthrough an imaginary surface or solid angle. The unit of measure isthe lumen. The flow through one steradian from a source of onecandela would be one lumen. The mathematical definition of flux is :
φ = dQ / dt
where Q is the luminous energy.
V I T A L S I G N S C U R R I C U L U M M A T E R I A L S P R O J E C T
INTERIOR ILLUMINANCE, DAYLIGHT CONTROLS AND OCCUPANT RESPONSE
APPENDICES
A-F 15
Talbot A rarely used unit of light equal to one lumen-second.
Toplighting Fenestration which is on a horizontal surface, or theprocess of using horizontal fenestration for daylighting.
Tungsten-halogen lamp Quartz, Halogen, and quartz-iodine are allnames for the same lamp source, which is a sophisticated type ofincandescent.
UBC The Uniform Building Code. One of several codes used asmodels for establishing local building codes. Predominant on theWest Coast.
UL, or U.L. approved UL approved means that an independenttesting agency, the Underwriter’s Laboratories, has tested representa-tive samples of the labeled device, and certify that it meets thecriteria of the classification for which it is labeled. The Canadianequivalent is the CSA or Canadian Standards Association.
Ultraviolet The wavelengths which are shorter than the those of thevisible spectrum, which result from higher temperatures than visiblelight sources.
Veiling reflection A reflection superimposed on a surface whichinterferes with the perception of the information on (or behind) thatsurface.
Visual acuity The ability to distinguish visible information.
Visual comfort probability an index which describes the percent-age of the people occupying a certain position who would notcomplain of glare as a result of the lighting considered in thecalculation.
Wavelength [lambda] The length of one complete cycle orwaveform of radiation (typically light). It is the reciprocal of thefrequency. The dominant wavelength determines the perceived coloror colors.
Watt The basic unit of electrical power, equal to the product of voltsand amperes in direct current systems. 1 Watt = 3.41 Btuh
Zonal cavity method Another name for the lumen method ofcalculating illuminance.
Purkinje shift The phenomena which shifts peak eye sensitivitytowards blue at very low light levels, as the rods take over from thecones.
Quartz lamp Halogen, tungsten-halogen, and quartz-iodine are allnames for the same lamp source, which is a sophisticated type ofincandescent.
Rapid start lamp The most common fluorescent lamp.
Reflectance [rho] The fraction (usually expressed as a percentage)of the incoming light energy which is bounced back from a surface.
Refraction The process by which light is bent when passing fromone medium to another.
Retina The internal receiving surface of the eye, which actuallycontains the sensing devices, the rods and the cones.
Rods The color sensitive receptors in the eye.
Scotopic vision Vision based on light sensed by the rods, typicallyat low light levels.
Sidelighting Fenestration which is on a vertical surface, or theprocess of using vertical fenestration for daylighting.
Skylight The most common form of toplighting, or horizontalfenestration.
Spectrum A range of electromagnetic radiation, usually referring toa portion of what is within the visible range.
Specular reflection A reflection which retains the original image.
Spot A short term which refers to a lamp with a narrow beamspread, used to spotlight a particular object.
Starter A device which starts the arc in a fluorescent, cold cathode,or neon lamp.
Steradian The unit of measure of a solid angle. It can be understoodin terms of a surface area one square unit on a sphere of one unitradius.
Strobe light A lamp capable of being flashed very rapidly, used inphotography for brief but very high levels of light, or for specialeffects. Also used in experiments for measuring change over verybrief periods of time.
Task lighting Lighting which is located at and focused on aparticular work function. It is often amenable to manipulation by thenearest worker.
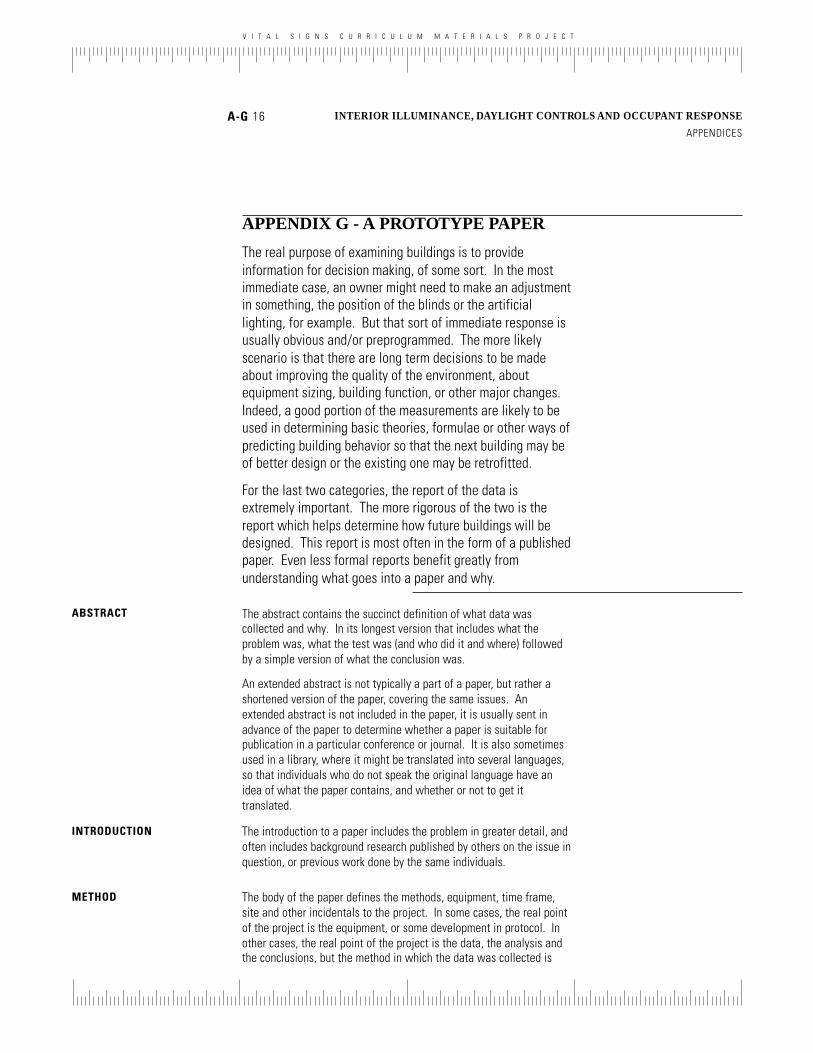
V I T A L S I G N S C U R R I C U L U M M A T E R I A L S P R O J E C T
A-G 16 INTERIOR ILLUMINANCE, DAYLIGHT CONTROLS AND OCCUPANT RESPONSE
APPENDICES
APPENDIX G - A PROTOTYPE PAPER
The real purpose of examining buildings is to provideinformation for decision making, of some sort. In the mostimmediate case, an owner might need to make an adjustmentin something, the position of the blinds or the artificiallighting, for example. But that sort of immediate response isusually obvious and/or preprogrammed. The more likelyscenario is that there are long term decisions to be madeabout improving the quality of the environment, aboutequipment sizing, building function, or other major changes.Indeed, a good portion of the measurements are likely to beused in determining basic theories, formulae or other ways ofpredicting building behavior so that the next building may beof better design or the existing one may be retrofitted.
For the last two categories, the report of the data isextremely important. The more rigorous of the two is thereport which helps determine how future buildings will bedesigned. This report is most often in the form of a publishedpaper. Even less formal reports benefit greatly fromunderstanding what goes into a paper and why.
ABSTRACT The abstract contains the succinct definition of what data wascollected and why. In its longest version that includes what theproblem was, what the test was (and who did it and where) followedby a simple version of what the conclusion was.
An extended abstract is not typically a part of a paper, but rather ashortened version of the paper, covering the same issues. Anextended abstract is not included in the paper, it is usually sent inadvance of the paper to determine whether a paper is suitable forpublication in a particular conference or journal. It is also sometimesused in a library, where it might be translated into several languages,so that individuals who do not speak the original language have anidea of what the paper contains, and whether or not to get ittranslated.
INTRODUCTION The introduction to a paper includes the problem in greater detail, andoften includes background research published by others on the issue inquestion, or previous work done by the same individuals.
METHOD The body of the paper defines the methods, equipment, time frame,site and other incidentals to the project. In some cases, the real pointof the project is the equipment, or some development in protocol. Inother cases, the real point of the project is the data, the analysis andthe conclusions, but the method in which the data was collected is
V I T A L S I G N S C U R R I C U L U M M A T E R I A L S P R O J E C T
A-G 17 INTERIOR ILLUMINANCE, DAYLIGHT CONTROLS AND OCCUPANT RESPONSE
APPENDICES
critical to the validity and applicability of the conclusions. Although itsometimes seems tedious, it is very useful to record such details.
DATA AND ANALYSIS The data should be included in some form or another, depending onthe format of the paper, and how much data is involved. Graphicpresentation is by far the best. Again, the average reader canassimilate far more information graphically than verbally. This meansthat figures, charts and graphs are most important, tables next, andtext should be there only to clarify the graphs, charts and tables.
Sometimes this section immediately becomes the analysis section, aswell. This means that the authors of the paper begin to point out thepatterns in the data. They clarify observations, and then begin to posethe relationships. This can mean they suggest that one variable is theresult of another, or that both are following some third drivingvariable. They might suggest that certain ranges of illuminance,luminance, or contrast are acceptable and others are not.
It is also appropriate to include information about the number ofsamples, or the size of the subject pool. Part of analyzing data iskeeping track of how solid it is. Again, repeatability is important, andtesting only one case limits the confidence with which we can extendconclusions to other cases. Since this is always true, it is mostappropriate to include the limitations of the data in the analysis andconclusion sections.
CONCLUSIONS The end of the paper is the determination of the conclusions. Thereare actually several types of conclusions. The most important, ofcourse, is the summation of the analysis. What behaviors areconfidently observed, and what might be predicted. The limitations ofthe data are also included in the conclusions. When do the predic-tions and observations apply, under what circumstances, and withwhat cautionary notes. Finally, the conclusions usually include whatwork should be done next, in order to further the work at hand, orverify the current analysis. Answering one question often leads toanother question.
ACKNOWLEDGMENTS In the life of the researcher, and probably in the experience of anyonewho gets time and equipment to monitor buildings, there is the needto recognize the sources which made the endeavor possible. This isnot only fair, in giving credit, but very useful, in identifying entitieswho are interested in such problems. It is also critical in obtaining thenext grant, if the work was funded!

V I T A L S I G N S C U R R I C U L U M M A T E R I A L S P R O J E C T
A-G 18 INTERIOR ILLUMINANCE, DAYLIGHT CONTROLS AND OCCUPANT RESPONSE
APPENDICES
CONCLUSIONS It is necessary to be able to clarify and express your experiences andconclusions, both for your own understanding of experiment orproject, and also in order to make the information available in a usefulmanner for others.
An example of a well written paper on a measurement project is:"Lighting System Performance in an Innovative Daylighted Structure:An Instrumented Study", by Benton, C., Warren, M., Selkowitz, S., andJewell, J., presented at the International Daylighting Conference,Long Beach, California, November 1986. Refer Appendix B for anannotation.
The following exercise gives you the chance of writing a paper basedon your recorded data which you have assembled while working onthe earlier exercises.
REVIEW QUESTIONS What is the difference between the abstract and theintroduction to a paper?
Where would you include alternative experiments or futureresearch suggestions?
ANSWERS TO REVIEWQUESTIONS
1 The abstract succinctly states what the paper will cover.The introduction begins to introduce the reader to the problem,previous work done on the subject, etc.
2 Alternative experiments or future research suggestions aretypically included in the conclusions.
V I T A L S I G N S C U R R I C U L U M M A T E R I A L S P R O J E C T
A-G 19 INTERIOR ILLUMINANCE, DAYLIGHT CONTROLS AND OCCUPANT RESPONSE
APPENDICES
ASSIGNMENT - WRITING A PAPER
Presentation of the results of the project in an easily comprehensiblebut rigorous manner.
OBJECTIVE
Half of the work in performing an experiment or evaluating a buildingis defining the problem, design the testing, getting the data andunderstanding it. The other half is presenting it to others. The bestway to bring closure to your understanding of the measurementprocess is to prepare a document which would be presentable as apaper to others who are knowledgeable on the topic.
DISCUSSION
There is no unusual equipment required for this assignment. You doneed access to word processing software like Word, or WordPerfectetc. which have importing capabilities, as you will need to importgraphics and graphical information prepared with different software.You will need to check your particular word processing software forfile import types.
EQUIPMENT
Take the work done in the earlier exercises and distill from it apresentable paper. It is clear that this paper does not necessarilybring any new information to the arena, but imagine that it does.Imagine that there has been little or no research of the type which youhave just completed, and that you need to disseminate your work in acareful and clear manner.
Following the guideline presented by the Lesson on Preparing a Paper,prepare a succinct Abstract. Produce a complete Introduction. TheIntroduction may be somewhat imaginary when referring to theproblem which prompted the study, but there should be real refer-ences to work done on the topic before. Ask your instructor forreferences, or go to the library and look up names which have beenused as references by the previous lessons or other books you haveread. Remember that once you have identified people who dointeresting work, you can look their names up in a publications indexand they are likely to show up again and again. There is a great dealof information in “trees” which run through computerized indices.When you read a paper, check the references for new names you havenot identified before. In turn, be careful to footnote your work.
Present the data and the analysis in the body of the paper. You mayuse the graphs prepared for any of the previous assignments. Makecareful and clearly defined conclusions from the work which you did.
METHOD
V I T A L S I G N S C U R R I C U L U M M A T E R I A L S P R O J E C T
A-G 20 INTERIOR ILLUMINANCE, DAYLIGHT CONTROLS AND OCCUPANT RESPONSE
APPENDICES
1. Produce a simple version of a paper, complete withabstract, main body, and conclusions. This paper should be from fourto six pages long, single spaced, including reduced plots, graphs andtables. For added realism, you should include a title, your own nameand affiliation and some formatting, i.e. heavier typefaces and fontsfor headings and subheadings, and perhaps even a two columnformat. Number all figures and tables, and provide captions.
EVALUATION
V I T A L S I G N S C U R R I C U L U M M A T E R I A L S P R O J E C T
SUMMARY
A complete range of exercises, covering everything from an under-standing of how your own eye works to how to do image processingon a digitized videoscan has been covered. In between we havetalked about illuminance and luminance, about models and buildings,about lighting controls and occupant responses. There is actually stilla great deal which has not been covered. The image processing mayresult in new theoretical understandings of glare, especially if wecould use test cells with a range of conditions and a range of testsubjects. The tools which you have learned allow you to understanddesign decisions better, evaluate existing buildings and proposespecific changes, or test models of a building before it is built.
You are encouraged to develop these techniques and protocols further.If you are interested, you are welcome to get in touch with us, as wewould be happy to hear from you.
Marc SchilerShweta Arun JapeeUniversity of Southern CaliforniaSchool of ArchitectureLos Angeles, CA 90089-0291
email [email protected]