Embed Size (px)
Citation preview
w w w. D u r r - G r O u p. C O M
i n t e r i M s tat e M e n tJ a n u a r y 1 t O s e p t e M B e r 3 0 , 2 019
Interim statement January 1 to September 30, 2019
2� � � � � � � � � � � � � � � � � � � � � � � � � � � � � � � � � � � � � � � � � � � � � � � � � � � � � � � � � � � � � � � � � � � � � � � � � � � � � � � � � � � � � � � � � � � � � � � � � � � � � � � � � � � � � � � � � � � � � � � � � � � � � � � � � � � � � � � � � � � � � � � � � � � � � � � � � � � � � � � � � � � � � � � � � � � � � � � � � � � � � � � � � � � � � � � � � � � � � � � � � � � � � � � � � � � � � � � � � � � � � � � � � � � �Contents
Contents3 Key figures
4 Highlights
5 Group management report
21 Consolidated statement of income
22 Consolidated statement of comprehensive income
23 Consolidated statement of financial position
25 Consolidated statement of cash flows
27 Consolidated statement of changes in equity
28 Financial calendar
28 Contact
COvER:Technology for the production of e-mobilit y dr ives: Schenck RoTec’s eTENO machine enables the fully automated balancing of electr ic armatures�
Interim statement January 1 to September 30, 2019
3� � � � � � � � � � � � � � � � � � � � � � � � � � � � � � � � � � � � � � � � � � � � � � � � � � � � � � � � � � � � � � � � � � � � � � � � � � � � � � � � � � � � � � � � � � � � � � � � � � � � � � � � � � � � � � � � � � � � � � � � � � � � � � � � � � � � � � � � � � � � � � � � � � � � � � � � � � � � � � � � � � � � � � � � � � � � � � � � � � � � � � � � � � � � � � � � � � � � � � � � � � � � � � � � � � � � � � � � � � � � � � � � � � � �
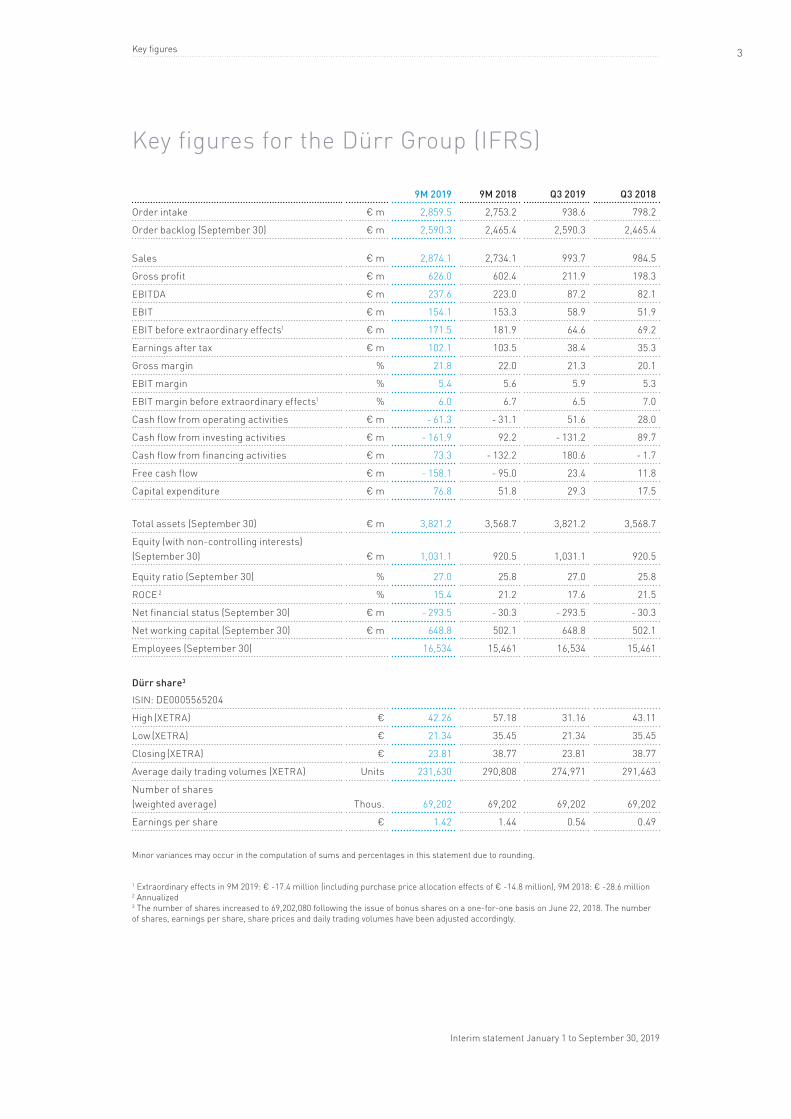
Key figures for the Dürr Group (IFRS)
9M 2019 9M 2018 Q3 2019 Q3 2018
Order intake € m 2,859�5 2,753�2 938�6 798�2
Order backlog (September 30) € m 2,590�3 2,465�4 2,590�3 2,465�4
Sales € m 2,874�1 2,734�1 993�7 984�5
Gross profit € m 626�0 602�4 211�9 198�3
EBITDA € m 237�6 223�0 87�2 82�1
EBIT € m 154�1 153�3 58�9 51�9
EBIT before extraordinary effects1 € m 171�5 181�9 64�6 69�2
Earnings after tax € m 102�1 103�5 38�4 35�3
Gross margin % 21�8 22�0 21�3 20�1
EBIT margin % 5�4 5�6 5�9 5�3
EBIT margin before extraordinary effects1 % 6�0 6�7 6�5 7�0
Cash flow from operating activities € m - 61�3 - 31�1 51�6 28�0
Cash flow from investing activities € m - 161�9 92�2 - 131�2 89�7
Cash flow from financing activities € m 73�3 - 132�2 180�6 - 1�7
Free cash flow € m - 158�1 - 95�0 23�4 11�8
Capital expenditure € m 76�8 51�8 29�3 17�5
Total assets (September 30) € m 3,821�2 3,568�7 3,821�2 3,568�7
Equity (with non-controlling interests) (September 30) € m 1,031�1 920�5 1,031�1 920�5
Equity ratio (September 30) % 27�0 25�8 27�0 25�8
ROCE 2 % 15�4 21�2 17�6 21�5
Net financial status (September 30) € m - 293�5 - 30�3 - 293�5 - 30�3
Net working capital (September 30) € m 648�8 502�1 648�8 502�1
Employees (September 30) 16,534 15,461 16,534 15,461
Dürr share3 ISIN: DE0005565204
High (XETRA) € 42�26 57�18 31�16 43�11
Low (XETRA) € 21�34 35�45 21�34 35�45
Closing (XETRA) € 23�81 38�77 23�81 38�77
Average daily trading volumes (XETRA) Units 231,630 290,808 274,971 291,463
Number of shares (weighted average) Thous� 69,202 69,202 69,202 69,202
Earnings per share € 1�42 1�44 0�54 0�49
Minor variances may occur in the computation of sums and percentages in this statement due to rounding�
1 Extraordinary effects in 9M 2019: € -17�4 million (including purchase price allocation effects of € -14�8 million), 9M 2018: € -28�6 million2 Annualized3 The number of shares increased to 69,202,080 following the issue of bonus shares on a one-for-one basis on June 22, 2018� The number of shares, earnings per share, share prices and daily trading volumes have been adjusted accordingly�
Key figures
Interim statement January 1 to September 30, 2019
4� � � � � � � � � � � � � � � � � � � � � � � � � � � � � � � � � � � � � � � � � � � � � � � � � � � � � � � � � � � � � � � � � � � � � � � � � � � � � � � � � � � � � � � � � � � � � � � � � � � � � � � � � � � � � � � � � � � � � � � � � � � � � � � � � � � � � � � � � � � � � � � � � � � � � � � � � � � � � � � � � � � � � � � � � � � � � � � � � � � � � � � � � � � � � � � � � � � � � � � � � � � � � � � � � � � � � � � � � � � � � � � � � � � �Highlights: Higher order intake, profit and cash flow in Q3 2019
Highlights: Higher order intake, profit and cash flow in Q3 2019
� 9M sales: up 5%, up 4% before currency translation � Order intake 9M: up 4%, up 2% before currency translation � Book-to-bill ratio of 1�0; order backlog of € 2�6 billion unchanged over December 31, 2018 � Service business: disproportionately strong growth of 12% � 9M EBIT: up 0�5% to € 154�1 million; Q3 EBIT: up 13�6% to € 58�9 million � Operating EBIT (before extraordinary effects):
9M: down 5�7% to € 171�5 million Q3: down 6�6% to € 64�6 million
� Expected improvement in margins in Paint and Final Assembly Systems in Q3 compared with earlier quarters Orders with wider margins being invoiced FOCUS 2�0 optimization program boosting efficiency
� Application Technology in line with expectations � Clean Technology Systems with sharp rise in earnings; integration of Megtec/Universal proceeding
according to plan � Substantially better Q3 for Measuring and Process Systems after weak first half � Clear improvement in Q3 order intake at HOMAG compared with muted Q2 2019; earnings down on
the previous year (due to factors such as stronger price pressure, lower capacity utilization and overly high production costs in some cases)
� Cash flow positive in Q3 � Outlook for 2019 as a whole:
EBIT forecast adjusted on November 6, package of measures adopted for HOMAG, outlook for operating earnings not affected
Order intake: € 3�8 - 4�1 billion (unchanged) Sales: € 3�9 - 4�1 billion (unchanged) EBIT margin: 4�4 - 4�9% (previously 5�5 - 6�0%) EBIT margin before extraordinary effects: 6�0 - 6�5% (unchanged)
Interim statement January 1 to September 30, 2019
5� � � � � � � � � � � � � � � � � � � � � � � � � � � � � � � � � � � � � � � � � � � � � � � � � � � � � � � � � � � � � � � � � � � � � � � � � � � � � � � � � � � � � � � � � � � � � � � � � � � � � � � � � � � � � � � � � � � � � � � � � � � � � � � � � � � � � � � � � � � � � � � � � � � � � � � � � � � � � � � � � � � � � � � � � � � � � � � � � � � � � � � � � � � � � � � � � � � � � � � � � � � � � � � � � � � � � � � � � � � � � � � � � � � �
GROUP MANAGEMENT REPORT
First-time application of IFRS 16 We have been applying the new International Financial Reporting Standard, IFRS 16 “Leases”, since January 1, 2019� The most important change is that lessees must now recognize all main leases as assets� The application of the new standard does not have any material impact on the Dürr Group’s results of ope-rations, although it has led to shifts within the income statement� Aggregate earnings before tax are un- changed across all periods� The application of IFRS 16 caused a charge of € 2 million within financial result in the first nine months of 2019, whereas EBIT improved by a similar amount� There was a positive effect of around € 23 million on EBITDA� On balance, the application of IFRS 16 did not have any impact on free cash flow, although the cash flow from operating activities rose by around € 22 million in the first nine months of 2019, whereas the cash flow from financing activities was correspondingly lower� In the opening balance sheet as of January 1, 2019, property, plant and equipment as well as investment properties increased by a total of € 88 million� Equity dropped by € 7 million, while there were declines of € 2 million in other items on the equity and liabilities side of the balance sheet� Financial liabilities rose by € 99 million, resulting in a corresponding drop in the net financial status�
HOMAG valuation proceedings: Appeal lodged by HOMAG shareholders against court rulingIn the valuation proceedings concerning the domination and profit transfer agreement entered into between Dürr Technologies GmbH and HOMAG Group AG, the Stuttgart Court of Appeals brought down a ruling in August 2019, providing for a minor increase in the cash settlement offer and the guaranteed dividend (com-pensation)� The court increased the cash settlement for shareholders of HOMAG Group AG who offer their shares to Dürr Technologies GmbH by € 0�02 to € 31�58 and the guaranteed dividend by € 0�02 to € 1�03 net per share� However, as HOMAG shareholders have lodged an appeal against this decision, the matter will now probably be referred to the higher court� This means that the original cash settlement offer and guaran-teed dividend (compensation) will continue to apply until further notice� Dürr expects the proceedings before the Upper Court of Appeals in Stuttgart to take between one-and-a-half and two years�
Package of measures for HOMAG Group The Dürr Group has adopted a package of measures aimed at achieving substantial efficiency gains and implementing structural changes in the Woodworking Machinery and Systems division (HOMAG Group)� The package entails non-recurring expenses of € 40 million, of which around € 37 million will be arising in 2019� These measures are to generate annual savings of around € 15 million by 2021 at the latest�
They include the closure of the production at the Hemmoor site (Lower Saxony, Germany) and further per-sonnel adjustments at other German locations� Roughly 350 out of a global total of 6,615 jobs are to be cut at HOMAG by 2020� The company currently has around 4,100 employees in Germany� With this initiative, HOMAG is actively addressing the structural surplus capacities in Germany and responding to capacity additions in growth markets� In earlier years, HOMAG was able to make full use of its domestic German ca-pacities due to the extraordinarily strong demand in the furniture industry� However, demand for HOMAG is currently lower, a situation which is also likely to continue in 2020� It is in response to this that the package of measures, which also includes the merger of the Systems and Automation segments, is being implemented�
Group management report
Interim statement January 1 to September 30, 2019
6� � � � � � � � � � � � � � � � � � � � � � � � � � � � � � � � � � � � � � � � � � � � � � � � � � � � � � � � � � � � � � � � � � � � � � � � � � � � � � � � � � � � � � � � � � � � � � � � � � � � � � � � � � � � � � � � � � � � � � � � � � � � � � � � � � � � � � � � � � � � � � � � � � � � � � � � � � � � � � � � � � � � � � � � � � � � � � � � � � � � � � � � � � � � � � � � � � � � � � � � � � � � � � � � � � � � � � � � � � � � � � � � � � � �
Operating environmentAgainst the backdrop of the trade conflicts, the unresolved Brexit question and mounting political tension (e�g� Iran and Turkey/Syria), the economy has deteriorated significantly in the year to date� The central banks and markets have reacted to this, with interest rates declining substantially� German ten-year Bunds, for example, are currently yielding -0�4%� There was only little change in exchange rate parities in the first nine months of 2019�
Global automotive production is now headed for a full-year decline of 4%� By comparison, experts had been projecting growth of 4% at the beginning of the year� In particular, demand in China, the world’s largest auto-motive market, is slowing appreciably� Order volumes in the mechanical engineering industry continued on the downward trend of the past 12 months� Customer restraint is particularly evident in the market for woodworking machinery�
Business performance1
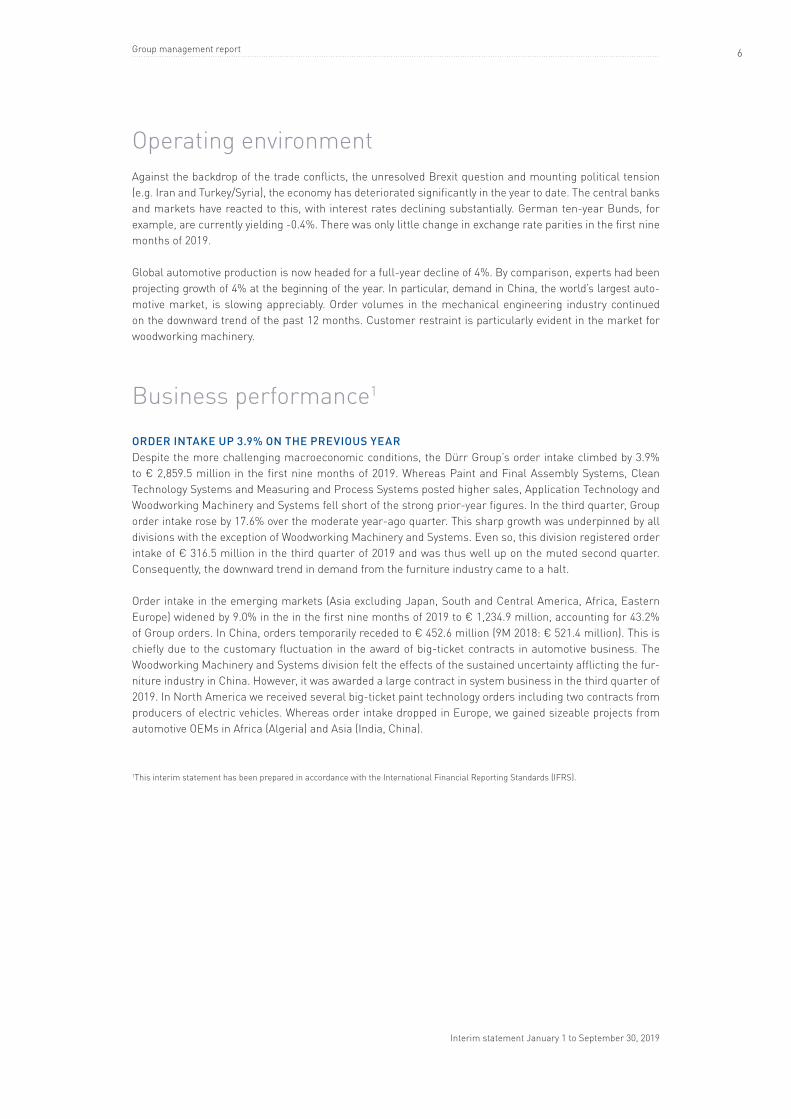
OrDer intake up 3.9% On the previOus yearDespite the more challenging macroeconomic conditions, the Dürr Group’s order intake climbed by 3�9% to € 2,859�5 million in the first nine months of 2019� Whereas Paint and Final Assembly Systems, Clean Technology Systems and Measuring and Process Systems posted higher sales, Application Technology and Woodworking Machinery and Systems fell short of the strong prior-year figures� In the third quarter, Group order intake rose by 17�6% over the moderate year-ago quarter� This sharp growth was underpinned by all divisions with the exception of Woodworking Machinery and Systems� Even so, this division registered order intake of € 316�5 million in the third quarter of 2019 and was thus well up on the muted second quarter� Consequently, the downward trend in demand from the furniture industry came to a halt�
Order intake in the emerging markets (Asia excluding Japan, South and Central America, Africa, Eastern Europe) widened by 9�0% in the in the first nine months of 2019 to € 1,234�9 million, accounting for 43�2% of Group orders� In China, orders temporarily receded to € 452�6 million (9M 2018: € 521�4 million)� This is chiefly due to the customary fluctuation in the award of big-ticket contracts in automotive business� The Woodworking Machinery and Systems division felt the effects of the sustained uncertainty afflicting the fur-niture industry in China� However, it was awarded a large contract in system business in the third quarter of 2019� In North America we received several big-ticket paint technology orders including two contracts from producers of electric vehicles� Whereas order intake dropped in Europe, we gained sizeable projects from automotive OEMs in Africa (Algeria) and Asia (India, China)�
1This interim statement has been prepared in accordance with the International Financial Reporting Standards (IFRS)�
Group management report
Interim statement January 1 to September 30, 2019
7� � � � � � � � � � � � � � � � � � � � � � � � � � � � � � � � � � � � � � � � � � � � � � � � � � � � � � � � � � � � � � � � � � � � � � � � � � � � � � � � � � � � � � � � � � � � � � � � � � � � � � � � � � � � � � � � � � � � � � � � � � � � � � � � � � � � � � � � � � � � � � � � � � � � � � � � � � � � � � � � � � � � � � � � � � � � � � � � � � � � � � � � � � � � � � � � � � � � � � � � � � � � � � � � � � � � � � � � � � � � � � � � � � � �
Order intake (€ m) January - September 2019
€ m 9M 2019 9M 2018 Q3 2019 Q3 2018
Order intake 2,859�5 2,753�2 938�6 798�2
Sales 2,874�1 2,734�1 993�7 984�5
Order backlog (September 30) 2,590�3 2,465�4 2,590�3 2,465�4
SaleS up 5.1% Sales in the first nine months of 2019 rose by 5�1% to € 2,874�1 million� With the exception of Application Technology and Measuring and Process Systems, the divisions posted what in some cases was substantial top-line growth� In the third quarter, Group sales rose by 0�9% and, at € 993�7 million, were well up on the previous two quarters in absolute terms�
Germany accounted for 18% of Group sales in the first nine months, other European countries for 28%, North and South America for 27% and Asia, Africa and Australia likewise for 27%� The emerging markets contributed 44% to sales�
Service revenue rose more quickly than total sales in the first nine months of 2019, climbing sharply by 12%� The service revenues of € 814�6 million accounted for 28�3% of Group sales� The growth in service business was underpinned by all five divisions, with the acquisition of Megtec/Universal yielding a positive effect in Clean Technology Systems�
The book-to-bill ratio came to 1�0� Order backlog rose by € 13�2 million over the end of 2018 to € 2,590�3 million, increasing by € 125�0 million over the same date in the previous year�
Group management report
2,753�2
521�4 565�7 573�9
794�1
298�0
2,859�5
452�6
914�7
431�1
722�9
338�1
0�0
500�0
1,000�0
1,500�0
2,000�0
2,500�0
3,000�0
3,500�0
Total China Americas Germany Europe (w/oGermany)
Asia (w/o China),Africa, Australia
2018 2019
+3.9%
-13.2%
+61.7%
-24.9%
-9.0%
+13.5%
Interim statement January 1 to September 30, 2019
8� � � � � � � � � � � � � � � � � � � � � � � � � � � � � � � � � � � � � � � � � � � � � � � � � � � � � � � � � � � � � � � � � � � � � � � � � � � � � � � � � � � � � � � � � � � � � � � � � � � � � � � � � � � � � � � � � � � � � � � � � � � � � � � � � � � � � � � � � � � � � � � � � � � � � � � � � � � � � � � � � � � � � � � � � � � � � � � � � � � � � � � � � � � � � � � � � � � � � � � � � � � � � � � � � � � � � � � � � � � � � � � � � � � �
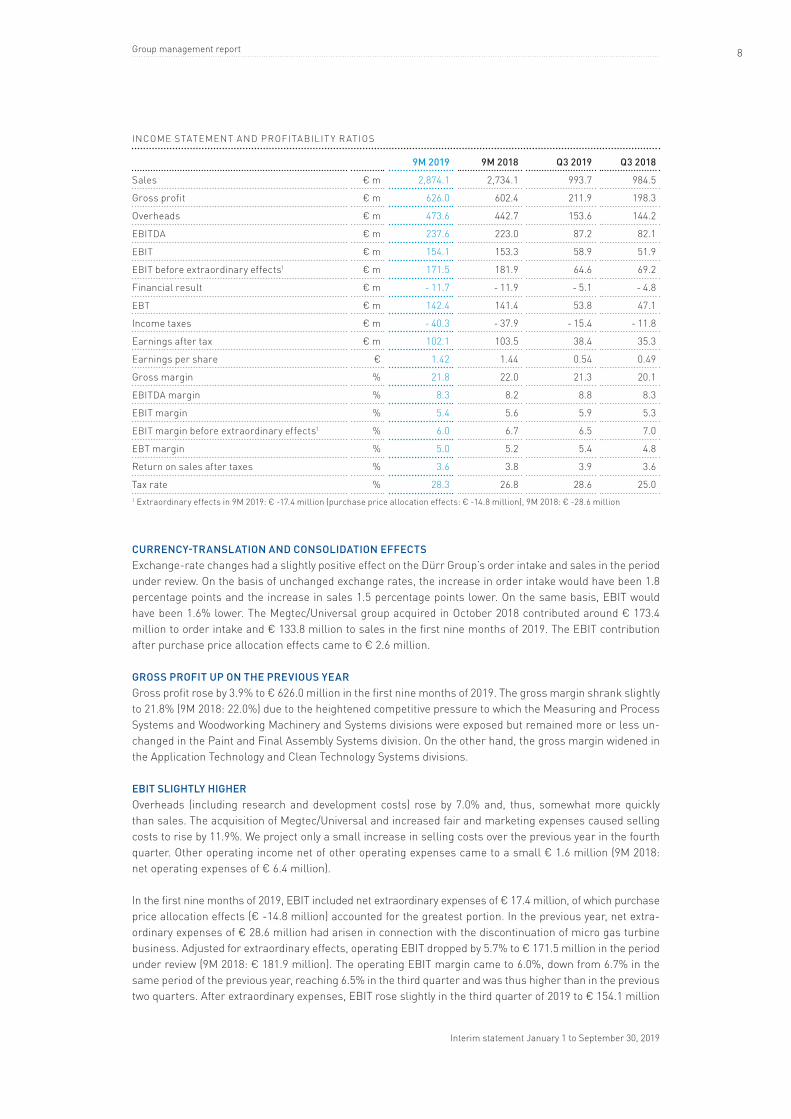
INCOME STATEMENT AND PROFITABILIT Y R ATIOS
9M 2019 9M 2018 Q3 2019 Q3 2018
Sales € m 2,874�1 2,734�1 993�7 984�5
Gross profit € m 626�0 602�4 211�9 198�3
Overheads € m 473�6 442�7 153�6 144�2
EBITDA € m 237�6 223�0 87�2 82�1
EBIT € m 154�1 153�3 58�9 51�9
EBIT before extraordinary effects1 € m 171�5 181�9 64�6 69�2
Financial result € m - 11�7 - 11�9 - 5�1 - 4�8
EBT € m 142�4 141�4 53�8 47�1
Income taxes € m - 40�3 - 37�9 - 15�4 - 11�8
Earnings after tax € m 102�1 103�5 38�4 35�3
Earnings per share € 1�42 1�44 0�54 0�49
Gross margin % 21�8 22�0 21�3 20�1
EBITDA margin % 8�3 8�2 8�8 8�3
EBIT margin % 5�4 5�6 5�9 5�3
EBIT margin before extraordinary effects1 % 6�0 6�7 6�5 7�0
EBT margin % 5�0 5�2 5�4 4�8
Return on sales after taxes % 3�6 3�8 3�9 3�6
Tax rate % 28�3 26�8 28�6 25�01 Extraordinary effects in 9M 2019: € -17�4 million (purchase price allocation effects: € -14�8 million), 9M 2018: € -28�6 million
CurrenCy-translatiOn anD COnsOliDatiOn effeCts Exchange-rate changes had a slightly positive effect on the Dürr Group’s order intake and sales in the period under review� On the basis of unchanged exchange rates, the increase in order intake would have been 1�8 percentage points and the increase in sales 1�5 percentage points lower� On the same basis, EBIT would have been 1�6% lower� The Megtec/Universal group acquired in October 2018 contributed around € 173�4 million to order intake and € 133�8 million to sales in the first nine months of 2019� The EBIT contribution after purchase price allocation effects came to € 2�6 million�
GrOss prOfit up On the previOus year Gross profit rose by 3�9% to € 626�0 million in the first nine months of 2019� The gross margin shrank slightly to 21�8% (9M 2018: 22�0%) due to the heightened competitive pressure to which the Measuring and Process Systems and Woodworking Machinery and Systems divisions were exposed but remained more or less un- changed in the Paint and Final Assembly Systems division� On the other hand, the gross margin widened in the Application Technology and Clean Technology Systems divisions�
eBit sliGhtly hiGher Overheads (including research and development costs) rose by 7�0% and, thus, somewhat more quickly than sales� The acquisition of Megtec/Universal and increased fair and marketing expenses caused selling costs to rise by 11�9%� We project only a small increase in selling costs over the previous year in the fourth quarter� Other operating income net of other operating expenses came to a small € 1�6 million (9M 2018: net operating expenses of € 6�4 million)�
In the first nine months of 2019, EBIT included net extraordinary expenses of € 17�4 million, of which purchase price allocation effects (€ -14�8 million) accounted for the greatest portion� In the previous year, net extra-ordinary expenses of € 28�6 million had arisen in connection with the discontinuation of micro gas turbine business� Adjusted for extraordinary effects, operating EBIT dropped by 5�7% to € 171�5 million in the period under review (9M 2018: € 181�9 million)� The operating EBIT margin came to 6�0%, down from 6�7% in the same period of the previous year, reaching 6�5% in the third quarter and was thus higher than in the previous two quarters� After extraordinary expenses, EBIT rose slightly in the third quarter of 2019 to € 154�1 million
Group management report
Interim statement January 1 to September 30, 2019
9� � � � � � � � � � � � � � � � � � � � � � � � � � � � � � � � � � � � � � � � � � � � � � � � � � � � � � � � � � � � � � � � � � � � � � � � � � � � � � � � � � � � � � � � � � � � � � � � � � � � � � � � � � � � � � � � � � � � � � � � � � � � � � � � � � � � � � � � � � � � � � � � � � � � � � � � � � � � � � � � � � � � � � � � � � � � � � � � � � � � � � � � � � � � � � � � � � � � � � � � � � � � � � � � � � � � � � � � � � � � � � � � � � � �
(Q3 2018: € 153�3 million)� With depreciation and amortization expense coming to € 83�5 million, EBITDA for the first nine months of 2019 stood at € 237�6 million (9M 2018: € 223�0 million)�
Financial result improved from € -11�9 million to € -11�7 million despite the strain of € 2�0 million arising from the initial application of IFRS 16� At 28�3%, the tax rate remained at a low level despite a small increase (9M 2018: 26�8%)� Accordingly, earnings after tax climbed slightly to € 102�1 million (9M 2018: € 103�5 million)� Earnings per share came to € 1�42 (9M 2018: € 1�44)�
siGnifiCant eventsIn the first nine months of 2019, there were no events materially impacting the Dürr Group’s results of ope-rations, financial condition and net assets�
Financial position
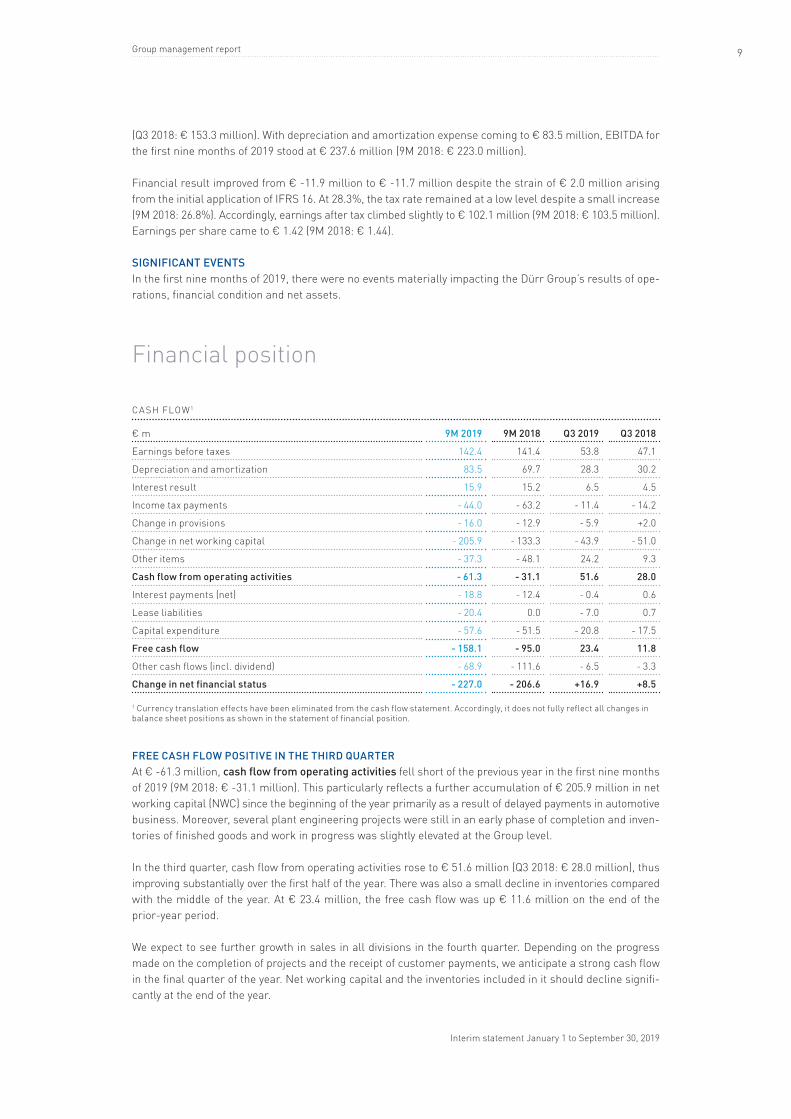
CA SH FLOW1
€ m 9M 2019 9M 2018 Q3 2019 Q3 2018
Earnings before taxes 142�4 141�4 53�8 47�1
Depreciation and amortization 83�5 69�7 28�3 30�2
Interest result 15�9 15�2 6�5 4�5
Income tax payments - 44�0 - 63�2 - 11�4 - 14�2
Change in provisions - 16�0 - 12�9 - 5�9 +2�0
Change in net working capital - 205�9 - 133�3 - 43�9 - 51�0
Other items - 37�3 - 48�1 24�2 9�3
Cash flow from operating activities - 61.3 - 31.1 51.6 28.0
Interest payments (net) - 18�8 - 12�4 - 0�4 0�6
Lease liabilities - 20�4 0�0 - 7�0 0�7
Capital expenditure - 57�6 - 51�5 - 20�8 - 17�5
free cash flow - 158.1 - 95.0 23.4 11.8
Other cash flows (incl� dividend) - 68�9 - 111�6 - 6�5 - 3�3
Change in net financial status - 227.0 - 206.6 +16.9 +8.5
1 Currency translation effects have been eliminated from the cash flow statement� Accordingly, it does not fully reflect all changes in balance sheet positions as shown in the statement of financial position�
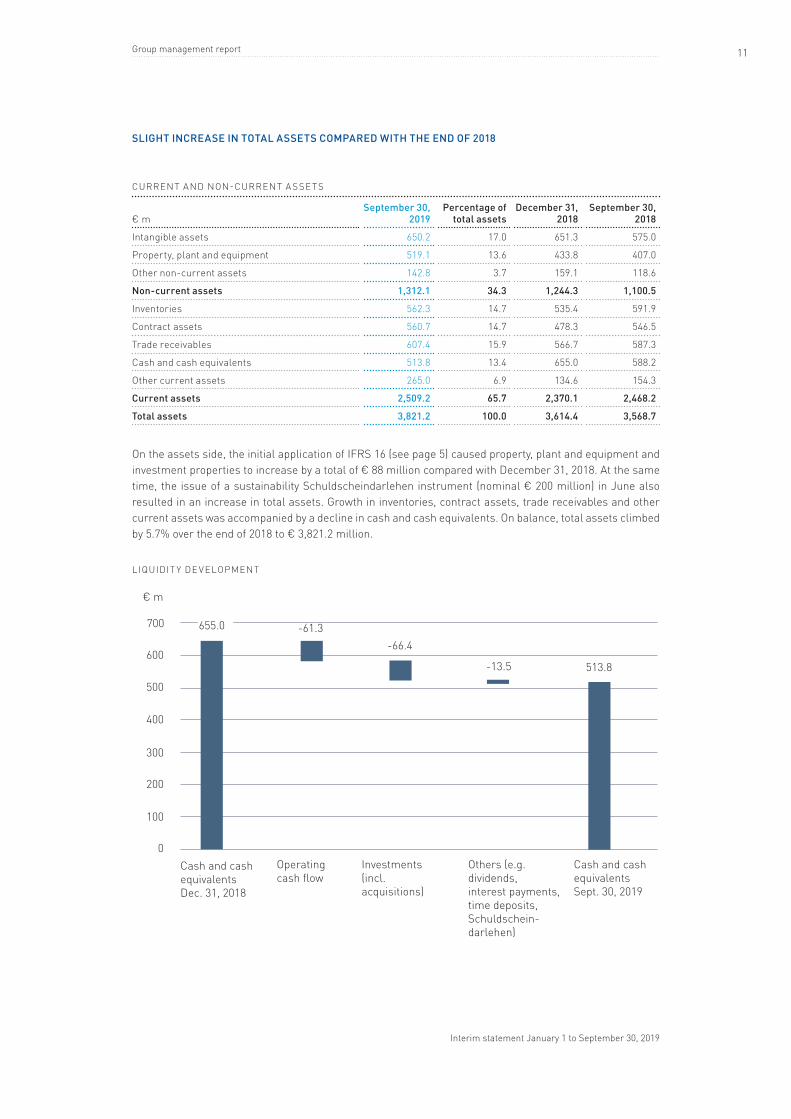
free Cash flOw pOsitive in the thirD QuarterAt € -61�3 million, cash flow from operating activities fell short of the previous year in the first nine months of 2019 (9M 2018: € -31�1 million)� This particularly reflects a further accumulation of € 205�9 million in net working capital (NWC) since the beginning of the year primarily as a result of delayed payments in automotive business� Moreover, several plant engineering projects were still in an early phase of completion and inven-tories of finished goods and work in progress was slightly elevated at the Group level�
In the third quarter, cash flow from operating activities rose to € 51�6 million (Q3 2018: € 28�0 million), thus improving substantially over the first half of the year� There was also a small decline in inventories compared with the middle of the year� At € 23�4 million, the free cash flow was up € 11�6 million on the end of the prior-year period�
We expect to see further growth in sales in all divisions in the fourth quarter� Depending on the progress made on the completion of projects and the receipt of customer payments, we anticipate a strong cash flow in the final quarter of the year� Net working capital and the inventories included in it should decline signifi-cantly at the end of the year�
Group management report
Interim statement January 1 to September 30, 2019
10� � � � � � � � � � � � � � � � � � � � � � � � � � � � � � � � � � � � � � � � � � � � � � � � � � � � � � � � � � � � � � � � � � � � � � � � � � � � � � � � � � � � � � � � � � � � � � � � � � � � � � � � � � � � � � � � � � � � � � � � � � � � � � � � � � � � � � � � � � � � � � � � � � � � � � � � � � � � � � � � � � � � � � � � � � � � � � � � � � � � � � � � � � � � � � � � � � � � � � � � � � � � � � � � � � � � � � � � � � � � � � � � � � � �
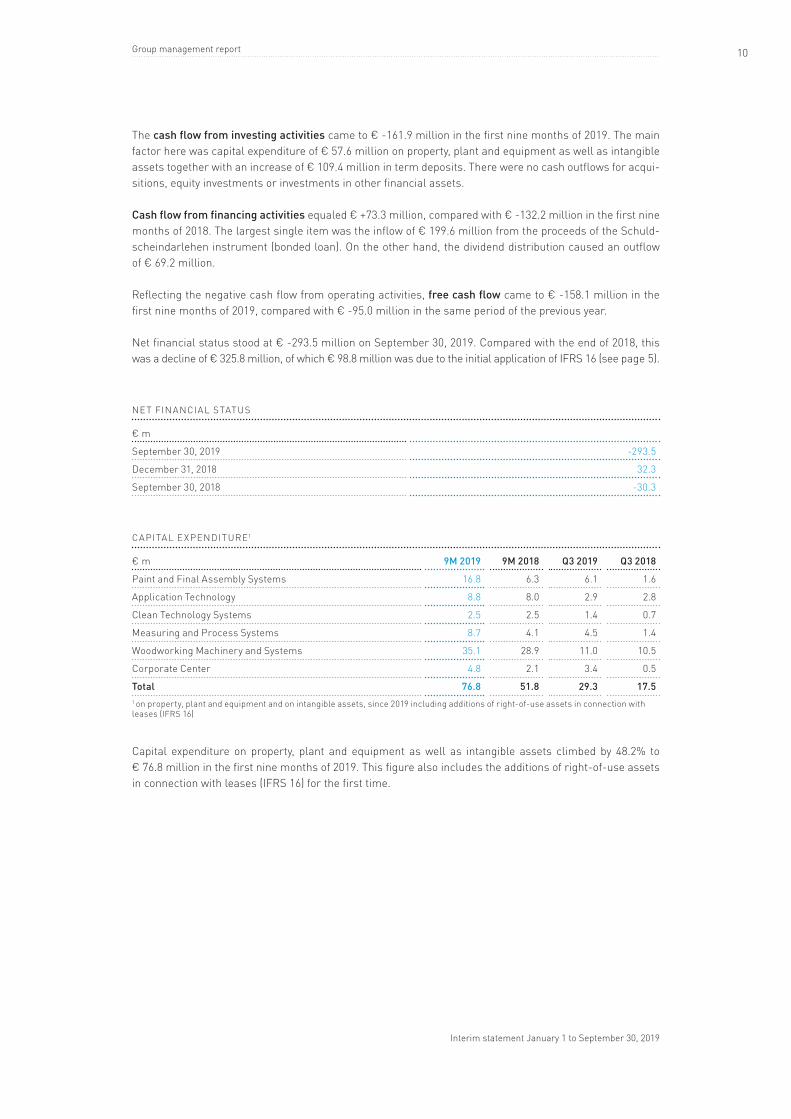
The cash flow from investing activities came to € -161�9 million in the first nine months of 2019� The main factor here was capital expenditure of € 57�6 million on property, plant and equipment as well as intangible assets together with an increase of € 109�4 million in term deposits� There were no cash outflows for acqui-sitions, equity investments or investments in other financial assets�
Cash flow from financing activities equaled € +73�3 million, compared with € -132�2 million in the first nine months of 2018� The largest single item was the inflow of € 199�6 million from the proceeds of the Schuld-scheindarlehen instrument (bonded loan)� On the other hand, the dividend distribution caused an outflow of € 69�2 million�
Reflecting the negative cash flow from operating activities, free cash flow came to € -158�1 million in the first nine months of 2019, compared with € -95�0 million in the same period of the previous year�
Net financial status stood at € -293�5 million on September 30, 2019� Compared with the end of 2018, this was a decline of € 325�8 million, of which € 98�8 million was due to the initial application of IFRS 16 (see page 5)�
NE T FINANCIAL STATUS
€ m
September 30, 2019 -293�5
December 31, 2018 32�3
September 30, 2018 -30�3
CAPITAL E XPENDITURE1
€ m 9M 2019 9M 2018 Q3 2019 Q3 2018
Paint and Final Assembly Systems 16�8 6�3 6�1 1�6
Application Technology 8�8 8�0 2�9 2�8
Clean Technology Systems 2�5 2�5 1�4 0�7
Measuring and Process Systems 8�7 4�1 4�5 1�4
Woodworking Machinery and Systems 35�1 28�9 11�0 10�5
Corporate Center 4�8 2�1 3�4 0�5
total 76.8 51.8 29.3 17.51 on property, plant and equipment and on intangible assets, since 2019 including additions of right-of-use assets in connection with leases (IFRS 16)
Capital expenditure on property, plant and equipment as well as intangible assets climbed by 48�2% to € 76�8 million in the first nine months of 2019� This figure also includes the additions of right-of-use assets in connection with leases (IFRS 16) for the first time�
Group management report
Interim statement January 1 to September 30, 2019
11� � � � � � � � � � � � � � � � � � � � � � � � � � � � � � � � � � � � � � � � � � � � � � � � � � � � � � � � � � � � � � � � � � � � � � � � � � � � � � � � � � � � � � � � � � � � � � � � � � � � � � � � � � � � � � � � � � � � � � � � � � � � � � � � � � � � � � � � � � � � � � � � � � � � � � � � � � � � � � � � � � � � � � � � � � � � � � � � � � � � � � � � � � � � � � � � � � � � � � � � � � � � � � � � � � � � � � � � � � � � � � � � � � � �
sliGht inCrease in tOtal assets COMpareD with the enD Of 2018
CURRENT AND NON-CURRENT A SSE TS
€ mseptember 30,
2019 percentage of
total assetsDecember 31,
2018september 30,
2018
Intangible assets 650�2 17�0 651�3 575�0
Property, plant and equipment 519�1 13�6 433�8 407�0
Other non-current assets 142�8 3�7 159�1 118�6
non-current assets 1,312.1 34.3 1,244.3 1,100.5
Inventories 562�3 14�7 535�4 591�9
Contract assets 560�7 14�7 478�3 546�5
Trade receivables 607�4 15�9 566�7 587�3
Cash and cash equivalents 513�8 13�4 655�0 588�2
Other current assets 265�0 6�9 134�6 154�3
Current assets 2,509.2 65.7 2,370.1 2,468.2
total assets 3,821.2 100.0 3,614.4 3,568.7
On the assets side, the initial application of IFRS 16 (see page 5) caused property, plant and equipment and investment properties to increase by a total of € 88 million compared with December 31, 2018� At the same time, the issue of a sustainability Schuldscheindarlehen instrument (nominal € 200 million) in June also resulted in an increase in total assets� Growth in inventories, contract assets, trade receivables and other current assets was accompanied by a decline in cash and cash equivalents� On balance, total assets climbed by 5�7% over the end of 2018 to € 3,821�2 million�
LIQUIDIT Y DE vELOPMENT
Group management report
700
300
200
100
0
€ m
Cash and cash equivalents Dec� 31, 2018
Operating cash flow
Investments (incl� acquisitions)
Others (e�g� dividends, interest payments, time deposits, Schuldschein- darlehen)
Cash and cash equivalents Sept� 30, 2019
600
400
500
-61�3-66�4
513�8-13�5
655�0
Interim statement January 1 to September 30, 2019
12� � � � � � � � � � � � � � � � � � � � � � � � � � � � � � � � � � � � � � � � � � � � � � � � � � � � � � � � � � � � � � � � � � � � � � � � � � � � � � � � � � � � � � � � � � � � � � � � � � � � � � � � � � � � � � � � � � � � � � � � � � � � � � � � � � � � � � � � � � � � � � � � � � � � � � � � � � � � � � � � � � � � � � � � � � � � � � � � � � � � � � � � � � � � � � � � � � � � � � � � � � � � � � � � � � � � � � � � � � � � � � � � � � � �
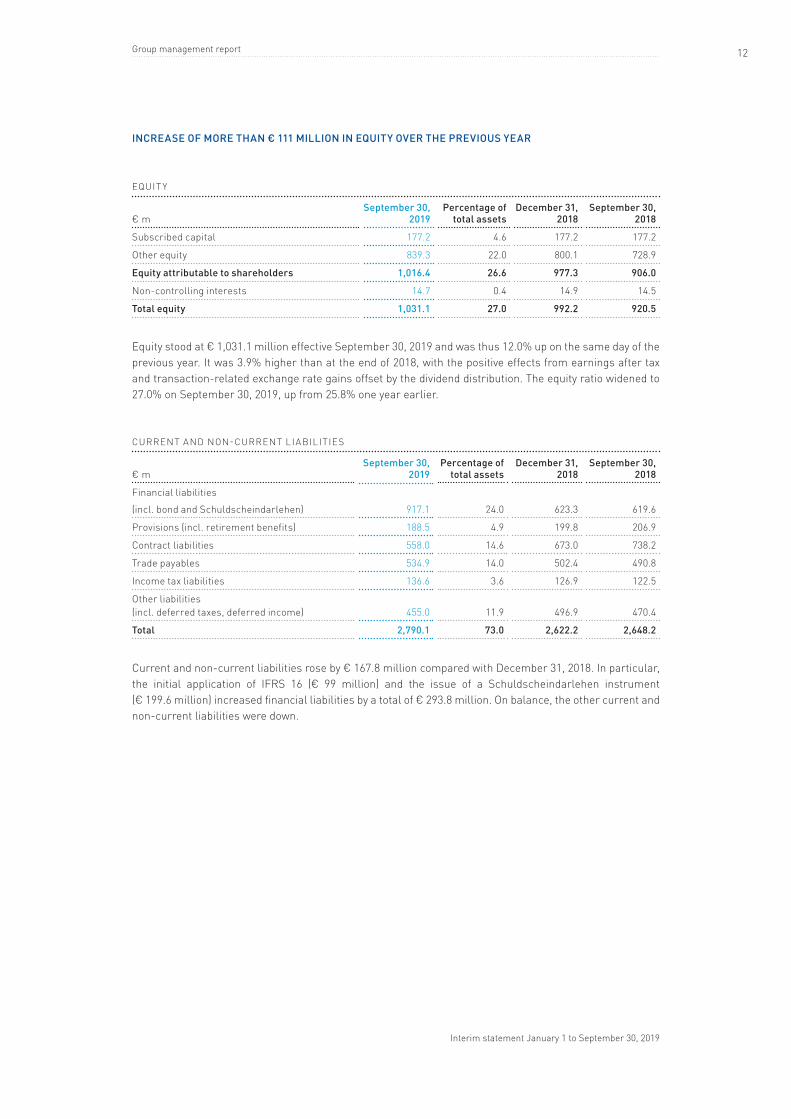
inCrease Of MOre than € 111 MilliOn in eQuity Over the previOus year
EQUIT Y
€ mseptember 30,
2019 percentage of
total assetsDecember 31,
2018september 30,
2018
Subscribed capital 177�2 4�6 177�2 177�2
Other equity 839�3 22�0 800�1 728�9
equity attributable to shareholders 1,016.4 26.6 977.3 906.0
Non-controlling interests 14�7 0�4 14�9 14�5
total equity 1,031.1 27.0 992.2 920.5
Equity stood at € 1,031�1 million effective September 30, 2019 and was thus 12�0% up on the same day of the previous year� It was 3�9% higher than at the end of 2018, with the positive effects from earnings after tax and transaction-related exchange rate gains offset by the dividend distribution� The equity ratio widened to 27�0% on September 30, 2019, up from 25�8% one year earlier�
CURRENT AND NON-CURRENT LIABILITIES
€ mseptember 30,
2019 percentage of
total assetsDecember 31,
2018september 30,
2018
Financial liabilities (incl� bond and Schuldscheindarlehen) 917�1 24�0 623�3 619�6
Provisions (incl� retirement benefits) 188�5 4�9 199�8 206�9
Contract liabilities 558�0 14�6 673�0 738�2
Trade payables 534�9 14�0 502�4 490�8
Income tax liabilities 136�6 3�6 126�9 122�5
Other liabilities (incl� deferred taxes, deferred income) 455�0 11�9 496�9 470�4
total 2,790.1 73.0 2,622.2 2,648.2
Current and non-current liabilities rose by € 167�8 million compared with December 31, 2018� In particular, the initial application of IFRS 16 (€ 99 million) and the issue of a Schuldscheindarlehen instrument (€ 199�6 million) increased financial liabilities by a total of € 293�8 million� On balance, the other current and non-current liabilities were down�
Group management report
Interim statement January 1 to September 30, 2019
13� � � � � � � � � � � � � � � � � � � � � � � � � � � � � � � � � � � � � � � � � � � � � � � � � � � � � � � � � � � � � � � � � � � � � � � � � � � � � � � � � � � � � � � � � � � � � � � � � � � � � � � � � � � � � � � � � � � � � � � � � � � � � � � � � � � � � � � � � � � � � � � � � � � � � � � � � � � � � � � � � � � � � � � � � � � � � � � � � � � � � � � � � � � � � � � � � � � � � � � � � � � � � � � � � � � � � � � � � � � � � � � � � � � �
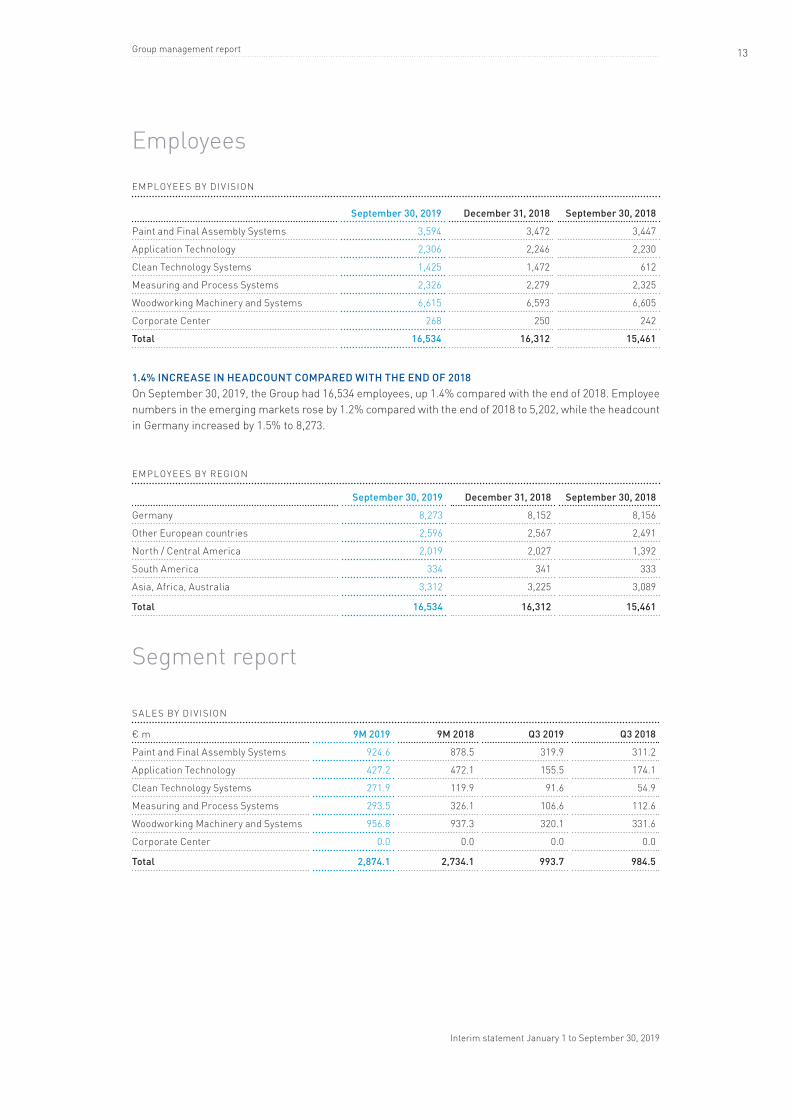
Employees
EMPLOYEES BY DIv ISION
september 30, 2019 December 31, 2018 september 30, 2018
Paint and Final Assembly Systems 3,594 3,472 3,447
Application Technology 2,306 2,246 2,230
Clean Technology Systems 1,425 1,472 612
Measuring and Process Systems 2,326 2,279 2,325
Woodworking Machinery and Systems 6,615 6,593 6,605
Corporate Center 268 250 242
total 16,534 16,312 15,461
1.4% inCrease in heaDCOunt COMpareD with the enD Of 2018 On September 30, 2019, the Group had 16,534 employees, up 1�4% compared with the end of 2018� Employee numbers in the emerging markets rose by 1�2% compared with the end of 2018 to 5,202, while the headcount in Germany increased by 1�5% to 8,273�
EMPLOYEES BY REGION
september 30, 2019 December 31, 2018 september 30, 2018
Germany 8,273 8,152 8,156
Other European countries 2,596 2,567 2,491
North / Central America 2,019 2,027 1,392
South America 334 341 333
Asia, Africa, Australia 3,312 3,225 3,089
total 16,534 16,312 15,461
Segment report
SALES BY DIv ISION
€ m 9M 2019 9M 2018 Q3 2019 Q3 2018
Paint and Final Assembly Systems 924�6 878�5 319�9 311�2
Application Technology 427�2 472�1 155�5 174�1
Clean Technology Systems 271�9 119�9 91�6 54�9
Measuring and Process Systems 293�5 326�1 106�6 112�6
Woodworking Machinery and Systems 956�8 937�3 320�1 331�6
Corporate Center 0�0 0�0 0�0 0�0
total 2,874.1 2,734.1 993.7 984.5
Group management report
Interim statement January 1 to September 30, 2019
14� � � � � � � � � � � � � � � � � � � � � � � � � � � � � � � � � � � � � � � � � � � � � � � � � � � � � � � � � � � � � � � � � � � � � � � � � � � � � � � � � � � � � � � � � � � � � � � � � � � � � � � � � � � � � � � � � � � � � � � � � � � � � � � � � � � � � � � � � � � � � � � � � � � � � � � � � � � � � � � � � � � � � � � � � � � � � � � � � � � � � � � � � � � � � � � � � � � � � � � � � � � � � � � � � � � � � � � � � � � � � � � � � � � �
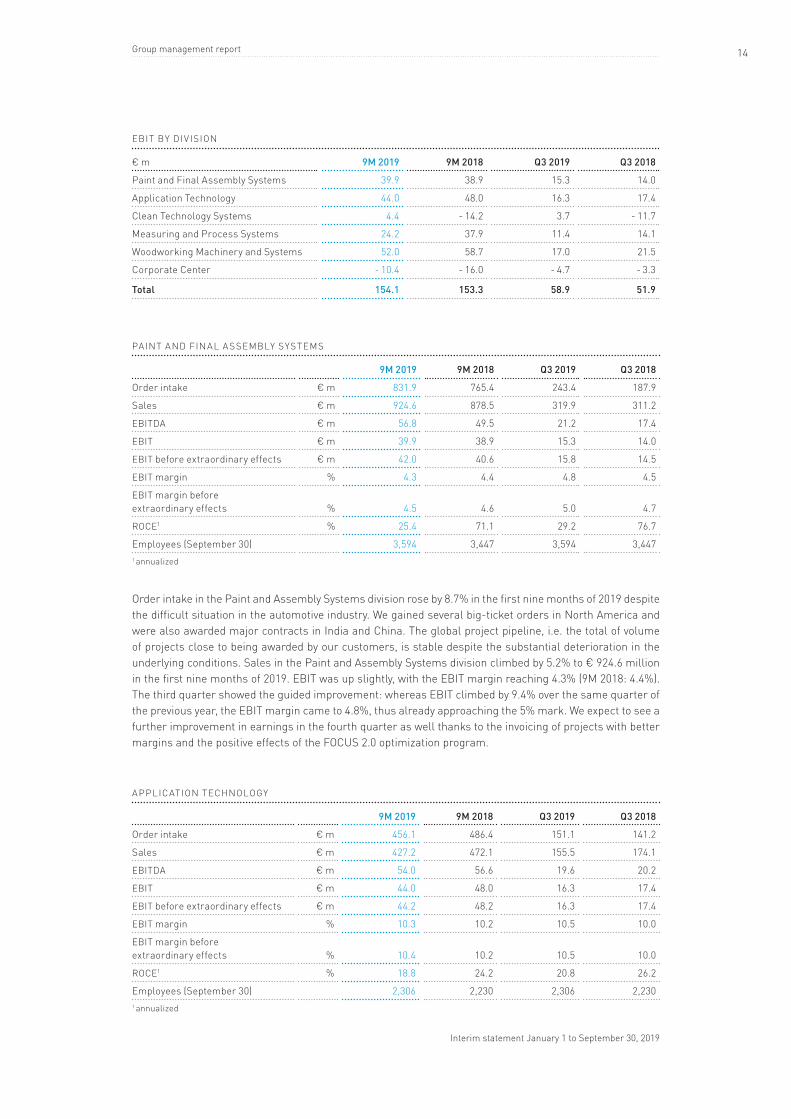
EBIT BY DIv ISION
€ m 9M 2019 9M 2018 Q3 2019 Q3 2018
Paint and Final Assembly Systems 39�9 38�9 15�3 14�0
Application Technology 44�0 48�0 16�3 17�4
Clean Technology Systems 4�4 - 14�2 3�7 - 11�7
Measuring and Process Systems 24�2 37�9 11�4 14�1
Woodworking Machinery and Systems 52�0 58�7 17�0 21�5
Corporate Center - 10�4 - 16�0 - 4�7 - 3�3
total 154.1 153.3 58.9 51.9
PAINT AND FINAL A SSEMBLY SYSTEMS
9M 2019 9M 2018 Q3 2019 Q3 2018
Order intake € m 831�9 765�4 243�4 187�9
Sales € m 924�6 878�5 319�9 311�2
EBITDA € m 56�8 49�5 21�2 17�4
EBIT € m 39�9 38�9 15�3 14�0
EBIT before extraordinary effects € m 42�0 40�6 15�8 14�5
EBIT margin % 4�3 4�4 4�8 4�5
EBIT margin before extraordinary effects % 4�5 4�6 5�0 4�7
ROCE1 % 25�4 71�1 29�2 76�7
Employees (September 30) 3,594 3,447 3,594 3,4471 annualized
Order intake in the Paint and Assembly Systems division rose by 8�7% in the first nine months of 2019 despite the difficult situation in the automotive industry� We gained several big-ticket orders in North America and were also awarded major contracts in India and China� The global project pipeline, i�e� the total of volume of projects close to being awarded by our customers, is stable despite the substantial deterioration in the underlying conditions� Sales in the Paint and Assembly Systems division climbed by 5�2% to € 924�6 million in the first nine months of 2019� EBIT was up slightly, with the EBIT margin reaching 4�3% (9M 2018: 4�4%)� The third quarter showed the guided improvement: whereas EBIT climbed by 9�4% over the same quarter of the previous year, the EBIT margin came to 4�8%, thus already approaching the 5% mark� We expect to see a further improvement in earnings in the fourth quarter as well thanks to the invoicing of projects with better margins and the positive effects of the FOCUS 2�0 optimization program�
APPLICATION TECHNOLOGY
9M 2019 9M 2018 Q3 2019 Q3 2018
Order intake € m 456�1 486�4 151�1 141�2
Sales € m 427�2 472�1 155�5 174�1
EBITDA € m 54�0 56�6 19�6 20�2
EBIT € m 44�0 48�0 16�3 17�4
EBIT before extraordinary effects € m 44�2 48�2 16�3 17�4
EBIT margin % 10�3 10�2 10�5 10�0
EBIT margin before extraordinary effects % 10�4 10�2 10�5 10�0
ROCE1 % 18�8 24�2 20�8 26�2
Employees (September 30) 2,306 2,230 2,306 2,2301 annualized
Group management report
Interim statement January 1 to September 30, 2019
15� � � � � � � � � � � � � � � � � � � � � � � � � � � � � � � � � � � � � � � � � � � � � � � � � � � � � � � � � � � � � � � � � � � � � � � � � � � � � � � � � � � � � � � � � � � � � � � � � � � � � � � � � � � � � � � � � � � � � � � � � � � � � � � � � � � � � � � � � � � � � � � � � � � � � � � � � � � � � � � � � � � � � � � � � � � � � � � � � � � � � � � � � � � � � � � � � � � � � � � � � � � � � � � � � � � � � � � � � � � � � � � � � � � �
Order intake and sales in the Application Technology division contracted in the first nine months of 2019 (by 6�2% and 9�5%, respectively)� Service business was also down, reflecting the low capacity utilization of many automotive factories, for which fewer replacement parts were required as a result� The book-to-bill ratio came to 1�1� In relative terms, EBIT did not decline as sharply as sales, while the EBIT margin widened slightly to 10�3% (9M 2018: 10�2%)� As with Paint and Final Assembly Systems, there are plenty of projects in the pipeline, justifying expectations of steady order intake over the next few quarters�
CLE AN TECHNOLOGY SYSTEMS
9M 2019 9M 2018 Q3 2019 Q3 2018
Order intake € m 334�1 152�8 126�0 36�3
Sales € m 271�9 119�9 91�6 54�9
EBITDA € m 14�1 - 1�4 7�0 - 0�3
EBIT € m 4�4 - 14�2 3�7 - 11�7
EBIT before extraordinary effects € m 11�9 - 0�3 6�6 2�0
EBIT margin % 1�6 - 11�9 4�1 - 21�3
EBIT margin before extraordinary effects % 4�4 - 0�2 7�3 3�6
ROCE1 % 3�5 - 33�0 9�0 - 81�4
Employees (September 30) 1,425 612 1,425 6121 annualized
The figures for Clean Technology Systems for the first nine months of 2019 and the year-over-year compa-rison were heavily influenced by the initial consolidation of Megtec/Universal in the fourth quarter of 2018� The division’s order intake almost doubled, increasing by 5�1% over the previous year’s high figure in like-for-like terms� The book-to-bill ratio came to a very good 1�2� Sales improved both as a result of the takeover of Megtec/Universal and on a like-for-like basis (up 15�2%)� In the third quarter, EBIT was by far the highest in the year to date� This growth was particularly underpinned by the performance of the Megtec/Universal group� Looking ahead over the next few quarters, we expect to see a continuation of the positive trend in earnings�
ME A SURING AND PROCESS SYSTEMS
9M 2019 9M 2018 Q3 2019 Q3 2018
Order intake € m 330�2 307�7 101�6 93�2
Sales € m 293�5 326�1 106�6 112�6
EBITDA € m 32�7 44�1 13�9 16�1
EBIT € m 24�2 37�9 11�4 14�1
EBIT before extraordinary effects € m 24�9 39�1 11�5 14�4
EBIT margin % 8�2 11�6 10�7 12�5
EBIT margin before extraordinary effects % 8�5 12�0 10�7 12�8
ROCE1 % 11�0 18�4 15�5 20�5
Employees (September 30) 2,326 2,325 2,326 2,3251 annualized
Order intake in the Measuring and Process Systems division rose by 7�3% in the first nine months of 2019� This was accompanied by a 10�0% decline in sales, which reflected the moderate order intake in tandem with high sales in the fourth quarter of 2018� Moreover, the division sustained a sizeable decline in its business in balancing systems for combustion engines (turbochargers and crankshafts)� This business, however, only accounts for 1% of the Dürr Group’s total sales� Measuring and Process System’s sales in the third quarter
Group management report
Interim statement January 1 to September 30, 2019
16� � � � � � � � � � � � � � � � � � � � � � � � � � � � � � � � � � � � � � � � � � � � � � � � � � � � � � � � � � � � � � � � � � � � � � � � � � � � � � � � � � � � � � � � � � � � � � � � � � � � � � � � � � � � � � � � � � � � � � � � � � � � � � � � � � � � � � � � � � � � � � � � � � � � � � � � � � � � � � � � � � � � � � � � � � � � � � � � � � � � � � � � � � � � � � � � � � � � � � � � � � � � � � � � � � � � � � � � � � � � � � � � � � � �
exceeded those of the first two quarters significantly� The book-to-bill ratio for the first nine months stands at 1�1� In addition to the decline in sales, heavy R&D expenditure on digitalization exerted a drag on EBIT� In the third quarter, EBIT improved thanks to the higher sales, with the EBIT margin exceeding the 10% mark�
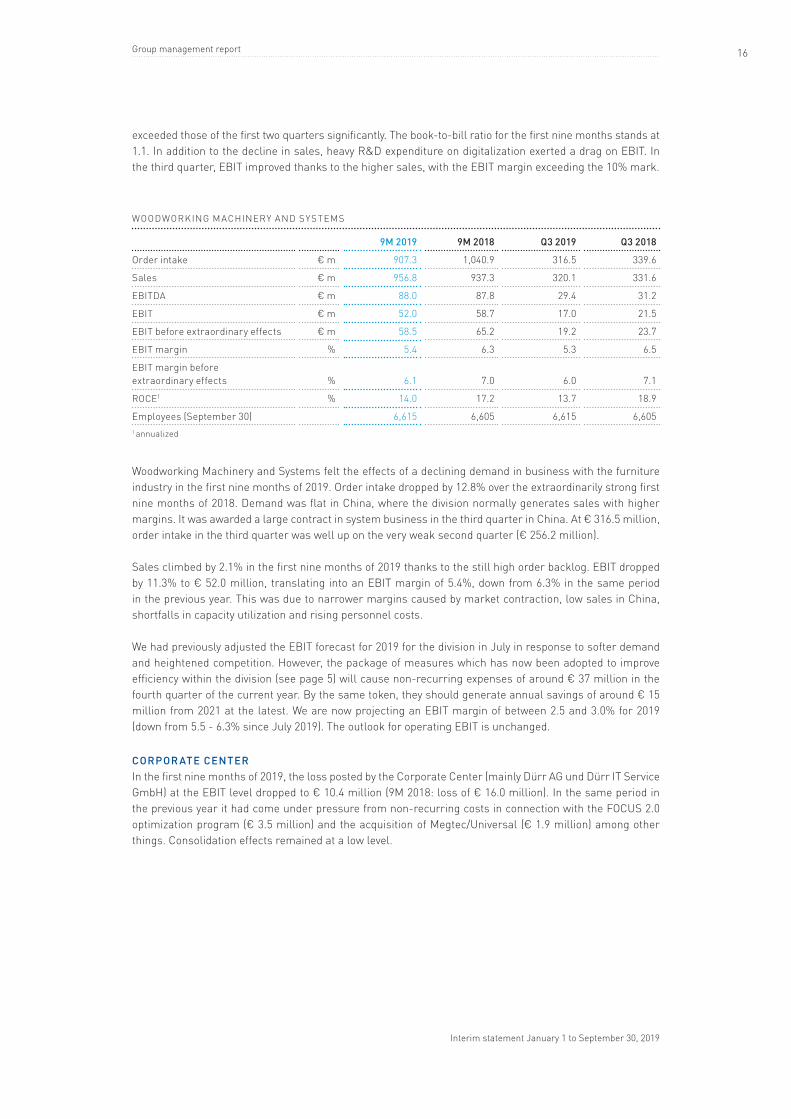
WOODWORKING MACHINERY AND SYSTEMS
9M 2019 9M 2018 Q3 2019 Q3 2018
Order intake € m 907�3 1,040�9 316�5 339�6
Sales € m 956�8 937�3 320�1 331�6
EBITDA € m 88�0 87�8 29�4 31�2
EBIT € m 52�0 58�7 17�0 21�5
EBIT before extraordinary effects € m 58�5 65�2 19�2 23�7
EBIT margin % 5�4 6�3 5�3 6�5
EBIT margin before extraordinary effects % 6�1 7�0 6�0 7�1
ROCE1 % 14�0 17�2 13�7 18�9
Employees (September 30) 6,615 6,605 6,615 6,6051 annualized
Woodworking Machinery and Systems felt the effects of a declining demand in business with the furniture industry in the first nine months of 2019� Order intake dropped by 12�8% over the extraordinarily strong first nine months of 2018� Demand was flat in China, where the division normally generates sales with higher margins� It was awarded a large contract in system business in the third quarter in China� At € 316�5 million, order intake in the third quarter was well up on the very weak second quarter (€ 256�2 million)�
Sales climbed by 2�1% in the first nine months of 2019 thanks to the still high order backlog� EBIT dropped by 11�3% to € 52�0 million, translating into an EBIT margin of 5�4%, down from 6�3% in the same period in the previous year� This was due to narrower margins caused by market contraction, low sales in China, shortfalls in capacity utilization and rising personnel costs�
We had previously adjusted the EBIT forecast for 2019 for the division in July in response to softer demand and heightened competition� However, the package of measures which has now been adopted to improve efficiency within the division (see page 5) will cause non-recurring expenses of around € 37 million in the fourth quarter of the current year� By the same token, they should generate annual savings of around € 15 million from 2021 at the latest� We are now projecting an EBIT margin of between 2�5 and 3�0% for 2019 (down from 5�5 - 6�3% since July 2019)� The outlook for operating EBIT is unchanged� COrpOr ate Center In the first nine months of 2019, the loss posted by the Corporate Center (mainly Dürr AG und Dürr IT Service GmbH) at the EBIT level dropped to € 10�4 million (9M 2018: loss of € 16�0 million)� In the same period in the previous year it had come under pressure from non-recurring costs in connection with the FOCUS 2�0 optimization program (€ 3�5 million) and the acquisition of Megtec/Universal (€ 1�9 million) among other things� Consolidation effects remained at a low level�
Group management report
Interim statement January 1 to September 30, 2019
17� � � � � � � � � � � � � � � � � � � � � � � � � � � � � � � � � � � � � � � � � � � � � � � � � � � � � � � � � � � � � � � � � � � � � � � � � � � � � � � � � � � � � � � � � � � � � � � � � � � � � � � � � � � � � � � � � � � � � � � � � � � � � � � � � � � � � � � � � � � � � � � � � � � � � � � � � � � � � � � � � � � � � � � � � � � � � � � � � � � � � � � � � � � � � � � � � � � � � � � � � � � � � � � � � � � � � � � � � � � � � � � � � � � �
Personnel changesThere were no changes in the composition of Dürr AG’s Board of Management or the Supervisory Board during the period under review� In March 2019, the Supervisory Board renewed Dr� Jochen Weyrauch’s con-tract for a further five years until December 31, 2024� A member of Dürr AG’s Board of Management since the beginning of 2017, Dr� Weyrauch is responsible for the Paint and Final Assembly Systems, Application Technology and Clean Technology Systems divisions as well as corporate development and information technology� At his own request, Chief Financial Officer Carlo Crosetto will not be renewing his contract when it expires at the end of February 2020� He notified the Supervisory Board of his decision on July 30, 2019� The search for a successor has been initiated�
OutlookOper atinG envirOnMentThe economic outlook has deteriorated considerably since the beginning of the year� As things currently stand, the global economy is expected to grow by 3�1% in 2019 and hence more slowly than in the previous year (3�8%)� Economists expect a similar growth rate for 2020� In Europe, gross domestic product is expected to increase by only 1% in the current year, while zero growth is projected for Germany� China should report growth of around 6%�
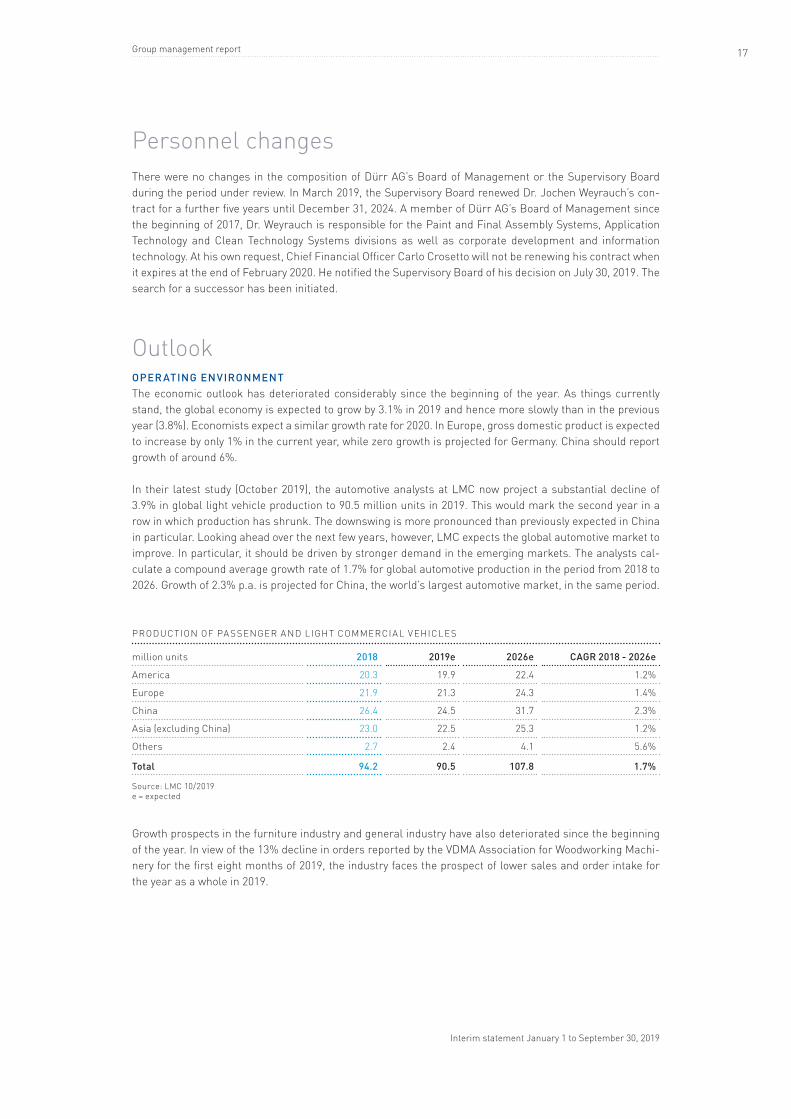
In their latest study (October 2019), the automotive analysts at LMC now project a substantial decline of 3�9% in global light vehicle production to 90�5 million units in 2019� This would mark the second year in a row in which production has shrunk� The downswing is more pronounced than previously expected in China in particular� Looking ahead over the next few years, however, LMC expects the global automotive market to improve� In particular, it should be driven by stronger demand in the emerging markets� The analysts cal-culate a compound average growth rate of 1�7% for global automotive production in the period from 2018 to 2026� Growth of 2�3% p�a� is projected for China, the world’s largest automotive market, in the same period�
PRODUCTION OF PA SSENGER AND LIGHT COMMERCIAL vEHICLES
million units 2018 2019e 2026e CaGr 2018 - 2026e
America 20�3 19�9 22�4 1�2%
Europe 21�9 21�3 24�3 1�4%
China 26�4 24�5 31�7 2�3%
Asia (excluding China) 23�0 22�5 25�3 1�2%
Others 2�7 2�4 4�1 5�6%
total 94.2 90.5 107.8 1.7%
Source: LMC 10/2019e = expected
Growth prospects in the furniture industry and general industry have also deteriorated since the beginning of the year� In view of the 13% decline in orders reported by the vDMA Association for Woodworking Machi-nery for the first eight months of 2019, the industry faces the prospect of lower sales and order intake for the year as a whole in 2019�
Group management report
Interim statement January 1 to September 30, 2019
18� � � � � � � � � � � � � � � � � � � � � � � � � � � � � � � � � � � � � � � � � � � � � � � � � � � � � � � � � � � � � � � � � � � � � � � � � � � � � � � � � � � � � � � � � � � � � � � � � � � � � � � � � � � � � � � � � � � � � � � � � � � � � � � � � � � � � � � � � � � � � � � � � � � � � � � � � � � � � � � � � � � � � � � � � � � � � � � � � � � � � � � � � � � � � � � � � � � � � � � � � � � � � � � � � � � � � � � � � � � � � � � � � � � �
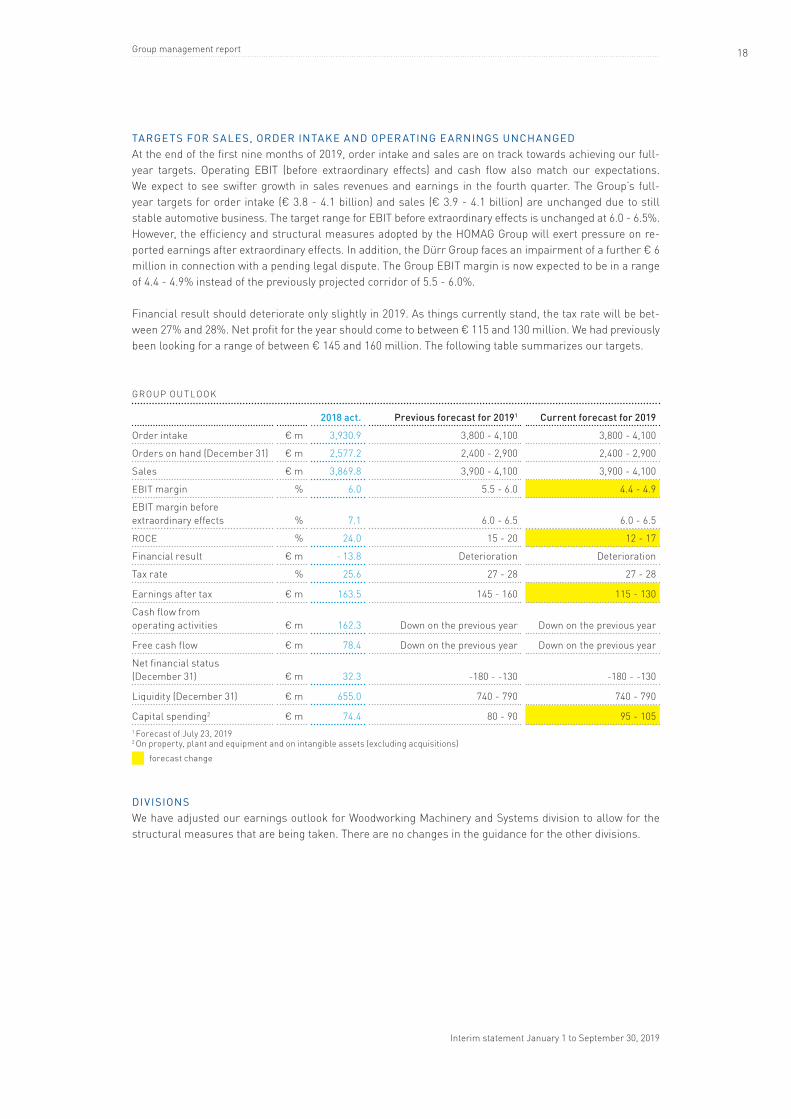
targetS fOr SaleS, Order intake and Oper ating e arningS unchanged At the end of the first nine months of 2019, order intake and sales are on track towards achieving our full- year targets� Operating EBIT (before extraordinary effects) and cash flow also match our expectations� We expect to see swifter growth in sales revenues and earnings in the fourth quarter� The Group’s full- year targets for order intake (€ 3�8 - 4�1 billion) and sales (€ 3�9 - 4�1 billion) are unchanged due to still stable automotive business� The target range for EBIT before extraordinary effects is unchanged at 6�0 - 6�5%� However, the efficiency and structural measures adopted by the HOMAG Group will exert pressure on re-ported earnings after extraordinary effects� In addition, the Dürr Group faces an impairment of a further € 6 million in connection with a pending legal dispute� The Group EBIT margin is now expected to be in a range of 4�4 - 4�9% instead of the previously projected corridor of 5�5 - 6�0%�
Financial result should deteriorate only slightly in 2019� As things currently stand, the tax rate will be bet-ween 27% and 28%� Net profit for the year should come to between € 115 and 130 million� We had previously been looking for a range of between € 145 and 160 million� The following table summarizes our targets�
GROUP OUTLOOK
2018 act. previous forecast for 20191 Current forecast for 2019
Order intake € m 3,930�9 3,800 - 4,100 3,800 - 4,100
Orders on hand (December 31) € m 2,577�2 2,400 - 2,900 2,400 - 2,900
Sales € m 3,869�8 3,900 - 4,100 3,900 - 4,100
EBIT margin % 6�0 5�5 - 6�0 4�4 - 4�9
EBIT margin before extraordinary effects % 7�1 6�0 - 6�5 6�0 - 6�5
ROCE % 24�0 15 - 20 12 - 17
Financial result € m - 13�8 Deterioration Deterioration
Tax rate % 25�6 27 - 28 27 - 28
Earnings after tax € m 163�5 145 - 160 115 - 130
Cash flow from operating activities € m 162�3 Down on the previous year Down on the previous year
Free cash flow € m 78�4 Down on the previous year Down on the previous year
Net financial status (December 31) € m 32�3 -180 - -130 -180 - -130
Liquidity (December 31) € m 655�0 740 - 790 740 - 790
Capital spending2 € m 74�4 80 - 90 95 - 1051 Forecast of July 23, 20192 On property, plant and equipment and on intangible assets (excluding acquisitions) forecast change
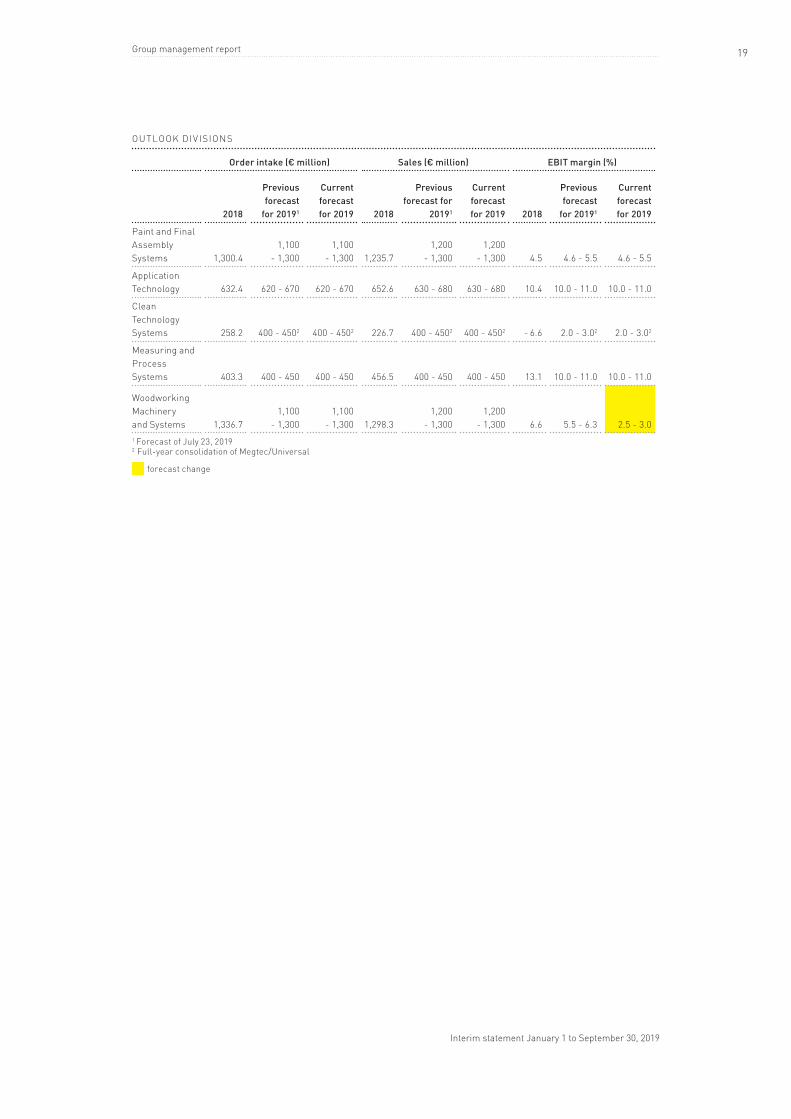
diviSiOnSWe have adjusted our earnings outlook for Woodworking Machinery and Systems division to allow for the structural measures that are being taken� There are no changes in the guidance for the other divisions�
Group management report
Interim statement January 1 to September 30, 2019
19� � � � � � � � � � � � � � � � � � � � � � � � � � � � � � � � � � � � � � � � � � � � � � � � � � � � � � � � � � � � � � � � � � � � � � � � � � � � � � � � � � � � � � � � � � � � � � � � � � � � � � � � � � � � � � � � � � � � � � � � � � � � � � � � � � � � � � � � � � � � � � � � � � � � � � � � � � � � � � � � � � � � � � � � � � � � � � � � � � � � � � � � � � � � � � � � � � � � � � � � � � � � � � � � � � � � � � � � � � � � � � � � � � � �
OUTLOOK DIv ISIONS
Order intake (€ million) sales (€ million) eBit margin (%)
2018
previous forecast
for 20191
Current forecast for 2019 2018
previous forecast for
20191
Current forecast for 2019 2018
previous forecast
for 20191
Current forecast for 2019
Paint and Final Assembly Systems 1,300�4
1,100 - 1,300
1,100 - 1,300 1,235�7
1,200 - 1,300
1,200 - 1,300 4�5 4�6 - 5�5 4�6 - 5�5
Application Technology 632�4 620 - 670 620 - 670 652�6 630 - 680 630 - 680 10�4 10�0 - 11�0 10�0 - 11�0
Clean Technology Systems 258�2 400 - 4502 400 - 4502 226�7 400 - 4502 400 - 4502 - 6�6 2�0 - 3�02 2�0 - 3�02
Measuring and Process Systems 403�3 400 - 450 400 - 450 456�5 400 - 450 400 - 450 13�1 10�0 - 11�0 10�0 - 11�0
Woodworking Machinery and Systems 1,336�7
1,100 - 1,300
1,100 - 1,300 1,298�3
1,200 - 1,300
1,200 - 1,300 6�6 5�5 - 6�3 2�5 - 3�0
1 Forecast of July 23, 20192 Full-year consolidation of Megtec/Universal
forecast change
Group management report
Interim statement January 1 to September 30, 2019
20� � � � � � � � � � � � � � � � � � � � � � � � � � � � � � � � � � � � � � � � � � � � � � � � � � � � � � � � � � � � � � � � � � � � � � � � � � � � � � � � � � � � � � � � � � � � � � � � � � � � � � � � � � � � � � � � � � � � � � � � � � � � � � � � � � � � � � � � � � � � � � � � � � � � � � � � � � � � � � � � � � � � � � � � � � � � � � � � � � � � � � � � � � � � � � � � � � � � � � � � � � � � � � � � � � � � � � � � � � � � � � � � � � � �
Events after the reporting period On November 6, 2019, we announced a package of measures aimed at optimizing the structures at the HOMAG Group and related extraordinary expenses of around € 37 million in 2019� Further information can be found on page 5 of this interim statement� No other exceptional or interim statement events occurred between the end of the reporting period and the date on which this interim statement was published�
Bietigheim-Bissingen, November 7, 2019
Dürr Aktiengesellschaft
The Board of Management
Ralf W� Dieter Carlo Crosetto CEO CFO
Pekka Paasivaara Dr� Jochen WeyrauchMember of the Board of Management Member of the Board of Management
Group management report
Interim statement January 1 to September 30, 2019
21� � � � � � � � � � � � � � � � � � � � � � � � � � � � � � � � � � � � � � � � � � � � � � � � � � � � � � � � � � � � � � � � � � � � � � � � � � � � � � � � � � � � � � � � � � � � � � � � � � � � � � � � � � � � � � � � � � � � � � � � � � � � � � � � � � � � � � � � � � � � � � � � � � � � � � � � � � � � � � � � � � � � � � � � � � � � � � � � � � � � � � � � � � � � � � � � � � � � � � � � � � � � � � � � � � � � � � � � � � � � � � � � � � � �Consolidated statement of income
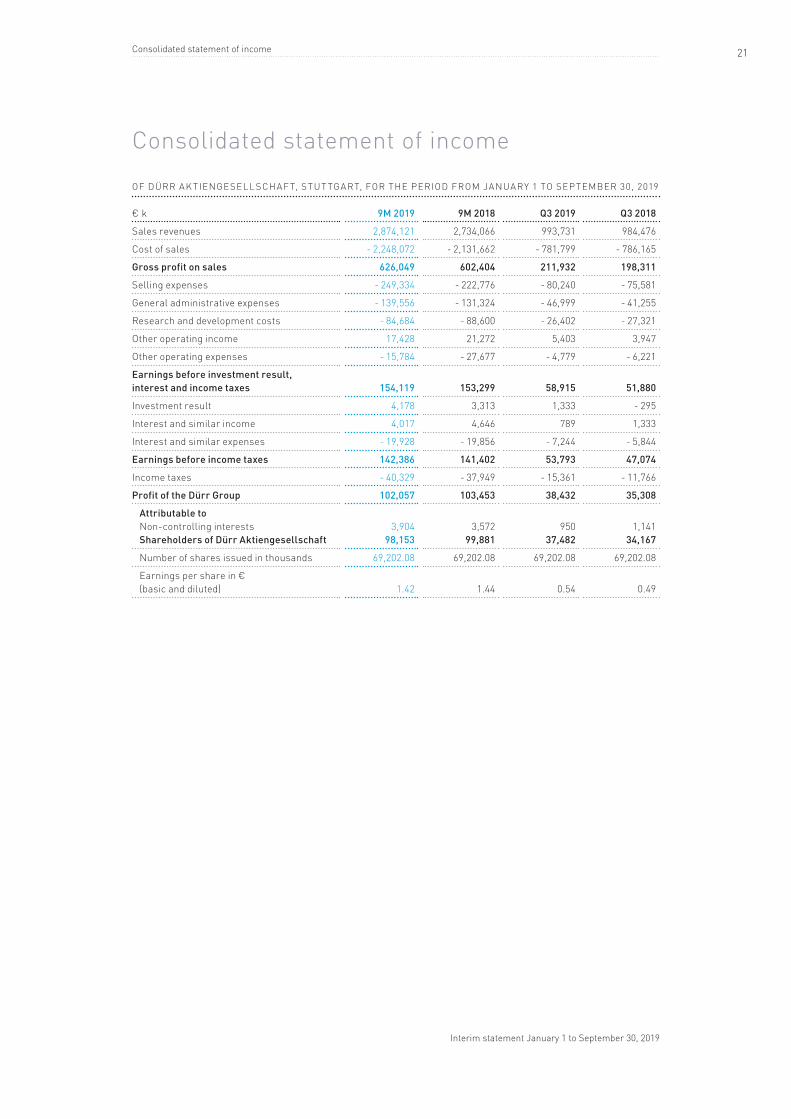
Consolidated statement of income
OF DüRR AK TIENGESELLSCHAF T, STUT TGART, FOR THE PERIOD FROM JANUARY 1 TO SEPTEMBER 30, 2019
€ k 9M 2019 9M 2018 Q3 2019 Q3 2018
Sales revenues 2,874,121 2,734,066 993,731 984,476
Cost of sales - 2,248,072 - 2,131,662 - 781,799 - 786,165
Gross profit on sales 626,049 602,404 211,932 198,311
Selling expenses - 249,334 - 222,776 - 80,240 - 75,581
General administrative expenses - 139,556 - 131,324 - 46,999 - 41,255
Research and development costs - 84,684 - 88,600 - 26,402 - 27,321
Other operating income 17,428 21,272 5,403 3,947
Other operating expenses - 15,784 - 27,677 - 4,779 - 6,221
earnings before investment result, interest and income taxes 154,119 153,299 58,915 51,880
Investment result 4,178 3,313 1,333 - 295
Interest and similar income 4,017 4,646 789 1,333
Interest and similar expenses - 19,928 - 19,856 - 7,244 - 5,844
earnings before income taxes 142,386 141,402 53,793 47,074
Income taxes - 40,329 - 37,949 - 15,361 - 11,766
profit of the Dürr Group 102,057 103,453 38,432 35,308
attributable to Non-controlling interests shareholders of Dürr aktiengesellschaft
3,904 98,153
3,572 99,881
950 37,482
1,141 34,167
Number of shares issued in thousands 69,202�08 69,202�08 69,202�08 69,202�08
Earnings per share in € (basic and diluted) 1�42 1�44 0�54 0�49
Interim statement January 1 to September 30, 2019
22� � � � � � � � � � � � � � � � � � � � � � � � � � � � � � � � � � � � � � � � � � � � � � � � � � � � � � � � � � � � � � � � � � � � � � � � � � � � � � � � � � � � � � � � � � � � � � � � � � � � � � � � � � � � � � � � � � � � � � � � � � � � � � � � � � � � � � � � � � � � � � � � � � � � � � � � � � � � � � � � � � � � � � � � � � � � � � � � � � � � � � � � � � � � � � � � � � � � � � � � � � � � � � � � � � � � � � � � � � � � � � � � � � � �Consolidated statement of comprehensive income
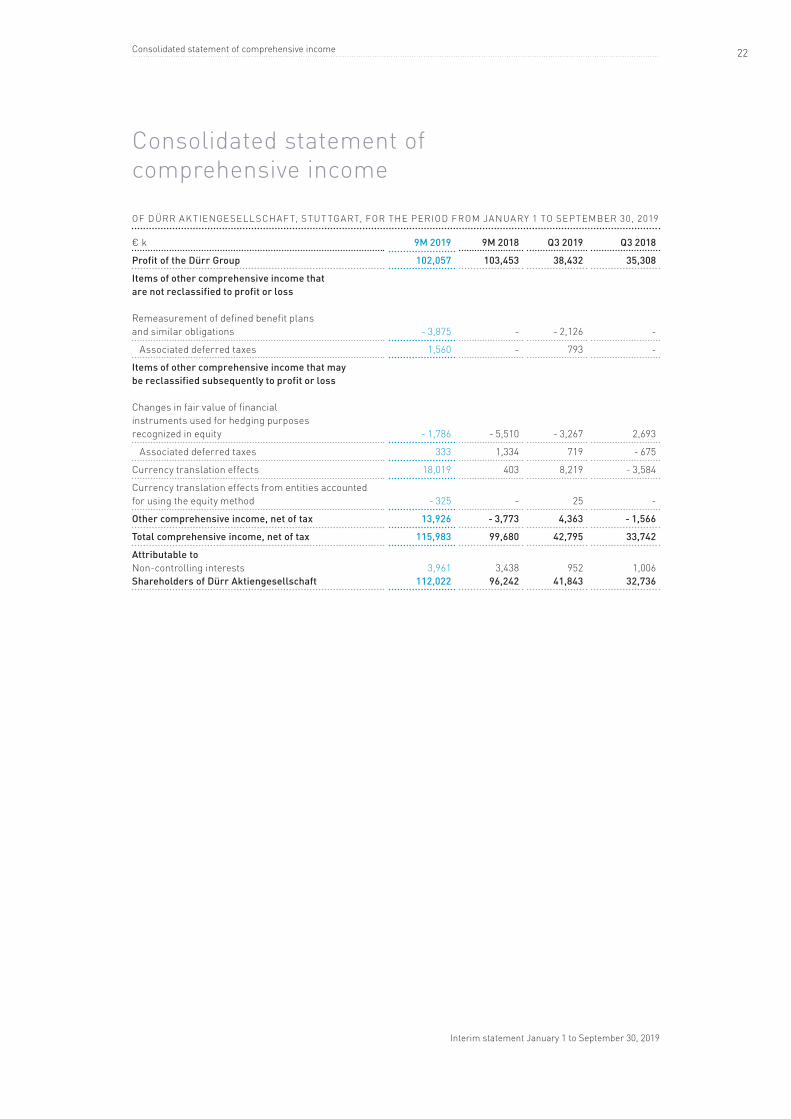
Consolidated statement of comprehensive income
OF DüRR AK TIENGESELLSCHAF T, STUT TGART, FOR THE PERIOD FROM JANUARY 1 TO SEPTEMBER 30, 2019
€ k 9M 2019 9M 2018 Q3 2019 Q3 2018
profit of the Dürr Group 102,057 103,453 38,432 35,308
items of other comprehensive income that are not reclassified to profit or loss Remeasurement of defined benefit plans and similar obligations - 3,875 - - 2,126 -
Associated deferred taxes 1,560 - 793 -
items of other comprehensive income that may be reclassified subsequently to profit or loss Changes in fair value of financial instruments used for hedging purposes recognized in equity - 1,786 - 5,510 - 3,267 2,693
Associated deferred taxes 333 1,334 719 - 675
Currency translation effects 18,019 403 8,219 - 3,584
Currency translation effects from entities accounted for using the equity method - 325 - 25 -
Other comprehensive income, net of tax 13,926 - 3,773 4,363 - 1,566
total comprehensive income, net of tax 115,983 99,680 42,795 33,742
attributable to Non-controlling interests shareholders of Dürr aktiengesellschaft
3,961 112,022
3,438 96,242
952 41,843
1,006 32,736
Interim statement January 1 to September 30, 2019
23� � � � � � � � � � � � � � � � � � � � � � � � � � � � � � � � � � � � � � � � � � � � � � � � � � � � � � � � � � � � � � � � � � � � � � � � � � � � � � � � � � � � � � � � � � � � � � � � � � � � � � � � � � � � � � � � � � � � � � � � � � � � � � � � � � � � � � � � � � � � � � � � � � � � � � � � � � � � � � � � � � � � � � � � � � � � � � � � � � � � � � � � � � � � � � � � � � � � � � � � � � � � � � � � � � � � � � � � � � � � � � � � � � � �Consolidated statement of financial position
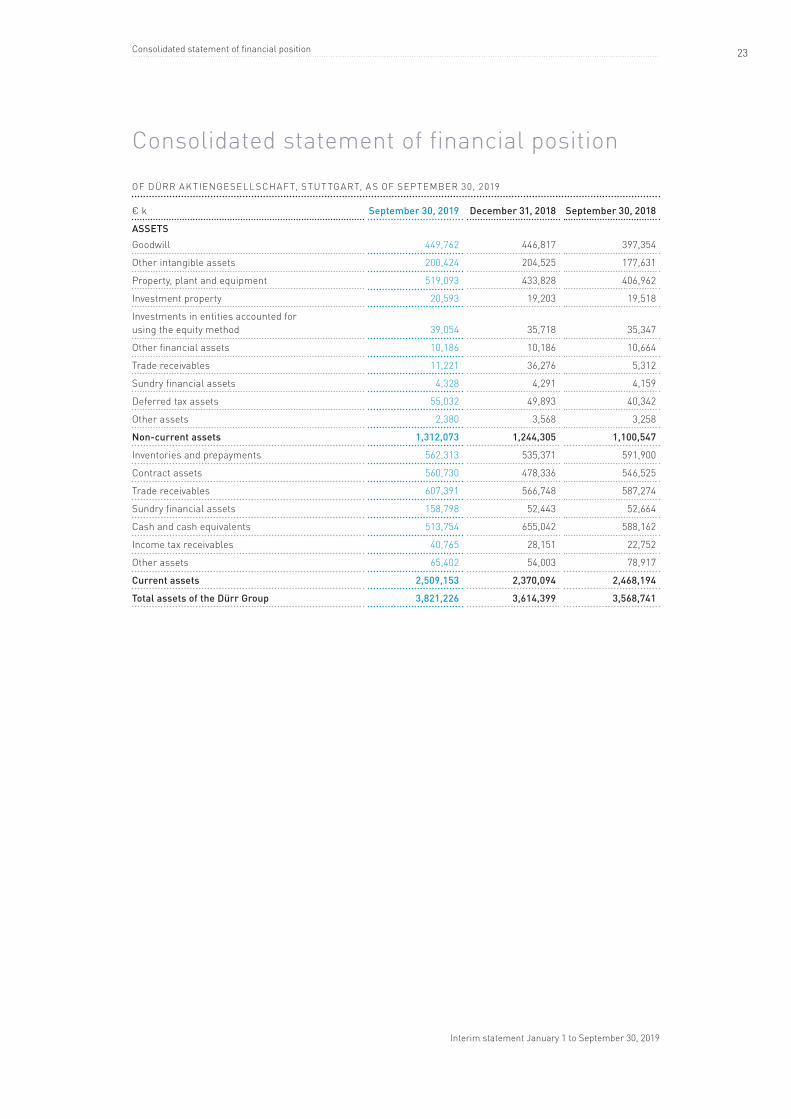
Consolidated statement of financial position
OF DüRR AK TIENGESELLSCHAF T, STUT TGART, A S OF SEPTEMBER 30, 2019
€ k september 30, 2019 December 31, 2018 september 30, 2018
assets Goodwill 449,762 446,817 397,354
Other intangible assets 200,424 204,525 177,631
Property, plant and equipment 519,093 433,828 406,962
Investment property 20,593 19,203 19,518
Investments in entities accounted for using the equity method 39,054 35,718 35,347
Other financial assets 10,186 10,186 10,664
Trade receivables 11,221 36,276 5,312
Sundry financial assets 4,328 4,291 4,159
Deferred tax assets 55,032 49,893 40,342
Other assets 2,380 3,568 3,258
non-current assets 1,312,073 1,244,305 1,100,547
Inventories and prepayments 562,313 535,371 591,900
Contract assets 560,730 478,336 546,525
Trade receivables 607,391 566,748 587,274
Sundry financial assets 158,798 52,443 52,664
Cash and cash equivalents 513,754 655,042 588,162
Income tax receivables 40,765 28,151 22,752
Other assets 65,402 54,003 78,917
Current assets 2,509,153 2,370,094 2,468,194
total assets of the Dürr Group 3,821,226 3,614,399 3,568,741
Interim statement January 1 to September 30, 2019
24� � � � � � � � � � � � � � � � � � � � � � � � � � � � � � � � � � � � � � � � � � � � � � � � � � � � � � � � � � � � � � � � � � � � � � � � � � � � � � � � � � � � � � � � � � � � � � � � � � � � � � � � � � � � � � � � � � � � � � � � � � � � � � � � � � � � � � � � � � � � � � � � � � � � � � � � � � � � � � � � � � � � � � � � � � � � � � � � � � � � � � � � � � � � � � � � � � � � � � � � � � � � � � � � � � � � � � � � � � � � � � � � � � � �Consolidated statement of financial position
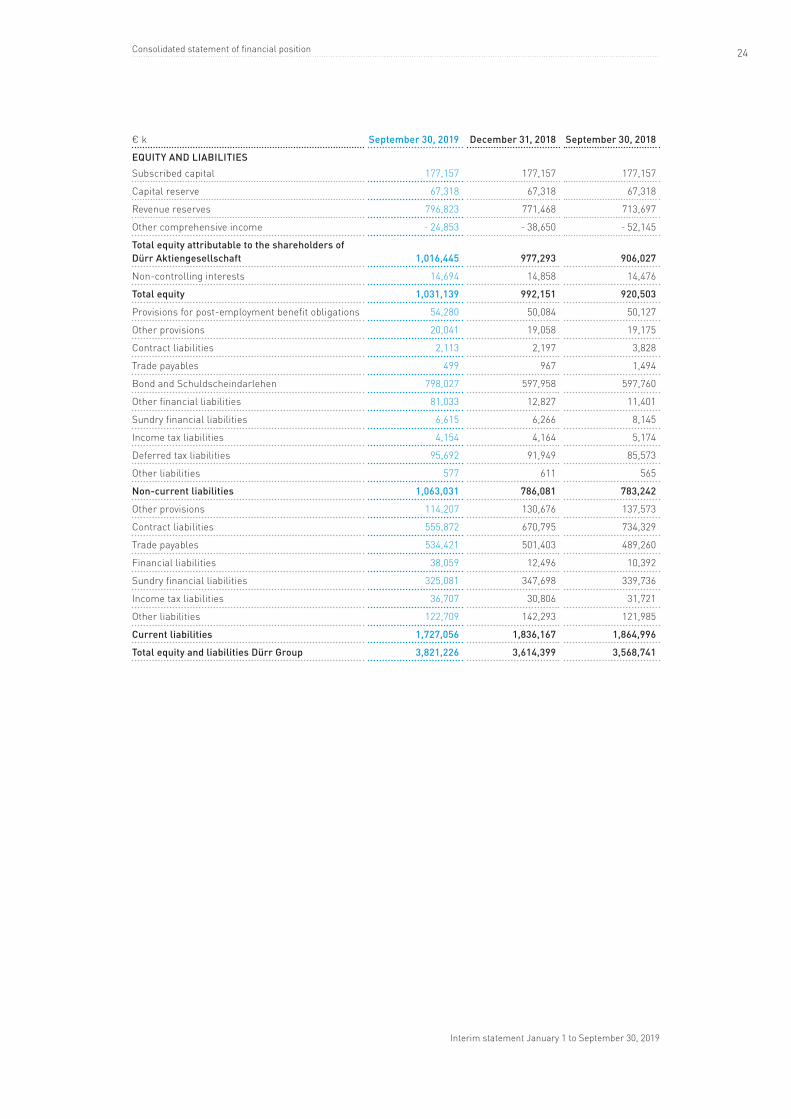
€ k september 30, 2019 December 31, 2018 september 30, 2018
eQuity anD liaBilities Subscribed capital 177,157 177,157 177,157
Capital reserve 67,318 67,318 67,318
Revenue reserves 796,823 771,468 713,697
Other comprehensive income - 24,853 - 38,650 - 52,145
total equity attributable to the shareholders of Dürr aktiengesellschaft 1,016,445 977,293 906,027
Non-controlling interests 14,694 14,858 14,476
total equity 1,031,139 992,151 920,503
Provisions for post-employment benefit obligations 54,280 50,084 50,127
Other provisions 20,041 19,058 19,175
Contract liabilities 2,113 2,197 3,828
Trade payables 499 967 1,494
Bond and Schuldscheindarlehen 798,027 597,958 597,760
Other financial liabilities 81,033 12,827 11,401
Sundry financial liabilities 6,615 6,266 8,145
Income tax liabilities 4,154 4,164 5,174
Deferred tax liabilities 95,692 91,949 85,573
Other liabilities 577 611 565
non-current liabilities 1,063,031 786,081 783,242
Other provisions 114,207 130,676 137,573
Contract liabilities 555,872 670,795 734,329
Trade payables 534,421 501,403 489,260
Financial liabilities 38,059 12,496 10,392
Sundry financial liabilities 325,081 347,698 339,736
Income tax liabilities 36,707 30,806 31,721
Other liabilities 122,709 142,293 121,985
Current liabilities 1,727,056 1,836,167 1,864,996
total equity and liabilities Dürr Group 3,821,226 3,614,399 3,568,741
Interim statement January 1 to September 30, 2019
25� � � � � � � � � � � � � � � � � � � � � � � � � � � � � � � � � � � � � � � � � � � � � � � � � � � � � � � � � � � � � � � � � � � � � � � � � � � � � � � � � � � � � � � � � � � � � � � � � � � � � � � � � � � � � � � � � � � � � � � � � � � � � � � � � � � � � � � � � � � � � � � � � � � � � � � � � � � � � � � � � � � � � � � � � � � � � � � � � � � � � � � � � � � � � � � � � � � � � � � � � � � � � � � � � � � � � � � � � � � � � � � � � � � �Consolidated statement of cash flows
Consolidated statement of cash flows
OF DüRR AK TIENGESELLSCHAF T, STUT TGART, FOR THE PERIOD FROM JANUARY 1 TO SEPTEMBER 30, 2019
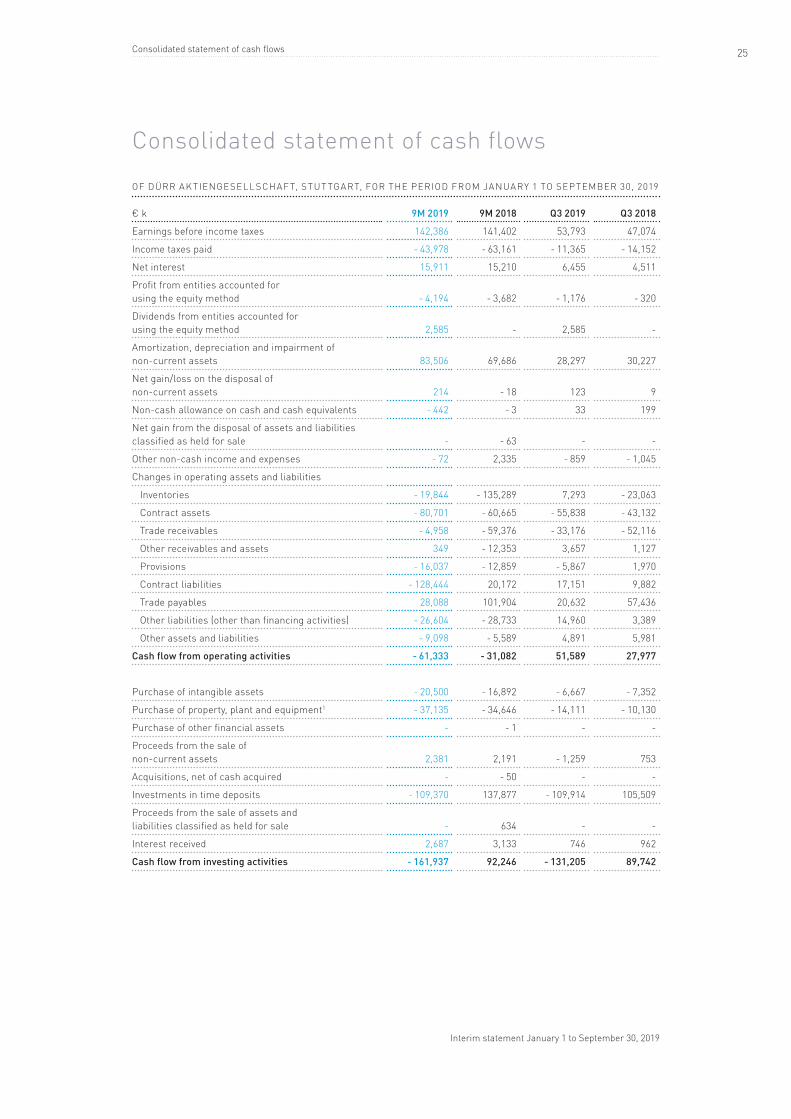
€ k 9M 2019 9M 2018 Q3 2019 Q3 2018
Earnings before income taxes 142,386 141,402 53,793 47,074
Income taxes paid - 43,978 - 63,161 - 11,365 - 14,152
Net interest 15,911 15,210 6,455 4,511
Profit from entities accounted for using the equity method - 4,194 - 3,682 - 1,176 - 320
Dividends from entities accounted for using the equity method 2,585 - 2,585 -
Amortization, depreciation and impairment of non-current assets 83,506 69,686 28,297 30,227
Net gain/loss on the disposal of non-current assets 214 - 18 123 9
Non-cash allowance on cash and cash equivalents - 442 - 3 33 199
Net gain from the disposal of assets and liabilities classified as held for sale - - 63 - -
Other non-cash income and expenses - 72 2,335 - 859 - 1,045
Changes in operating assets and liabilities
Inventories - 19,844 - 135,289 7,293 - 23,063
Contract assets - 80,701 - 60,665 - 55,838 - 43,132
Trade receivables - 4,958 - 59,376 - 33,176 - 52,116
Other receivables and assets 349 - 12,353 3,657 1,127
Provisions - 16,037 - 12,859 - 5,867 1,970
Contract liabilities - 128,444 20,172 17,151 9,882
Trade payables 28,088 101,904 20,632 57,436
Other liabilities (other than financing activities) - 26,604 - 28,733 14,960 3,389
Other assets and liabilities - 9,098 - 5,589 4,891 5,981
Cash flow from operating activities - 61,333 - 31,082 51,589 27,977
Purchase of intangible assets - 20,500 - 16,892 - 6,667 - 7,352
Purchase of property, plant and equipment1 - 37,135 - 34,646 - 14,111 - 10,130
Purchase of other financial assets - - 1 - -
Proceeds from the sale of non-current assets 2,381 2,191 - 1,259 753
Acquisitions, net of cash acquired - - 50 - -
Investments in time deposits - 109,370 137,877 - 109,914 105,509
Proceeds from the sale of assets and liabilities classified as held for sale - 634 - -
Interest received 2,687 3,133 746 962
Cash flow from investing activities - 161,937 92,246 - 131,205 89,742
Interim statement January 1 to September 30, 2019
26� � � � � � � � � � � � � � � � � � � � � � � � � � � � � � � � � � � � � � � � � � � � � � � � � � � � � � � � � � � � � � � � � � � � � � � � � � � � � � � � � � � � � � � � � � � � � � � � � � � � � � � � � � � � � � � � � � � � � � � � � � � � � � � � � � � � � � � � � � � � � � � � � � � � � � � � � � � � � � � � � � � � � � � � � � � � � � � � � � � � � � � � � � � � � � � � � � � � � � � � � � � � � � � � � � � � � � � � � � � � � � � � � � � �Consolidated statement of cash flows
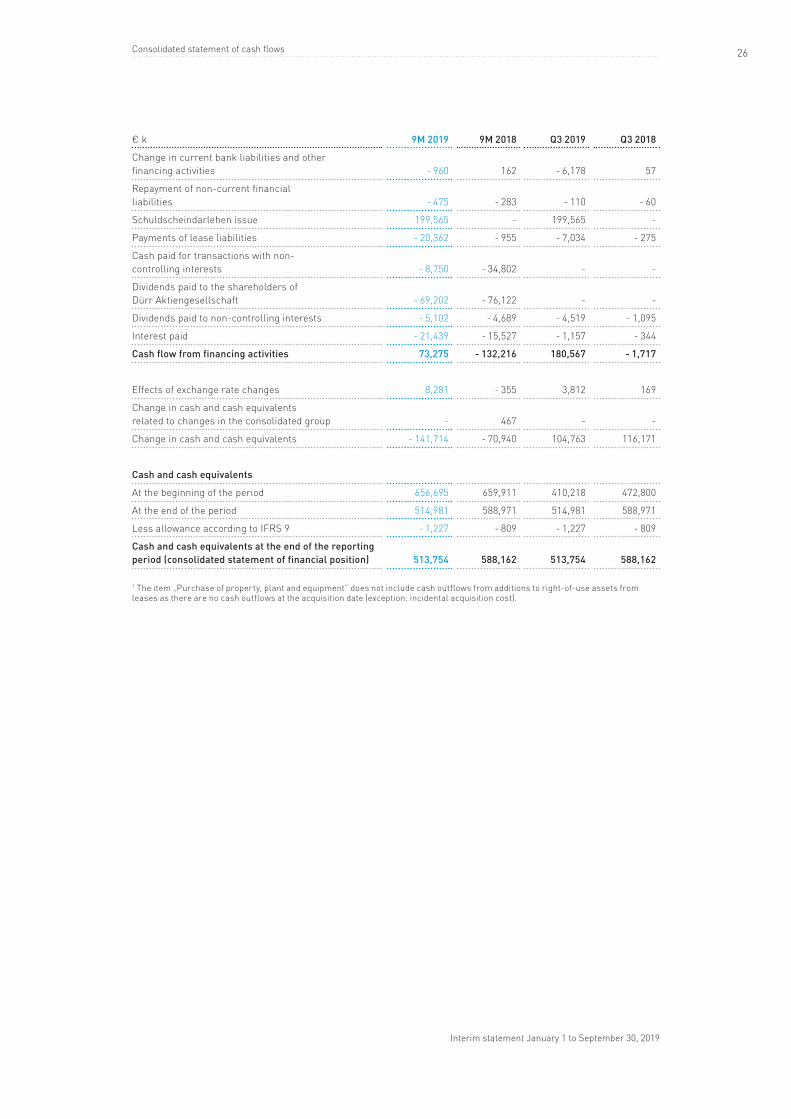
€ k 9M 2019 9M 2018 Q3 2019 Q3 2018
Change in current bank liabilities and other financing activities - 960 162 - 6,178 57
Repayment of non-current financial liabilities - 475 - 283 - 110 - 60
Schuldscheindarlehen issue 199,565 - 199,565 -
Payments of lease liabilities - 20,362 - 955 - 7,034 - 275
Cash paid for transactions with non- controlling interests - 8,750 - 34,802 - -
Dividends paid to the shareholders of Dürr Aktiengesellschaft - 69,202 - 76,122 - -
Dividends paid to non-controlling interests - 5,102 - 4,689 - 4,519 - 1,095
Interest paid - 21,439 - 15,527 - 1,157 - 344
Cash flow from financing activities 73,275 - 132,216 180,567 - 1,717
Effects of exchange rate changes 8,281 - 355 3,812 169
Change in cash and cash equivalents related to changes in the consolidated group - 467 - -
Change in cash and cash equivalents - 141,714 - 70,940 104,763 116,171
Cash and cash equivalents
At the beginning of the period 656,695 659,911 410,218 472,800
At the end of the period 514,981 588,971 514,981 588,971
Less allowance according to IFRS 9 - 1,227 - 809 - 1,227 - 809
Cash and cash equivalents at the end of the reporting period (consolidated statement of financial position) 513,754 588,162 513,754 588,162
1 The item „Purchase of property, plant and equipment” does not include cash outflows from additions to right-of-use assets from leases as there are no cash outflows at the acquisition date (exception: incidental acquisition cost)�
Inte
rim s
tate
men
t Jan
uary
1 to
Sep
tem
ber 3
0, 2
019
27��
����
����
����
����
����
����
����
����
����
����
����
����
����
����
����
����
����
����
����
����
����
����
����
����
����
����
����
����
����
����
����
����
����
����
����
����
����
����
����
����
����
����
����
����
����
����
����
����
����
����
����
����
����
����
����
����
����
����
����
����
����
����
����
����
����
����
����
����
����
����
����
����
����
����
����
����
����
����
����
����
����
����
����
����
����
����
����
����
����
����
����
����
����
����
����
����
����
����
����
����
����
����
����
����
����
����
����
����
Cons
olid
ated
sta
tem
ent o
f cha
nges
in e
quity
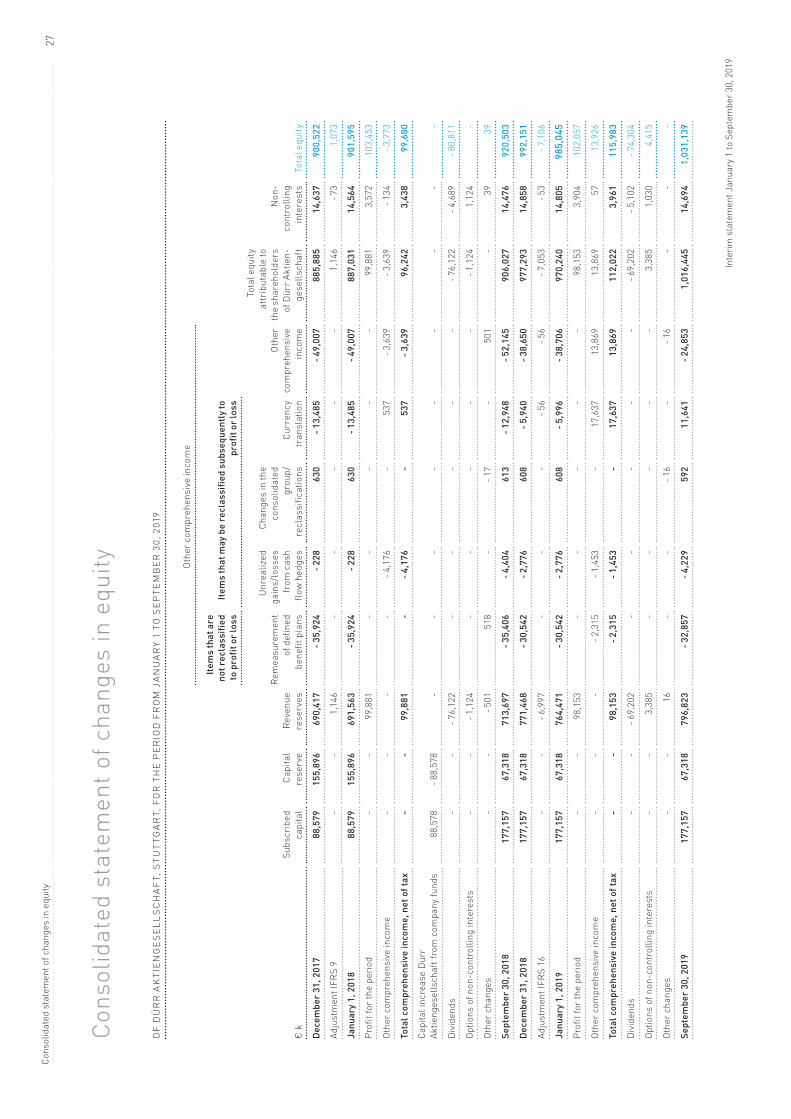
Cons
olid
ated
sta
tem
ent o
f cha
nges
in e
quity
OF
Dü
RR
AK
TIE
NG
ESE
LLS
CH
AF
T, S
TUT
TGA
RT,
FO
R T
HE
PE
RIO
D F
RO
M J
AN
UA
RY
1 TO
SE
PTE
MB
ER
30,
201
9
Oth
er c
ompr
ehen
sive
inco
me
item
s th
at a
re
not r
ecla
ssifi
ed
to p
rofit
or l
oss
item
s th
at m
ay b
e re
clas
sifie
d su
bseq
uent
ly to
pr
ofit
or lo
ss
€ k
Subs
crib
ed
capi
tal
Capi
tal
rese
rve
Reve
nue
rese
rves
Rem
easu
rem
ent
of d
efin
ed
bene
fit p
lans
Unr
ealiz
ed
gain
s/lo
sses
fr
om c
ash
flow
hed
ges
Chan
ges
in th
e co
nsol
idat
ed
grou
p/
recl
assi
ficat
ions
Curr
ency
tr
ansl
atio
n
Oth
er
com
preh
ensi
ve
inco
me
Tota
l equ
ity
attr
ibut
able
to
the
shar
ehol
ders
of
Dür
r Akt
ien-
ge
sells
chaf
t
Non
- co
ntro
lling
in
tere
sts
Tota
l equ
ity
Dece
mbe
r 31,
201
788
,579
155,
896
690,
417
-35,
924
-228
630
-13,
485
-49,
007
885,
885
14,6
3790
0,52
2
Adju
stm
ent I
FRS
9-
-1,
146
--
--
-1,
146
-73
1,07
3
Janu
ary
1, 2
018
88,5
7915
5,89
669
1,56
3-3
5,92
4-2
2863
0-1
3,48
5-4
9,00
788
7,03
114
,564
901,
595
Prof
it fo
r the
per
iod
--
99,8
81-
--
--
99,8
813,
572
103,
453
Othe
r com
preh
ensi
ve in
com
e-
--
--4
,176
-53
7-3
,639
-3,6
39-1
34-3
,773
tota
l com
preh
ensi
ve in
com
e, n
et o
f tax
--
99,8
81-
-4,1
76-
537
-3,6
3996
,242
3,43
899
,680
Capi
tal i
ncre
ase
Dür
r Ak
tieng
esel
lsch
aft f
rom
com
pany
fund
s88
,578
-88,
578
--
--
--
--
-
Div
iden
ds-
--7
6,12
2-
--
--
-76,
122
-4,6
89-8
0,81
1
Optio
ns o
f non
-con
trol
ling
inte
rest
s-
--1
,124
--
--
--1
,124
1,12
4-
Othe
r cha
nges
--
-501
518
--1
7-
501
-39
39
sept
embe
r 30,
201
817
7,15
767
,318
713,
697
-35,
406
-4,4
0461
3-1
2,94
8-5
2,14
590
6,02
714
,476
920,
503
Dece
mbe
r 31,
201
817
7,15
767
,318
771,
468
-30,
542
-2,7
7660
8-5
,940
-38,
650
977,
293
14,8
5899
2,15
1
Adju
stm
ent I
FRS
16-
--6
,997
--
--5
6-5
6-7
,053
-53
-7,1
06
Janu
ary
1, 2
019
177,
157
67,3
1876
4,47
1-3
0,54
2-2
,776
608
-5,9
96-3
8,70
697
0,24
014
,805
985,
045
Prof
it fo
r the
per
iod
--
98,1
53-
--
--
98,1
533,
904
102,
057
Othe
r com
preh
ensi
ve in
com
e-
--
-2,3
15-1
,453
-17
,637
13,8
6913
,869
5713
,926
tota
l com
preh
ensi
ve in
com
e, n
et o
f tax
--
98,1
53-2
,315
-1,4
53-
17,6
3713
,869
112,
022
3,96
111
5,98
3
Div
iden
ds-
--6
9,20
2-
--
--
-69,
202
-5,1
02-7
4,30
4
Optio
ns o
f non
-con
trol
ling
inte
rest
s-
-3,
385
--
--
-3,
385
1,03
04,
415
Othe
r cha
nges
--
16-
--1
6-
-16
--
-
sept
embe
r 30,
201
917
7,15
767
,318
796,
823
-32,
857
-4,2
2959
211
,641
-24,
853
1,01
6,44
514
,694
1,03
1,13
9
Interim statement January 1 to September 30, 2019
28� � � � � � � � � � � � � � � � � � � � � � � � � � � � � � � � � � � � � � � � � � � � � � � � � � � � � � � � � � � � � � � � � � � � � � � � � � � � � � � � � � � � � � � � � � � � � � � � � � � � � � � � � � � � � � � � � � � � � � � � � � � � � � � � � � � � � � � � � � � � � � � � � � � � � � � � � � � � � � � � � � � � � � � � � � � � � � � � � � � � � � � � � � � � � � � � � � � � � � � � � � � � � � � � � � � � � � � � � � � � � � � � � � � �Financial calendar and contact
Contact Dürr AGPlease contact us for further information: Günter Dielmann Mathias Christen Stefan Tobias Burkhardt Corporate Communications & Investor Relations Carl-Benz-Strasse 34 74321 Bietigheim-Bissingen Germany Phone: +49 7142 78-1785 / -1381 / -3558 Fax: +49 7142 78-1716 corpcom@durr�com investor�relations@durr�com
www�durr-group�com
This interim statement is the English translation of the German original� The German version shall prevail�
This publication has been prepared independently by Dürr AG/Dürr Group (“Dürr”)� It may contain statements which ad-dress such key issues as strategy, future financial results, events, competitive positions and product developments� Such forward-looking statements are subject to a number of risks, uncertainties and other factors, including, but not limited to those described in Dürr‘s disclosures, in particular in the chapter “Risks” in Dürr‘s annual report� Should one or more of these risks, uncertainties and other factors materialize, or should underlying expectations not occur or assumptions prove incorrect, actual results, performances or achievements of Dürr may vary materially from those described in the relevant forward-looking statements� These statements may be identified by words such as “expect”, “want”, “anticipate”, “intend”, “plan”, “believe”, “seek”, “estimate”, “will”, “project” or words of similar meaning� Dürr neither intends, nor assumes any obligation, to update or revise its forward-looking statements regularly in light of developments which differ from those anticipated� Stated competitive positions are based on management estimates supported by information provided by specialized external agencies�Our financial reports, presentations, press releases and ad-hoc releases may include alternative financial metrics� These metrics are not defined in the IFRS (International Financial Reporting Standards)� Dürr‘s net assets, financial position and results of operations should not be assessed solely on the basis of these alterna-tive financial metrics� Under no circumstances do they replace the performance indicators presented in the consolidated financial statements and calculated in accordance with the IFRS� The calculation of alternative financial metrics may vary from company to company despite the use of the same terminology� Further information regarding the alternative finan-cial metrics used at Dürr can be found in our financial glossary on the Dürr Web page (https://www�durr-group�com/en/investor-relations/service-awards/glossary/)�
Financial calendar
November 12, 2019 UBS European Conference 2019, London
November 19, 2019 DZ Equity Conference, Frankfurt
November 26, 2019 Exane BNP Paribas MidCap CEO Conference, Paris
December 2, 2019 Berenberg European Conference, Pennyhill
December 3, 2019 Annual Goldman Sachs Industrials Conference, London
January 9, 2020 ODDO BHF Forum, Lyon
January 14, 2020 Commerzbank German Investment Seminar, New York
January 21, 2020 Kepler Cheuvreux German Corporate Conference, Frankfurt
February 27, 2020 Preliminary figures for fiscal 2019: Press conference and conference call


![[Woodworking plans]](https://img.pdfslide.us/doc/110x75/58a0c2aa1a28ab6d018b47eb/woodworking-plans-58a0c6bcaf227.jpg)