Embed Size (px)
Citation preview

Interim statement Q1 2019 / 2020
Johannes
Gutenberg

Heidelberg Group
2
INTERIM STATEMENT FOR THE FIRST QUARTER OF 2019 / 2020
Figures
¬ Incoming orders of € 615 million reflect investment restraint due to worsened economic conditions; order backlog
increased slightly year-on-year
¬ Sales down year-on-year at € 502 million due to economic conditions
¬ EBITDA excluding restructuring result at € 14 million; EBIT excluding restructuring result at € – 10 million
¬ Net result after taxes € – 31 million
¬ Cash flow at € – 4 million; free cash flow at € – 83 million
¬ Net debt rises due in part to the first-time application of IFRS 16 to € 391 million, leverage at 2.1
¬ Sales forecast confirmed, margin target and forecast for net result after taxes adjusted
Facts
¬ Expansion of digital business models: demand for contract and subscription offerings continues to develop favorably
¬ Successful Print China 2019: customers focus on digital packaging printing and Smart Print Shop
¬ World’s first web-to-pack platform for individual folding boxes implemented in China
¬ Expansion of cloud-based applications: establishment of a new platform for the printing industry
¬ “Heidelberg Digital Campus of Things” project launched: concept for sustainable and forward-looking development
of the Wiesloch-Walldorf production site put forward
¬ First quarter affected by increasing investment restraint and corresponding sales deferrals due to the economic
slowdown, especially at the end of the reporting period

3
Interim statement Q1 2019 / 2020
Key figures at a glance use assets) and financial liabilities (recognition of lease lia-
bilities). In the income statement, depreciation and amor-
tization increase and the financial result deteriorates; these
effects are offset by roughly equal increases in EBITDA, so
the net result is virtually unchanged. The previous year’s
figures were not adjusted.
Overall assessment of business development
The business development of Heidelberger Druckmaschinen
AG (Heidelberg) in the first quarter (April 1, 2019 to June 30,
2019) of the 2019 / 2020 financial year was influenced by
increasing investment restraint and corresponding sales
deferrals due to the economic slowdown, especially at the
end of the reporting period. This development chimes with
the statements by the industry association VDMA from
early July, which lowered its full-year forecast for 2019 to a
production drop of 2 percent. Particularly in Germany and
parts of Europe and in the business with consumables,
Heidelberg was not able to build on the previous year.
Heidelberg has made further progress with the Compa-
ny’s digital transformation in the first quarter of the cur-
rent 2019 / 2020 financial year. At the start of the new finan-
cial year, the Company successfully presented solutions for
digital packaging printing and Heidelberg’s Smart Print
Shop at Print China in April. Together with a large Chinese
folding box producer, the Company also launched the web-
to-pack platform “boxuni” and a fully digital production
line centered on a Primefire 106 there. Heidelberg is there-
fore a pioneer in the establishment of a digital, cloud-based
ecosystem for the packaging market in the Chinese print
media industry.
Figures in € millions Q1 2018 / 2019
Q1 2019 / 2020
Incoming orders 665 615
Order backlog 714 730
Net sales 541 502
EBITDA 1) 20 14
in percent of sales 3.7 2.8
Result of operating activities (EBIT) excluding restructuring result 2 – 10
Restructuring result 0 – 3
Financial result – 16 – 13
Net result before taxes – 14 – 26
Net result after taxes – 15 – 31
Equity 332 295
Net debt 2) 278 391
Leverage 4) 1.4 2.1
Cash flow 3 – 4
Free cash flow – 45 – 83
Earnings per share in € – 0.05 – 0.10
Number of employees at end of quarter (excluding trainees) 11,549 11,459
1) Result of operating activities before interest and taxes and before depreciation and amortization, excluding restructuring result
2) Net total of financial liabilities and cash and cash equivalents and current securities3) Of which: approximately € 55 million from the first-time application of IFRS 164) Ratio of net debt to EBITDA excluding restructuring result for the last four quarters
First-time application of IFRS 16
Heidelberger Druckmaschinen AG is applying the financial
reporting standard IFRS 16 “Leases” for the first time in the
2019 / 2020 financial year, which supersedes the former
lease accounting standard IAS 17 “Leases”. The material
effects of the introduction of IFRS 16 are reflected in the
increase in both non-current assets (recognition of right-of-
3)

Heidelberg Group
4
Net sales and results of operations Interim consolidated income statement
¬ Despite considerably higher demand in China, incom-
ing orders in the first quarter of the financial year
2019 / 2020 amounted to € 615 million, down on the pre-
vious year’s figure of € 665 million, due to economy-
driven investment deferrals in Western Europe.
¬ At € 502 million, net sales were down on the previous
year’s figure of € 541 million due to the worsened eco-
nomic conditions and corresponding investment defer-
rals. This primarily affected the new machinery business
and thus the Heidelberg Digital Technology segment.
¬ ebitda excluding restructuring result was down
on the same quarter of the previous year (€ 20 million)
at € 14 million due to the lower volume and a less
favorable product mix. The positive effects from the
first-time application of IFRS 16 amounted to around
€ 5 million. ebit excluding restructuring result amounted to € – 10 million (same quarter of the previ-
ous year: € 2 million). The EBITDA margin excluding
restructuring result (including IFRS 16 effect) amounted
to 2.8 percent after 3.7 percent in the same quarter of
the previous year.
Figures in € millions Q1 2018 / 2019 Q1 2019 / 2020
Net sales 541 502
Change in finished goods and work in progress / other own work capitalized 70 84
Total operating performance 611 586
EBITDA excluding restructuring result 20 14
Result of operating activities (EBIT) excluding restructuring result 2 – 10
Restructuring result 0 – 3
Result of operating activities 2 – 13
Financial result – 16 – 13
Net result before taxes – 14 – 26
Taxes on income 1 5
Net result after taxes – 15 – 31
Furthermore, together with a company specializing in
cloud-based management information systems, Heidelberg
plans to establish a new industry platform for the printing
industry, which will then also be opened up for applica-
tions from third-party providers.
The demand for e-commerce, contract and subscription
services (service, software and supply contracts for consum-
ables and in the final expansion stage subscription con-
tracts including equipment) continued to develop posi-
tively, so Heidelberg is offering additional contract vari-
ants. The share of recurring sales has risen compared with
the same quarter of the previous year. In the medium term,
the share of recurring sales primarily from contract and
subscription offerings is set to increase to around one-third
of total sales.
In the quarter under review, there was an intensive
exchange with the communities of Wiesloch and Walldorf
regarding the sustainable and forward-looking develop-
ment of the largest production site within the production
network, Wiesloch-Walldorf, into the “Heidelberg Digital
Campus of Things”. Extensive infrastructure changes and
the efficient use of all resources and synergies at the loca-
tion are to create a home base for the future growth of Hei-
delberg and its production network.
Incoming orders and sales in the first quarter of the
2019 / 2020 financial year were significantly negatively
influenced by the worsened economic conditions and the
associated investment restraint and both fell short of the
figures for the same quarter of the previous year. Com-
pared to the end of the financial year on March 31, 2019
(€ 654 million), the order backlog increased by around
12 percent to € 730 million as of June 30, 2019. This is also
thanks to the new subscription contracts, which will be
reflected in sales throughout the term of the respective
contracts.

5
Interim statement Q1 2019 / 2020
Net sales and results of operations Interim consolidated income statement
Equity and liabilities
Figures in € millions 31-Mar-2019 30-Jun-2019
Equity 399 295
Provisions 880 921
of which: pension provisions 582 652
Financial liabilities 465 542
Trade payables 245 221
Other equity and liabilities 340 371
Total equity and liabilities 2,329 2,350
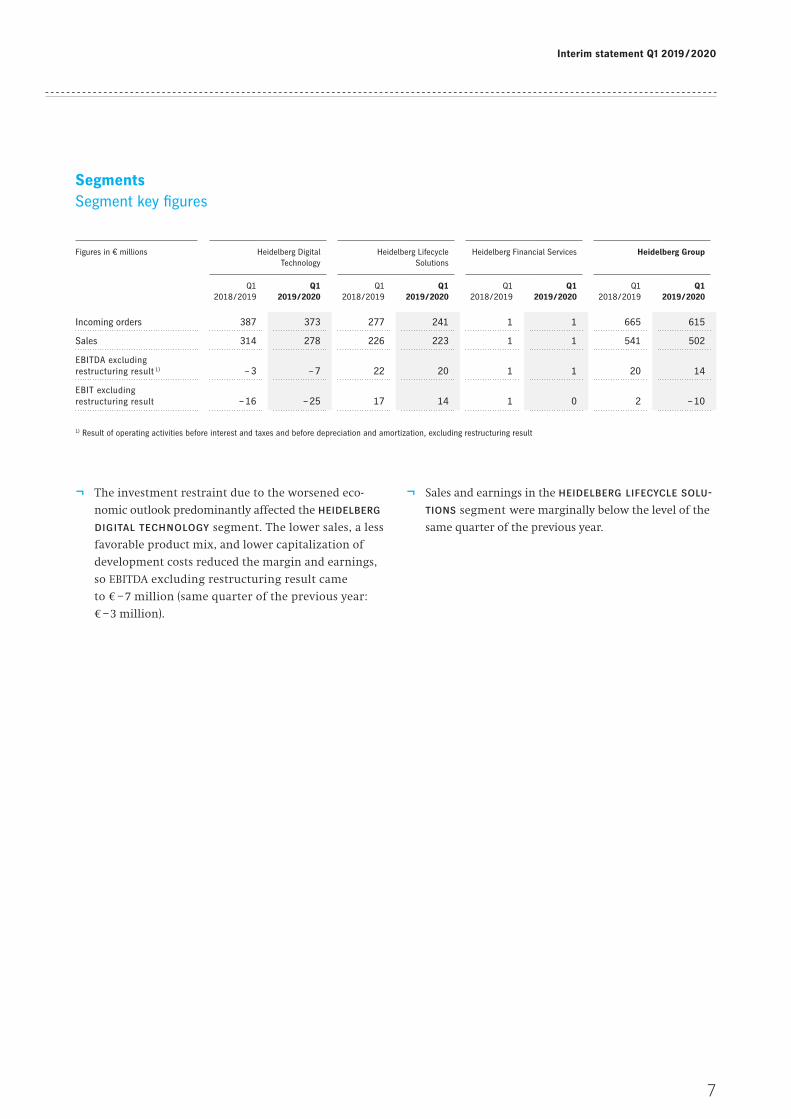
¬ Non-current assets climbed in the quarter under
review, essentially as a result of the first-time appli-
cation of IFRS 16.
¬ Due to the expected rise in deliveries and sales in the
second half of the financial year and to the planned
series launch of the digital portfolio, inventories
exceeded the level as of the end of the 2018 / 2019
financial year. Consequently, net working capital also
rose to € 710 million as of June 30, 2019 (June 30, 2018:
€ 606 million; March 31, 2019: € 684 million).
¬ Trade receivables fell to € 283 million as of June
30, 2019, due to seasonal effects (same quarter of
the previous year: € 360 million).
¬ Cash and cash equivalents decreased primarily as a
result of the negative free cash flow.
¬ Equity decreased due primarily to the significant
decline in the interest rate for German pensions
(from 2.0 percent as of March 31, 2019 to 1.5 percent
as of June 30, 2019) and the loss for the quarter and
amounted to € 295 million as of the end of the quarter.
The equity ratio was therefore around 13 percent.
¬ Due to the decline in the interest rate for German pen-
sions, the pension provisions increased as of the end of
the reporting period on June 30, 2019. Overall, provi-
sions increased to around € 921 million.
¬ Financial liabilities rose as of the end of the reporting
period, essentially as a result of the first-time applica-
tion of IFRS 16 (approximately € 55 million) and
the negative free cash flow. Net debt therefore also
increased to € 391 million as of the end of the quarter.
¬ Due to seasonal influences and as a result of the first-
time application of IFRS 16, leverage rose to 2.1 as of
the end of the quarter.
Net assets
Figures in € millions 31-Mar-2019 30-Jun-2019
Non-current assets 846 897
Inventories 685 777
Trade receivables 360 283
Receivables from sales financing 60 58
Cash and cash equivalents 215 151
Other assets 163 184
Total assets 2,329 2,350
Assets
¬ The financial result improved to € – 13 million after
€ – 16 million in the same quarter of the previous year.
¬ Taking into account taxes on income, the net result after taxes amounted to € – 31 million (same quarter
of the previous year: € – 15 million).

Heidelberg Group
6
Financial position Interim consolidated statement of cash flows
Figures in € millions Q1 2018 / 2019
Q1 2019 / 2020
Net result after taxes – 15 – 31
Cash flow 3 – 4
Other operating changes – 35 – 62
of which: net working capital 8 – 30
of which: receivables from sales financing 4 1
of which: other – 47 – 34
Cash used in investing activities – 13 – 17
Free cash flow – 45 – 83
in percent of sales – 8.3 – 16.5
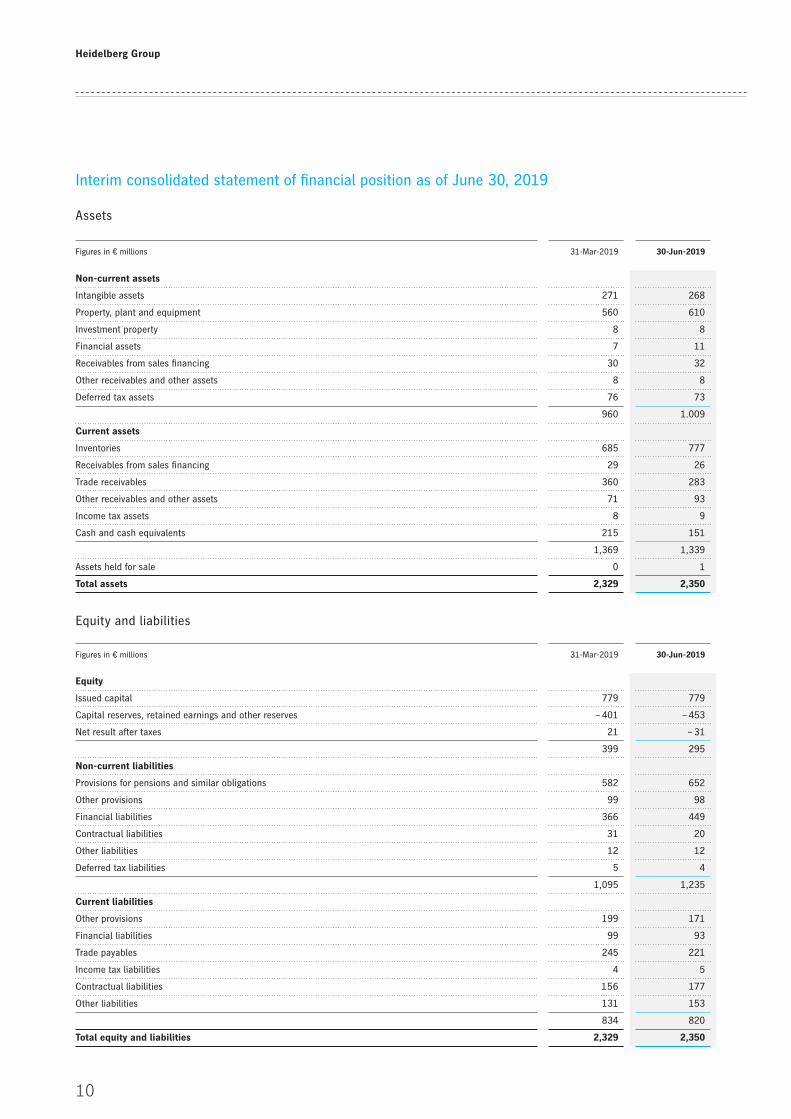
¬ Cash flow amounted to € – 4 million (same quarter of
the previous year: € 3 million).
¬ There was net cash outflow of € – 62 million in other
operating changes due primarily to the increase in
net working capital and seasonal staff payments.
¬ Cash used in investing activities amounted to
€ – 17 million in the quarter under review. In the
reporting period, we invested in particular in digital
projects, the establishment of new business models
and the acquisition of a smaller company from the
software sector.
¬ In total, free cash flow was significantly negative in
the first quarter of 2019 / 2020 at € – 83 million.
¬ The three pillars of our financing portfolio – capital
market instruments (corporate bond and convertible
bond), the syndicated credit line plus other instru-
ments and promotional loans – are well balanced.
¬ Heidelberg’s credit facilities, which currently total
around € 710 million, have balanced diversification
and a balanced maturity structure until 2023. The
net financial debt of € 336 million (excluding approx-
imately € 55 million from the first-time application
of IFRS 16) is thus funded in the medium to long
term.
7
Interim statement Q1 2019 / 2020
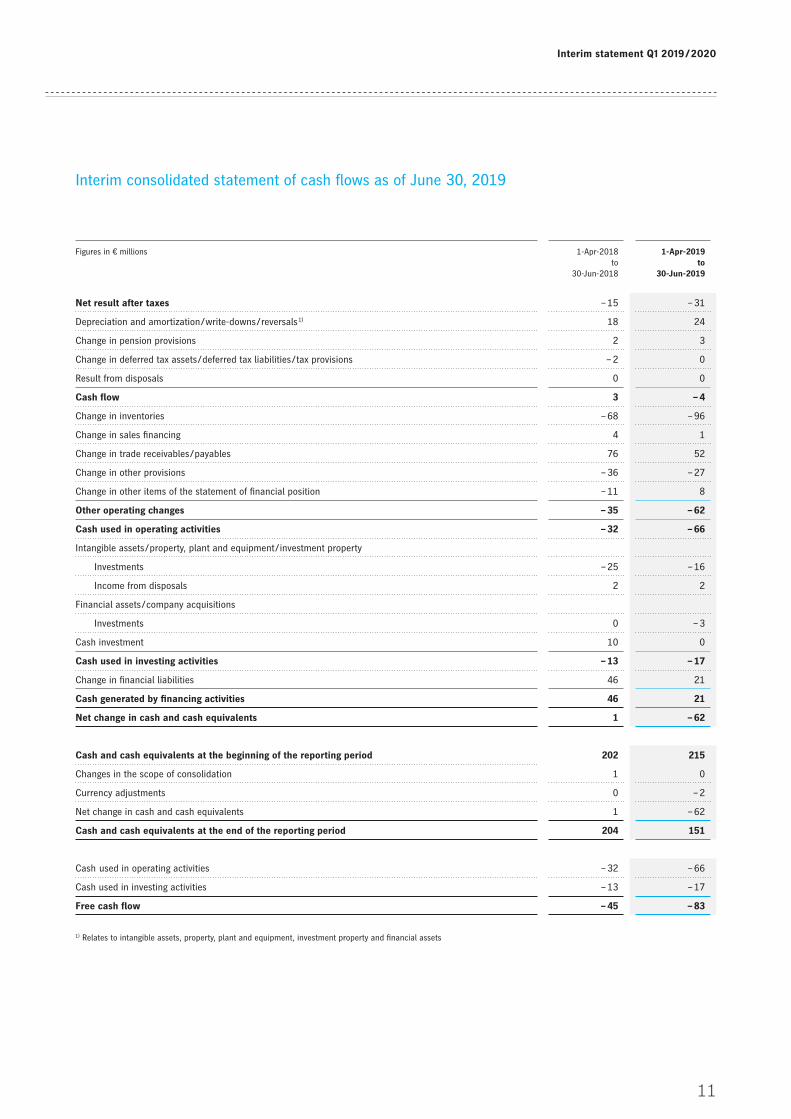
SegmentsSegment key figures
¬ The investment restraint due to the worsened eco-
nomic outlook predominantly affected the heidelberg digital technology segment. The lower sales, a less
favorable product mix, and lower capitalization of
development costs reduced the margin and earnings,
so EBITDA excluding restructuring result came
to € – 7 million (same quarter of the previous year:
€ – 3 million).
Figures in € millions Heidel berg Digital Technology
Heidelberg Lifecycle Solutions
Heidel berg Financial Services Heidel berg Group
Q12018 / 2019
Q1 2019 / 2020
Q12018 / 2019
Q1 2019 / 2020
Q12018 / 2019
Q1 2019 / 2020
Q12018 / 2019
Q1 2019 / 2020
Incoming orders 387 373 277 241 1 1 665 615
Sales 314 278 226 223 1 1 541 502
EBITDA excluding restructuring result 1) – 3 – 7 22 20 1 1 20 14
EBIT excluding restructuring result – 16 – 25 17 14 1 0 2 – 10
1) Result of operating activities before interest and taxes and before depreciation and amortization, excluding restructuring result
¬ Sales and earnings in the heidelberg lifecycle solu-tions segment were marginally below the level of the
same quarter of the previous year.

Heidelberg Group
8
Figures in € millions Q1 2018 / 2019
Q1 2019 / 2020
EMEA 211 194
Asia / Pacific 172 160
Eastern Europe 49 59
North America 89 77
South America 20 12
Heidel berg Group 541 502
Q1 2019 / 2020 Share of Heidelberg Group sales (in parentheses: previous year)
¬ In the emea region and especially in Germany and
Central Europe, the investment restraint and corre-
sponding deferrals due to the economic slowdown
made a particular impact on sales.
¬ The picture in the asia / pacific region was mixed:
While Japan and Singapore significantly increased
sales and China came close to the previous year’s figure,
sales in many smaller markets declined compared
with the same quarter of the previous year.
¬ Higher sales of sheetfed offset printing presses in
Southeastern Europe considerably increased the east-ern europe region’s sales in the quarter under review.
¬ The north america region failed to achieve the previ-
ous year’s sales level; the US in particular was unable
to repeat the good result of the same quarter of the
previous year.
¬ In the south america region, there was considerable
restraint and therefore a sales decline due to the diffi-
cult political, economic and financial environment.
Outlook
As communicated in an ad hoc announcement on July 17,
2019, the Company is adjusting the outlook for the operat-
ing result in the current 2019 / 2020 financial year and
assumes a target margin for EBITDA excluding restructur-
ing result in a range from 6.5 to 7 percent of sales (previ-
ously 7.5 to 8.0 percent). This is due to increasing invest-
ment restraint due to the worsened economic conditions
and a less favorable product mix in the 2019 / 2020 financial
year. The Heidelberg Digital Technology segment is now
expected to achieve an EBITDA margin excluding restruc-
turing result of 2.0 percent to 3.0 percent; an EBITDA mar-
gin excluding restructuring result of 13.5 percent to 14.0
percent is still being envisaged for the Heidelberg Lifecycle
Solutions segment. The Heidelberg Financial Services seg-
ment is expected to continue to make a positive contribu-
tion to EBITDA. For the 2019 / 2020 financial year as a
whole, Heidelberg continues to expect sales at the level of
the previous year. Despite the economic slowdown and the
associated reluctance to invest in the equipment business,
compensation is expected from a further stable expansion
of the contract business. The Company expects to break
even after taxes, having previously targeted a net result
after taxes at the previous year’s level.
The other parts of the forecast for the current
2019 / 2020 financial year remain unchanged and can be
found on pages 52 / 53 of the 2018 / 2019 Annual Report.
Regions Sales by region
39 % (39 %)Europe, Middle East
and Africa
2 % (4 %)South America
15 % (16 %)North America
12 % (9 %)Eastern Europe
32 % (32 %)Asia / Pacific

9
Interim statement Q1 2019 / 2020
Financial section Interim consolidated income statement
Figures in € millions 1-Apr-2018to
30-Jun-2018
1-Apr-2019to
30-Jun-2019
Net sales 541 502
Change in inventories 62 82
Other own work capitalized 8 2
Total operating performance 611 586
Other operating income 19 13
Cost of materials 283 270
Staff costs 233 233
Depreciation and amortization 18 24
Other operating expenses 94 85
Result of operating activities 1) 2 – 13
Financial income 2 1
Financial expenses 18 14
Financial result – 16 – 13
Net result before taxes – 14 – 26
Taxes on income 1 5
Net result after taxes – 15 – 31
Basic earnings per share according to IAS 33 (in € per share) – 0.05 – 0.10
Diluted earnings per share according to IAS 33 (in € per share) – 0.05 – 0.10
1) Result of operating activities excluding restructuring result: € – 10 million (April 1, 2018 to June 30, 2018: € 2 million) Restructuring result (€ – 3 million; April 1, 2018 to June 30, 2018: € 0 million) = restructuring income (€ 1 million; April 1, 2018 to June 30, 2018: € 3 million) less restructuring expenses (€ 4 million; April 1, 2018 to June 30, 2018: € 3 million).
Heidelberg Group
10
Interim consolidated statement of financial position as of June 30, 2019
Figures in € millions 31-Mar-2019 30-Jun-2019
Non-current assets
Intangible assets 271 268
Property, plant and equipment 560 610
Investment property 8 8
Financial assets 7 11
Receivables from sales financing 30 32
Other receivables and other assets 8 8
Deferred tax assets 76 73
960 1.009
Current assets
Inventories 685 777
Receivables from sales financing 29 26
Trade receivables 360 283
Other receivables and other assets 71 93
Income tax assets 8 9
Cash and cash equivalents 215 151
1,369 1,339
Assets held for sale 0 1
Total assets 2,329 2,350
Equity and liabilities
Assets
Figures in € millions 31-Mar-2019 30-Jun-2019
Equity
Issued capital 779 779
Capital reserves, retained earnings and other reserves – 401 – 453
Net result after taxes 21 – 31
399 295
Non-current liabilities
Provisions for pensions and similar obligations 582 652
Other provisions 99 98
Financial liabilities 366 449
Contractual liabilities 31 20
Other liabilities 12 12
Deferred tax liabilities 5 4
1,095 1,235
Current liabilities
Other provisions 199 171
Financial liabilities 99 93
Trade payables 245 221
Income tax liabilities 4 5
Contractual liabilities 156 177
Other liabilities 131 153
834 820
Total equity and liabilities 2,329 2,350
11
Interim statement Q1 2019 / 2020
Interim consolidated statement of cash flows as of June 30, 2019
Figures in € millions 1-Apr-2018to
30-Jun-2018
1-Apr-2019 to
30-Jun-2019
Net result after taxes – 15 – 31
Depreciation and amortization / write-downs / reversals 1) 18 24
Change in pension provisions 2 3
Change in deferred tax assets / deferred tax liabilities / tax provisions – 2 0
Result from disposals 0 0
Cash flow 3 – 4
Change in inventories – 68 – 96
Change in sales financing 4 1
Change in trade receivables / payables 76 52
Change in other provisions – 36 – 27
Change in other items of the statement of financial position – 11 8
Other operating changes – 35 – 62
Cash used in operating activities – 32 – 66
Intangible assets / property, plant and equipment / investment property
Investments – 25 – 16
Income from disposals 2 2
Financial assets / company acquisitions
Investments 0 – 3
Cash investment 10 0
Cash used in investing activities – 13 – 17
Change in financial liabilities 46 21
Cash generated by financing activities 46 21
Net change in cash and cash equivalents 1 – 62
Cash and cash equivalents at the beginning of the reporting period 202 215
Changes in the scope of consolidation 1 0
Currency adjustments 0 – 2
Net change in cash and cash equivalents 1 – 62
Cash and cash equivalents at the end of the reporting period 204 151
Cash used in operating activities – 32 – 66
Cash used in investing activities – 13 – 17
Free cash flow – 45 – 83
1) Relates to intangible assets, property, plant and equipment, investment property and financial assets

Heidelberg Group
12
Important noteThis interim statement contains forward-looking statements based on assumptions and estimates by the management of Heidelberger Druckmaschinen Aktiengesellschaft. Although the Management Board is of the opinion that these assumptions and estimates are realistic, actual future developments and results may deviate substantially from these forward-looking statements due to various factors. These factors could, for instance, include changes in the overall economic situation, exchange rates and interest rates, as well as changes within the print media industry. Heidelberger Druckmaschinen Aktiengesellschaft provides no guarantee and assumes no liability for future developments and results deviating from the assumptions and estimates made in this interim statement. Heidelberg neither intends nor assumes any obligation to update the assumptions and estimates made in this interim statement to reflect events or developments occurring after the publication of this interim statement.
In individual cases, rounding may result in discrepancies concerning the totals and percentages contained in this interim statement.
This report is a non-binding English convenience translation of the German interim statement of Heidelberger Druckmaschinen Aktiengesellschaft. The Company disclaims responsibility for any misunderstanding or misinterpretation due to this translation.
This interim statement was published on August 6, 2019.
Financial calendar 2019 / 2020
November 6, 2019 ¬ Publication of Half-Year Figures 2019 / 2020
February 11, 2020 ¬ Publication of Third Quarter Figures 2019 / 2020
June 9, 2020 ¬ Press Conference, Annual Analyst and Investor Conference
July 23, 2020 ¬ Annual General Meeting
Subject to change
Contact Publishing information
Investor Relations Heidelberger Druckmaschinen
Tel. +49-6222-82 67120 Aktiengesellschaft
[email protected] Kurfürsten-Anlage 52 – 60
69115 Heidelberg
Germany
www.heidelberg.com


![PDF [391 K]](https://img.pdfslide.us/doc/110x75/586e035d1a28ab8b3b8b5f73/pdf-391-k.jpg)