Embed Size (px)
Citation preview
Group adjusted EBITDA 6 % higher year on year // Exceptional energy trading performance // Earnings forecast for fiscal 2021 confirmed: Group adjusted EBITDA of €3.0 billion to €3.4 billion expected // RWE secures sites for two new North Sea wind farms
Interim statement on the first three quarters of 2021

At a glance
1 Some prior-year figures restated due to a change in the recognition of renewable energy tax benefits in the USA (see commentary on page 6).2 Converted to full-time positions.
Contents
1 Combined review of operations 3 Major events 3 Commentary on reporting 5 Business performance 7 Outlook for 2021 17
2 Interim consolidated financial statements (condensed) 18
Income statement 18 Statement of comprehensive income 19 Balance sheet 20 Cash flow statement 22
3 Financial calendar 2021 / 2022 23
RWE Group – key figures1 Jan – Sep 2021
Jan – Sep 2020
+/– Jan – Dec 2020
Power generation GWh 118,691 101,529 17,162 146,775
External revenue (excluding natural gas tax / electricity tax) € million 13,253 9,392 3,861 13,688
Adjusted EBITDA € million 2,397 2,261 136 3,286
Adjusted EBIT € million 1,339 1,182 157 1,823
Income from continuing operations before tax € million 3,459 1,948 1,511 1,265
Net income € million 2,808 1,597 1,211 1,051
Adjusted net income € million 1,026 794 232 1,257
Cash flows from operating activities of continuing operations € million 3,421 1,768 1,653 4,125
Capital expenditure € million 2,800 1,662 1,138 3,358
Property, plant and equipment and intangible assets € million 2,763 1,562 1,201 2,285
Financial assets € million 37 100 – 63 1,073
Free cash flow € million 1,213 427 786 1,132
Number of shares outstanding (average) thousands 676,220 624,308 51,912 637,286
Earnings per share € 4.15 2.56 1.59 1.65
Adjusted net income per share € 1.52 1.27 0.25 1.97
30 Sep 2021 31 Dec 2020
Net debt € million 2,866 4,432 – 1,566
Workforce2 18,902 19,498 – 596
Major events
In the period under review
RWE secures two locations for new wind farms in German North Sea. In an invitation to tender by the German Network Agency in September, RWE placed the winning bid for a site in the North Sea, officially called N-3.7. This allows us to build a wind farm with an installed capacity of 225 MW. We made a zero-cent bid to secure the area, which means that we will sell the electricity generated there without a minimum price guaranteed by the state. N-3.8, a second North Sea area earmarked for a 433 MW wind farm, was also auctioned off in the tender process. The winning bid was placed by French energy group EDF, but it had to pass on the location to a joint venture between Northland Power and RWE. This is because together with our Canadian partner, we had pre-developed the site and therefore had a step-in right. Now we must deliver the project at the conditions in EDF’s winning bid; the company submitted a zero-cent bid.
Partial sale of Texan wind farm West Raymond completed. In July, our new Texan wind farm West Raymond put its net installed capacity of 240 MW into commercial operation. Shortly thereafter, we sold shares accounting for a total of 75 % of the wind farm. The purchasers were a subsidiary of the Canadian energy utility Algonquin Power & Utilities and the UK investor Greencoat, which acquired stakes of 51 % and 24 %, respectively. A corresponding contract was concluded in December 2020. The agreement also stipulated that Algonquin and Greencoat receive interests of 51 % and 24 % in the Texan onshore wind farms Stella (201 MW), Cranell (220 MW) and East Raymond (200 MW). These transactions were concluded in January 2021. As we retain a shareholding of just 25 % in the wind farms, they are no longer fully consolidated and are accounted for using the equity method instead. However, RWE remains the operator of the wind farms.
US wind farm Cassadaga starts commercial operation. This past summer, we completed yet another large-scale onshore wind farm called Cassadaga, which is located in the US state of New York. The 37 turbines have been running commercially since August and account for a combined capacity of 125 MW. Cassadaga is our 29th onshore wind farm in the USA. Our capital expenditure on the project exceeded US$200 million.
RWE sells small hydropower plants to KELAG. Austrian energy utility KELAG acquired twelve French and seven Portuguese hydro assets from us, which have a total installed capacity of 62 MW (RWE’s pro-rata share). We also sold a number of wind turbines in Portugal with a combined capacity of 3 MW to KELAG. A corresponding agreement was reached at the end of last year. We transferred the French plants in April 2021, and the Portuguese assets followed in September. KELAG is a leading hydropower producer. We currently hold a 37.9 % stake in the company.
Frimmersdorf lignite-fired power station shut down for good. The Frimmersdorf lignite power plant in Grevenbroich (near Cologne) has been shut down for good. The last two units P and Q, with a net installed capacity of 284 MW and 278 MW, were on stand-by until 30 September this year. As of 1 October 2017, they had been designated as operating reserve for a period of four years, during which they were unable to participate in the market, as their capacity had to remain available to ensure security of supply when necessary. This obligation has since expired. The approximately 30 affected employees now work for the adjacent Neurath power station or have retired. Three of RWE’s lignite blocks are still on security stand-by: Niederaussem E and F (until 30 September 2022) as well as Neurath C (until 30 September 2023).
Major events occurring in the period from January to July 2021 were presented in the interim report on the first half of 2021.
1Combined review of operationsMajor events
2Interim consolidated financial statements (condensed)
3Financial calendar 2021 / 2022
3

After the period under review
RWE sets the stage to expand renewable energy in Greece. In early October, we set up a joint venture with energy group Public Power Corporation (PPC) to realise solar projects in Greece. We and PPC own 51 % and 49 % of the new company, respectively. Our partner is the country’s largest power utility and will contribute photovoltaic projects with up to 940 MW of capacity to the joint venture. RWE will bring a project pipeline of a similar size to the table. The undertakings are in various stages of development. Based on current plans, the first farms will be commissioned in 2023.
Memorandum of Understanding signed to partner with Shell on hydrogen projects. RWE and Shell are stepping up their collaborative efforts to build a European hydrogen economy. Representatives from both companies recently signed a corresponding Memorandum of Understanding (MoU). It envisages us jointly developing projects to produce, use and sell hydrogen. RWE and the British-Dutch energy group are already working together in this area. The companies are partners in consortiums implementing trailblazing hydrogen projects: AquaVentus in Germany and NortH2 in the Netherlands, on which we provide commentary on pages 31 et seq. of the 2020 Annual Report. RWE and Shell intend to take the next step and initiate large-scale projects in the United Kingdom for the production of green hydrogen using offshore wind energy. The MoU also encompasses measures to decarbonise gas and biomass-fired power stations within the RWE Group. To this end, we will explore carbon capture and storage as well as electricity generation using hydrogen.
1Combined review of operationsMajor events
2Interim consolidated financial statements (condensed)
3Financial calendar 2021 / 2022
4
Commentary on reporting
Group structure features five segments. In our financial reporting, we divide the RWE Group into the five following segments: (1) Offshore Wind, (2) Onshore Wind / Solar, (3) Hydro / Biomass / Gas, (4) Supply & Trading and (5) Coal / Nuclear. Segments (1) to (4) represent our core business. This is where we want to grow. In (5), we have pooled our German power generation from coal and nuclear fuel, which will lose importance due to exit roadmaps established by the government.
The individual segments comprise the following activities:
• Offshore Wind: We present our business relating to offshore wind here. It is overseen by our Group company RWE Renewables.
• Onshore Wind / Solar: This is the segment in which we pool our onshore wind and solar business as well as parts of our battery storage activities. Here again, operating responsibility lies with RWE Renewables.
• Hydro / Biomass / Gas: Our business involving our run-of-river, pumped storage, biomass and gas power stations is pooled here. The segment also includes the Dutch Amer 9 and Eemshaven power plants, which run on biomass and hard coal, some battery storage systems, as well as the project management and engineering consulting company RWE Technology International. These activities are overseen by RWE Generation. In addition, since the beginning of 2021, the company has been responsible for the design and implementation of our hydrogen strategy. Our 37.9 % stake in Austrian energy utility KELAG is also assigned to this segment.
• Supply & Trading: The main activity of this segment is proprietary trading of energy commodities, which is managed by RWE Supply & Trading. The company also acts as an intermediary for gas, supplies key accounts with energy, and undertakes a number of additional trading-related activities. Our German and Czech gas storage facilities also form part of this segment.
• Coal / Nuclear: Our German electricity generation from coal and nuclear fuel as well as our lignite production in the Rhenish mining region to the west of Cologne are subsumed here. This is also where we report our investments in Dutch nuclear power plant operator EPZ (30 %) and Germany-based URANIT (50 %), which holds a 33 % stake in uranium enrichment specialist Urenco. Most of the aforementioned activities and investments are overseen by RWE Power. Our German hard coal-fired power plants were operated by RWE Generation; the last two stations were shut down this year.
Group companies with cross-segment tasks, such as the Group holding company RWE AG, are stated as part of the core business under the ‘other, consolidation’ line item. This also applies to our stakes of 25.1 % in German transmission system operator Amprion and 15 % in E.ON. However, the dividends we receive from E.ON are recognised in the financial result. Furthermore, ‘other, consolidation’ contains consolidation effects.
1Combined review of operationsCommentary on reporting
2Interim consolidated financial statements (condensed)
3Financial calendar 2021 / 2022
5

Changed recognition of tax benefits in the USA. At the start of this fiscal year, we changed the way in which we account for tax benefits we receive for US wind and solar projects. As set out on page 37 of the 2020 Annual Report, renewable energy is subsidised via tax credits in the USA. Furthermore, plant operators can benefit from accelerated depreciation, referred to as tax benefits. Until 2020, we recognised them in taxes on income. By contrast, the benefits of tax credits are considered in other operating income. For the sake of consistency, we have now also applied this approach to tax benefits. It has a positive impact on adjusted EBITDA. To ensure comparability, we restated the prior-year figures. More information can be found on pages 35 et seqq. of the interim report on the first half of 2021.
Forward-looking statements. This interim statement contains forward-looking statements regarding the future development of the RWE Group and its companies as well as economic and political developments. These statements are assessments that we have made based on information available to us at the time this document was prepared. Despite this, actual developments can deviate from the developments expected at present, for instance if underlying assumptions do not materialise or unforeseen risks arise. Therefore, we cannot assume responsibility for the correctness of forward-looking statements.
1Combined review of operationsCommentary on reporting
2Interim consolidated financial statements (condensed)
3Financial calendar 2021 / 2022
6
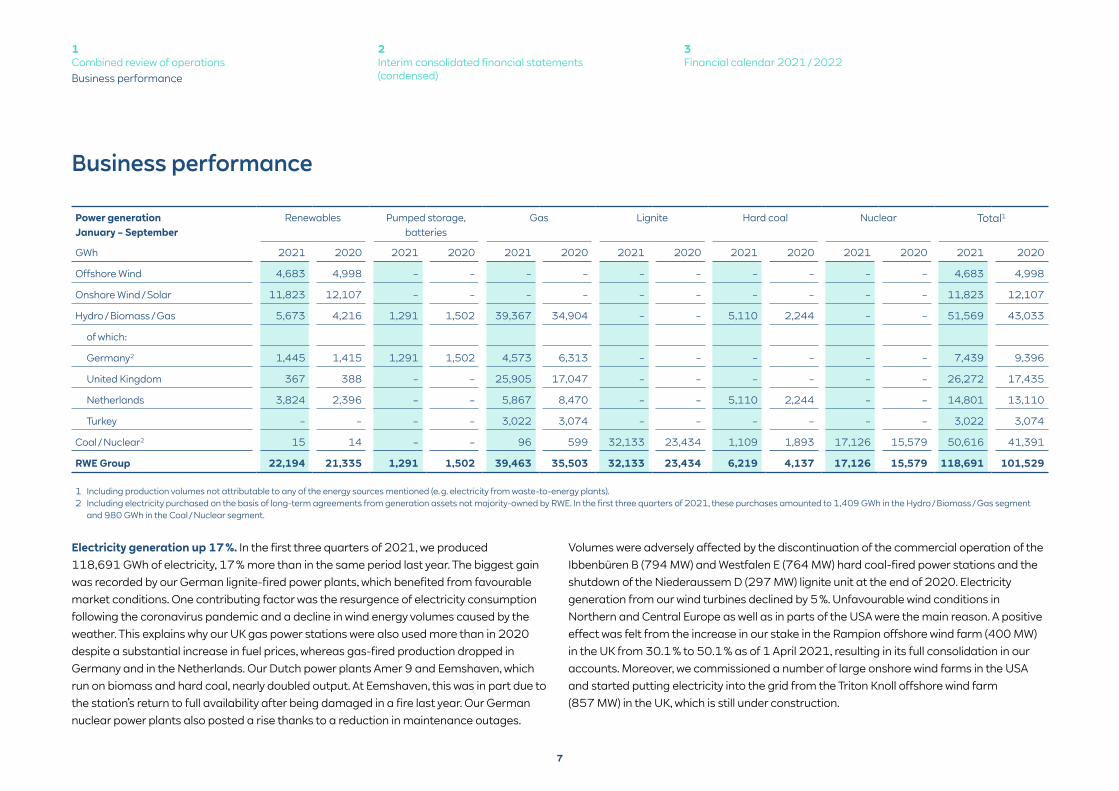
1 Including production volumes not attributable to any of the energy sources mentioned (e. g. electricity from waste-to-energy plants). 2 Including electricity purchased on the basis of long-term agreements from generation assets not majority-owned by RWE. In the first three quarters of 2021, these purchases amounted to 1,409 GWh in the Hydro / Biomass / Gas segment
and 980 GWh in the Coal / Nuclear segment.
Business performance
Electricity generation up 17 %. In the first three quarters of 2021, we produced 118,691 GWh of electricity, 17 % more than in the same period last year. The biggest gain was recorded by our German lignite-fired power plants, which benefited from favourable market conditions. One contributing factor was the resurgence of electricity consumption following the coronavirus pandemic and a decline in wind energy volumes caused by the weather. This explains why our UK gas power stations were also used more than in 2020 despite a substantial increase in fuel prices, whereas gas-fired production dropped in Germany and in the Netherlands. Our Dutch power plants Amer 9 and Eemshaven, which run on biomass and hard coal, nearly doubled output. At Eemshaven, this was in part due to the station’s return to full availability after being damaged in a fire last year. Our German nuclear power plants also posted a rise thanks to a reduction in maintenance outages.
Volumes were adversely affected by the discontinuation of the commercial operation of the Ibbenbüren B (794 MW) and Westfalen E (764 MW) hard coal-fired power stations and the shutdown of the Niederaussem D (297 MW) lignite unit at the end of 2020. Electricity generation from our wind turbines declined by 5 %. Unfavourable wind conditions in Northern and Central Europe as well as in parts of the USA were the main reason. A positive effect was felt from the increase in our stake in the Rampion offshore wind farm (400 MW) in the UK from 30.1 % to 50.1 % as of 1 April 2021, resulting in its full consolidation in our accounts. Moreover, we commissioned a number of large onshore wind farms in the USA and started putting electricity into the grid from the Triton Knoll offshore wind farm (857 MW) in the UK, which is still under construction.
Power generation January – September
Renewables Pumped storage, batteries
Gas Lignite Hard coal Nuclear Total1
GWh 2021 2020 2021 2020 2021 2020 2021 2020 2021 2020 2021 2020 2021 2020
Offshore Wind 4,683 4,998 – – – – – – – – – – 4,683 4,998
Onshore Wind / Solar 11,823 12,107 – – – – – – – – – – 11,823 12,107
Hydro / Biomass / Gas 5,673 4,216 1,291 1,502 39,367 34,904 – – 5,110 2,244 – – 51,569 43,033
of which:
Germany2 1,445 1,415 1,291 1,502 4,573 6,313 – – – – – – 7,439 9,396
United Kingdom 367 388 – – 25,905 17,047 – – – – – – 26,272 17,435
Netherlands 3,824 2,396 – – 5,867 8,470 – – 5,110 2,244 – – 14,801 13,110
Turkey – – – – 3,022 3,074 – – – – – – 3,022 3,074
Coal / Nuclear2 15 14 – – 96 599 32,133 23,434 1,109 1,893 17,126 15,579 50,616 41,391
RWE Group 22,194 21,335 1,291 1,502 39,463 35,503 32,133 23,434 6,219 4,137 17,126 15,579 118,691 101,529
1Combined review of operationsBusiness performance
2Interim consolidated financial statements (condensed)
3Financial calendar 2021 / 2022
7

External revenue 41 % up year on year. Our external revenue grew by 41 % to €13,253 million (excluding natural gas tax / electricity tax). Revenue from our main product, electricity, totalled €11,103 million. This 35 % year-on-year increase was due to the rise in generation volumes and higher realised prices. Given that electricity from our power stations is largely sold externally by RWE Supply & Trading, the aforementioned factors were mainly reflected in revenue of the Supply & Trading segment. Our gas revenue more than tripled to €1,007 million. The main driver was the rise in wholesale gas prices to record levels during the year. Higher demand for gas in our key European markets driven by the economy and weather came to bear here. In addition, strong growth in demand for energy in Asia made imports of liquefied natural gas (LNG) to Europe much more expensive.
The percentage of consolidated revenue accounted for by coal-fired generation and other coal products is a key figure increasingly considered by sustainable investors. In the reporting period, this quota was 21 % (previous year: 24 %).
Power generation from renewables January – September
Offshore wind Onshore wind Solar Hydro Biomass Total
GWh 2021 2020 2021 2020 2021 2020 2021 2020 2021 2020 2021 2020
Germany 1,213 1,438 646 851 2 2 1,445 1,352 – 3 3,306 3,646
United Kingdom 3,333 3,383 1,093 1,554 – – 114 135 253 253 4,793 5,325
Netherlands – – 504 554 15 7 19 9 3,805 2,387 4,343 2,957
Poland – – 748 717 1 1 – – – – 749 718
Spain – – 661 611 80 36 26 24 – – 767 671
Italy – – 693 654 – – – – – – 693 654
Sweden 137 177 201 259 – – – – – – 338 436
USA – – 6,642 6,522 252 214 – – – – 6,894 6,736
Australia – – – – 153 22 – – – – 153 22
Rest of the world – – 16 21 72 32 70 117 – – 158 170
RWE Group 4,683 4,998 11,204 11,743 575 314 1,674 1,637 4,058 2,643 22,194 21,335
External revenue€ million
Jan – Sep 2021
Jan – Sep 2020
+/– Jan – Dec 2020
Offshore Wind 383 234 149 332
Onshore Wind / Solar 1,672 1,325 347 1,855
Hydro / Biomass / Gas 879 754 125 1,056
Supply & Trading 9,664 6,494 3,170 9,597
Other 3 8 – 5 9
Core business 12,601 8,815 3,786 12,849
Coal / Nuclear 652 577 75 839
RWE Group (excluding natural gas tax / electricity tax) 13,253 9,392 3,861 13,688
Natural gas tax / electricity tax 177 150 27 208
RWE Group 13,430 9,542 3,888 13,896
1Combined review of operationsBusiness performance
2Interim consolidated financial statements (condensed)
3Financial calendar 2021 / 2022
8

1 Some prior-year figures restated due to a change in the recognition of renewable energy tax benefits in the USA (see commentary on page 6).
Adjusted EBITDA up 6 % to €2.4 billion. In the first three quarters of 2021, we registered adjusted earnings before income taxes, depreciation and amortisation (adjusted EBITDA) of €2,397 million (previous year: €2,261 million). €1,677 million of this was attributable to our core business (previous year: €1,880 million) with the remaining €720 million coming from the Coal / Nuclear segment (previous year: €381 million). Adjusted EBITDA rose by 6 % compared to the first nine months of 2020. This was primarily due to the exceptional trading performance by RWE Supply & Trading. Moreover, we benefited from improved margins in power production from lignite and nuclear fuel. This was contrasted by significant one-off charges in the Onshore Wind / Solar segment due to an extreme cold snap in Texas this February, which resulted in unscheduled plant outages and forced us to fulfil existing electricity supply obligations through expensive purchases on the market.
Internal revenue € million
Jan – Sep 2021
Jan – Sep 2020
+/– Jan – Dec 2020
Offshore Wind 538 683 – 145 959
Onshore Wind / Solar 186 206 – 20 304
Hydro / Biomass / Gas 3,310 2,187 1,123 3,144
Supply & Trading 3,429 2,105 1,324 2,778
Other, consolidation – 6,789 – 4,852 – 1,937 – 6,803
Core business 674 329 345 382
Coal / Nuclear 2,910 2,135 775 3,075
Adjusted EBITDA1 € million
Jan – Sep 2021
Jan – Sep 2020
+/– Jan – Dec 2020
Offshore Wind 656 738 – 82 1,069
Onshore Wind / Solar 36 373 – 337 523
Hydro / Biomass / Gas 430 382 48 621
Supply & Trading 609 399 210 539
Other, consolidation – 54 – 12 – 42 – 25
Core business 1,677 1,880 – 203 2,727
Coal / Nuclear 720 381 339 559
RWE Group 2,397 2,261 136 3,286
External revenue by product€ million
Jan – Sep 2021
Jan – Sep 2020
+/– Jan – Dec 2020
Electricity revenue 11,103 8,195 2,908 11,701
of which:
Offshore Wind 382 234 148 332
Onshore Wind / Solar 1,538 1,222 316 1,676
Hydro / Biomass / Gas 577 484 93 684
Supply & Trading 8,405 6,084 2,321 8,775
Core business 10,902 8,024 2,878 11,468
Coal / Nuclear 201 171 30 233
Gas revenue 1,007 317 690 534
of which: Supply & Trading 1,006 313 693 529
Other revenue 1,143 880 263 1,453
RWE Group (excluding natural gas tax / electricity tax) 13,253 9,392 3,861 13,688
1Combined review of operationsBusiness performance
2Interim consolidated financial statements (condensed)
3Financial calendar 2021 / 2022
9
The following is a breakdown of earnings by segment:
• Offshore Wind: At €656 million, adjusted EBITDA posted here was markedly down on 2020 (€738 million) mainly because wind speeds in Northern and Central Europe were much lower than the high level witnessed a year before. A positive effect was felt from our acquisition of a majority interest in the Rampion offshore wind farm in the UK as of 1 April 2021 and its full consolidation since then. Furthermore, we benefited from the first feed-ins from the Triton Knoll offshore wind farm, which is scheduled for completion in early 2022.
• Onshore Wind / Solar: Adjusted EBITDA in this segment declined to €36 million (previous year: €373 million). The main reason was an extreme cold front in parts of the USA in February, which caused substantial supply outages. Winter storms and sleet forced some RWE wind farms in Texas to go offline for several days. We had sold forward a portion of the generation of these assets and therefore had to buy electricity in order to meet our supply obligations. Due to the tight supply situation and statutory price regulations, we had to pay up to US$9,000 / MWh for these purchases. This reduced earnings by approximately €400 million. Further burdens stemmed from lower overall wind speeds. Conversely, we benefited from the commissioning of new generation assets and the capital gain on the sale of stakes in the US wind farms Stella, Cranell, East Raymond and West Raymond (see page 3).
• Hydro / Biomass / Gas: Here, adjusted EBITDA totalled €430 million, surpassing last year’s comparable figure (€382 million). Two driving factors were increased payments we received from the British capacity market and additional income from the commercial optimisation of power plant deployment. A counteracting effect was felt from the divestment of wood pellet manufacturer Georgia Biomass in mid-2020, at which point the company stopped contributing to the Group’s earnings. Another negative effect came from the fact that earnings from electricity produced through biomass firing in the Netherlands fluctuate during the year due to the subsidy scheme and were thus unusually low in the period under review. We anticipate higher income from biomass usage for the year as a whole.
• Supply & Trading: Adjusted EBITDA posted by this segment amounted to €609 million, clearly exceeding the high level achieved in the same period last year (€399 million). Our exceptional trading performance and improved earnings in the gas business were the main reasons for this.
• Coal / Nuclear: Adjusted EBITDA recorded here improved to €720 million (previous year: €381 million). Increased wholesale margins on electricity from our lignite and nuclear power stations compared to 2020 were the main driver. We had sold forward nearly all of the generation of these assets in earlier years. The improved availability of our nuclear power plants also had a positive effect. This was contrasted by earnings shortfalls caused by unscheduled outages at our lignite-fired power stations. Furthermore, the implementation of the German Coal Phaseout Act weighed on earnings.
1Combined review of operationsBusiness performance
2Interim consolidated financial statements (condensed)
3Financial calendar 2021 / 2022
10

Adjusted EBIT 13 % up on prior year. The Group’s adjusted EBIT advanced by 13 % to €1,339 million (previous year: €1,182 million). This figure differs from adjusted EBITDA in that it does not include operating depreciation and amortisation, which amounted to €1,058 million in the period under review (previous year: €1,079 million).
1 Some prior-year figures restated due to a change in the recognition of renewable energy tax benefits in the USA (see commentary on page 6).
Reconciliation to net income: exceptional effects eclipse operating performance. The reconciliation from adjusted EBIT to net income was characterised by one-off effects, which had a positive net impact. We have presented the development of the items in the reconciliation statement in the following passages.
1 Some prior-year figures restated due to a change in the recognition of renewable energy tax benefits in the USA (see commentary on page 6).
Adjusted EBIT1 € million
Jan – Sep 2021
Jan – Sep 2020
+/– Jan – Dec 2020
Offshore Wind 325 461 – 136 697
Onshore Wind / Solar – 258 87 – 345 138
Hydro / Biomass / Gas 202 134 68 283
Supply & Trading 574 367 207 496
Other, consolidation – 53 – 13 – 40 – 25
Core business 790 1,036 – 246 1,589
Coal / Nuclear 549 146 403 234
RWE Group 1,339 1,182 157 1,823
Reconciliation to net income1
€ millionJan – Sep
2021Jan – Sep
2020+/– Jan – Dec
2020
Adjusted EBITDA 2,397 2,261 136 3,286
Operating depreciation, amortisation and impairment losses – 1,058 – 1,079 21 – 1,463
Adjusted EBIT 1,339 1,182 157 1,823
Non-operating result 2,050 1,161 889 – 104
Financial result 70 – 395 465 – 454
Income from continuing operations before tax 3,459 1,948 1,511 1,265
Taxes on income – 632 – 524 – 108 – 376
Income from continuing operations 2,827 1,424 1,403 889
Income from discontinued operations – 221 – 221 221
Income 2,827 1,645 1,182 1,110
of which:
Non-controlling interests 19 48 – 29 59
Net income / income attributable to RWE AG shareholders 2,808 1,597 1,211 1,051
1Combined review of operationsBusiness performance
2Interim consolidated financial statements (condensed)
3Financial calendar 2021 / 2022
11

The non-operating result, in which we recognise factors which are not related to operations or the period being reviewed, amounted to €2,050 million compared to €1,161 million in the same period last year. Its components developed as follows:
• Income from the disposal of investments and assets was immaterial, totalling €21 million. It primarily stemmed from the sale of small run-of-river power plants in France and Portugal (see page 3).
• At €2,142 million, effects on income from the valuation of derivatives and inventories were much stronger than last year (€1,271 million). Such effects are temporary. They are mainly due to the fact that, pursuant to IFRS, financial instruments used to hedge price risks are accounted for at fair value at the corresponding balance-sheet date, whereas the hedged underlying transactions are only recognised as a profit or loss when they are realised.
• Income reported in the ‘other’ line item totalled – €113 million (previous year: – €134 million). This reflected the inclusion of the statutory compensation claim of €880 million granted to us by the government for the German nuclear phaseout in our figures and the recognition of an impairment loss of €780 million for the lignite business on which we provide more detailed information on page 40 of the interim report on the first half of 2021.
Our financial result improved by €465 million to €70 million. In detail, the following changes occurred:
• Net interest decreased by €41 million to – €6 million in part due to a rise in interest expenses in relation to currency hedges and higher costs incurred to pledge collateral in commodity trading. Net interest includes the dividend on our 15 % stake in E.ON, which amounted to €186 million (previous year: €182 million).
• The interest accretion to non-current provisions reduced income by €100 million. The charges in the first nine months of 2020 were higher (– €186 million) because we had lowered the discount rate used to calculate mining provisions and recognised the resulting increase in the present value of the obligations in part as an expense in the interest accretion. There was no material effect of this kind in the first three quarters of 2021.
1 Some prior-year figures restated due to a change in the recognition of renewable energy tax benefits in the USA (see commentary on page 6).
Non-operating result1
€ millionJan – Sep
2021Jan – Sep
2020+/– Jan – Dec
2020
Disposal result 21 24 – 3 13
Effects on income from the valuation of derivatives and inventories 2,142 1,271 871 1,886
Other – 113 – 134 21 – 2,003
Non-operating result 2,050 1,161 889 – 104
Financial result € million
Jan – Sep 2021
Jan – Sep 2020
+/– Jan – Dec 2020
Interest income 238 266 – 28 283
of which: E.ON dividend 186 182 4 182
Interest expenses – 244 – 231 – 13 – 296
Net interest – 6 35 – 41 – 13
Interest accretion to non-current provisions – 100 – 186 86 – 255
of which: interest accretion to mining provisions – 76 – 143 67 – 186
Other financial result 176 – 244 420 – 186
Financial result 70 – 395 465 – 454
1Combined review of operationsBusiness performance
2Interim consolidated financial statements (condensed)
3Financial calendar 2021 / 2022
12

• The ‘other financial result’ increased by €420 million to €176 million, mainly due to interest claims relating to a tax refund for earlier assessment periods. Moreover, last year’s result was curtailed by a one-off effect: during the turmoil on the financial markets caused by the coronavirus pandemic, we suffered significant losses on investments in securities in March 2020.
Income from continuing operations before tax grew by €1,511 million to €3,459 million. Our effective tax rate dropped by 9 percentage points to 18 % predominantly due to the aforementioned tax refund for earlier years. A counteracting effect was felt from an increase in our deferred tax liabilities caused by the UK Parliament adopting a higher corporation tax rate with effect from 2023.
There was no income from discontinued operations in the current fiscal year. For the first nine months of last year, we disclosed an amount of €221 million, which came from our stake in Slovak energy utility VSE. The shareholding was sold to E.ON in August 2020.
Non-controlling interests in income decreased to €19 million (previous year: €48 million). The sale of our shareholding in VSE played a major role here as well: last year, the company’s co-owners were allocated a profit of €34 million.
The RWE Group’s net income totalled €2,808 million (previous year: €1,597 million). This corresponds to earnings per share of €4.15 (previous year: €2.56). The number of RWE shares outstanding, which is the basis for calculating this key figure, was 676.2 million. It rose by 61.5 million as a result of our capital increase in August 2020. In the first three quarters of last year, the average number of shares totalled 624.3 million.
Adjusted net income grows to €1,026 million. Adjusted net income amounted to €1,026 million (previous year: €794 million). It is calculated by deducting the non-operating result as well as major special items in the financial result from net income according to IFRS. Instead of the actual tax rate, we applied a rate of 15 %, which is oriented towards the expected medium-term tax burden. The positive development of adjusted net income resulted in part from the good operating earnings. Another factor was the significant improvement of the adjusted financial result compared to last year’s figure (– €231 million).
Reconciliation to adjusted net income January – September 2021 € million
Original figures
Adjustment Adjusted figures
Adjusted EBIT 1,339 – 1,339
Non-operating result 2,050 – 2,050 –
Financial result 70 – 179 – 109
Taxes on income – 632 447 – 185
Income 2,827 – 1,782 1,045
of which:
Non-controlling interests 19 – 19
Net income / income attributable to RWE AG shareholders 2,808 – 1,782 1,026
1Combined review of operationsBusiness performance
2Interim consolidated financial statements (condensed)
3Financial calendar 2021 / 2022
13
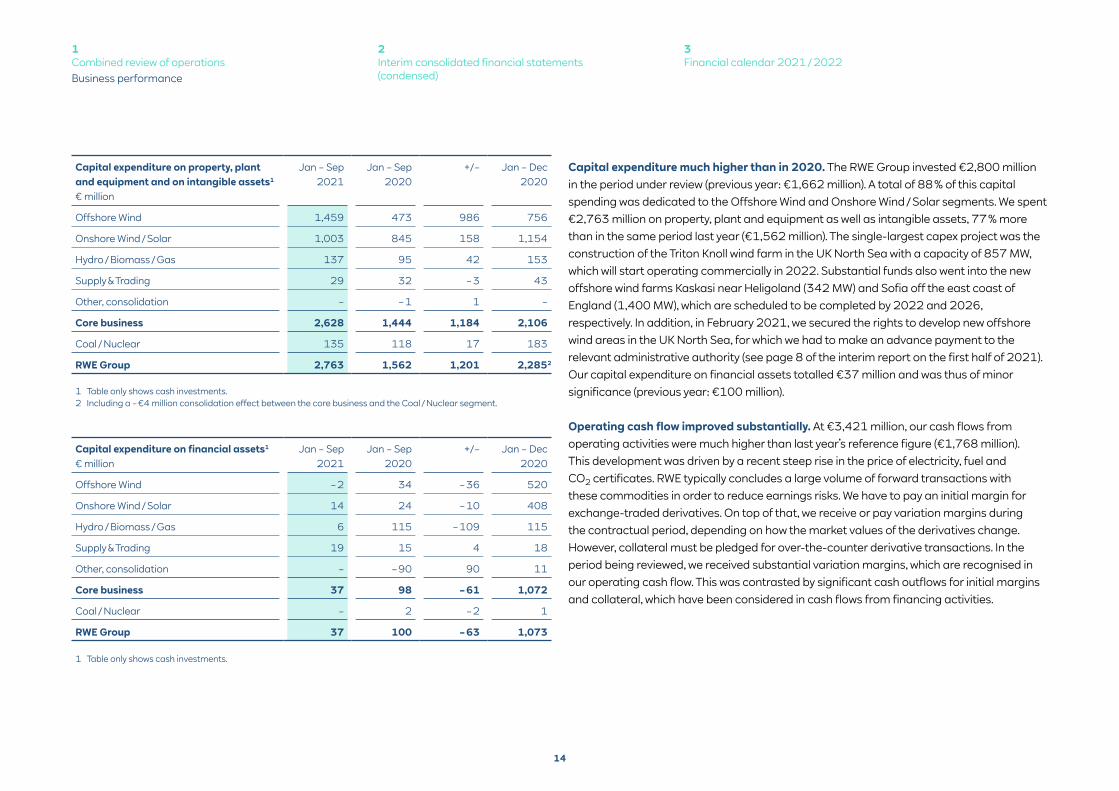
1 Table only shows cash investments.
1 Table only shows cash investments.2 Including a – €4 million consolidation effect between the core business and the Coal / Nuclear segment.
Capital expenditure much higher than in 2020. The RWE Group invested €2,800 million in the period under review (previous year: €1,662 million). A total of 88 % of this capital spending was dedicated to the Offshore Wind and Onshore Wind / Solar segments. We spent €2,763 million on property, plant and equipment as well as intangible assets, 77 % more than in the same period last year (€1,562 million). The single-largest capex project was the construction of the Triton Knoll wind farm in the UK North Sea with a capacity of 857 MW, which will start operating commercially in 2022. Substantial funds also went into the new offshore wind farms Kaskasi near Heligoland (342 MW) and Sofia off the east coast of England (1,400 MW), which are scheduled to be completed by 2022 and 2026, respectively. In addition, in February 2021, we secured the rights to develop new offshore wind areas in the UK North Sea, for which we had to make an advance payment to the relevant administrative authority (see page 8 of the interim report on the first half of 2021). Our capital expenditure on financial assets totalled €37 million and was thus of minor significance (previous year: €100 million).
Operating cash flow improved substantially. At €3,421 million, our cash flows from operating activities were much higher than last year’s reference figure (€1,768 million). This development was driven by a recent steep rise in the price of electricity, fuel and CO2 certificates. RWE typically concludes a large volume of forward transactions with these commodities in order to reduce earnings risks. We have to pay an initial margin for exchange-traded derivatives. On top of that, we receive or pay variation margins during the contractual period, depending on how the market values of the derivatives change. However, collateral must be pledged for over-the-counter derivative transactions. In the period being reviewed, we received substantial variation margins, which are recognised in our operating cash flow. This was contrasted by significant cash outflows for initial margins and collateral, which have been considered in cash flows from financing activities.
Capital expenditure on financial assets1
€ millionJan – Sep
2021Jan – Sep
2020+/– Jan – Dec
2020
Offshore Wind – 2 34 – 36 520
Onshore Wind / Solar 14 24 – 10 408
Hydro / Biomass / Gas 6 115 – 109 115
Supply & Trading 19 15 4 18
Other, consolidation – – 90 90 11
Core business 37 98 – 61 1,072
Coal / Nuclear – 2 – 2 1
RWE Group 37 100 – 63 1,073
Capital expenditure on property, plant and equipment and on intangible assets1
€ million
Jan – Sep 2021
Jan – Sep 2020
+/– Jan – Dec 2020
Offshore Wind 1,459 473 986 756
Onshore Wind / Solar 1,003 845 158 1,154
Hydro / Biomass / Gas 137 95 42 153
Supply & Trading 29 32 – 3 43
Other, consolidation – – 1 1 –
Core business 2,628 1,444 1,184 2,106
Coal / Nuclear 135 118 17 183
RWE Group 2,763 1,562 1,201 2,2852
1Combined review of operationsBusiness performance
2Interim consolidated financial statements (condensed)
3Financial calendar 2021 / 2022
14
1 All items solely relate to continuing operations; some prior-year figures restated due to a change in the recognition of renewable energy tax benefits in the USA (see commentary on page 6).
2 Including €17 million in cash and cash equivalents attributable to an asset group that is held for sale and is thus not considered in net debt.
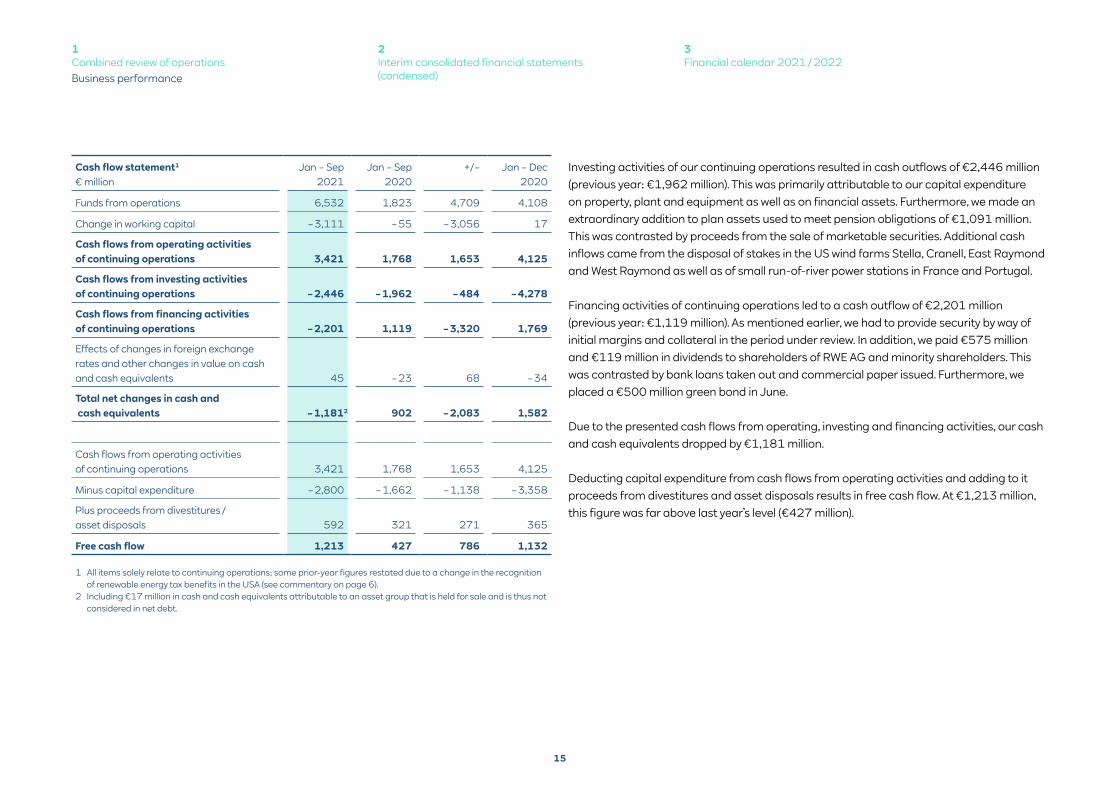
Investing activities of our continuing operations resulted in cash outflows of €2,446 million (previous year: €1,962 million). This was primarily attributable to our capital expenditure on property, plant and equipment as well as on financial assets. Furthermore, we made an extraordinary addition to plan assets used to meet pension obligations of €1,091 million. This was contrasted by proceeds from the sale of marketable securities. Additional cash inflows came from the disposal of stakes in the US wind farms Stella, Cranell, East Raymond and West Raymond as well as of small run-of-river power stations in France and Portugal.
Financing activities of continuing operations led to a cash outflow of €2,201 million (previous year: €1,119 million). As mentioned earlier, we had to provide security by way of initial margins and collateral in the period under review. In addition, we paid €575 million and €119 million in dividends to shareholders of RWE AG and minority shareholders. This was contrasted by bank loans taken out and commercial paper issued. Furthermore, we placed a €500 million green bond in June.
Due to the presented cash flows from operating, investing and financing activities, our cash and cash equivalents dropped by €1,181 million.
Deducting capital expenditure from cash flows from operating activities and adding to it proceeds from divestitures and asset disposals results in free cash flow. At €1,213 million, this figure was far above last year’s level (€427 million).
Cash flow statement1
€ millionJan – Sep
2021Jan – Sep
2020+/– Jan – Dec
2020
Funds from operations 6,532 1,823 4,709 4,108
Change in working capital – 3,111 – 55 – 3,056 17
Cash flows from operating activities of continuing operations 3,421 1,768 1,653 4,125
Cash flows from investing activities of continuing operations – 2,446 – 1,962 – 484 – 4,278
Cash flows from financing activities of continuing operations – 2,201 1,119 – 3,320 1,769
Effects of changes in foreign exchange rates and other changes in value on cash and cash equivalents 45 – 23 68 – 34
Total net changes in cash and cash equivalents – 1,1812 902 – 2,083 1,582
Cash flows from operating activities of continuing operations 3,421 1,768 1,653 4,125
Minus capital expenditure – 2,800 – 1,662 – 1,138 – 3,358
Plus proceeds from divestitures / asset disposals 592 321 271 365
Free cash flow 1,213 427 786 1,132
1Combined review of operationsBusiness performance
2Interim consolidated financial statements (condensed)
3Financial calendar 2021 / 2022
15
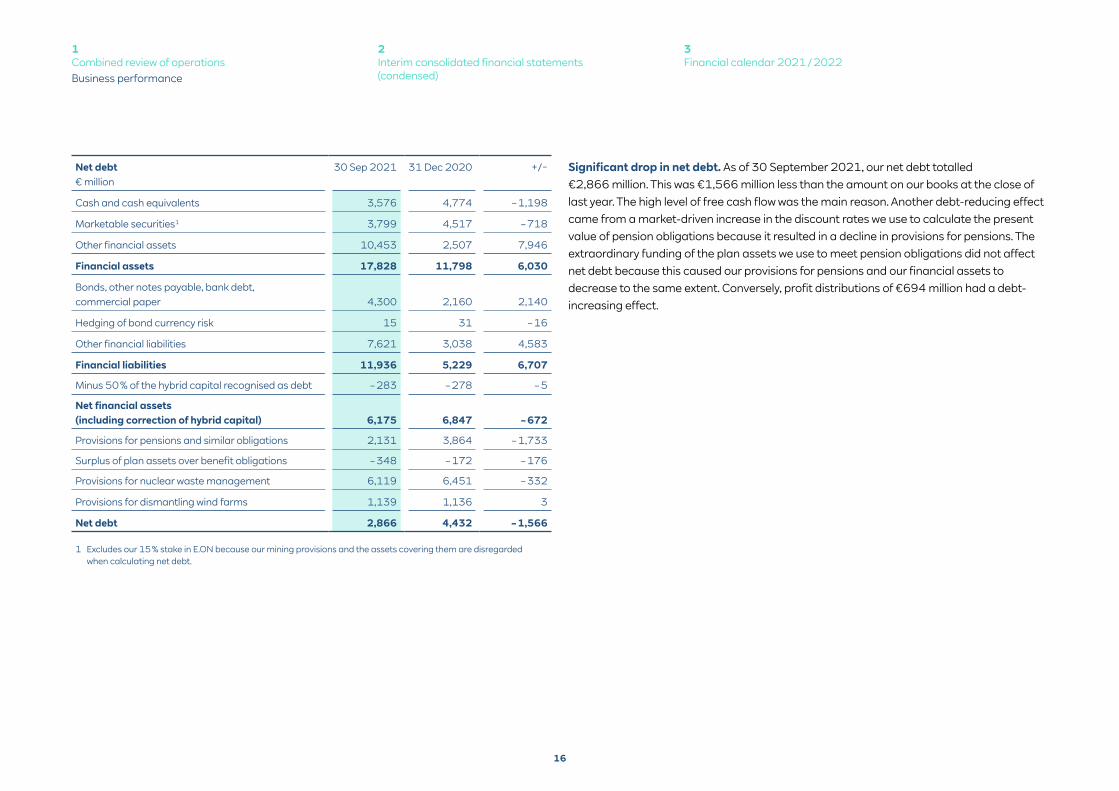
Significant drop in net debt. As of 30 September 2021, our net debt totalled €2,866 million. This was €1,566 million less than the amount on our books at the close of last year. The high level of free cash flow was the main reason. Another debt-reducing effect came from a market-driven increase in the discount rates we use to calculate the present value of pension obligations because it resulted in a decline in provisions for pensions. The extraordinary funding of the plan assets we use to meet pension obligations did not affect net debt because this caused our provisions for pensions and our financial assets to decrease to the same extent. Conversely, profit distributions of €694 million had a debt-increasing effect.
1 Excludes our 15 % stake in E.ON because our mining provisions and the assets covering them are disregarded when calculating net debt.
Net debt€ million
30 Sep 2021 31 Dec 2020 + /−
Cash and cash equivalents 3,576 4,774 – 1,198
Marketable securities1 3,799 4,517 – 718
Other financial assets 10,453 2,507 7,946
Financial assets 17,828 11,798 6,030
Bonds, other notes payable, bank debt, commercial paper 4,300 2,160 2,140
Hedging of bond currency risk 15 31 – 16
Other financial liabilities 7,621 3,038 4,583
Financial liabilities 11,936 5,229 6,707
Minus 50 % of the hybrid capital recognised as debt – 283 – 278 – 5
Net financial assets (including correction of hybrid capital) 6,175 6,847 – 672
Provisions for pensions and similar obligations 2,131 3,864 – 1,733
Surplus of plan assets over benefit obligations – 348 – 172 – 176
Provisions for nuclear waste management 6,119 6,451 – 332
Provisions for dismantling wind farms 1,139 1,136 3
Net debt 2,866 4,432 – 1,566
1Combined review of operationsBusiness performance
2Interim consolidated financial statements (condensed)
3Financial calendar 2021 / 2022
16

Outlook for 2021
Forecast € million
2020 actual1 Current outlook
Adjusted EBITDA 3,286 3,000 – 3,400
of which:
Core business 2,727 2,150 – 2,550
of which:
Offshore Wind 1,069 1,050 – 1,250
Onshore Wind / Solar 523 50 – 250
Hydro / Biomass / Gas 621 500 – 600
Supply & Trading 539 Significantly above 350
Coal / Nuclear 559 800 – 900
Adjusted EBIT 1,823 1,500 – 1,900
Adjusted net income 1,257 1,050 – 1,400
RWE confirms earnings forecast. Our outlook on earnings for the current fiscal year is identical to the one we published in mid-August on page 25 of the interim report on the first half of 2021. Therefore, we still expect to outperform our March forecast (see pages 67 et seq. of the 2020 Annual Report). We anticipate that the Group will post adjusted EBITDA of between €3,000 million and €3,400 million, with €2,150 million to €2,550 million coming from the core business. Our earnings forecast is summarised in the table above.
1 Some figures restated due to a change in the recognition of renewable energy tax benefits in the USA (see commentary on page 6).
Capital expenditure on property, plant and equipment up on 2020. We also uphold our forecast in relation to capital spending. Capital expenditure on property, plant and equipment and intangible assets will be much higher than in 2020 (€2,285 million). Focal points of investment are wind and solar projects in the USA and Europe. We plan to invest €200 million to €300 million outside the core business in the Coal / Nuclear segment. This expenditure has primarily been earmarked to maintain our power plants and opencast mines.
Leverage factor: RWE will remain below 3.0 cap. An important indicator of our financial strength is the ratio of net debt to the adjusted EBITDA of our core business, also referred to as the leverage factor. We set the upper limit for this key figure at 3.0, which we also expect to comply with in 2021.
Dividend target: €0.90 per share. The Executive Board of RWE AG aims to pay a dividend of €0.90 per share for fiscal 2021. This represents an increase of €0.05 relative to the dividend for 2020, reflecting the bright earnings prospects of our core business.
1Combined review of operationsOutlook for 2021
2Interim consolidated financial statements (condensed)
3Financial calendar 2021 / 2022
17
Interim consolidated financial statements (condensed)Income statement
€ million Jul – Sep 2021 Jul – Sep 20201 Jan – Sep 2021 Jan – Sep 20201
Revenue (including natural gas tax / electricity tax) 4,855 2,963 13,430 9,542
Natural gas tax / electricity tax – 50 – 46 – 177 – 150
Revenue2 4,805 2,917 13,253 9,392
Cost of materials – 3,909 – 1,615 – 10,239 – 5,262
Staff costs – 656 – 517 – 1,872 – 1,647
Depreciation, amortisation and impairment losses – 362 – 388 – 1,872 – 1,122
Other operating result 2,114 92 3,767 712
Income from investments accounted for using the equity method 60 76 200 256
Other income from investments – 36 3 152 14
Financial income 167 622 1,314 1,584
Finance costs – 246 – 713 – 1,244 – 1,979
Income from continuing operations before tax 1,937 477 3,459 1,948
Taxes on income – 529 – 53 – 632 – 524
Income from continuing operations 1,408 424 2,827 1,424
Income from discontinued operations 171 221
Income 1,408 595 2,827 1,645
of which: non-controlling interests 32 11 19 48
of which: net income / income attributable to RWE AG shareholders 1,376 584 2,808 1,597
Basic and diluted earnings per share in € 2.03 0.91 4.15 2.56
of which: from continuing operations in € 2.03 0.65 4.15 2.26
of which: from discontinued operations in € 0.26 0.30
1 Some prior-year figures restated due to a retroactive change in the recognition of renewable energy tax benefits in the USA (see commentary on page 6).2 A presentation of revenue by product and segment can be found on pages 8 et seq.
1Combined review of operations
2Interim consolidated financial statements (condensed)Income statement
3Financial calendar 2021 / 2022
18

Statement of comprehensive income
Amounts after tax – € million Jul – Sep 2021 Jul – Sep 20201 Jan – Sep 2021 Jan – Sep 20201
Income 1,408 595 2,827 1,645
Actuarial gains and losses of defined benefit pension plans and similar obligations 22 – 479 827 – 376
Income and expenses of investments accounted for using the equity method (pro rata) – 1 – 2 – 27
Fair valuation of equity instruments 309 – 91 609 21
Income and expenses recognised in equity, not to be reclassified through profit or loss 331 – 571 1,434 – 382
Currency translation adjustment – 15 84 86 – 439
Fair valuation of debt instruments – 5 10 – 17 7
Fair valuation of financial instruments used for hedging purposes – 6,226 – 424 – 5,142 – 146
Income and expenses of investments accounted for using the equity method (pro rata) 2 13 – 2
Income and expenses recognised in equity, to be reclassified through profit or loss in the future – 6,244 – 330 – 5,060 – 580
Other comprehensive income – 5,913 – 901 – 3,626 – 962
Total comprehensive income – 4,505 – 306 – 799 683
of which: attributable to RWE AG shareholders – 4,540 – 317 – 883 671
of which: attributable to non-controlling interests 35 11 84 12
1 Some prior-year figures restated due to a retroactive change in the recognition of renewable energy tax benefits in the USA (see commentary on page 6).
1Combined review of operations
2Interim consolidated financial statements (condensed)Statement of comprehensive income
3Financial calendar 2021 / 2022
19

Balance sheet
Assets 30 Sep 2021 31 Dec 20201 1 Jan 20202
€ million
Non-current assets
Intangible assets 5,840 4,899 4,777
Property, plant and equipment 19,832 17,902 19,016
Investments accounted for using the equity method 2,881 3,276 3,252
Other non-current financial assets 4,964 4,237 4,337
Receivables and other assets 3,968 3,707 3,668
Deferred taxes 702 397 680
38,187 34,418 35,730
Current assets
Inventories 5,564 1,632 1,585
Trade accounts receivable 4,485 3,007 3,621
Receivables and other assets 89,878 12,531 15,310
Marketable securities 3,506 4,219 3,258
Cash and cash equivalents 3,576 4,774 3,192
Assets held for sale 427 1,061 1,274
107,436 27,224 28,240
145,623 61,642 63,970
1 Some prior-year figures restated due to a retroactive change in the recognition of renewable energy tax benefits in the USA (see commentary on page 6) and retroactive adjustments to the first-time consolidation of operations which RWE acquired from Nordex in 2020; information on the transaction with Nordex is presented on pages 43 and 110 of the 2020 Annual Report.
2 Some prior-year figures restated due to a retroactive change in the recognition of renewable energy tax benefits in the USA (see commentary on page 6) and retroactive adjustments to the first-time consolidation of the acquired E.ON operations (see commentary on pages 108 et seq. of the 2020 Annual Report).
1Combined review of operations
2Interim consolidated financial statements (condensed)Balance sheet
3Financial calendar 2021 / 2022
20

Equity and liabilities 30 Sep 2021 31 Dec 20201 1 Jan 20202
€ million
Equity
RWE AG shareholders’ interest 14,836 16,916 16,617
Non-controlling interests 1,822 790 502
16,658 17,706 17,119
Non-current liabilities
Provisions 17,087 19,470 18,937
Financial liabilities 5,214 3,951 3,924
Other liabilities 2,279 2,152 2,144
Deferred taxes 1,249 1,862 2,197
25,829 27,435 27,202
Current liabilities
Provisions 3,531 3,004 2,638
Financial liabilities 6,707 1,247 1,689
Trade accounts payable 3,698 2,387 2,987
Other liabilities 89,108 9,282 11,825
Liabilities held for sale 92 581 510
103,136 16,501 19,649
145,623 61,642 63,970
1 Some prior-year figures restated due to a retroactive change in the recognition of renewable energy tax benefits in the USA (see commentary on page 6) and retroactive adjustments to the first-time consolidation of operations which RWE acquired from Nordex in 2020; information on the transaction with Nordex is presented on pages 43 and 110 of the 2020 Annual Report.
2 Some prior-year figures restated due to a retroactive change in the recognition of renewable energy tax benefits in the USA (see commentary on page 6) and retroactive adjustments to the first-time consolidation of the acquired E.ON operations (see commentary on pages 108 et seq. of the 2020 Annual Report).
1Combined review of operations
2Interim consolidated financial statements (condensed)Balance sheet
3Financial calendar 2021 / 2022
21

Cash flow statement
€ million Jan – Sep 2021 Jan – Sep 20201
Income from continuing operations 2,827 1,424
Depreciation, amortisation and impairment losses / write-backs 1,751 1,072
Changes in provisions 28 – 232
Deferred taxes / non-cash income and expenses / income from disposal of non-current assets and marketable securities 1,926 – 441
Changes in working capital – 3,111 – 55
Cash flows from operating activities of continuing operations 3,421 1,768
Cash flows from operating activities of discontinued operations 50
Cash flows from operating activities 3,421 1,818
Cash flows from investing activities of continuing operations2 – 2,446 – 1,962
Cash flows from investing activities of discontinued operations – 76
Cash flows from investing activities – 2,446 – 2,038
Cash flows from financing activities of continuing operations – 2,201 1,119
Cash flows from financing activities of discontinued operations 7
Cash flows from financing activities – 2,201 1,126
Net cash change in cash and cash equivalents – 1,226 906
Effect of changes in foreign exchange rates and other changes in value on cash and cash equivalents 45 – 23
Net change in cash and cash equivalents – 1,181 883
Cash and cash equivalents at beginning of reporting period 4,774 3,212
of which: reported as ‘Assets held for sale’ 20
Cash and cash equivalents at beginning of reporting period as per the consolidated balance sheet 4,774 3,192
Cash and cash equivalents at end of reporting period 3,593 4,095
of which: reported as ‘Assets held for sale’ 17
Cash and cash equivalents at end of reporting period as per the consolidated balance sheet 3,576 4,095
1 Some prior-year figures restated due to a retroactive change in the recognition of renewable energy tax benefits in the USA (see commentary on page 6).2 After an extraordinary transfer to plan assets in the amount of €1,091 million (prior-year period: €97 million).
1Combined review of operations
2Interim consolidated financial statements (condensed)Cash flow statement
3Financial calendar 2021 / 2022
22

Financial calendar 2021 / 2022
RWE AktiengesellschaftRWE Platz 145141 EssenGermany
www.rwe.com
15 November 2021 Capital Market Day
15 March 2022 Annual report for fiscal 2021
28 April 2022 Annual General Meeting
29 April 2022 Ex-dividend date
03 May 2022 Dividend payment
12 May 2022 Interim statement on the first quarter of 2022
11 August 2022 Interim report on the first half of 2022
10 November 2022 Interim statement on the first three quarters of 2022
This document was published on 11 November 2021. It is a translation of the German interim statement on the first three quarters of 2021. In case of divergence the German version shall prevail. All events concerning the publication of our financial reports and the Annual General Meeting are broadcast live on the internet and recorded. We will keep the recordings on our website for at least twelve months.