Embed Size (px)
Citation preview

CONSISTENTLY DELIVERING
®
Interim results for the six months ended 31 August 2019
JHB presentation: 31 October 2019
CPT presentation: 4 November 2019

Afrimat interim results presentation for the six months ended 31 August 2019
Afrimat
2
▪ Track record of excellence in small scale mining and materials supply
▪ Delivered exceptional results supported by a diversification strategy, cost reductions and efficiency improvement initiatives

Afrimat interim results presentation for the six months ended 31 August 2019
Summary of the period
3
Period-on-period operating profit
Construction Materials
6,5%
Bulk Commodities
176,2%
Net cash from operations
192,1% to R425,0m
Net debt:equity ratio
9,4% (Aug 2018: 35,7%)
Industrial Minerals
50,4%
Cash utilised to pay down debt
Aug 2019 vs Aug 2018

Afrimat interim results presentation for the six months ended 31 August 2019
Balanced portfolio at work
4
54%
17%
29%
2019
Construction Materials
Industrial Minerals
Bulk Commodities
Revenue Operating profit
38%
19%
43%
2019

Afrimat final results presentation for the year ended 28 February 2019
Operational overview
Overview
5

Afrimat interim results presentation for the six months ended 31 August 2019
Diversified portfolio and footprintwhich generates a balanced, consistent income stream
Northern Cape 1
Western Cape27
Eastern Cape1
KwaZulu-Natal 17
Mpumalanga 4
Limpopo Mozambique 2
Gauteng 3
1
Free State 7
South AfricaBulk Commodities
2
4
3
6
1 Iron ore and manganese mine
Construction Materials
25 Commercial quarries
6 Sand & gravel mines
4 Clinker sources
Mobile crushing & screening
Drilling & blasting
9 Concrete brick & block factories
22 Readymix batching sites
Industrial Minerals
2 Limestone mines
2 Dolomite mines
1 Silica mine

Afrimat interim results presentation for the six months ended 31 August 2019
Segmental makeup
7
• Aggregates
• Contract crushing, drilling and
blasting
• Concrete products
• Readymix
• Limestone
• Dolomite
• Silica
• Iron Ore
Construction
MaterialsIndustrial
Minerals
Bulk
Commodities

Afrimat interim results presentation for the six months ended 31 August 2019 8
Revenue
870 923
-
200
400
600
800
1 000
Aug '18 Aug '19
R’m
illio
n
• Revenue increased by 6,1%
• Despite slowdown in activities, KZN improved
• Aggregates Western Cape did well
• Market stabilised : green shoots
Operating profit and margin
115 122 -
200
400
600
800
1 000
Aug '18 Aug '19R
’mill
ion
13,2% 13,2%
• Operating profit increased by 6,5%
• Operating profit margin flat
• Internal efficiency drive bearing fruit
Solid results in a tough environment
Construction Materials

Afrimat interim results presentation for the six months ended 31 August 2019 9
▪ 53,7% of revenue
▪ 38,4% of operating profit
▪ Continue to supply materials in Mozambique
▪ Good recovery expected from Mozambique
▪ Recovery continues
Construction Materials

Afrimat interim results presentation for the six months ended 31 August 2019 10
Revenue Operating profit and margin
284 299
-
100
200
300
400
500
600
700
800
900
1 000
Aug '18 Aug '19
R’m
illio
n
• Revenue increased by 5,2%
• Entered new markets
• Increased activity
41
62
-
10
20
30
40
50
60
70
80
90
100
Aug '18 Aug '19R
’mill
ion
20,9%
• Operating profit increased by 50,4%
• Operating profit margin increased
• Successful product development
• Efficiency initiatives pay off
14,6%
Industrial Minerals
Strong results across all regions, entering new markets

Afrimat interim results presentation for the six months ended 31 August 2019 11
▪ 17,4% of revenue
▪ 19,6% of operating profit
▪ Delivered strong results
▪ Entered new markets
Industrial Minerals

Afrimat interim results presentation for the six months ended 31 August 2019 12
Revenue Operating profit and margin
280
498
-
100
200
300
400
500
600
700
800
900
1 000
Aug '18 Aug '19
R’m
illio
n
• Revenue increased by 77,5%
• Increase in iron ore volumes
• Favourable pricing
50 138
-
50
100
150
200
250
300
350
400
450
500
Aug '18 Aug '19R
’mill
ion
27,8%
• Operating profit increased by 176,2%
• Operating profit margin increased
17,9%
Bulk Commodities
Excellent results on favourable market conditions

Afrimat interim results presentation for the six months ended 31 August 2019
▪ Exceptional contribution to group
▪ 28,9% of revenue
▪ 43,5% of operating profit
▪ Load out facility completed
▪ Transnet rail line stable
▪ Increased production volumes
Bulk Commodities
13

Afrimat final results presentation for the year ended 28 February 2019
Operational overview
Financial review
14

Afrimat interim results presentation for the six months ended 31 August 2019
Core financial achievements
15
Strong cash
generation used
to pay down
debt
Ability to instantly
adjust to market
signals picked up
by information
systems
Excellent results
on the back of
good overall
performance

Afrimat interim results presentation for the six months ended 31 August 2019
Financial overview
16
Group revenue
increased to
R1,7bn
19,9% 18,5%
Operating profit
margin
9,4%
Net debt:equity
ratio
improvement
from 35,7%
94,3%
HEPS increased
to 181,9 cents
89,5%
Interim dividend
per share of
36,0cps
32,3%
Return on net
operating assets

Afrimat interim results presentation for the six months ended 31 August 2019
Operating profit (R’000)
Financial overview
17
1 0
03 2
37
1 1
53 2
58
1 1
84 5
92
1 4
34 8
50
1 7
19 8
029
66 5
49
1 0
74 8
99
1 1
96 4
02
1 5
31 5
49
0
500 000
1 000 000
1 500 000
2 000 000
2 500 000
3 000 000
3 500 000
2016 2017 2018 2019 2020
1st half 2nd half
159 6
23
206 1
52
194 2
44
202 6
69 3
17 9
93
160 7
65 2
03 4
92
157 2
94
268 4
83
0
50 000
100 000
150 000
200 000
250 000
300 000
350 000
400 000
450 000
500 000
2016 2017 2018 2019 2020
1st half 2nd half
19,9%
56,9%
Co
ntr
ibu
tion f
rom
op
era
tions m
arg
in 1
8,5
% (
20
18
: 1
4,1
%)
Revenue (R’000)
Revenue and operating profit
Afrimat interim results presentation for the six months ended 31 August 2019

Afrimat interim results presentation for the six months ended 31 August 2019
38%
19%
43%
2019
Contribution from operations
18
61%20%
19%
201854%
17%
29%
2019
Construction Materials
Industrial Minerals
Bulk Commodities
Revenue
56%
20%
24%
2018Operating
profit

Afrimat interim results presentation for the six months ended 31 August 2019
Headline earnings per share - interimC
en
ts p
er
sh
are
61,176,0
95,2 102,293,6
181,9
0,0
20,0
40,0
60,0
80,0
100,0
120,0
140,0
160,0
180,0
200,0
2014 2015 2016 2017 2018 2019
5-yr CAGR 24,4%
(2014 - 2019)
19

Afrimat interim results presentation for the six months ended 31 August 2019
Net cash from operating activities
74 374 98 938
113 748
79
51
0
145 505
425 000
-
50 000
100 000
150 000
200 000
250 000
300 000
350 000
400 000
450 000
2014 2015 2016 2017 2018 2019
120 100
192,1%
20
5-yr CAGR of
41,7%
2014 - 2019
R’0
00

Afrimat interim results presentation for the six months ended 31 August 2019
Statement of financial position - assets
R’000Unaudited
Aug 2019
Unaudited
Aug 2018
Audited
Feb 2019
Property, plant and equipment 1 514 283 1 451 475 1 469 837
Mining rights and goodwill 221 065 243 173 221 873
Inventories 258 409 289 498 261 249
Trade and other receivables 426 516 432 707 435 458
Cash 156 850 164 945 191 763
Other assets / BEE funding 108 834 120 191 106 832
2 685 957 2 701 989 2 687 012
21

Afrimat interim results presentation for the six months ended 31 August 2019
Statement of financial position - equities & liabilities
R’000Unaudited
Aug 2019
Unaudited
Aug 2018
Audited
Feb 2018
Total equity 1 549 246 1 286 556 1 409 517
Borrowings 259 186 463 874 383 546
Provisions 147 232 135 782 141 080
Overdraft 34 381 148 496 134 153
Trade and other payables 469 444 444 844 390 517
Other liabilities / deferred tax 226 468 222 437 228 199
2 685 957 2 701 989 2 687 012
Net debt less cash:equity 9,4%
22

Afrimat interim results presentation for the six months ended 31 August 2019
Capital expenditure
23
F2019
▪ General maintenance
▪ Additional fixed plant at
Demaneng of R36,9 million
Planned
F2020
H1: R115,8 m
H2: R 91,7 m
R207,5 m
H1: R100,1 m
H2: R149,4 m
R249,5 m

Afrimat interim results presentation for the six months ended 31 August 2019
Dividend payment
Cen
ts p
er
sh
are
13
16
20 20 19
36
-
5
10
15
20
25
30
35
40
2014 2015 2016 2017 2018 2019
89,5%
Interim dividend – 2,75x cover
5-yr CAGR of
22,6%
2014 - 2019
Record date:
Fri 29 Nov 2019
Dividend payment
Mon 2 Dec 2019
24

Afrimat interim results presentation for the six months ended 31 August 2019
Iron ore provisions
▪ Iron ore invoice on average price of previous month
▪ Cash received after 30 days
▪ Prices reconciled after 3 months with cash adjustment
▪ Provisions made at end August:
- Platts price assumption: June sales $84/t
July sales $81/t
August sales $79/t
- Lumpy premium: $0,14/dmtu
- Shipping: $17,22/t
25

Afrimat final results presentation for the year ended 28 February 2019
Operational overview
Operating market
26

Afrimat interim results presentation for the six months ended 31 August 2019
Our market
Purposeful exposure to sectors with economic fundamentals
that suit the Afrimat business model, to prosper
27
Afrimat interim results presentation for the six months ended 31 August 2019
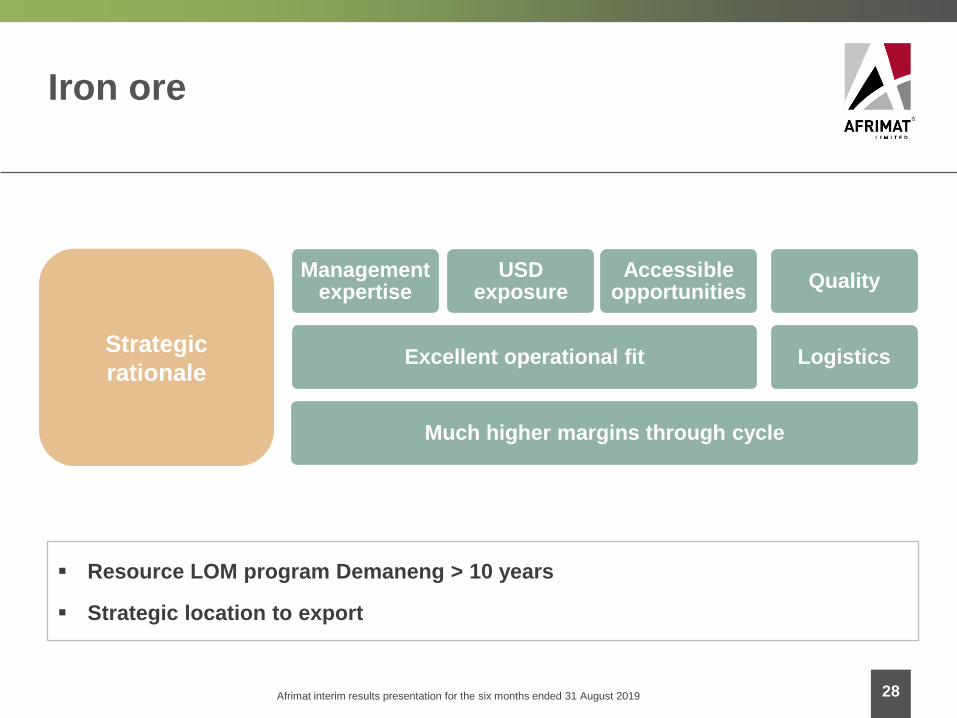
Iron ore
28
Much higher margins through cycle
Excellent operational fit
Management expertise
USD exposure
Accessible opportunities
Logistics
Quality
Strategic
rationale
▪ Resource LOM program Demaneng > 10 years
▪ Strategic location to export
Afrimat interim results presentation for the six months ended 31 August 2019

29
0
0,05
0,1
0,15
0,2
0,25
0,3
0,35
0,4
0,45
0
20
40
60
80
100
120
140
01-Apr-15
01-Jun-15
01-Aug-15
01-Oct-15
01-Dec-15
01-Feb-16
01-Apr-16
01-Jun-16
01-Aug-16
01-Oct-16
01-Dec-16
01-Feb-17
01-Apr-17
01-Jun-17
01-Aug-17
01-Oct-17
01-Dec-17
01-Feb-18
01-Apr-18
01-Jun-18
01-Aug-18
01-Oct-18
01-Dec-18
01-Feb-19
01-Apr-19
01-Jun-19
01-Aug-19
01-Oct-19
Historical Index Pricing
62% Lump Premium
Iron ore
Afrimat interim results presentation for the six months ended 31 August 2019

Afrimat interim results presentation for the six months ended 31 August 2019
Iron ore sales by rail
30
22 7
15
28 6
29
26 8
13
30 6
43
30 2
82
45 7
43
45 3
92
45 2
25
45 7
58 57 1
72
65 2
44
58 4
63
75 2
81
53 3
95 65 0
04
64 9
82
41 4
70
64 1
75
70 7
94
64 8
93
64 8
52
67 8
63
67 8
11
68 3
84
102 8
28
68 7
85
0
20 000
40 000
60 000
80 000
100 000
120 000
Au
g-1
7
Sep
-17
Oct-
17
No
v-1
7
De
c-1
7
Ja
n-1
8
Feb
-18
Ma
r-18
Ap
r-18
Ma
y-1
8
Ju
n-1
8
Ju
l-18
Au
g-1
8
Sep
-18
Oct-
18
No
v-1
8
De
c-1
8
Ja
n-1
9
Feb
-19
Ma
r-19
Ap
r-19
Ma
y-1
9
Ju
n-1
9
Ju
l-19
Au
g-1
9
Sep
-19
Sales (tons)
(*) Planned Transnet maintenance shut down
*
Stable monthly sales expected to settle at an average of 72,500

31
Afrimat Construction Index – 2nd quarter 2019
Afrimat interim results presentation for the six months ended 31 August 2019

Afrimat interim results presentation for the six months ended 31 August 2019
Industrial minerals: the market
32
▪ Glass
− Bottles
− Windscreens
− Plate glass
▪ Metallurgical
− Alloys
− Chrome
− Steel
− Foundries
▪ Chemical
▪ Water treatment
− Drinking water
− Acid mine drainage
▪ Industrial powders and fillers
− Fire retardants
− Paints
− Tiles and tile adhesives
− Grout fillers
▪ Agriculture
− Soil pH stabilisation
− Animal hygiene

Afrimat final results presentation for the year ended 28 February 2019
Operational overview
Looking forward
33

Afrimat interim results presentation for the six months ended 31 August 2019
▪ Continuous improvement
▪ Commodities: expanding resource base
▪ Industrial Minerals: many good opportunities
▪ Mozambique and other
▪ Green shoots in economy starting to show
▪ Build on entrepreneurial culture
Our strategy
34Afrimat interim results presentation for the six months ended 31 August 2019

Afrimat interim results presentation for the six months ended 31 August 2019
How to assess Afrimat
35
Efficient hedge(against volatile local business
conditions)
Strength of
management
Moat(geographic locations, unique
metallurgy & structural cost advantage)
Cash generative | free
cash flow focus
Operational
diversification
Dividend
payer(2,7 x cover)
Scalability reduces
cyclicality(protects against commodity price
fluctuations)
Rand hedge(Iron ore & Mozambique)

Afrimat interim results presentation for the six months ended 31 August 2019
Experience has taught us
▪ Value = weakest link in value chain
▪ Expect the unexpected
▪ Only the best people are good enough
▪ Don’t trust the spreadsheet
▪ Don’t sail too close to the wind
▪ Cash is king – make it back soon
▪ DO NOT OVERPAY
36

Afrimat interim results presentation for the six months ended 31 August 2019
People development and transformation
37

38
Thank you for your attendance and participation
For any further investor relations questions please contact:
Andries van Heerden | CEO 021 917 8853
Vanessa Rech | Keyter Rech Investor Solutions 087 351 3814
www.afrimat.co.za