Embed Size (px)
Citation preview
"This report is used to ensure prompt dissemination of preliminary results, interim reports, and special studies to the scientific community. The material is not ready for formal publication since the paper may later be published in a modified form to include more recent information or research results. Abstracting, citing, or reproduction of this information is not allowed. Contact author if additional information is required."
i
MINUTES OF THE 2002 TRINATIONAL SARDINE FORUM San Pedro California USA
December 5-6 20021
John Hunter Southwest Fisheries Science Center
National Marine Fisheries Service, NOAA La Jolla, CA 92038
Diane Pleschner-Steele
DB Pleschner & Associates P.O. Box 336
Buellton, CA 93427
MARCH 2003
ADMINISTRATIVE REPORT LJ-03-05
1Document may be cited as:
2003. J. Hunter and D. Pleschner-Steele (Editors). Minutes of the Third Trinational Sardine Forum, San Pedro California USA, December 5-6, 2002, SWFSC Administrative Report LJ-03-05, 50 pp.

1
This page intentionally left blank.
i
TABLE OF CONTENTS
INTRODUCTION ................................................................................................................................. 1 PLENARY SESSION HIGHLIGHTS................................................................................................... 1 Landings in Canada and the Pacific Northwest ............................................................................... 1 California Landings and US Stock Assessment............................................................................... 2 Mexican Landings and Assessments ............................................................................................... 2 Viral Hemorrhagic Septicemia Virus (VHSV) Disease in the Pacific Sardine ............................... 3 Latitudinal Allocation of Sardine Quota in the US.......................................................................... 4 INDUSTRY PANEL DISCUSSION ..................................................................................................... 5 TRINATIONAL SARDINE FORUM WEB SITE................................................................................ 6 NEXT TRINATIONAL MEETING...................................................................................................... 6 CONCLUDING REMARKS BY THE CHAIRS .................................................................................. 6 WORKING GROUP REPORTS ........................................................................................................... 7 Working Group 1: Adult Sampling/Sardine Ageing Workshop..................................................... 7 Working Group 2: Regional Estimates of Biomass in 2002 and Recommendations for Future Activities ........................................................................................ 9 Working Group 3: 2002 Tri-National Sardine Meeting, Working Group Stock Structure and Latitudinal Origins plus VHSV Disease sampling strategies ....................................................................................................... 21 APPENDICIES
Appendix I: Participant List .................................................................................................... 29 Appendix II: Meeting Agenda .................................................................................................. 35 Appendix III: Acronyms ............................................................................................................ 37 Appendix IV: Contributed abstracts and summaries.................................................................. 3 9 Stock Assessment of Pacific Sardine with Management Recommendations for 2003 Executive Summary – Conser et al. (2002).... 41 Biological and Political Implications of the Detection of Viral Hemorrhagic Septicemia Virus (VHSV) in California Sardines – Hedrick et al. ............................................................................................... 53

ii
This page intentionally left blank.
1
INTRODUCTION The 2002 Trinational Sardine Forum was held in San Pedro, California, December 5-6, 2002, in a meeting room in the headquarters of the Southern California Commercial Fishing Association, (SCCFA, an association of the southern California purse seine fishing fleet). The meeting was attended by 51 registered participants representing sardine fishing and processing industries, marine resource agencies, and academic scientists from Canada, US and Mexico (Appendix 1). The meeting was supported in part by contributions from SCCFA, southern California processor members of the California Wetfish Producers Association (CWPA), IAI, and NMFS (SWFSC). The meeting opened with presentations on current year landings in Canada, US and Mexico, and the US sardine stock assessment for 2002 (Appendix II). After these reports, Ron Hedrick, Fish Health Lab at UC Davis, presented background and his latest data on VHS virus disease in Pacific sardine, and outlined present gaps in knowledge. Concluding the Thursday morning session, Kevin Hill (chair of the CPS Management Team) and Sam Herrick (SWFSC economist on the team) reviewed options for geographically-based sardine harvest shares in the US. Herrick outlined examples of the kinds of economic analyses required by law to evaluate such allocation options. In Thursday’s afternoon session, representatives from US, Canada and Mexico reported on recent sardine research activities in their respective regions. Concluding the Thursday agenda, Don Pepper (Canada), Orlando Amoroso (SCCFA), and Ricardo Thompson (Mexico) led an open discussion of the scientific issues of importance to the various industry sectors. The day closed with a reception dinner, including grilled and canned California sardines, hosted by SCCFA and CWPA. Cans of California sardines, compliments of Monterey Fish Company, decorated the tables as well as the buffet; many reception attendees happily took them home. The second day of the meeting began with an early morning optional field trip to the Tri-Marine Fish Company plant on Terminal Island, where 27 participants observed the unloading and processing of sardines. After breakfast and a preview of a DVD compiled by CWPA, highlighting the history of California’s sardine industry, the three working groups met to discuss joint projects. The meeting was reconvened in plenary session for working group presentations and plenary discussion. PLENARY SESSION HIGHLIGHTS Landings in Canada and the Pacific Northwest The fisheries in the Pacific northwest and Canada are near shore fisheries (30 NM from the shore or less), generally managed under a policy of gradual expansion of fishing effort with some or all of the fishing observed by marine fishery observers. Lisa Mijacika (DFO) reported that the Pacific sardine in Canada is managed under a plan that allows effort to increase gradually to a harvest ceiling of 15% of the estimated biomass in the US. The fishery has 100% observer coverage which is paid by industry. This year the total allowable catch was set at 5% of the population biomass estimated by the US or 5,040 tons. Landings in 2002 were 703 tons. The Canadian market is primarily large sashimi grade sardines exported to Japan. Jake Schweigert (DFO) pointed out that the sardines taken in the Canadian fishery average about 230mm, although some small fish (175mm) do occur and are caught in traps. The fat content is very high with concentrations ranging from 18% to 37% fat; ages range from 2-8 years with a mode around 4 years. Schweigert also noted that the
2
volume of the stomach contents has been declining the last few years. This may reflect different environmental conditions but also might be an early indicator of the density dependent changes discussed by Hill in this section. Michele Robinson (WDFW) reported that the State of Washington manages sardines under a trial fishery, under which the number of participants cannot be limited. Participation in the fishery and overall landings have increased from 4,791 metric tons (mt) in 2000 (by three primary vessels) to 15,212 mt in 2002 (by 19 vessels). About 24% of the trips are observed. More detailed information on the results of the fishery, observed bycatch, and biological sample data are available in the WDFW Summary Report for 2002. Jean McCrae (ODFW) reported that a total catch of 22,000 metric tons was landed by Oregon this year, an increase of 13,000 metric tons from 2001 with 6 trips observed. Nearly all of the sardines from the Oregon fishery are sold in frozen blocks. California Landings and US Stock Assessment In California, a total 54,904 mt were landed in 2001, and 54,923 mt have been landed to date in 2002. Kevin Hill (CDFG) presented the latest sardine stock assessment for the Pacific Fishery Management Council. Sardine biomass (age 1+; July 2002) was estimated to be 999,871 mt (Conser et al. 2002; Appendix IV). The harvest guideline for January 2003 was set at 110,908 mt. Sea surface temperatures measured at Scripps Pier have been running below average the last three years, and deep concern existed in industry that the three-year running mean, which regulates the harvestable fraction of the biomass, would drop below the 17.2 degree C threshold. The harvestable fraction would be reduced from the current 15% to 5% when the mean SST reaches 16.8 degrees C. This did not happen in 2002; the mean was 17.3 degrees C and the harvest fraction for US waters for 2003 remained at 15%. The concern remains, however. This is because since the 1998 El Niño, the northeastern Pacific Ocean appears to have entered an ocean climate regime of typically lower than average sea temperatures. At this writing, a weak El Niño is beginning to affect the west coast of the US, which could forestall further decline in the three-year mean SST for a while longer.
One of the most interesting aspects of the analysis of California landings data was preliminary evidence that growth of the sardine population may be slowing due to density dependent processes. The annual biomass estimates 1999-2002 have not shown the annual 30% increase in spawning biomass observed in the preceding years, although the confidence intervals on recent biomass estimates are sufficiently broad to accommodate a 30% increase. Stronger evidence for slowing of population growth were comparisons of life table characteristics between the two periods 1990-1996 vs 1999-2002 provided by Kevin Hill. Using southern California port sample data, he showed a decline in the body weight for all ages, and an increase in the size of first maturity. Similar changes in growth and maturity, were documented by Wada and Kashiwai (1991) for the Japanese sardine population. Mexican Landings and Assessments Walterio Garcia (CICIMAR-INP) reported that landings of sardines have declined in Enseñada, Mexico since 2000 when 51,172 metric were landed, with only 22,246 tons landed in 2001 and 16,745 mt through July 2002. Nearly all sardines are taken right off the port of Enseñada or a little south, and very little taken north near the international border. Most of the catch is canned or used for human consumption, and only 5% for meal. There are presently only 11 vessels fishing in the Enseñada area, which is much lower than in the early 1980s, when about 50 vessels were involved in
3
wetfish fishing, primarily for anchovy. Surprisingly, a large catch is consistently taken from Magdalena Bay, in southern Baja California. Felix Uraga (CICIMAR-INP) reported sardine landings of 40 tons from the Bay only in 2002 and 48 tons from the general vicinity. During El Niños the catch in this small area declines by about half and the fish are believed to shift to the north. He pointed out that landings in Enseñada and Magdalena Bay appear to be inversely related, indicating a coastal migration. In the Gulf of California, Manuel Nevarez (CRIP) reported that currently the Gulf stock of sardines is about 2 million tons, and catches reach 200,000 tons in normal years but drop sharply to less than 75,000 tons in El Niño years. In El Niño years the tropical clupeids (thread herring, big mouth anchovy), invade the Gulf from the south, and they replace the catch of sardine. Where the Gulf sardines move during an El Niño is apparently unknown. Presently the fishery employs a limited entry program, with 32 boats licensed to fish and 27 operating. All of the catch is used domestically, with most of it used for fish meal and a small amount processed by the canning industry. Viral Hemorrhagic Septicemia Virus (VHSV) disease in Pacific Sardine
The occurrence VHSV in west coast sardines became important to the Pacific sardine fishery when Australian biosecurity officers became concerned that imported frozen sardine from the US might introduce the virus to Australian waters, where the sardines are used as food for pen-cultured bluefin tuna. Concern regarding the introduction of marine diseases increased when substantial die offs of Australian sardines occurred in 1995 and 1998. These massive mortalities were attributed to a herpesvirus, which Australian authorities at one time believed might have been introduced with imported sardines (there has been no evidence to prove or disprove this suspicion). Ron Hedrick, a leading expert on infectious diseases of fish in the US, was asked to participate in the Trinational Sardine Forum and lead a discussion concerning VHSV in eastern Pacific sardines. An abstract of his talk is presented in Appendix III and we provide below a few highlights from his talk and the discussion that followed. Hedrick reported that the virus was discovered in rainbow trout in Europe in 1931 and later isolated by Jensen et al in 1963. Investigators subsequently found that the origin of the virus may have been Baltic herring fed to trout; the virus subsequently became established in freshwater trout hatcheries throughout Europe.
On the Pacific coast, the virus was first identified in Pacific cod from Alaska in 1988 by Meyers et al. Currently known hosts include cod, hake, pollock, herring, several salmonid species, sand lance, mackerel and sardine. In general, the virus seems to grow faster at low sea temperatures. The disease is rare at temperatures above 15EC. In recent years, documented mass mortalities of sardine trapped in Canadian inlets occur about two times a year, according to Jake Schweighert. Such mass mortalities are often associated with a high prevalence of the VHS virus, although other stressors such as low temperature are believed to play an important role. Recent work by Hedrick and associates (see abstract, Appendix IV) indicated a prevalence of 4-8% among the first populations from which VHSV was isolated, with most detections of the virus occurring at water temperatures between 12E and 15EC. More recent sampling of sardine populations from southern California to Oregon have been found to be free of virus, suggesting that virus prevalence is a seasonal phenomenon most noticeable in spring.
4
In initial trials, Hedrick and associates found that freezing sardine using procedures employed in commercial processing plants greatly reduces the concentration of the virus, with the range of reduction from 59 to 100 percent. In addition, only a small number of sardines inoculated with live virus for the experiment contracted VHSV, suggesting some fish may have a natural immunity. Participants strongly supported a continuation of VHSV research. Research investigating how processing may affect the virus needs to be continued. In addition, a thorough epidemiological study is needed where the prevalence of the virus or disease can be examined in terms of water temperature, season, age, and geographic origin of the stock. This expanded research is possible by linking the VHS virus tissue sampling to existing sardine sampling programs carried out by members of the Trinational. Latitudinal Allocation of Sardine Quota in the US
Under the current US fishery management plan, 66% of the sardine harvest is allocated to fisheries south of Pt. Piedras Blancas (south of Monterey) and 33% to the north (including Monterey as well as recently emerging fisheries in Oregon and Washington). After October 1, unused harvest shares are pooled and divided equally between north and south segments of the fishery. Objections to this policy have been raised by the fishers and packers in the newly developing sardine fisheries of Oregon and Washington, which landed 37,000 MT in 2002. The Trinational role, however, is one of science, communication, and international cooperation, and does not involve allocation policy. Nevertheless, we felt an appropriate application of the Trinational’s communication role was to hold a discussion of the options, government processes, and economic analyses that will be undertaken by the US Pacific Fishery Management Council to resolve this issue.
Kevin Hill began the discussion by outlining the north-south allocation options identified by the CPS management team, which include preserving the status quo, instituting a coast-wide harvest guideline with no allocations, and moving the north-south allocation boundary north to encompass all of California’s limited-entry fishery, and changing the reallocation date to earlier in the year. Hill pointed out that the Council will take into consideration present participation and dependence on sardine, history of the fishery, economics, consistency with the Magnuson Stevens act and FMP, and biological considerations, such as the catch of large spawners in the north and catch of juvenile fish in the south. Generally, it was felt that we do not know enough about subpopulation structure, and migrations to change the allocation policy. Sam Herrick then noted that federal law requires that all allocation options must be accompanied by economic analysis to examine the net economic benefits of different options to the country, and to determine the impact of the regulations on the local community (Regulatory Impact Analysis). For such analyses to be accurate requires extensive data on fishing and processing costs and revenues. Detailed economic data of this kind on the fishery is generally not available, and typically, public sources of information such as vessel landing receipts, and value of exported product from custom districts are used. When questioned how Councils tended to weight criteria based on net benefits to the nation relative to community impact, Herrick responded that, in his opinion, community impact is given a greater weight by Fishery Management Councils in settling allocation issues. It is also very clear that the data currently available for economic analysis of regulatory impacts on a community are very poor for sardine fisheries, and a need exists for fishers, processors and the government to work together to obtain better cost information.
5
INDUSTRY PANEL DISCUSSION
In free ranging discussion of industry issues chaired by Don Pepper and Orlando Amoroso, industry members stressed the need for better information to support the Trinational sardine fisheries. Of particular value for the industry would be predictive models that would provide a forecast of the availability of fish for future fisheries. In particular, predictions regarding future stability of the resource was viewed as especially valuable by industry representatives. Industry representatives from Canada and the Pacific Northwest were deeply concerned regarding continuance of migration into northern waters, recognizing that changes in the extent of migration might be one of the early responses to changes in ocean climate. The development of better economic information on the fishery, and development of bioeconomic models was stressed as highly important as well. Long range projections of effects of changes in markets was identified as an important issue. Concerns were voiced by US fishermen, regarding losses of fishing grounds to marine reserves in California, and a feeling that they lack representation in meetings that affect their fisheries.
Participants discussed the continuing expansion of the bluefin tuna pen culture on the west coast, and quantities of sardine that may be needed to sustain this developing industry. Five new farms have been authorized in Baja California, and there may be as many as 10 in the near future in Baja California. Bluefin tuna farming is also being discussed as a possibility in US waters. Rough calculations indicated that ten farms, consisting of 15 cages each, would require about 40,000 metric tons of sardines per year. Clearly, as pen farming expands, the ability of sardines and other coastal pelagic species to support that production will need to be examined.
Ricardo Thompson discussed his plans for a new sardine processing facility at Cedros Island
(about 600 miles below the international border). The plant on the island has been closed for years, but this new project will bring employment to the area. The plant will consist of a freezer boat moored at Cedros Island with a capacity of processing about 120 metric tons per day. Thompson, identified the need for improved information related to the availability of sardines in the region and sustainability of the supply in the future.
John Royal (San Pedro) perhaps best summed up the situation by pointing out that the need for
better information on sardines becomes more urgent every year as sardine fisheries expand, but progress is slow. He went on to say that none of the three governments are paying enough attention to sardines and their transboundary issues, nor are they devoting enough resources to solve the most pressing scientific problems. Royal urged the Trinational Sardine Forum members to recommend to their governments, the development of a MOU establishing a Trinational Sardine Fishery Commission. Patterned after other Fishery Commissions in the world (e.g. the IATTC), the Commission would be funded by contributions from member nations to support key research projects and guide cooperative research projects among members. This concept was endorsed by the participants.
6
TRINATIONAL SARDINE FORUM WEB SITE
The Southwest Fishery Science Center, Fishery Resources Division agreed to set up a Trinational Sardine Forum Website, (on the SWFSC Site) which shall provide basic information regarding Trinational meetings, working groups and shared information. Those wishing to post information on the web site should contact the web manager, [email protected]. We anticipate the web site will be fully operational by the end of February 2003. NEXT TRINATIONAL MEETING
The consensus of participants was that the meetings are useful and should be continued. The fourth Trinational meeting shall be held again in San Pedro, during the first week of December 2003. Orlando Amoroso, offered once again to host the meeting, which will be held at the Southern California Commercial Fishing Association Headquarters in San Pedro, as it was in 2002. CONCLUDING REMARKS
In 2002, our Trinational shows us that the overall picture for the Pacific sardine fisheries is positive and dynamic. The world-wide expansion of bluefin tuna ranching and the opening of Japanese markets, caused by the collapse of the Japanese sardine fishery, are producing new and expanding markets for Pacific sardine. Landings and revenues are increasing because of the development of the new markets and because of the increased availability of the putative northern stock since its recovery. However, there are a few warning signs. Population growth of the northern stock may have slowed in the last few years. The northern stock may grow more slowly in the future, owing to the onset of density dependent processes, and because of a general cooling of the California Current. Of course, a less productive northern stock in a cooler California Current will be protected to some extent by automatic changes in the temperature dependent harvest guidelines in the US Fishery Management Plan. On the other hand, under conditions where the northern stock is stable or growing more slowly, even the maximum harvest rate of 15% might soon be exceeded by the combined catches from the US, Mexico and Canada (see Conser et al. 2002, Fig. 13, Appendix IV). Fishing organizations and agencies in Canada, the US and Mexico are committed to not repeat the sardine failures of the past, but commitment alone may be insufficient to offset future problems. Ignorance of sardine biology, and particularly, poor understanding of the interdependence of regional stocks, and those that cross international boundaries, may be a fatal flaw. Solving the stock interdependence issue would not only greatly reduce risk of over-fishing, it also presents a great opportunity to increase efficiency of sardine management in all three countries. We of the Trinational Forum have done our best to build cooperative projects and improve joint understanding of sardine dynamics, but a limit exists on how much can be accomplished using the purely informal, and voluntary approach of the Trinational. Participants recommended a binding and official commitment by the three governments to work together and commit resources to that end. In short, a Trinational Sardine Commission is needed to commit funds and resources in the three countries for joint work on sardine dynamics, movements, and stock assessments, as well as to guide the collaborative process.
John Hunter and Tim Baumgartner (December 2002)
7
WORKING GROUP REPORTS WORKING GROUP 1: Adult Sampling/Sardine Ageing Workshop - Kevin Hill, Chair Recommendations from Trinational Sardine Forum (TSF) 2001 Participants of TSF 2001 agreed that coastwide standardization of ageing criteria was essential and that an age determination workshop could make a major contribution to the quality of future stock assessments. Objectives the workshop should include: 1) summarize all existing data on age size composition of Pacific sardine, 2) standardize aging methods and criteria, 3) establish guidelines for cross reading of otoliths between labs, 4) develop a joint publication summarizing coast-wide age data. TSF 2002 participants also recommended standardizing gonad maturity codes for sardine, thereby making it easier to combine data from different areas and countries. Progress and Plans for 2003
I. Sardine Ageing Workshop Working Group 1 discussed plans for the upcoming sardine ageing workshop, which will be held in spring of 2003 at the Southwest Fisheries Science Center in La Jolla, California. The workshop was initially planned for late April, but after some discussion it was agreed to move the dates to the 2nd and 3rd of April, 2003. The working group discussed a preliminary agenda (below), and agreed to hold a conference call in January to organize workshop details. Preliminary Workshop Agenda: 1) Discuss and resolve basic sardine ageing methods and issues - sampling rate (fishery) - resolving first annulus, check marks, outer edge - standardizing birth date and year class assignment 2) Cross-reads among existing ageing experts - full spectrum of samples by region and season - representation of all ages - excellent, average, and difficult examples 3) Validation and verification - marginal increment analysis, and review of previous work 4) Presentation of regional data 5) Joint publication on coastwide age distribution, growth, maturity 6) Develop format for sharing summarized age and growth data among agencies Preliminary List of Workshop Participants: DFO Sandy McFarlane + 1 other WDFW Michele Robinson + 1 other ODFW Jean McCrae + 1 other CDFG Kevin Hill, Darrin Bergen, Stephen Wertz, Valerie Taylor, Leeanne Laughlin, Kelly
O’Reilly, + 1 other CICIMAR Casimiro Quiñonez, Roberto Félix, + 1 other (?) CISESE Tim Baumgartner, Sarita de la Campa, Yanira Green, Pablo Santos, Christina
Sanchez
8
INP NMFS John Butler? Paul Crone? II. Revision of Gonad Maturity Codes Working Group I recommended that a standard maturity code for sardine be applied throughout the range, making it much easier to combine data from different areas and countries. Beverly Macewicz (SWFSC) drafted a 4-stage maturity code system (abbreviated below) and provided photographs and background information to facilitate coastwide implementation. Participants from each agency agreed to implement the system in early 2003, after Macewicz’ finalized guidelines, including photographs, are distributed. The classification codes will also be applied to other small pelagics such as mackerel and anchovy. Females: 1 - Immature 2 - Intermediate (not immature, but no oocytes visible) 3 - Active (yolked oocytes visible) 4 – Hydrated Males: 1 - Immature 2 - Intermediate (not immature, but no milt present) 3 - Milt present
9
WORKING GROUP 2: Regional Estimates of Biomass in 2002 and Recommendations
for Future Activities – Nancy Lo, Chair Members: Martin E. Hernandez-Rivas, [email protected]; Sandy McFarlane, [email protected];Robert Emmett, [email protected]; Ray Conser, [email protected]; Yanira Green-Ruiz, [email protected]; Sarita De la Campa, [email protected]; Darrell Kapp, [email protected]; Nancy C.H. Lo, [email protected]; Lisa Mijackia, [email protected]; Rene Torres Villegas, [email protected] Group e-mail address: sardine.forum
1. IMECOCAL and CalCOFI, April cruises, 2002 Objectives: To estimate spawning biomass of Pacific sardine from Baja California, Mexico to San Francisco, CA , US.
Activities
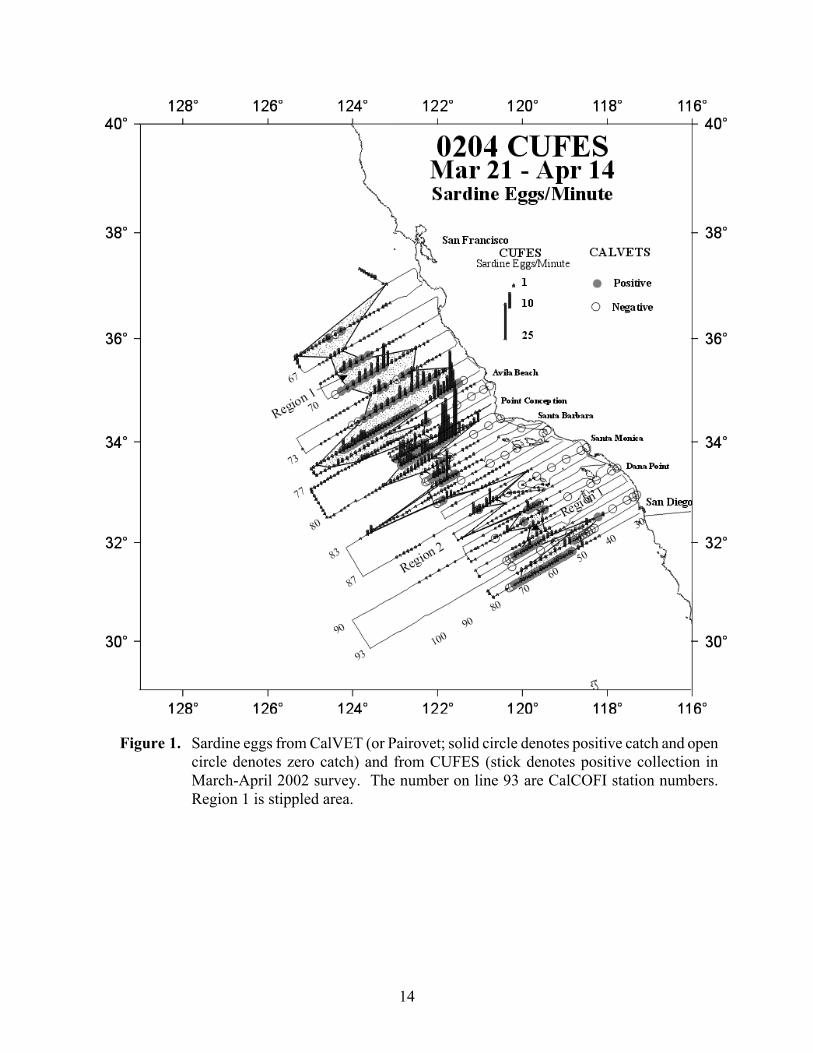
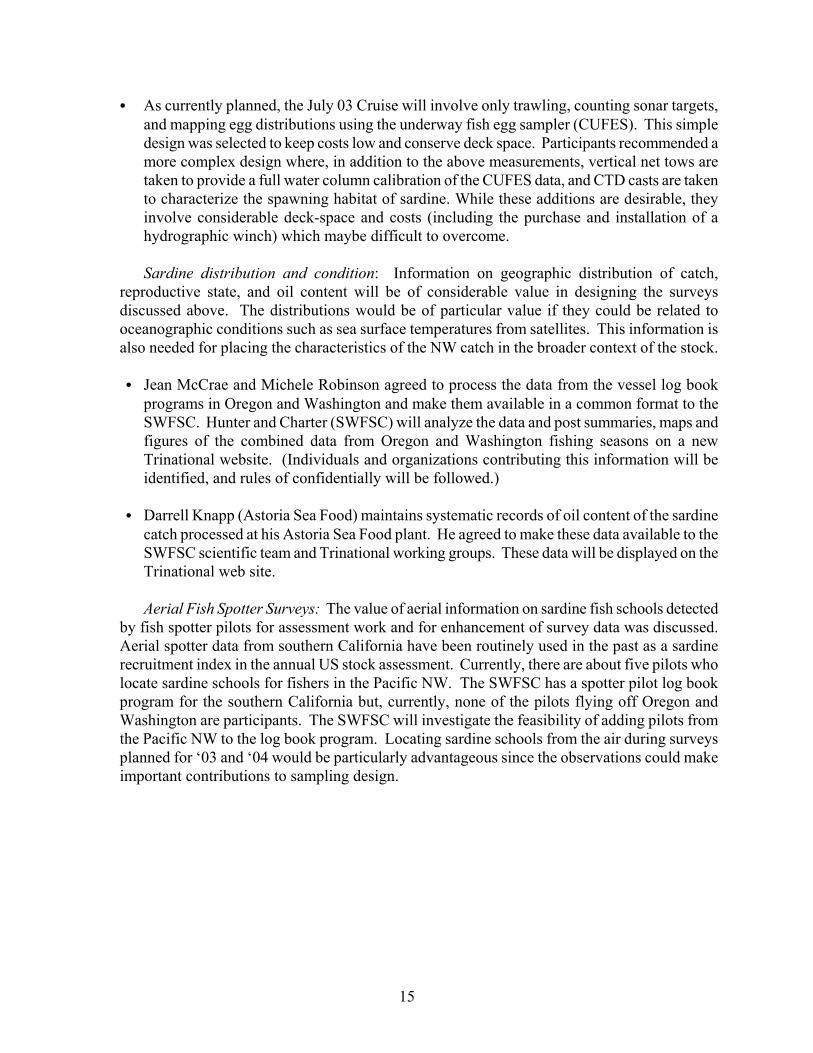
1.1. CalCOFI In 2002, a full-scaled survey was conducted to estimate the spawning biomass of Pacific sardine. In this survey, ichthyoplankton samples from CalVET and CUFES were taken aboard R/V McArthur (March 21 - April 19) (Figure 1) and R/V David Starr Jordan (March 27 - April 14) (Figure 2). The Jordan segment was the routine CalCOFI April survey. Adult sardine samples for reproductive output were taken aboard R/V David Starr Jordan (April 14-25) after the routine CalCOFI cruise. The daily egg production of Pacific sardine (Sardinops sagax) off California from San Diego to Monterey was estimated to be 0.728/0.05m2 (CV = 0.17). The estimate of daily specific fecundity (number of eggs/population weight (gm)/day was 22.94 (compared to 23.55 used in the past years). Reproductive parameters of the mature female sardines from the April 2002 survey were as follows: R, the sex ratio, was 0.386 (CV = 0.19); F, mean batch fecundity, was 54403.26 eggs/batch (CV = 0.05); S, spawning fraction was 0.174 per day (CV = 0.28); and Wf , mean female fish weight, was 159.2 grams (CV = 0.04).
The spawning biomass was estimated to be 206,333mt (CV = 0.35) for an area of 325,082 km2. The area is similar to 321,386 km2 in 2001. The estimates of spawning biomass of Pacific sardine in 1994 and 1996 - 2002 are 129,000 mt, 83,000 mt, 440,000 mt, 310,000 mt, 280,000 mt, 1.06 million mt, 791,000 mt, and 206,000 mt respectively. Therefore, the estimates of spawning biomass have been fluctuating since 1994. One possible reason for the fluctuation may be due to the migration.
1.2. IMECOCAL: (See the Research report from Northern Baja California by Tim
Baumgartner)
10
2. NWFSC Biomass off Northern Oregon and Southern Washington Objectives: To estimate spawning biomass of Pacific sardine off Oregon in 1999 - 2002.
Activities
2.1. Egg surveys in 1999-2002. No egg surveys were conducted in 1999-2002. 2.2. Adult surveys. Similar to year 2001, no off-shore survey was conducted to capture adults in June because locations and timing of the spawning were unknown. Effort was concentrated on near-shore trawling surveys off Oregon and Washington:
a) Bonneville Power Administration (BPA) Columbia River plume study: from northern Washington to Newport in May, June, and September. The study is a funded by BPA and NMFS until at least 2005.
b) Predator/baitfish study off the Columbia River: night surface trawl surveys off the Columbia River every 10 days from late April through July.
c) Lower Columbia River purse seine survey: every 2 weeks from April through September.
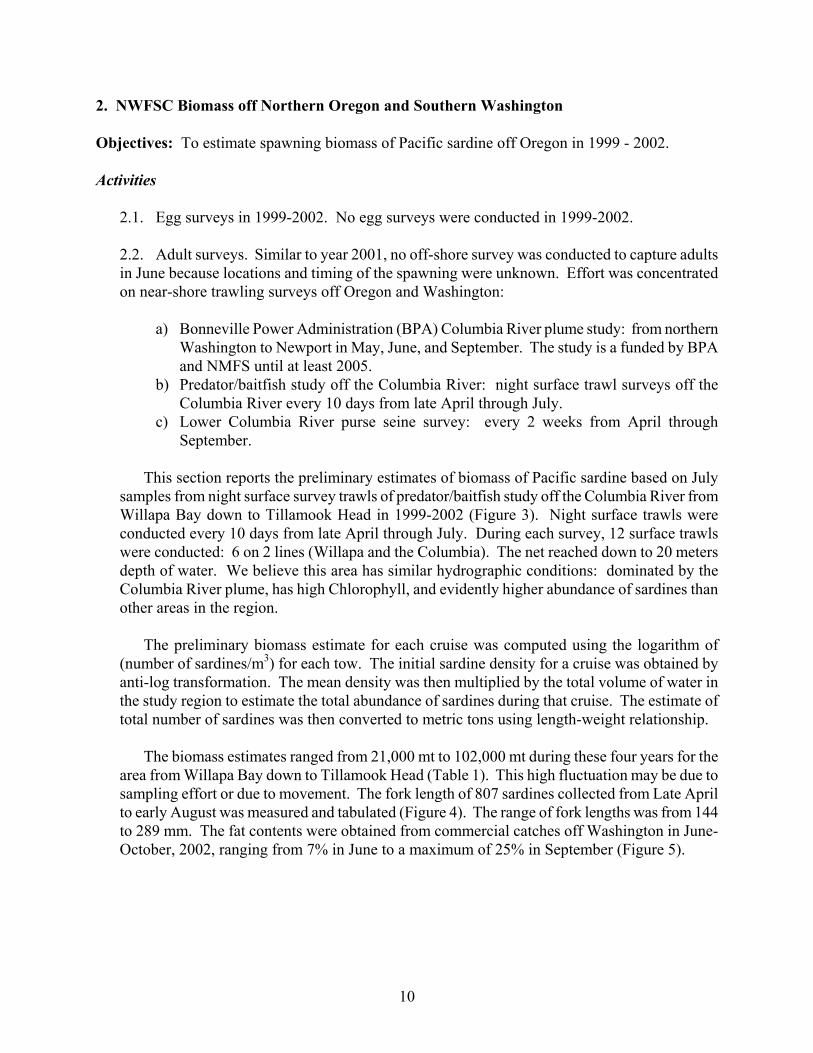
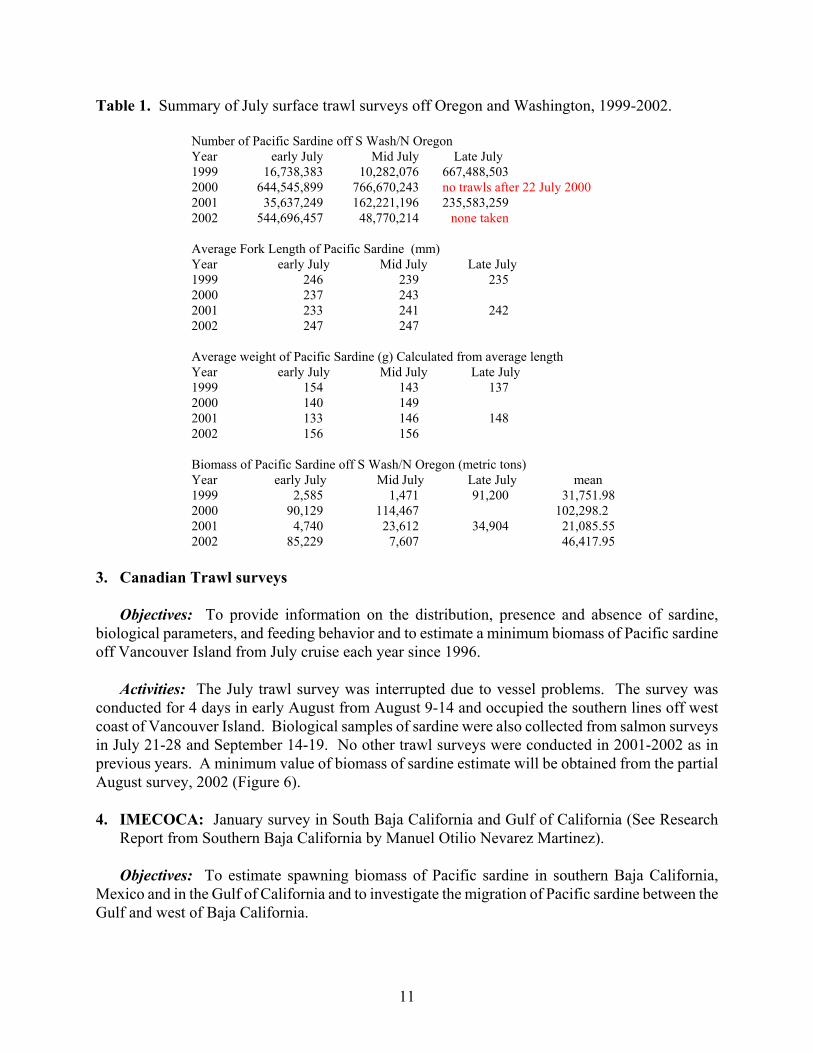
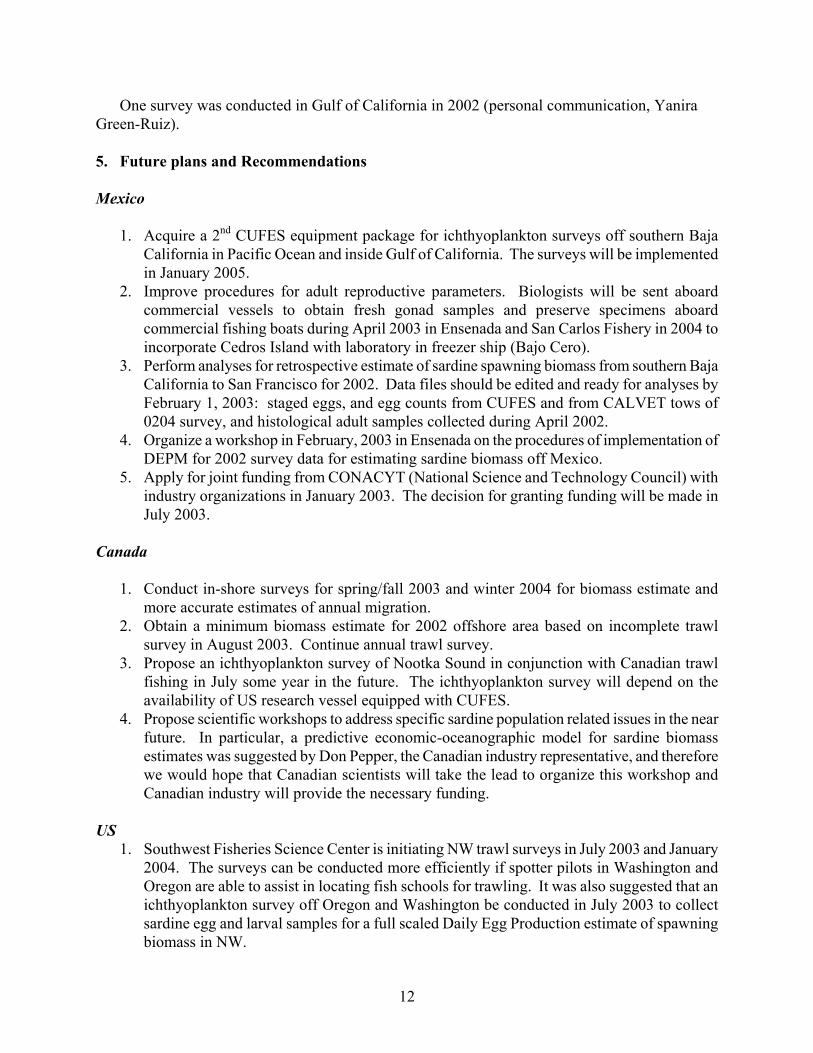
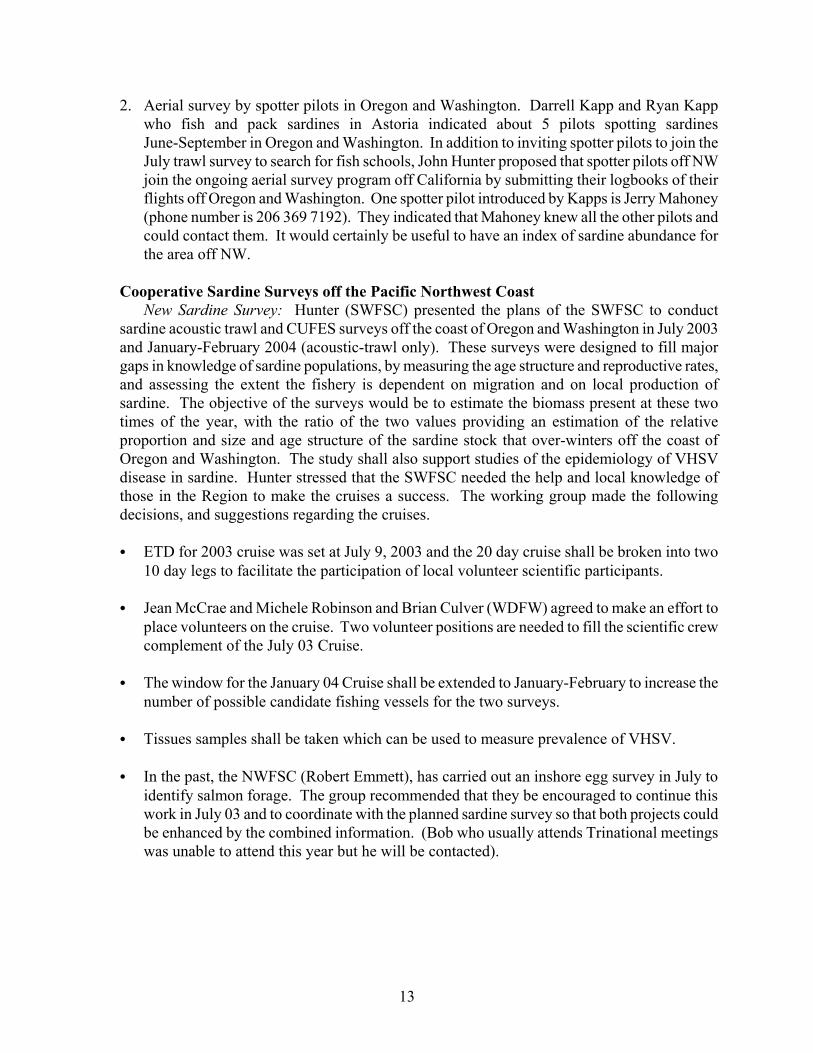
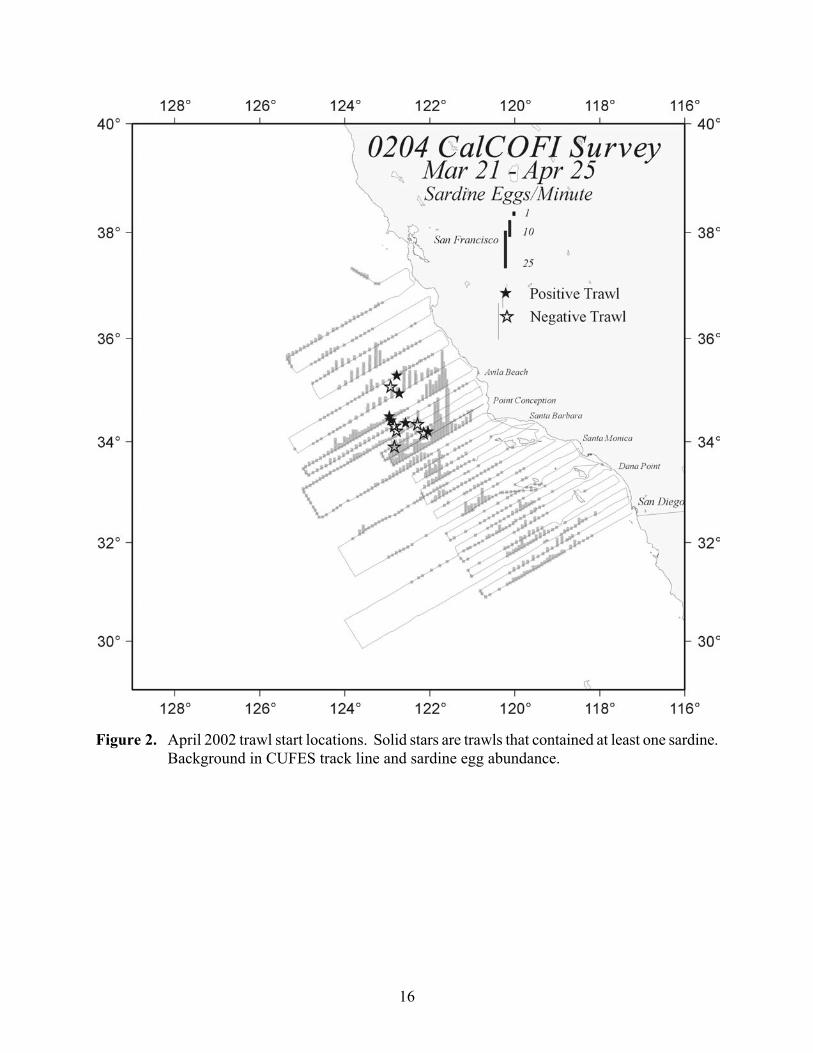
This section reports the preliminary estimates of biomass of Pacific sardine based on July samples from night surface survey trawls of predator/baitfish study off the Columbia River from Willapa Bay down to Tillamook Head in 1999-2002 (Figure 3). Night surface trawls were conducted every 10 days from late April through July. During each survey, 12 surface trawls were conducted: 6 on 2 lines (Willapa and the Columbia). The net reached down to 20 meters depth of water. We believe this area has similar hydrographic conditions: dominated by the Columbia River plume, has high Chlorophyll, and evidently higher abundance of sardines than other areas in the region. The preliminary biomass estimate for each cruise was computed using the logarithm of (number of sardines/m3) for each tow. The initial sardine density for a cruise was obtained by anti-log transformation. The mean density was then multiplied by the total volume of water in the study region to estimate the total abundance of sardines during that cruise. The estimate of total number of sardines was then converted to metric tons using length-weight relationship. The biomass estimates ranged from 21,000 mt to 102,000 mt during these four years for the area from Willapa Bay down to Tillamook Head (Table 1). This high fluctuation may be due to sampling effort or due to movement. The fork length of 807 sardines collected from Late April to early August was measured and tabulated (Figure 4). The range of fork lengths was from 144 to 289 mm. The fat contents were obtained from commercial catches off Washington in June-October, 2002, ranging from 7% in June to a maximum of 25% in September (Figure 5).
11
Table 1. Summary of July surface trawl surveys off Oregon and Washington, 1999-2002.
Number of Pacific Sardine off S Wash/N Oregon Year early July Mid July Late July 1999 16,738,383 10,282,076 667,488,503 2000 644,545,899 766,670,243 no trawls after 22 July 2000 2001 35,637,249 162,221,196 235,583,259 2002 544,696,457 48,770,214 none taken Average Fork Length of Pacific Sardine (mm) Year early July Mid July Late July 1999 246 239 235 2000 237 243 2001 233 241 242 2002 247 247 Average weight of Pacific Sardine (g) Calculated from average length Year early July Mid July Late July 1999 154 143 137 2000 140 149 2001 133 146 148 2002 156 156 Biomass of Pacific Sardine off S Wash/N Oregon (metric tons) Year early July Mid July Late July mean 1999 2,585 1,471 91,200 31,751.98 2000 90,129 114,467 102,298.2 2001 4,740 23,612 34,904 21,085.55 2002 85,229 7,607 46,417.95
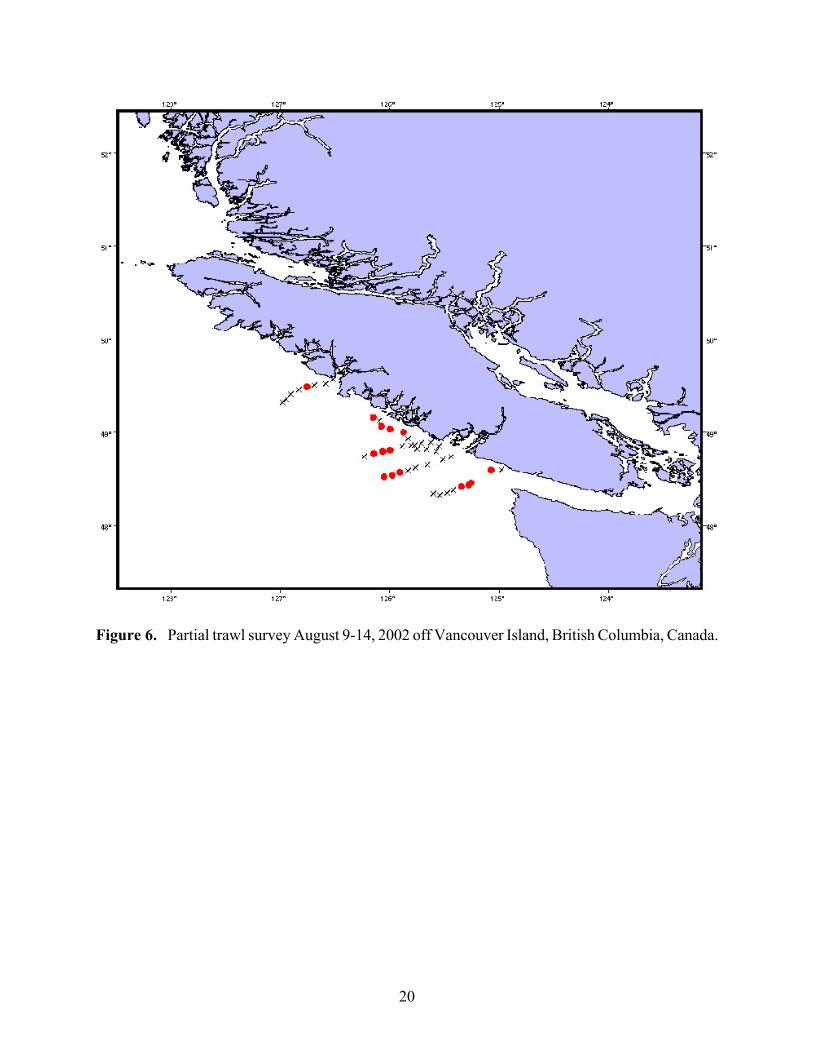
3. Canadian Trawl surveys Objectives: To provide information on the distribution, presence and absence of sardine, biological parameters, and feeding behavior and to estimate a minimum biomass of Pacific sardine off Vancouver Island from July cruise each year since 1996.
Activities: The July trawl survey was interrupted due to vessel problems. The survey was conducted for 4 days in early August from August 9-14 and occupied the southern lines off west coast of Vancouver Island. Biological samples of sardine were also collected from salmon surveys in July 21-28 and September 14-19. No other trawl surveys were conducted in 2001-2002 as in previous years. A minimum value of biomass of sardine estimate will be obtained from the partial August survey, 2002 (Figure 6). 4. IMECOCA: January survey in South Baja California and Gulf of California (See Research
Report from Southern Baja California by Manuel Otilio Nevarez Martinez). Objectives: To estimate spawning biomass of Pacific sardine in southern Baja California, Mexico and in the Gulf of California and to investigate the migration of Pacific sardine between the Gulf and west of Baja California.
12
One survey was conducted in Gulf of California in 2002 (personal communication, Yanira Green-Ruiz). 5. Future plans and Recommendations Mexico
1. Acquire a 2nd CUFES equipment package for ichthyoplankton surveys off southern Baja California in Pacific Ocean and inside Gulf of California. The surveys will be implemented in January 2005.
2. Improve procedures for adult reproductive parameters. Biologists will be sent aboard commercial vessels to obtain fresh gonad samples and preserve specimens aboard commercial fishing boats during April 2003 in Ensenada and San Carlos Fishery in 2004 to incorporate Cedros Island with laboratory in freezer ship (Bajo Cero).
3. Perform analyses for retrospective estimate of sardine spawning biomass from southern Baja California to San Francisco for 2002. Data files should be edited and ready for analyses by February 1, 2003: staged eggs, and egg counts from CUFES and from CALVET tows of 0204 survey, and histological adult samples collected during April 2002.
4. Organize a workshop in February, 2003 in Ensenada on the procedures of implementation of DEPM for 2002 survey data for estimating sardine biomass off Mexico.
5. Apply for joint funding from CONACYT (National Science and Technology Council) with industry organizations in January 2003. The decision for granting funding will be made in July 2003.
Canada
1. Conduct in-shore surveys for spring/fall 2003 and winter 2004 for biomass estimate and more accurate estimates of annual migration.
2. Obtain a minimum biomass estimate for 2002 offshore area based on incomplete trawl survey in August 2003. Continue annual trawl survey.
3. Propose an ichthyoplankton survey of Nootka Sound in conjunction with Canadian trawl fishing in July some year in the future. The ichthyoplankton survey will depend on the availability of US research vessel equipped with CUFES.
4. Propose scientific workshops to address specific sardine population related issues in the near future. In particular, a predictive economic-oceanographic model for sardine biomass estimates was suggested by Don Pepper, the Canadian industry representative, and therefore we would hope that Canadian scientists will take the lead to organize this workshop and Canadian industry will provide the necessary funding.
US
1. Southwest Fisheries Science Center is initiating NW trawl surveys in July 2003 and January 2004. The surveys can be conducted more efficiently if spotter pilots in Washington and Oregon are able to assist in locating fish schools for trawling. It was also suggested that an ichthyoplankton survey off Oregon and Washington be conducted in July 2003 to collect sardine egg and larval samples for a full scaled Daily Egg Production estimate of spawning biomass in NW.
13
2. Aerial survey by spotter pilots in Oregon and Washington. Darrell Kapp and Ryan Kapp who fish and pack sardines in Astoria indicated about 5 pilots spotting sardines June-September in Oregon and Washington. In addition to inviting spotter pilots to join the July trawl survey to search for fish schools, John Hunter proposed that spotter pilots off NW join the ongoing aerial survey program off California by submitting their logbooks of their flights off Oregon and Washington. One spotter pilot introduced by Kapps is Jerry Mahoney (phone number is 206 369 7192). They indicated that Mahoney knew all the other pilots and could contact them. It would certainly be useful to have an index of sardine abundance for the area off NW.
Cooperative Sardine Surveys off the Pacific Northwest Coast New Sardine Survey: Hunter (SWFSC) presented the plans of the SWFSC to conduct sardine acoustic trawl and CUFES surveys off the coast of Oregon and Washington in July 2003 and January-February 2004 (acoustic-trawl only). These surveys were designed to fill major gaps in knowledge of sardine populations, by measuring the age structure and reproductive rates, and assessing the extent the fishery is dependent on migration and on local production of sardine. The objective of the surveys would be to estimate the biomass present at these two times of the year, with the ratio of the two values providing an estimation of the relative proportion and size and age structure of the sardine stock that over-winters off the coast of Oregon and Washington. The study shall also support studies of the epidemiology of VHSV disease in sardine. Hunter stressed that the SWFSC needed the help and local knowledge of those in the Region to make the cruises a success. The working group made the following decisions, and suggestions regarding the cruises.
C ETD for 2003 cruise was set at July 9, 2003 and the 20 day cruise shall be broken into two
10 day legs to facilitate the participation of local volunteer scientific participants. C Jean McCrae and Michele Robinson and Brian Culver (WDFW) agreed to make an effort to
place volunteers on the cruise. Two volunteer positions are needed to fill the scientific crew complement of the July 03 Cruise.
C The window for the January 04 Cruise shall be extended to January-February to increase the
number of possible candidate fishing vessels for the two surveys. C Tissues samples shall be taken which can be used to measure prevalence of VHSV. C In the past, the NWFSC (Robert Emmett), has carried out an inshore egg survey in July to
identify salmon forage. The group recommended that they be encouraged to continue this work in July 03 and to coordinate with the planned sardine survey so that both projects could be enhanced by the combined information. (Bob who usually attends Trinational meetings was unable to attend this year but he will be contacted).
14
Figure 1. Sardine eggs from CalVET (or Pairovet; solid circle denotes positive catch and open
circle denotes zero catch) and from CUFES (stick denotes positive collection in March-April 2002 survey. The number on line 93 are CalCOFI station numbers. Region 1 is stippled area.
15
C As currently planned, the July 03 Cruise will involve only trawling, counting sonar targets, and mapping egg distributions using the underway fish egg sampler (CUFES). This simple design was selected to keep costs low and conserve deck space. Participants recommended a more complex design where, in addition to the above measurements, vertical net tows are taken to provide a full water column calibration of the CUFES data, and CTD casts are taken to characterize the spawning habitat of sardine. While these additions are desirable, they involve considerable deck-space and costs (including the purchase and installation of a hydrographic winch) which maybe difficult to overcome.
Sardine distribution and condition: Information on geographic distribution of catch, reproductive state, and oil content will be of considerable value in designing the surveys discussed above. The distributions would be of particular value if they could be related to oceanographic conditions such as sea surface temperatures from satellites. This information is also needed for placing the characteristics of the NW catch in the broader context of the stock.
C Jean McCrae and Michele Robinson agreed to process the data from the vessel log book
programs in Oregon and Washington and make them available in a common format to the SWFSC. Hunter and Charter (SWFSC) will analyze the data and post summaries, maps and figures of the combined data from Oregon and Washington fishing seasons on a new Trinational website. (Individuals and organizations contributing this information will be identified, and rules of confidentially will be followed.)
C Darrell Knapp (Astoria Sea Food) maintains systematic records of oil content of the sardine
catch processed at his Astoria Sea Food plant. He agreed to make these data available to the SWFSC scientific team and Trinational working groups. These data will be displayed on the Trinational web site.
Aerial Fish Spotter Surveys: The value of aerial information on sardine fish schools detected by fish spotter pilots for assessment work and for enhancement of survey data was discussed. Aerial spotter data from southern California have been routinely used in the past as a sardine recruitment index in the annual US stock assessment. Currently, there are about five pilots who locate sardine schools for fishers in the Pacific NW. The SWFSC has a spotter pilot log book program for the southern California but, currently, none of the pilots flying off Oregon and Washington are participants. The SWFSC will investigate the feasibility of adding pilots from the Pacific NW to the log book program. Locating sardine schools from the air during surveys planned for ‘03 and ‘04 would be particularly advantageous since the observations could make important contributions to sampling design.
16
Figure 2. April 2002 trawl start locations. Solid stars are trawls that contained at least one sardine.
Background in CUFES track line and sardine egg abundance.
17
Figure 3. Surface trawl survey off Oregon and Washington from late April – early August, 1999-
2002.
I n f o r m a t i o n : 2 l i n e s ( W i l l a p a a n d C o l u m b i a R i v e r ) w e r e s u r v e y e d e v e r y 1 0 d a y s f r o m l a t e A p r i l t h r o u g h J u l y , 1 9 9 9 , 2 0 0 0 , a n d 2 0 0 1 . G e a r – 2 6 4 r o p e t r a w l – m o u t h o p e n i n g o f 3 6 0 m 2
E s t i m a t e d r e p r e s e n t a t i v e s u r v e y a r e a – 2 0 , 0 0 0 k m 2 ( F r o m a b o v e G r a y s H a r b o r t o C a p e F a l c o n – a n d o u t ~ 3 5 n m ) . T o t a l v o l u m e ( 4 x 1 0 1 1 m 3 ) w i t h i n t h e s u r v e y a r e a w a s c a l c u l a t e d u s i n g 2 0 m ( d e p t h t h e n e t f i s h e d ) x t h e s u r v e y a r e a .
s u r v e y a r e a i s 2 0 , 0 0 0k m 2
W i l l a p a B a y l i n e
C o l u m b i a R i v e rl i n e
18
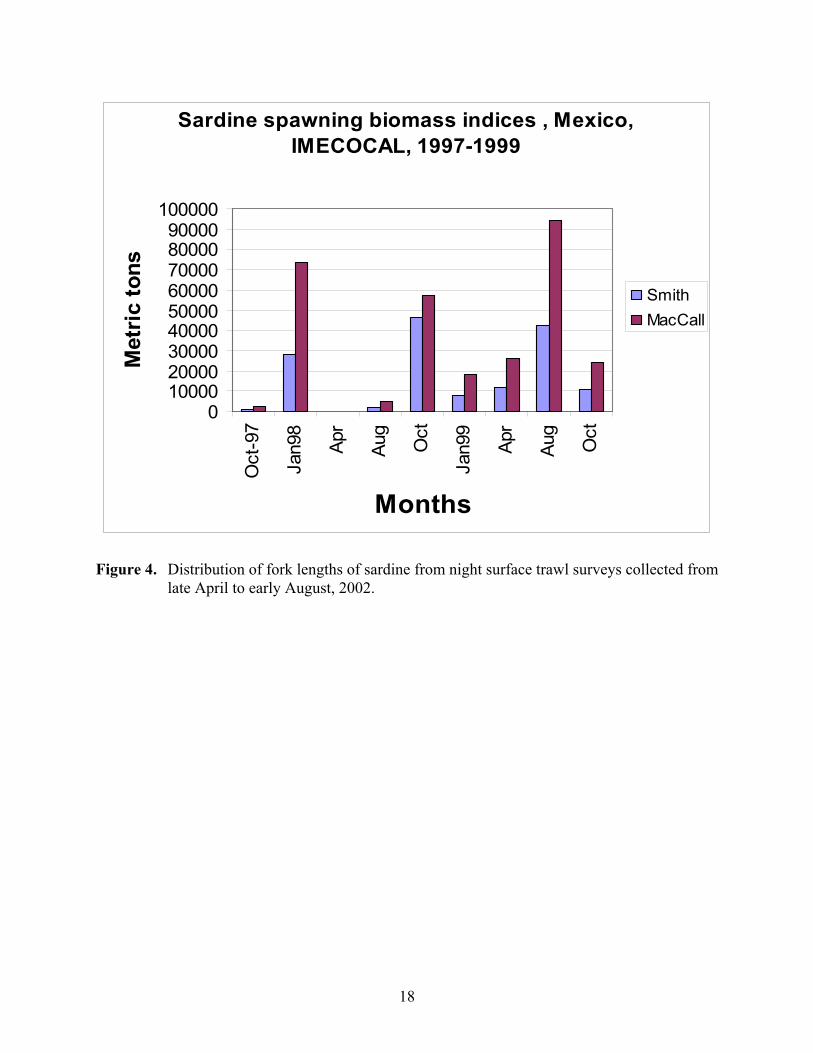
Figure 4. Distribution of fork lengths of sardine from night surface trawl surveys collected from
late April to early August, 2002.
Sardine spawning biomass indices , Mexico, IMECOCAL, 1997-1999
0100002000030000400005000060000700008000090000
100000
Oct
-97
Jan9
8
Apr
Aug
Oct
Jan9
9
Apr
Aug
Oct
Months
Met
ric
tons
SmithMacCall
19
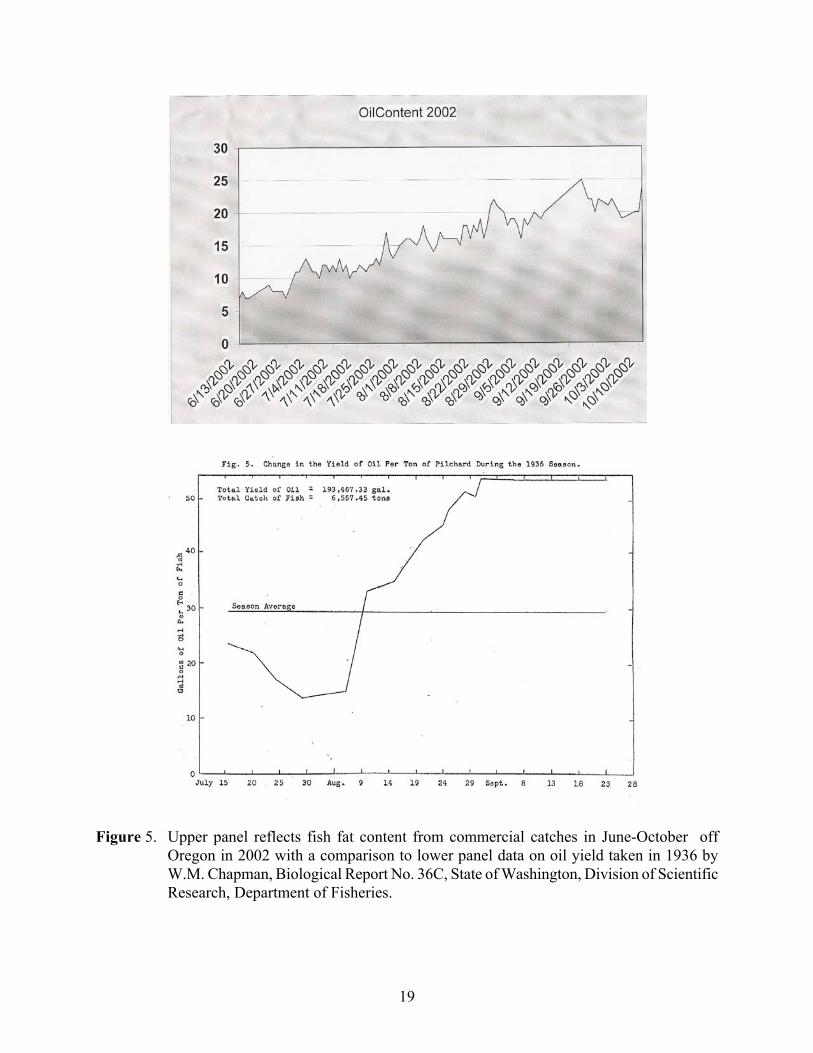
Figure 5. Upper panel reflects fish fat content from commercial catches in June-October off
Oregon in 2002 with a comparison to lower panel data on oil yield taken in 1936 by W.M. Chapman, Biological Report No. 36C, State of Washington, Division of Scientific Research, Department of Fisheries.
20
Figure 6. Partial trawl survey August 9-14, 2002 off Vancouver Island, British Columbia, Canada.
21
WORKING GROUP 3: 2002 Tri-National Sardine Meeting, Working Group Stock
Structure and Latitudinal Origins plus VHS Disease sampling strategies – Russ Vetter, Chair
Historical Opinions, and Beliefs about Population Structure
1. Sardine in the Sea of Cortez constitute a stock. This stock undergoes extreme fluctuations in population size but probably has not gone locally extinct in recent times.
2. When populations are low in the Sea of Cortez, sardine retreat to core areas 3. Sardine recovery in the Sea of Cortez may sometimes be aided by migration of sardine from
the outer coast of Baja into the Sea of Cortez. 4. The outer coast of southern Baja constitutes a second stock (southern stock). There is
movement between the Magdalena Bay region, the Cedros Island region and the Ensenada region. Sardine from this stock may even extend across the border into the southern California inshore landings.
5. The main US stock is a third stock (northern stock). This stock is located offshore in southern California. The spawning center is off the central coast of California and it extends northward to Vancouver, British Columbia during favorable environmental conditions.
6. Information on how the Magdalena Bay landings vary inversely with the Ensenada landings was presented. It was suggested that the core of the southern stock moves north and south during El Niño and La Niña events.
7. Not all Pacific sardine experts believe in the existence of a separate northern stock; Alec McCall’s skepticism regarding the existence of a separate northern stock is noted in his review of this document.
Much of the above information has been presented and discussed in the previous Trinational and has been summarized in the paper “Climate Variability and Pacific Sardine Populations and Fisheries” in American Fisheries Society Symposium 32: 195-214, 2002. G. A. McFarlane, P.E. Smith, T.R. Baumgartner and J.R. Hunter. Hypotheses on Migration Patterns Sardine populations fluctuate widely. Under certain climate conditions they may shift their centers of distribution and may go locally extinct at the northern and southern portions of their range (off Vancouver and in the Sea of Cortez). When conditions are favorable, sardine recolonize previously unfavorable portions of their range and can reach high biomass in previously empty habitats. Considering just the northern region there are three scenarios:
1. Sardine recolonize the previously empty habitat, grow and reproduce in the new habitat, and locally generate recruits.
2. Sardine migrate northward with a progression of the seasons, or with age, and forage in
northern habitats. Either annually, or at some point in the life cycle, they return to their core spawning region and contribute to the larval production of the core population.
22
3. Sardine migrate northward with age but do not return. The northern animals are a terminal phase that contributes little to the overall fecundity and growth of the core region or the northern extension.
Management Implications Scenario 1: Fish stocks should be managed separately with the expectation that the northern fishery will eventually collapse if climate conditions change. Scenario 2: Fish at the northern end of the range should be considered as a valuable part of the core population whose overharvest would decrease the reproductive output of the stock. Scenario 3: The large northern fish do not contribute in a substantial way to the reproductive output of either the north or the core region and can be harvested either as smaller fish in the core region or as larger fish in the northern region. Here the decision is based on local economic considerations, not biology. Potential Methods of Examining Population Structure and Latitudinal Origin
1. otolith microchemistry 2. otolith stable isotope composition 3. genetics 4. meristics and morphometrics, vertebral counts 5. magnetic tags 6. parasites 7. immunological differences including susceptibility and evidence of pre-exposures to VHSV
Promising Approaches to Defining Stock Structure No single method was identified that will easily discern stock structure and migration patterns. Tagging methods have improved. To go beyond what was done previously would require an extensive tagging and recovery program. Involvement of processors in the recovery of tags would be required. Vertebral counts vary with water temperature at the time of metamorphosis. This approach should be pursued as a simple method of examining mixed stock landings. Differences in vertebral counts do not indicate stock differences in a genetic sense but may indicate the natal origin of the individual. Genetic methods involving protein enzyme electrophoresis and mitochondrial DNA have yielded basin-wide information (e.g. Chile vs North America) but have not been useful in discriminating between putative stocks within the northwest Pacific (trinational) region. More variable markers, including microsatellite nuclear DNA and perhaps single nucleotide polymorphisms (SNIPS), might yield results and should be tried. Genetic markers will never be applicable for studying the movements of individual fish over their lifetimes. Changes in external water chemistry, temperature, and diet can result in different chemical signatures in fish otoliths. Study of whole otoliths and individual growth rings can potentially shed light on the natal habitat and subsequent movements of individual sardines. Samples of DNA and otoliths should begin to be collected so that DNA and otolith microchemistry studies can be undertaken when research funds become available.
23
Sampling Strategy for Studying Stock Structure It was generally agreed that the primary sampling focus should be on core populations where sardines persist even during unfavorable climate conditions. Sampling should also include areas where two stocks might mix (southern California) and areas at the limits of the range (Vancouver). These areas would be important to confirm results of stock definition, to examine founder effects, and migration. Possible sampling locations would include:
Sea of Cortez 1. Great Island Tiburon 2. Islas Cerralvo near La Paz
Outer Coast Baja California (southern stock)
1. Magdalena Bay 2. Cedros Island 3. Ensenda (knowing sardines may be a mixture of southern and northern stocks)
Alta California:
1. Monterey (pure northern stock) 2. San Diego (mixed)
Oregon and Washington:
1. Columbia River Plume (might have strong microchemistry signal) 2. Existing otoliths from Emmett studies may be available.
B.C. Vancouver:
1. Ricker survey samples and existing otoliths
Sampling Protocols for otolith microchemistry and DNA analyses Samples with the most ancillary biological and oceanographic information will be most useful for genetic and microchemistry analyses. Otoliths from existing ageing programs in Mexico, US and Canada would be the easiest place to begin microchemistry studies. Fin clips or other tissue samples from the same individuals used for ageing would provide the best DNA samples. Samples for DNA could be taken when otoliths are being removed. A fin clip or piece of tissue should be placed in ethanol for DNA analyses when otoliths are being removed and other life history characters such as length and weight are being recorded. Occurrence of VHSV in natural populations Acute viral hemorrhagic septicemia (VHS) appears to be triggered by cold temperature and or other stressors. The occurrence of VHS in the warmer parts of the sardine’s range and the susceptibility of southern stocks to the virus causing VHS (VHSV) are unknown. A priority issue is the survey of southern populations for the presence of VHSV and the characterization of the viral strains if discovered.
24
Sampling Protocols for VHSV Sampling Sampling for the presence of VHSV requires more stringent conditions than those for DNA or otoliths. Sampling can be done to detect the presence of virus or to preserve the virus in a viable state so that it can be cultured and studied. Sampling to detect the presence of virus requires a solution that will prevent enzymatic destruction of the viral genome. In particular an RNAase inhibitor must be added to prevent the cleavage of the single stranded viral RNA. When the proper buffer is provided, along with training in finding viral rich tissues such as spleen and kidney and training in the use of disposable dissecting tools to prevent cross contamination, good results can be expected. Juveniles would be most desirable. Linking to Stock Demographics It is critical that sampling for population structure and incidence of VHS disease be closely coupled with that needed to characterize the population demographically (age and size structure, growth, and size and age at first maturity). Clearly, if genetic and or otolith microchemistry studies reveal the existence of separate substocks of Pacific sardine, the demography of each substock must be known to deal with this new information in an assessment. Similarly, the epidemiology of sardine VHSV shall be greatly strengthened, and the possible fishing strategies to avoid the disease broadened, if the demography of the substocks is understood. Scientists from NOAA Fisheries, La Jolla (Russ Vetter), CICESE, Ensenada (Sharon Herzka), CICIMAR-IPN, (Roberto Feliz Urraga) and CRIP-Guaymas-INP (Manuel Nevarez Martinez) will explore preparation of a proposal for joint US-Mexico education funds that would begin studies of microchemistry and genetic differences between Sea of Cortez and outer coast populations.
1. Russ Vetter will consult with new genetics professors at CICESE and with geneticists who
have an interest in the genetics of clupeoid fishes, (e.g. Stew Grant, Dennis Hedgecock and Kristy Miller-Saunders), on the most productive approaches for examining the genetics of sardine.
2. Paul Smith will continue to examine vertebral counts (particularly from Cedros Island
fishery and San Diego) to see if fish with different thermal birth temperatures occur in the San Diego landings as a possible look at different natal origins for fish landed in the fishery. This does not address the issue of stocks in a genetic sense.
3. Russ Vetter will discuss integration of sampling and archiving protocols with Age Structure
and Validation Working Group (K. Hill). 4. Ron Hedrick will stay in touch with sampling efforts of the group in an effort to obtain
samples for both live virus (virus isolation) and / or preserved tissues that can be used to detect the virus by PCR analyses.
25
TRINATIONAL SARDINE FORUM - DEC 2002 – PAUL SMITH Fundamental differences in sardine larval abundance by season and geographic location
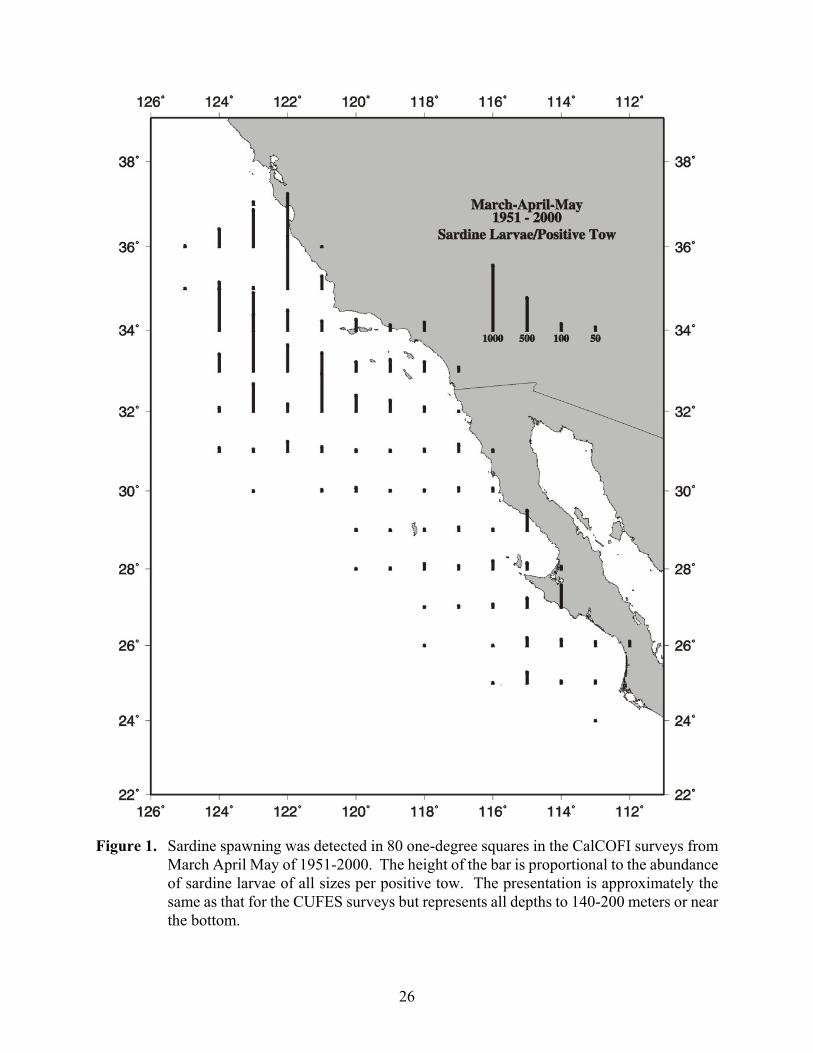
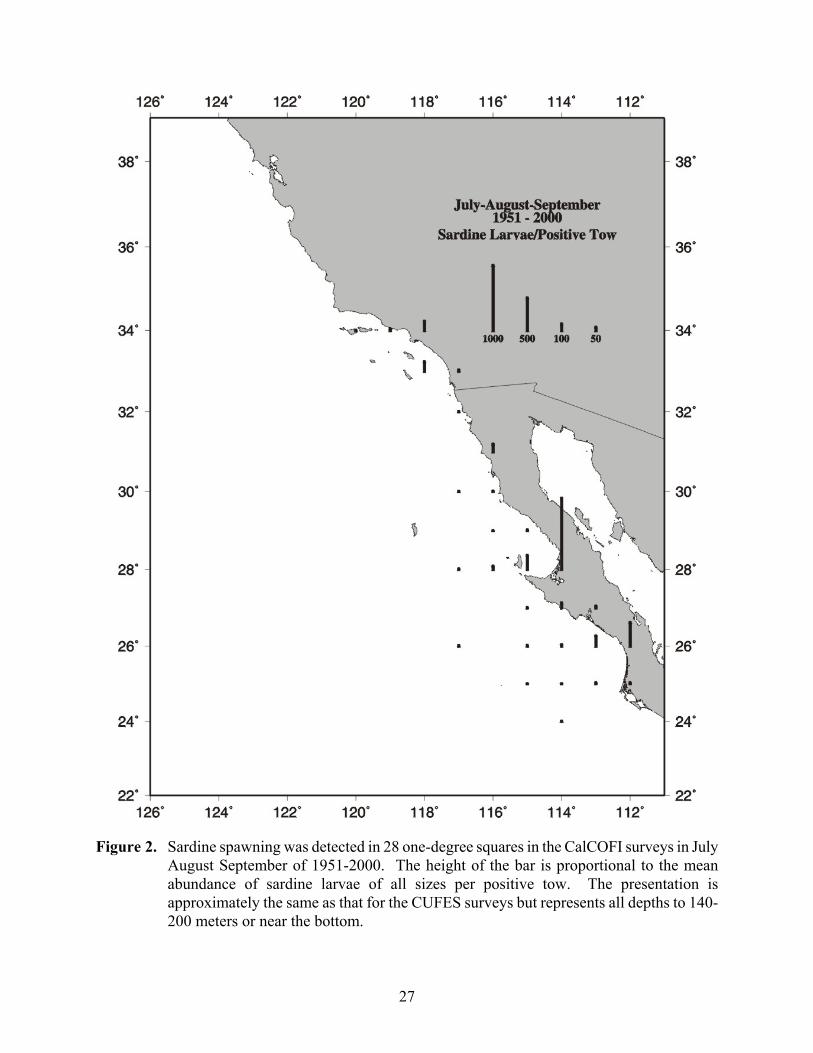
Whatever the future work regarding stock structure shows, the egg pump (CUFES) has changed our view of this species. In particular, the extensive surveys in the 20's and 30's showed a high abundance of sardine offshore, but by 1938 ( and until 1994), it was believed that the major spawning was in the Southern California Bight. If we isolate sardine stock size from the abundance of spawn, we see that the major spawning concentrations in the 1951-2000 period were offshore of Central California, with reduced spawning nearshore in the SCB and along the coast of Baja California in cool water in spring (Mar Apr May Figure 1). In the summer, this historical view places the major concentrations nearshore off Baja California in the vicinity of Sebastian Vizcaino Bay and Magdalena Bay (Figure 2). If incipient subpopulation changes start with isolation, this isolation at spawning time could be important, since the spawners of the imputed northern stock would be feeding in the Pacific Northwest, while the spawning at headlands, bays, and estuaries continues through the summer in extremely warm habitats.
26
Figure 1. Sardine spawning was detected in 80 one-degree squares in the CalCOFI surveys from
March April May of 1951-2000. The height of the bar is proportional to the abundance of sardine larvae of all sizes per positive tow. The presentation is approximately the same as that for the CUFES surveys but represents all depths to 140-200 meters or near the bottom.
27
Figure 2. Sardine spawning was detected in 28 one-degree squares in the CalCOFI surveys in July
August September of 1951-2000. The height of the bar is proportional to the mean abundance of sardine larvae of all sizes per positive tow. The presentation is approximately the same as that for the CUFES surveys but represents all depths to 140-200 meters or near the bottom.

28
This page intentionally left blank.
29
APPENDIX I: List of Participants
Trinational Sardine Forum San Pedro, CA
December 5-6, 2002
Canada: Gordon (Sandy) McFarlane Department of Fisheries & Oceans P.O. Box 100 3190 Hammond Bay Road Nanaimo, B.C. V9R 5K6 Canada Ph: (250) 756-7052 Fx: (250) 756-7053 E-mail: [email protected] Lisa Mijacika Department of Fisheries & Oceans 460-555 W. Hastings Street Nanaimo, B.C. V6B SG3 Canada Ph: (604) 666-2188 Fx: (604) 666-9136 E-mail: [email protected] Don Pepper Pacific Sardine Association #6-3555 Westminster Highway Richmond, B.C. V7C 5P6 Ph: (604) 303-0141 E-mail: [email protected] Jake Schweigert Department of Fisheries & Oceans Canada Pacific Biological Station Nanaimo, B.C. V9T 6N7 Canada Ph: (250)-756-7203 Fx: (250)-756-7138 E-mail: [email protected]
México: Tim Baumgartner CICESE Carretera Tijuana – Ensenada Km. 107 Ensenada, B.C. México Ph: (52-646) 174-5983 Fx: (52-646) 175-2158 E-mail: [email protected] Sarita de la Campa CICESE Carretera Tijuana – Ensenada Km. 107 Ensenada, B.C. México Ph: (52-646) 175-5050 ext. 24291 E-mail: [email protected] Celia Eva Cotero-Altamirano Centro Regional de Investigación Pesquera Instituto Nacional de la Pesca (INP) Apartado Postal 1360 Ensenada, B. C. México Ph: (52-646) 174-60-85 Fx: (52-646) 174-61-35 E-mail: [email protected] Juan Carlos Delgado California Bahias Parque Industrial FONDEPORT El Sauzal de Rodríguez C.P. 22760 Ensenada, B.C. México Ph: (52-646) 174-7188 Fx: (52-646) 174-6887 E-mail: [email protected]
30
Roberto Félix Uraga CICIMAR-IPN Ave. IPN s/n A.P. 592 Col. Playa Palo Sta. Rita C.P. 23096 La Paz, B. C. S. México Ph: (52-612) 122-53-44 Ext. 82422 E-mail: [email protected] René Funes Rodriguez CICIMAR-IPN Av. IPN s/n, A.P. 592 Col. Playa Palo Sta. Rita. C.P. 23096 La Paz, B.C. S. México Ph: (612) 123-4666 Fx: (612) 122-5322 E-mail: [email protected] Walterio García Franco Centro Regional de Investigación Pesquera Instituto Nacional de la Pesca (INP) Apartado Postal 1360 Ensenada, B. C. México Ph: (52-646) 174-60-85 Fx: (52-646) 174-61-35 E-mail: [email protected] Yanira Green Ruiz INP-CRIP-Maz. Calz. SBbalo-Cerritos S/N MazatlBn, Sin. Mexico Ph: Fx: E-mail: Ragnar Gutiérrez A. Productos Marinos ABC, S. A. de C. V. Parque Industrial FONDEPORT El Sauzal de Rodriguez C.P. 22760 Ensenada, B. C. México Ph: (52-646) 174-73-84 Fx: (52-646) 714-6055 E-mail: [email protected]
Martin HernBndez Rivas CICIMAR-IPN Av. L.P.N. S/N P.O. Box 592 23000 La Paz, BCS Mexico Ph: Fx: E-mail: Sharon Z. Herzka CICESE Carretera Tijuana – Ensenada Km. 107 Ensenada, 22860, B.C. México Ph: (52-646) 174-5050 ext. 24259 Fx: (52- 646)-175-0545 E-mail: [email protected] Carlos Jaimes Cantu Baja Mex Internacional Calle Primera Edificio 68 local 16 Entre Morelos e Hidalgo El Sauzal C.P. 22760 Ensenada, B.C. México Ph: (52-646) 174-6990 Fx: (52-646) 174-7170 E-mail: [email protected] Manuel Otilio Nevarez Martínez CRIP- GUAYMAS- INP Calle Miguel Aleman No. 605 Sur Guaymas, Sonora México 85400 Ph: (52-622) 222-59-25 Fx: (52-622) 222-10-21 E-mail: [email protected] Ricardo Thompson Ramírez Buena Pesca, S. A. de C. V. Recinto Portuario No. 193, Local 1 Edificio del Puerto El Sauzal de Rodriguez Ensenada, B. C. México Ph: (52-646) 174-64-81 (52-646) 174-65-44 Fx: (52-646) 174-65-40 E-mail: [email protected] [email protected]
31
René Torres Villegas CICIMAR-IPN Ave. IPN s/n A.P. 592 Col. Playa Palo Sta. Rita C.P. 230096 La Paz, B. C. S. México Ph: (52-612) 122-53-44 Fx: (52-612) 122-53-22 E-mail: [email protected] United States: Dimitry Abramenkoff National Marine Fisheries Service 8604 La Jolla Shores Dr. La Jolla, CA 92037 USA Ph: (858) 546-7126 Fx: (858) 546-5656 E-mail: [email protected] Orlando Amoroso So. California Commercial Fishing Assoc. Berth 73 San Pedro, CA 90731 USA Ph: (310) 831-6201 Fx: (310) 831-6777 E-mail: [email protected] Darrin Bergen California Department of Fish & Game 8604 La Jolla Shores Drive La Jolla, CA 92037-1508 USA Ph: (858) 546-5690 Fx: (858) 546-7116 E-mail: [email protected] Richard Charter National Marine Fisheries Service 8604 La Jolla Shores Dr. La Jolla, CA 92037-0271 USA Ph: (858) 546-7157 Fx: (858) 546-5656 E-mail: [email protected]
Brian Culver Washington Dept. of Fish & Wildlife 48 Devonshire Road Montesano, WA 98563 USA Ph: (360) 249-1205 Fx: (360) 664-0689 E-mail: [email protected] K. Alexandra Curtis Scripps Institution of Oceanography 9500 Gilman Drive La Jolla, CA 90293-0218 USA Ph: (858) 534-4228 E-mail: [email protected] Vanessa DeLuca State Fish Company, Inc. 2194 Signal Place San Pedro, CA 90731 USA Ph: (310) 832-2633 E-mail: [email protected] P. Felando 1903 S Grand Avenue San Pedro, CA 90731 Ph: Fx: E-mail: Dave Griffith National Marine Fisheries Service 8604 La Jolla Shores Dr. La Jolla, CA 92037 USA Ph: (858) 546-7155 Fx: (858) 546-5656 E-mail: [email protected] Ron Hedrick Department of Medicine & Epidemiology School of Veterinary Medicine University of California, Davis 2118A Tupper Hall Davis, CA 95616 USA Ph: (530) 752-3411 E-mail: [email protected]
32
Sam Herrick, Jr. National Marine Fisheries Service 8604 La Jolla Shores Dr. La Jolla, CA 92037 USA Ph: (858) 546-7111 Fx: (858) 546-5656 E-mail: [email protected] Kevin Hill California Department of Fish & Game 8604 La Jolla Shores Drive La Jolla, CA 92037-1508 USA Ph: (858) 546-7052 Fx: (858) 546-7116 E-mail: [email protected] John Hunter National Marine Fisheries Service 8604 La Jolla Shores Dr. La Jolla, CA 92037 USA Ph: (858) 546-7127 Fx: (858) 546-5656 E-mail: [email protected] Christina S. Johnson California Sea Grant Scripps Institution of Oceanography 9500 Gilman Dr., Mail Code 0232 La Jolla, CA 92107 USA Ph: (858) 822-5334 Fx: E-mail: [email protected] Darrell Kapp Astoria Pacific Seafood P.O. Box 1180 Astoria, OR 97103 USA Ph: (503) 325-3156 Fx: (503) 325-3229 Email: [email protected]
Ryan Kapp Gulf Vessel Management 955 Colony Ct. Bellingham, WA 98229 USA Ph: (360) 714-0882 E-mail: [email protected] Leeanne M. Laughlin California Department of Fish & Game 4665 Lampson Avenue, Suite C Los Alamitos, CA 90720 USA Ph: (562) 342-7167 Fx: (562) 342-7139 E-mail: [email protected] Nancy Lo National Marine Fisheries Service 8604 La Jolla Shores Dr. La Jolla, CA 92037-0271 USA Ph: (858) 546-7123 Fx: (858) 546-5656 E-mail: [email protected] Beverly Macewicz National Marine Fisheries Service 8604 La Jolla Shores Dr. La Jolla, CA 92037 USA Ph: (858) 546-7107 Fx: (858) 546-5656 E-mail: [email protected] Jean McCrae Oregon Dept. of Fish and Wildlife 2040 SE Marine Science Drive Newport, OR 97365 USA Ph: (541) 867-0300, ext. 245 Fx: (541) 867-0311 E-mail: [email protected]
33
Jim Morgan National Marine Fisheries Service 501 W. Ocean Blvd., Suite 4200 Long Beach, CA 90802-4213 USA Ph: (562) 980-4036 Fx: (562) 980-4047 E-mail: [email protected] Tony Morton NMFS SW Region 501 W Ocean Blvd. Long Beach, CA 90802 Ph: (562) 980-3209 Fx: (562) 980 E-mail: [email protected] Kelly M. O’Reilly California Department of Fish & Game 4665 Lampson Avenue, Suite C Los Alamitos, CA 90720 USA Ph: (562) 342-7187 Fx: (562) 342-7139 E-mail: [email protected] Steve Seltzer Conal Bay International Inc. 907 W. Domingo Drive San Gabriel, CA 91775 USA Ph: Fx: E-mail: Diane Pleschner-Steele DB Pleschner & Associates P.O. Box 336 Buellton, CA 93427 USA Ph: (805) 693-5430 Fx: (805) 686-9312 E-mail: [email protected] Michelle K. Robinson Washington Dept. of Fish & Wildlife 48 Devonshire Road Montesano, WA 98563 Ph: (360) 249-1211 Fx: (360) 664-0689 E-mail: [email protected]
John Royal P.O. Box 1162 San Pedro, CA 90733 USA Paul Smith National Marine Fisheries Service 8604 La Jolla Shores Dr. La Jolla, CA 92037-0271 USA Ph: (858) 546-7169 Fx: (858) 546-5656 E-mail: [email protected] Dale Sweetnam California Department of Fish and Game Southwest Fisheries Science Center 8604 La Jolla Shores Dr. La Jolla, CA 92037 USA Ph: (858) 546-7170 Cll: (858) 243-3778 Fx: (858) 546-7116 E-mail: [email protected] Russ Vetter National Marine Fisheries Service 8604 La Jolla Shores Dr. La Jolla, CA 92037-0271 USA Ph: (858) 546-7125 Fx: (858) 546-5656 E-mail: [email protected] Dan Waldeck Pacific Fishery Management Council 7700 NE Ambassador Place, Suite 200 Portland, OR 97220-1384 USA Ph: (503) 820-2280 Fx: (503) 820-2299 E-mail: [email protected] Stephen Wertz California Department of Fish & Game Coastal Pelagic Species Unit 4665 Lampson Avenue, Suite C Los Alamitos, CA 90720 USA Ph: (562) 342-7184 Fx: (562) 342-7139 E-mail: [email protected]

34
This page intentionally left blank.
35
APPENDIX II: Agenda
2002 TRINATIONAL SARDINE FORUM Agenda
SOUTHERN CALIFORNIA COMMERICAL FISHING ASSOCIATION HEADQUARTERS San Pedro, CA USA December 5-6, 2002
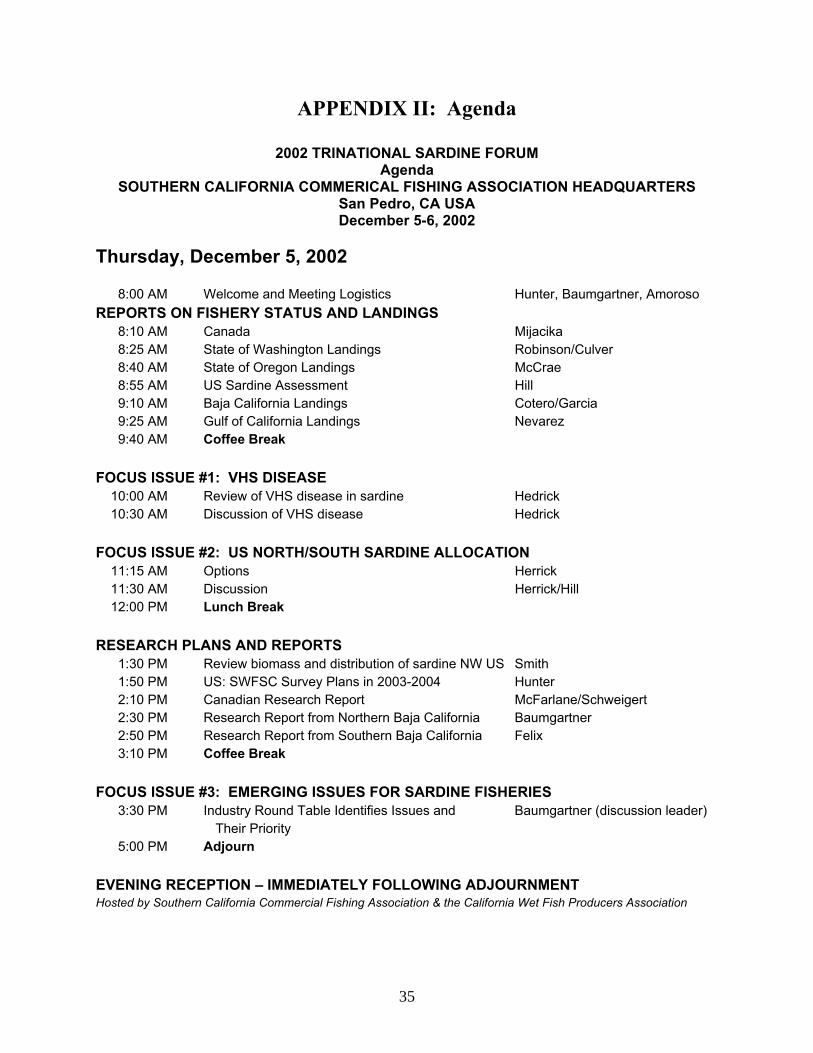
Thursday, December 5, 2002 8:00 AM Welcome and Meeting Logistics Hunter, Baumgartner, Amoroso REPORTS ON FISHERY STATUS AND LANDINGS 8:10 AM Canada Mijacika 8:25 AM State of Washington Landings Robinson/Culver 8:40 AM State of Oregon Landings McCrae 8:55 AM US Sardine Assessment Hill 9:10 AM Baja California Landings Cotero/Garcia 9:25 AM Gulf of California Landings Nevarez 9:40 AM Coffee Break FOCUS ISSUE #1: VHS DISEASE 10:00 AM Review of VHS disease in sardine Hedrick 10:30 AM Discussion of VHS disease Hedrick FOCUS ISSUE #2: US NORTH/SOUTH SARDINE ALLOCATION 11:15 AM Options Herrick 11:30 AM Discussion Herrick/Hill 12:00 PM Lunch Break RESEARCH PLANS AND REPORTS 1:30 PM Review biomass and distribution of sardine NW US Smith 1:50 PM US: SWFSC Survey Plans in 2003-2004 Hunter 2:10 PM Canadian Research Report McFarlane/Schweigert 2:30 PM Research Report from Northern Baja California Baumgartner 2:50 PM Research Report from Southern Baja California Felix 3:10 PM Coffee Break FOCUS ISSUE #3: EMERGING ISSUES FOR SARDINE FISHERIES 3:30 PM Industry Round Table Identifies Issues and Baumgartner (discussion leader) Their Priority 5:00 PM Adjourn EVENING RECEPTION – IMMEDIATELY FOLLOWING ADJOURNMENT Hosted by Southern California Commercial Fishing Association & the California Wet Fish Producers Association
36
2002 TRINATIONAL SARDINE FORUM Agenda
SOUTHERN CALIFORNIA COMMERICAL FISHING ASSOCIATION HEADQUARTERS San Pedro, CA USA December 5-6, 2002
Friday, December 6, 2002 6:00 AM Optional Field Trip to San Pedro Processing Plant 8:00 AM Light Breakfast provided in meeting room
8:30 AM Instructions to Working Groups
8:45 AM Working Groups meet
10:00 AM Coffee Break
10:15 AM Working Groups resume meetings
12:00 AM Lunch 1:30 PM Working Groups report back
3:30 PM Coffee Break
3:50 PM Write Key Finds and Recommendations for 2002 Report
5:30 PM Adjourn
TRINATIONAL WORKING GROUPS Regional Estimates of Biomass [Lo, Chair] Stock Structure and Latitudinal Origins (includes genetics and VHS disease) [Vetter, Acting Chair] Age Structure and Validation [Hill, Chair]
37
APPENDIX III: Acronyms BPA Bonneville Power Administration CalCOFI California Cooperative Oceanic Fisheries Investigations CalVET CalCOFI vertical egg tow CANSAR Catch at age analysis for sardine CDF&G California Department of Fish and Game CICESE Centro de Investigacion Cientifica y de Educacion Superior de Ensenada, B.C. CICIMAR-IPN El Centro de Investigacion Cientifica y de Educacion Superior de Ensenada CONACYT National Science and Technology Council CRIP Centro Regional de Investigaciones Pesqueras de Quaymas CTD Conductivity-Temperature-Density (or depth) CUFES Continuous Underway Fish Egg Sampler DEPM Daily Egg Production Method DFO Department of Fisheries & Oceans, Canada EPCOR-IAI Eastern Pacific Consortium of the Inter-American Institute for Global Change
Research IMECOCAL Investigaciones Mexicanas de la Corriente de California INP Instituto Nacional de la Pesca MOU Memorandum of Understanding NMFS National Marine Fisheries Service NWFSC Northwest Fisheries Science Center ODFW Oregon Department of Fish and Wildlife PFMC Pacific Fishery Management Council SCCFA Southern California Commercial Fishing Association SIO Scripps Institution of Oceanography SNIPS single nucleotide polymorphisms SWFSC Southwest Fisheries Science Center TSF Trinational Sardine Forum VHS viral hemorrhagic septicemia WDFW Washington Department of Fish and Wildlife WG Working Group

38
This page intentionally left blank.
39
APPENDIX IV: Contributed Abstracts and Summaries

40
This page intentionally left blank.
Stock Assessment of Pacific Sardine with Management Recommendations for 2003
Executive Summary
by
Ramon J. Conser1, Kevin T. Hill2, Paul R. Crone1, Nancy C.H. Lo1, and Darrin Bergen2
Submitted to:Pacific Fishery Management Council
7700 NE Ambassador Place, Suite 200Portland, OR 97220
October 2002
Addresses for authors:
1 NOAA/NMFSSouthwest Fisheries Science Center8604 La Jolla Shores Dr.La Jolla, CA 92038
2 California Department of Fish and GameSouthwest Fisheries Science Center8604 La Jolla Shores Dr.La Jolla, CA 92038
This document is available electronically at:http://swfsc.nmfs.noaa.gov/frd/Coastal%20Pelagics/Sardine/sardine1.htm
42
Introduction
The following summary presents pertinent results and harvest recommendations from a stock assessmentconducted on Pacific sardine (Sardinops sagax). It is an update to the stock assessment carried out lastyear (Conser et al. 2001), and is intended for use by the Pacific Fishery Management Council (PFMC)when developing management goals for the upcoming fishing season for sardine beginning January 2003.
The assessment results presented here are applicable to the sardine population off the North America Pacificcoast from Baja California, Mexico to British Columbia, Canada. Research surveys (fishery-independent)have been conducted on an annual basis in the spawning areas off central and southern California. For mostof the contemporary time series (1983-98), significant fishing for sardine occurred only off northern Mexicoand California (Area 1 or Inside Area). As the sardine population rebuilt and expanded its range through themid-1990's, sardine became more available seasonally off Oregon, Washington, and British Columbia. Subsequently, fisheries in these more northerly areas expanded with significant landings beginning in 2000. As in past assessments, research survey data (fishery-independent) are used to index the size of the sardinespawning biomass; and when coupled in a modelling framework with fishery-dependent data and structuralinformation on sardine biology and migration, provide the stock size estimates and demographics needed bythe PFMC to establish harvest guidelines for the USA fisheries.
Methods
An age-structured stock assessment model (CANSAR-TAM, Catch-at-age ANalysis for SARdine - TwoArea Model, see Hill et al.1999) was applied to fishery-dependent and fishery-independent data to deriveestimates of population abundance and age-specific fishing mortality rates. In 1998, the original CANSARmodel (Deriso et al. 1996) was modified to account for the expansion of the population northward to watersoff the Pacific northwest. The models are based on a ‘forward-simulation’ approach, whereby parameters(e.g., population sizes, recruitments, fishing mortality rates, gear selectivities, and catchability coefficients)are estimated after log transformation using the method of nonlinear least squares. The terms in theobjective function (to be minimized) included the sum of squared differences in (loge) observed and (loge)predicted estimates from the catch-at-age and various sources of auxiliary data used for ‘tuning’ the model,e.g., indices of abundance from research survey data. Bootstrap procedures were used to calculate varianceand bias (95% confidence intervals) of sardine biomass and recruitment estimates generated from theassessment model. The CANSAR-TAM model was based on two fisheries (California, U.S. and Ensenada,Mexico) and semesters within a year were used as time steps, with ages being incremented betweensemesters on July 1 and spawning that was assumed to occur on April 1 (middle of the first semester).
Fishery-dependent data from the California and Ensenada fisheries (1983 to first semester 2002) were usedto develop the following time series: (1) catch (in mt)-Table 1 and Figure-1; (2) catch-at-age in numbers offish; and (3) estimates of weight-at-age. Fishery-independent data (time series) from research surveysincluded the following indices, which were developed from data collected from Area 1 (Inside Area,primarily waters off central and southern California) and used as relative abundance measures (Table 2): (1) index (proportion-positive stations) of sardine egg abundance from California Cooperative Oceanic andFisheries Investigations (CalCOFI) survey data (CalCOFI Index)-Figure 2; (2) index of spawning biomass(mt) based on the Daily Egg Production Method (DEPM) survey data (DEPM Index)-Figure 3, see Lo et al.(1996); (3) index of spawning area (Nmi2) from CalCOFI and DEPM survey data (Spawning Area Index)-Figure 4, see Barnes et al. (1997); and (4) index of pre-adult biomass (mt) from aerial spotter plane surveydata (Aerial Spotter Index)-Figure 5, see Lo et al. (1992). Time series of sea-surface temperatures (Figure6) recorded at Scripps Pier, La Jolla, California were used to determine appropriate harvest guidelines (Sea-
43
surface Temperature Index), see Amendment 8 of the Coastal Pelagic Species Fishery Management Plan,Option J, Table 4.2.5-1, PFMC (1998).
Survey indices of relative abundance were re-estimated using generally similar techniques as was done inprevious assessments (Hill et al. 1999; Conser et al. 2000; and Conser et al. 2001). The final modelconfiguration was based on equally ‘weighted’ indices except for the CalCOFI index, which wasdownweighted to 0.7 (relative to 1.0 for the other indices). The relative weight used for the CalCOFI index(0.7) was consistent with previous assessments in which the proportion of the total spawning area coveredby the CalCOFI surveys (~70%) was used to determine its relative weighting in the model. Further theCalCOFI Index has undergone considerable saturation in recent years due to the higher frequency ofpositive stations as the sardine stock expanded throughout and beyond the southern California Bight. As inthe previous assessment, the CalCOFI index was fit with a non-unity exponent (0.3547) to allow for anonlinear relationship between the index and sardine spawning biomass. This procedure produced a betterfit to these data and a more acceptable residual pattern than assuming the classical linear relationshipbetween the index of abundance and population size. As in the two previous assessments, the Aerial SpotterIndex was assumed to primarily track pre-adult fish (ages 0 and 1 plus a portion of age 2 fish). All of theother fishery-independent indices were used as indices of the spawning stock biomass, which can beapproximated by the biomass of ages 1+ sardine.
Recognizing that the geographical extent of the sardine population tends to increase as population sizeincreases (inferred largely from tagging data and the expansion of the fishery in the 1930's), the CANSAR-TAM model uses explicit time-varying migration rates to `move’ sardine from the well-sampled Area 1(roughly Baja California through central California) to the larger, coastwide stock area. Internal consistencychecks are done to ensure that reasonable numbers of sardine are present outside Area 1 to account for thecatches of the developing fisheries in the Pacific Northwest. In conjunction with this assessment, asensitivity run was carried out in which (i) the available catch-at-age from Oregon and Washington fisheries(mostly 2000 and 2001) were formally incorporated into the model and (ii) no structural assumptionsregarding migration rates were imposed. As the time series of catch-at-age data from the PacificNorthwest fisheries accumulates and fishery-independent data become available from northern areas, thestructure of this sensitivity run is likely to become the template for future sardine stock assessments.
Results
Pacific sardine landings for the directed fisheries off California, USA and Ensenada, Mexico decreased fromthe high levels that were reached during 2000 (109,000 mt), with a total 2002 harvest of roughly 81,000 mt(Table 1, Figure 1); however, note that semester 2 landings in 2002 reflect projected estimates based onlanding patterns observed in the fisheries during the mid to late 1990s (Table 1). Both California andEnsenada landings in 2002 are expected to decrease from the 2000 level, with a more notable decrease inthe projected Ensenada landings (51,000 mt in 2000, decreasing to 27,000 mt in 2002). Currently, the USAfishery is regulated using a quota (harvest guideline) management scheme and the Mexico fishery (Ensenadalandings) is essentially unregulated.
As has been the case in recent years, landings from the USA Pacific sardine fishery (California, Oregon, andWashington) are below the harvest guideline recommended for 2002 (118,000 mt), with roughly 79,000 mtlanded through September 2002 and 87,000 mt projected landings for the entire year (the fishing year endsDecember 31, 2002).
Estimated stock biomass (>1-year old fish on July 1, 2002) from the assessment conducted this year
44
indicated the sardine population has remained at a relatively high abundance level, with a bias-correctedestimate of nearly 1.0 million mt (Table 3 and Figure 7). Estimated recruitment (age-0 fish on July 1)during the past four years has declined considerably from that estimated for the strong 1998 year-class(Table 3 and Figure 8). However, it should be noted that recent recruitment (4-22 billion recruits) is notestimated precisely (Figure 8), and another 2-3 years of data may be needed to ascertain whether thesardine population biomass has reached a plateau at the 1.0 million mt level (Figure 7).
Estimates of Pacific sardine biomass from the 1930's (Murphy 1966 and MacCall 1979) indicate that thesardine population may have been more than three times its current size prior to the population decline andeventual collapse in the 1960's (Figure 9). Considering the historical perspective, it would appear that thesardine population, under the right conditions, may still have growth potential beyond its present size. However, per capita recruitment estimates show a downward trend in recruits per spawner in recent yearsthat may be indicative of a stock that has reached a plateau under current environmental conditions (Conseret al. 2001).
The estimate of 2002 stock biomass from the sensitivity run (in which available catch-at-age from Oregonand Washington fisheries were formally incorporated into the model and no structural assumptions regardingmigration rates were imposed) was virtually identical to the corresponding estimate from the baselineassessment model, described above (Figure 10). Most annual biomass estimates from the sensitivity run fellwithin the 95% confidence interval from the baseline assessment (with notable exceptions in 1998 and1999). However, biomass estimates from the sensitivity run were systematically smaller than those fromthe baseline during the (recent) years of rapid stock size increase. This may be indicative of a rapidlygrowing and expanding stock coupled with a lag in the development of fisheries in the northern area to`sample’ the sardine in that area. Overall, confidence intervals on stock biomass from the sensitivity runwere much broader than those from the baseline and some parameters were poorly estimated (e.g.selectivity for the northern fishery). It is reasonable to expect the performance of this model configurationto improve as the time series of catch-at-age data from the Pacific Northwest fisheries accumulates andfishery-independent data become available for northern areas.
Harvest Guideline for 2003
The harvest guideline recommended for the U.S. (California, Oregon, and Washington) Pacific sardinefishery for 2003 is 110,908 mt. Statistics used to determine this harvest guideline are discussed below andpresented in Table 4. To calculate the proposed harvest guideline for 2003, we used the maximumsustainable yield (MSY) control rule defined in Amendment 8 of the Coastal Pelagic Species-FisheryManagement Plan, Option J, Table 4.2.5-1, PFMC (1998). This formula is intended to prevent Pacificsardine from being overfished and maintain relatively high and consistent catch levels over a long-termhorizon. The Amendment 8 harvest formula for sardine is:
HG2003 = (TOTAL STOCK BIOMASS2002 - CUTOFF) • FRACTION • U.S. DISTRIBUTION,
where HG2003 is the total U.S. (California, Oregon, and Washington) harvest guideline recommended for2003, TOTAL STOCK BIOMASS2002 is the estimated stock biomass (ages 1+) from the currentassessment conducted in 2002 (see above), CUTOFF is the lowest level of estimated biomass at whichharvest is allowed, FRACTION is an environment-based percentage of biomass above the CUTOFF thatcan be harvested by the fisheries (see below), and U.S. DISTRIBUTION is the percentage of TOTALSTOCK BIOMASS2002 in U.S. waters.
45
The value for FRACTION in the MSY control rule for Pacific sardine is a proxy for Fmsy (i.e., the fishingmortality rate that achieves equilibrium MSY). Given Fmsy and the productivity of the sardine stock havebeen shown to increase when relatively warm-water ocean conditions persist, the following formula hasbeen used to determine an appropriate (sustainable) FRACTION value:
FRACTION or Fmsy = 0.248649805(T2) - 8.190043975(T) + 67.4558326,
where T is the running average sea-surface temperature at Scripps Pier, La Jolla, California during the threepreceding years. Ultimately, under Option J (PFMC 1998), Fmsy is constrained and ranges between 5% and15% (Figure 11).
Based on the T values observed throughout the period covered by this stock assessment (1983-2002), theappropriate Fmsy exploitation fraction has consistently been 15% (see Figures 6 and 11); and this remains thecase under current oceanic conditions (T2002 = 17.3 °C). However, it should be noted that the decline insea-surface temperature observed in recent years (1998-2002) may invoke environmentally-basedreductions in the exploitation fraction as early as next year (i.e. in setting the harvest guideline for the 2004fishing season) – see Figure 11.
Although the 2003 USA harvest guideline (110,908 mt) is less than the 2002 level (118,442 mt), recentfishery practices indicate that it may not be constraining with regard to USA fishery landings in 2003 (Figure12). However, should the recent declining recruitment trend estimated in this assessment be confirmed withfuture work, and should the sea-surface temperature decline, it is likely that harvest guidelines in the outyears will constrain USA fishery practices and removals.
Further when viewed on a stock-wide basis and considering the landings of Mexico and Canada as well asthe USA, adherence to an implied ‘stock-wide harvest guideline’ may constrain fisheries even without sea-surface temperature declines. Figure 13 compares recent international landings with the annual harvestguidelines that would have resulted from applying the PFMC CPS FMP harvest formula (above) absent the“U.S. Distribution” term. Should Oregon and Washington landings continue to increase (at ratescomparable to the past few years) and/or Mexican landings return to their 1999-2000 levels, the impliedstock-wide harvest guideline may be exceeded as early as next year (2003).
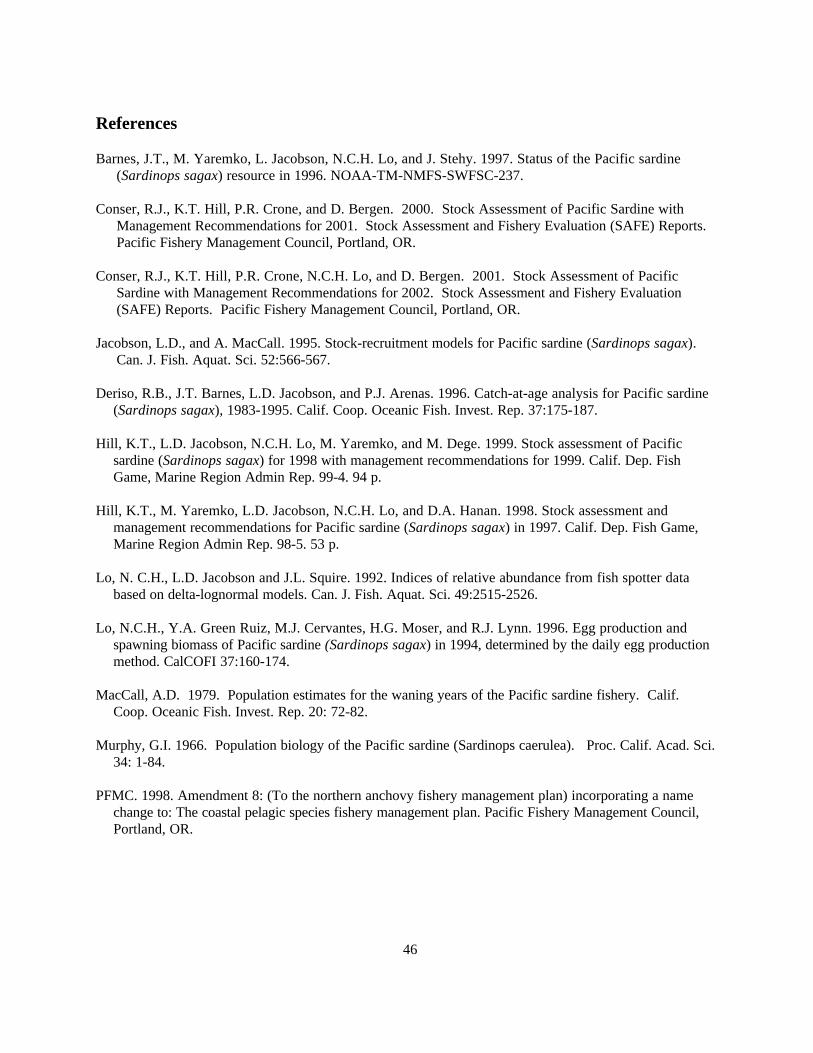
46
References
Barnes, J.T., M. Yaremko, L. Jacobson, N.C.H. Lo, and J. Stehy. 1997. Status of the Pacific sardine(Sardinops sagax) resource in 1996. NOAA-TM-NMFS-SWFSC-237.
Conser, R.J., K.T. Hill, P.R. Crone, and D. Bergen. 2000. Stock Assessment of Pacific Sardine with Management Recommendations for 2001. Stock Assessment and Fishery Evaluation (SAFE) Reports. Pacific Fishery Management Council, Portland, OR.
Conser, R.J., K.T. Hill, P.R. Crone, N.C.H. Lo, and D. Bergen. 2001. Stock Assessment of Pacific Sardine with Management Recommendations for 2002. Stock Assessment and Fishery Evaluation(SAFE) Reports. Pacific Fishery Management Council, Portland, OR.
Jacobson, L.D., and A. MacCall. 1995. Stock-recruitment models for Pacific sardine (Sardinops sagax).Can. J. Fish. Aquat. Sci. 52:566-567.
Deriso, R.B., J.T. Barnes, L.D. Jacobson, and P.J. Arenas. 1996. Catch-at-age analysis for Pacific sardine(Sardinops sagax), 1983-1995. Calif. Coop. Oceanic Fish. Invest. Rep. 37:175-187.
Hill, K.T., L.D. Jacobson, N.C.H. Lo, M. Yaremko, and M. Dege. 1999. Stock assessment of Pacificsardine (Sardinops sagax) for 1998 with management recommendations for 1999. Calif. Dep. FishGame, Marine Region Admin Rep. 99-4. 94 p.
Hill, K.T., M. Yaremko, L.D. Jacobson, N.C.H. Lo, and D.A. Hanan. 1998. Stock assessment andmanagement recommendations for Pacific sardine (Sardinops sagax) in 1997. Calif. Dep. Fish Game,Marine Region Admin Rep. 98-5. 53 p.
Lo, N. C.H., L.D. Jacobson and J.L. Squire. 1992. Indices of relative abundance from fish spotter databased on delta-lognormal models. Can. J. Fish. Aquat. Sci. 49:2515-2526.
Lo, N.C.H., Y.A. Green Ruiz, M.J. Cervantes, H.G. Moser, and R.J. Lynn. 1996. Egg production andspawning biomass of Pacific sardine (Sardinops sagax) in 1994, determined by the daily egg productionmethod. CalCOFI 37:160-174.
MacCall, A.D. 1979. Population estimates for the waning years of the Pacific sardine fishery. Calif. Coop. Oceanic Fish. Invest. Rep. 20: 72-82.
Murphy, G.I. 1966. Population biology of the Pacific sardine (Sardinops caerulea). Proc. Calif. Acad. Sci.34: 1-84.
PFMC. 1998. Amendment 8: (To the northern anchovy fishery management plan) incorporating a namechange to: The coastal pelagic species fishery management plan. Pacific Fishery Management Council,Portland, OR.
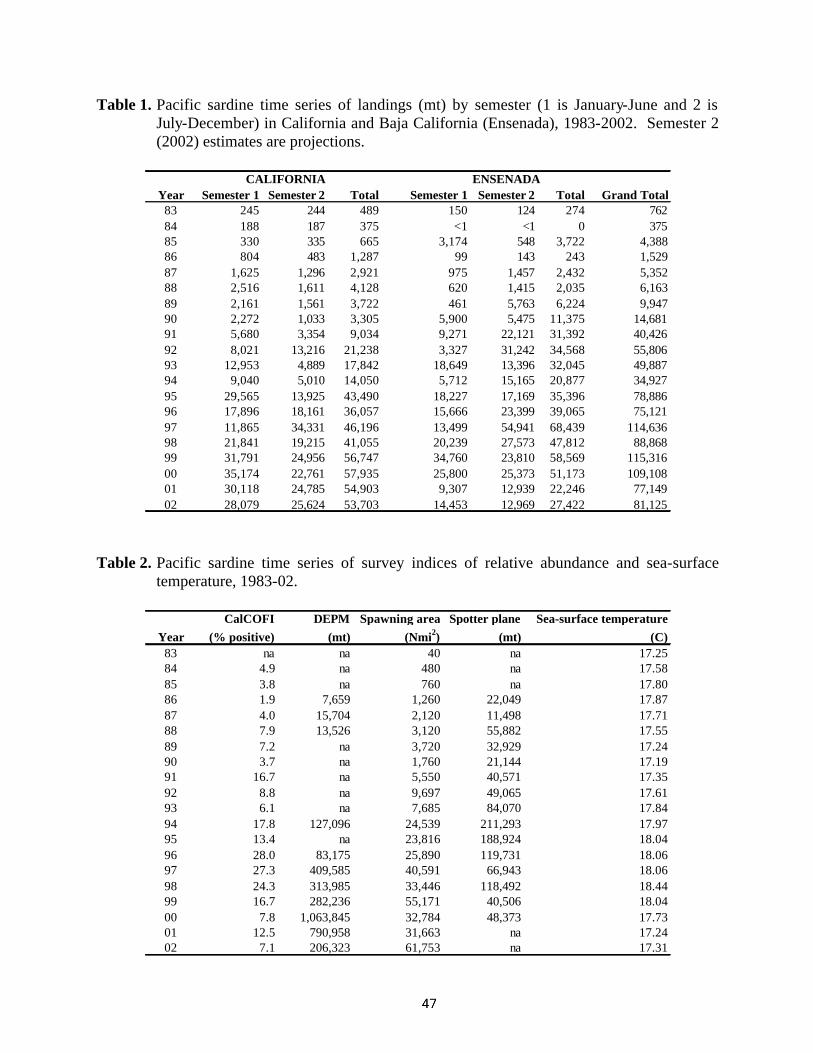
Table 1. Pacific sardine time series of landings (mt) by semester (1 is January-June and 2 is July-December) in California and Baja California (Ensenada), 1983-2002. Semester 2 (2002) estimates are projections.
Table 2. Pacific sardine time series of survey indices of relative abundance and sea-surface
temperature, 1983-02.
CALIFORNIA ENSENADA Year Semester 1 Semester 2 Total Semester 1 Semester 2 Total Grand Total
83 245 244 489 150 124 274 76284 188 187 375 <1 <1 0 37585 330 335 665 3,174 548 3,722 4,38886 804 483 1,287 99 143 243 1,52987 1,625 1,296 2,921 975 1,457 2,432 5,35288 2,516 1,611 4,128 620 1,415 2,035 6,16389 2,161 1,561 3,722 461 5,763 6,224 9,94790 2,272 1,033 3,305 5,900 5,475 11,375 14,68191 5,680 3,354 9,034 9,271 22,121 31,392 40,42692 8,021 13,216 21,238 3,327 31,242 34,568 55,80693 12,953 4,889 17,842 18,649 13,396 32,045 49,88794 9,040 5,010 14,050 5,712 15,165 20,877 34,92795 29,565 13,925 43,490 18,227 17,169 35,396 78,88696 17,896 18,161 36,057 15,666 23,399 39,065 75,12197 11,865 34,331 46,196 13,499 54,941 68,439 114,63698 21,841 19,215 41,055 20,239 27,573 47,812 88,86899 31,791 24,956 56,747 34,760 23,810 58,569 115,31600 35,174 22,761 57,935 25,800 25,373 51,173 109,10801 30,118 24,785 54,903 9,307 12,939 22,246 77,14902 28,079 25,624 53,703 14,453 12,969 27,422 81,125
CalCOFI DEPM Spawning area Spotter plane Sea-surface temperatureYear (% positive) (mt) (Nmi2) (mt) (C)
83 na na 40 na 17.2584 4.9 na 480 na 17.5885 3.8 na 760 na 17.8086 1.9 7,659 1,260 22,049 17.8787 4.0 15,704 2,120 11,498 17.7188 7.9 13,526 3,120 55,882 17.5589 7.2 na 3,720 32,929 17.2490 3.7 na 1,760 21,144 17.1991 16.7 na 5,550 40,571 17.3592 8.8 na 9,697 49,065 17.6193 6.1 na 7,685 84,070 17.8494 17.8 127,096 24,539 211,293 17.9795 13.4 na 23,816 188,924 18.0496 28.0 83,175 25,890 119,731 18.0697 27.3 409,585 40,591 66,943 18.0698 24.3 313,985 33,446 118,492 18.4499 16.7 282,236 55,171 40,506 18.0400 7.8 1,063,845 32,784 48,373 17.7301 12.5 790,958 31,663 na 17.2402 7.1 206,323 61,753 na 17.31
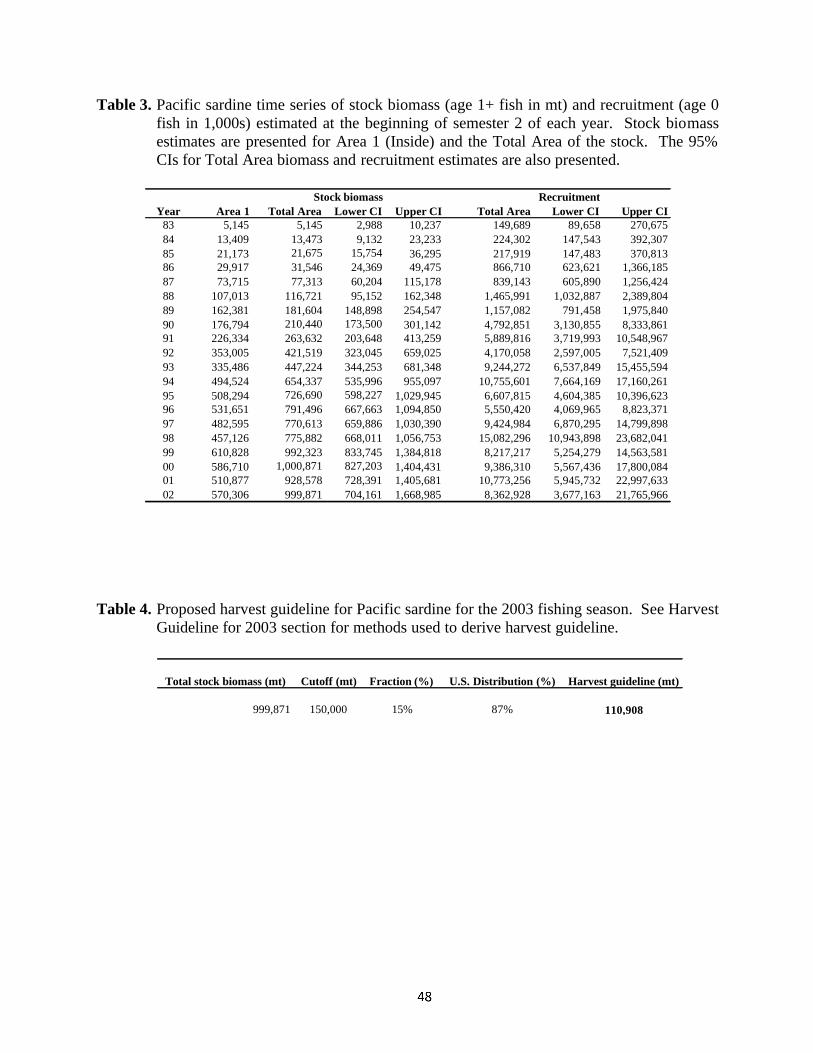
Table 3. Pacific sardine time series of stock biomass (age 1+ fish in mt) and recruitment (age 0 fish in 1,000s) estimated at the beginning of semester 2 of each year. Stock biomass estimates are presented for Area 1 (Inside) and the Total Area of the stock. The 95% CIs for Total Area biomass and recruitment estimates are also presented.
Table 4. Proposed harvest guideline for Pacific sardine for the 2003 fishing season. See Harvest
Guideline for 2003 section for methods used to derive harvest guideline.
RecruitmentYear Area 1 Total Area Lower CI Upper CI Total Area Lower CI Upper CI
83 5,145 5,145 2,988 10,237 149,689 89,658 270,67584 13,409 13,473 9,132 23,233 224,302 147,543 392,30785 21,173 21,675 15,754 36,295 217,919 147,483 370,81386 29,917 31,546 24,369 49,475 866,710 623,621 1,366,18587 73,715 77,313 60,204 115,178 839,143 605,890 1,256,42488 107,013 116,721 95,152 162,348 1,465,991 1,032,887 2,389,80489 162,381 181,604 148,898 254,547 1,157,082 791,458 1,975,84090 176,794 210,440 173,500 301,142 4,792,851 3,130,855 8,333,86191 226,334 263,632 203,648 413,259 5,889,816 3,719,993 10,548,96792 353,005 421,519 323,045 659,025 4,170,058 2,597,005 7,521,40993 335,486 447,224 344,253 681,348 9,244,272 6,537,849 15,455,59494 494,524 654,337 535,996 955,097 10,755,601 7,664,169 17,160,26195 508,294 726,690 598,227 1,029,945 6,607,815 4,604,385 10,396,62396 531,651 791,496 667,663 1,094,850 5,550,420 4,069,965 8,823,37197 482,595 770,613 659,886 1,030,390 9,424,984 6,870,295 14,799,89898 457,126 775,882 668,011 1,056,753 15,082,296 10,943,898 23,682,04199 610,828 992,323 833,745 1,384,818 8,217,217 5,254,279 14,563,58100 586,710 1,000,871 827,203 1,404,431 9,386,310 5,567,436 17,800,08401 510,877 928,578 728,391 1,405,681 10,773,256 5,945,732 22,997,63302 570,306 999,871 704,161 1,668,985 8,362,928 3,677,163 21,765,966
Stock biomass
Total stock biomass (mt) Cutoff (mt) Fraction (%) U.S. Distribution (%) Harvest guideline (mt)
999,871 150,000 15% 87% 110,908
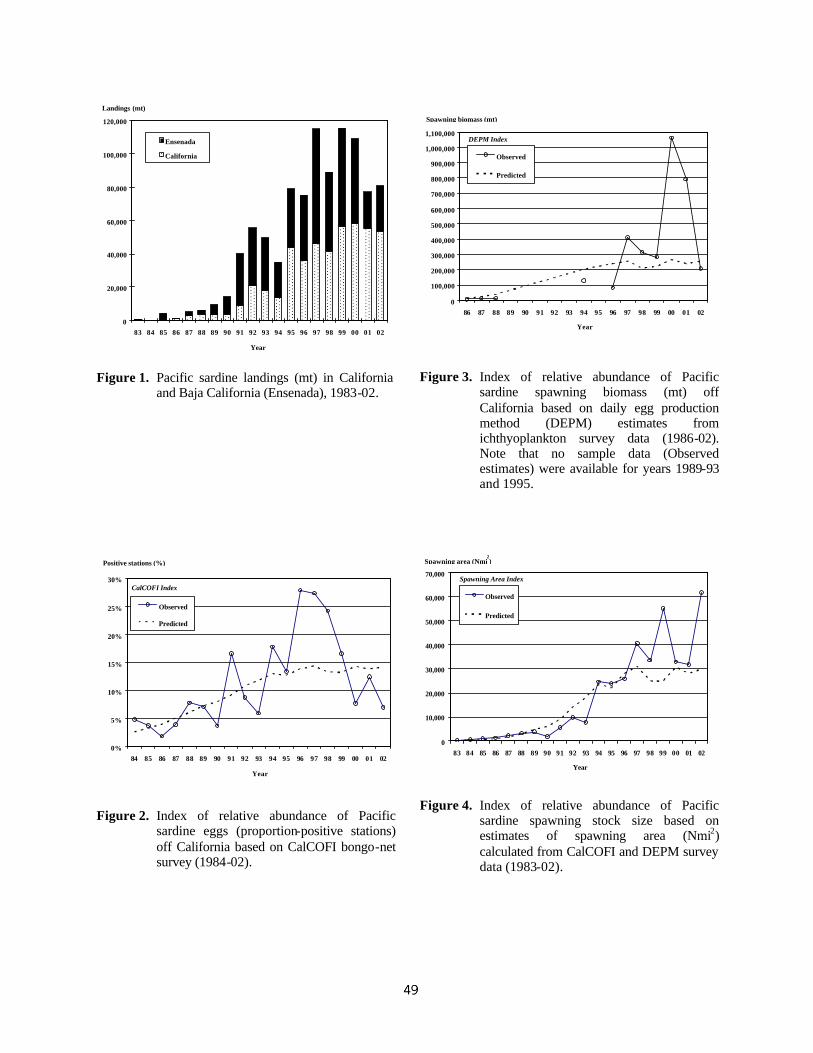
47
0
20,000
40,000
60,000
80,000
100,000
120,000
83 84 85 86 87 88 89 90 91 92 93 94 95 96 97 98 99 00 01 02
Year
Ensenada
California
Landings (mt)
Figure 1. Pacific sardine landings (mt) in California
and Baja California (Ensenada), 1983-02.
0%
5%
10%
15%
20%
25%
30%
84 85 86 87 88 89 90 91 92 93 94 95 96 97 98 99 00 01 02
Year
Observed
Predicted
CalCOFI Index
Positive stations (%)
Figure 2. Index of relative abundance of Pacific
sardine eggs (proportion-positive stations) off California based on CalCOFI bongo-net survey (1984-02).
0
100,000
200,000
300,000
400,000
500,000
600,000
700,000
800,000
900,000
1,000,000
1,100,000
86 87 88 89 90 91 92 93 94 95 96 97 98 99 00 01 02
Year
Observed
Predicted
DEPM Index
Spawning biomass (mt)
Figure 3. Index of relative abundance of Pacific
sardine spawning biomass (mt) off California based on daily egg production method (DEPM) estimates from ichthyoplankton survey data (1986-02). Note that no sample data (Observed estimates) were available for years 1989-93 and 1995.
0
10,000
20,000
30,000
40,000
50,000
60,000
70,000
83 84 85 86 87 88 89 90 91 92 93 94 95 96 97 98 99 00 01 02
Year
Observed
Predicted
Spawning Area Index
Spawning area (Nmi2)
Figure 4. Index of relative abundance of Pacific
sardine spawning stock size based on estimates of spawning area (Nmi2) calculated from CalCOFI and DEPM survey data (1983-02).
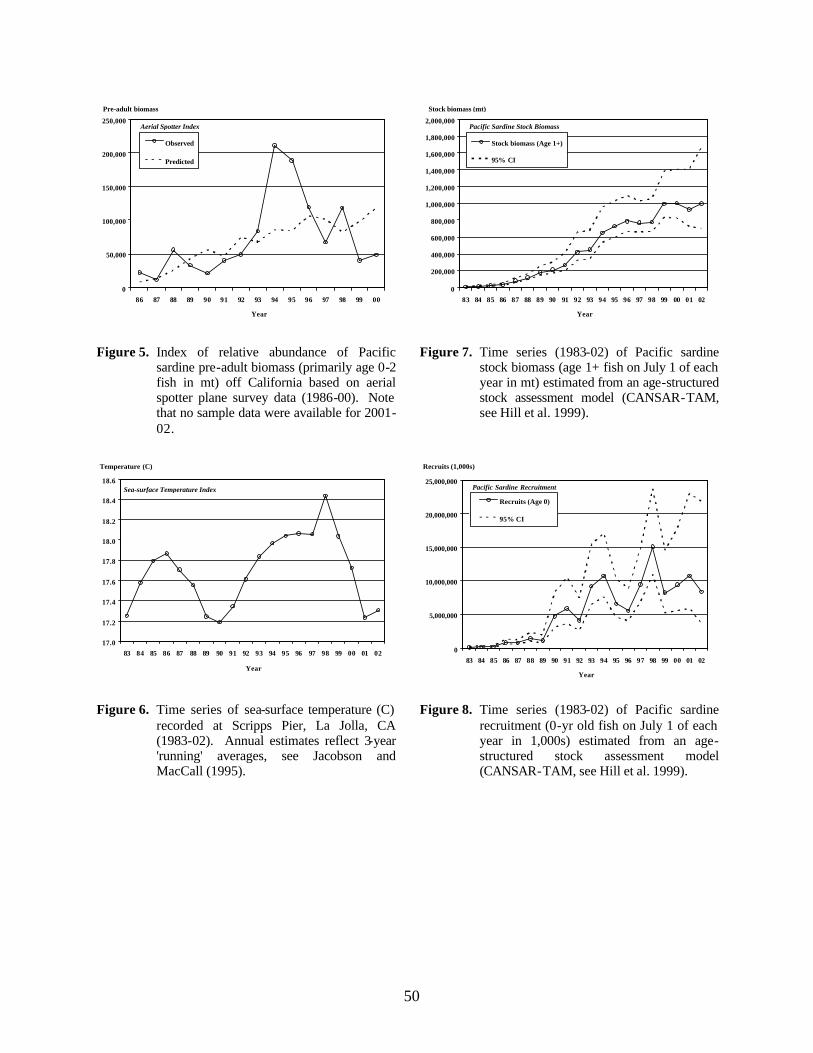
50
0
50,000
100,000
150,000
200,000
250,000
86 87 88 89 90 91 92 93 94 95 96 97 98 99 00
Year
Observed
Predicted
Aerial Spotter Index
Pre-adult biomass (mt)
Figure 5. Index of relative abundance of Pacific
sardine pre-adult biomass (primarily age 0-2 fish in mt) off California based on aerial spotter plane survey data (1986-00). Note that no sample data were available for 2001-02.
17.0
17.2
17.4
17.6
17.8
18.0
18.2
18.4
18.6
83 84 85 86 87 88 89 90 91 92 93 94 95 96 97 98 99 00 01 02
Year
Temperature (C)
Sea-surface Temperature Index
Figure 6. Time series of sea-surface temperature (C)
recorded at Scripps Pier, La Jolla, CA (1983-02). Annual estimates reflect 3-year 'running' averages, see Jacobson and MacCall (1995).
0
200,000
400,000
600,000
800,000
1,000,000
1,200,000
1,400,000
1,600,000
1,800,000
2,000,000
83 84 85 86 87 88 89 90 91 92 93 94 95 96 97 98 99 00 01 02
Year
Stock biomass (Age 1+)
95% CI
Pacific Sardine Stock Biomass
Stock biomass (mt)
Figure 7. Time series (1983-02) of Pacific sardine
stock biomass (age 1+ fish on July 1 of each year in mt) estimated from an age-structured stock assessment model (CANSAR-TAM, see Hill et al. 1999).
0
5,000,000
10,000,000
15,000,000
20,000,000
25,000,000
83 84 85 86 87 88 89 90 91 92 93 94 95 96 97 98 99 00 01 02
Year
Recruits (1,000s)
Recruits (Age 0)
95% CI
Pacific Sardine Recruitment
Figure 8. Time series (1983-02) of Pacific sardine
recruitment (0-yr old fish on July 1 of each year in 1,000s) estimated from an age-structured stock assessment model (CANSAR-TAM, see Hill et al. 1999).
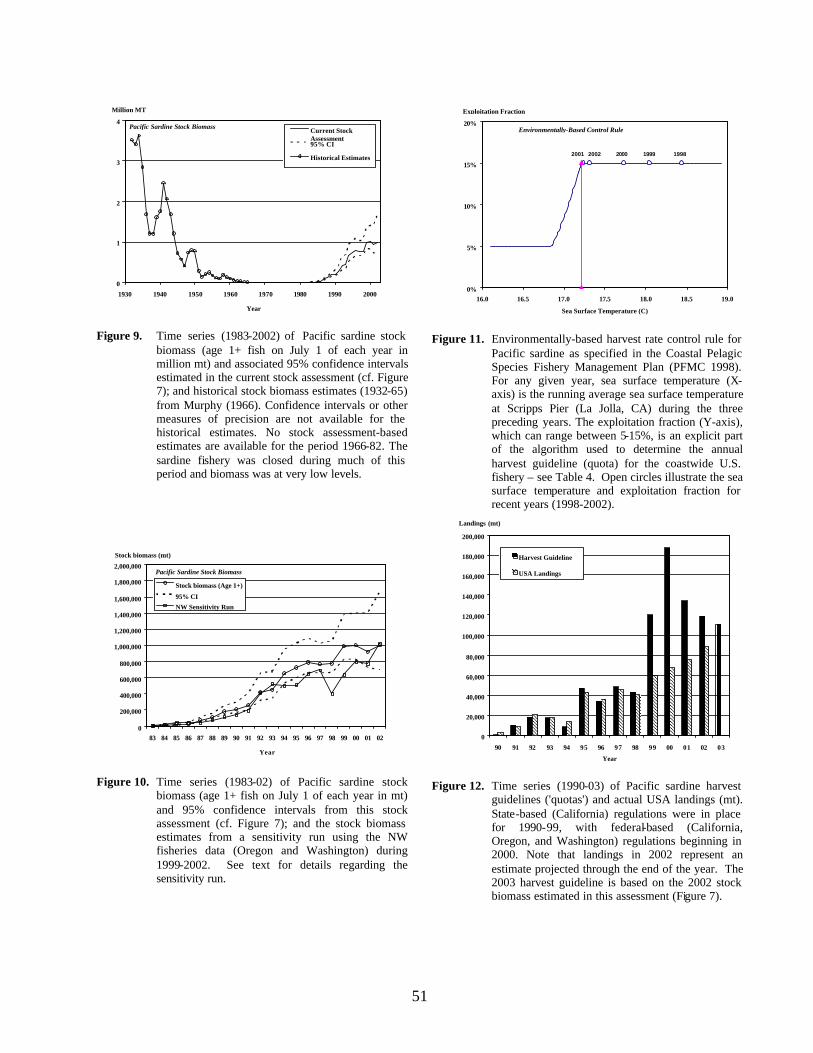
51
Figure 9. Time series (1983-2002) of Pacific sardine stock
biomass (age 1+ fish on July 1 of each year in million mt) and associated 95% confidence intervals estimated in the current stock assessment (cf. Figure 7); and historical stock biomass estimates (1932-65) from Murphy (1966). Confidence intervals or other measures of precision are not available for the historical estimates. No stock assessment-based estimates are available for the period 1966-82. The sardine fishery was closed during much of this period and biomass was at very low levels.
Figure 10. Time series (1983-02) of Pacific sardine stock
biomass (age 1+ fish on July 1 of each year in mt) and 95% confidence intervals from this stock assessment (cf. Figure 7); and the stock biomass estimates from a sensitivity run using the NW fisheries data (Oregon and Washington) during 1999-2002. See text for details regarding the sensitivity run.
Figure 11. Environmentally-based harvest rate control rule for
Pacific sardine as specified in the Coastal Pelagic Species Fishery Management Plan (PFMC 1998). For any given year, sea surface temperature (X-axis) is the running average sea surface temperature at Scripps Pier (La Jolla, CA) during the three preceding years. The exploitation fraction (Y-axis), which can range between 5-15%, is an explicit part of the algorithm used to determine the annual harvest guideline (quota) for the coastwide U.S. fishery – see Table 4. Open circles illustrate the sea surface temperature and exploitation fraction for recent years (1998-2002).
Figure 12. Time series (1990-03) of Pacific sardine harvest
guidelines ('quotas') and actual USA landings (mt). State-based (California) regulations were in place for 1990-99, with federal-based (California, Oregon, and Washington) regulations beginning in 2000. Note that landings in 2002 represent an estimate projected through the end of the year. The 2003 harvest guideline is based on the 2002 stock biomass estimated in this assessment (Figure 7).
0
20,000
40,000
60,000
80,000
100,000
120,000
140,000
160,000
180,000
200,000
90 91 92 93 94 95 96 97 98 99 00 01 02 03
Year
Landings (mt)
Harvest Guideline
USA Landings
0
200,000
400,000
600,000
800,000
1,000,000
1,200,000
1,400,000
1,600,000
1,800,000
2,000,000
83 84 85 86 87 88 89 90 91 92 93 94 95 96 97 98 99 00 01 02
Year
Stock biomass (Age 1+)
95% CI
NW Sensitivity Run
Pacific Sardine Stock Biomass
Stock biomass (mt)
0
1
2
3
4
1930 1940 1950 1960 1970 1980 1990 2000
Year
Million MT
Current StockAssessment95% CI
Historical Estimates
Pacific Sardine Stock Biomass
0%
5%
10%
15%
20%
16.0 16.5 17.0 17.5 18.0 18.5 19.0
Sea Surface Temperature (C)
Environmentally-Based Control Rule
2001 2000 1999 19982002
Exploitation Fraction
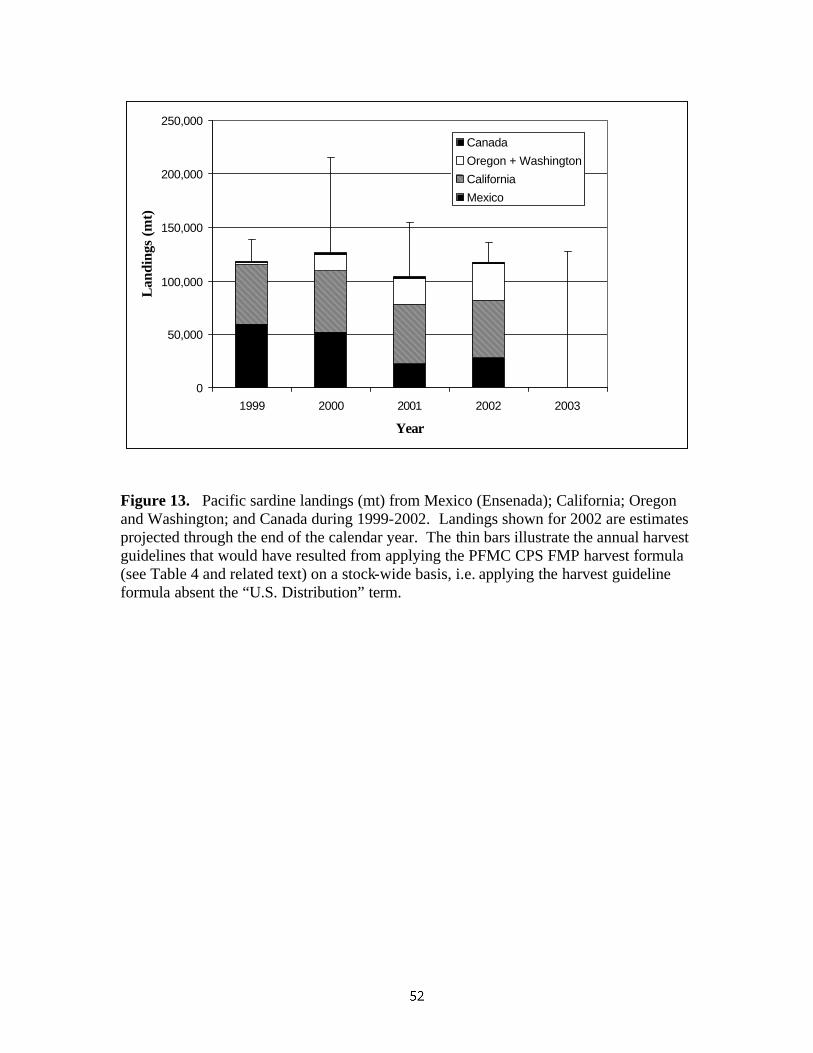
0
50,000
100,000
150,000
200,000
250,000
1999 2000 2001 2002 2003
Year
Lan
ding
s (m
t)Canada
Oregon + Washington
California
Mexico
Figure 13. Pacific sardine landings (mt) from Mexico (Ensenada); California; Oregon and Washington; and Canada during 1999-2002. Landings shown for 2002 are estimates projected through the end of the calendar year. The thin bars illustrate the annual harvest guidelines that would have resulted from applying the PFMC CPS FMP harvest formula (see Table 4 and related text) on a stock-wide basis, i.e. applying the harvest guideline formula absent the “U.S. Distribution” term.
53
Biological and Political Implications of the Detection of Viral Hemorrhagic
Septicemia Virus (VHSV) in California Sardines
R.P. Hedrick1,*, T.S. McDowell1, S. Yun1, A.M. McBride2, H.L. Mendonca2, K.D. Arkush2 and
W.N. Batts3,, G.S. Traxler4, J. Kaufman5, J.R. Winton3
1Department of Medicine and Epidemiology, School of Veterinary Medicine,
University of California, Davis, California 95616 USA 2Bodega Marine Laboratory, Bodega Bay, California 94923 USA
3Western Fisheries Research Center, 6505 N.E. 65th St, Seattle, Washington 98115 USA 4Pacific Biological Station, Department of Fisheries and Oceans, Nanaimo, British Columbia,
V9T 6N7 Canada 5Oregon Department of Fish and Wildlife, Department of Microbiology, Oregon State
University, Corvallis, Oregon 97331 USA
Viral hemorrhagic septicemia virus (VHSV) was isolated from populations of Pacific sardines
(Sardinops sagax) from the coastal waters of Vancouver Island, British Columbia, Canada and
most recently from central and southern California, USA. Mortality and evidence of skin lesions
typical for viral hemorrhagic septicemia in other marine fish species were observed among
sardines in Canada but sardines from California showed no signs of infection. Estimates of the
prevalence of infection among apparently healthy sardines ranged from 4–8% at locations where
virus was found in California. The prevalence of infection was 58% among sardines in Canada
suffering a naturally occurring epidemic in 1998-1999. The greater prevalence and severity of
disease due to VHSV among sardines in Canada presumably resulted from water temperatures of
8-9oC that were favorable for virus replication but at the lower range of tolerance for Pacific
sardines. The new VHSV isolates were closely related in comparisons of the nucleotide
sequence of a 669 nt segment of their glycoprotein (G) gene and all belong to the North
American genotype/group of VHSV. The VHSV isolates from sardines in Canada and
54
California were the most closely related strains of VHSV known in this group of VHSV and
differed from isolates obtained from other marine fish species and salmonids found in British
Columbia, Canada. Finding isolates with identical nucleotide sequences in sardines from two
distant geographic areas may suggest that populations of sardines, most of which originate in the
coastal waters of California, carry the virus upon migration to or from more northern waters (e.g.
Canada). Two trials were conducted to investigate the role of freezing, either as individual fish
or in the commercial process in 40 – 50 lb blocks, on virus stability. Virus concentrations among
experimentally infected sardines before and after freezing were determined for individually
marked sardines. In the first laboratory freezing trial at –20oC, there was little reduction of virus
concentrations in the kidney and spleen of individual fish after freezing and thawing. In the
second trial designed to reproduce the commercial freezing process (also at –20oC), more
significant reductions occurred among 11 fish with virus concentrations before freezing. Virus
concentrations declined from 59 – 100% after a single freeze and thaw cycle. Virus known to be
present in 3 fish before freezing could not be recovered after the freezing process. The initial
commercial freezing trial demonstrates clearly that virus concentrations are significantly reduced
by processing but not entirely eliminated. With healthy appearing sardines that make up the bulk
of the bait fishery, the prevalence of infection and virus concentrations are low. In these cases
the freezing process should significantly reduce, although note entirely eliminate, the risk of
movements of virus with commercially frozen product.

![Puente and Bragazzi, 1:8 Open Access Scientific Reports€¦ · · 2014-05-19Open Access Scientific Reports Scientific Reports ... hallmarks” [4]. We agree that biological,](https://img.pdfslide.us/doc/110x75/5af3217a7f8b9aa91691425b/puente-and-bragazzi-18-open-access-scientific-reports-2014-05-19open-access.jpg)