Embed Size (px)
Citation preview
2018 1
INTERIMREPORTTEAMTALK 2018

CONTENTS
1 FROM THE CHAIRMAN & CHIEF EXECUTIVE
4 FINANCIAL STATEMENTS
8 NOTES TO THE FINANCIAL STATEMENTS
16 CORPORATE DIRECTORY
OUR CUSTOMER DECLARATION
We’re not textbook, but our team will do “whatever it takes” to deliver on our promises to you. We know that to improve means making sure we hear what you tell us. We’re constantly looking for new technologies and better ways to do things, so that our services are what you want. We’re on a journey to earn your trust by being accurate, helpful, and dependable.
2018 1
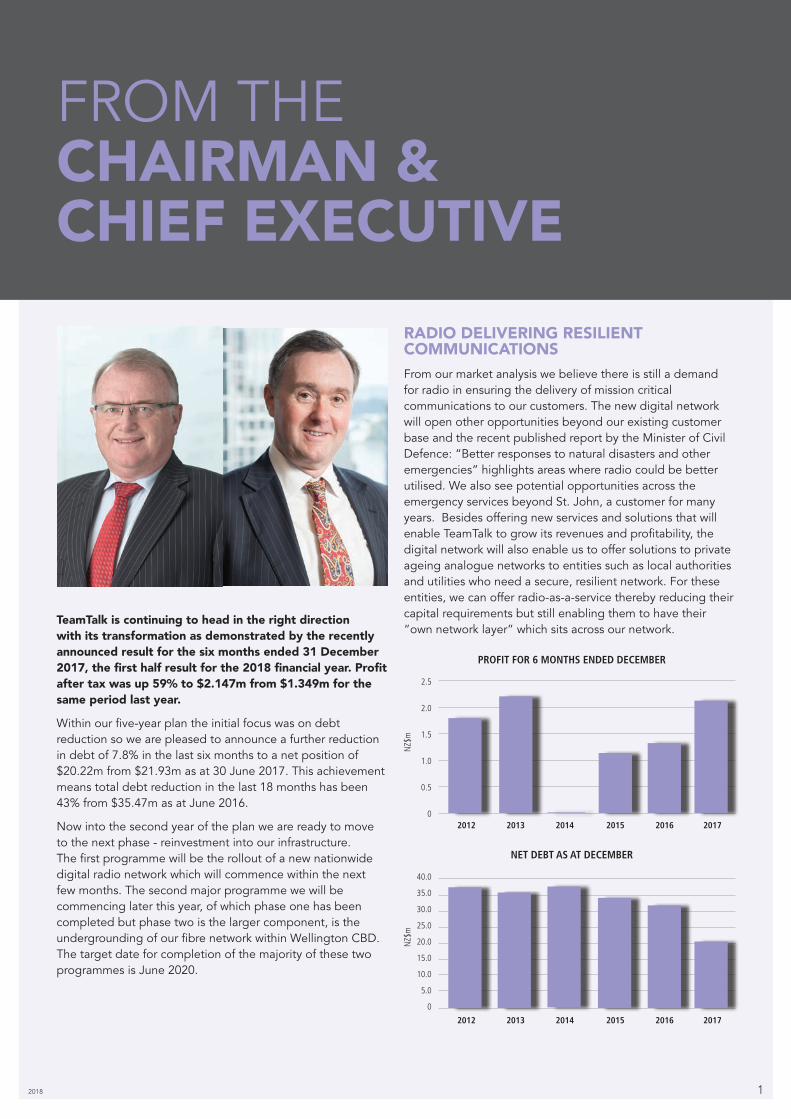
TeamTalk is continuing to head in the right direction with its transformation as demonstrated by the recently announced result for the six months ended 31 December 2017, the first half result for the 2018 financial year. Profit after tax was up 59% to $2.147m from $1.349m for the same period last year.
Within our five-year plan the initial focus was on debt reduction so we are pleased to announce a further reduction in debt of 7.8% in the last six months to a net position of $20.22m from $21.93m as at 30 June 2017. This achievement means total debt reduction in the last 18 months has been 43% from $35.47m as at June 2016.
Now into the second year of the plan we are ready to move to the next phase - reinvestment into our infrastructure. The first programme will be the rollout of a new nationwide digital radio network which will commence within the next few months. The second major programme we will be commencing later this year, of which phase one has been completed but phase two is the larger component, is the undergrounding of our fibre network within Wellington CBD. The target date for completion of the majority of these two programmes is June 2020.
FROM THE CHAIRMAN &CHIEF EXECUTIVE
40.0
35.0
30.0
25.0
20.0
15.0
10.0
5.0
0
2012 2013 2014 2015 2016 2017
NZ$
m
NET DEBT AS AT DECEMBER
PROFIT FOR 6 MONTHS ENDED DECEMBER
2.5
2.0
1.5
1.0
0.5
0 2012 2013 2014 2015 2016 2017
NZ$
m
RADIO DELIVERING RESILIENT COMMUNICATIONSFrom our market analysis we believe there is still a demand for radio in ensuring the delivery of mission critical communications to our customers. The new digital network will open other opportunities beyond our existing customer base and the recent published report by the Minister of Civil Defence: “Better responses to natural disasters and other emergencies” highlights areas where radio could be better utilised. We also see potential opportunities across the emergency services beyond St. John, a customer for many years. Besides offering new services and solutions that will enable TeamTalk to grow its revenues and profitability, the digital network will also enable us to offer solutions to private ageing analogue networks to entities such as local authorities and utilities who need a secure, resilient network. For these entities, we can offer radio-as-a-service thereby reducing their capital requirements but still enabling them to have their “own network layer” which sits across our network.

2 TeamTalk Interim Report
Our announcement in December that we have selected Tait Communications as our partner reinvigorates a long partnership going back decades. Whilst a new digital network is exciting, it is the roadmap of further integrated services that will be released over the next few years that really excites us about this investment. Our partnership with Tait Communications and other integrators will allow us to be at the forefront of new developments and enable New Zealand to gain access to these leading technologies and solutions quickly.
INTERNAL INFRASTRUCTUREWe are also improving our internal systems which have been under invested in for many years. One such example of this is where we identified requirements of both Operations and IT that could be satisfied with one common solution. The outcome of the investment will be faster more resilient connectivity for both customers and staff alike. The solution will deliver computing power as required by dynamically allocating resources. Devices will replicate data in real time with seamless fall-over resulting in higher availability and much lower reliance on business continuity strategies.
PEOPLEWe are also investing in our most important assets – our people. In December we held a staff day at the refurbished Poneke rugby club and was the first time that the whole staff from across the country were gathered in one location. Besides meeting some colleagues for the first time there was also discussion on strategy and our plan along with various team building exercises and workshops which focused on what we needed to do better. The day was rounded off with staff awards and our Christmas dinner and the whole event was considered a resounding success with a lot of positive feedback received from staff.
SUSAN FREEMAN-GREENE
INDEPENDENT DIRECTOR
Susan is currently Chief Executive of Engineering New Zealand (formerly IPENZ) where she has been since February 2015. She is leading a transformation agenda to meet the challenges of supporting and promoting the engineering profession in a world of rapid change. With 20,000 members and a team of 65 that’s been a significant undertaking. Susan was formerly Chief Executive of the Broadcasting Standards Authority and before that was a senior leader and Chief Mediator with the Human Rights Commission. Her professional background is in law (she still holds a Practising Certificate) and she practised for many years as a lawyer before adding to her repertoire by undertaking further training and practising as a mediator. She has had over 25 years’ experience across the public and private sector in law (including in the commercial and employment areas) and in mediation. Her broad experience in many sectors, combined with the analytical skills of a lawyer and the influencing skills of a mediator, have given her a wide perspective and a broad set of skills to bring to leadership and governance.
GOVERNANCE Following on from The AGM we are pleased to welcome both James Sclater and Susan Freeman-Greene on to the Board. This change in the Board ensures a continuous evolution in our governance model that is a vital component of an organisation. As part of this evolution, Geoff Davis will step down from the Board at the end of this month and we would like to take this opportunity to thank Geoff for his service over the last 15 years.

2018 3
ROGER SOWRY Chairman
ANDREW MILLER Chief Executive
JAMES SCLATER
INDEPENDENT DIRECTOR
James Sclater is a professional company director and trustee acting for a number of companies and investment trusts, including ProCare Health, Homecare Medical and Damar Industries. James is a chartered accountant and a member of Chartered Accountants Australia and New Zealand and the New Zealand Institute of Directors. Prior to 2009, James was chairman of Grant Thornton Auckland, where he was a business advisory services director for 18 years, specialising in small-to-medium enterprise accounting, taxation and management advice.
OUTLOOK AND GUIDANCEWe are pleased to say that our results demonstrate consistent improvement and that we are on track to meet our guidance. We are excited about moving into the next phase of our five-year plan as we reinvest into our infrastructure which is critical in producing better results for our shareholders. The aim of the company once these capital programmes are completed is to move to a dividend policy of paying around 50 – 70% of net profit after tax.
The company is on track for a resumption of dividends along with reinstatement of the dividend reinvestment option at the end of financial year 2018.
Yours sincerely
4 TeamTalk Interim Report
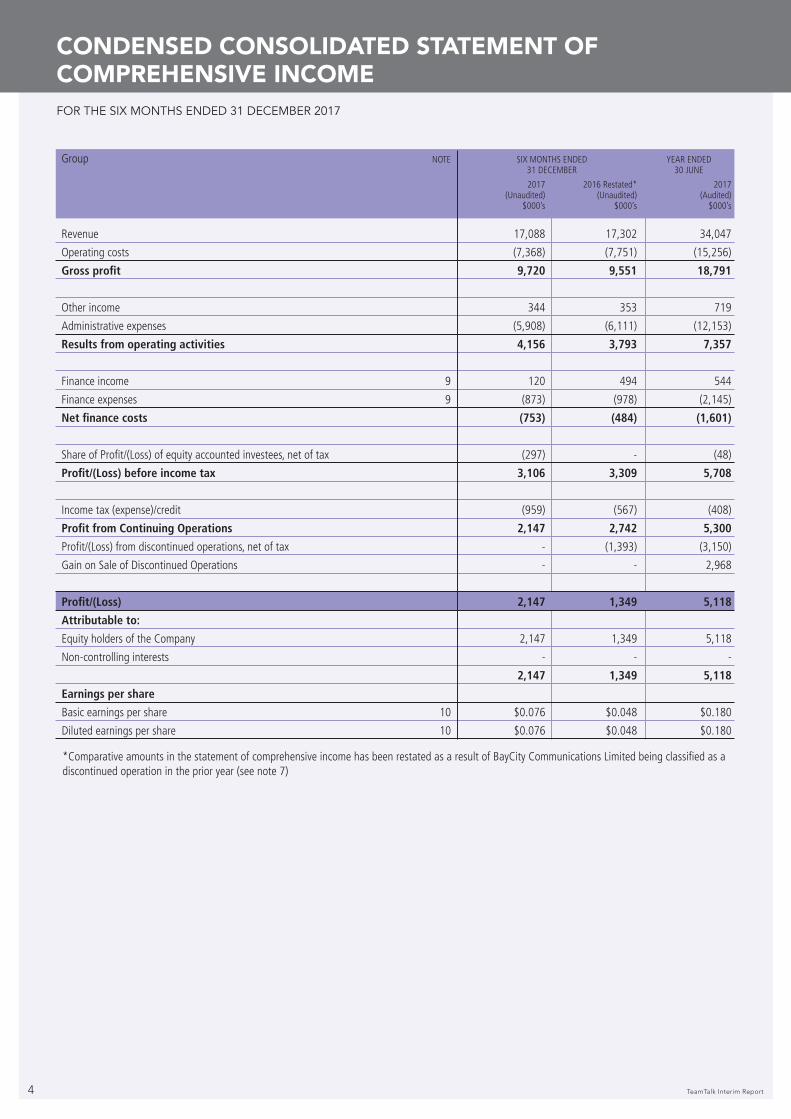
CONDENSED CONSOLIDATED STATEMENT OF COMPREHENSIVE INCOMEFOR THE SIX MONTHS ENDED 31 DECEMBER 2017
Group NOTE SIX MONTHS ENDED YEAR ENDED 31 DECEMBER 30 JUNE
2017 2016 Restated* 2017 (Unaudited) (Unaudited) (Audited) $000’s $000’s $000’s
Revenue 17,088 17,302 34,047
Operating costs (7,368) (7,751) (15,256)
Gross profit 9,720 9,551 18,791
Other income 344 353 719
Administrative expenses (5,908) (6,111) (12,153)
Results from operating activities 4,156 3,793 7,357
Finance income 9 120 494 544
Finance expenses 9 (873) (978) (2,145)
Net finance costs (753) (484) (1,601)
Share of Profit/(Loss) of equity accounted investees, net of tax (297) - (48)
Profit/(Loss) before income tax 3,106 3,309 5,708
Income tax (expense)/credit (959) (567) (408)
Profit from Continuing Operations 2,147 2,742 5,300
Profit/(Loss) from discontinued operations, net of tax - (1,393) (3,150)
Gain on Sale of Discontinued Operations - - 2,968
Profit/(Loss) 2,147 1,349 5,118
Attributable to:
Equity holders of the Company 2,147 1,349 5,118
Non-controlling interests - - -
2,147 1,349 5,118
Earnings per share
Basic earnings per share 10 $0.076 $0.048 $0.180
Diluted earnings per share 10 $0.076 $0.048 $0.180
*Comparative amounts in the statement of comprehensive income has been restated as a result of BayCity Communications Limited being classified as a discontinued operation in the prior year (see note 7)
2018 5
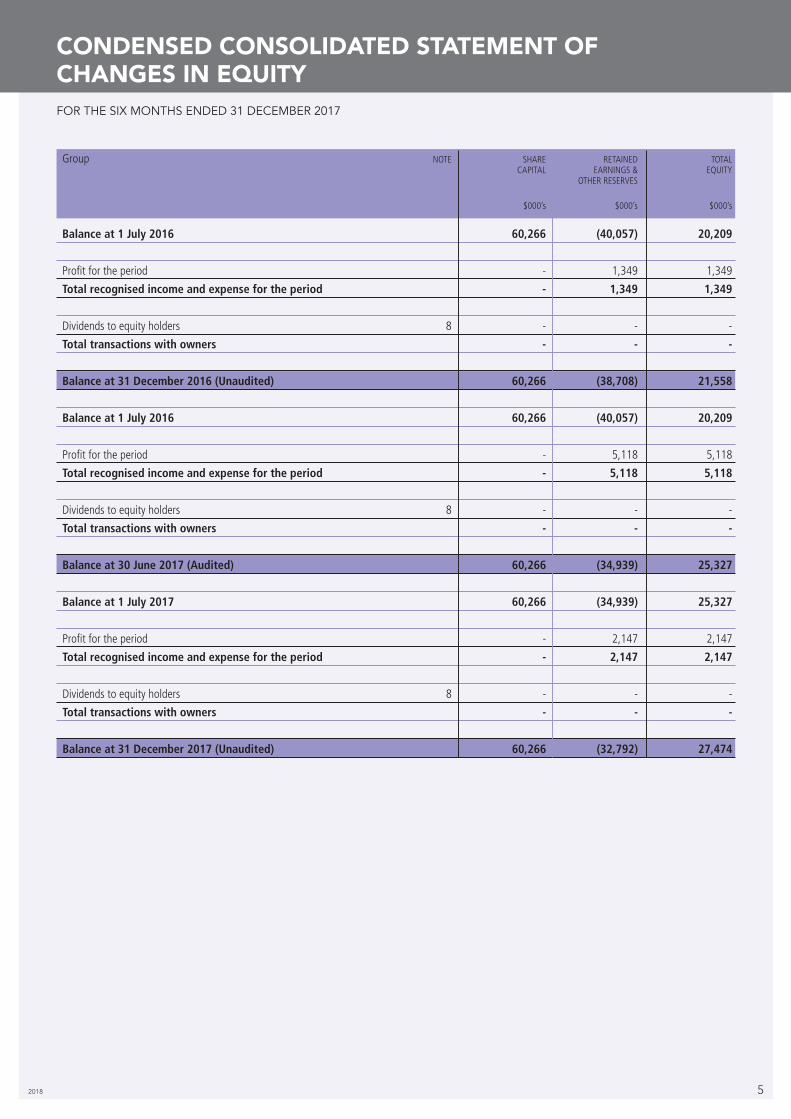
CONDENSED CONSOLIDATED STATEMENT OF CHANGES IN EQUITYFOR THE SIX MONTHS ENDED 31 DECEMBER 2017
Group NOTE SHARE RETAINED TOTAL CAPITAL EARNINGS & EQUITY OTHER RESERVES
$000’s $000’s $000’s
Balance at 1 July 2016 60,266 (40,057) 20,209
Profit for the period - 1,349 1,349
Total recognised income and expense for the period - 1,349 1,349
Dividends to equity holders 8 - - -
Total transactions with owners - - -
Balance at 31 December 2016 (Unaudited) 60,266 (38,708) 21,558
Balance at 1 July 2016 60,266 (40,057) 20,209
Profit for the period - 5,118 5,118
Total recognised income and expense for the period - 5,118 5,118
Dividends to equity holders 8 - - -
Total transactions with owners - - -
Balance at 30 June 2017 (Audited) 60,266 (34,939) 25,327
Balance at 1 July 2017 60,266 (34,939) 25,327
Profit for the period - 2,147 2,147
Total recognised income and expense for the period - 2,147 2,147
Dividends to equity holders 8 - - -
Total transactions with owners - - -
Balance at 31 December 2017 (Unaudited) 60,266 (32,792) 27,474
6 TeamTalk Interim Report
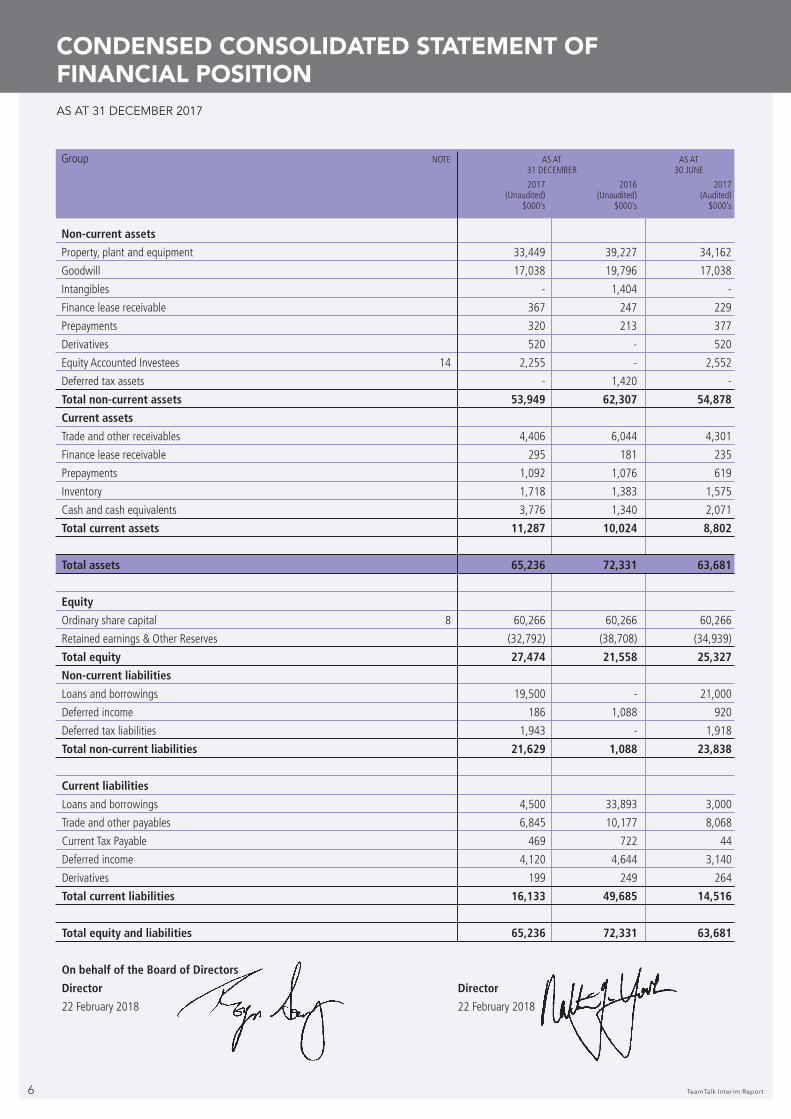
CONDENSED CONSOLIDATED STATEMENT OF FINANCIAL POSITIONAS AT 31 DECEMBER 2017
Group NOTE AS AT AS AT 31 DECEMBER 30 JUNE
2017 2016 2017 (Unaudited) (Unaudited) (Audited) $000’s $000’s $000’s
Non-current assets
Property, plant and equipment 33,449 39,227 34,162
Goodwill 17,038 19,796 17,038
Intangibles - 1,404 -
Finance lease receivable 367 247 229
Prepayments 320 213 377
Derivatives 520 - 520
Equity Accounted Investees 14 2,255 - 2,552
Deferred tax assets - 1,420 -
Total non-current assets 53,949 62,307 54,878
Current assets
Trade and other receivables 4,406 6,044 4,301
Finance lease receivable 295 181 235
Prepayments 1,092 1,076 619
Inventory 1,718 1,383 1,575
Cash and cash equivalents 3,776 1,340 2,071
Total current assets 11,287 10,024 8,802
Total assets 65,236 72,331 63,681
Equity
Ordinary share capital 8 60,266 60,266 60,266
Retained earnings & Other Reserves (32,792) (38,708) (34,939)
Total equity 27,474 21,558 25,327
Non-current liabilities
Loans and borrowings 19,500 - 21,000
Deferred income 186 1,088 920
Deferred tax liabilities 1,943 - 1,918
Total non-current liabilities 21,629 1,088 23,838
Current liabilities
Loans and borrowings 4,500 33,893 3,000
Trade and other payables 6,845 10,177 8,068
Current Tax Payable 469 722 44
Deferred income 4,120 4,644 3,140
Derivatives 199 249 264
Total current liabilities 16,133 49,685 14,516
Total equity and liabilities 65,236 72,331 63,681
On behalf of the Board of Directors
Director Director
22 February 2018 22 February 2018
2018 7
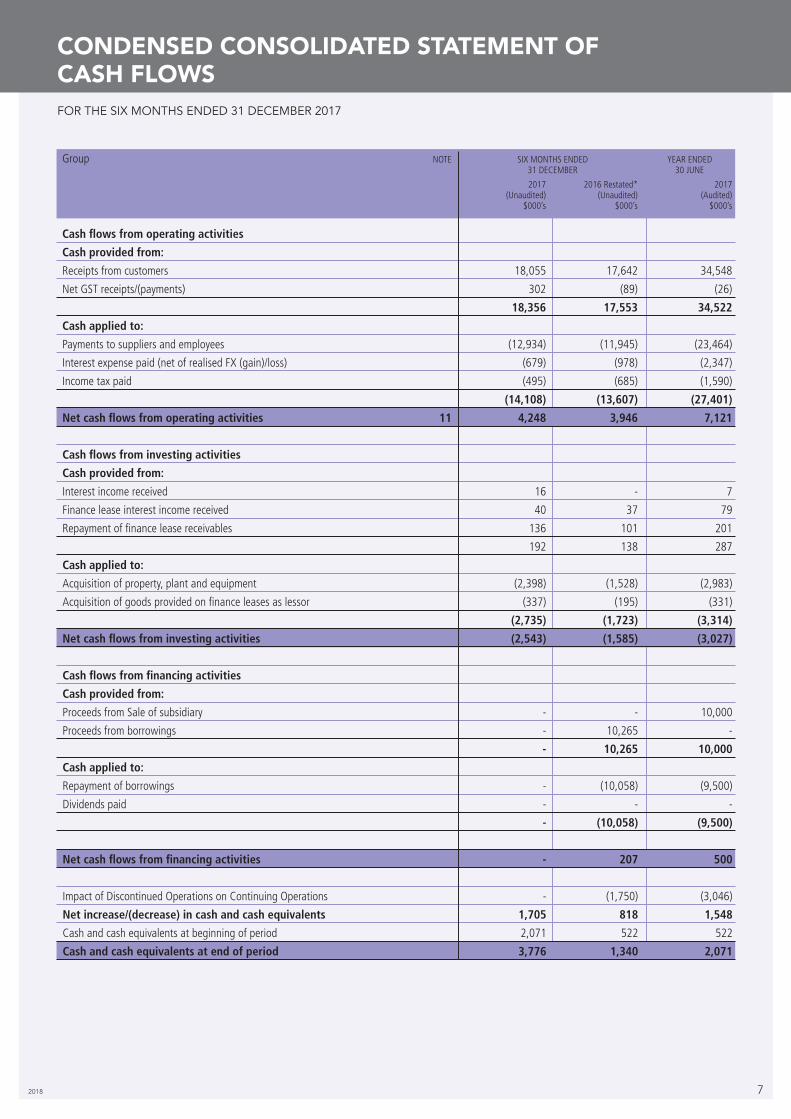
CONDENSED CONSOLIDATED STATEMENT OF CASH FLOWSFOR THE SIX MONTHS ENDED 31 DECEMBER 2017
Group NOTE SIX MONTHS ENDED YEAR ENDED 31 DECEMBER 30 JUNE
2017 2016 Restated* 2017 (Unaudited) (Unaudited) (Audited) $000’s $000’s $000’s
Cash flows from operating activities
Cash provided from:
Receipts from customers 18,055 17,642 34,548
Net GST receipts/(payments) 302 (89) (26)
18,356 17,553 34,522
Cash applied to:
Payments to suppliers and employees (12,934) (11,945) (23,464)
Interest expense paid (net of realised FX (gain)/loss) (679) (978) (2,347)
Income tax paid (495) (685) (1,590)
(14,108) (13,607) (27,401)
Net cash flows from operating activities 11 4,248 3,946 7,121
Cash flows from investing activities
Cash provided from:
Interest income received 16 - 7
Finance lease interest income received 40 37 79
Repayment of finance lease receivables 136 101 201
192 138 287
Cash applied to:
Acquisition of property, plant and equipment (2,398) (1,528) (2,983)
Acquisition of goods provided on finance leases as lessor (337) (195) (331)
(2,735) (1,723) (3,314)
Net cash flows from investing activities (2,543) (1,585) (3,027)
Cash flows from financing activities
Cash provided from:
Proceeds from Sale of subsidiary - - 10,000
Proceeds from borrowings - 10,265 -
- 10,265 10,000
Cash applied to:
Repayment of borrowings - (10,058) (9,500)
Dividends paid - - -
- (10,058) (9,500)
Net cash flows from financing activities - 207 500
Impact of Discontinued Operations on Continuing Operations - (1,750) (3,046)
Net increase/(decrease) in cash and cash equivalents 1,705 818 1,548
Cash and cash equivalents at beginning of period 2,071 522 522
Cash and cash equivalents at end of period 3,776 1,340 2,071
8 TeamTalk Interim Report
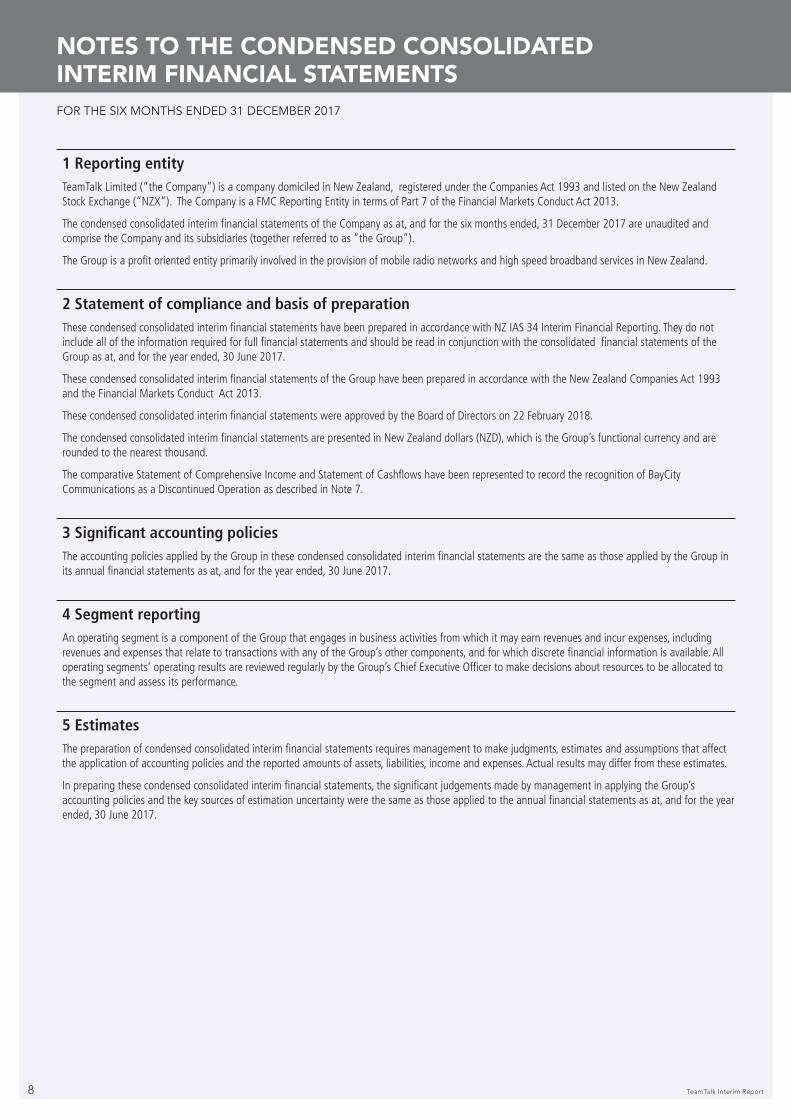
1 Reporting entity TeamTalk Limited (“the Company”) is a company domiciled in New Zealand, registered under the Companies Act 1993 and listed on the New Zealand Stock Exchange (“NZX”). The Company is a FMC Reporting Entity in terms of Part 7 of the Financial Markets Conduct Act 2013.
The condensed consolidated interim financial statements of the Company as at, and for the six months ended, 31 December 2017 are unaudited and comprise the Company and its subsidiaries (together referred to as “the Group”).
The Group is a profit oriented entity primarily involved in the provision of mobile radio networks and high speed broadband services in New Zealand.
2 Statement of compliance and basis of preparation These condensed consolidated interim financial statements have been prepared in accordance with NZ IAS 34 Interim Financial Reporting. They do not include all of the information required for full financial statements and should be read in conjunction with the consolidated financial statements of the Group as at, and for the year ended, 30 June 2017.
These condensed consolidated interim financial statements of the Group have been prepared in accordance with the New Zealand Companies Act 1993 and the Financial Markets Conduct Act 2013.
These condensed consolidated interim financial statements were approved by the Board of Directors on 22 February 2018.
The condensed consolidated interim financial statements are presented in New Zealand dollars (NZD), which is the Group’s functional currency and are rounded to the nearest thousand.
The comparative Statement of Comprehensive Income and Statement of Cashflows have been represented to record the recognition of BayCity Communications as a Discontinued Operation as described in Note 7.
3 Significant accounting policies The accounting policies applied by the Group in these condensed consolidated interim financial statements are the same as those applied by the Group in its annual financial statements as at, and for the year ended, 30 June 2017.
4 Segment reporting An operating segment is a component of the Group that engages in business activities from which it may earn revenues and incur expenses, including revenues and expenses that relate to transactions with any of the Group’s other components, and for which discrete financial information is available. All operating segments’ operating results are reviewed regularly by the Group’s Chief Executive Officer to make decisions about resources to be allocated to the segment and assess its performance.
5 Estimates The preparation of condensed consolidated interim financial statements requires management to make judgments, estimates and assumptions that affect the application of accounting policies and the reported amounts of assets, liabilities, income and expenses. Actual results may differ from these estimates.
In preparing these condensed consolidated interim financial statements, the significant judgements made by management in applying the Group’s accounting policies and the key sources of estimation uncertainty were the same as those applied to the annual financial statements as at, and for the year ended, 30 June 2017.
NOTES TO THE CONDENSED CONSOLIDATED INTERIM FINANCIAL STATEMENTSFOR THE SIX MONTHS ENDED 31 DECEMBER 2017
2018 9
NOTES TO THE CONDENSED CONSOLIDATED INTERIM FINANCIAL STATEMENTSFOR THE SIX MONTHS ENDED 31 DECEMBER 2017
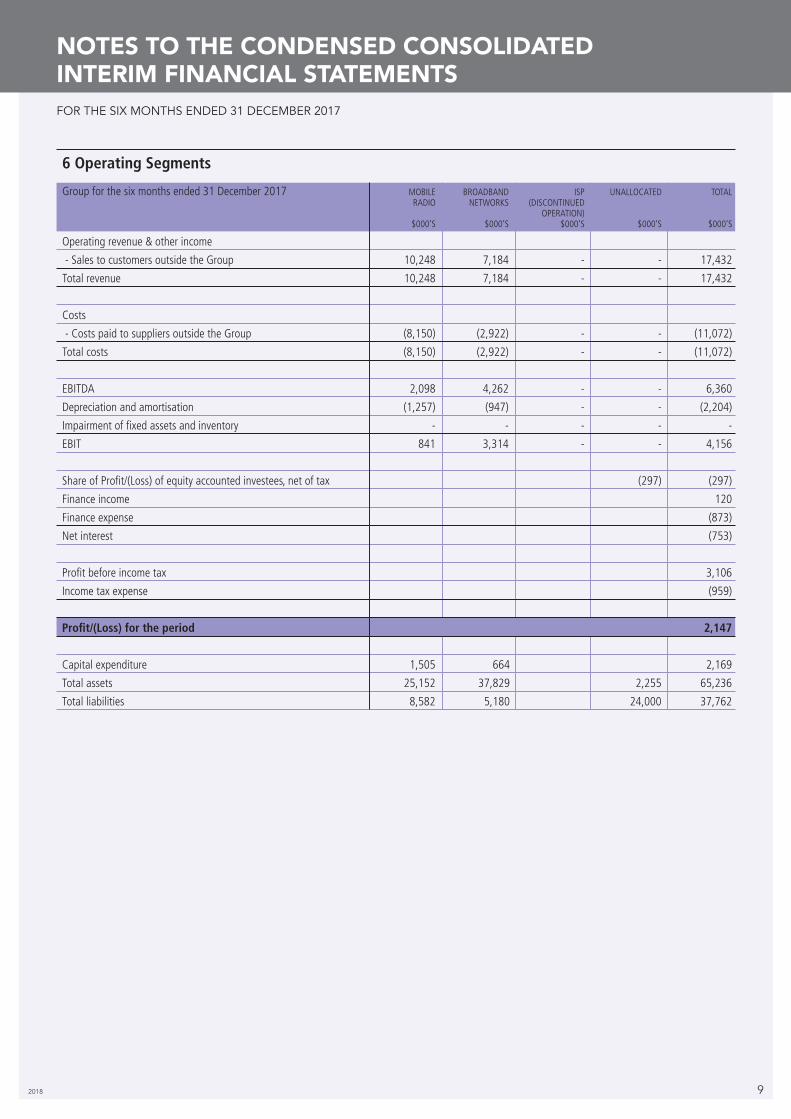
Group for the six months ended 31 December 2017 MOBILE BROADBAND ISP UNALLOCATED TOTAL RADIO NETWORKS (DISCONTINUED OPERATION) $000’S $000’S $000’S $000’S $000’S
Operating revenue & other income
- Sales to customers outside the Group 10,248 7,184 - - 17,432
Total revenue 10,248 7,184 - - 17,432
Costs
- Costs paid to suppliers outside the Group (8,150) (2,922) - - (11,072)
Total costs (8,150) (2,922) - - (11,072)
EBITDA 2,098 4,262 - - 6,360
Depreciation and amortisation (1,257) (947) - - (2,204)
Impairment of fixed assets and inventory - - - - -
EBIT 841 3,314 - - 4,156
Share of Profit/(Loss) of equity accounted investees, net of tax (297) (297)
Finance income 120
Finance expense (873)
Net interest (753)
Profit before income tax 3,106
Income tax expense (959)
Profit/(Loss) for the period 2,147
Capital expenditure 1,505 664 2,169
Total assets 25,152 37,829 2,255 65,236
Total liabilities 8,582 5,180 24,000 37,762
6 Operating Segments
10 TeamTalk Interim Report
NOTES TO THE CONDENSED CONSOLIDATED INTERIM FINANCIAL STATEMENTSFOR THE SIX MONTHS ENDED 31 DECEMBER 2017
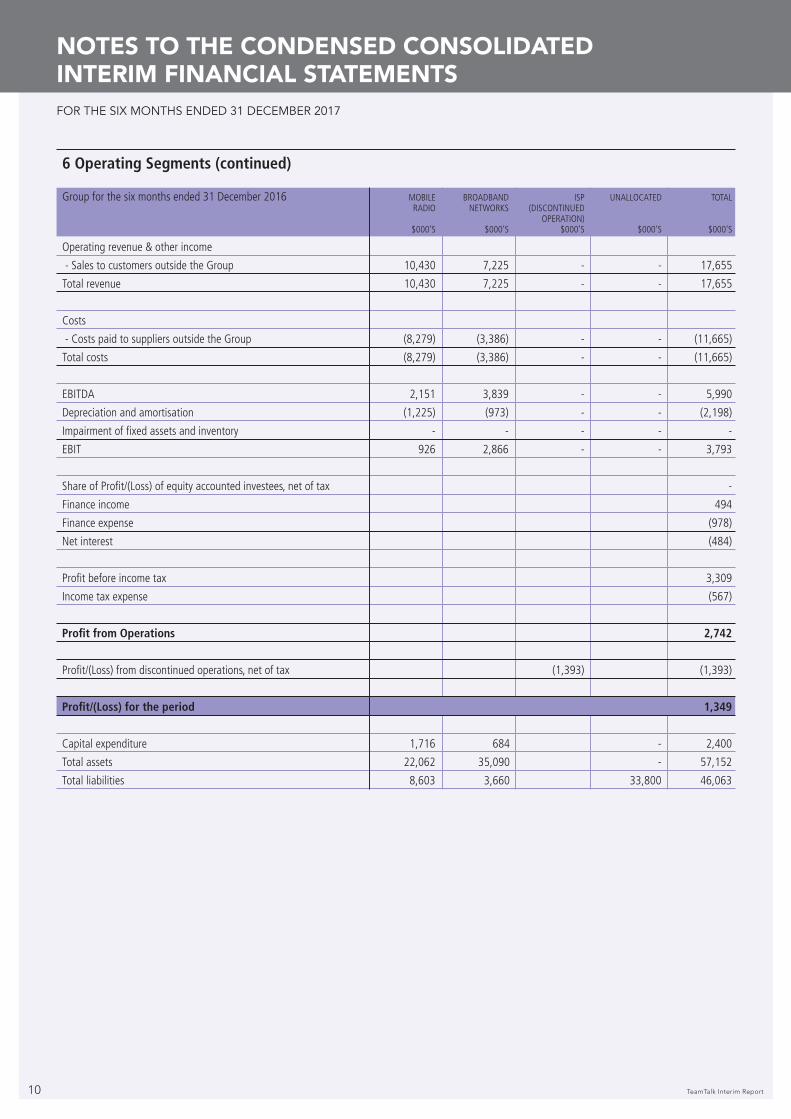
6 Operating Segments (continued)
Group for the six months ended 31 December 2016 MOBILE BROADBAND ISP UNALLOCATED TOTAL RADIO NETWORKS (DISCONTINUED OPERATION) $000’S $000’S $000’S $000’S $000’S
Operating revenue & other income
- Sales to customers outside the Group 10,430 7,225 - - 17,655
Total revenue 10,430 7,225 - - 17,655
Costs
- Costs paid to suppliers outside the Group (8,279) (3,386) - - (11,665)
Total costs (8,279) (3,386) - - (11,665)
EBITDA 2,151 3,839 - - 5,990
Depreciation and amortisation (1,225) (973) - - (2,198)
Impairment of fixed assets and inventory - - - - -
EBIT 926 2,866 - - 3,793
Share of Profit/(Loss) of equity accounted investees, net of tax -
Finance income 494
Finance expense (978)
Net interest (484)
Profit before income tax 3,309
Income tax expense (567)
Profit from Operations 2,742
Profit/(Loss) from discontinued operations, net of tax (1,393) (1,393)
Profit/(Loss) for the period 1,349
Capital expenditure 1,716 684 - 2,400
Total assets 22,062 35,090 - 57,152
Total liabilities 8,603 3,660 33,800 46,063
2018 11
NOTES TO THE CONDENSED CONSOLIDATED INTERIM FINANCIAL STATEMENTSFOR THE SIX MONTHS ENDED 31 DECEMBER 2017
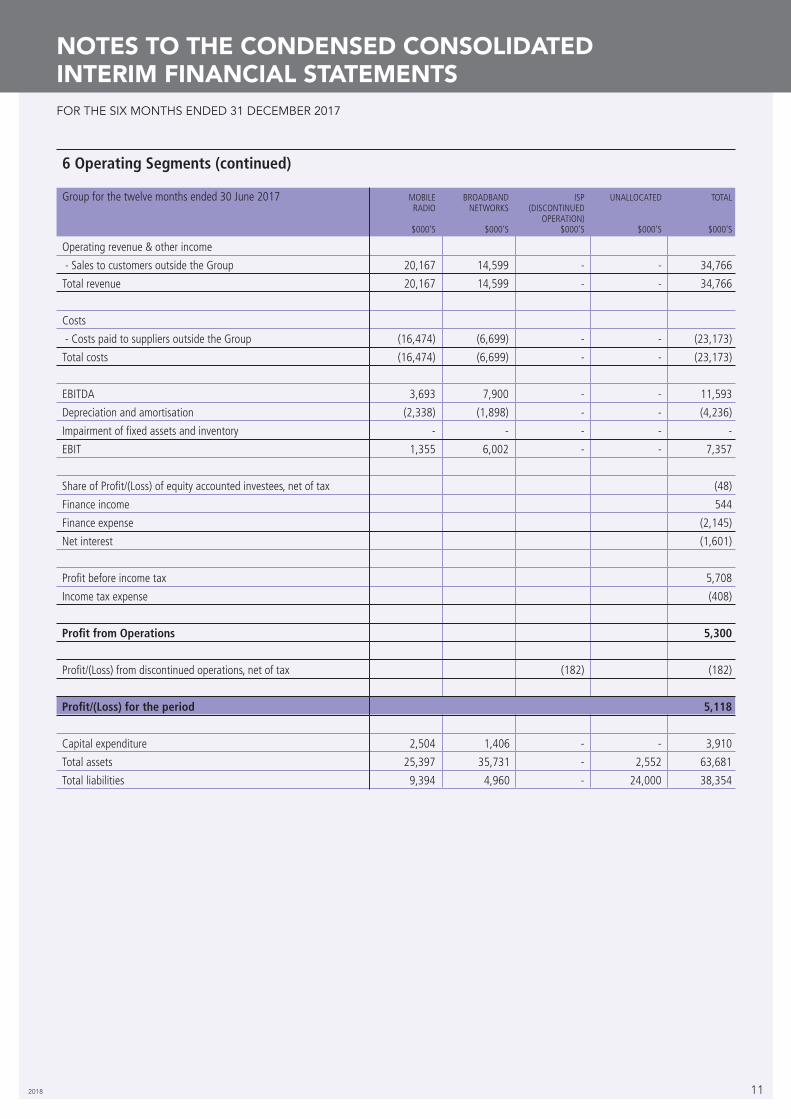
Group for the twelve months ended 30 June 2017 MOBILE BROADBAND ISP UNALLOCATED TOTAL RADIO NETWORKS (DISCONTINUED OPERATION) $000’S $000’S $000’S $000’S $000’S
Operating revenue & other income
- Sales to customers outside the Group 20,167 14,599 - - 34,766
Total revenue 20,167 14,599 - - 34,766
Costs
- Costs paid to suppliers outside the Group (16,474) (6,699) - - (23,173)
Total costs (16,474) (6,699) - - (23,173)
EBITDA 3,693 7,900 - - 11,593
Depreciation and amortisation (2,338) (1,898) - - (4,236)
Impairment of fixed assets and inventory - - - - -
EBIT 1,355 6,002 - - 7,357
Share of Profit/(Loss) of equity accounted investees, net of tax (48)
Finance income 544
Finance expense (2,145)
Net interest (1,601)
Profit before income tax 5,708
Income tax expense (408)
Profit from Operations 5,300
Profit/(Loss) from discontinued operations, net of tax (182) (182)
Profit/(Loss) for the period 5,118
Capital expenditure 2,504 1,406 - - 3,910
Total assets 25,397 35,731 - 2,552 63,681
Total liabilities 9,394 4,960 - 24,000 38,354
6 Operating Segments (continued)
12 TeamTalk Interim Report
NOTES TO THE CONDENSED CONSOLIDATED INTERIM FINANCIAL STATEMENTSFOR THE SIX MONTHS ENDED 31 DECEMBER 2017
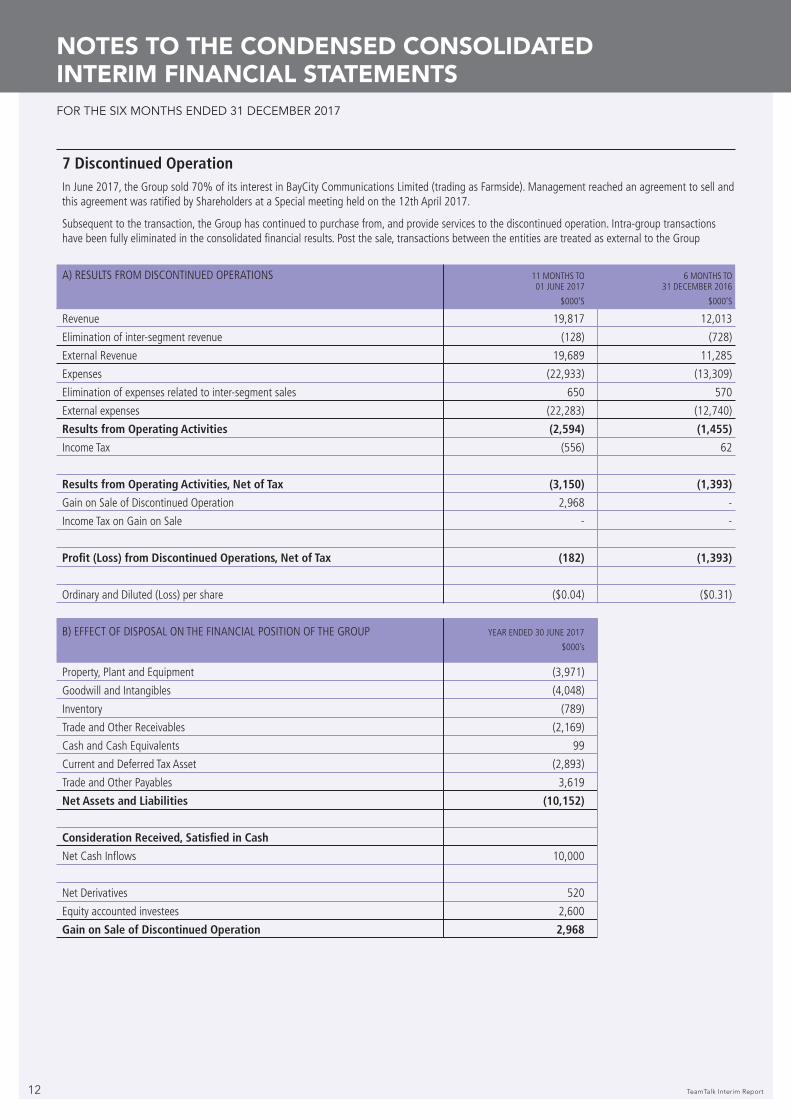
7 Discontinued Operation In June 2017, the Group sold 70% of its interest in BayCity Communications Limited (trading as Farmside). Management reached an agreement to sell and this agreement was ratified by Shareholders at a Special meeting held on the 12th April 2017.
Subsequent to the transaction, the Group has continued to purchase from, and provide services to the discontinued operation. Intra-group transactions have been fully eliminated in the consolidated financial results. Post the sale, transactions between the entities are treated as external to the Group
A) RESULTS FROM DISCONTINUED OPERATIONS 11 MONTHS TO 6 MONTHS TO 01 JUNE 2017 31 DECEMBER 2016
$000’S $000’S
Revenue 19,817 12,013
Elimination of inter-segment revenue (128) (728)
External Revenue 19,689 11,285
Expenses (22,933) (13,309)
Elimination of expenses related to inter-segment sales 650 570
External expenses (22,283) (12,740)
Results from Operating Activities (2,594) (1,455)
Income Tax (556) 62
Results from Operating Activities, Net of Tax (3,150) (1,393)
Gain on Sale of Discontinued Operation 2,968 -
Income Tax on Gain on Sale - -
Profit (Loss) from Discontinued Operations, Net of Tax (182) (1,393)
Ordinary and Diluted (Loss) per share ($0.04) ($0.31)
B) EFFECT OF DISPOSAL ON THE FINANCIAL POSITION OF THE GROUP YEAR ENDED 30 JUNE 2017
$000’s
Property, Plant and Equipment (3,971)
Goodwill and Intangibles (4,048)
Inventory (789)
Trade and Other Receivables (2,169)
Cash and Cash Equivalents 99
Current and Deferred Tax Asset (2,893)
Trade and Other Payables 3,619
Net Assets and Liabilities (10,152)
Consideration Received, Satisfied in Cash
Net Cash Inflows 10,000
Net Derivatives 520
Equity accounted investees 2,600
Gain on Sale of Discontinued Operation 2,968
2018 13
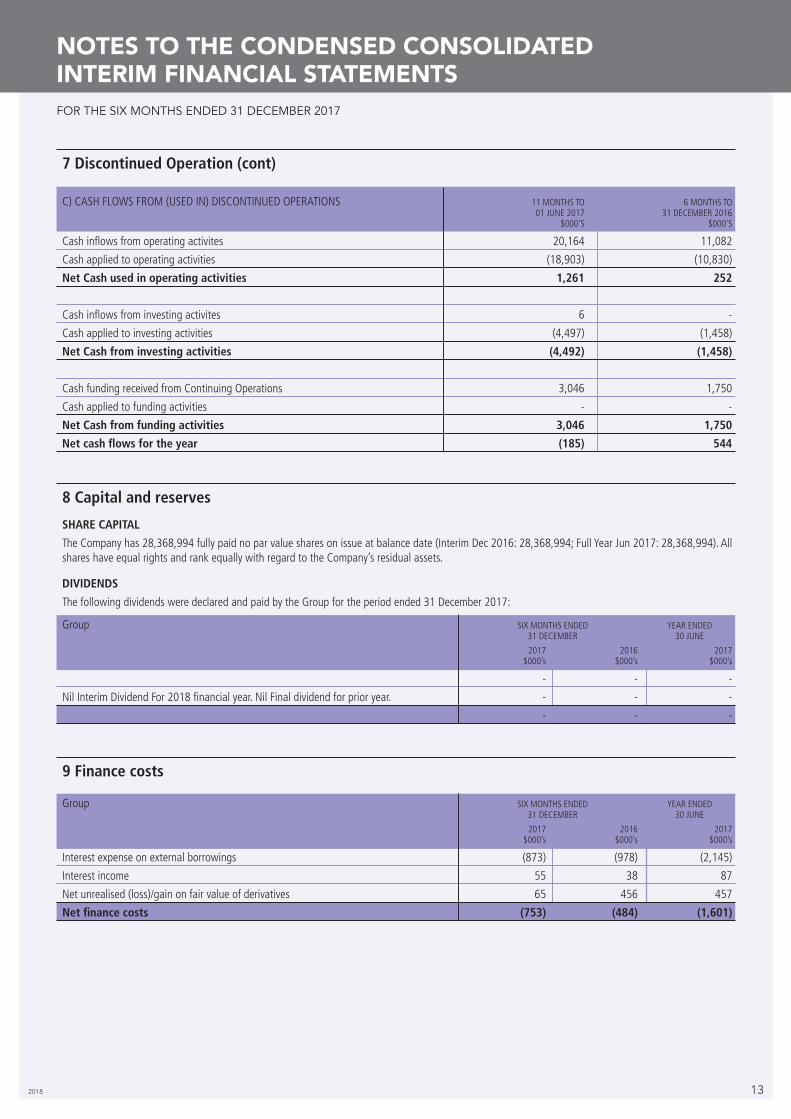
7 Discontinued Operation (cont) C) CASH FLOWS FROM (USED IN) DISCONTINUED OPERATIONS 11 MONTHS TO 6 MONTHS TO 01 JUNE 2017 31 DECEMBER 2016 $000’S $000’S
Cash inflows from operating activites 20,164 11,082
Cash applied to operating activities (18,903) (10,830)
Net Cash used in operating activities 1,261 252
Cash inflows from investing activites 6 -
Cash applied to investing activities (4,497) (1,458)
Net Cash from investing activities (4,492) (1,458)
Cash funding received from Continuing Operations 3,046 1,750
Cash applied to funding activities - -
Net Cash from funding activities 3,046 1,750
Net cash flows for the year (185) 544
8 Capital and reserves
SHARE CAPITAL
The Company has 28,368,994 fully paid no par value shares on issue at balance date (Interim Dec 2016: 28,368,994; Full Year Jun 2017: 28,368,994). All shares have equal rights and rank equally with regard to the Company’s residual assets.
DIVIDENDS
The following dividends were declared and paid by the Group for the period ended 31 December 2017:
9 Finance costs
Group SIX MONTHS ENDED YEAR ENDED 31 DECEMBER 30 JUNE
2017 2016 2017 $000’s $000’s $000’s
- - -
Nil Interim Dividend For 2018 financial year. Nil Final dividend for prior year. - - -
- - -
Group SIX MONTHS ENDED YEAR ENDED 31 DECEMBER 30 JUNE
2017 2016 2017 $000’s $000’s $000’s
Interest expense on external borrowings (873) (978) (2,145)
Interest income 55 38 87
Net unrealised (loss)/gain on fair value of derivatives 65 456 457
Net finance costs (753) (484) (1,601)
NOTES TO THE CONDENSED CONSOLIDATED INTERIM FINANCIAL STATEMENTSFOR THE SIX MONTHS ENDED 31 DECEMBER 2017
14 TeamTalk Interim Report
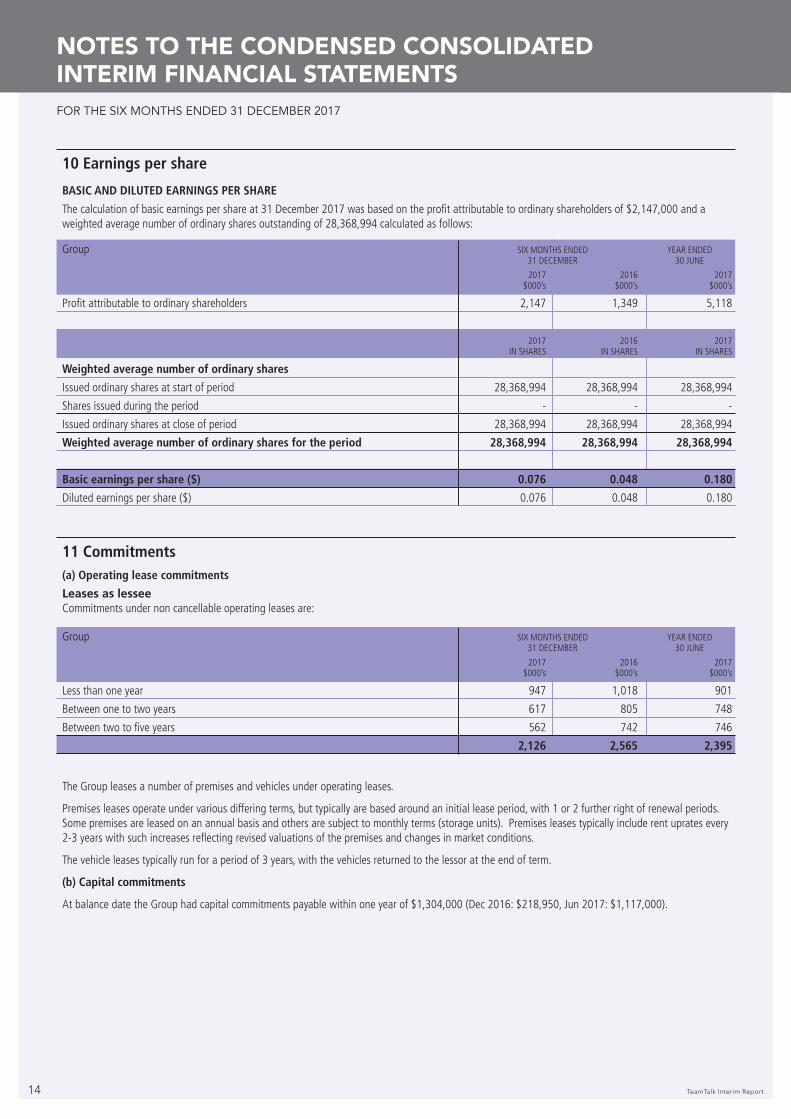
10 Earnings per share
BASIC AND DILUTED EARNINGS PER SHARE
The calculation of basic earnings per share at 31 December 2017 was based on the profit attributable to ordinary shareholders of $2,147,000 and a weighted average number of ordinary shares outstanding of 28,368,994 calculated as follows:
11 Commitments(a) Operating lease commitments
Leases as lessee Commitments under non cancellable operating leases are:
Group SIX MONTHS ENDED YEAR ENDED 31 DECEMBER 30 JUNE
2017 2016 2017 $000’s $000’s $000’s
Profit attributable to ordinary shareholders 2,147 1,349 5,118
2017 2016 2017 IN SHARES IN SHARES IN SHARES
Weighted average number of ordinary shares
Issued ordinary shares at start of period 28,368,994 28,368,994 28,368,994
Shares issued during the period - - -
Issued ordinary shares at close of period 28,368,994 28,368,994 28,368,994
Weighted average number of ordinary shares for the period 28,368,994 28,368,994 28,368,994
Basic earnings per share ($) 0.076 0.048 0.180
Diluted earnings per share ($) 0.076 0.048 0.180
Group SIX MONTHS ENDED YEAR ENDED 31 DECEMBER 30 JUNE
2017 2016 2017 $000’s $000’s $000’s
Less than one year 947 1,018 901
Between one to two years 617 805 748
Between two to five years 562 742 746
2,126 2,565 2,395
The Group leases a number of premises and vehicles under operating leases.
Premises leases operate under various differing terms, but typically are based around an initial lease period, with 1 or 2 further right of renewal periods. Some premises are leased on an annual basis and others are subject to monthly terms (storage units). Premises leases typically include rent uprates every 2-3 years with such increases reflecting revised valuations of the premises and changes in market conditions.
The vehicle leases typically run for a period of 3 years, with the vehicles returned to the lessor at the end of term.
(b) Capital commitments
At balance date the Group had capital commitments payable within one year of $1,304,000 (Dec 2016: $218,950, Jun 2017: $1,117,000).
NOTES TO THE CONDENSED CONSOLIDATED INTERIM FINANCIAL STATEMENTSFOR THE SIX MONTHS ENDED 31 DECEMBER 2017
2018 15
NOTES TO THE CONDENSED CONSOLIDATED INTERIM FINANCIAL STATEMENTSFOR THE SIX MONTHS ENDED 31 DECEMBER 2017
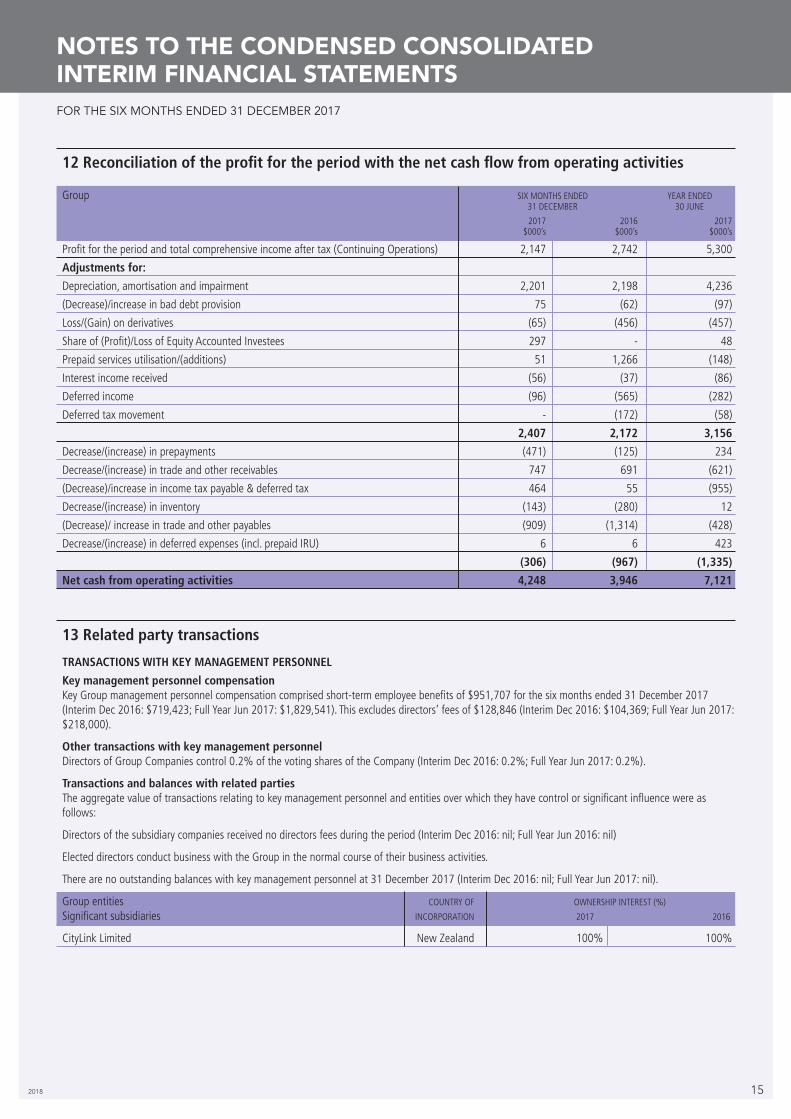
12 Reconciliation of the profit for the period with the net cash flow from operating activities
13 Related party transactions
TRANSACTIONS WITH KEY MANAGEMENT PERSONNEL
Key management personnel compensation Key Group management personnel compensation comprised short-term employee benefits of $951,707 for the six months ended 31 December 2017 (Interim Dec 2016: $719,423; Full Year Jun 2017: $1,829,541). This excludes directors’ fees of $128,846 (Interim Dec 2016: $104,369; Full Year Jun 2017: $218,000).
Other transactions with key management personnel Directors of Group Companies control 0.2% of the voting shares of the Company (Interim Dec 2016: 0.2%; Full Year Jun 2017: 0.2%).
Transactions and balances with related parties The aggregate value of transactions relating to key management personnel and entities over which they have control or significant influence were as follows:
Directors of the subsidiary companies received no directors fees during the period (Interim Dec 2016: nil; Full Year Jun 2016: nil)
Elected directors conduct business with the Group in the normal course of their business activities.
There are no outstanding balances with key management personnel at 31 December 2017 (Interim Dec 2016: nil; Full Year Jun 2017: nil).
Group entities COUNTRY OF OWNERSHIP INTEREST (%)
Significant subsidiaries INCORPORATION 2017 2016
CityLink Limited New Zealand 100% 100%
Group SIX MONTHS ENDED YEAR ENDED 31 DECEMBER 30 JUNE
2017 2016 2017 $000’s $000’s $000’s
Profit for the period and total comprehensive income after tax (Continuing Operations) 2,147 2,742 5,300
Adjustments for:
Depreciation, amortisation and impairment 2,201 2,198 4,236
(Decrease)/increase in bad debt provision 75 (62) (97)
Loss/(Gain) on derivatives (65) (456) (457)
Share of (Profit)/Loss of Equity Accounted Investees 297 - 48
Prepaid services utilisation/(additions) 51 1,266 (148)
Interest income received (56) (37) (86)
Deferred income (96) (565) (282)
Deferred tax movement - (172) (58)
2,407 2,172 3,156
Decrease/(increase) in prepayments (471) (125) 234
Decrease/(increase) in trade and other receivables 747 691 (621)
(Decrease)/increase in income tax payable & deferred tax 464 55 (955)
Decrease/(increase) in inventory (143) (280) 12
(Decrease)/ increase in trade and other payables (909) (1,314) (428)
Decrease/(increase) in deferred expenses (incl. prepaid IRU) 6 6 423
(306) (967) (1,335)
Net cash from operating activities 4,248 3,946 7,121
16 TeamTalk Interim Report
NOTES TO THE CONDENSED CONSOLIDATED INTERIM FINANCIAL STATEMENTSFOR THE SIX MONTHS ENDED 31 DECEMBER 2017
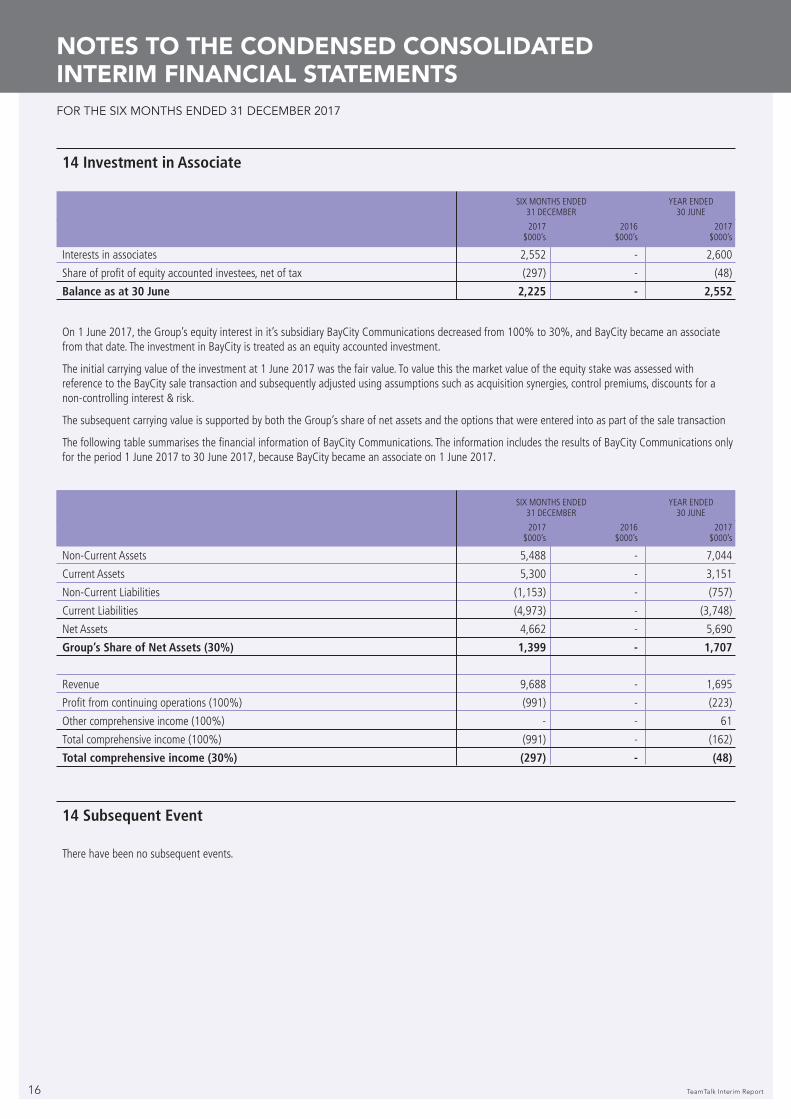
14 Investment in Associate SIX MONTHS ENDED YEAR ENDED 31 DECEMBER 30 JUNE
2017 2016 2017 $000’s $000’s $000’s
Interests in associates 2,552 - 2,600
Share of profit of equity accounted investees, net of tax (297) - (48)
Balance as at 30 June 2,225 - 2,552
On 1 June 2017, the Group’s equity interest in it’s subsidiary BayCity Communications decreased from 100% to 30%, and BayCity became an associate from that date. The investment in BayCity is treated as an equity accounted investment.
The initial carrying value of the investment at 1 June 2017 was the fair value. To value this the market value of the equity stake was assessed with reference to the BayCity sale transaction and subsequently adjusted using assumptions such as acquisition synergies, control premiums, discounts for a non-controlling interest & risk.
The subsequent carrying value is supported by both the Group’s share of net assets and the options that were entered into as part of the sale transaction
The following table summarises the financial information of BayCity Communications. The information includes the results of BayCity Communications only for the period 1 June 2017 to 30 June 2017, because BayCity became an associate on 1 June 2017.
SIX MONTHS ENDED YEAR ENDED 31 DECEMBER 30 JUNE
2017 2016 2017 $000’s $000’s $000’s
Non-Current Assets 5,488 - 7,044
Current Assets 5,300 - 3,151
Non-Current Liabilities (1,153) - (757)
Current Liabilities (4,973) - (3,748)
Net Assets 4,662 - 5,690
Group’s Share of Net Assets (30%) 1,399 - 1,707
Revenue 9,688 - 1,695
Profit from continuing operations (100%) (991) - (223)
Other comprehensive income (100%) - - 61
Total comprehensive income (100%) (991) - (162)
Total comprehensive income (30%) (297) - (48)
14 Subsequent Event There have been no subsequent events.
2018 17
NOTES TO THE FINANCIAL STATEMENTSTEAMTALK LIMITED CORPORATE DIRECTORY
REGISTERED OFFICELevel 6, 25-27 Cambridge Terrace, Wellington, New Zealand
HEAD OFFICELevel 6, 25-27 Cambridge Terrace, Wellington, New Zealand Phone: (04) 802 1470 www.teamtalk.co.nz
BRANCHESAUCKLAND
2 Robert Street, Ellerslie, Auckland Phone: (09) 580 9282
CHRISTCHURCH
Unit 2, 49 Sir William Pickering Drive, Burnside, Christchurch Phone: (03) 357 3005
SUBSIDIARIESCITYLINK LIMITED
Level 6, 25-27 Cambridge Terrace, Wellington, New Zealand Phone: (04) 802 1470 www.citylink.co.nz
AUDITORSKPMG
10 Customhouse Quay, Wellington, New Zealand
SOLICITORS
Crengle, Shreves & Ratner 105-109 The Terrace, Wellington, New Zealand
BANKERS
Westpac Banking Corporation 10-14 Courtenay Place, Wellington, New Zealand
REGISTRAR
Link Market Services Limited 138 Tancred Street, Ashburton, New Zealand