Embed Size (px)
Citation preview
1
Interim Report2014
CONTENTS
Vision, Mission and Values 3
Company Information 4
Shareholders’ Information 5
Company Profile 6
Directors’ Review 8
Condensed Interim Balance Sheet 10
Condensed Interim Profit and Loss Account 12
Condensed Interim Statement of Comprehensive Income 13
Condensed Interim Cash Flow Statement 14
Condensed Interim Statement of Changes in Equity 15
Selected Notes to the Condensed Interim Financial Information 16

2

3
Interim Report2014
To gain and maintain leadership in the industries it competes in by producing the best quality products with lowest possible cost.
To give the best returns to shareholders by optimal allocation of resources to the products and markets the Company competes in.
To provide the best value products and services to its customers through investment in technology, human resources, operational
systems and processes.
To provide the best working environment to its employees and provide opportunities to them for enhancing their skills.
To work with its farmers, suppliers and distributors as partners developing their expertise and profitability.
To pursue environment friendly policies and effectively and efficiently use all energy resources aiming for zero waste and a
clean healthy environment in its vicinity.
To be a socially responsible corporate citizen supporting education, health, environment and socio economic development
of the society.
ViSiON, MiSSiON & ValuES
4
COMPaNY iNFORMaTiON
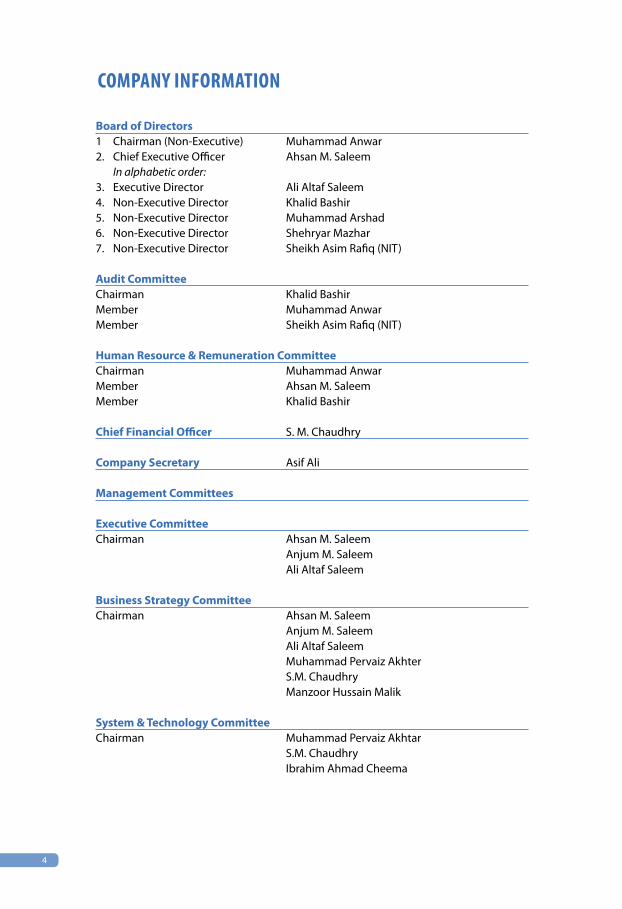
Board of Directors 1 Chairman (Non-Executive) Muhammad Anwar 2. Chief Executive Officer Ahsan M. Saleem In alphabetic order:3. Executive Director Ali Altaf Saleem4. Non-Executive Director Khalid Bashir5. Non-Executive Director Muhammad Arshad6. Non-Executive Director Shehryar Mazhar7. Non-Executive Director Sheikh Asim Rafiq (NIT)
Audit CommitteeChairman Khalid BashirMember Muhammad AnwarMember Sheikh Asim Rafiq (NIT)
Human Resource & Remuneration CommitteeChairman Muhammad Anwar Member Ahsan M. Saleem Member Khalid Bashir
Chief Financial Officer S. M. Chaudhry
Company Secretary Asif Ali
Management Committees
Executive CommitteeChairman Ahsan M. Saleem Anjum M. Saleem Ali Altaf Saleem
Business Strategy CommitteeChairman Ahsan M. Saleem Anjum M. Saleem Ali Altaf Saleem Muhammad Pervaiz Akhter S.M. Chaudhry Manzoor Hussain Malik
System & Technology CommitteeChairman Muhammad Pervaiz Akhtar S.M. Chaudhry Ibrahim Ahmad Cheema

5
Interim Report2014
Stock Exchange Listing Shakarganj Mills Limited is a listedcompany and its shares are traded on all the three stock exchanges of Pakistan. Daily quotes on the Company’s stock can be obtained from leading newspapers. Shakarganj is listed under ‘Food Producers’
Public InformationFinancial analysts, Stock brokers,interested investors and financialmedia desiring information about“Shakarganj” should contact Mr. Asif Ali at the Company’s Office, Jhang.Tel: 047 763 1001 - 05Fax: 047 763 1011E-mail: [email protected]
Shareholders’ InformationInquiries concerning lost stockcertificates, dividend payment,change of address, verification oftransfer deeds and share transfersshould be directed to CorpTec Associates (Pvt) Limited Share Registrar of the Company at Lahore.Tel: 042 3517 0336 - 7Fax: 042 3517 0338E-mail: [email protected]
Products• Sugar• BioFuel• BioPower• BuildingMaterials• Yarn• TigerCompost
Legal AdvisorHassan & Hassan Advocates, Lahore
BankersAllied Bank LimitedMCB Bank LimitedNational Bank of PakistanThe Bank of PunjabUnited Bank LimitedStandard Chartered Bank Silk Bank LimitedBank Alfalah LimitedFaysal Bank LimitedAskari Bank Limited
ShaREhOldERS’ iNFORMaTiON
Works
Principal Facility
Management House Toba Road, Jhang, PakistanTel: 047 763 1001 - 05Fax: 047 763 1011E-mail: [email protected]
Satellite Facility
Management House 63 km, Jhang Sargodha RoadBhone, PakistanTel: 048 688 9211 - 13Fax: 047 763 1011
Websitewww.shakarganj.com.pkNote: This Interim Report isavailable on Shakarganj website.
Registered and Principal Office 10th Floor, BOP Tower,10-B Block E 2, Gulberg III,Lahore, PakistanTel: 042 3578 3801- 06Fax: 042 3578 3811
Karachi Office12th Floor, Sidco Avenue Centre,264 R.A. Lines, Karachi, PakistanTel: 021 3568 8149Fax: 021 3568 0476
Faisalabad OfficeNishatabad, New Lahore Road,Faisalabad, PakistanTel: 041 875 2810Fax: 041 875 2811
Share Registrar CorpTec Associates (Pvt) Limited503-E, Johar TownLahoreTel: 042 3517 0336 - 7Fax: 042 3517 0338E-mail: [email protected]
6
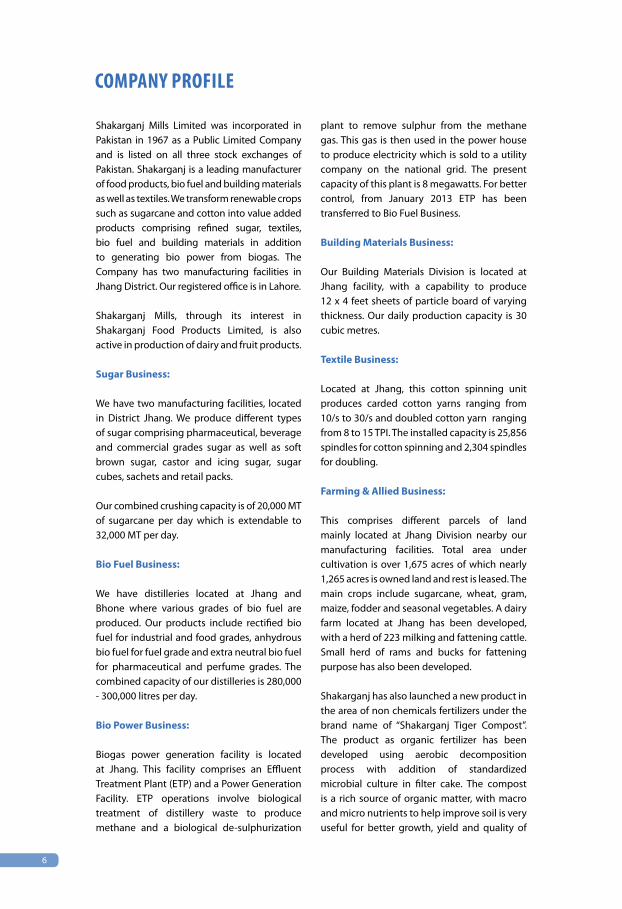
Shakarganj Mills Limited was incorporated in Pakistan in 1967 as a Public Limited Company and is listed on all three stock exchanges of Pakistan. Shakarganj is a leading manufacturer of food products, bio fuel and building materials as well as textiles. We transform renewable crops such as sugarcane and cotton into value added products comprising refined sugar, textiles, bio fuel and building materials in addition to generating bio power from biogas. The Company has two manufacturing facilities in Jhang District. Our registered office is in Lahore.
Shakarganj Mills, through its interest in Shakarganj Food Products Limited, is also active in production of dairy and fruit products.
Sugar Business:
We have two manufacturing facilities, located in District Jhang. We produce different types of sugar comprising pharmaceutical, beverage and commercial grades sugar as well as soft brown sugar, castor and icing sugar, sugar cubes, sachets and retail packs.
Our combined crushing capacity is of 20,000 MT of sugarcane per day which is extendable to 32,000 MT per day.
Bio Fuel Business:
We have distilleries located at Jhang and Bhone where various grades of bio fuel are produced. Our products include rectified bio fuel for industrial and food grades, anhydrous bio fuel for fuel grade and extra neutral bio fuel for pharmaceutical and perfume grades. The combined capacity of our distilleries is 280,000 - 300,000 litres per day.
Bio Power Business:
Biogas power generation facility is located at Jhang. This facility comprises an Effluent Treatment Plant (ETP) and a Power Generation Facility. ETP operations involve biological treatment of distillery waste to produce methane and a biological de-sulphurization
plant to remove sulphur from the methane gas. This gas is then used in the power house to produce electricity which is sold to a utility company on the national grid. The present capacity of this plant is 8 megawatts. For better control, from January 2013 ETP has been transferred to Bio Fuel Business.
Building Materials Business:
Our Building Materials Division is located at Jhang facility, with a capability to produce 12 x 4 feet sheets of particle board of varying thickness. Our daily production capacity is 30 cubic metres.
Textile Business:
Located at Jhang, this cotton spinning unit produces carded cotton yarns ranging from 10/s to 30/s and doubled cotton yarn ranging from 8 to 15 TPI. The installed capacity is 25,856 spindles for cotton spinning and 2,304 spindles for doubling.
Farming & Allied Business:
This comprises different parcels of land mainly located at Jhang Division nearby our manufacturing facilities. Total area under cultivation is over 1,675 acres of which nearly 1,265 acres is owned land and rest is leased. The main crops include sugarcane, wheat, gram, maize, fodder and seasonal vegetables. A dairy farm located at Jhang has been developed, with a herd of 223 milking and fattening cattle. Small herd of rams and bucks for fattening purpose has also been developed.
Shakarganj has also launched a new product in the area of non chemicals fertilizers under the brand name of “Shakarganj Tiger Compost”. The product as organic fertilizer has been developed using aerobic decomposition process with addition of standardized microbial culture in filter cake. The compost is a rich source of organic matter, with macro and micro nutrients to help improve soil is very useful for better growth, yield and quality of
COMPaNY PROFilE

7
Interim Report2014
all field crops in general and specifically for sugarcane. This is at its initial stage and would grow up in the farmer’s community with the practical exposures.
Business Vision and Strategy:
Shakarganj’s vision is to create country’s leading renewable ingredients business. We aim to achieve this by building a consistent portfolio of distinctive, profitable, high-value solutions in products and services for our customers. Shakarganj is committed to provide long-term value for our shareholders. Our strategy is to build a stronger value added business with a low-cost commodity base. We focus on five key business objectives to deliver consistent growth.
- Serve our Customers:
Delivering excellent customer service is at the core of everything we do. Our aim is to be the partner of choice in our customers’ processes and to help them develop more successful consumer products.
- Operate Efficiently and Safely:
We aim to be the lowest-cost and most efficient producer in all our markets. Through our expertise in high-volume process management, our focus is on technical and manufacturing excellence and the efficient use of services such as logistics and utilities. We are continually working to improve operational efficiency and strive to ensure safe and healthy conditions for everyone at our sites.
- Invest in Long Term Assets and Partnerships:
We continually evaluate investment opportunities that would add strategic value by enabling us to enter new markets or add products, technologies and knowledge more efficiently than we could organically. We also aim to grow our business by forming joint ventures and partnerships to enhance the capabilities of our existing product portfolio. Using alliances and joint ventures can be an efficient way to lower our cost of investing in new areas and markets, and will help secure access to new and complementary technology and expertise.
- Invest in Technology and People:
We are investing in our research and development capabilities to help us in developing innovative solutions that meet our customers’ product challenges. We are also complementing our own capabilities through business and technology partnerships, and university collaborations. To develop talent, improve leadership and help our employees succeed, we operate various programs designed to ensure the right skills at all levels to grow our business.
- Grow the Contribution from Value Added Products:
We are committed to grow the contribution from our value added products. Value added products utilize technology and intellectual property enabling us to obtain a price premium along with sustainable and/or higher margins.
8
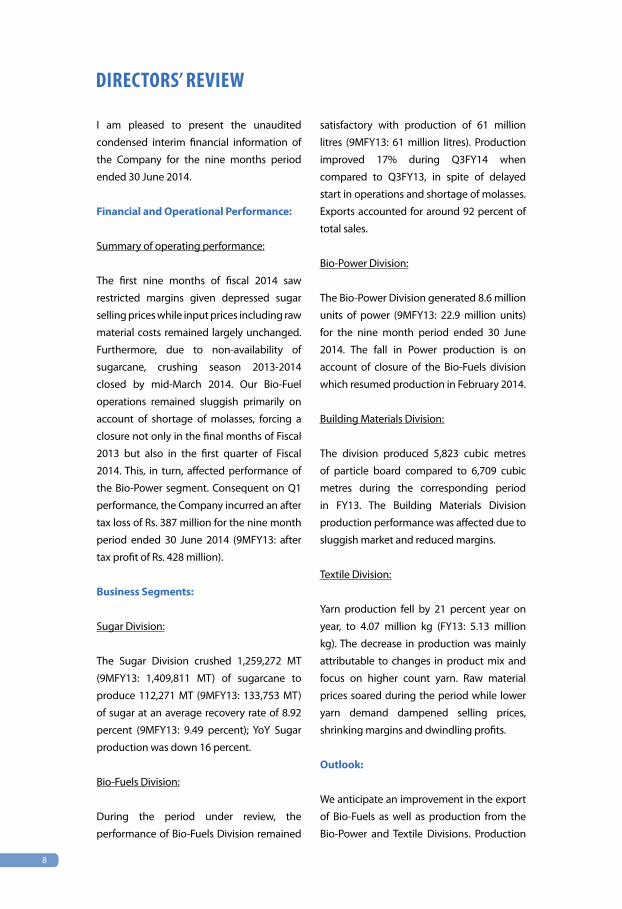
I am pleased to present the unaudited
condensed interim financial information of
the Company for the nine months period
ended 30 June 2014.
Financial and Operational Performance:
Summary of operating performance:
The first nine months of fiscal 2014 saw
restricted margins given depressed sugar
selling prices while input prices including raw
material costs remained largely unchanged.
Furthermore, due to non-availability of
sugarcane, crushing season 2013-2014
closed by mid-March 2014. Our Bio-Fuel
operations remained sluggish primarily on
account of shortage of molasses, forcing a
closure not only in the final months of Fiscal
2013 but also in the first quarter of Fiscal
2014. This, in turn, affected performance of
the Bio-Power segment. Consequent on Q1
performance, the Company incurred an after
tax loss of Rs. 387 million for the nine month
period ended 30 June 2014 (9MFY13: after
tax profit of Rs. 428 million).
Business Segments:
Sugar Division:
The Sugar Division crushed 1,259,272 MT
(9MFY13: 1,409,811 MT) of sugarcane to
produce112,271MT (9MFY13:133,753MT)
of sugar at an average recovery rate of 8.92
percent (9MFY13: 9.49 percent); YoY Sugar
production was down 16 percent.
Bio-Fuels Division:
During the period under review, the
performance of Bio-Fuels Division remained
satisfactory with production of 61 million
litres (9MFY13: 61million litres). Production
improved 17% during Q3FY14 when
compared to Q3FY13, in spite of delayed
start in operations and shortage of molasses.
Exports accounted for around 92 percent of
total sales.
Bio-Power Division:
The Bio-Power Division generated 8.6 million
units of power (9MFY13: 22.9million units)
for the nine month period ended 30 June
2014. The fall in Power production is on
account of closure of the Bio-Fuels division
which resumed production in February 2014.
Building Materials Division:
The division produced 5,823 cubic metres
of particle board compared to 6,709 cubic
metres during the corresponding period
in FY13. The Building Materials Division
production performance was affected due to
sluggish market and reduced margins.
Textile Division:
Yarn production fell by 21 percent year on
year, to 4.07 million kg (FY13: 5.13 million
kg). The decrease in production was mainly
attributable to changes in product mix and
focus on higher count yarn. Raw material
prices soared during the period while lower
yarn demand dampened selling prices,
shrinking margins and dwindling profits.
Outlook:
We anticipate an improvement in the export
of Bio-Fuels as well as production from the
Bio-Power and Textile Divisions. Production
diRECTORS’ REViEw

9
Interim Report2014
performance of our major business segment,
bio-fuels, significantly improved in Q3FY14
ascomparedtoQ3FY13and,wearehopeful
that momentum will continue through the
remainder of fiscal year 2014.
Inspite of all the challenges as stated in Note
1.2 of the annexed condensed interim financial
information, the Company believes that there
is no doubt on its ability to continue as a
going concern as it has adequate resources
and operating capabilities to continue
operations for the foreseeable future. The
steps taken by the management so far and
those planned for the future are explained in
Note 1.2 of the annexed condensed interim
financial information.
Finally, I would like to record our appreciation
to all stakeholders for their patronage and
look forward to their continued support.
On behalf of the Board
Ahsan M. SaleemChief Executive OfficerDate: 24 July 2014
10
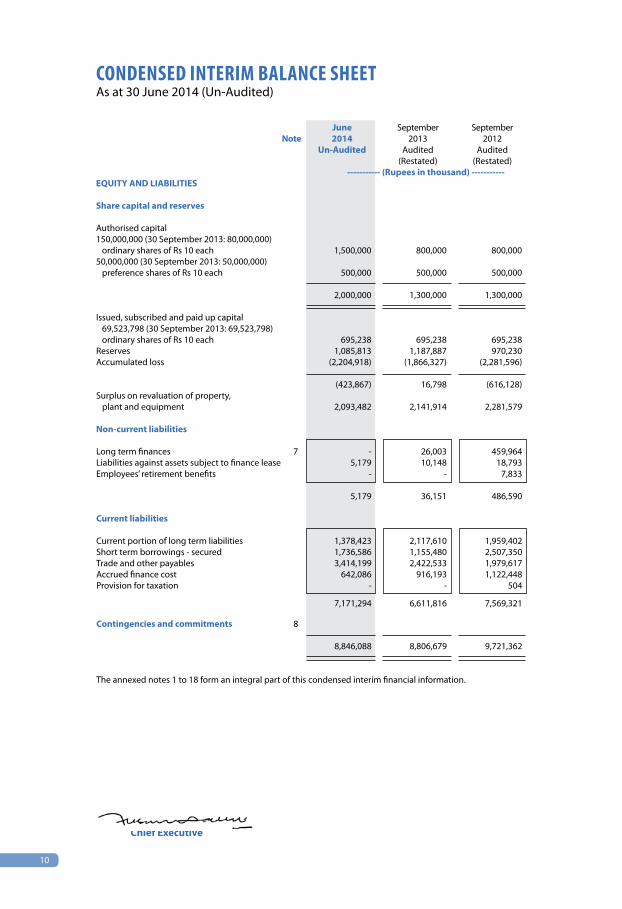
CONdENSEd iNTERiM BalaNCE ShEETAs at 30 June 2014 (Un-Audited)
Chief Executive
June September September Note 2014 2013 2012 Un-Audited Audited Audited (Restated) (Restated) ----------- (Rupees in thousand) -----------EQUITY AND LIABILITIES Share capital and reserves Authorised capital 150,000,000 (30 September 2013: 80,000,000) ordinary shares of Rs 10 each 1,500,000 800,000 800,000 50,000,000 (30 September 2013: 50,000,000) preference shares of Rs 10 each 500,000 500,000 500,000
2,000,000 1,300,000 1,300,000 Issued, subscribed and paid up capital 69,523,798 (30 September 2013: 69,523,798) ordinary shares of Rs 10 each 695,238 695,238 695,238 Reserves 1,085,813 1,187,887 970,230 Accumulated loss (2,204,918) (1,866,327) (2,281,596)
(423,867) 16,798 (616,128)Surplus on revaluation of property, plant and equipment 2,093,482 2,141,914 2,281,579 Non-current liabilities Long term finances 7 - 26,003 459,964 Liabilities against assets subject to finance lease 5,179 10,148 18,793 Employees’ retirement benefits - - 7,833
5,179 36,151 486,590 Current liabilities Current portion of long term liabilities 1,378,423 2,117,610 1,959,402 Short term borrowings - secured 1,736,586 1,155,480 2,507,350 Trade and other payables 3,414,199 2,422,533 1,979,617 Accrued finance cost 642,086 916,193 1,122,448 Provision for taxation - - 504
7,171,294 6,611,816 7,569,321 Contingencies and commitments 8 8,846,088 8,806,679 9,721,362
The annexed notes 1 to 18 form an integral part of this condensed interim financial information.

11
Interim Report2014
Chairman
Note June September September 2014 2013 2012 Un-Audited Audited Audited (Restated) (Restated) ----------- (Rupees in thousand) -----------ASSETS Non-current assets Property, plant and equipment 9 6,069,958 6,252,667 6,401,019 Intangible assets 910 955 1,045 Biological assets 13,324 13,975 8,895 Investments - related parties 10 594,537 1,081,722 750,895 Employees’ retirement benefits 7,293 4,467 - Long term loans, advances, deposits and prepayments 11,778 38,323 39,969 Deferred taxation - - -
6,697,800 7,392,109 7,201,823 Current assets Biological assets 22,310 32,600 37,395 Stores, spares and loose tools 117,001 115,086 129,862 Stock-in-trade 1,110,805 522,007 1,765,735 Trade debts 200,641 71,619 243,138 Investments 11 269,658 248,607 119,041 Loans, advances, deposits, prepayments and other receivables 365,653 324,282 154,767 Cash and bank balances 62,220 100,369 69,601
2,148,288 1,414,570 2,519,539
8,846,088 8,806,679 9,721,362

12
CONdENSEd iNTERiM PROFiT aNd lOSS aCCOuNTFor the nine months period ended 30 June 2014 (Un-Audited)
Chief Executive Chairman
Quarter ended Nine months ended
Note 30 June 30 June 30 June 30 June
2014 2013 2014 2013
--------------- (Rupees in thousand) ---------------
Sales 12.1 2,146,489 4,714,261 9,707,795 11,274,112
Cost of sales 12.2 (2,044,808) (4,458,826) (9,630,159) (10,145,734)
Gross profit 101,681 255,435 77,636 1,128,378
Administrative expenses (69,502) (70,030) (231,411) (218,968)
Distribution and selling costs (101,838) (97,442) (241,490) (275,389)
Other operating expenses (3,669) (15,521) (32,438) (61,590)
Other operating income 13 31,014 42,772 325,452 149,758
Profit / (loss) from operations (42,314) 115,214 (102,251) 722,189
Finance cost (81,969) (111,986) (249,256) (345,108)
Share of income from associates 41,133 31,966 88,781 155,707
Profit / (loss) before taxation (83,150) 35,194 (262,726) 532,788
Taxation
- Company (30,949) (34,300) (106,420) (82,513)
- Associates (7,573) (5,135) (17,876) (21,889)
(38,522) (39,435) (124,296) (104,402)
Profit / (loss) after taxation (121,672) (4,241) (387,022) 428,386
Earnings per share
Basic earnings per share 14.1 (1.75) (0.06) (5.57) 6.16
Diluted earnings per share 14.2 (1.62) (0.06) (5.14) 5.69
The annexed notes 1 to 18 form an integral part of this condensed interim financial information.
13
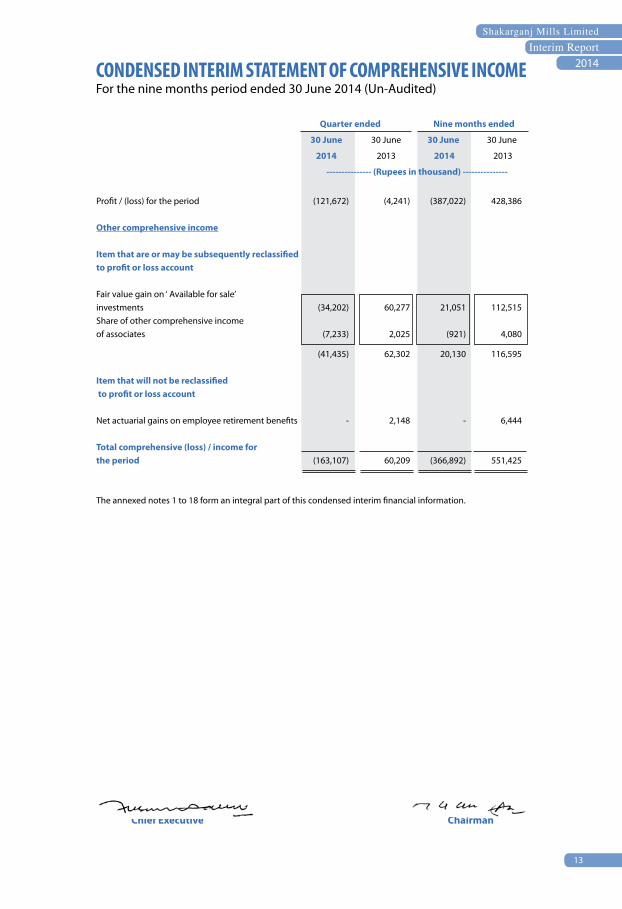
Interim Report2014CONdENSEd iNTERiM STaTEMENT OF COMPREhENSiVE iNCOME
For the nine months period ended 30 June 2014 (Un-Audited)
Chief Executive Chairman
Quarter ended Nine months ended
30 June 30 June 30 June 30 June
2014 2013 2014 2013
--------------- (Rupees in thousand) ---------------
Profit / (loss) for the period (121,672) (4,241) (387,022) 428,386 Other comprehensive income Item that are or may be subsequently reclassified to profit or loss account Fair value gain on ‘ Available for sale’ investments (34,202) 60,277 21,051 112,515 Share of other comprehensive income of associates (7,233) 2,025 (921) 4,080
(41,435) 62,302 20,130 116,595 Item that will not be reclassified to profit or loss account Net actuarial gains on employee retirement benefits - 2,148 - 6,444 Total comprehensive (loss) / income for the period (163,107) 60,209 (366,892) 551,425 The annexed notes 1 to 18 form an integral part of this condensed interim financial information.
14
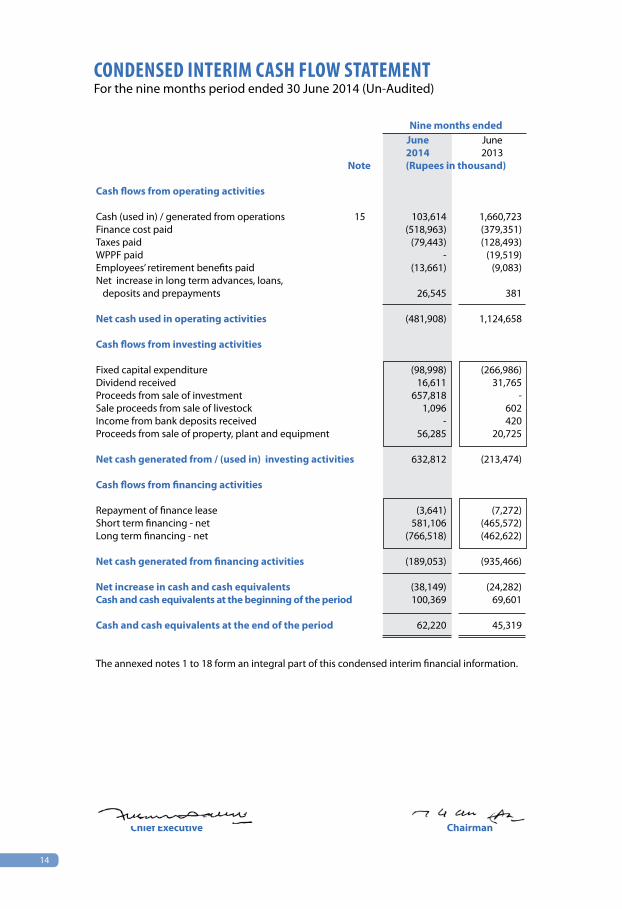
CONdENSEd iNTERiM CaSh FlOw STaTEMENTFor the nine months period ended 30 June 2014 (Un-Audited)
Nine months ended June June 2014 2013 Note (Rupees in thousand)
Cash flows from operating activities Cash (used in) / generated from operations 15 103,614 1,660,723 Finance cost paid (518,963) (379,351)Taxes paid (79,443) (128,493)WPPF paid - (19,519)Employees’ retirement benefits paid (13,661) (9,083)Net increase in long term advances, loans, deposits and prepayments 26,545 381 Net cash used in operating activities (481,908) 1,124,658 Cash flows from investing activities Fixed capital expenditure (98,998) (266,986)Dividend received 16,611 31,765 Proceeds from sale of investment 657,818 - Sale proceeds from sale of livestock 1,096 602 Income from bank deposits received - 420 Proceeds from sale of property, plant and equipment 56,285 20,725 Net cash generated from / (used in) investing activities 632,812 (213,474) Cash flows from financing activities Repayment of finance lease (3,641) (7,272)Short term financing - net 581,106 (465,572)Long term financing - net (766,518) (462,622) Net cash generated from financing activities (189,053) (935,466) Net increase in cash and cash equivalents (38,149) (24,282)Cash and cash equivalents at the beginning of the period 100,369 69,601
Cash and cash equivalents at the end of the period 62,220 45,319
The annexed notes 1 to 18 form an integral part of this condensed interim financial information.
Chief Executive Chairman
15
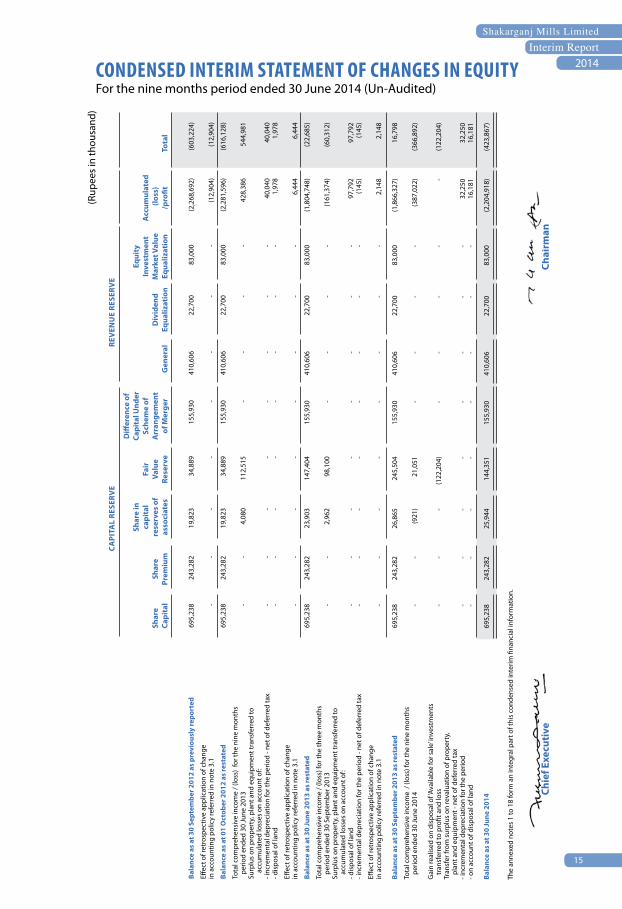
Interim Report2014CONdENSEd iNTERiM STaTEMENT OF ChaNGES iN EQuiTY
For the nine months period ended 30 June 2014 (Un-Audited)
C
API
TAL
RESE
RVE
REV
ENU
E RE
SERV
E
D
iffer
ence
of
Shar
e in
Capi
tal U
nder
Eq
uity
capi
tal
Fair
Sc
hem
e of
In
vest
men
t A
ccum
ulat
ed
Sh
are
Shar
e re
serv
es o
f Va
lue
Arr
ange
men
t
Div
iden
d M
arke
t Val
ue
(lo
ss)
C
apit
al
Prem
ium
as
soci
ates
Re
serv
e of
Mer
ger
Gen
eral
Eq
ualiz
atio
n Eq
ualiz
atio
n /p
rofit
To
tal
Bala
nce
as a
t 30
Sept
embe
r 201
2 as
pre
viou
sly
repo
rted
6
95,2
38
243
,282
1
9,82
3
34,
889
1
55,9
30
410
,606
2
2,70
0
83,
000
(2
,268
,692
) (6
03,2
24)
Effec
t of r
etro
spec
tive
appl
icat
ion
of c
hang
e
in a
ccou
ntin
g po
licy
refe
rred
in n
ote
3.1
-
-
-
-
-
-
-
-
(12,
904)
(1
2,90
4)
Bala
nce
as a
t 01
Oct
ober
201
2 as
rest
ated
6
95,2
38
243
,282
1
9,82
3
34,
889
1
55,9
30
410
,606
2
2,70
0
83,
000
(2
,281
,596
) (6
16,1
28)
Tota
l com
preh
ensi
ve in
com
e / (
loss
) fo
r the
nin
e m
onth
s
perio
d en
ded
30 Ju
ne 2
013
-
-
4,0
80
112
,515
-
-
-
-
428
,386
5
44,9
81
Surp
lus
on p
rope
rty,
pla
nt a
nd e
quip
men
t tra
nsfe
rred
to
acc
umul
ated
loss
es o
n ac
coun
t of:
- i
ncre
men
tal d
epre
ciat
ion
for t
he p
erio
d - n
et o
f def
erre
d ta
x -
-
-
-
-
-
-
-
4
0,04
0
40,
040
- dis
posa
l of l
and
- -
- -
- -
- -
1,9
78
1,9
78
Effec
t of r
etro
spec
tive
appl
icat
ion
of c
hang
e
in a
ccou
ntin
g po
licy
refe
rred
in n
ote
3.1
-
-
-
-
-
-
-
-
6,4
44
6,4
44
Bala
nce
as a
t 30
June
201
3 as
rest
ated
6
95,2
38
243
,282
2
3,90
3
147
,404
1
55,9
30
410
,606
2
2,70
0
83,
000
(1
,804
,748
) (2
2,68
5)
To
tal c
ompr
ehen
sive
inco
me
/ (lo
ss) f
or th
e th
ree
mon
ths
pe
riod
ende
d 30
Sep
tem
ber 2
013
-
-
2,9
62
98,
100
-
-
-
-
(1
61,3
74)
(60,
312)
Surp
lus
on p
rope
rty,
pla
nt a
nd e
quip
men
t tra
nsfe
rred
to
accu
mul
ated
loss
es o
n ac
coun
t of:
- d
ispo
sal o
f lan
d -
-
-
-
-
-
-
-
9
7,79
2
97,
792
- inc
rem
enta
l dep
reci
atio
n fo
r the
per
iod
- net
of d
efer
red
tax
-
-
-
-
-
-
-
-
(145
) (1
45)
Effec
t of r
etro
spec
tive
appl
icat
ion
of c
hang
e
in a
ccou
ntin
g po
licy
refe
rred
in n
ote
3.1
-
-
-
-
-
-
-
-
2,1
48
2,1
48
Ba
lanc
e as
at 3
0 Se
ptem
ber 2
013
as re
stat
ed
695
,238
2
43,2
82
26,
865
2
45,5
04
155
,930
4
10,6
06
22,
700
8
3,00
0
(1,8
66,3
27)
16,
798
Tota
l com
preh
ensi
ve in
com
e /
(loss
) for
the
nine
mon
ths
pe
riod
ende
d 30
June
201
4 -
-
(9
21)
21,
051
-
-
-
-
(387
,022
) (3
66,8
92)
Gai
n re
alis
ed o
n di
spos
al o
f ‘Ava
ilabl
e fo
r sal
e’ in
vest
men
ts
tran
sfer
red
to p
rofit
and
loss
-
-
-
(1
22,2
04)
-
-
-
-
-
(122
,204
)Tr
ansf
er fr
om s
urpl
us o
n re
valu
atio
n of
pro
pert
y,
plan
t and
equ
ipm
ent -
net
of d
efer
red
tax
- i
ncre
men
tal d
epre
ciat
ion
for t
he p
erio
d -
-
-
-
-
-
-
-
3
2,25
0
32,
250
- on
acco
unt o
f dis
posa
l of l
and
- -
- -
- -
- -
16,
181
1
6,18
1
Ba
lanc
e as
at 3
0 Ju
ne 2
014
695
,238
2
43,2
82
25,
944
1
44,3
51
155
,930
4
10,6
06
22,
700
8
3,00
0
(2,2
04,9
18)
(423
,867
)
Th
e an
nexe
d no
tes
1 to
18
form
an
inte
gral
par
t of t
his
cond
ense
d in
terim
fina
ncia
l inf
orm
atio
n.
(Rup
ees
in th
ousa
nd)
Ch
ief E
xecu
tive
Ch
airm
an

16
NOTES TO ThE CONdENSEd iNTERiM FiNaNCial iNFORMaTiONFor the nine months period ended 30 June 2014 (Un-Audited)
1. The Company and its operations 1.1 The Company is incorporated in Pakistan and is listed on Karachi, Lahore and Islamabad Stock
Exchanges. It is principally engaged in manufacture, purchase and sale of sugar, bio fuel, building materials, yarn (textile) and engaged in generation and sale of bio power (electricity). The Company has its principal manufacturing facilities at Jhang and satellite manufacturing facilities at Bhone. The registered office of the Company is situated in Lahore.
1.2 Going concern assumption As at the reporting date, the current liabilities of the Company have exceeded its current assets
by Rs. 5,023 million (30 September 2013: Rs. 5,197 million), the equity has eroded and stands at negative Rs. 424 million. The Company has not been able to meet its various obligations for long term loans and short term borrowings. Borrowings (including mark-up payable thereon) aggregating Rs. 1,472 million (30 September 2013: Rs. 2,409 million) are over-due for payment.
The Company has been facing liquidity crunch for the last few years. In February 2010, the
Company entered into agreements for a bridge finance facility of Rs. 2,466 million and short term running finance facility of Rs. 2,980 million from a consortium of its existing lenders. The bridge finance was envisaged to be operational by April 2010 and fully repaid by June 2011 through sale of certain assets of the Company, identified in the agreement. However, neither the bridge finance facility nor the consortium cash finance could become operative due to delays in obtaining No-objection certificate from National Bank of Pakistan for creation of pari passu charge on the assets against the above new facilities. Furthermore, the Company was not able to liquidate all of the specified assets as per timelines identified in the bridge loan agreement and subsequent to 30 June 2011, these facilities stood expired.
Furthermore the Company had issued redeemable preference shares in 2005 to the shareholders
of the Company which were to be redeemed along with any outstanding dividend payable in December 2009. Due to liquidity crunch the Company has not redeemed the preference shares and preference dividend amounting to Rs. 64.79 million is also outstanding as on 30 June 2014.
The above conditions raise significant doubts on the Company’s ability to continue as a going
concern. However, the management is confident of the Company’s ability to continue as a going concern based on its concerted effort to re-profile borrowings and utilisation of improved liquidity in cost efficient operational levels of cane crushing and Bio Fuel manufacturing.
The steps taken by management up till now and planned in future are as follows: Operational measures The Company continued with its efforts to achieve operational efficiency in current and
previous periods to improve its productivity and financial results in order to generate liquidity for financing of operations and repayment of borrowings. The operational results in the current period were low compared with the previous period as the Company was only able to crush 1.26 million tons of sugarcane (2013: 1.41 million tons) however the Company sold off its entire stock of sugar and bio fuel so as to have liquidity to finance its operations for the remaining period and to further utilize it towards settling of its liabilities.
Further during this interim period, the Company disposed off its entire holding in Asian Stock
Fund, Crescent Jute Products Limited and Safeway Mutual Fund. The realised proceeds were utilized towards repayment of bank borrowings and to finance operations.
To date the Company has repaid Rs. 1,666 million of the bridge loan through utilisation of
improved liquidity resulting from operational results and sale of certain assets of the Company, namely, Sugar Unit at Dargai Shah, Power Division at Dargai Shah, full disinvestment in Safeway Mutual Fund and Asian Stocks Fund and partial disposal of agricultural land.

17
Interim Report2014
The Company, in its efforts to re-profile its borrowings, continued the process of negotiations with its lenders seeking short term financing facilities for operational liquidity and relaxation in payments of its existing loan, the details of which are as follows:
Long term financing - secured The Company requested its lenders for restructuring of over-due balances including mark-up to
term borrowings under reduced and/or non-mark-up arrangements. As a result, the Company has been able to restructure/ reschedule various loans from its lenders resulting in relaxation in payments and for others still in over-due deliberations are going on, the details of which are as follows:
- currently negotiating with National Bank of Pakistan to restructure its overdue principal
alongwith mark-up to long term loans with deferred payment terms. Furthermore, the Companyisseekingtoobtainrelaxation/waiverinoverduemark-uponupfrontpayment;
- restructuring of Rs. 176 million of over-due long term running finance and Rs. 75 million of over-due accrued mark-up under bridge finance to long term demand finance from The BankofPunjab.Thishasbeenfullyrepaidduringtheperiod;
- restructuring of Rs. 161 million of short term financing and Rs. 76 million of over-due
mark-up under bridge finance to long term loan under non mark-up arrangements from Allied Bank Limited. This has been fully repaid during the period except overdue mark up of Rs. 63.52 million.
- restructuring of bridge finance of Rs. 181 million to long term loan from United Bank
Limited.Thishasbeenfullyrepaidduringtheperiod; - restructuring of Rs. 473 million of various over-due borrowings to long term loan and
rescheduling of long term loan of Rs. 92 million from MCB Bank Limtied. Out of above, Rs. 283millionhasbeenrepaidtill30June2014;and
- negotiating separately with each term finance certificate (TFC) holders for settlement of
their outstanding over-dues. So far, the Company was successful in negotiating its over-dueexposurewithUBLFundManagersandAskariBankLimited;
Short term financing- secured The Company requested its lenders for following short term secured financing for operational
liquidity. - Working capital line against pledge of sugar at 20% margin for 120 to 150 days with an
incentive for lender to adjust 10% of the new disbursement against settlement of existing over-dueloans(principalonly);and
- An FE 25 loan in US Dollars with a maturity of 120-150 days after settlement of working capital against pledge of sugar. Such loan is being offered to be securitised against pledge of molasses/bio fuel with an incentive for lender to adjust 20% of the new disbursement against settlement of existing overdue loans (principal only).
Newly disbursed facilities shall be settled upon sale of respective commodities (sugar/ bio
fuel). The Company has negotiated with its lenders on bilateral terms and obtained working capital
lines of Rs. 1,700 million and FE 25 loan of Rs. 900 million.
18
These facilities have been obtained against pledge of sugar /molasses /bio fuel at margin ranging from 15% to 25%.
The Company is confident that based on its above mentioned plan it will continue to be
supported by the lenders and also be able to reschedule remaining of its existing over-due borrowings as well.
The condensed interim financial information has been prepared on a going concern basis
based on management’s expectation that: - the Company will continue to get support of its lenders and will be able to obtain relaxation
inpaymenttermsofitsover-dueborrowings;and - the Company will be able to generate adequate liquidity through new short term
borrowings and will be successful in utilising such funds to increase its operations and achieve its budgeted targets for production of sugar, bio fuel etc.
The condensed interim financial information consequently, do not include any adjustments
relating to the realisation of its assets and liquidation of any liabilities that might be necessary should the Company be unable to continue as a going concern.
2. Basis of preparation This condensed interim financial information is un-audited and has been prepared in accordance
with approved accounting standards as applicable in Pakistan for interim financial reporting. The disclosures in this condensed interim financial information does not include all the information reported for full annual financial statements and should be read in conjunction with the annual financial statements for the year ended 30 September 2013.
This condensed interim financial information is being submitted to the shareholders as required
by section 245 the Companies Ordinance, 1984. 3 Significant accounting policies The accounting policies and methods of computation adopted for the preparation of this
condensed interim financial information are the same as those applied in the preparation of the financial statements for the year ended 30 September 2013 and should be read in conjunction with those financial statements except for a change as a result of amendments in IAS-19 - “Employee benefits” as under.
3.1 During the period, as a result of revision in IAS 19 Employee Benefits, the Company has changed
its accounting policy with respect to the recognition of actuarial gains and losses related to its defined benefit plans.
Under revised IAS 19, the Company determines the net interest expense (income) on the net
defined benefit liability (asset) for the period by applying the discount rate used to measure the defined benefit obligation at the beginning of the annual period to then - net defined benefit liability (asset), taking into account any changes in the net defined benefit liability (asset) during the period as a result of contributions and benefit payments. All the changes in the present value of defined benefit obligation are now recognized in statement of comprehensive income and the past service costs are recognized in profit and loss account, immediately in the period they occur.
Previously, the Company recognized actuarial gains/losses over the expected average remaining
working lives of the current employees, to the extent that unrecognized actuarial gains/losses exceeds 10 percent of present value of defined benefit obligation.
19
Interim Report2014
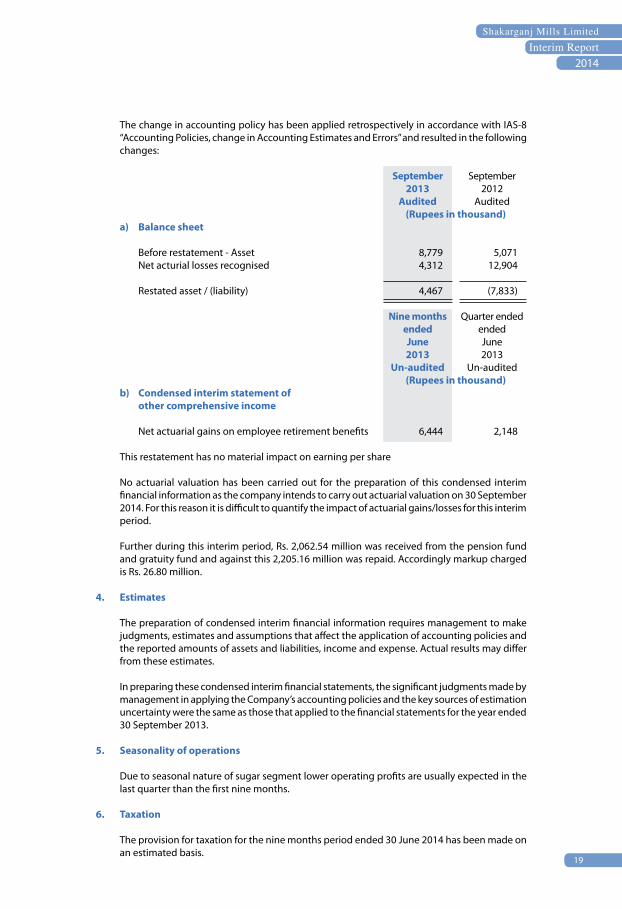
The change in accounting policy has been applied retrospectively in accordance with IAS-8 “Accounting Policies, change in Accounting Estimates and Errors” and resulted in the following changes:
September September 2013 2012 Audited Audited (Rupees in thousand) a) Balance sheet Before restatement - Asset 8,779 5,071 Net acturial losses recognised 4,312 12,904
Restated asset / (liability) 4,467 (7,833) Nine months Quarter ended ended ended June June 2013 2013 Un-audited Un-audited (Rupees in thousand) b) Condensed interim statement of other comprehensive income Net actuarial gains on employee retirement benefits 6,444 2,148
This restatement has no material impact on earning per share No actuarial valuation has been carried out for the preparation of this condensed interim
financial information as the company intends to carry out actuarial valuation on 30 September 2014. For this reason it is difficult to quantify the impact of actuarial gains/losses for this interim period.
Further during this interim period, Rs. 2,062.54 million was received from the pension fund
and gratuity fund and against this 2,205.16 million was repaid. Accordingly markup charged is Rs. 26.80 million.
4. Estimates The preparation of condensed interim financial information requires management to make
judgments, estimates and assumptions that affect the application of accounting policies and the reported amounts of assets and liabilities, income and expense. Actual results may differ from these estimates.
In preparing these condensed interim financial statements, the significant judgments made by
management in applying the Company’s accounting policies and the key sources of estimation uncertainty were the same as those that applied to the financial statements for the year ended 30 September 2013.
5. Seasonality of operations Due to seasonal nature of sugar segment lower operating profits are usually expected in the
last quarter than the first nine months. 6. Taxation The provision for taxation for the nine months period ended 30 June 2014 has been made on
an estimated basis.
20
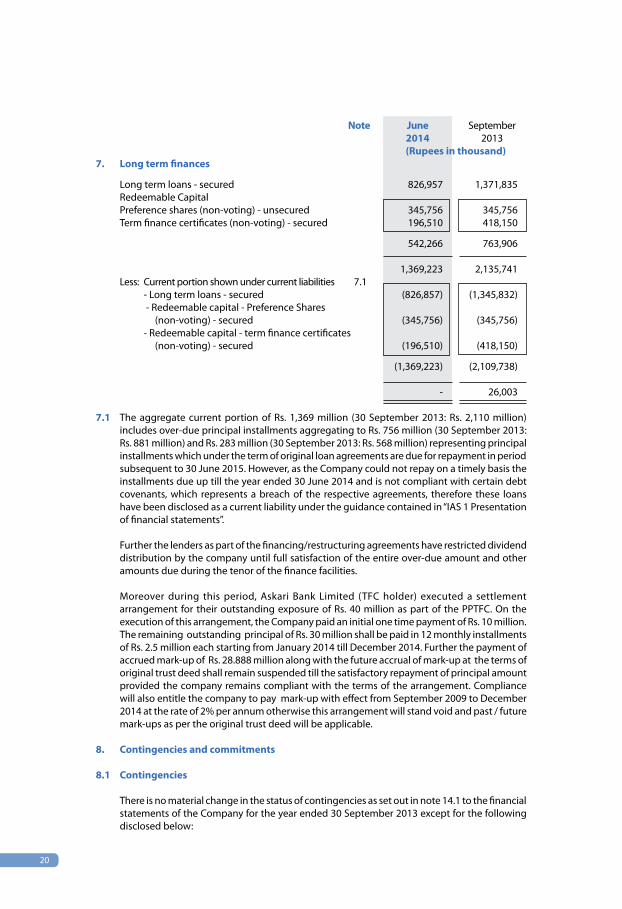
Note June September 2014 2013 (Rupees in thousand)7. Long term finances Long term loans - secured 826,957 1,371,835 Redeemable Capital Preference shares (non-voting) - unsecured 345,756 345,756 Term finance certificates (non-voting) - secured 196,510 418,150 542,266 763,906
1,369,223 2,135,741 Less: Current portion shown under current liabilities 7.1 - Long term loans - secured (826,857) (1,345,832) - Redeemable capital - Preference Shares (non-voting) - secured (345,756) (345,756) - Redeemable capital - term finance certificates (non-voting) - secured (196,510) (418,150) (1,369,223) (2,109,738)
- 26,003
7.1 The aggregate current portion of Rs. 1,369 million (30 September 2013: Rs. 2,110 million) includes over-due principal installments aggregating to Rs. 756 million (30 September 2013: Rs. 881 million) and Rs. 283 million (30 September 2013: Rs. 568 million) representing principal installments which under the term of original loan agreements are due for repayment in period subsequent to 30 June 2015. However, as the Company could not repay on a timely basis the installments due up till the year ended 30 June 2014 and is not compliant with certain debt covenants, which represents a breach of the respective agreements, therefore these loans have been disclosed as a current liability under the guidance contained in “IAS 1 Presentation of financial statements”.
Further the lenders as part of the financing/restructuring agreements have restricted dividend
distribution by the company until full satisfaction of the entire over-due amount and other amounts due during the tenor of the finance facilities.
Moreover during this period, Askari Bank Limited (TFC holder) executed a settlement
arrangement for their outstanding exposure of Rs. 40 million as part of the PPTFC. On the execution of this arrangement, the Company paid an initial one time payment of Rs. 10 million. The remaining outstanding principal of Rs. 30 million shall be paid in 12 monthly installments of Rs. 2.5 million each starting from January 2014 till December 2014. Further the payment of accrued mark-up of Rs. 28.888 million along with the future accrual of mark-up at the terms of original trust deed shall remain suspended till the satisfactory repayment of principal amount provided the company remains compliant with the terms of the arrangement. Compliance will also entitle the company to pay mark-up with effect from September 2009 to December 2014 at the rate of 2% per annum otherwise this arrangement will stand void and past / future mark-ups as per the original trust deed will be applicable.
8. Contingencies and commitments 8.1 Contingencies There is no material change in the status of contingencies as set out in note 14.1 to the financial
statements of the Company for the year ended 30 September 2013 except for the following disclosed below:
21
Interim Report2014
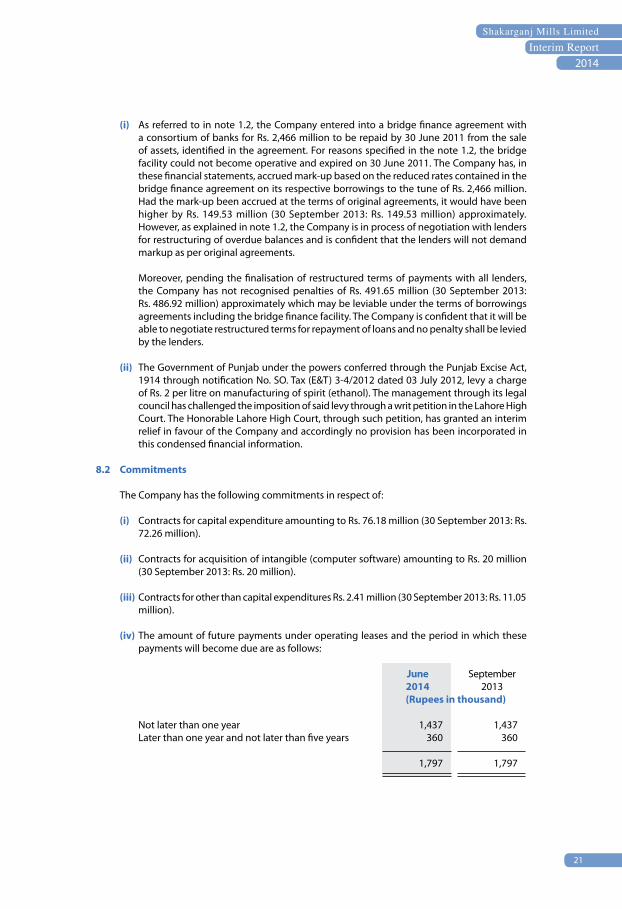
(i) As referred to in note 1.2, the Company entered into a bridge finance agreement with a consortium of banks for Rs. 2,466 million to be repaid by 30 June 2011 from the sale of assets, identified in the agreement. For reasons specified in the note 1.2, the bridge facility could not become operative and expired on 30 June 2011. The Company has, in these financial statements, accrued mark-up based on the reduced rates contained in the bridge finance agreement on its respective borrowings to the tune of Rs. 2,466 million. Had the mark-up been accrued at the terms of original agreements, it would have been higher by Rs. 149.53 million (30 September 2013: Rs. 149.53 million) approximately. However, as explained in note 1.2, the Company is in process of negotiation with lenders for restructuring of overdue balances and is confident that the lenders will not demand markup as per original agreements.
Moreover, pending the finalisation of restructured terms of payments with all lenders,
the Company has not recognised penalties of Rs. 491.65 million (30 September 2013: Rs. 486.92 million) approximately which may be leviable under the terms of borrowings agreements including the bridge finance facility. The Company is confident that it will be able to negotiate restructured terms for repayment of loans and no penalty shall be levied by the lenders.
(ii) The Government of Punjab under the powers conferred through the Punjab Excise Act,
1914 through notification No. SO. Tax (E&T) 3-4/2012 dated 03 July 2012, levy a charge of Rs. 2 per litre on manufacturing of spirit (ethanol). The management through its legal council has challenged the imposition of said levy through a writ petition in the Lahore High Court. The Honorable Lahore High Court, through such petition, has granted an interim relief in favour of the Company and accordingly no provision has been incorporated in this condensed financial information.
8.2 Commitments The Company has the following commitments in respect of: (i) Contracts for capital expenditure amounting to Rs. 76.18 million (30 September 2013: Rs.
72.26 million). (ii) Contracts for acquisition of intangible (computer software) amounting to Rs. 20 million
(30 September 2013: Rs. 20 million). (iii) Contracts for other than capital expenditures Rs. 2.41 million (30 September 2013: Rs. 11.05
million).
(iv) The amount of future payments under operating leases and the period in which these payments will become due are as follows:
June September 2014 2013 (Rupees in thousand) Not later than one year 1,437 1,437 Later than one year and not later than five years 360 360 1,797 1,797
22
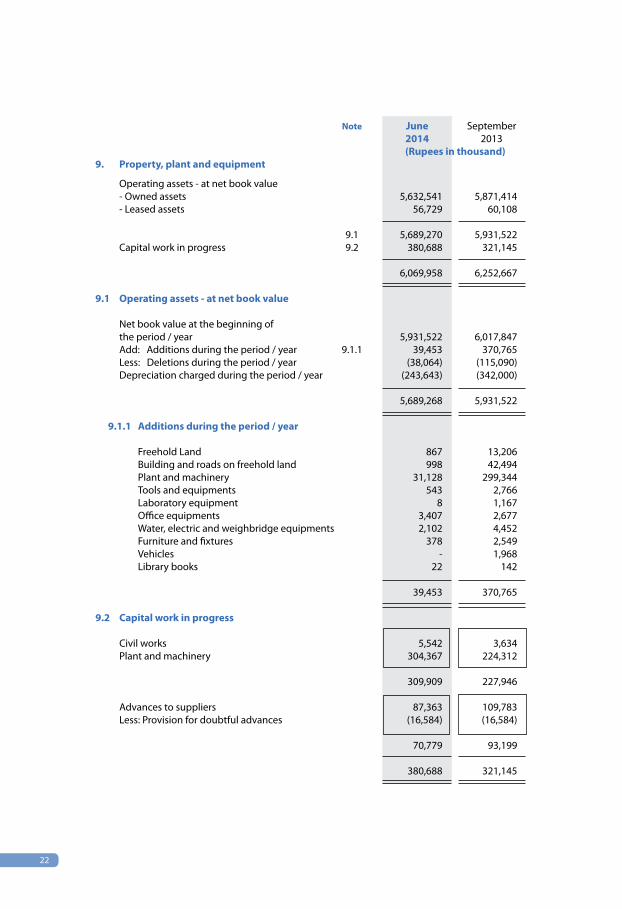
Note June September 2014 2013 (Rupees in thousand)9. Property, plant and equipment Operating assets - at net book value - Owned assets 5,632,541 5,871,414 - Leased assets 56,729 60,108
9.1 5,689,270 5,931,522 Capital work in progress 9.2 380,688 321,145
6,069,958 6,252,667 9.1 Operating assets - at net book value Net book value at the beginning of the period / year 5,931,522 6,017,847 Add: Additions during the period / year 9.1.1 39,453 370,765 Less: Deletions during the period / year (38,064) (115,090) Depreciation charged during the period / year (243,643) (342,000)
5,689,268 5,931,522 9.1.1 Additions during the period / year Freehold Land 867 13,206 Building and roads on freehold land 998 42,494 Plant and machinery 31,128 299,344 Tools and equipments 543 2,766 Laboratory equipment 8 1,167 Office equipments 3,407 2,677 Water, electric and weighbridge equipments 2,102 4,452 Furniture and fixtures 378 2,549 Vehicles - 1,968 Library books 22 142 39,453 370,765 9.2 Capital work in progress Civil works 5,542 3,634 Plant and machinery 304,367 224,312
309,909 227,946 Advances to suppliers 87,363 109,783 Less: Provision for doubtful advances (16,584) (16,584)
70,779 93,199
380,688 321,145
23
Interim Report2014
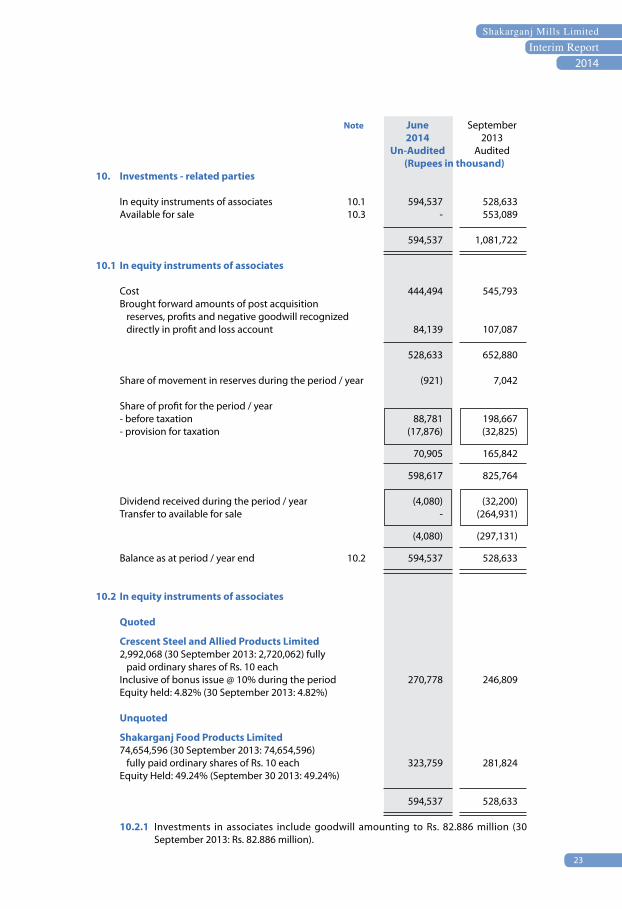
Note June September 2014 2013 Un-Audited Audited (Rupees in thousand)10. Investments - related parties In equity instruments of associates 10.1 594,537 528,633 Available for sale 10.3 - 553,089
594,537 1,081,722 10.1 In equity instruments of associates Cost 444,494 545,793 Brought forward amounts of post acquisition reserves, profits and negative goodwill recognized directly in profit and loss account 84,139 107,087
528,633 652,880 Share of movement in reserves during the period / year (921) 7,042 Share of profit for the period / year - before taxation 88,781 198,667 - provision for taxation (17,876) (32,825)
70,905 165,842
598,617 825,764 Dividend received during the period / year (4,080) (32,200) Transfer to available for sale - (264,931)
(4,080) (297,131)
Balance as at period / year end 10.2 594,537 528,633 10.2 In equity instruments of associates Quoted Crescent Steel and Allied Products Limited 2,992,068 (30 September 2013: 2,720,062) fully paid ordinary shares of Rs. 10 each Inclusive of bonus issue @ 10% during the period 270,778 246,809 Equity held: 4.82% (30 September 2013: 4.82%) Unquoted Shakarganj Food Products Limited 74,654,596 (30 September 2013: 74,654,596) fully paid ordinary shares of Rs. 10 each 323,759 281,824 Equity Held: 49.24% (September 30 2013: 49.24%) 594,537 528,633 10.2.1 Investments in associates include goodwill amounting to Rs. 82.886 million (30
September 2013: Rs. 82.886 million).
24
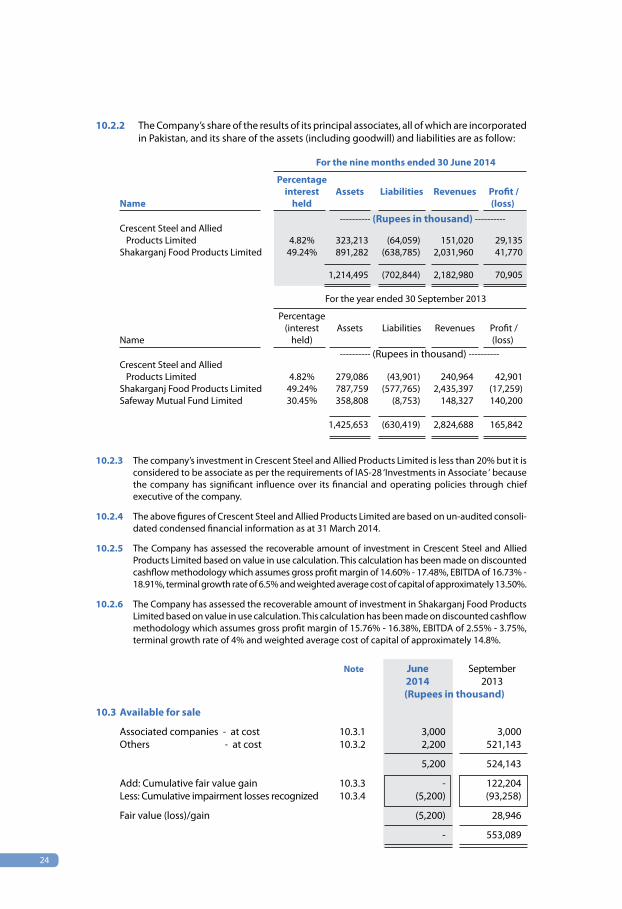
10.2.2 The Company’s share of the results of its principal associates, all of which are incorporated in Pakistan, and its share of the assets (including goodwill) and liabilities are as follow:
For the nine months ended 30 June 2014
Percentage interest Assets Liabilities Revenues Profit / Name held (loss) ---------- (Rupees in thousand) ---------- Crescent Steel and Allied Products Limited 4.82% 323,213 (64,059) 151,020 29,135 Shakarganj Food Products Limited 49.24% 891,282 (638,785) 2,031,960 41,770
1,214,495 (702,844) 2,182,980 70,905
For the year ended 30 September 2013
Percentage (interest Assets Liabilities Revenues Profit / Name held) (loss) ---------- (Rupees in thousand) ---------- Crescent Steel and Allied Products Limited 4.82% 279,086 (43,901) 240,964 42,901 Shakarganj Food Products Limited 49.24% 787,759 (577,765) 2,435,397 (17,259) Safeway Mutual Fund Limited 30.45% 358,808 (8,753) 148,327 140,200 1,425,653 (630,419) 2,824,688 165,842
10.2.3 The company’s investment in Crescent Steel and Allied Products Limited is less than 20% but it is considered to be associate as per the requirements of IAS-28 ‘Investments in Associate ‘ because the company has significant influence over its financial and operating policies through chief executive of the company.
10.2.4 The above figures of Crescent Steel and Allied Products Limited are based on un-audited consoli-
dated condensed financial information as at 31 March 2014. 10.2.5 The Company has assessed the recoverable amount of investment in Crescent Steel and Allied
Products Limited based on value in use calculation. This calculation has been made on discounted cashflow methodology which assumes gross profit margin of 14.60% - 17.48%, EBITDA of 16.73% - 18.91%, terminal growth rate of 6.5% and weighted average cost of capital of approximately 13.50%.
10.2.6 The Company has assessed the recoverable amount of investment in Shakarganj Food Products
Limited based on value in use calculation. This calculation has been made on discounted cashflow methodology which assumes gross profit margin of 15.76% - 16.38%, EBITDA of 2.55% - 3.75%, terminal growth rate of 4% and weighted average cost of capital of approximately 14.8%.
Note June September 2014 2013 (Rupees in thousand)
10.3 Available for sale
Associated companies - at cost 10.3.1 3,000 3,000 Others - at cost 10.3.2 2,200 521,143
5,200 524,143
Add: Cumulative fair value gain 10.3.3 - 122,204 Less: Cumulative impairment losses recognized 10.3.4 (5,200) (93,258)
Fair value (loss)/gain (5,200) 28,946
- 553,089
25
Interim Report2014
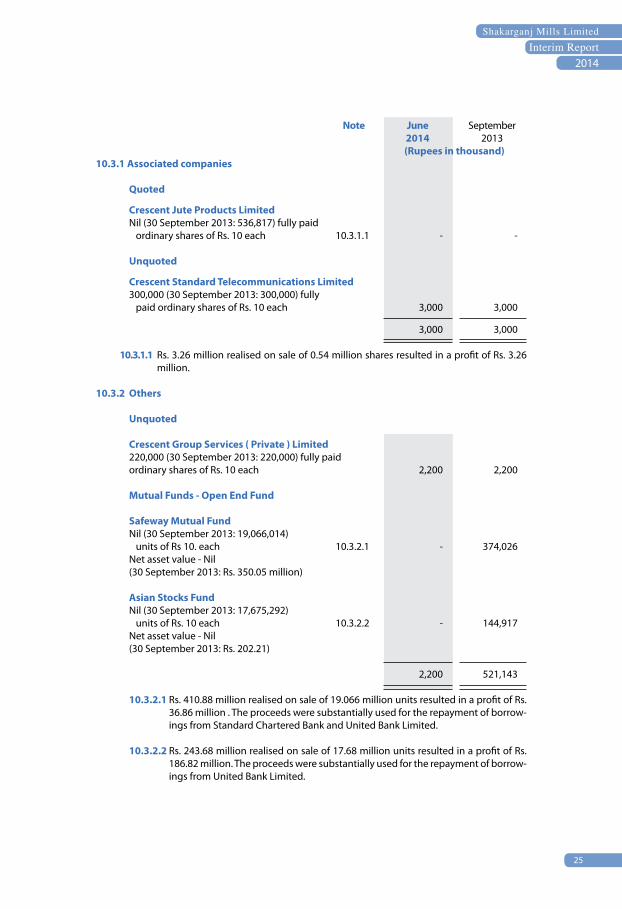
Note June September 2014 2013 (Rupees in thousand)10.3.1 Associated companies
Quoted
Crescent Jute Products Limited Nil (30 September 2013: 536,817) fully paid ordinary shares of Rs. 10 each 10.3.1.1 - - Unquoted Crescent Standard Telecommunications Limited 300,000 (30 September 2013: 300,000) fully paid ordinary shares of Rs. 10 each 3,000 3,000 3,000 3,000 10.3.1.1 Rs. 3.26 million realised on sale of 0.54 million shares resulted in a profit of Rs. 3.26
million. 10.3.2 Others
Unquoted Crescent Group Services ( Private ) Limited 220,000 (30 September 2013: 220,000) fully paid ordinary shares of Rs. 10 each 2,200 2,200 Mutual Funds - Open End Fund Safeway Mutual Fund Nil (30 September 2013: 19,066,014) units of Rs 10. each 10.3.2.1 - 374,026 Net asset value - Nil (30 September 2013: Rs. 350.05 million) Asian Stocks Fund Nil (30 September 2013: 17,675,292) units of Rs. 10 each 10.3.2.2 - 144,917 Net asset value - Nil (30 September 2013: Rs. 202.21) 2,200 521,143 10.3.2.1 Rs. 410.88 million realised on sale of 19.066 million units resulted in a profit of Rs.
36.86 million . The proceeds were substantially used for the repayment of borrow-ings from Standard Chartered Bank and United Bank Limited.
10.3.2.2 Rs. 243.68 million realised on sale of 17.68 million units resulted in a profit of Rs.
186.82 million. The proceeds were substantially used for the repayment of borrow-ings from United Bank Limited.

26
June September 2014 2013 (Rupees in thousand)10.3.3 Cumulative fair value gain As at 1 October 122,204 41,155 Disposal of shares/units (122,204) - Fair value gain during the period / year - 81,049
As at period / year end - 122,204 10.3.4 Cumulative impairment losses recognized As at 1 October 93,258 93,258 Recognized during the period / year - - Transfer to Profit and loss account on derecognition of units (88,058) - As at period / year end 5,200 93,258 10.4 Investments with face value of Rs. 594.25 million (30 September 2013: Rs. 922.49 million) and
market value of Rs. 656.91 million (30 September 2013: Rs. 1,157.94 million) are pledged as security against long term running finances and short term borrowings.
Note June September 2014 2013 (Rupees in thousand)11. Investments Available for sale - cost 11.1 125,307 125,307 Add: Cumulative fair value gain 11.2 144,351 123,300 269,658 248,607 11.1 Available for sale - at cost Altern Energy Limited - Quoted 12,530,582 (30 September 2013: Rs. 12,530,582) fully paid ordinary shares of Rs. 10 each 125,307 125,307 Innovative Investment Bank Limited - Unquoted 51,351 (30 September 2013: Rs. 51,351) fully paid ordinary shares of Rs. 10 each - - 125,307 125,307 11.2 Cumulative fair value gain As at 1 October 123,300 (6,266) Fair value gain during period / year 21,051 129,566
As at period / year end 144,351 123,300 11.3 Investments with face value of Rs. 124.66 million (30 September 2013: Rs. 124.66 million)
and market value of Rs. 268.27 million (30 September 2013: Rs. 247.33 million) are pledged as security against long term running finances and short term borrowings.
27
Interim Report2014
Sug
ar
B
io F
uel
Bio
Pow
er
Bu
ildin
g m
ater
ials
Sub
-tot
al c
arri
ed fo
rwar
d
Qua
rter
end
ed
N
ine
mon
ths
ende
d
Qua
rter
end
ed
Nin
e m
onth
s en
ded
Q
uart
er e
nded
N
ine
mon
ths
ende
d
Q
uart
er e
nded
N
ine
mon
ths
ende
d
Q
uart
er e
nded
N
ine
mon
ths
nded
30
June
30
June
30
June
30
June
30
June
30
June
30
June
30
June
30
June
30
June
30
June
30
June
30
June
30
June
30
June
30
June
30
June
30
June
30
June
30
June
20
14
2013
20
14
2013
20
14
2013
20
14
2013
20
14
2013
20
14
2013
20
14
2013
20
14
2013
20
14
2013
20
14
2013
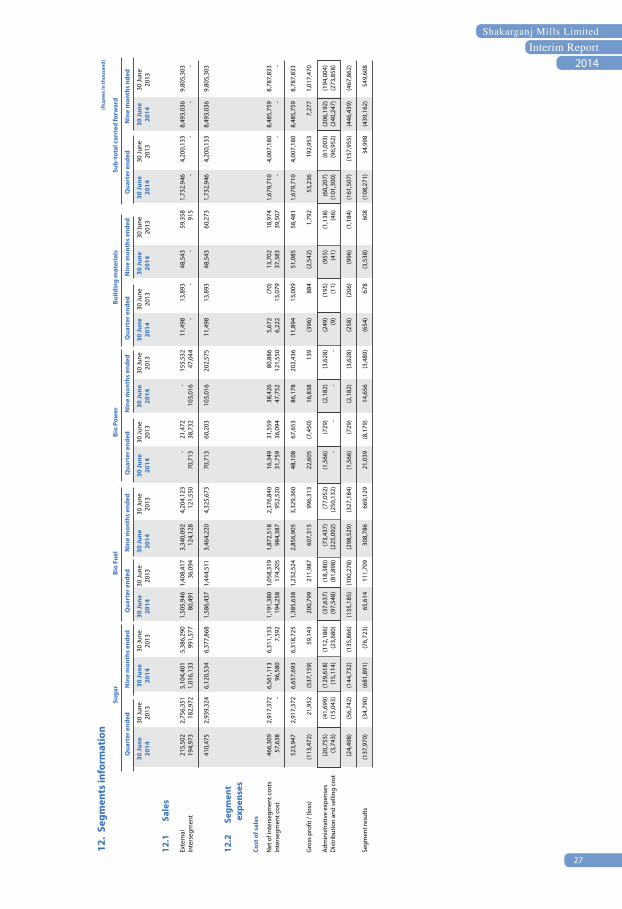
12.1
S
ales
Exte
rnal
2
15,5
02
2,7
56,3
51
5,1
04,4
01
5,3
86,2
90
1,5
05,9
46
1,40
8,41
7
3,3
40,0
92
4,2
04,1
23
-
21,
472
-
1
55,5
32
11,
498
1
3,89
3
48,
543
5
9,35
8
1,7
32,9
46
4,2
00,1
33
8,4
93,0
36
9,8
05,3
03
Inte
rseg
men
t 1
94,9
73
182
,972
1
,016
,133
9
91,5
77
80,
491
3
6,09
4
124
,128
1
21,5
50
70,
713
3
8,73
2
103
,016
4
7,04
4
-
-
-
915
-
-
-
-
4
10,4
75
2,9
39,3
24
6,1
20,5
34
6,3
77,8
68
1,5
86,4
37
1,44
4,51
1
3,4
64,2
20
4,3
25,6
73
70,
713
6
0,20
3
103
,016
2
02,5
75
11,
498
1
3,89
3
48,
543
6
0,27
3
1,7
32,9
46
4,2
00,1
33
8,4
93,0
36
9,8
05,3
03
12.2
S
egm
ent
exp
ense
s
Cost
of s
ales
Net
of i
nter
segm
ent c
osts
4
66,3
09
2,9
17,3
72
6,5
61,1
13
6,3
11,1
33
1,1
91,3
80
1,05
8,31
9
1,8
72,5
18
2,3
76,8
40
16,
349
3
1,55
9
38,
426
8
0,88
6
5,6
72
(70)
1
3,70
2
18,
974
1
,679
,710
4
,007
,180
8
,485
,759
8
,787
,833
In
ters
egm
ent c
ost
57,
638
-
9
6,58
0
7,5
92
194
,258
1
74,2
05
984
,387
9
52,5
20
31,
759
3
6,09
4
47,
752
1
21,5
50
6,2
22
13,
079
3
7,38
3
39,
507
-
-
-
-
5
23,9
47
2,9
17,3
72
6,6
57,6
93
6,3
18,7
25
1,3
85,6
38
1,23
2,52
4
2,8
56,9
05
3,3
29,3
60
48,
108
6
7,65
3
86,
178
2
02,4
36
11,
894
1
3,00
9
51,
085
5
8,48
1
1,6
79,7
10
4,0
07,1
80
8,4
85,7
59
8,7
87,8
33
Gro
ss p
rofit
/ (lo
ss)
(113
,472
) 2
1,95
2
(537
,159
) 5
9,14
3
200
,799
2
11,9
87
607
,315
9
96,3
13
22,
605
(7
,450
) 1
6,83
8
139
(3
96)
884
(2
,542
) 1
,792
5
3,23
6
192
,953
7
,277
1
,017
,470
Ad
min
istr
ativ
e ex
pens
es
(20,
755)
(4
1,69
9)
(129
,618
) (1
12,1
86)
(37,
637)
(1
8,38
0)
(73,
437)
(7
7,05
2)
(1,5
66)
(729
) (2
,182
) (3
,628
) (2
49)
(195
) (9
55)
(1,1
38)
(60,
207)
(6
1,00
3)
(206
,192
) (1
94,0
04)
Dis
trib
utio
n an
d se
lling
cos
t (3
,743
) (1
5,04
3)
(15,
114)
(2
3,68
0)
(97,
548)
(8
1,89
8)
(225
,092
) (2
50,1
32)
-
-
-
-
(9)
(11)
(4
1)
(46)
(1
01,3
00)
(96,
952)
(2
40,2
47)
(273
,858
)
(2
4,49
8)
(56,
742)
(1
44,7
32)
(135
,866
) (1
35,1
85)
(100
,278
) (2
98,5
29)
(327
,184
) (1
,566
) (7
29)
(2,1
82)
(3,6
28)
(258
) (2
06)
(996
) (1
,184
) (1
61,5
07)
(157
,955
) (4
46,4
39)
(467
,862
)
Se
gmen
t res
ults
(1
37,9
70)
(34,
790)
(6
81,8
91)
(76,
723)
6
5,61
4
111
,709
3
08,7
86
669
,129
2
1,03
9
(8,1
79)
14,
656
(3
,489
) (6
54)
678
(3
,538
) 6
08
(108
,271
) 3
4,99
8
(439
,162
) 5
49,6
08
12.
Segm
ents
info
rmat
ion
(Rup
ees
in th
ousa
nd)

28
S
ub-t
otal
bro
ught
forw
ard
Text
ile
Fa
rms
Oth
ers
Tota
l
Qua
rter
end
ed
N
ine
mon
ths
ende
d
Qua
rter
end
ed
Nin
e m
onth
s en
ded
Q
uart
er e
nded
N
ine
mon
ths
ende
d
Q
uart
er e
nded
N
ine
mon
ths
ende
d
Q
uart
er e
nded
N
ine
mon
ths
nded
30
June
30
June
30
June
30
June
30
June
30
June
30
June
30
June
30
June
30
June
30
June
30
June
30
June
30
June
30
June
30
June
30
June
30
June
30
June
30
June
20
14
2013
20
14
2013
20
14
2013
20
14
2013
20
14
2013
20
14
2013
20
14
2013
20
14
2013
20
14
2013
20
14
2013
12.1
S
ales
Exte
rnal
1
,732
,946
4
,200
,133
8
,493
,036
9
,805
,303
3
84,7
99
479
,798
1
,159
,722
1
,406
,795
1
1,60
8
12,
186
2
5,82
2
23,
837
1
7,13
5
22,
144
2
9,21
4
38,
177
2
,146
,489
4
,714
,261
9
,707
,795
1
1,27
4,11
2 In
ters
egm
ent
-
-
-
-
-
-
-
-
-
-
13,
446
1
2,23
2
-
-
-
-
-
-
-
-
1
,732
,946
4
,200
,133
8
,493
,036
9
,805
,303
3
84,7
99
479
,798
1
,159
,722
1
,406
,795
1
1,60
8
12,
186
3
9,26
8
36,
069
1
7,13
5
22,
144
2
9,21
4
38,
177
2
,146
,489
4
,714
,261
9
,707
,795
1
1,27
4,11
2
12.2
Se
gmen
t
ex
pens
es
Co
st o
f sal
es
N
et o
f int
erse
gmen
t cos
ts
1,6
79,7
10
4,0
07,1
80
8,4
85,7
59
8,7
87,8
33
344
,059
4
26,5
65
1,0
88,2
98
1,2
99,0
65
12,
682
1
2,12
1
39,
802
3
4,76
3
8,3
57
12,
959
1
6,30
0
24,
072
2
,044
,808
4
,458
,826
9
,630
,159
1
0,14
5,73
4 In
ters
egm
ent c
ost
-
-
-
-
55,
996
3
4,82
5
87,
753
4
6,41
2
-
-
2,2
44
5,4
82
304
-
6
24
256
-
-
-
-
1
,679
,710
4
,007
,180
8
,485
,759
8
,787
,833
4
00,0
55
461
,390
1
,176
,051
1
,345
,477
1
2,68
2
12,
121
4
2,04
6
40,
245
8
,661
1
2,95
9
16,
924
2
4,32
8
2,0
44,8
08
4,4
58,8
26
9,6
30,1
59
10,
145,
734
Gro
ss p
rofit
/(lo
ss)
53,
236
1
92,9
53
7,2
77
1,0
17,4
70
(15,
256)
1
8,40
8
(16,
329)
6
1,31
8
(1,0
74)
64
(2
,778
) (4
,176
) 8
,474
9
,185
1
2,29
0
13,
849
1
01,6
81
255
,435
7
7,63
6
1,1
28,3
78
Adm
inis
trat
ive
expe
nses
(6
0,20
7)
(61,
003)
(2
06,1
92)
(194
,004
) (8
,047
) (7
,969
) (2
2,28
2)
(22,
426)
(8
61)
(708
) (2
,319
) (1
,862
) (3
88)
(349
) (6
19)
(675
) (6
9,50
2)
(70,
030)
(2
31,4
11)
(218
,968
)D
istr
ibut
ion
and
selli
ng c
ost
(101
,300
) (9
6,95
2)
(240
,247
) (2
73,8
58)
(537
) (4
90)
(1,2
42)
(1,5
31)
-
-
-
-
-
-
-
-
(101
,838
) (9
7,44
2)
(241
,490
) (2
75,3
89)
(1
61,5
07)
(157
,955
) (4
46,4
39)
(467
,862
) (8
,584
) (8
,459
) (2
3,52
4)
(23,
957)
(8
61)
(708
) (2
,319
) (1
,862
) (3
88)
(349
) (6
19)
(675
) (1
71,3
40)
(167
,472
) (4
72,9
01)
(494
,357
)
Se
gmen
t res
ults
(1
08,2
71)
34,
998
(4
39,1
62)
549
,608
(2
3,84
0)
9,9
49
(39,
853)
3
7,36
1
(1,9
35)
(644
) (5
,097
) (6
,039
) 8
,086
8
,836
1
1,67
1
13,
174
(6
9,65
9)
87,
963
(3
95,2
65)
634
,021
O
ther
ope
ratin
g ex
pens
es
(3,6
69)
(15,
521)
(3
2,43
8)
(61,
590)
Fina
nce
cost
s
(8
1,96
9)
(111
,986
) (2
49,2
56)
(345
,108
)O
ther
ope
ratin
g in
com
e
3
1,01
4
42,
772
3
25,4
52
149
,758
Sh
are
of in
com
e of
ass
ocia
tes
41,
133
3
1,96
6
88,
781
1
55,7
07
Taxa
tion
(38,
522)
(3
9,43
5)
(124
,296
) (1
04,4
02)
Profi
t / (l
oss)
for
the
perio
d
(121
,672
) (4
,241
) (3
87,0
22)
428
,386
12.
Segm
ents
info
rmat
ion
(Rup
ees
in th
ousa
nd)
29
Interim Report2014
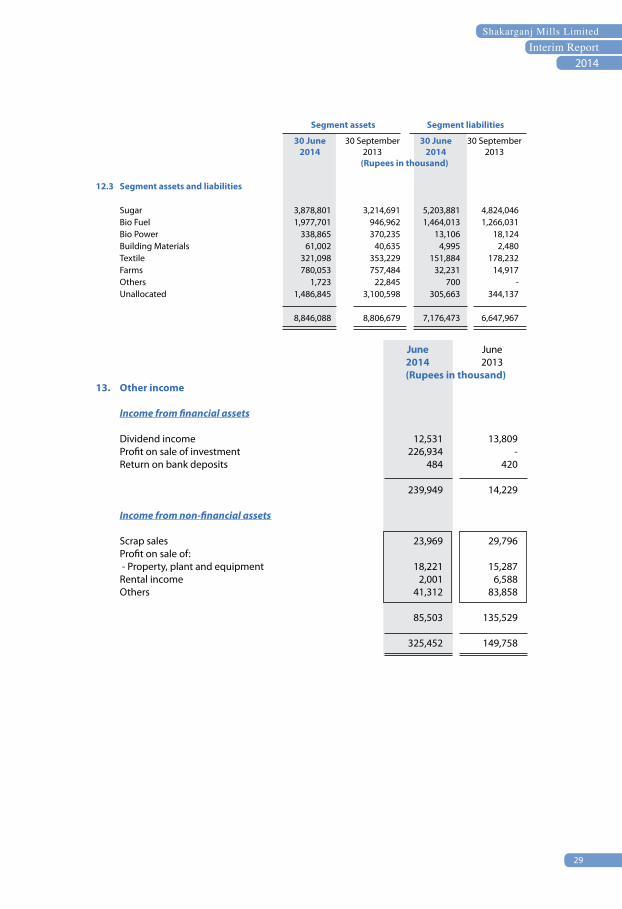
Segment assets Segment liabilities
30 June 30 September 30 June 30 September 2014 2013 2014 2013 (Rupees in thousand)
12.3 Segment assets and liabilities Sugar 3,878,801 3,214,691 5,203,881 4,824,046 Bio Fuel 1,977,701 946,962 1,464,013 1,266,031 Bio Power 338,865 370,235 13,106 18,124 Building Materials 61,002 40,635 4,995 2,480 Textile 321,098 353,229 151,884 178,232 Farms 780,053 757,484 32,231 14,917 Others 1,723 22,845 700 - Unallocated 1,486,845 3,100,598 305,663 344,137
8,846,088 8,806,679 7,176,473 6,647,967
June June 2014 2013 (Rupees in thousand)13. Other income Income from financial assets Dividend income 12,531 13,809 Profit on sale of investment 226,934 - Return on bank deposits 484 420 239,949 14,229
Income from non-financial assets Scrap sales 23,969 29,796 Profit on sale of: - Property, plant and equipment 18,221 15,287 Rental income 2,001 6,588 Others 41,312 83,858
85,503 135,529 325,452 149,758
30
Quarter ended Nine months ended
30 June 30 June 30 June 30 June 2014 2013 2014 2013
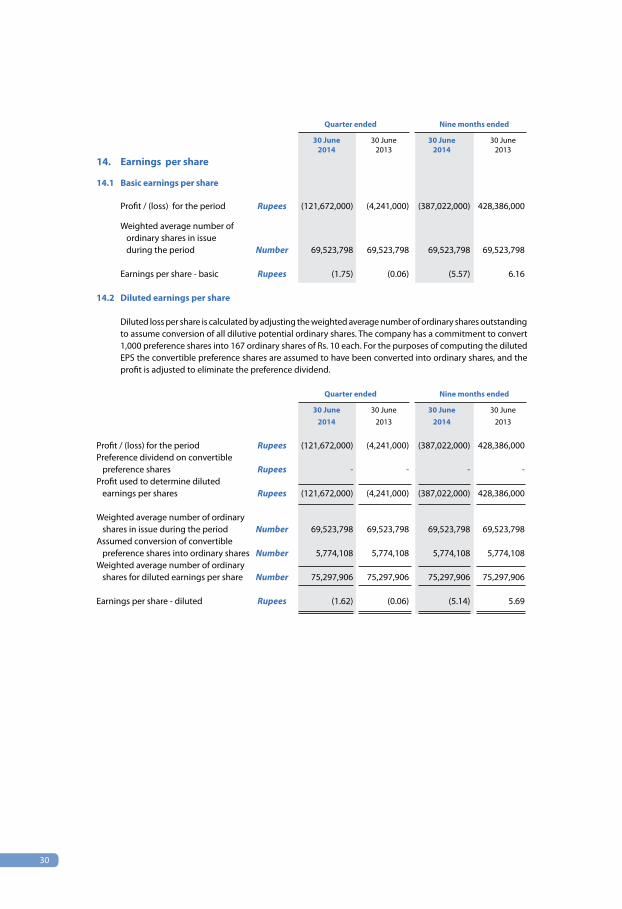
14. Earnings per share 14.1 Basic earnings per share
Profit / (loss) for the period Rupees (121,672,000) (4,241,000) (387,022,000) 428,386,000 Weighted average number of ordinary shares in issue during the period Number 69,523,798 69,523,798 69,523,798 69,523,798 Earnings per share - basic Rupees (1.75) (0.06) (5.57) 6.16
14.2 Diluted earnings per share Diluted loss per share is calculated by adjusting the weighted average number of ordinary shares outstanding
to assume conversion of all dilutive potential ordinary shares. The company has a commitment to convert 1,000 preference shares into 167 ordinary shares of Rs. 10 each. For the purposes of computing the diluted EPS the convertible preference shares are assumed to have been converted into ordinary shares, and the profit is adjusted to eliminate the preference dividend.
Quarter ended Nine months ended
30 June 30 June 30 June 30 June 2014 2013 2014 2013 Profit / (loss) for the period Rupees (121,672,000) (4,241,000) (387,022,000) 428,386,000 Preference dividend on convertible preference shares Rupees - - - - Profit used to determine diluted earnings per shares Rupees (121,672,000) (4,241,000) (387,022,000) 428,386,000 Weighted average number of ordinary shares in issue during the period Number 69,523,798 69,523,798 69,523,798 69,523,798 Assumed conversion of convertible preference shares into ordinary shares Number 5,774,108 5,774,108 5,774,108 5,774,108 Weighted average number of ordinary shares for diluted earnings per share Number 75,297,906 75,297,906 75,297,906 75,297,906 Earnings per share - diluted Rupees (1.62) (0.06) (5.14) 5.69

31
Interim Report2014
Nine months ended June June 2014 2013 (Rupees in thousand)
15. Cash generated from operating activities (Loss) / profit before taxation (262,726) 532,788 Adjustments for: Depreciation on operating assets 243,643 260,123 Amortization of intangible assets 45 30 Loss on sale of property, plant and equipment (18,221) (15,362) Dividend income (12,531) (13,808) Share of profit from associates (88,781) (155,707) Return on bank deposits - (420) Fair value gain on livestock (444) (214) Profit on sale of Investment (226,935) - Provision for WPPF - 21,577 Provision for employee benefits 10,835 9,087 Finance cost 249,256 345,108 Effect of revaluation on agricultural assets - (6,287) Markup waived off (4,400) (46,980)
152,467 397,147 (Loss) / profit before working capital changes (110,259) 929,935 (Increase)/ decrease in current assets: Stock-in-trade (588,798) (297,801) Trade debts (129,022) (111,026) Stores and spares (1,915) (6,612) Other receivables (68,348) (57,935) Biological assets 10,290 19,914 Increase in current liabilities: Trade and other payables 991,666 1,184,248 213,873 730,788 Cash (used in) / generated from operations 103,614 1,660,723

32
Chief Executive Chairman
16. Transactions with related parties The related parties comprise associated undertakings, post employment benefit plans, other related
companies, and key management personnel. The company in the normal course of business carries out transactions with various related parties. Transactions with related parties (other than disclosed elsewhere in this interim financial information) are as follows:
Nine months ended Relationship with Nature of June June the company transactions 2014 2013 (Rupees in thousand) i. Associated / Related Undertakings Crescent Steel & Allied Purchase of goods 3,572 38,584 Products Limited Sale of goods 1,655 150 Rendering services - 38 Common expenses 5,887 1,795 Sale of land 36,250 - Dividend income 4,080 5,440 Shakarganj Food Sale of goods 4,864 14,062 Products Limited Salary expense and other Common expenses 1,050 1,357 Premier Insurance Limited Insurance expenses 4,206 3,918 ii. Post employment Expense charged in respect of benefit plans retirement benefit plans 10,186 12,815 iii. Key Management Personnel Salaries and other employee benefits 78,902 59,681 16.1 All transactions with related parties have been carried out on bilaterally agreed terms. 17. Date of authorisation for issue This condensed interim financial information was authorised for issue on 24 July 2014 by the
Board of Directors of the Company. 18, General Corresponding figures have been re-arranged and re-classified, wherever necessary, for the
purposes of comparison and better presentation as per reporting framework.