Embed Size (px)
Citation preview
Productivity Commission Interim Report
National Agreement for Skills and Workforce Development Review
This interim report has been prepared for further public consultation and input.The Commission will finalise its report after these processes have taken place.
May 2020

Commonwealth of Australia 2020
Except for the Commonwealth Coat of Arms and content supplied by third parties, this copyright work is
licensed under a Creative Commons Attribution 3.0 Australia licence. To view a copy of this licence, visit
http://creativecommons.org/licenses/by/3.0/au. In essence, you are free to copy, communicate and adapt the
work, as long as you attribute the work to the Productivity Commission (but not in any way that suggests the
Commission endorses you or your use) and abide by the other licence terms.
Use of the Commonwealth Coat of Arms
Terms of use for the Coat of Arms are available from the Department of the Prime Minister and Cabinet’s website:
https://www.pmc.gov.au/government/commonwealth-coat-arms
Third party copyright
Wherever a third party holds copyright in this material, the copyright remains with that party. Their permission
may be required to use the material, please contact them directly.
Attribution
This work should be attributed as follows, Source: Productivity Commission, National Agreement for Skills
and Workforce Development Review, Interim Report.
If you have adapted, modified or transformed this work in anyway, please use the following, Source: based on
Productivity Commission data, National Agreement for Skills and Workforce Development Review, Interim Report.
An appropriate reference for this publication is:
Productivity Commission 2020, National Agreement for Skills and Workforce Development Review, Interim
Report, Canberra.
Publications enquiries
Media, Publications and Web, phone: (03) 9653 2244 or email: [email protected]
The Productivity Commission
The Productivity Commission is the Australian Government’s independent research and advisory
body on a range of economic, social and environmental issues affecting the welfare of Australians.
Its role, expressed most simply, is to help governments make better policies, in the long term
interest of the Australian community.
The Commission’s independence is underpinned by an Act of Parliament. Its processes and
outputs are open to public scrutiny and are driven by concern for the wellbeing of the community
as a whole.
Further information on the Productivity Commission can be obtained from the Commission’s
website (www.pc.gov.au).

OPPORTUNITY FOR FURTHER COMMENT iii
Opportunity for further comment
You are invited to examine this review and comment on it by written submission to the
Productivity Commission, preferably in electronic format, by 17 July 2020.
Further information on how to provide a submission is included on the study website:
https://www.pc.gov.au/inquiries/current/skills-workforce-agreement.
The Commission will prepare the final report after further submissions have been received
and it will hold further discussions with stakeholders. The Commission is to provide the final
report to the Government in November 2020.
Commissioners
For the purposes of this study the Commissioners are:
Jonathan Coppel
Malcolm Roberts
iv NASWD REVIEW
Terms of reference
I, the Hon Josh Frydenberg MP, Treasurer, pursuant to Parts 2 and 4 of the of the Productivity
Commission Act 1998, hereby request that the Productivity Commission undertake a review
of the National Agreement for Skills and Workforce Development (NASWD).
Background
The NASWD is a high-level agreement that identifies the ‘long term objectives of the
Commonwealth and State and Territory Governments in the areas of skills and workforce
development, and recognises the interest of all governments in ensuring the skills of the
Australian people are developed and utilised in the economy’. Parties to the NASWD have
agreed to ‘the need for reform of the national training system to ensure it delivers the high
quality, responsive, equitable and efficient training and training outcomes needed’.
The NASWD’s objectives are to ensure the vocational education and training (VET) system
delivers a productive and highly skilled workforce; enables all working age Australians to develop
the skills and qualifications needed to participate effectively in the labour market and contribute to
Australia’s economic future; and supports increased rates of workforce participation.
Scope
In the context of the VET system, the review will consider:
1. achievement of the objectives, outcomes, performance indicators, targets, reform
directions and roles and responsibilities set out in the NASWD and their ongoing suitability
2. options for governments to coordinate and streamline their support for vocational
education in the future
3. options for nationally consistent government funding and pricing arrangements that
maximise efficiency, transparency and the supply of trained workers for the economy
and promote consistency of incentives
4. options to promote consistency in funding and loan arrangements between the VET and
higher education sectors, and on any cross sector impacts that there might be
5. options to ensure government investment in VET encourages increased participation in
training by all Australians and is commensurate with the outcomes and benefits derived by
individuals, business, industry, the local and national economy and society more generally
6. potential for future funding arrangements to achieve further targeted reforms, including
extending Language, Literacy, Numeracy and Digital Literacy (LLND) programs to all
TERMS OF REFERENCE v
Australians and other relevant recommendations from the Expert Review of Australia’s
Vocational Educational and Training System (the Joyce review)
7. options for improved performance indicators, data and information sharing arrangements
to enable all governments to assess the effectiveness of VET investment and delivery.
In undertaking this review, the Commission should have regard to current and potential
funding arrangements, existing skills programs and contemporary policy settings and labour
market needs, noting:
A. the VET and higher education sectors are closely linked with cross system impacts
seen through funding arrangements, pathway policies and the skills continuum
B. responsibility for funding and financing of VET is shared between the Australian
Government, state and territory governments, employers and individuals. The
Australian government provides funding to the sector through its own programs such
as the Australian Apprenticeship Incentives Program, the Skills for Education and
Employment program and additional financial support to students through VET
Student Loans and Trade Support Loans
C. the differences in local labour market conditions and economies, and the need to
deliver opportunities and outcomes for all Australians regardless of geographic,
social or personal circumstances
D. the National Skills and Workforce Development Specific Purpose Payment (SPP),
made under the Intergovernmental Agreement on Federal Financial Relations. These
payments are made independently of the NASWD and are not tied to the achievement
of outcomes. The only requirement is that the money is spent on skills and workforce
development
E. the Skilling Australians Fund, currently managed through a National Partnership
Agreement with signatory state and territory governments, aimed at supporting
apprenticeships, traineeships and employment related training
F. the Joyce Review, commissioned by the Australian Government, recommendations
in relation to skills programs and VET funding. For example, the report
recommended that the Australian Government and state territory governments agree
to a new national agreement where the parties co-fund subsidised qualifications
based on nationally consistent subsidy levels
G. the August 2019 COAG agreement for a shared vision for VET that delivers high
quality education and training that helps all Australians, and meets the needs of
students and employers and any further decisions taken by COAG and Skills Council
during the review
H. the new measures in the $525 million Skills Package ‘Delivering Skills for Today
and Tomorrow’ announced as part of the 2019-20 Budget.
vi NASWD REVIEW
Process
The Productivity Commission is to consult broadly including with state and territory
governments, provide and interim report in March 2020 that has particular regard to points
two, three and five above, and final report within 12 months of receipt of the terms of reference.
The Hon Josh Frydenberg MP
Treasurer
[Received 15 November 2019]
CONTENTS vii
Contents
Opportunity for further comment iii
Terms of reference iv
Abbreviations ix
Overview 1
Interim findings, reform directions and information requests 35
1 About this review 49
1.1 The Commission’s task 50
1.2 Context for this review 51
1.3 The VET system in Australia 57
1.4 The Commission’s approach to the interim report 67
2 Progress against the NASWD 69
2.1 Key provisions of the NASWD 70
2.2 Progress against the NASWD’s performance framework 73
2.3 Progress on reform directions 81
2.4 Where to for a new agreement? 102
3 Why governments invest in VET 111
3.1 Rationales for a government role in VET 112
3.2 The concept of skill shortages 114
3.3 Public and private benefits 118
3.4 Consistency with the higher education system 123
4 Mechanics of VET course funding 129
4.1 The approach to subsidising VET courses 130
4.2 Determining which courses to subsidise 131
4.3 How VET course subsidies are set 134
4.4 How jurisdictions manage VET course subsidies 148
viii NASWD REVIEW
4.5 Conclusions 153
5 Impacts of subsidies 155
5.1 The impacts of course subsidies 155
5.2 Incentives for trade apprentices and trainees — ‘chalk and
cheese’ 160
5.3 Student supports that complement subsidies 165
6 Policy options for investment in VET 169
6.1 The design of course subsidies 171
6.2 An increased role for loans? 177
6.3 Government supports for trade apprenticeships 186
6.4 Student supports 190
6.5 Investment in public provision 191
6.6 Information is lacking or opaque 193
6.7 The challenge posed by online delivery 193
7 Coordination and streamlining of VET supports 195
7.1 Progress against the NASWD 196
7.2 Support services for apprenticeships 198
7.3 Streamlining training package developments 211
7.4 Multiple regulators 216
7.5 Information for VET students (and employers) 218
Appendixes
A Conduct of the review 225
B The NASWD 231
C Operation of the VET system 241
D Government funding of VET 259
E Higher education policy settings 287
References 299
ABBREVIATIONS ix
Abbreviations
ACSF Australian Core Skills Framework
AQF Australian Qualifications Framework
ASQA Australian Skills Quality Authority
ATSI Aboriginal and Torres Strait Islander
COAG Council of Australian Governments
EFTSL Equivalent Full Time Student Load
FCL Funded Course List
FYTEs Full Year Training Equivalents
GTOs Group Training Organisations
ICLs Income Contingent Loans
IGAFFR Intergovernmental Agreement on Federal Financial Relations
IRCs Industry Reference Committees
NASWD National Agreement on Skills and Workforce Development
NCI National Careers Institute
NCVER National Centre for Vocational Education Research
NSC National Skills Commission
NSNL National Skills Needs List
OECD Organisation for Economic Co-operation and Development
QILT Quality Indicators for Learning and Teaching
RFM Relative Funding Model
RPL Recognition of Prior Learning
RTO Registered Training Organisation
SOs Skills Organisations
SPOL State Priority Occupation List (WA)
SPP Specific Purpose Payment
SSON Skills Senior Officials Network

x NASWD REVIEW
SSOs Skill Service Organisations
STA State Training Authority
TAFE institute Technical and Further Education institute
TEQSA Tertiary Education Quality and Standards Agency
VET Vocational education and training
VFH VET FEE-HELP
VSL VET Student Loans

OVERVIEW
Overview
2 NASWD REVIEW
Key points
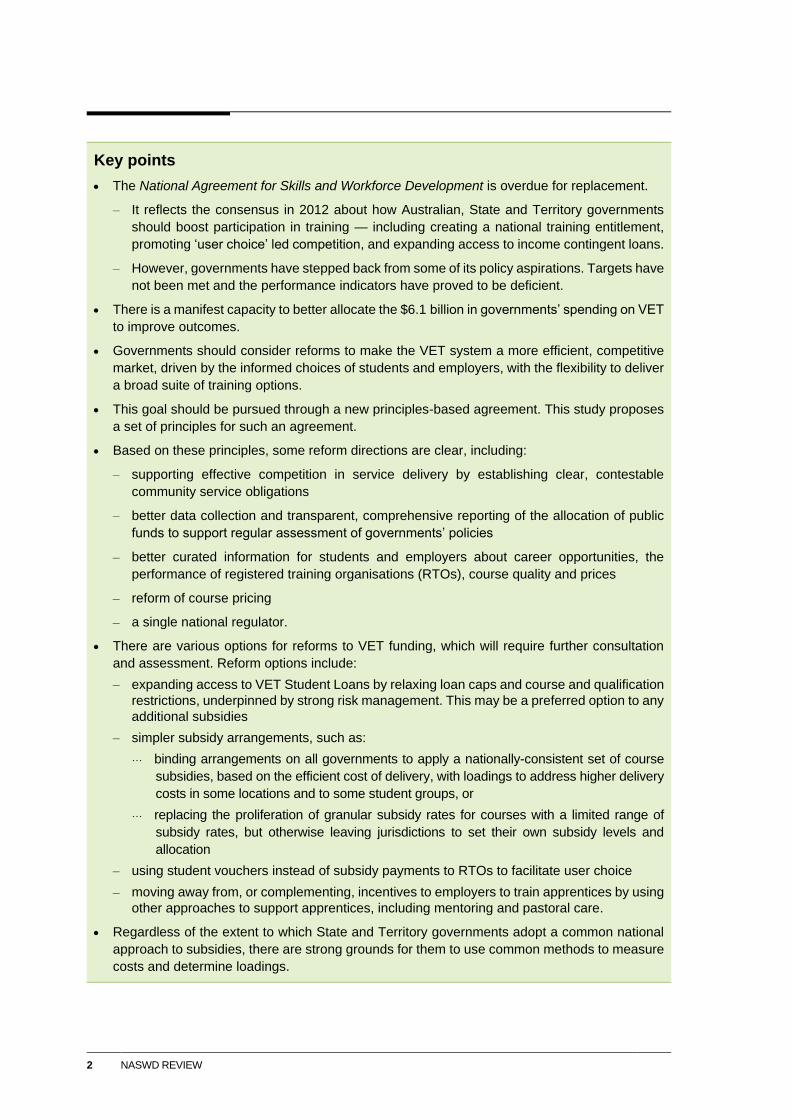
The National Agreement for Skills and Workforce Development is overdue for replacement.
– It reflects the consensus in 2012 about how Australian, State and Territory governments
should boost participation in training — including creating a national training entitlement,
promoting ‘user choice’ led competition, and expanding access to income contingent loans.
– However, governments have stepped back from some of its policy aspirations. Targets have
not been met and the performance indicators have proved to be deficient.
There is a manifest capacity to better allocate the $6.1 billion in governments’ spending on VET
to improve outcomes.
Governments should consider reforms to make the VET system a more efficient, competitive
market, driven by the informed choices of students and employers, with the flexibility to deliver
a broad suite of training options.
This goal should be pursued through a new principles-based agreement. This study proposes
a set of principles for such an agreement.
Based on these principles, some reform directions are clear, including:
– supporting effective competition in service delivery by establishing clear, contestable
community service obligations
– better data collection and transparent, comprehensive reporting of the allocation of public
funds to support regular assessment of governments’ policies
– better curated information for students and employers about career opportunities, the
performance of registered training organisations (RTOs), course quality and prices
– reform of course pricing
– a single national regulator.
There are various options for reforms to VET funding, which will require further consultation
and assessment. Reform options include:
– expanding access to VET Student Loans by relaxing loan caps and course and qualification
restrictions, underpinned by strong risk management. This may be a preferred option to any
additional subsidies
– simpler subsidy arrangements, such as:
binding arrangements on all governments to apply a nationally-consistent set of course
subsidies, based on the efficient cost of delivery, with loadings to address higher delivery
costs in some locations and to some student groups, or
replacing the proliferation of granular subsidy rates for courses with a limited range of
subsidy rates, but otherwise leaving jurisdictions to set their own subsidy levels and
allocation
– using student vouchers instead of subsidy payments to RTOs to facilitate user choice
– moving away from, or complementing, incentives to employers to train apprentices by using
other approaches to support apprentices, including mentoring and pastoral care.
Regardless of the extent to which State and Territory governments adopt a common national
approach to subsidies, there are strong grounds for them to use common methods to measure
costs and determine loadings.
OVERVIEW 3
An efficient, accessible vocational education and training (VET) system is critical to skill
acquisition for new entrants to the labour market and for employees who need to update or
broaden their skills. Millions of Australians have obtained or honed their workplace skills
through Australia’s formal VET system. In 2018, registered training organisations (RTOs)
served over 4 million students and offered over 1400 types of qualifications as well as short
courses and single subjects.
The National Agreement for Skills and Workforce Development (NASWD) — commencing
in 2009 and updated in 2012 — sets out governments’ roles, policy aspirations, performance
measures, and reform directions for the formal VET system. Some $6.1 billion is spent by
governments on VET delivery each year — shared between the Australian, State and
Territory governments. The Australian Government helps to manage and fund
apprenticeships and contributes funding of $1.7 billion to the States and Territories for the
delivery of other VET services. The States and Territories are free to decide how to allocate
funds to the VET system, are responsible for the day-to-day delivery of training in their local
markets, and provide services through publicly-owned TAFEs. Both levels of government
share regulatory responsibilities for qualification standards and the quality of RTOs, data
collection, and agreed reform directions.
The Australian Government has asked the Commission to review progress against the
targets, outcomes and performance indicators in the NASWD and to assess whether the
NASWD is still an effective long-term framework for intergovernmental cooperation on
VET policy. Intertwined with that assessment, the Commission has also been asked to
consider options to streamline government support and promote more national consistency
in VET funding and pricing.
This review of the NASWD is timely. The Joyce Review recommended significant changes
to aspects of the VET system, in particular the setting of course subsidies and the process to
update training packages. The Australian Government has announced the establishment of a
National Skills Commission and a National Careers Institute to support these changes. The
COAG Skills Council is considering the development of a new intergovernmental agreement
to replace the NASWD; a draft VET Reform Roadmap has been released for consultation to
inform the new agreement.
In undertaking the review, the Commission has been conscious that the formal VET system
includes a large fee-for-service market where private and public providers deliver recognised
training without the support of government subsidies. The Commission also recognises that
there are avenues outside the formal VET system for Australians to develop skills, including
through informal workplace learning or unaccredited training from unregistered providers.
Formal learning — both higher education and VET — is geared more to younger people
seeking to acquire skills to obtain a job rather than people who need to upskill or reskill for
an existing job (figure 1).
Lifelong learning is mainly non-formal and about 85 per cent is funded by employers. This
training is an important contributor to the incremental attainment of skills, sometimes a
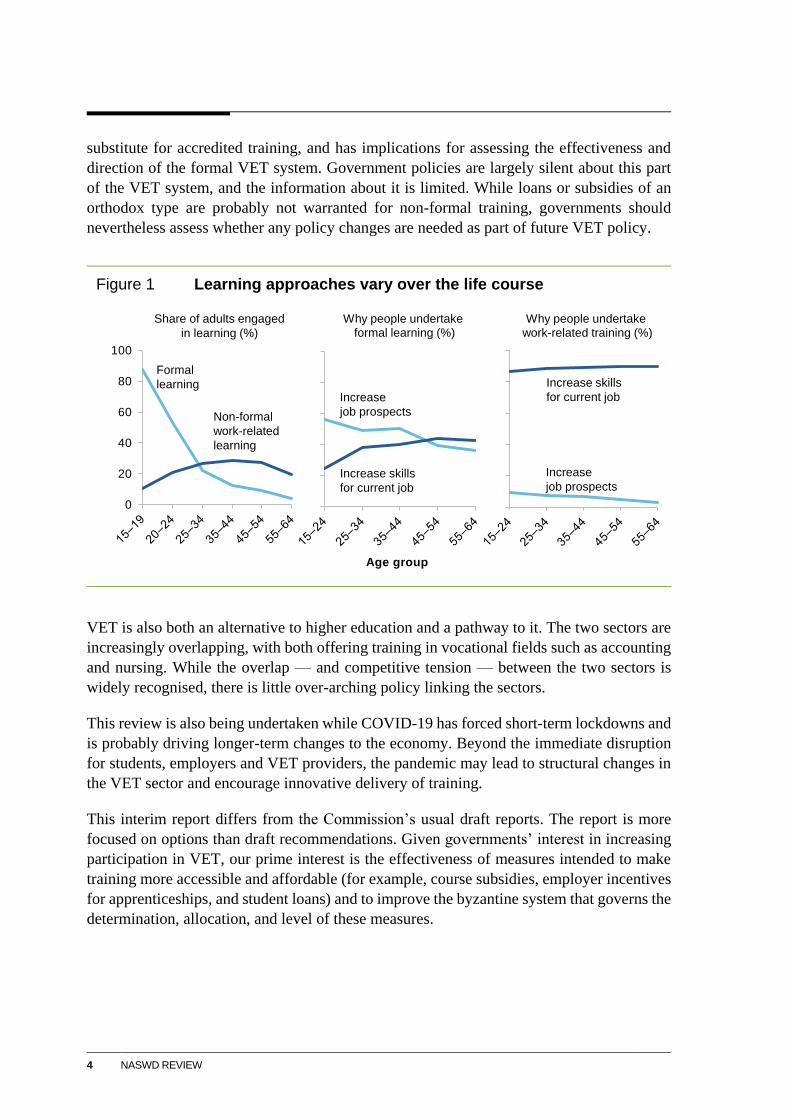
4 NASWD REVIEW
substitute for accredited training, and has implications for assessing the effectiveness and
direction of the formal VET system. Government policies are largely silent about this part
of the VET system, and the information about it is limited. While loans or subsidies of an
orthodox type are probably not warranted for non-formal training, governments should
nevertheless assess whether any policy changes are needed as part of future VET policy.
Figure 1 Learning approaches vary over the life course
VET is also both an alternative to higher education and a pathway to it. The two sectors are
increasingly overlapping, with both offering training in vocational fields such as accounting
and nursing. While the overlap — and competitive tension — between the two sectors is
widely recognised, there is little over-arching policy linking the sectors.
This review is also being undertaken while COVID-19 has forced short-term lockdowns and
is probably driving longer-term changes to the economy. Beyond the immediate disruption
for students, employers and VET providers, the pandemic may lead to structural changes in
the VET sector and encourage innovative delivery of training.
This interim report differs from the Commission’s usual draft reports. The report is more
focused on options than draft recommendations. Given governments’ interest in increasing
participation in VET, our prime interest is the effectiveness of measures intended to make
training more accessible and affordable (for example, course subsidies, employer incentives
for apprenticeships, and student loans) and to improve the byzantine system that governs the
determination, allocation, and level of these measures.
Age group
Increase
job prospects
Increase skills
for current job
0
20
40
60
80
100
Formal
learning
Non-formal
work-related
learning
Increase skills
for current job
Increase
job prospects
Share of adults engaged
in learning (%)
Why people undertake
formal learning (%)
Why people undertake
work-related training (%)
OVERVIEW 5
1 A snapshot of the formal VET system
The formal VET system is a highly managed market, with the Australian and State and
Territory governments sharing responsibilities for its architecture, funding and performance.
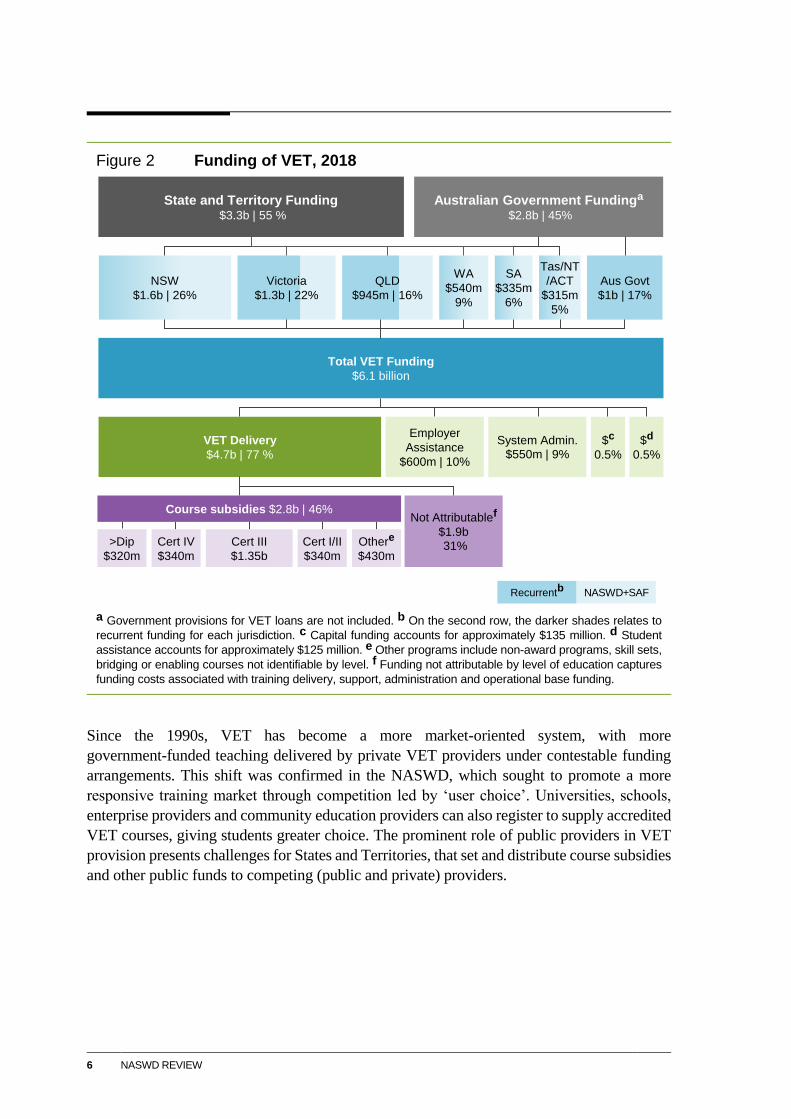
Governments collectively provided direct funding of about $6.1 billion in 2018; about
$3.4 billion is provided through course subsidies to training providers and incentives for
employers (figure 2). The Australian Government provides additional funding of about
$500 million through VET student and trade support loans. However, the formal VET
system is more than just government-funded training. Only about half of domestic students
(1 102 400) undertaking a nationally recognised training program receive government
funding.
Qualifications in the VET system are diverse in difficulty and duration, ranging from
building foundation skills (principally language, literacy, numeracy and basic digital skills)
to delivering formal qualifications up to Advanced Diplomas.
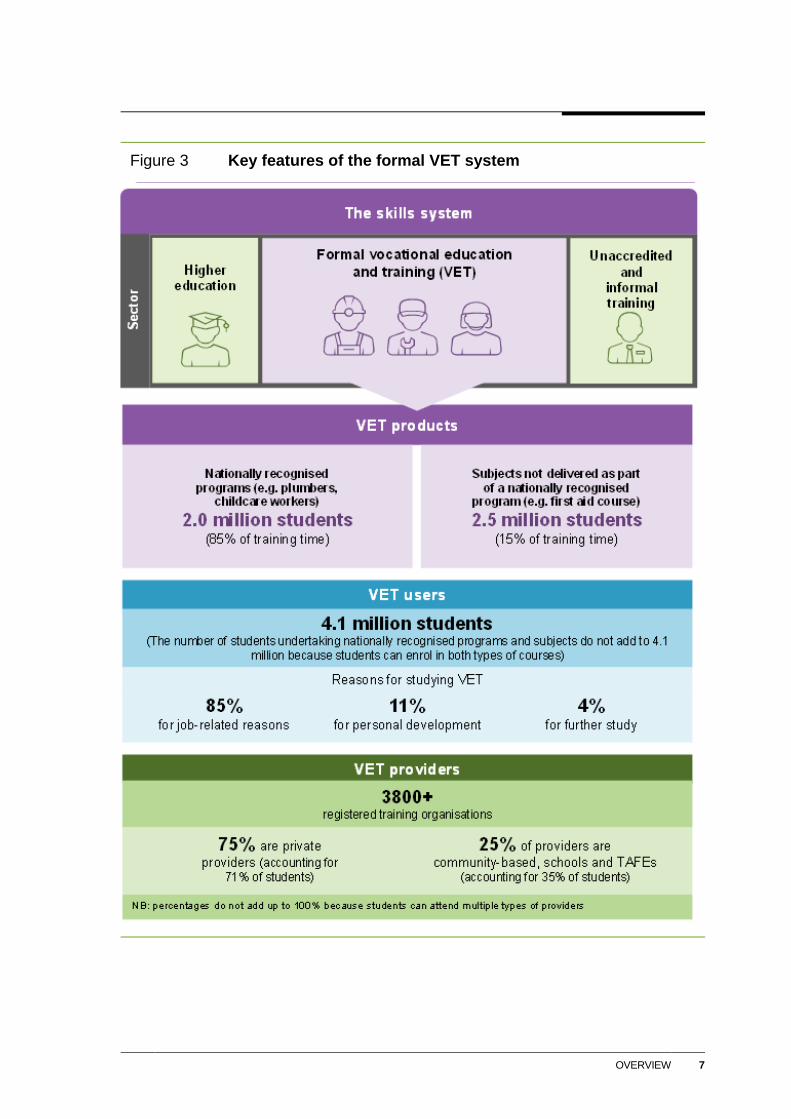
Half of the 4.1 million VET student enrolments and 85 per cent of training hours are under
nationally recognised programs (figure 3). RTOs teach pre-approved training packages,
which specify the skills and knowledge (‘competencies’) required to perform effectively in
particular occupations. These formal credentials (qualifications and statements of
attainment) are developed in consultation with industry and educational institutions. Only
RTOs can deliver nationally recognised training, undertake assessments, and issue
qualifications. RTOs must comply with national standards for training and assessment.
Training in nationally recognised programs has been declining in recent years, while use of
stand-alone short courses or individual subjects (such as first aid and OH&S courses) has
been growing. There are many reasons for this trend. Universities are offering more courses
which directly compete with traditional VET courses; many students are now choosing
university-based alternatives to VET. Employers are attracted to the greater flexibility and
lower costs of short courses. Regulatory changes have increased the demand for short
courses such as responsible service of alcohol and cardiopulmonary resuscitation. Students
are also increasingly assembling their own mix of qualifications from a blend of short
courses and micro-credentials in a world of more frequent career changes.
6 NASWD REVIEW
Figure 2 Funding of VET, 2018
a Government provisions for VET loans are not included. b On the second row, the darker shades relates to
recurrent funding for each jurisdiction. c Capital funding accounts for approximately $135 million. d Student
assistance accounts for approximately $125 million. e Other programs include non-award programs, skill sets,
bridging or enabling courses not identifiable by level. f Funding not attributable by level of education captures
funding costs associated with training delivery, support, administration and operational base funding.
Since the 1990s, VET has become a more market-oriented system, with more
government-funded teaching delivered by private VET providers under contestable funding
arrangements. This shift was confirmed in the NASWD, which sought to promote a more
responsive training market through competition led by ‘user choice’. Universities, schools,
enterprise providers and community education providers can also register to supply accredited
VET courses, giving students greater choice. The prominent role of public providers in VET
provision presents challenges for States and Territories, that set and distribute course subsidies
and other public funds to competing (public and private) providers.
Total VET Funding
$6.1 billion
VET Delivery
$4.7b | 77 %
Employer
Assistance
$600m | 10%
System Admin.
$550m | 9%
$c
0.5%
$d
0.5%
NSW
$1.6b | 26%
QLD
$945m | 16%
SA
$335m
6%
Tas/NT
/ACT
$315m
5%
Victoria
$1.3b | 22%
WA
$540m
9%
Aus Govt
$1b | 17%
Recurrentb NASWD+SAF
Australian Government Fundinga
$2.8b | 45%
State and Territory Funding$3.3b | 55 %
Not Attributablef
$1.9b
31%
Course subsidies $2.8b | 46%
>Dip
$320m
Cert IV
$340m
Cert III
$1.35b
Othere
$430m
Cert I/II
$340m
OVERVIEW 7
Figure 3 Key features of the formal VET system
VET products
Secto
r
Unaccredited
and
informal
training
Nationally recognised
programs (e.g. plumbers,
childcare workers)
2.0 million students (85% of training time)
Subjects not delivered as part
of a nationally recognised
program (e.g. first aid course)
2.5 million students (15% of training time)
Higher
education
VET providers
4.1 million students (The number of students undertaking nationally recognised programs and subjects do not add to 4.1
million because students can enrol in both types of courses)
75% are private
providers (accounting for
71% of students)
25% of providers are
community-based, schools and TAFEs (accounting for 35% of students)
Reasons for studying VET
Formal vocational education
and training (VET)
85% for job-related reasons
11% for personal development
4% for further study
NB: percentages do not add up to 100% because students can attend multiple types of providers
3800+registered training organisations
VET users
The skills system
8 NASWD REVIEW
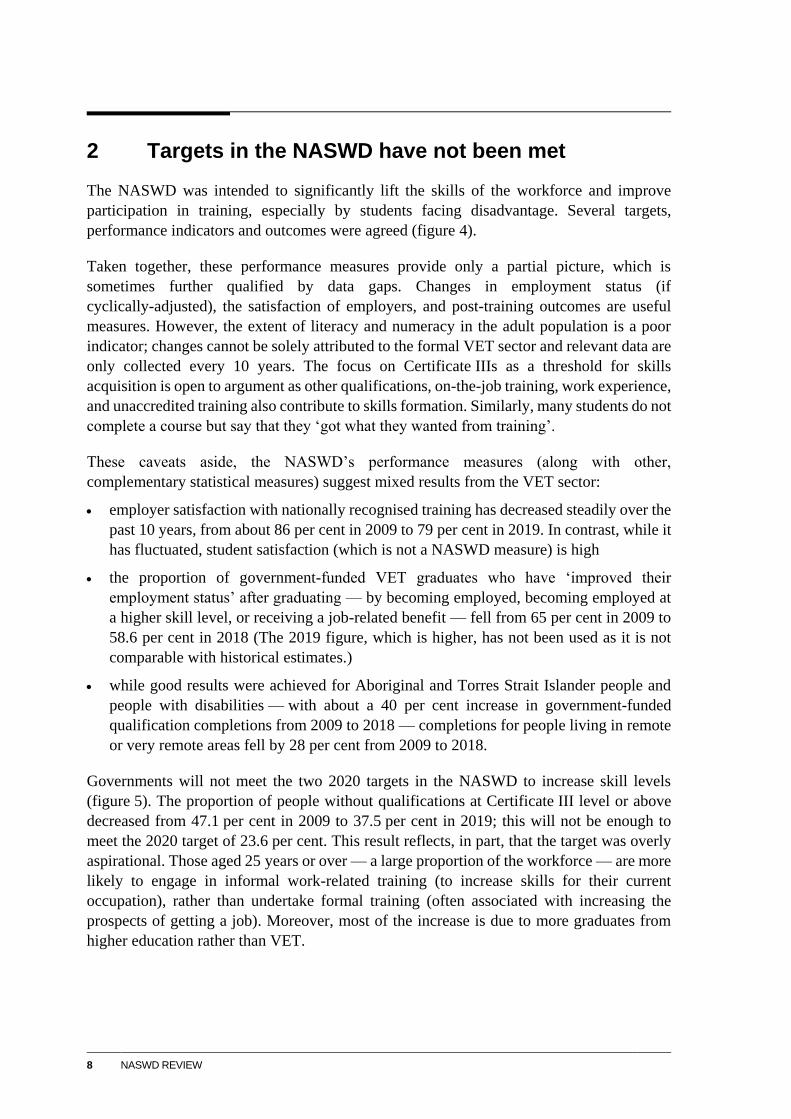
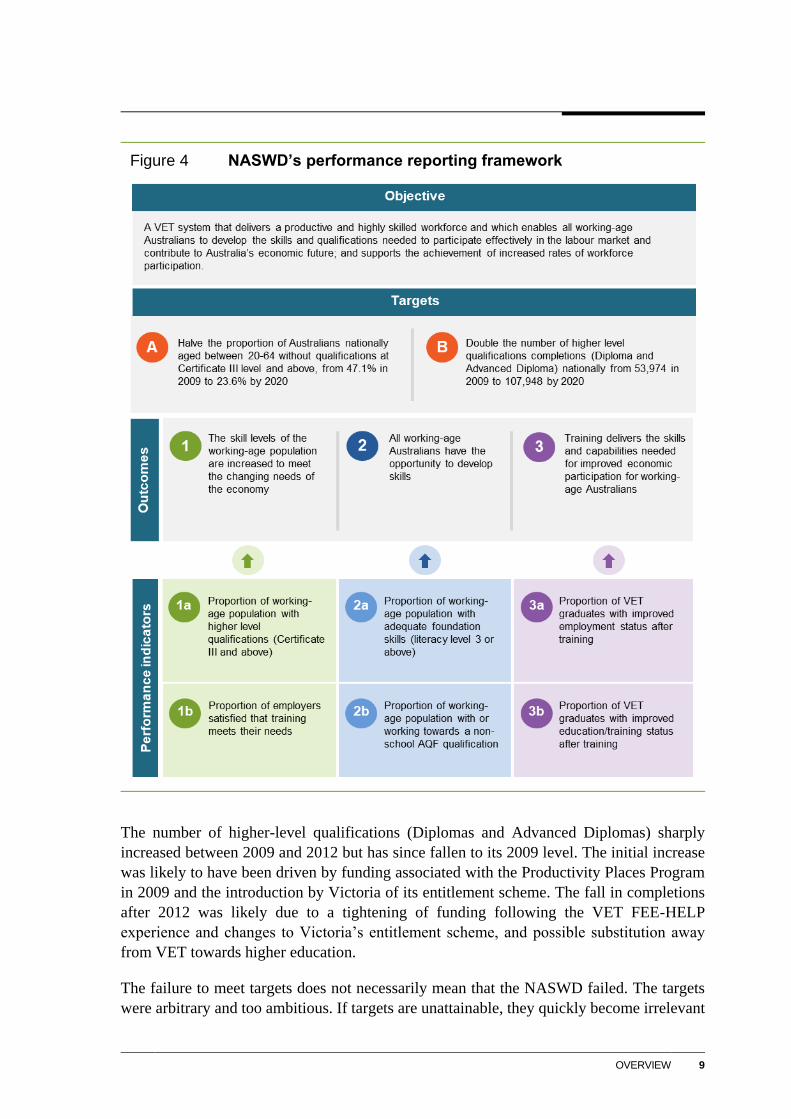
2 Targets in the NASWD have not been met
The NASWD was intended to significantly lift the skills of the workforce and improve
participation in training, especially by students facing disadvantage. Several targets,
performance indicators and outcomes were agreed (figure 4).
Taken together, these performance measures provide only a partial picture, which is
sometimes further qualified by data gaps. Changes in employment status (if
cyclically-adjusted), the satisfaction of employers, and post-training outcomes are useful
measures. However, the extent of literacy and numeracy in the adult population is a poor
indicator; changes cannot be solely attributed to the formal VET sector and relevant data are
only collected every 10 years. The focus on Certificate IIIs as a threshold for skills
acquisition is open to argument as other qualifications, on-the-job training, work experience,
and unaccredited training also contribute to skills formation. Similarly, many students do not
complete a course but say that they ‘got what they wanted from training’.
These caveats aside, the NASWD’s performance measures (along with other,
complementary statistical measures) suggest mixed results from the VET sector:
employer satisfaction with nationally recognised training has decreased steadily over the
past 10 years, from about 86 per cent in 2009 to 79 per cent in 2019. In contrast, while it
has fluctuated, student satisfaction (which is not a NASWD measure) is high
the proportion of government-funded VET graduates who have ‘improved their
employment status’ after graduating — by becoming employed, becoming employed at
a higher skill level, or receiving a job-related benefit — fell from 65 per cent in 2009 to
58.6 per cent in 2018 (The 2019 figure, which is higher, has not been used as it is not
comparable with historical estimates.)
while good results were achieved for Aboriginal and Torres Strait Islander people and
people with disabilities — with about a 40 per cent increase in government-funded
qualification completions from 2009 to 2018 — completions for people living in remote
or very remote areas fell by 28 per cent from 2009 to 2018.
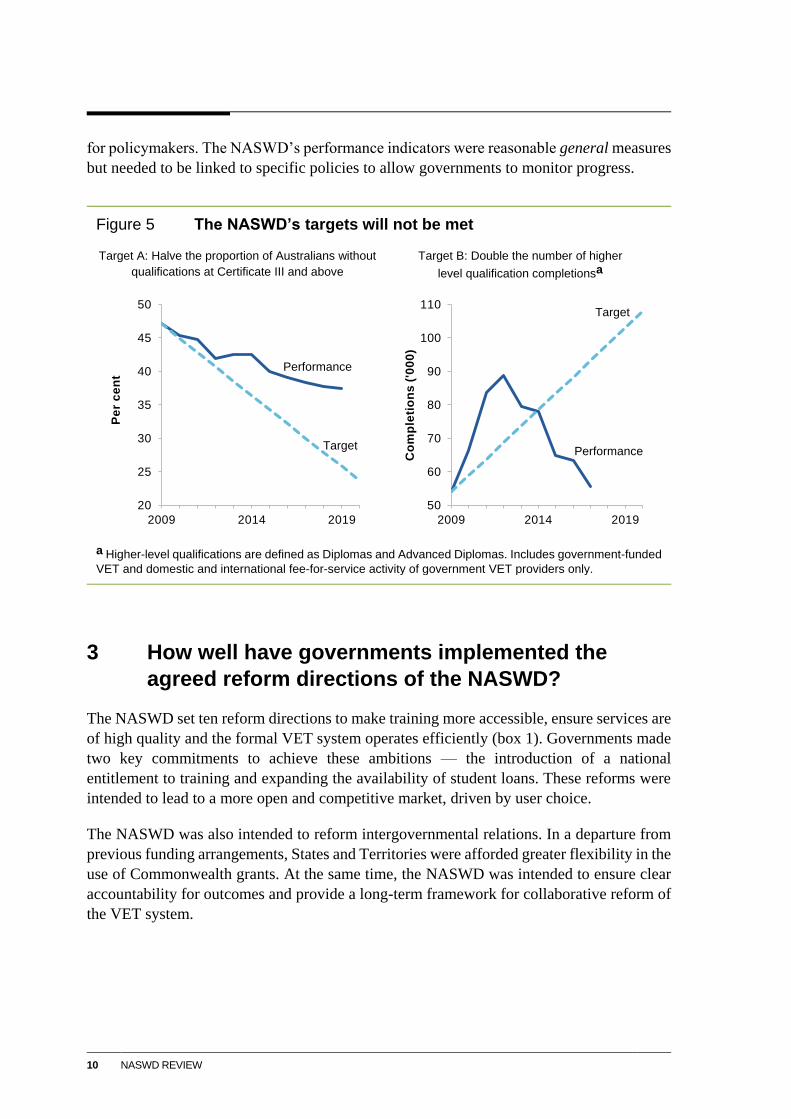
Governments will not meet the two 2020 targets in the NASWD to increase skill levels
(figure 5). The proportion of people without qualifications at Certificate III level or above
decreased from 47.1 per cent in 2009 to 37.5 per cent in 2019; this will not be enough to
meet the 2020 target of 23.6 per cent. This result reflects, in part, that the target was overly
aspirational. Those aged 25 years or over — a large proportion of the workforce — are more
likely to engage in informal work-related training (to increase skills for their current
occupation), rather than undertake formal training (often associated with increasing the
prospects of getting a job). Moreover, most of the increase is due to more graduates from
higher education rather than VET.
OVERVIEW 9
Figure 4 NASWD’s performance reporting framework
The number of higher-level qualifications (Diplomas and Advanced Diplomas) sharply
increased between 2009 and 2012 but has since fallen to its 2009 level. The initial increase
was likely to have been driven by funding associated with the Productivity Places Program
in 2009 and the introduction by Victoria of its entitlement scheme. The fall in completions
after 2012 was likely due to a tightening of funding following the VET FEE-HELP
experience and changes to Victoria’s entitlement scheme, and possible substitution away
from VET towards higher education.
The failure to meet targets does not necessarily mean that the NASWD failed. The targets
were arbitrary and too ambitious. If targets are unattainable, they quickly become irrelevant
10 NASWD REVIEW
for policymakers. The NASWD’s performance indicators were reasonable general measures
but needed to be linked to specific policies to allow governments to monitor progress.
Figure 5 The NASWD’s targets will not be met
Target A: Halve the proportion of Australians without
qualifications at Certificate III and above
Target B: Double the number of higher
level qualification completionsa
a Higher-level qualifications are defined as Diplomas and Advanced Diplomas. Includes government-funded
VET and domestic and international fee-for-service activity of government VET providers only.
3 How well have governments implemented the
agreed reform directions of the NASWD?
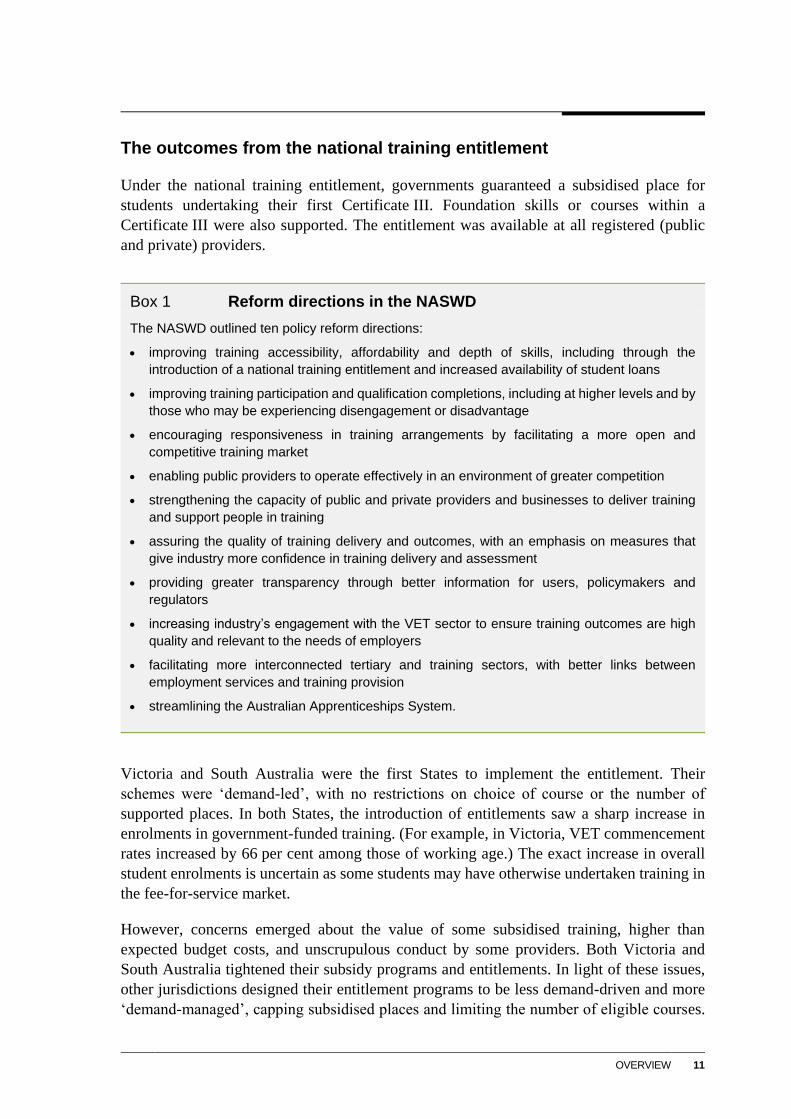
The NASWD set ten reform directions to make training more accessible, ensure services are
of high quality and the formal VET system operates efficiently (box 1). Governments made
two key commitments to achieve these ambitions — the introduction of a national
entitlement to training and expanding the availability of student loans. These reforms were
intended to lead to a more open and competitive market, driven by user choice.
The NASWD was also intended to reform intergovernmental relations. In a departure from
previous funding arrangements, States and Territories were afforded greater flexibility in the
use of Commonwealth grants. At the same time, the NASWD was intended to ensure clear
accountability for outcomes and provide a long-term framework for collaborative reform of
the VET system.
20
25
30
35
40
45
50
2009 2014 2019
Pe
r c
en
t
Performance
Target
50
60
70
80
90
100
110
2009 2014 2019
Co
mp
leti
on
s (
'00
0)
Performance
Target
OVERVIEW 11
The outcomes from the national training entitlement
Under the national training entitlement, governments guaranteed a subsidised place for
students undertaking their first Certificate III. Foundation skills or courses within a
Certificate III were also supported. The entitlement was available at all registered (public
and private) providers.
Box 1 Reform directions in the NASWD
The NASWD outlined ten policy reform directions:
improving training accessibility, affordability and depth of skills, including through the
introduction of a national training entitlement and increased availability of student loans
improving training participation and qualification completions, including at higher levels and by
those who may be experiencing disengagement or disadvantage
encouraging responsiveness in training arrangements by facilitating a more open and
competitive training market
enabling public providers to operate effectively in an environment of greater competition
strengthening the capacity of public and private providers and businesses to deliver training
and support people in training
assuring the quality of training delivery and outcomes, with an emphasis on measures that
give industry more confidence in training delivery and assessment
providing greater transparency through better information for users, policymakers and
regulators
increasing industry’s engagement with the VET sector to ensure training outcomes are high
quality and relevant to the needs of employers
facilitating more interconnected tertiary and training sectors, with better links between
employment services and training provision
streamlining the Australian Apprenticeships System.
Victoria and South Australia were the first States to implement the entitlement. Their
schemes were ‘demand-led’, with no restrictions on choice of course or the number of
supported places. In both States, the introduction of entitlements saw a sharp increase in
enrolments in government-funded training. (For example, in Victoria, VET commencement
rates increased by 66 per cent among those of working age.) The exact increase in overall
student enrolments is uncertain as some students may have otherwise undertaken training in
the fee-for-service market.
However, concerns emerged about the value of some subsidised training, higher than
expected budget costs, and unscrupulous conduct by some providers. Both Victoria and
South Australia tightened their subsidy programs and entitlements. In light of these issues,
other jurisdictions designed their entitlement programs to be less demand-driven and more
‘demand-managed’, capping subsidised places and limiting the number of eligible courses.
12 NASWD REVIEW
Governments shifted from promoting competition through user choice to a more managed
market, which saw providers (public and private) compete for contestable government
contracts. More recently, some jurisdictions have further shifted support to public providers,
offering a broad range of free courses.
Reputational damage from VET FEE-HELP
The expansion of the VET FEE-HELP loans scheme, the other major reform, saw a surge in
the uptake of loans from about 54 000 students in 2012 to over 272 000 in 2015. The
scheme’s expansion also saw average course fees more than triple from $4060 in 2009 to
about $14 000 in 2015. However, many of these higher-cost courses were offered by a small
number of opportunistic providers delivering poor quality training and are no longer
operating.
The problems associated with VET FEE-HELP stemmed from flaws in the design and
implementation of the program. With the Australian Skills Quality Authority (ASQA) only
established in 2011, regulatory oversight was also inadequate at a time of rapid change. The
scheme was replaced at the end of 2016 with the far more restrictive VET Student Loans
program. The commitment in the NASWD towards expanding the availability of income
contingent loans has largely been abandoned.
The VET FEE-HELP experience significantly damaged the reputation of the VET sector,
and, following its failure, governments have recognised the priority of improving regulation
— particularly the supervision of training providers.
Commitment to a competitive training market has waned
As noted, the NASWD was intended to promote greater competition in the delivery of
training. The combination of student entitlements and wider use of income contingent loans
was expected to give students genuine choice and leverage in the market. Governments
expected that public providers would adjust to a more open and competitive market.
These expectations have not been realised. With hindsight, some essential pre-conditions for
a robust competitive market were not in place. Students lacked accessible information to
make effective choices of courses and providers. Regulation of RTOs was inadequate,
leaving students exposed to misconduct.
States and Territories have turned to a limited form of contestability rather than user choice
to support competition. Each State and Territory decides how much of the pool of public
funding is open to bids from private RTOs and the allocation of funds to those providers.
Public providers continue to deliver the majority of government-funded training in all
jurisdictions, except Queensland. In 2018, 50 per cent of government funding was open to
competitive tendering, with non-TAFE RTOs securing 41 per cent of that pool.
OVERVIEW 13
Besides capital works, States and Territories support public providers to deliver community
service obligations. Governments — and the NASWD — have not clearly defined the nature
or scope of these obligations. One example is servicing thin markets (that is, markets where
there is insufficient demand for commercial delivery of VET). However, thin markets could
be contestable for servicing by private and public providers.
Reforms to quality assurance are underway
The NASWD recognised the importance of strengthening industry engagement in the formal
VET system to improve the quality and relevance of training and endorsed reforms to ‘give
industry more confidence in the standards of training delivery and assessment’. The
establishment in 2011 of the national regulator — ASQA — was intended to achieve national
consistency in the way providers were registered, courses accredited and the quality of the
system monitored. ASQA replaced State or Territory regulators in all but two jurisdictions
(Victoria and Western Australia).
Establishing a new national regulator as governments introduced major policy changes
involved under-appreciated risks. Flawed program design compounded the problem. The
Braithwaite and Joyce reviews identified concerns with regulatory standards, including RTO
registration, course accreditation and engagement with industry. But change is in train.
ASQA is moving to a cost-recovery funding model and more engagement with RTOs as part
of its compliance strategy. In 2020, the Australian Government accepted all
24 recommendations of a ‘rapid review’ about operating arrangements, which are expected
to improve ASQA’s effectiveness.
Objective quantitative measures of quality are challenging, with reliance on high-level
indicators such as employer satisfaction providing only some insights. Short courses may force
high-quality providers to lower their standards to compete. Teacher quality remains a
persistent concern. Some participants believe that the current minimum requirement for
teachers — the Certificate IV in Training and Assessment — is too restrictive while others
believe it is too lax. Perceptions of problems in quality may also partly stem from the existence
of a few low-quality providers rather than systemic problems in the formal VET system.
New assessment models involving independent assessment of competency have been
foreshadowed by the COAG Skills Council’s draft VET Reform Roadmap, which may
reduce the risks associated with assessment undertaken by RTOs. Unbundling of assessment
from teaching has a wider potential to disrupt the current model of VET supply (as discussed
in section 11).
User choice is illusory without salient information
The NASWD recognised that students need practical information on courses, careers and
training providers, and curated and presented in a way that is more likely to be used in
making decisions about training.
14 NASWD REVIEW
However, as noted by many commentators, information for students is still fragmented and
duplicated across multiple government and private sector websites. Students need better
information about training providers — the courses offered (in what mode and contact
hours), the prices charged, the quality of services — and in-demand careers and salaries, and
job outcomes. For example, many courses do not have pricing information uploaded to the
My Skills platform, although My Skills was intended to be the main source of information
for VET students. As noted by the Business Council of Australia, information gaps have
‘stymied a learner-centric approach and contributed to poor decisions on the part of learners’.
Unclear pathways to jobs through the education and training system
The VET system serves a range of student needs. People may use VET once to acquire a
skill, return multiple times over their working lives to upskill, or use it as a stepping stone to
higher education. While the NASWD recognised that VET should be an integrated part of a
wider post-school education system, various factors have worked against this goal.
The reliability and usefulness of career information and advice (especially for school
students) is questionable, as is the effectiveness of VET in Schools as a pathway to
employment. Previous reviews have found that schools and their advisors often have little
experience with VET, favour universities and mistakenly see VET as only offering trade
qualifications. Participants argued that students who complete VET subjects in secondary
school often do not know how to apply the skills they have learned, and their qualifications
are of uneven quality and relevance to the labour market.
There is also a need for improved information about credit pathways — which encompasses
credit transfer, recognition of prior learning and articulation — to allow students to move
from VET to higher education, taking into account the skills they have acquired already.
According to tertiary admission agencies, most students are unaware of these processes and
are deterred by the complex paperwork.
Coordinating and streamlining services
While the NASWD’s reform aspiration centred on streamlining the Australian
Apprenticeships System, jurisdictions’ efforts for streamlining have extended further.
Governments have made progress to streamline and coordinate their policy and regulatory
activities by harmonising apprenticeship systems, streamlining training packages and
developing national standards for regulating training quality.
Further streamlining is likely. The COAG Skills Council’s draft VET Reform Roadmap
foreshadows more initiatives to streamline training packages, reduce red tape in
apprenticeship supports and better coordinate consumer information.

OVERVIEW 15
4 Where to for a new agreement?
Overall, while some progress has been made, many of the reform directions of the NASWD
have not been met. The context for intergovernmental co-operation has also evolved. The
COAG Reform Council was intended to be an independent body monitoring progress under
the various national agreements but was disbanded in 2014. The COAG Skills Council has
now emerged as the main forum for co-operation on VET policy and delivery. The Council
is expected to negotiate a new national funding agreement for VET by 2021. The draft VET
Reform Roadmap, which will inform this new agreement, incorporates some of the key goals
(‘reform directions’) in the original NASWD, such as better information for students,
improved quality assurance, a more interconnected education and training system, enhanced
data and accountability, and (as noted above) greater streamlining.
However, the draft VET Reform Roadmap misses some important aspects of the NASWD,
particularly the goals of contestability and the establishment of a workably competitive
market. While the policies intended to achieve these goals were flawed, the fundamental
directions are not. This highlights the danger that a new intergovernmental agreement may
result in an ad hoc reform agenda.
A principles-based approach to the design of the VET system would provide coherence and
give governments flexibility about their policy choices, and could be the best option for a
new agreement. The policies that would give effect to those principles could be in a different
intergovernmental agreement or pursued bilaterally or unilaterally. A principles-based
approach would, for example, leave contestability and market delivery of services on the
table, but leave it up to governments to determine how to design the market and the strategies
to mitigate risk.
Principles would be the core of a new agreement
The existing NASWD included many (sound) principles that were intended to shape the
actions of governments, including:
efficiency
equitable access (particularly in respect of access for students facing disadvantage and
promotion of foundational skills as a stepping stone to further training)
quality training delivery and teaching
system design that enhances economywide economic participation and productivity
responsiveness and resilience to changes in the economy and technological change
provision of information for informed student and employer choice
publicly available data and information to support analysis of programs, system
performance and accountability for government funding
16 NASWD REVIEW
coherent linkages with other parts of the education and training system (schools and
higher education), and with employers
stability in funding arrangements to provide greater certainty for jurisdictions making
investments.
However, important principles are missing, while some others fail to give much guidance on
their implications for policy.
The principle that government services should be centred on ‘customers’ (students and
employers in the case of VET) rather than suppliers is now widely recognised in disability
care and Indigenous services, but much less so in VET. The supplier-centric focus has meant
that certain segments of the VET sector are favoured through selective subsidies, that
competence is the basis for assessment even if students might want to signal their
proficiency, and that governments do not give students the option of acquiring their
knowledge in a way that suits them and having these independently certified. A
student-centric approach would resolve these problems (box 2). The latter means that the
supply of services for nationally recognised training is restricted to RTOs. (Quality assurance
is essential, but there may be alternative ways of achieving that — section 11.)
The principle of subsidiarity — implicit in federation — suggests that responsibility for a
function should, where practical, be devolved to the extent possible, so that government is
accessible and accountable to those affected by its decisions. Given the vertical fiscal
imbalance, the Australian Government must fund many of the activities for which State and
Territory governments have key responsibility. However, the Australian Government’s
revenue raising capacity does not give it any intrinsic superiority in judging how to allocate
funding or regulate. The untied nature of funding in the NASWD recognises this. The
principle of subsidiarity does not preclude the desirability of a national role for the Australian
Government if there are sufficient benefits. Moreover, other jurisdictions will often consent
to that role if the vehicle for achieving it is well-designed and serves their purpose. (For
example, the benefits of a national regulator have been accepted by most governments.)
Efficiency is a desirable principle, but the imperative for it in the NASWD is too imprecise
to strongly guide policy. Breaking the principle into seven important components would help
make it more tangible — efficient delivery, efficient pricing and subsidies, the importance
that any subsidies need to elicit additional training to have economic impacts, the trade-off
between quality and cost, incentives for innovation, competitive neutrality, and recognition
that (even if guided), students have the best overall understanding of their preferences and
life goals.
But even efficient pricing (and underpinning it, cost estimation) is not a simple concept to
apply, given the complexity and resource costs of setting multiple tiers of prices for courses
delivered in different settings, for example, by student type and region. And for governments
that determine efficient pricing rules, there is the added challenge of uncertainty about costs,
which governments only incompletely observe. Genuinely efficient prices have to take
OVERVIEW 17
account of such transaction costs (and uncertainty), and use robust rules that generally work.
Subsidy setting (discussed further below) has arguably lost sight of this reality.
Box 2 A student-centred approach
Giving students as much consumer sovereignty and flexibility as possible requires several
important supports:
choice and power — students should be able to choose between RTOs and courses based
on the degree to which they meet their needs and their pricing and quality. An element of this
is the desirability of avoiding obstacles to (virtuous) product variety, because some subsidy
and pricing approaches risk undermining training organisations’ capacity to provide
differentiated services and to innovate
good information and navigation of services provided in a meaningful way. Informed choice
must be underpinned by disclosure of prices, the quality of the providers, and their course
offerings, among other factors
provision of gateway services to improve matching efficiency, such as appropriate career
advice. Students come with varying preferences and capabilities, and the value of their
investments may often only be realised if these are well-matched to courses. Poor matching
limits students’ attainment of competencies and retention rates
the availability of support services — mentoring and pastoral care — recognising that effective
training requires more than standard tuition
high quality regulation and consumer protection, accompanied by efficient compliance.
VET FEE-HELP served many students very poorly due to poor regulatory oversight
value for money — which largely comes down to ensuring workable competition, such that
costs are minimised and margins are not excessive or permanent
credible qualifications — the value of training is not just about the acquisition of skills, but proof
to employers that they have been genuinely acquired.
The NASWD did not include the principle of fiscal sustainability, notwithstanding the risk
posed by its initial liberal approach to training entitlements. Future policies would benefit
from rigorous tests of the long-run fiscal sustainability of any policy.
Equally, it is desirable to have neutral, but not equivalent treatment of higher education (VET
and universities), with policy settings that minimise distortions in students’ choice between
sectors, given the connected, but bifurcated post-secondary school education system.
An expanded suite of principles within a new agreement would guide the design of policies
for achieving an efficient and effective VET system and help define appropriate roles of
governments.
18 NASWD REVIEW
5 What are the key reform options for VET policy?
While linked to the desirable direction of a new agreement, the Australian Government also
requested the Commission to consider reform options for funding, pricing and streamlining
VET services. In doing so, the Commission has also examined some policies that would
support more efficient funding (such as data and empowering students and employers with
information) and taken into account that economic and technological changes may require
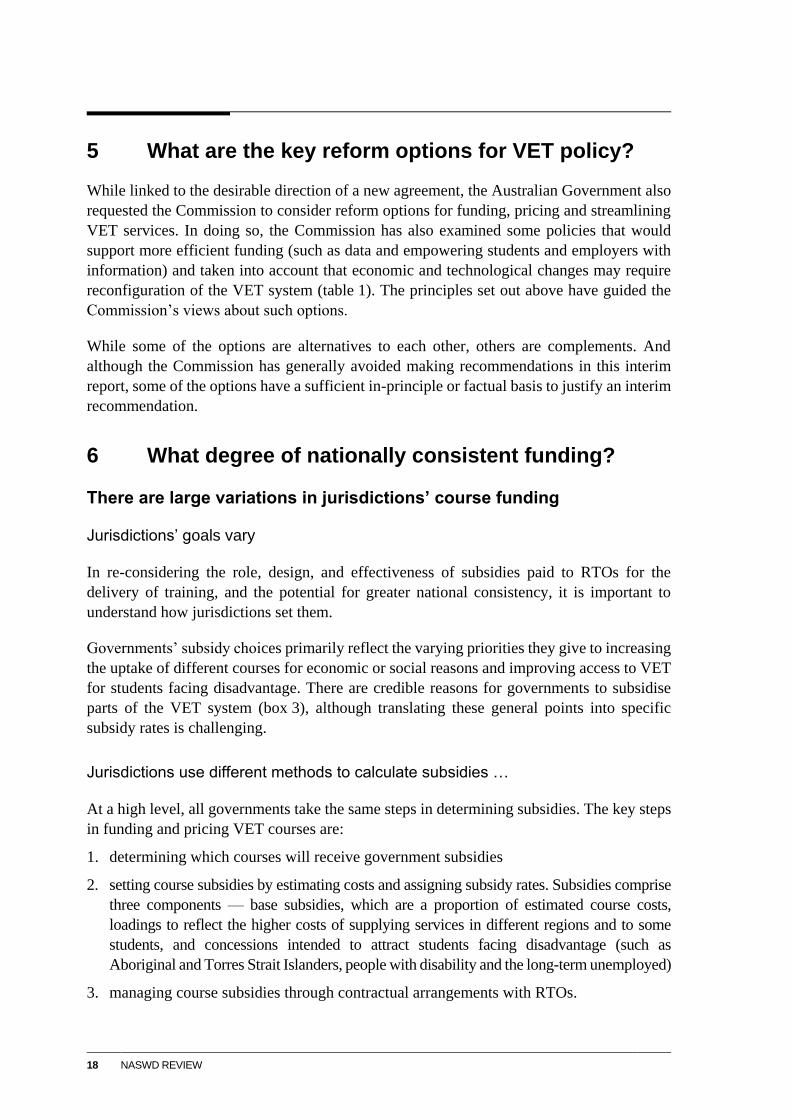
reconfiguration of the VET system (table 1). The principles set out above have guided the
Commission’s views about such options.
While some of the options are alternatives to each other, others are complements. And
although the Commission has generally avoided making recommendations in this interim
report, some of the options have a sufficient in-principle or factual basis to justify an interim
recommendation.
6 What degree of nationally consistent funding?
There are large variations in jurisdictions’ course funding
Jurisdictions’ goals vary
In re-considering the role, design, and effectiveness of subsidies paid to RTOs for the
delivery of training, and the potential for greater national consistency, it is important to
understand how jurisdictions set them.
Governments’ subsidy choices primarily reflect the varying priorities they give to increasing
the uptake of different courses for economic or social reasons and improving access to VET
for students facing disadvantage. There are credible reasons for governments to subsidise
parts of the VET system (box 3), although translating these general points into specific
subsidy rates is challenging.
Jurisdictions use different methods to calculate subsidies …
At a high level, all governments take the same steps in determining subsidies. The key steps
in funding and pricing VET courses are:
1. determining which courses will receive government subsidies
2. setting course subsidies by estimating costs and assigning subsidy rates. Subsidies comprise
three components — base subsidies, which are a proportion of estimated course costs,
loadings to reflect the higher costs of supplying services in different regions and to some
students, and concessions intended to attract students facing disadvantage (such as
Aboriginal and Torres Strait Islanders, people with disability and the long-term unemployed)
3. managing course subsidies through contractual arrangements with RTOs.
OVERVIEW 19
However, governments undertake these steps in different ways (box 4).
Table 1 There is a large suite of policy issues and reform options
Area of policy Options/recommendations Key relevance
Course funding and a nationally-oriented system
Common methods
Simpler subsidies
Nationally determined, binding subsidies
Student vouchers
A bigger role for loans
Pricing reforms
Data
Eliminating unjustified national variations
Better matching of funding to student needs
Addressing perverse incentives
Fiscal sustainability
Desirable roles of governments within the federation
Loans make training more affordable
Streamlining training packages and regulation
Quicker adaption to changing skill needs
A single regulator
A responsive VET system
Administrative efficiency
Apprenticeship funding and design
Adjust employer incentives
Industry levies
Student support
Higher retention rates
Greater effectiveness in inducing additional apprentice numbers
Student supports Pastoral and mentoring services
Upfront assessment
Addressing non-completion and wasted subsidies
Better matching of students to courses
Public provision and contestability
Competitive neutrality
Transparency
Efficient markets responsive to student needs
Better information for students and employers
Disclosure of RTO performance and pricing
Testing of disclosure methods
Consistency with a customer-centred approach
Underpins an efficient market
Supports centring the VET system on customers
Better data for assessing VET system performance
Requirements for transparency
Collection of information on a consistent basis
Accountability for spending
Testing the effectiveness of VET policy and achievement of goals
Guides subsidy determination
Adaptability and resilience to new economic developments
Greater online provision
Cross-border course subsidies
Unbundling of training from assessment
Centres the VET system on customers
Increases competition for supply of training
Encourages innovative delivery
20 NASWD REVIEW
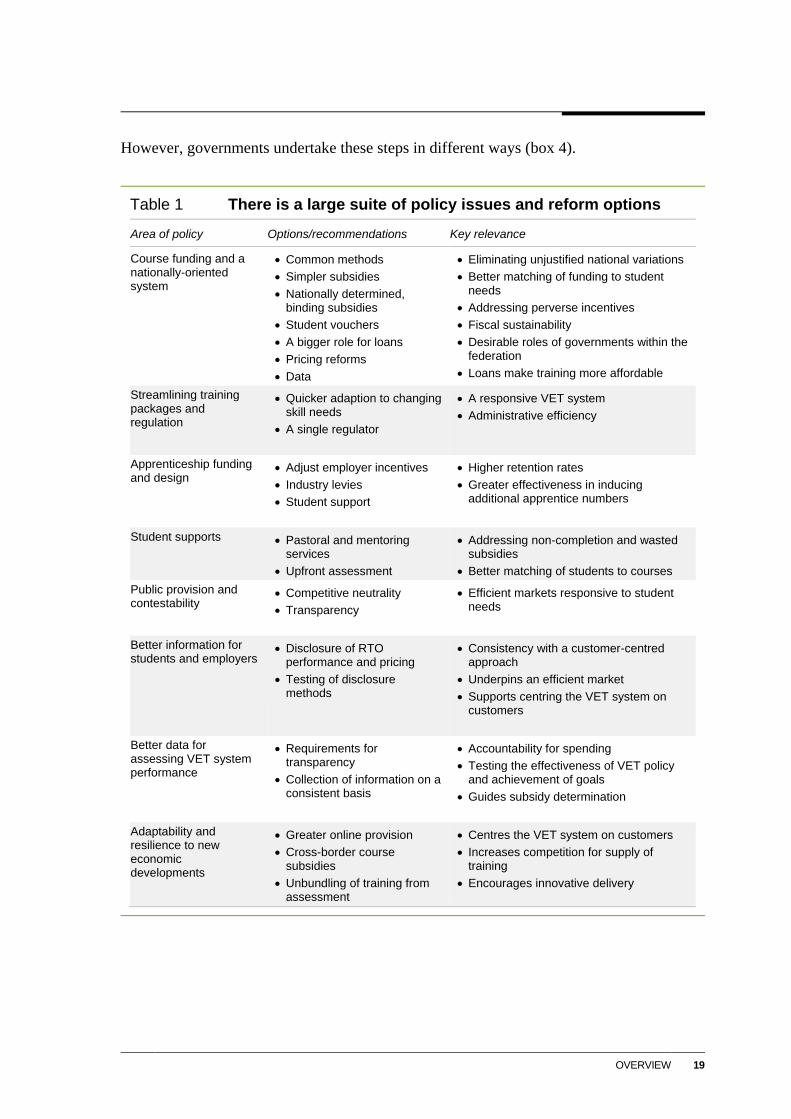
Box 3 Rationales for subsidies
There is compelling evidence that completing a VET qualification typically raises productivity and
leads to higher labour income (see figure below). However, this general link is not a sufficient
argument for government interventions to increase vocational skill formation. Private parties, such
as students and employers, have strong incentives to invest in education so public investment
may not always be necessary. The key issue is the public value of such policies.
Some forms of governments’ investment in VET — quality regulation, consumer protection,
careers information, and support for students facing disadvantage — have well accepted public
interest reasons for interventions.
The public value of other policy measures that subsidise or otherwise encourage the uptake of
VET courses and apprenticeships are more open to debate and depend in turn on their rationale
and effectiveness.
Subsidies directed at addressing skill shortages have some in-principle validity as,
notwithstanding expectations that markets will respond, some skill shortages have been
surprisingly persistent.
Private incentives to invest do not take account of broader public benefits, leading to
underinvestment.
Even where private incentives are sufficient to motivate training, if there are also public
benefits there is an equity argument for requiring contributions from all the parties who benefit.
This is a societal choice exercised by governments, shaped by social norms about what is fair.
Some degree of parity is required between higher education and the VET sector as current
arrangements can inefficiently encourage students to choose a sector less suited to them,
while also being inequitable. This means that subsidy and loan settings in the VET system
cannot be considered in isolation from those in higher education.
Education wage premium, 20–64 year olds
0
10
20
30
40
2001 2003 2005 2007 2009 2011 2013 2015 2017
Pe
r c
en
t
Graduate degree
Undergraduate degree
Vocational education
OVERVIEW 21
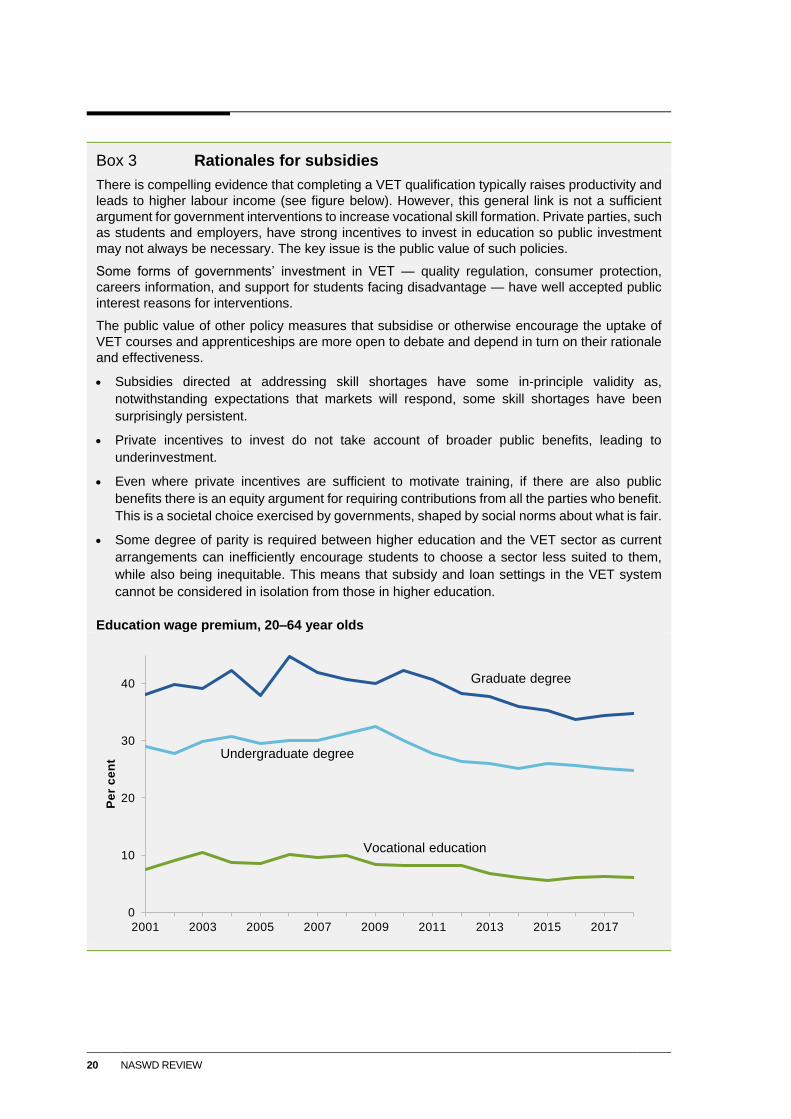
Box 4 Each to its own — how jurisdictions determine costs and subsidies
There is no general approach to estimating course costs, calculating subsidy rates or in setting
loadings/concessions, with methods varying significantly within and across jurisdictions. For
example, within each jurisdiction, location loadings take into account the higher costs of training
in regional and remote areas. However, large differences exist across jurisdictions. New South
Wales has a flat 10 or 20 per cent regional loading (Tasmania has none) — between 5 and 7
times lower than Queensland and Western Australia — despite large parts of the State being
classified as remote or very remote. Similarly, equity loadings vary markedly. As an illustration,
the loading for Aboriginal and Torres Strait Islander students is 15 per cent of course costs in New
South Wales, 50 per cent in Victoria and a flat $500 in the ACT.
Many jurisdictions’ estimates of the cost of delivery are based on historical average course costs
whose original methodologies are unclear. In New South Wales, where the methodology is
known, subsidy rates are based on 2012 data, and on the cost profile of TAFEs (which do not
have cost structures typical of the broader market). While definitive information was unavailable,
our analysis of two popular VET courses suggests that estimates of costs can have a significant
impact on the subsidies on offer (see figure below).
The methods jurisdictions use to apply subsidies to courses vary, including in their complexity.
New South Wales, for example, determines average course subsidies by field of education. In
contrast, Victoria determines average course subsidies using an industry classification.
Jurisdictions also have different ways of grouping subsidised courses for the purposes of
signalling their priority. For example, Queensland has three groups (with subsidy rates ranging
from 50 to 100 per cent of course costs) and Western Australia has five groups (for example,
Priority Industry Qualifications, Diploma and above and Targeted fee relief).
Subsidy schedules for two Certificates ($)a,b
a These comparisons are for illustration. Due to the varied nature of information on subsidies some jurisdictions’
data have been supplemented with TAFE data and amounts may not be directly comparable. b These
comparisons are for an Aboriginal or Torres Strait Island Student living in a regional or remote location.
0
1,000
2,000
3,000
4,000
5,000
6,000
7,000
8,000
9,000
Certificate III in Business
0
2,000
4,000
6,000
8,000
10,000
12,000
14,000
Certificate III in Individual Support
Regional/remote loading ATSI loading Concession (ATSI)Base subsidy
22 NASWD REVIEW
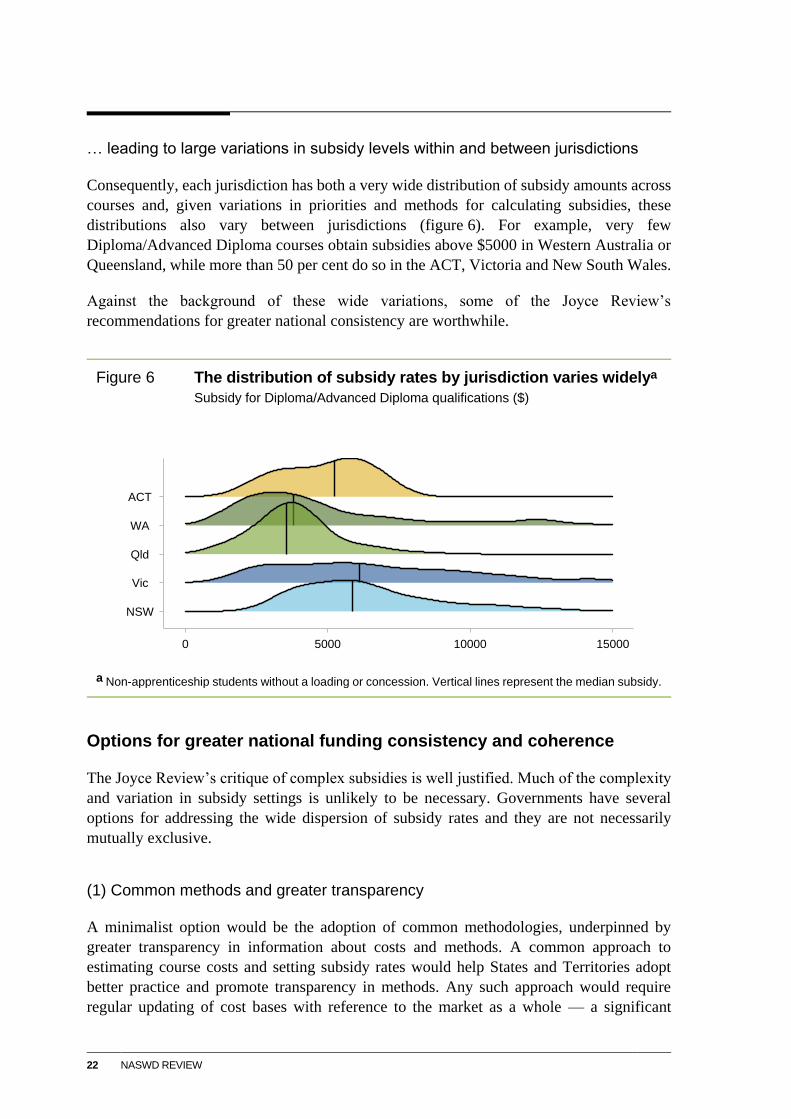
… leading to large variations in subsidy levels within and between jurisdictions
Consequently, each jurisdiction has both a very wide distribution of subsidy amounts across
courses and, given variations in priorities and methods for calculating subsidies, these
distributions also vary between jurisdictions (figure 6). For example, very few
Diploma/Advanced Diploma courses obtain subsidies above $5000 in Western Australia or
Queensland, while more than 50 per cent do so in the ACT, Victoria and New South Wales.
Against the background of these wide variations, some of the Joyce Review’s
recommendations for greater national consistency are worthwhile.
Figure 6 The distribution of subsidy rates by jurisdiction varies widelya
Subsidy for Diploma/Advanced Diploma qualifications ($)
a Non-apprenticeship students without a loading or concession. Vertical lines represent the median subsidy.
Options for greater national funding consistency and coherence
The Joyce Review’s critique of complex subsidies is well justified. Much of the complexity
and variation in subsidy settings is unlikely to be necessary. Governments have several
options for addressing the wide dispersion of subsidy rates and they are not necessarily
mutually exclusive.
(1) Common methods and greater transparency
A minimalist option would be the adoption of common methodologies, underpinned by
greater transparency in information about costs and methods. A common approach to
estimating course costs and setting subsidy rates would help States and Territories adopt
better practice and promote transparency in methods. Any such approach would require
regular updating of cost bases with reference to the market as a whole — a significant
NSW
Vic
Qld
WA
ACT
0 5000 10000 15000
OVERVIEW 23
departure from current practice. Common approaches do not mean common outcomes, as
cost-reflective base costs and loadings may vary between jurisdictions. Similarly, there are
good grounds for using consistent methods to determine skills shortages, which are a major
determinant of the eligibility of courses for subsidies. These would still take into account the
regional dimensions of shortages. A prime function of the Australian Government’s National
Skills Commission (due to be formally established in July 2020) will be to develop these
more consistent methods.
An advantage of this minimalist approach is that it would leave jurisdictions to make their
own policy judgments about subsidy settings and the courses and student groups they wish
to support, while addressing the methodological quirks that lead to unjustified variations.
(2) Streamlining subsidies
As finely calibrated subsidy rates are unlikely to sway student choices or reflect real
differences in the public/private returns from different courses, there are strong grounds for
simplifying subsidies.
Simplification could take various forms, including:
(a) a single subsidy rate for all courses on a skills/priorities list, set as a constant percentage
of course costs. This approach would not affect relative prices between courses
(b) a flat dollar subsidy for all courses on the skills/priority list. While very simple, this
would mean that students would pay a higher share of the costs for high-cost courses,
which may be seen as inequitable. It could also mean that the subsidy could exceed the
cost of a course. Unless the student was able to pocket the difference, this would
discourage students from seeking value for money
(c) a small set of subsidies whose values would be a share of the average (or efficient) cost
of delivering groups of similar courses.
In each case, States and Territories would (in line with the subsidiarity principle) still decide
on the rates for their own jurisdictions and the eligibility criteria for subsidised courses.
Loadings for the higher costs of teaching some groups of students would still apply, as would
concessions.
(3) National determination of subsidy rates?
As recommended by Joyce, a more significant change would be to apply the approach (c)
above, but using the same subsidy rate for all jurisdictions and with the costs of each group
of courses based on the average national cost of delivery. Loadings would provide additional
funding for the costs of provision in regional Australia and for some groups of students. State
and Territory governments would be bound by these nationally consistent subsidy levels, but
would be free to decide how many subsidised places to offer.
24 NASWD REVIEW
This recommendation would have the virtue of simplifying subsidy rates and making their
derivation transparent. In a workably competitive market, it would create strong incentives
for RTOs to minimise costs.
However, national consistency per se is not always a virtue. State and Territory governments
would lose the capacity to vary subsidy rates to meet the needs of their local labour market
or their social policy objectives. Governments would not have the option of changing
subsidy rates (including loadings) to fund more student places (possibly at lower unit cost),
or to determine the levels of support and eligibility for concessions for students facing
disadvantage.
Regardless of whether there is a national agreement that binds parties to consistent subsidy
levels, the analytical work by the National Skills Commission on a common national
approach to determine costs (as discussed under option 1 above) will be useful to the States
and Territories.
(4) Vouchers?
State and Territory governments provide subsidies to RTOs. An alternative would be to
allocate the funding to students as a voucher-style entitlement. Vouchers would support user
choice and should make providers more responsive to their customers. The value of the
voucher would be equivalent to some or all of the subsidy that would otherwise have been
provided to RTOs.
In some jurisdictions, like New South Wales, student places for subsidised courses are capped.
Where places are capped, introducing vouchers would be more complex as their numbers
would have to be limited to replicate the outcome of direct rationed funding of RTOs.
Vouchers could be allocated to students satisfying eligibility criteria (such as some measure
of likely success in the occupation), but would be unlike universally available vouchers.
While capping may be justified because of budget constraints or the desire to limit
enrolments in occupations, it also raises an equity issue. Capping means that students
studying the same subject could face different net fees, depending on whether they had
access to the subsidy before caps were exceeded. The materiality of this issue is unclear,
and, in any case, the same problem already applies to students who must pay full fees if they
fail to secure a capped place.
(5) Pricing and student fee regulations can have unintended adverse impacts
Governments differ in how stringently they control student fees and prices paid to RTOs for
subsidised courses, reflecting different views on quality and service delivery risks. New
South Wales and Western Australia regulate most heavily by fixing student fees for all
qualifications (allowing neither lower or higher fees). In that case, the payment to the RTO
OVERVIEW 25
— the ‘price’ of the service — is entirely regulated as the subsidy level is also set.
(Queensland sets some student fees, but only for apprenticeship courses).
Other jurisdictions do not set student fees for most courses, although RTOs in Queensland,
South Australia, Tasmania and the ACT must charge a (modest) minimum student fee so
that students have ‘skin in the game’. This sensibly aims to reduce the risk of fraudulent
conduct by RTOs (for example, giving inducements to students to undertake training while
supplying low-quality services, so maximising the value of the subsidy) and encourages
students to choose their training carefully.
However, beyond a requirement to have a student fee, regulated prices and student fees can
have perverse impacts because they reduce the ability of RTOs to differentiate based on
quality and mode of delivery. For example, price regulations do not prevent RTOs from
reducing quality, but they can prevent them from delivering higher-quality training at a
higher price or delivering high-quality courses at lower than capped prices, as is the case in
New South Wales.
Consequently, there are good grounds for the New South Wales and Western Australian
Governments to remove price regulations (and for the Queensland Government, its price
control of apprenticeship courses). The risks of excessive student fees would be mitigated
through the provision of information to students and possibly some initial price monitoring.
(6) A bigger role for loans?
Course subsidies have overly elaborate designs, do not apply for many courses, have only
partial effectiveness in increasing overall VET enrolments and changing students’ course
choices, and involve large government outlays. By contrast, income contingent loans have
promising features that suggest they could play — if robustly designed with effective
integrity safeguards — a larger role in government funding of the VET system:
loans address the difficulty many students face in paying upfront for VET (upfront
payments are still required for many courses)
loans directly target the market failure that credit is not available for uncertain investment
in human capital
students receive a signal that training is a long-term investment
the contingent nature of loans means they do not have adverse equity effects if training
does not deliver its expected dividends
the long-term fiscal costs of loans should be less than subsidies
loans give students a portable entitlement that promotes user choice
clearly disclosed loans require ‘skin in the game’ from students who will have stronger
incentives to choose efficient, lower priced RTOs and to choose suitable qualifications
and courses
26 NASWD REVIEW
loans allow students to choose based on their preferences and on the likely benefits of
courses and careers.
The widespread rorting of VET FEE-HELP has obscured these intrinsic advantages, but
these failures were a symptom of poor policy design and implementation, rather than a
failure in the concept.
Current income contingent VET Student Loans (VSL) provided by the Australian
Government have many strong (and justified) protections against rorting, but the focus on
preventing malfeasance and reducing fiscal risks may have undermined the key role of loans
in providing affordable access to training. VSL is bound by complex restrictions and poorly
targeted and burdensome administration. In its current form, not only does VSL limit access
to loans for many students, but it has adverse effects on incentives. It may push students into
the higher education system or from more costly VET courses to cheaper ones, although
neither of these destinations may suit their preferences and capabilities. VSL may also affect
the behaviour of VET providers. Some do not apply for access to VSL as arrangements are
too compliance heavy. Others may change the quality and type of courses they deliver so
that VSL caps do not bind (or not by much).
There are four broad policy options that could enable VSL to better meet its objectives.
Regardless of more significant reform directions for VSL, there are reasonable grounds to
streamline administrative and compliance arrangements so that they are less burdensome for
low-risk RTOs.
The VSL program’s significant restrictions on eligible courses appear arbitrary and lack a
clear rationale, which suggests the scope for ending them. A course is only eligible for VSL
if it is subsidised by at least two States and Territories, or is a science, technology,
engineering or mathematics course, or is tied to licensing requirements for a particular
occupation. The consequence is that about one third of the total number of accredited courses
at the Diploma or higher level are ineligible for VSL (while the more general restrictions on
lower-level qualifications mean that none of these are eligible).
The current restriction that the VSL program is only available to students studying some
Diploma or higher-level qualifications could be relaxed to extend income contingent loans
(ICLs) to lower level qualifications, particularly Certificates III and IV. Many students
studying lower-level qualifications face fees of thousands of dollars without recourse to a
loan — an obstacle to training for some, and out of kilter with the loans available in the
higher education sector.
While loan caps may be an effective measure to counter the risk of misconduct by, and lack of
competition between, RTOs, their levels may not be justified. In particular, the lower the cap,
the more it undermines the purpose of loans to provide finance for students finding student
fees unaffordable, especially for students who might have to train in the fee-for-service market
and who are disadvantaged. Given the other measures now in place that can address
OVERVIEW 27
misconduct and excessive pricing, an option is to raise what appear to be excessively stringent
caps. Such an option could still require a student to pay something upfront.
A reform agenda for VSL could choose any combination of the above possible changes to
the current framework. Table 2 presents one such spectrum. A conservative option would be
to relax course restrictions, which would make all Diplomas/Advanced Diplomas eligible
for loans, increasing access to loans and reducing students’ upfront costs. A further step
would be to widen eligibility to students studying Certificate III/IVs. The most far-reaching
initiative would be to allow access to VSL for all students in nationally recognised training
programs. In that instance, the quid pro quo for the Australian Government’s exposure to
greater loan liabilities would be its withdrawal from (or reduction in its) funding through its
agreement with the States and Territories.
Moreover, any expansion of governments’ funding of the VET system may be best
undertaken through a greater reorientation to loans rather than more subsidies.
The benefits of reforms could be significant. Extending loans to new groups of students
would help make training more affordable, increasing the uptake of qualifications and
diversity of choice.
A challenge in redesigning VSL is the shadow cast by the scarring experiences of the
widespread rorting of VET FEE-HELP, with its costly impacts on thousands of students, the
Australian Government and the reputation of the entire sector. Accordingly, any expansion
of loans in the VET sector would have to be accompanied by effective regulation of course
quality and the market conduct of RTOs — many of which are already a feature of the
existing VSL — and accessible and relevant information on courses for students.
To the extent that the Australian Government is concerned to further moderate risks, it could
include some course restrictions where the risks were deemed high. For example, the Business
Council of Australia and the Australian Industry Group recommended a black list approach
(that is, the Government would nominate ineligible course loans), leaving remaining courses
eligible for loans. Similarly, the Australian Government could set a transition path to a less
restrictive system, testing risk as caps and qualification restrictions are lifted.
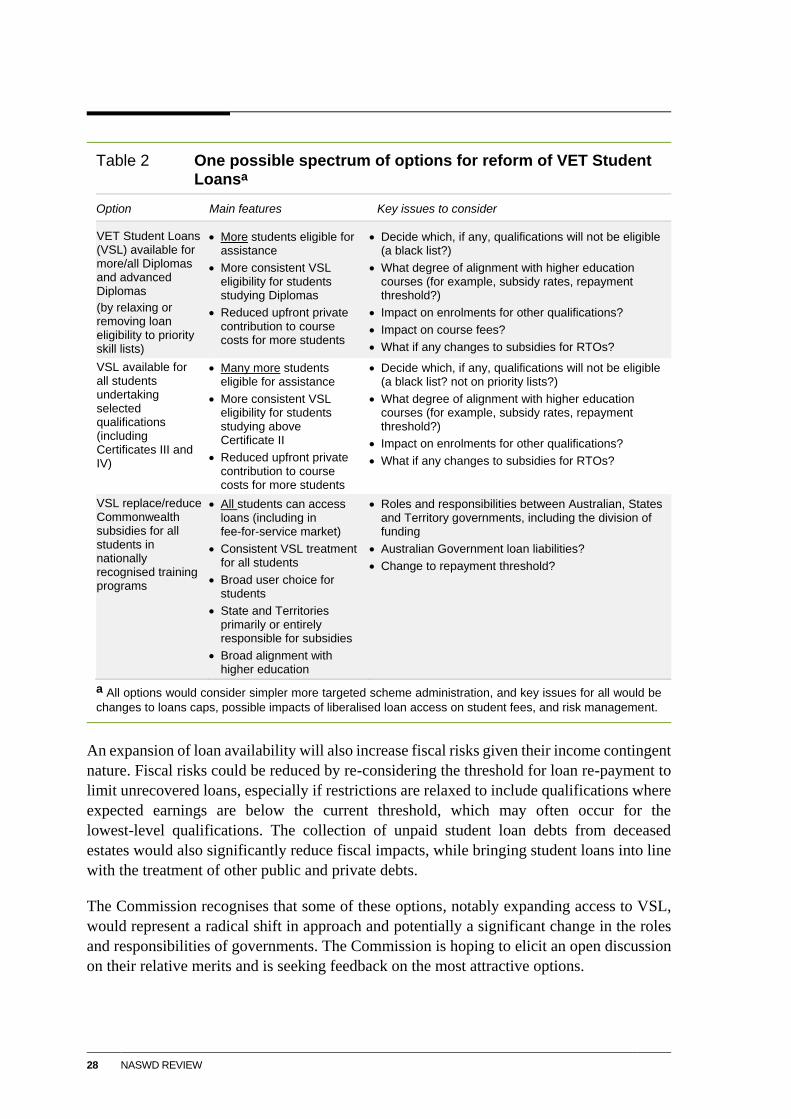
28 NASWD REVIEW
Table 2 One possible spectrum of options for reform of VET Student Loansa
Option Main features Key issues to consider
VET Student Loans (VSL) available for more/all Diplomas and advanced Diplomas
(by relaxing or removing loan eligibility to priority skill lists)
More students eligible for assistance
More consistent VSL eligibility for students studying Diplomas
Reduced upfront private contribution to course costs for more students
Decide which, if any, qualifications will not be eligible (a black list?)
What degree of alignment with higher education courses (for example, subsidy rates, repayment threshold?)
Impact on enrolments for other qualifications?
Impact on course fees?
What if any changes to subsidies for RTOs?
VSL available for all students undertaking selected qualifications (including Certificates III and IV)
Many more students eligible for assistance
More consistent VSL eligibility for students studying above Certificate II
Reduced upfront private contribution to course costs for more students
Decide which, if any, qualifications will not be eligible (a black list? not on priority lists?)
What degree of alignment with higher education courses (for example, subsidy rates, repayment threshold?)
Impact on enrolments for other qualifications?
What if any changes to subsidies for RTOs?
VSL replace/reduce Commonwealth subsidies for all students in nationally recognised training programs
All students can access loans (including in fee-for-service market)
Consistent VSL treatment for all students
Broad user choice for students
State and Territories primarily or entirely responsible for subsidies
Broad alignment with higher education
Roles and responsibilities between Australian, States and Territory governments, including the division of funding
Australian Government loan liabilities?
Change to repayment threshold?
a All options would consider simpler more targeted scheme administration, and key issues for all would be
changes to loans caps, possible impacts of liberalised loan access on student fees, and risk management.
An expansion of loan availability will also increase fiscal risks given their income contingent
nature. Fiscal risks could be reduced by re-considering the threshold for loan re-payment to
limit unrecovered loans, especially if restrictions are relaxed to include qualifications where
expected earnings are below the current threshold, which may often occur for the
lowest-level qualifications. The collection of unpaid student loan debts from deceased
estates would also significantly reduce fiscal impacts, while bringing student loans into line
with the treatment of other public and private debts.
The Commission recognises that some of these options, notably expanding access to VSL,
would represent a radical shift in approach and potentially a significant change in the roles
and responsibilities of governments. The Commission is hoping to elicit an open discussion
on their relative merits and is seeking feedback on the most attractive options.
OVERVIEW 29
Links between funding options
Some of the above options are substitutes for each other, while others are not mutually
exclusive and could be pursued simultaneously. Regardless of whether governments
streamline subsidies (option 2) or develop a nationally consistent approach to subsidies
(option 3), governments should use common methodologies (option 1) and address pricing
distortions (option 5). Vouchers (option 4) could be a feature of any subsidy system,
regardless of the choices between options 1 to 3. Similarly, while there would be grounds
for reducing the weight given to course subsidies, changes to loans (option 6) could coexist
with any subsidy arrangement.
7 Other measures to improve national consistency
Streamlining of training packages
While the streamlining ambitions of the COAG Skill Council’s draft VET Reform Roadmap
are good, they should be widened, particularly in relation to the timeliness of training
package updates.
The process of developing, updating and endorsing training packages is cumbersome and
rigid, as it requires vetting by multiple parties. To change a training package, each industry
board (called Industry Reference Committees) must obtain the approval of the Australian
Skills Industry Committee before new training package contents can be developed. Once
training package changes are developed, the Industry Reference Committees need the
Australian Skills Industry Committee’s approval for every change before the training
packages are endorsed by the COAG Skills Council. This approval process ensures that
governments have oversight of all training package changes but adds months to the timeline
to update training packages.
These problems could be addressed by devolving approval processes to the Industry Reference
Committees — which can act more quickly — where changes are minor and uncontroversial.
Completing the shift to a single regulator
Stakeholders in this and other reviews have stressed that regulatory arrangements do not
work seamlessly where there are multiple potential regulators. For instance, there is often
confusion among training organisations about whether they need to report to ASQA or the
Victorian regulator and whether ASQA and the other regulators interpret the standards in the
same way. Other stakeholders pointed to difficulties students have in knowing where to
lodge complaints about providers.
Many of the concerns about moving Victoria and Western Australia to a single regulator can
be managed. States and Territories would still be able to respond to local training needs.
30 NASWD REVIEW
ASQA accredits courses where there are demonstrated needs that are not serviced by existing
training products, and States and Territories use other mechanisms such as funding to
address local needs.
The Commission supports the recommendations of previous VET reviews, including those by
Joyce and Braithwaite, that Victoria and Western Australia move their regulatory responsibilities
to ASQA to reduce confusion and ensure all RTOs are held to the same standard.
8 Changes to government support for apprenticeships
While there has been considerable streamlining of Australia’s apprenticeship system, there
is room for more far reaching reform, particularly to re-assess the merits of current
government incentives to employers to train apprenticeships. There is little evidence that
incentive payments to employers to train trade apprentices have been effective in increasing
enrolments. These payments offset only a small share of the total costs to employers of taking
on a trade apprentice. The Commission estimates that the Australian Government’s
employer incentives (which have remained fixed in nominal terms for many years) account
for less than 2 per cent of the full costs of hiring, remunerating and training a trade
apprentice. In contrast, financial incentives initially boosted non-trade apprenticeships
(trainees), although with questionable benefits, if any, for genuine skill formation as much
of the upturn was in areas deemed to be low priority and was associated with rorting. Policies
have now tightened access to traineeships.
This experience implies that large incentive payments to employers would be needed to
significantly increase the number of trade apprentices, suggesting that alternative options
could be pursued.
One option — which could be combined with all others — is to address barriers to hiring
apprentices, including their foundational skills, work readiness, and the minimum wages or
other award conditions set by the Fair Work Commission. For instance, the business sector
often expresses concern that many young people do not have sufficient numeracy or literacy
skills to undertake an apprenticeship.
The evidence, supported by research here and overseas, also suggests that a more
cost-effective alternative to employer-based incentive payments, or a complement to them,
would be support services for employers and apprentices, such as mentoring and pastoral
care for apprentices.
In principle, industry training levies could also play a larger role in funding apprenticeships
— as widely used in State and Territory schemes in the construction industry. Levies
overcome the problem that a non-training employer can free-ride on the training efforts of
others (‘poaching’). The overall empirical evidence about the materiality of poaching as a
problem demanding a policy solution is mixed, as is evidence about the effectiveness of
OVERVIEW 31
levies. We are seeking feedback on where levies or other incentives might play a greater role
in funding apprenticeships, if at all, and their appropriate design and implementation.
To the extent that employer incentives continue, they should be subject to further
coordination and simplification given the confusing array of measures and eligibility
conditions. Better navigation services provided through the Australian Government’s
Apprenticeship Support Network would be an option.
Complex eligibility criteria for Australian Government support for apprentices could be
eliminated by providing incentives to all trade apprentices regardless of their tenure in the
business and removing the requirement that a skill be on the National Skills Needs List. This
would recognise the trade-offs between targeting and administrative simplicity. Current
targeted arrangements for trainees, where incentives for existing workers relate only to
caring occupations, should be retained to avoid subsidising training activities that have little
effect on skill augmentation.
9 Subsidising public providers may violate
competitive neutrality principles
Public providers receive payments besides course subsidies. States and Territories do not
fully disclose the value or use of these payments; nevertheless, these payments may be
distorting competition between public and private providers. Funding higher-cost public
providers outside competitive processes will diminish returns from the public funds invested
in training.
Some participants have raised several rationales for preferential funding for public providers,
including servicing thin markets, maintaining certainty of supply, servicing particular student
cohorts, and general community service activities. However, existing course subsidies already
provide additional payments for particular student groups and allow for regional variation in
costs. Moreover, if there are additional community service obligations, public provision is not
necessarily the only or best option. At face value, governments should fund public providers
based on explicit, transparent community service obligations (which should be subject to
market testing and contestability rather than simply earmarked for TAFEs).
10 The power of information
Better information for better choices
The Australian Government created the National Careers Institute in 2019 to improve the
quality of career development services and provide more useful information to students. The
outstanding task is to fill information gaps on course prices, career opportunities, the
availability of government financial support and the performance of individual RTOs.
Information should be tested with students and employers to ensure that it is salient, trusted
32 NASWD REVIEW
and interpreted correctly. To be even more useful for students, all governments should work
together to ensure the Institute becomes a central information hub.
Data and analysis for assessing the impact of VET policies
The assessment of the effectiveness and public value of VET policies is central to
accountability and improving system design. As noted above, the performance metrics used
in the NASWD have generally been deficient.
Any performance indicators should be valid, reliable, easily collected, and timely.
Nevertheless, while such indicators can provide useful diagnostics and benchmarks to
monitor the system, they do not shed light on causality. Systematic policy evaluation —
beyond the measurement of system performance — is required to assess what works,
including how policy actions have contributed to outcomes.
A strong evidence base is essential to support evaluation, which is hampered by deficiencies
in the collection and publication of information on VET funding, including where funding
for VET delivery is spent, whether funding programs are meeting their objectives, and the
broader impacts of spending on system outcomes. This is a major deficiency and addressing
it is critical to support governments’ and other parties’ assessments of the effectiveness of
governments’ stewardship of the VET system. The Commission has experienced first-hand
a reluctance by many jurisdictions to provide the information that would allow a
comprehensive review of the NASWD. There is an immediate imperative for improved
disclosure of information as well as its collection in the first place.
11 New agendas and frameworks
The disruption of COVID-19 has thrown into sharper relief the potential for new platforms
for learning, including the possibility for entirely online acquisition of some skills. That
raises questions about arrangements that might facilitate subsidy payments by one
jurisdiction to an RTO in another, or indeed, in a more radical re-working of the system, to
reputable providers internationally. A new agreement and other VET policies might
therefore need to support new national delivery models (and associated quality assurance
and funding arrangements).
For example, massive open online courses (MOOCs) are seen as the province of the higher
education sector, a preconception that should be open to challenge. MOOCs (and
gamification) have the advantage that it becomes economic to make large upfront
investments in high quality and engaging ways of transmitting skills, with very low
incremental access costs for students.
This feature of online delivery has several implications for delivery and pricing. For
example, subsidies could be paid to meet the fixed costs of such online approaches, with
OVERVIEW 33
near zero pricing given that use of such courses by any one student does not limit its use by
another. Such provision is time agnostic and so can suit people of older ages already in jobs,
for whom time away from work is an impediment to further training. In 2016-17, the two
main obstacles to undertaking work-related training was too much work/not enough time
(45 per cent of people who want to do more training) and financial reasons (26 per cent) —
which are partially alleviated by this new model for provision. Moreover, this model also
increases the scope for variety. In a traditional model of training, variety is costly because
the number of students who might access training through a local training provider becomes
smaller with higher degrees of specificity of a course or unit of competency — a problem
that does not exist where costs can be spread across large numbers of students across a nation
(or globally).
The seeming Achilles heel of such models of training is accreditation. However,
accreditation and knowledge provision could be unbundled — as is the case for drivers’
licenses. Governments’ role would be to develop reputable certification models where these
were not already available. (Businesses sometimes already provide quality certification, as
in Microsoft’s exams for certifying IT skills relevant to its platforms.) There may be potential
to introduce independent accreditation for non-online courses too. This would have the
added advantage of providing greater certainty about training standards to employers and
students, increasing the incentives for training providers to supply high quality services,
spurring competition and reducing the demands on ASQA.
The degree to which new platforms for learning are practical is only partly tested. For example,
online delivery is not suitable for many courses (such as when competency in using equipment
is an essential part of skills acquisition). Many students may prefer face-to-face contact.
Similarly, independent accreditation may be too administratively costly for many courses.
The Commission is seeking feedback on new ways in which people could acquire skills and
their policy implications.

INTERIM FINDINGS AND DIRECTIONS 35
Interim findings, reform directions and
information requests
Progress against the NASWD
Performance framework
INTERIM FINDING 2.1 — NASWD PERFORMANCE FRAMEWORK
Governments’ targets on skills formation will not be met. Progress against other
performance measures, such as employer satisfaction and improvements in
employment and education status, is mixed.
Assessing the NASWD’s reform directions
INTERIM FINDING 2.2 — GOVERNMENT-FUNDED VET PARTICIPATION
Key reforms under the NASWD — the national training entitlement and expansion of
student loans (VET FEE-HELP) — initially increased participation but incentives were
later wound back because of escalating costs and rorting. Overall participation rates are
now at or below pre-NASWD levels.
INTERIM FINDING 2.3 — VET MARKET COMPETITION AND EFFICIENT TRAINING DELIVERY
Early efforts to promote a ‘more open and competitive training market’ have stalled.
Improving the efficiency of training markets is no longer an explicit priority for most
governments.
Further work is required by governments on the policy settings that best facilitate a
responsive and efficient training market. This includes a more clearly defined role for
public providers.
36 NASWD REVIEW
INFORMATION REQUEST — ROLE OF COMPETITION IN THE VET MARKET
What role should competition play in meeting users’ needs, including the quantity,
type and quality, and regional accessibility of VET services?
How should the efficiency of the VET market be measured?
What is the appropriate (and exclusive) role of public providers, and why?
Are additional consumer protection arrangements required to support a
well-functioning VET market? What are the costs and benefits of different models of
consumer protection established by governments, including ombudsmans’ offices?
INTERIM RECOMMENDATION 2.1 — INFORMATION ON VET SYSTEM PERFORMANCE
Australian, State and Territory governments should develop improved performance
measures to provide a more complete picture of system performance. Any future
sector-wide performance framework should better measure:
total VET activity
the contribution of VET to developing the foundation skills of Australians
skills obtained through the VET system when students do not complete a course
students’ longer-term labour market outcomes.
INFORMATION REQUEST – CAREER GUIDANCE FOR STUDENTS
What changes could be made to ensure school students have appropriate career
information and advice?

INTERIM FINDINGS AND DIRECTIONS 37
A new agreement to guide policy
INTERIM FINDING 2.4 — THE NASWD NEEDS REPLACEMENT
The NASWD is overdue for replacement. Governments have stepped back from several
key policy aspirations. The performance framework has limited value for assessing the
functioning of the VET system. Its targets have not been met and some performance
indicators have proved to be deficient.
Some principles of the NASWD remain pertinent for a future intergovernmental
agreement, including equitable access to training and contestability. Reforms are still
needed to give students better information, increase user choice, improve quality
assurance, and create a more interconnected education and training system.
Many of the principles in the Intergovernmental Agreement on Federal Financial
Relations, including recognising the Australian Government’s interest in areas
traditionally the responsibility of State and Territory governments, clarifying all
governments’ roles, and allowing State and Territory governments flexibility in the use
of grants, are a sound basis for negotiating any new agreement.
INTERIM RECOMMENDATION 2.2 — A NEW PRINCIPLES-BASED AGREEMENT
Australian, State and Territory governments should negotiate a new, principles-based
intergovernmental agreement. Such an agreement should commit governments to
developing an efficient, competitive market driven by the informed choices of students
and employers. The agreement’s principles should include:
centring policy on the consumer, including information provision for informed choice
equitable access
recognition of fiscal sustainability and the stability of funding
transparency about where funding is allocated, including detailed information on
course subsidies, costs and the size and nature of funding to public providers
efficient pricing and delivery
designing incentives to increase the likelihood of eliciting training
competitive neutrality between public and private provision
neutral, but not equivalent, treatment of the VET and higher education sectors.
38 NASWD REVIEW
INFORMATION REQUEST — DESIGNING A NEW INTERGOVERNMENTAL AGREEMENT
If a new principles-based agreement was negotiated in line with interim
recommendation 2.2:
how should it consider other educational sectors, informal training and
non-government funded training?
what other mechanisms to facilitate reform and improve accountability would best
complement an agreement?
Governments’ funding of VET
Rationales for investment
INTERIM FINDING 3.1 — PUBLIC AND PRIVATE RETURNS TO VET
There are significant private and public economic returns to VET, with returns larger for
Diploma and Advanced Diploma VET courses.
There are also indirect benefits — such as reduced crime and intergenerational
economic mobility — which may be greatest for lower-level VET qualifications.
INTERIM FINDING 3.2 — ALIGNED TREATMENT OF VET AND HIGHER EDUCATION
The use of subsidies in the university system provides a robust efficiency and equity
rationale for subsidies in the VET system.
However, given the public benefits and aims of the VET and higher education systems
differ, subsidy rates do not need to be identical in the two sectors for all occupations and
fields.
INFORMATION REQUEST — IDENTIFYING AND ACTING ON SKILLS SHORTAGES
What are useful ways of defining and measuring the skills shortages (and surpluses)
relevant to the VET sector?
What factors are causing an apparently persistent shortage of skilled workers in some
occupations, despite these occupations being a priority for government support?
To what extent are skills forecasts based on future industry growth a useful and
reliable basis for providing course subsidies?
In what circumstances do skills shortages justify course and employer subsidies and
at what level of granularity?
INTERIM FINDINGS AND DIRECTIONS 39
The mechanics of subsidising VET courses
INTERIM FINDING 4.3 — JURISDICTIONS’ APPROACHES TO SUBSIDISING COURSES
State and Territory governments share the same goal that subsidies should increase
participation in training, particularly by students facing disadvantage and in skill areas in
short supply or with other public benefits. All take the same key steps in setting subsidies
and managing subsidised services.
However, there is significant variation in policy priorities and the approaches used to
determine which courses receive subsidies, and in overseeing course costs and student
fees. Consequently, subsidies and student fees for the same courses can vary widely
across Australia.
The effects of different settings on the behaviour of students and training providers are
poorly understood.
INTERIM FINDING 4.1 — DATA UNDERPINNING SUBSIDY RATES
Data used to estimate course costs (which inform subsidy rates) are dated in most
States and Territories and are not a sound basis for setting subsidies.
INTERIM FINDING 4.4 — LACK OF TRANSPARENCY IN SUBSIDY SETTING
There is a general lack of transparency on subsidy- setting processes and the rationales
for subsidies. There is also a lack of transparency on course costs faced by students.
This transparency deficit adversely affects the ability of students and training providers
to make informed decisions on investment in training.
INTERIM FINDING 4.2 — PRICE CONTROLS ARE INEFFICIENT
Fixing student fees can stifle competition, inhibit allocative efficiency and reduce
incentives to improve the quality of training.
There are more direct instruments to address issues of quality management, information
asymmetries and budget control.
40 NASWD REVIEW
Options for funding and pricing reform for course subsidies
OPTION 6.1 — SCOPE FOR MORE NATIONALLY-CONSISTENT COURSE SUBSIDIES
Australian, State and Territory governments should consider:
adopting a nationally consistent set of course subsidies, based on the efficient cost
of delivery for groups of similar courses, with loadings to address higher delivery
costs in some locations and to some student groups (as in the Joyce Review); or
simplifying the large number of different subsidy rates for courses but otherwise
leaving jurisdictions to set their own subsidy rates and their allocation.
INFORMATION REQUEST — SIMPLIFICATION OF SUBSIDY GROUPINGS
In judging the relative merits of alternatives in option 6.1:
how should subsidy groupings be simplified?
what criteria should be used to bundle courses and set subsidy rates?
what are the trade-offs between the greater simplicity of adopting nationally
consistent subsidies and the reduced discretion for jurisdictions?
INTERIM RECOMMENDATION 6.1 — COMMON METHODS FOR COSTING
State and Territory governments should use common methods to measure costs and
determine loadings.
OPTION 6.2 — CONSISTENT METHODS FOR ASSESSING SKILLS SHORTAGES
Australian, State and Territory governments could consider adopting consistent
approaches to the determination of skills shortages, while taking account of variations
in local labour markets, with this task undertaken by the National Skills Commission.
OPTION 6.3 — SWITCHING FROM SUPPLIER TO CUSTOMER SUBSIDIES
State and Territory governments could consider re-configuring subsidies paid to RTOs
as student vouchers, with the voucher value depending on the method used to calculate
subsidies as specified in option 6.1.
INTERIM FINDINGS AND DIRECTIONS 41
INFORMATION REQUEST — IMPACTS OF VOUCHERS
In judging option 6.3:
how would vouchers be provided for courses with capped places?
what impacts would vouchers have on effective competition?
what are the risks of vouchers?
INTERIM FINDING 6.1 — WELL-DESIGNED VET STUDENT LOANS IMPROVE AFFORDABILITY
Poor design, rather than poor policy justification, was the source of the rorting of
VET FEE-HELP. A well-designed VET student loan scheme can improve affordability
and access to VET courses with few fiscal risks to government.
OPTION 6.4 — A LARGER ROLE FOR INCOME CONTINGENT LOANS
Income contingent loans have significant advantages. Governments should consider
making VET Student Loans available for a wider range of qualifications. Current
restrictions — by AQF level or inclusion on a skill/priority list — could be relaxed to
support greater user choice and participation, as could loan caps.
The degree to which restrictions should be relaxed should be based on risks, costs and
administrative complexity.
Widening access to loans should largely maintain the existing strong regulations that
reduce risks associated with loans, but could also include the adoption of a ‘black list’
that identifies courses ineligible for loan support, setting a transition path to a
less-restrictive system, testing risk as caps and course restrictions are lifted, and
reducing the income thresholds for loan repayment.
42 NASWD REVIEW
INFORMATION REQUEST — IMPLEMENTING AN EXPANDED LOANS SCHEME
If VET Student Loans (VSL) were expanded in line with option 6.4:
to what degree and where should restrictions on the VSL scheme be eased?
what would be the costs and benefits (to governments and students) of:
– removing course list restrictions?
– expanding the VSL scheme to Certificate-level qualifications?
– re-orienting the role of the Australian Government from a direct funder of the VET
system to an issuer of income contingent loans to all students in nationally
recognised training programs?
– changing the loan caps?
what would be the appropriate roles and responsibilities of Australian, State and
Territory governments in the VET system if the prime responsibility of the Australian
Government was to extend VSL rather than provide subsidies?
which parts of the VSL administration and reporting requirements are most
burdensome?
what aspects of a system architecture and settings may need to be in place to reduce
risks, assure quality and support the operation of a well-functioning market, including
consideration of ‘black lists’, repayment thresholds, and recovery of unpaid debt from
deceased estates?
INTERIM RECOMMENDATION 6.2 — PRICE CONTROLS SHOULD BE REMOVED
Governments should not cap the prices of VET courses.
INTERIM FINDINGS AND DIRECTIONS 43
Trade apprenticeship and traineeship incentives
OPTION 6.5 — SUPPORTING TRADE APPRENTICESHIPS
Given the apparently poor effectiveness of employer incentives, the Australian and State
and Territory governments could consider:
addressing barriers to hiring apprentices, including their foundational skills, work
readiness and the minimum wages or other award conditions set by the Fair Work
Commission
reintroducing (better-designed) industry levies.
Consideration of these options should take into account the effectiveness of any
measures to strengthen pastoral, mentoring and other support services for VET students
in general (options 6.6 and 7.3).
INFORMATION REQUEST — IMPLEMENTING NEW SUPPORT ARRANGEMENTS FOR TRADE
APPRENTICESHIPS
In assessing the merits of option 6.5:
does the nature and size of the ‘apprenticeship problem’ merit new policy measures?
how significant is ‘poaching’ as a problem that would justify industry levies?
how effective are levies in increasing apprenticeships?
are there other reasons for using industry levies?
how would the problems of administrative complexity for some existing levies be
addressed?
INTERIM FINDING 7.1 — STREAMLINING APPRENTICESHIPS
Governments have made progress in harmonising and streamlining the apprenticeship
system but there is scope to further simplify arrangements for student support and
system administration.
44 NASWD REVIEW
OPTION 7.1 — BETTER COORDINATING AND STREAMLINING INFORMATION ON APPRENTICESHIP
INCENTIVES
To better coordinate and streamline information on their multiple apprenticeship
incentives, Australian, State and Territory governments could implement one or more of
the following options:
task the Australian Apprenticeship Support Network to assist employers in
determining their eligibility for benefits offered by both the Australian and relevant
State or Territory governments
publish clearer information on all incentive payments that employers in each
jurisdiction may be eligible for
strictly delineate the roles and responsibilities for managing apprenticeship supports.
INFORMATION REQUEST — ASSESSING STREAMLINING OPTIONS
In assessing the policy alternatives in option 7.1:
what are their relative costs and benefits?
are there alternative ways to encourage governments to coordinate or streamline
their employer incentive programs?
OPTION 7.2 — STREAMLINING TRADE APPRENTICESHIP INCENTIVES
In considering how to streamline trade apprenticeship incentives, the Australian
Government could consider extending eligibility for trade apprenticeship incentives to all
workers, regardless of their tenure with the employer.
INFORMATION REQUEST — EMPLOYER INCENTIVES TARGETING DISADVANTAGED GROUPS
What are the benefits and costs of targeting disadvantaged groups for additional
incentives at the Certificate II, and Certificate III and above qualification levels?
INTERIM FINDINGS AND DIRECTIONS 45
OPTION 7.3 — IMPROVING THE AUSTRALIAN APPRENTICESHIP SUPPORT NETWORK
The Australian Government could improve apprenticeship support services by:
publishing more information on the scope of services that Australian Apprenticeship
Support Network (AASN) providers are contracted to deliver
evaluating the AASN contracts to assess how recently-revised arrangements have
affected the efficiency of service provision and outcomes for users
cooperating with State and Territory governments to jointly contract AASN providers
to better align services with local needs, as is the practice in the Northern Territory.
INFORMATION REQUEST — APPRENTICESHIP SUPPORT NETWORK SERVICE DELIVERY
In assessing the three options in option 7.3:
what types of information could the Australian Government provide to help State and
Territory governments plan their service delivery?
what is the effectiveness of the joint contracting model in the Northern Territory and
the feasibility of extending this model to other jurisdictions?
Training package development
INTERIM RECOMMENDATION 7.1 — TRAINING PACKAGE UPDATE AND APPROVAL PROCESSES
Reforms planned or underway to streamline the development and updating of training
content should address most stakeholder concerns. To further improve the timeliness of
the process, the COAG Skills Council should consider delegating to Industry Reference
Committees the power to:
commission updates to training packages where there is an industry-agreed change
to work standards or a new technology
approve straightforward, non-controversial or minor changes to training packages.
INFORMATION REQUEST — FLEXIBILITY ALLOWED BY TRAINING PACKAGES
How could the approach to developing training packages more effectively manage the
trade-offs between consistency and flexibility?
46 NASWD REVIEW
Completing the shift to a single regulator
INTERIM RECOMMENDATION 7.2 — QUALITY REGULATION
The Victorian and Western Australian Governments should ultimately follow other State
and Territory governments in referring regulation of training organisations to the
Australian Skills Quality Authority (ASQA).
In the first instance, ASQA, the Victorian Registration and Qualification Authority and
the Training Accreditation Council in Western Australia should seek to address
stakeholders’ concerns about inconsistencies and overlap in requirements between
regulators, including different interpretations of regulatory standards.
Supporting students
INTERIM RECOMMENDATION 7.3 — IMPROVING THE PROVISION OF VET INFORMATION
The National Careers Institute should extend its work on information provision to fill
significant information gaps in course prices, subsidies and RTO quality, and test that
information is salient to students, trusted, used and interpreted correctly.
Australian, State and Territory governments should work together to establish the
Institute as a central information hub.
INFORMATION REQUEST — PATHWAYS AND TRANSITIONS
The Commission seeks evidence on:
the usefulness of VET in schools in developing work-ready skills
what can be done to improve students’ awareness of credit entitlements between the
VET and higher education sectors
the extent to which time-consuming processes for credit and recognition of prior
learning are a barrier to students applying for credit
the effectiveness of programs and services aimed at assisting groups to move from
education to employment (such as Jobs PaTH, Transitions to Work and jobactive)
whether there are gaps in government initiatives aimed at improving students’
workplace-ready skills and, more broadly, transitions from education to employment.
INTERIM FINDINGS AND DIRECTIONS 47
OPTION 6.6 — PASTORAL, MENTORING AND UPFRONT ASSESSMENT SERVICES
Australian State and Territory governments could expand mentoring and pastoral
services for VET students, including those undertaking apprenticeships.
Governments should also consider the wider uptake of tools for the upfront assessment
of student needs — as used by the South Australian Government — to determine
students’ suitability for their chosen course and their need for any supports.
INFORMATION REQUEST — EVIDENCE ABOUT MENTORING AND PASTORAL SUPPORTS
How should pastoral and mentoring services be funded, delivered and designed,
taking into account the continuity of funding, scale, and effectiveness in improving
outcomes for students?
What should be their priority target groups?
Investment in public provision
INTERIM RECOMMENDATION 6.3 — IMPROVING INVESTMENT IN PUBLIC PROVISION
In making payments to publicly-owned VET providers, State and Territory governments
should:
adopt the principle of transparent disclosure in interim recommendation 2.2
ensure compliance with competitive neutrality principles
assess the efficiency and effectiveness of existing investments
undertake market testing or other options to increase the contestability of existing
obligations.
INFORMATION REQUEST — INVESTMENT IN PUBLIC PROVISION
In feedback on interim recommendation 6.3, the Commission requests information on:
the funding, monitoring and outcomes delivered under community service obligations
any changes to funding models, or other actions, that governments should undertake
to address any potential breach of competitive neutrality principles in relation to VET
services
the funding mechanism (for example, training subsidies or block funding) best suited
to efficient and effective service delivery in ‘thin markets’
how future funding arrangements to promote national consistency should incorporate
any additional (non-subsidy) funding to public providers, if at all.
48 NASWD REVIEW
New developments in the VET sector
INFORMATION REQUEST — THE CHALLENGES OF ONLINE DELIVERY
What is the scope to increase the use of fully online delivery of VET, with what
advantages, risks and policy challenges?
How should subsidy arrangements be configured for payments across jurisdictions
for online delivery of services?
What subsidy, pricing and costing approaches are appropriate for services that have
high fixed costs and low incremental costs?
To what degree could accreditation be separated from training?
What types of training are most suited to innovative models of training?
What actions would governments need to take to maximise the potential for the
adoption of innovative delivery of training or new types of training?
INFORMATION REQUEST — IMPACTS OF COVID-19
What, if any, are the likely medium and long-term impacts of the COVID-19 pandemic
on skill formation and the market in the VET sector?
To the extent that some cohorts face enduring displacement from the labour market,
particularly younger Australians, what role beyond current arrangements should VET
play in augmenting their skills and employability?
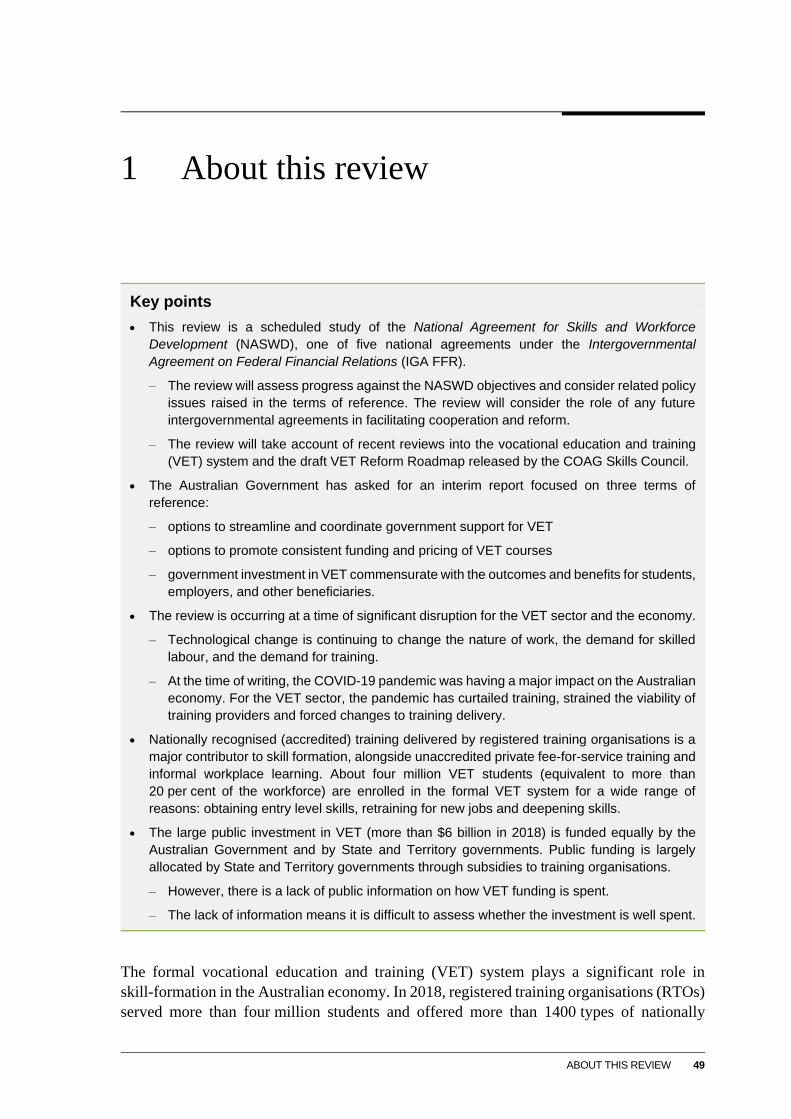
ABOUT THIS REVIEW 49
1 About this review
Key points
This review is a scheduled study of the National Agreement for Skills and Workforce
Development (NASWD), one of five national agreements under the Intergovernmental
Agreement on Federal Financial Relations (IGA FFR).
– The review will assess progress against the NASWD objectives and consider related policy
issues raised in the terms of reference. The review will consider the role of any future
intergovernmental agreements in facilitating cooperation and reform.
– The review will take account of recent reviews into the vocational education and training
(VET) system and the draft VET Reform Roadmap released by the COAG Skills Council.
The Australian Government has asked for an interim report focused on three terms of
reference:
– options to streamline and coordinate government support for VET
– options to promote consistent funding and pricing of VET courses
– government investment in VET commensurate with the outcomes and benefits for students,
employers, and other beneficiaries.
The review is occurring at a time of significant disruption for the VET sector and the economy.
– Technological change is continuing to change the nature of work, the demand for skilled
labour, and the demand for training.
– At the time of writing, the COVID-19 pandemic was having a major impact on the Australian
economy. For the VET sector, the pandemic has curtailed training, strained the viability of
training providers and forced changes to training delivery.
Nationally recognised (accredited) training delivered by registered training organisations is a
major contributor to skill formation, alongside unaccredited private fee-for-service training and
informal workplace learning. About four million VET students (equivalent to more than
20 per cent of the workforce) are enrolled in the formal VET system for a wide range of
reasons: obtaining entry level skills, retraining for new jobs and deepening skills.
The large public investment in VET (more than $6 billion in 2018) is funded equally by the
Australian Government and by State and Territory governments. Public funding is largely
allocated by State and Territory governments through subsidies to training organisations.
– However, there is a lack of public information on how VET funding is spent.
– The lack of information means it is difficult to assess whether the investment is well spent.
The formal vocational education and training (VET) system plays a significant role in
skill-formation in the Australian economy. In 2018, registered training organisations (RTOs)
served more than four million students and offered more than 1400 types of nationally
50 NASWD REVIEW
recognised qualifications and about 700 accredited courses, in addition to other units,
modules and skill sets. Twenty-three per cent of the resident population aged 15–64
participated in nationally recognised (accredited) training in 2018 (NCVER 2019i, pp. 1-7).
VET in Schools reaches over 230 000 students. More than 270 000 apprentices and trainees
were in training in 2019 (NCVER 2020a).
People across most age groups, skill levels and income levels use VET to improve their skills.
The system provides the core skills required for many occupations, as well as short courses to
meet regulatory requirements (for example, responsible service of alcohol and first aid). VET
supports new entrants to the labour market to obtain their first qualifications, as well as
employees needing to improve their skills for their current jobs and those changing careers.
Government-funded VET is one avenue to build skills. Other avenues include private
fee-for-service training (which may or may not involve nationally recognised qualifications),
informal workplace learning and higher education. These training options usually serve different
needs, with many people using these options at different stages over their working lives.
1.1 The Commission’s task
The National Agreement on Skills and Workforce Development (NASWD) is a high-level
agreement between the Australian, State and Territory governments that provides a
framework for collaboration and coordination of VET policy and sets out agreed long-term
reform directions. The agreement commenced in 2009 and was updated in 2012.
The terms of reference (ToR) for this review require the Commission to assess progress
against the targets, outcomes and performance indicators in the NASWD (ToR 1), and to
evaluate whether the NASWD is still an effective long-term framework for
intergovernmental cooperation on skills policy. The Commission has been asked to consider
options to:
streamline and coordinate government support for VET (ToR 2)
promote nationally consistent funding and pricing arrangements for
government-subsidised VET courses (ToR 3)
promote consistency in funding and student loan arrangements between the VET and
higher education sectors (ToR 4)
ensure government investment in VET encourages increased participation in training,
and that the level of public investment is commensurate with the outcomes and benefits
for students, employers and other beneficiaries (ToR 5)
achieve further reforms through funding arrangements, including extending
foundational learning programs and other recommendations made in Strengthening
Skills: Expert Review of Australia’s Vocational Education and Training System (the
Joyce Review) (ToR 6)
ABOUT THIS REVIEW 51
improve performance indicators, data and information sharing arrangements to enable all
governments to assess the effectiveness of VET investment and delivery (ToR 7).
As requested by the Australian Government, this interim report gives particular regard to
three terms of reference: streamlining and coordination options, the funding and pricing of
VET courses, and government investment in VET (ToR 2, 3 and 5).1
1.2 Context for this review
The NASWD is a schedule to the Intergovernmental Agreement on Federal Financial
Relations (IGA FFR). The IGA FFR was intended to establish a ‘new era’ for
intergovernmental cooperation on areas of national importance, including health, schools,
skills and workforce development, affordable housing, Indigenous reform and disability
services (COAG 2009a). National agreements under the IGA FFR included agreed
long-term objectives for the sectors, and were expected to improve services by giving the
States and Territories more flexibility in the use of Commonwealth grants, while clarifying
the roles and responsibilities of each level of government, and improving reporting on
performance.
The Australian Government funded the Productivity Commission to ‘undertake independent
reviews of nationally significant sector-wide agreements with the States and Territories’ in
its 2017-18 Budget (Australian Government 2017a). This review of the NASWD is the
second review commissioned by the Australian Government.2
The review is an opportunity to consider how the VET system has developed and performed
over the past 10 years. It is also an opportunity to assess whether the ambitious goal of a
more collaborative national approach to VET — embodied in the NASWD — has been
realised and whether it should remain the model for the future.
To an extent, the process of determining what comes after the NASWD has already begun,
with COAG’s ‘shared vision for VET’, released in August 2019 (COAG 2019a). The vision
also aims to ensure VET operates as part of a ‘joined up and accessible’ tertiary education
system, helping people develop skills as needed over their careers. At the request of the
COAG Skills Council, senior officials from all jurisdictions have developed a consultation
draft of a ‘roadmap’ to guide implementation of the vision (box 1.1), with a proposed
timeline of actions to be undertaken over five years (SSON 2020).
1 The date of submission for this Interim Report to the Australian Government was extended.
2 The National Disability Agreement was the first agreement reviewed, in 2018.
52 NASWD REVIEW
Box 1.1 Key components of the COAG Skills Council’s draft VET Reform Roadmap
The draft VET Reform Roadmap sets out three priority areas — improving the relevance, quality
and accessibility of the VET system — and actions against these areas leading up to the
implementation of major reforms, particularly in years four and five. These reforms include:
a new approach to qualification design and rationalisation of qualifications
a new quality framework and standards, and new assessment arrangements
new models for employment-based training
improved design of government and industry support for apprentices and trainees
improvements to VET delivered in schools
modern qualification frameworks to support parity between VET and higher education
improved skills demand forecasting and new frameworks for public and private investment
improved governance architecture.
The COAG Skills Council has asked that the Reform Roadmap be prepared for COAG
consideration by mid-2020.
Source: (SSON 2020).
The VET system has been the subject of recent reviews
The Commission’s study follows many recent reviews into the VET system and subsequent
Government decisions. Relevant past reviews are the 2018 review of the National Vocational
Education and Training Regulation Act 2011 (Braithwaite 2018), the 2019 review of the
Australian Qualifications Framework (Noonan et al. 2019), the 2019 Joyce Review of the
VET system (Joyce 2019) and the 2020 review of the regulatory practices, governance and
culture of the Australian Skills Quality Authority (mpconsulting 2020).
Other reviews are also underway or with government, including reviews of: post-senior
secondary school pathways by the COAG Education Council (COAG Education
Council 2019); student loans by the COAG Skills Council (COAG 2019c); the Australian
Apprenticeships National Skills Needs List by the Australian Government
(DESSFB 2019e); and VET policies and administration by State and Territory governments.
These reviews and associated reform agendas cover virtually every aspect of VET. They
include development and accreditation of training courses, the quality of regulation, the
delivery of VET in Schools, funding approaches, reform of pathways between education
sectors, reform of information for users of VET and reform of governance arrangements.
The draft VET Reform Roadmap prepared for the COAG Skills Council is intended to bring
the results of these reviews together (SSON 2020).
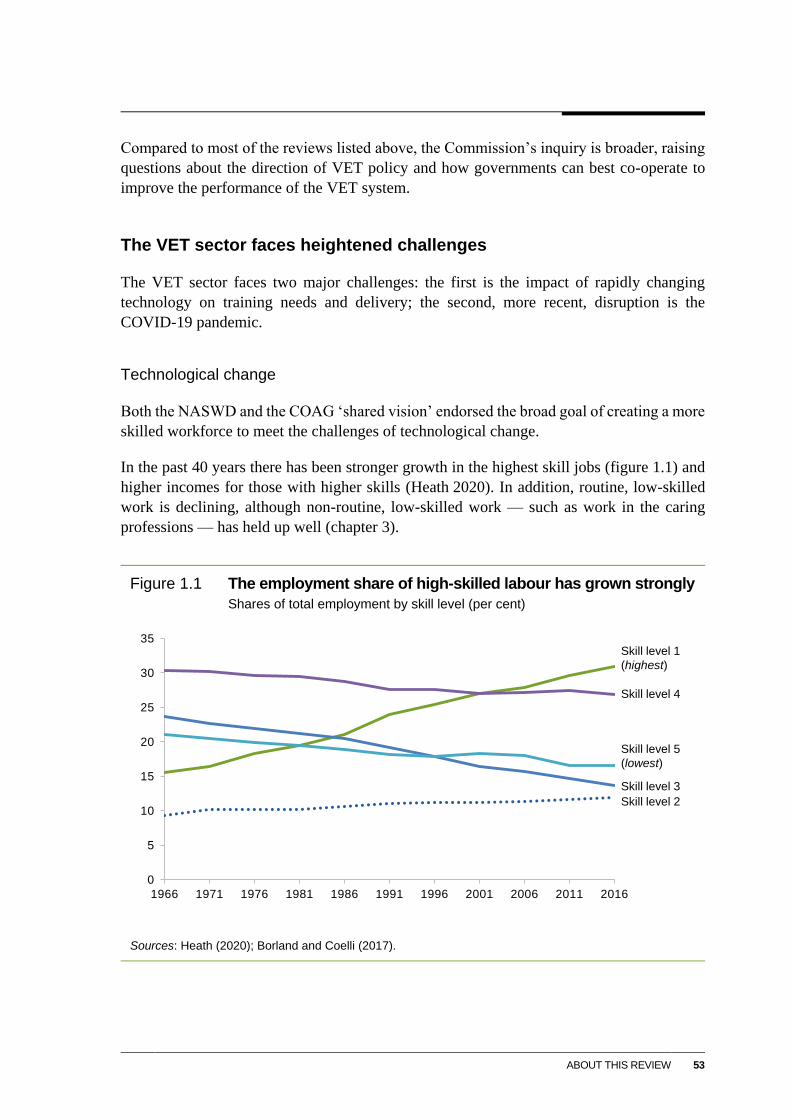
ABOUT THIS REVIEW 53
Compared to most of the reviews listed above, the Commission’s inquiry is broader, raising
questions about the direction of VET policy and how governments can best co-operate to
improve the performance of the VET system.
The VET sector faces heightened challenges
The VET sector faces two major challenges: the first is the impact of rapidly changing
technology on training needs and delivery; the second, more recent, disruption is the
COVID-19 pandemic.
Technological change
Both the NASWD and the COAG ‘shared vision’ endorsed the broad goal of creating a more
skilled workforce to meet the challenges of technological change.
In the past 40 years there has been stronger growth in the highest skill jobs (figure 1.1) and
higher incomes for those with higher skills (Heath 2020). In addition, routine, low-skilled
work is declining, although non-routine, low-skilled work — such as work in the caring
professions — has held up well (chapter 3).
Figure 1.1 The employment share of high-skilled labour has grown strongly
Shares of total employment by skill level (per cent)
Sources: Heath (2020); Borland and Coelli (2017).
0
5
10
15
20
25
30
35
1966 1971 1976 1981 1986 1991 1996 2001 2006 2011 2016
Skill level 1
(highest)
Skill level 5
(lowest)
Skill level 4
Skill level 3
Skill level 2
54 NASWD REVIEW
Two significant factors are contributing to these outcomes: the decline of employment in
manufacturing as a share of the workforce with the growth in employment in the services
sector; and the rise of non-routine jobs at the expense of routine ones. Both are caused in
part by technological progress (such as computerisation and automation).
At the same time, some predicted changes in the labour market — such as rapid growth in
self-employment and the gig economy — have been slow to emerge. The length of tenure in
jobs is also rising slightly, despite claims that workers are increasingly changing jobs and
moving between sectors.
There is broad consensus that individual tasks, rather than entire jobs, are likely to be most
affected by automation. It has proven easier to automate routine tasks (including some
cognitive tasks, such as analysis of financial reports) than tasks that rely on ‘soft’ skills, such
as perception, creative and social intelligence, empathy, tacit knowledge and high levels of
dexterity. The OECD has observed that:
Technology can replace workers in routine tasks that are easy to automate and complement
workers in tasks that require creativity, problem solving and cognitive skills. As machine learning
and artificial intelligence advance in many sectors, a growing number of workers may need to
move from declining occupations (which are highly intensive in low-skilled routine tasks) to
growing ones (which are characterised by high-level, non-routine cognitive skills).
(OECD 2019a, p. 12)
New technologies will both complement and substitute for labour. Employees with higher
skill levels will be more likely to benefit from complementary change. Over recent decades,
the tendency has been for technological change to be ‘skill biased’ — that is, it increases the
overall demand for higher-skilled labour across the economy (Borland and Coelli 2017).
This suggests that demand for training in the future will come from workers seeking to
increase their skills for existing jobs, as much as from those seeking to retrain for new jobs.
Demand may also grow for education and training of all types — VET, higher education and
informal training (Brennan 2019). Overall, this suggests that it will be important to ensure
effective mechanisms for building and updating workforce skills.
The implications for the VET sector in particular are less clear. Seventy per cent of people
in the highest skill jobs have at least a bachelor’s degree (Heath 2020), which suggests that
the recent shift towards higher education may be a sensible response to the changing labour
market. However, the level of over-skilling — employees with a bachelor’s degree in a job
where it is not required — also appears to be rising. There is evidence to suggest that some
students who did poorly at university could have achieved better income and employment
outcomes with a VET qualification (Heath 2020).
This review will consider whether government policy adequately responds to these challenges
and, more broadly, whether the NASWD supports governments’ vision for the sector.
ABOUT THIS REVIEW 55
The impact of the COVID-19 pandemic
At the time of writing, the COVID-19 pandemic is a major global health challenge.3 Policy
responses have varied around the world, but have generally involved strict controls on travel,
social distancing, and limits to business activity. These policies have reshaped the global
economy in 2020 through their severe effects on business operation, employment, consumer
demand, and international supply chains.
A multi-faceted policy response has been implemented by the Australian, State, and
Territory governments, with restrictions evolving according to the changing medical
situation and perceived risks in each State and Territory.
Australia’s policy response to COVID-19, as well as the state of the global economy, will
have a significant bearing on the VET sector in Australia. Some impacts are already
apparent. Others will be clearer by the time the final report of this review is completed.
Beyond this timeframe, broader questions will remain as to whether the pandemic will result
in fundamental changes to the VET sector and VET policy.
Interrupted learning and adaptive delivery
Escalating restrictions for social distancing4 have led to the suspension of most face-to-face
learning in the VET sector. The impact of these restrictions on students will depend on their
duration, as well as the ability of RTOs to offer alternative forms of delivery. The first point
is impossible to predict at the time of writing. On the second point, there has been a
significant pivot by RTOs toward online delivery. TAFE South Australia has moved
94 per cent of its courses to online delivery, with some rescheduling of theoretical and
practical elements (TDA 2020). Governments have facilitated the creation of online short
courses free to students. As data become available, it will be clearer as to what extent online
delivery supported the continuity of students’ learning.
Aside from social distancing, travel restrictions have direct effects on the international
segment of the VET sector. After initially implementing country-specific travel restrictions
and quarantine requirements, the Australian Government closed international travel to
Australia for non-citizens and non-residents on 20 March 2020 (Prime Minister of
Australia 2020b).
3 The World Health Organization (2020) reported at 19 May 2020, there were 4 731 458 known cases
globally, with 316 169 deaths.
4 Social distancing requirements were first announced on 13 March 2020, relating to gatherings of over
500 people (Prime Minister of Australia 2020a). The advice was updated on 18, 20, and 22 March,
escalating to the requirement that non-essential indoor gatherings have only one person per 4 square metres
(Prime Minister of Australia 2020c, 2020d, 2020e).
56 NASWD REVIEW
The abrupt fall in business activity has immediate effects on training and employment; early
data suggest that is certainly true for apprentices.5 When apprentices lose their employment,
they may be able to continue formal training with their RTO while searching for another
employer (for example, see NSW Government 2020b) but it remains to be seen whether this
results in widespread interruption or cancellation. The rate of business closures and job
losses have varied across industries, particularly given that some industries (such as
construction) have largely continued to operate, while others have been directed to suspend
or curtail operations. Many businesses have adapted to suit consumer demand during the
pandemic, providing takeaway meals, hand sanitiser, and personal protective equipment
(Coulter 2020; Hrastovec 2020; Wong 2020).
What will happen when restrictions are lifted?
Some aspects of COVID-19-related disruption to VET should be remedied simply by the
lifting of current restrictions. For example, removing social distancing requirements would
allow face-to-face learning to resume. The removal of international travel restrictions, here
and in students’ home countries (or reliance on restrictions such as enforced quarantine
periods for international student arrivals) would allow international students to begin or
resume their VET studies.
The longer-term repercussions of COVID-19 are less clear. For example, there is significant
uncertainty about the nature and speed of economic recovery, both in Australia and globally.
Where economic activity recovers quickly, and interruptions to learning are significant, there
may be shortages of particular skills and a need for accelerated learning.
In addition, economic activity is likely to recover unevenly across industries. Small- to
medium-sized enterprises in particular may close permanently during the pandemic.
Students and graduates may find greater need for job-matching, career advice and,
potentially, retraining. The scale of unemployment may lead to increased demand for
training. Several governments have committed funds targeting people who have been stood
down or have lost their jobs, assisting with retraining, job-matching and other help to
transition into jobs (NSW Government 2020a; Queensland Government 2020; Victoria State
Government 2020).
Broader changes to work processes may ultimately have a bearing on the demand for
particular skills and training. During the pandemic, there have been large-scale changes in
the use of technology, including the expanded use of advanced manufacturing methods (for
example, in personal protective equipment) and a greater reliance on remote working
(Coulter 2020; Nguyen 2020). Some have speculated that the pandemic could also result in
faster implementation of technologies such as automation (Farshchi 2020; Munro, Maxim
5 It is estimated that 12 500 apprentices have lost their jobs, while vacancies for apprentices declined in the
three months to April 2020 by 73 per cent nationally (Chrysanthos 2020; GAN Australia 2020). The
Australian Government has implemented a wage subsidy for apprentices in small to medium-sized
businesses, which to date has had over 15 000 applications (MacMillan 2020).
ABOUT THIS REVIEW 57
and Whiton 2020). Any prolonged changes to production processes would have implications
for the demand for skilled labour in the economy, requiring ongoing responsiveness from
the VET sector.
Moreover, the pivot to online delivery of training across the VET sector during the pandemic
may prove enduring for some courses. Given that the incremental costs of providing online
services are generally significantly lower than physical delivery, there are significant
opportunities for enhancements to productivity, flexibility and innovation. An increase in
the proportion of VET courses delivered online may present a challenge for the State- and
Territory-based subsidy systems, given that the online learning environment is
geographically agnostic (subject to the availability of internet services) and students could
easily undertake online study from RTOs regardless of where they are based. It may also
increase the need for support for students who may not benefit from online learning,
particularly those from low socioeconomic backgrounds and other vulnerable groups
(Brown et al. 2020).
Completing the review in the context of COVID-19
To the extent possible, the Commission has considered the potential implications of
COVID-19 on the policy options identified in this interim report (chapter 6). However, at
this stage, the most likely effect of COVID-19 is widespread uncertainty in the medium to
longer term. The Commission will monitor the evolving situation as more data and
information become available.
The challenges presented by the COVID-19 pandemic are unlikely to change the general
principles of skills policy. It is more likely that the pandemic will have a bearing on the
prioritisation and implementation of policies, which will also be relevant to any future
agreements between Australian, State, and Territory governments.
INFORMATION REQUEST — IMPACTS OF COVID 19
What, if any, are the likely medium and long-term impacts of the COVID-19 pandemic
on skill formation and the market in the VET sector?
To the extent that some cohorts face enduring displacement from the labour market,
particularly younger Australians, what role beyond current arrangements should VET
play in augmenting their skills and employability?
1.3 The VET system in Australia
This review deals mainly with nationally recognised training and the formal VET system
that delivers it, including the RTOs, accreditation frameworks, funding mechanisms and
regulators that are critical in the delivery of this training. Nationally recognised training,
often funded by governments, leads to portable qualifications for the benefit of students and
58 NASWD REVIEW
employers and improves the efficiency of the labour market by reducing the costs of
recruitment and changing jobs.
The formal system is one contributor to the development of workplace skills. Non-formal
training (workshops and training courses undertaken in the workplace) and informal training
(learning on the job and from peers and supervisors) are also critical to building skills and
lifting productivity. A recent OECD study found that about 70 per cent of workers engaged
in informal learning activities over a 12-month period, compared to 41 per cent who engaged
in non-formal training and just 8 per cent who trained towards a formal qualification (Fialho,
Quintini and Vandeweyer 2019, p. 6). Informal and non-formal learning are more likely to
be specific to a particular employer and do not lead to recognised credentials but were still
found to be associated with higher wages — participation in non-formal learning was
associated with 11 per cent higher wages, while participation in informal learning was
associated with 3.5 per cent higher wages (Fialho, Quintini and Vandeweyer 2019, p. 7).
In Australia, employers are more than twice as likely to make use of unaccredited training
(falling within the definition of non-formal training) as they are to use nationally recognised
training (NCVER 2019c, table 5) and employers using unaccredited training are more
satisfied with the training than employers using accredited training (NCVER 2019c, table 7).
What the formal VET system provides
The formal VET system provides nationally recognised training, both ‘nationally recognised
training programs’ and ‘subjects not delivered as part of nationally recognised training
programs’ (figure 1.2). Nationally recognised training is training that meets the approved
course descriptions (including the competencies to be achieved), course and provider
standards and accreditation arrangements that have been developed for VET. ‘Subjects’
include individual units (‘competencies’) to learn a particular skill and short courses, such
as first aid and responsible service of alcohol courses. These courses are often regulatory
requirements for particular jobs.
More students are enrolled in subjects than in nationally recognised training programs.
However, nationally recognised training programs account for the vast majority of hours of
training delivered (85 per cent in 2018) (NCVER 2019i, figure 4). Government support
focuses on nationally recognised training programs to ensure there is recognised VET training
available to support industry skill requirements, labour productivity and economic growth.
Reflecting the diverse demands on VET, the system offers over 1400 qualifications across
57 training packages, 681 accredited courses and 1388 skill sets (recognised sub-sets of
course units), with even wider scope for learning via short courses, modules and individual
subjects (DESE 2020d). Nationally recognised training activity is concentrated in five fields
of education — management and commerce, society and culture, health, engineering and
mixed field programs (NCVER 2019i). The largest number of VET program enrolments is
for Certificate III courses (NCVER 2019i, p. 10).
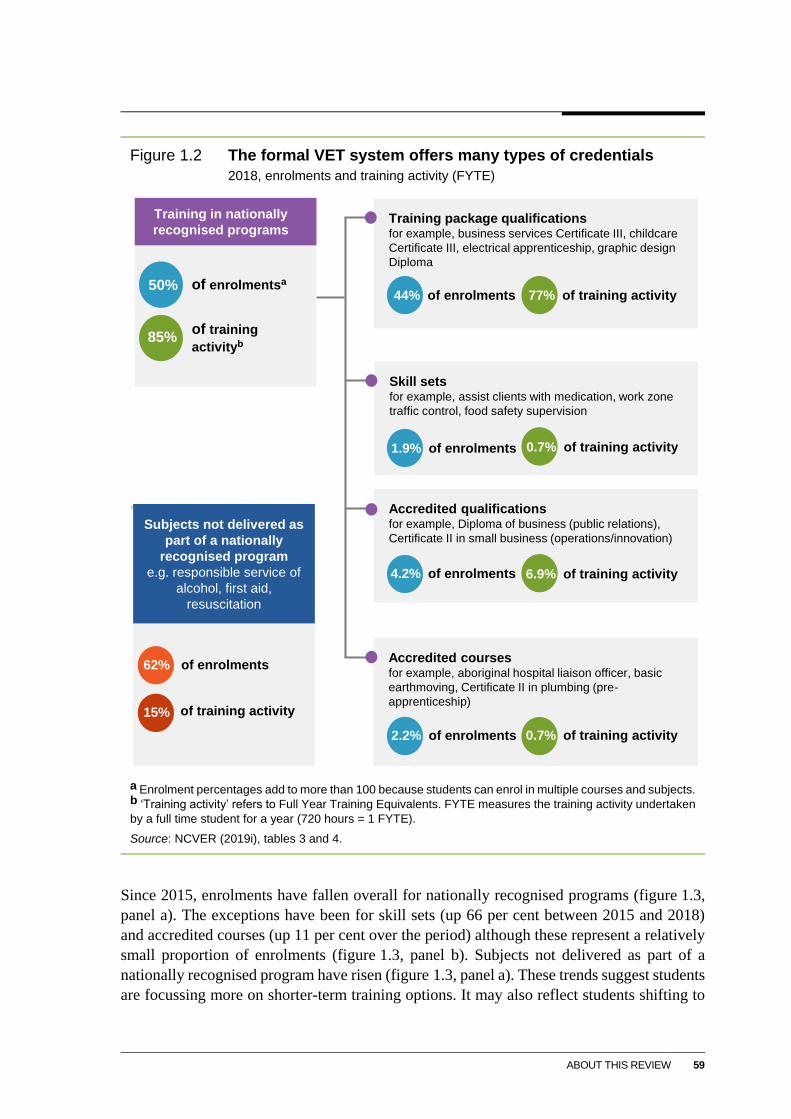
ABOUT THIS REVIEW 59
Figure 1.2 The formal VET system offers many types of credentials
2018, enrolments and training activity (FYTE)
a Enrolment percentages add to more than 100 because students can enrol in multiple courses and subjects.b ‘Training activity’ refers to Full Year Training Equivalents. FYTE measures the training activity undertaken
by a full time student for a year (720 hours = 1 FYTE).
Source: NCVER (2019i), tables 3 and 4.
Since 2015, enrolments have fallen overall for nationally recognised programs (figure 1.3,
panel a). The exceptions have been for skill sets (up 66 per cent between 2015 and 2018)
and accredited courses (up 11 per cent over the period) although these represent a relatively
small proportion of enrolments (figure 1.3, panel b). Subjects not delivered as part of a
nationally recognised program have risen (figure 1.3, panel a). These trends suggest students
are focussing more on shorter-term training options. It may also reflect students shifting to
Training package qualificationsfor example, business services Certificate III, childcare
Certificate III, electrical apprenticeship, graphic design
Diploma
Accredited qualificationsfor example, Diploma of business (public relations),
Certificate II in small business (operations/innovation)
Accredited coursesfor example, aboriginal hospital liaison officer, basic
earthmoving, Certificate II in plumbing (pre-
apprenticeship)
Skill setsfor example, assist clients with medication, work zone
traffic control, food safety supervision
44% of enrolments
1.9% of enrolments
4.2% of enrolments
2.2% of enrolments
77% of training activity
0.7% of training activity
6.9% of training activity
0.7% of training activity
of enrolmentsa
of training
activityb
Training in nationally
recognised programs
of enrolments
of training activity
Subjects not delivered as
part of a nationally
recognised program
e.g. responsible service of
alcohol, first aid,
resuscitation
85%
50%
62%
15%
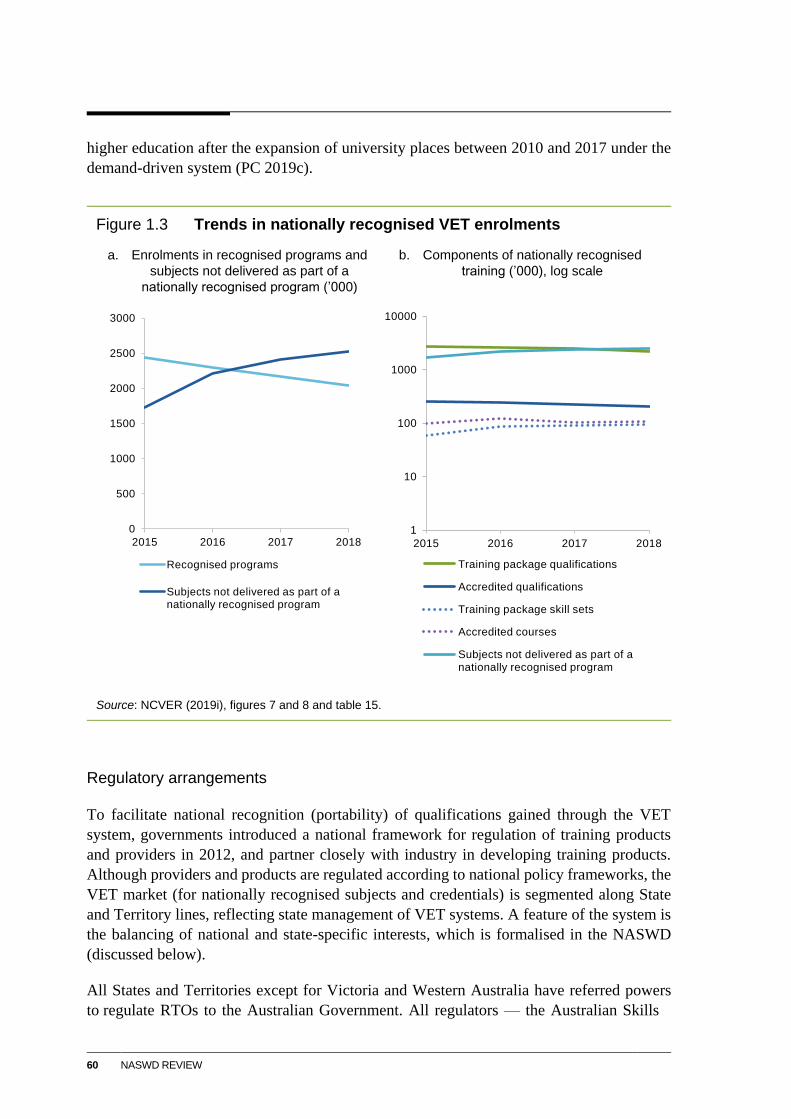
60 NASWD REVIEW
higher education after the expansion of university places between 2010 and 2017 under the
demand-driven system (PC 2019c).
Figure 1.3 Trends in nationally recognised VET enrolments
a. Enrolments in recognised programs and
subjects not delivered as part of a
nationally recognised program (’000)
b. Components of nationally recognised
training (’000), log scale
Source: NCVER (2019i), figures 7 and 8 and table 15.
Regulatory arrangements
To facilitate national recognition (portability) of qualifications gained through the VET
system, governments introduced a national framework for regulation of training products
and providers in 2012, and partner closely with industry in developing training products.
Although providers and products are regulated according to national policy frameworks, the
VET market (for nationally recognised subjects and credentials) is segmented along State
and Territory lines, reflecting state management of VET systems. A feature of the system is
the balancing of national and state-specific interests, which is formalised in the NASWD
(discussed below).
All States and Territories except for Victoria and Western Australia have referred powers
to regulate RTOs to the Australian Government. All regulators — the Australian Skills
0
500
1000
1500
2000
2500
3000
2015 2016 2017 2018
Recognised programs
Subjects not delivered as part of a nationally recognised program
1
10
100
1000
10000
2015 2016 2017 2018
Training package qualifications
Accredited qualifications
Training package skill sets
Accredited courses
Subjects not delivered as part of a nationally recognised program
ABOUT THIS REVIEW 61
Quality Authority (ASQA), the Victorian Registration and Qualifications Authority, and the
Training Accreditation Council in Western Australia — operate under the same framework
for overseeing RTOs and accrediting courses. ASQA is solely responsible for regulating
RTOs operating across jurisdictions and training international students.
RTOs have flexibility in deciding how to deliver and ‘package’ approved training content.
For example, training packages set out in detail the knowledge and skills needed in
occupations, but in a way that allows units of competency — the building blocks that make
up a training program — to be combined to form a curriculum rather than prescribing the
curriculum. Students also have some flexibility in choosing the units of competency that
form qualifications and can undertake qualifications, as well as short courses and subjects
outside of training packages, to meet their needs.
This flexibility has been a strength of the system in meeting the needs of employers in
different industries and the VET system’s diverse student base (Noonan 2016b). The quality
of services received less regulatory attention until recently — the model has relied on
standards for providers, competition between providers and client choice (by both students
and employers) to ensure quality is adequate. The problems with VET FEE-HELP since
2012 have resulted in greater focus on the regulators, the quality of training delivered, RTO
processes, and the student outcomes achieved.
Governments liaise with industries to identify training needs warranting government support
and to ensure graduates are equipped to work in specific occupations and industries. The
employer-training nexus is most formal in the apprenticeship model of training, where
employers and apprentices enter into training contracts, and governments oversee these
contracts and conditions of employment.
VET as part of the education system
VET has important links to higher education and schools. VET serves as an avenue for
further learning following a degree, a practical supplement to theory-based studies, an
element of school education through the VET in Schools program, and as a ‘second chance’
avenue for learning when students leave school without sufficient skills.
VET has similarities with the higher education sector. Some of the more advanced VET
qualifications overlap and compete with university courses.6 Both nationally recognised VET
and higher education have about the same training load, equivalent to 1.1 million full-time
students (DESE 2019a, table (ii); NCVER 2019c, table 9). And, like higher education, VET is
a significant exporter with almost 284 000 international students studying VET in 2019,
compared to 442 000 international students in higher education (DESE 2019e).
6 Under the Australian Qualifications Framework, the VET sector provides qualifications up to and including
the Diploma level, whereas higher education institutions may provide Diploma, Bachelor, and postgraduate
qualifications (AQF Council 2013).
62 NASWD REVIEW
The VET sector also fills a variety of roles for the community as a whole. It offers foundation
skills such as language, literacy, numeracy and digital literacy. It provides workforce
entry-level and bridging courses. It facilitates the pursuit of learning for personal interest,
personal development, and servicing regulatory requirements.
The supply of VET
Providers of nationally recognised VET services include TAFE institutes, private providers,
private businesses (so-called enterprise providers), community organisations, universities and
schools. In 2018, there were over 3830 active public and private RTOs — nearly three-quarters
of students attended private organisations (NCVER 2019i, table 2 and figure 12).
Private providers and TAFE institutes are the largest VET providers, delivering around
60 per cent and 30 per cent of total training hours respectively (NCVER 2019i). Enrolments
and training loads have fallen for both provider groups since 2015, with private providers
making up some of the loss of domestic students by increasing the numbers of international
students. Community education providers, which often focus on the provision of foundation
skills, are the next largest provider group.
VET courses are offered on a subsidised as well as fee-for-service basis by both public and
private providers. Government-subsidised training is delivered under contractual
arrangements with State and Territory governments. Providers of subsidised services are
therefore subject to requirements in addition to those imposed by the national regulatory
framework. Contracts typically specify measures to ensure the delivery and quality of services,
and expectations on the charging of fees. States and Territories differ significantly in their
approaches to subsidising courses and controlling their prices (chapter 4; appendix D).
The Australian Government is responsible for regulating the fee-for-service market in
jurisdictions other than Victoria and Western Australia. How differences in regulatory
approaches affect service delivery among service providers and the efficiency of the VET
market as a whole is a question for this review.
Governments’ roles in the VET system
State and Territory governments are responsible for both delivering VET services and
overseeing VET markets. Aside from these roles, very few areas are the exclusive domain
of one level of government. Governments share responsibility for product and provider
regulation, funding (further details below), setting policy directions for the VET system,
industry engagement and data provision.
States and Territories determine how most public resources for VET are spent but the
Commonwealth also directs support to areas it deems to be priorities. While the
Commonwealth may place conditions on grants provided to the States and Territories, the
majority of Commonwealth grants (86 per cent) is untied (NCVER 2019d, table 1), with the
ABOUT THIS REVIEW 63
reporting framework in the NASWD intended to provide assurance that this funding and,
more broadly, all government funding for the VET sector, is prudently and efficiently spent.
These arrangements mean the scope of shared activity and interest is large. A clear definition
of the roles and responsibilities of governments is important to avoid costly duplication and
inconsistencies across government programs, and in areas of shared responsibility, initiatives
should aim to minimise these risks.
More detail on the VET system can be found in appendix C.
The NASWD and other intergovernmental agreements
The NASWD is part of the governance arrangements to support collaborative VET policies
among governments. It defines the VET system’s overarching objective as delivering a
productive and highly skilled workforce. Governments endorsed a set of targets and
performance indicators to track progress and agreed wide-ranging reform directions to
improve the accessibility and quality of training, the contestability of the market for
nationally recognised training, consumer and government decision-making, and the
connections between education sectors and VET and the labour market (more detail on the
NASWD can be found in appendix B).
The IGA FFR provided for annual Specific Purpose Payments (SPPs) to the States and
Territories. SPPs are the most significant means used for providing funds from the
Commonwealth to the States and Territories. The skills SPP is not subject to conditions other
than that funds must be spent on skills and workforce development. The IGA FFR also
provided for time-limited National Partnership payments to support the delivery of specified
outputs or projects, facilitate reforms or reward jurisdictions that deliver nationally
significant reforms. Agreements for such payments may include financial or other controls
on service delivery (COAG 2009a; appendix D).
There are four National Partnership Agreements (NPAs), three of which are project-specific.
Past NPAs were instrumental in progressing national reform commitments, including increasing
the accessibility of training by introducing a national training entitlement (a guaranteed
subsidised training place for all students undertaking their first Certificate III or above
qualification) and extending the availability of income contingent student loans (box 1.2).
64 NASWD REVIEW
Box 1.2 Major national partnerships agreements
National Productivity Places Program (2009 – 2012)
This national partnership funded an additional 557 556 course enrolments and 402 881 qualification
commencements. The main objectives were to increase the productivity of existing workers and
assist job seekers to find work. Of the qualification commencements, 133 242 places were allocated
for job seekers and 269 639 places to existing workers. Funding was distributed to State and
Territory governments on the basis of their share of the working-age population.
Consistent with the NASWD, each State and Territory set its own approach to implementing the
program. Victoria had moved to an entitlement-based system so its funding was provided as an
addition to its untied funding base.
National Partnership on Skills Reform (2012 – 2017)
The agreement aimed to produce a more accessible, transparent, high quality and efficient VET
system. It provided for an entitlement to a training place for everyone of working age for
qualifications at Certificate III and above and the extension of Commonwealth income contingent
loans.
The agreement also included better data sharing, the introduction of a unique student identifier,
better information for students, development and publication of RTO performance measures and
strategies to support public providers.
Under the national partnership, the Commonwealth was to provide funding of up to $1.7 billion to
the States and Territories, with the major part of these payments dependent on jurisdictions
meeting milestones identified in agreed implementation plans.
Skilling Australians Fund (2018 – 2022)
The Skilling Australians Fund aims to increase the uptake of apprenticeships and traineeships
and other employment-related training. All jurisdictions except Victoria and Queensland are
parties to the fund.
The agreements describe state-based projects, joint funding commitments and targets for
additional training places. The Fund is partially financed by a levy paid by employers that sponsor
foreign skilled workers under certain permanent and temporary visa classes.
Source: COAG (2012c, 2012d, 2019b).
As noted, key questions for this review are how well governments’ aims for the sector under
the NASWD and the IGA FFR have been achieved, and whether the NASWD is an effective
long-term framework for VET policy and governance.
Government investment in VET
In 2018, governments spent $6.1 billion on the VET system (NCVER 2019d). The
Australian and State and Territory governments each contributed about half of this funding
(figure 1.4) — $1.7 billion of about $3 billion contributed by the Commonwealth was
provided to the States and Territories in the form of grants ($1.5 billion untied).
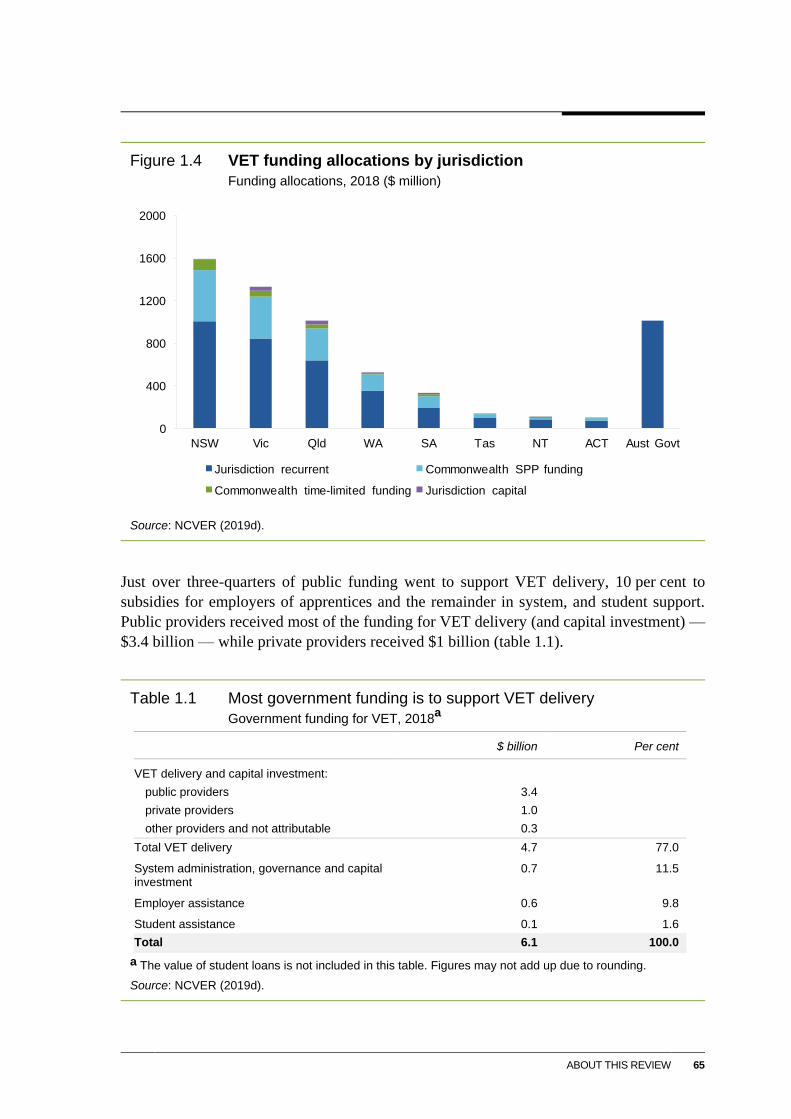
ABOUT THIS REVIEW 65
Figure 1.4 VET funding allocations by jurisdiction
Funding allocations, 2018 ($ million)
Source: NCVER (2019d).
Just over three-quarters of public funding went to support VET delivery, 10 per cent to
subsidies for employers of apprentices and the remainder in system, and student support.
Public providers received most of the funding for VET delivery (and capital investment) —
$3.4 billion — while private providers received $1 billion (table 1.1).
Table 1.1 Most government funding is to support VET delivery
Government funding for VET, 2018a
$ billion Per cent
VET delivery and capital investment:
public providers 3.4
private providers 1.0
other providers and not attributable 0.3
Total VET delivery 4.7 77.0
System administration, governance and capital investment
0.7 11.5
Employer assistance 0.6 9.8
Student assistance 0.1 1.6
Total 6.1 100.0
a The value of student loans is not included in this table. Figures may not add up due to rounding.
Source: NCVER (2019d).
0
400
800
1200
1600
2000
NSW Vic Qld WA SA Tas NT ACT Aust Govt
Jurisdiction recurrent Commonwealth SPP funding
Commonwealth time-limited funding Jurisdiction capital
66 NASWD REVIEW
Not included in the figures above is almost $300 million of VET student loans and a further
$212 million in trade support loans provided by the Australian Government in 2018
(NCVER 2019d).7
As for other government interventions considered by this review, the key questions about
government investment relate to the rationales for the role of government, the effectiveness of
the measures in achieving their goals, and the size and distribution of the benefits. The interim
report of this review provides the Commission’s preliminary assessment of these issues.
The Commission has also been asked to consider options on the choice and design of policy
instruments used to induce greater skill formation and for improved information, and
information sharing arrangements, to better enable governments to assess the effectiveness
of their investments.
Consistency in course funding and pricing
This study is to consider options for achieving nationally consistent VET funding and
pricing. State and Territory governments decide which courses are subsidised and the rate of
subsidy for each course.
Data in this report on where VET funding is spent are incomplete. About 46 per cent of total
funding, or $2.8 billion, is attributable to course subsidies (NCVER 2019d). However, there is
a lack of transparency, particularly at the State and Territory level, about the details of where
public money is spent. In the preparation of this interim report, the Commission has found it
difficult to confirm spending data with jurisdictions; where data has been made available there
has been reluctance to allow analysis to be published. The Commission will continue to
explore better access to data and data transparency in the lead up to its final report.
The main goals of course subsidies are to foster the uptake of training in areas where there
are skills shortages and to encourage training by particular equity groups. Jurisdictions also
have other aims in providing subsidies, such as supporting regional industries and small
businesses. Targeted courses, student types, and rates of subsidy differ according to each
government’s policy priorities and the apparent needs of local economies. Jurisdictions also
have different methods for calculating and paying subsidies, as well as managing subsidised
services (including controls over course costs and student fees).
The Joyce Review concluded that the funding and pricing arrangements created unnecessary
complexity and uncertainty for training providers, and unjustified differences in course fees
for students. The Joyce Review recommended the development of a nationally consistent
funding policy for all government-subsidised qualifications (Joyce 2019, p. 73). It also
7 Loans are not comparable to the direct funding provided because they will, in general, be repaid. However,
they do present a form of partial subsidy, the subsidy components being the advance of finance coupled
with concessional rates of interest, plus the amount of written-off loans.
ABOUT THIS REVIEW 67
recommended the establishment of a National Skills Commission (NSC), which would have
responsibilities to:
… consult on and agree course subsidy levels with the States and Territories, allocate
Commonwealth funding to the States and Territories on agreed parameters, and monitor the
performance and effectiveness of system funding on behalf of the Commonwealth.
(Joyce 2019, p. 73)
The Joyce Review envisioned that the NSC would be given lead responsibility for producing
two key products: national, state and territory level and regional skills demand forecasts; and
nationally consistent subsidy levels based on averaged actual costs of delivery for providers
nationwide (Joyce 2019, pp. 124-125).
The Australian Government will launch the NSC by July 2020; a Bill is before Parliament
to establish the role and responsibilities of the Commissioner (box 1.3).
Box 1.3 The National Skills Commission
The National Skills Commission (NSC) was announced by the Australian Government in the
2019-20 Budget (with a $48.3 million over three years) ‘to drive long-term reforms in the VET
sector … and develop efficient pricing for training [and] oversee Skills Organisations to ensure
industry is leading the development of VET qualifications and training products’ (Australian
Treasury 2019, p. 69; DESE 2019h, p. 12).
A bill is currently before the Australian Parliament to establish the position and responsibilities of
the National Skills Commissioner. As set out in the Bill, the functions of the Commissioner are:
(a) to provide advice to the Minister and the Secretary on Australia’s workforce skills needs, efficient
prices for VET courses, the public and private return on government investment in VET and other matters
relating to the VET system; and
(b) to publish an annual report about Australia’s current, emerging and future workforce skills needs.
(Australian Government 2020a)
The Bill provides for the Minister to establish one or more advisory committees to give advice in
relation to the Commissioner’s functions.
Sources: Joyce (2019); Department of Employment, Skills, Small and Family Business (2019a).
1.4 The Commission’s approach to the interim report
This report starts with an assessment of progress against the NASWD performance
framework and reform directions (chapter 2). Chapter 2 also considers the role of future
intergovernmental agreements in guiding skill policy collaboration between governments.
Arrangements for funding VET (ToR 3 and 5) are considered in chapters 3 to 6.
Chapter 3 focuses on the rationales for government investment and the implications for
the design of government programs.
68 NASWD REVIEW
Chapter 4 largely takes as given the logic of the current funding model, but examines
how governments set and deliver course subsidies.
Chapter 5 assesses the impacts of government investments, both subsidies and other
student supports.
Chapter 6 then brings together policy options that could improve the effectiveness of
governments’ investments in VET, including options to achieve greater national
consistency in course subsidy arrangements.
Chapter 7 examines the potential for streamlining and coordinating government support for
VET. This includes an assessment of progress against the NASWD’s aim to streamline the
Australian Apprenticeship System. It also includes consideration of other areas that would
benefit from improved coordination, simplification and streamlining.
In undertaking this study, the Commission has benefited from the analysis of other reviews,
63 submissions, comments lodged with the Commission and meetings with a range of
participants. This interim report presents initial views, and the Commission welcomes
further input to inform its final report.
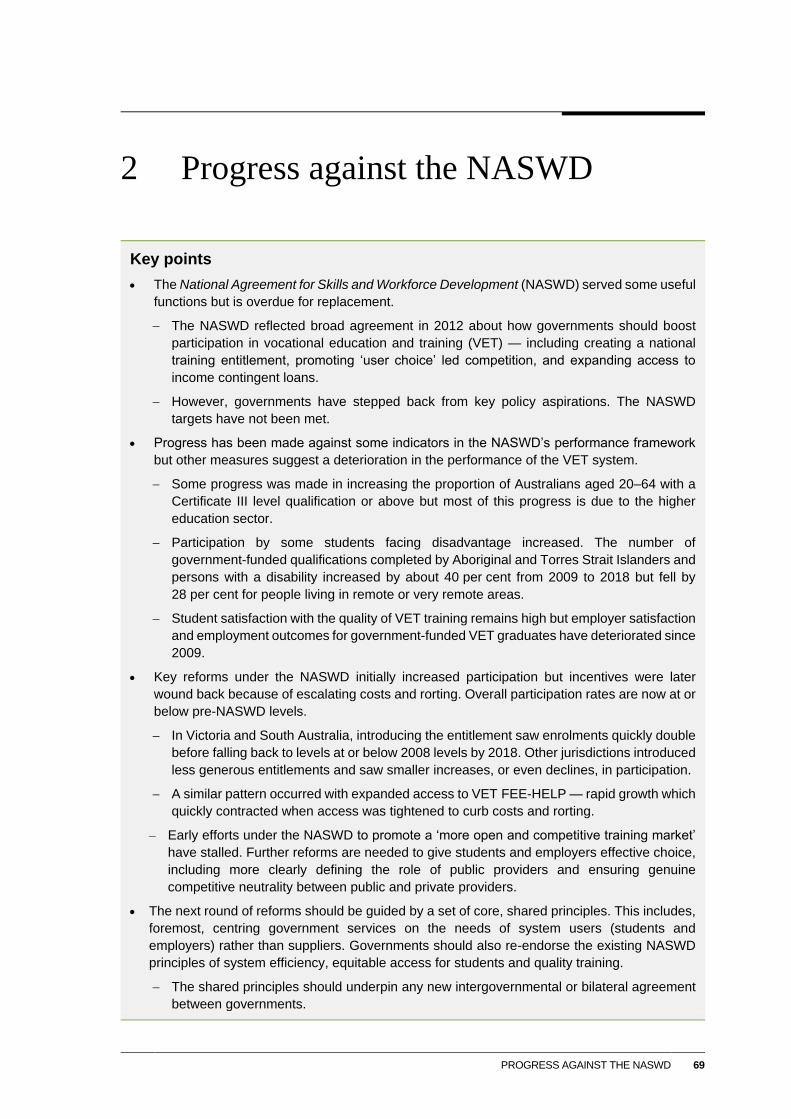
PROGRESS AGAINST THE NASWD 69
2 Progress against the NASWD
Key points
The National Agreement for Skills and Workforce Development (NASWD) served some useful
functions but is overdue for replacement.
The NASWD reflected broad agreement in 2012 about how governments should boost
participation in vocational education and training (VET) — including creating a national
training entitlement, promoting ‘user choice’ led competition, and expanding access to
income contingent loans.
However, governments have stepped back from key policy aspirations. The NASWD
targets have not been met.
Progress has been made against some indicators in the NASWD’s performance framework
but other measures suggest a deterioration in the performance of the VET system.
Some progress was made in increasing the proportion of Australians aged 20–64 with a
Certificate III level qualification or above but most of this progress is due to the higher
education sector.
Participation by some students facing disadvantage increased. The number of
government-funded qualifications completed by Aboriginal and Torres Strait Islanders and
persons with a disability increased by about 40 per cent from 2009 to 2018 but fell by
28 per cent for people living in remote or very remote areas.
Student satisfaction with the quality of VET training remains high but employer satisfaction
and employment outcomes for government-funded VET graduates have deteriorated since
2009.
Key reforms under the NASWD initially increased participation but incentives were later
wound back because of escalating costs and rorting. Overall participation rates are now at or
below pre-NASWD levels.
In Victoria and South Australia, introducing the entitlement saw enrolments quickly double
before falling back to levels at or below 2008 levels by 2018. Other jurisdictions introduced
less generous entitlements and saw smaller increases, or even declines, in participation.
A similar pattern occurred with expanded access to VET FEE-HELP — rapid growth which
quickly contracted when access was tightened to curb costs and rorting.
– Early efforts under the NASWD to promote a ‘more open and competitive training market’
have stalled. Further reforms are needed to give students and employers effective choice,
including more clearly defining the role of public providers and ensuring genuine
competitive neutrality between public and private providers.
The next round of reforms should be guided by a set of core, shared principles. This includes,
foremost, centring government services on the needs of system users (students and
employers) rather than suppliers. Governments should also re-endorse the existing NASWD
principles of system efficiency, equitable access for students and quality training.
The shared principles should underpin any new intergovernmental or bilateral agreement
between governments.
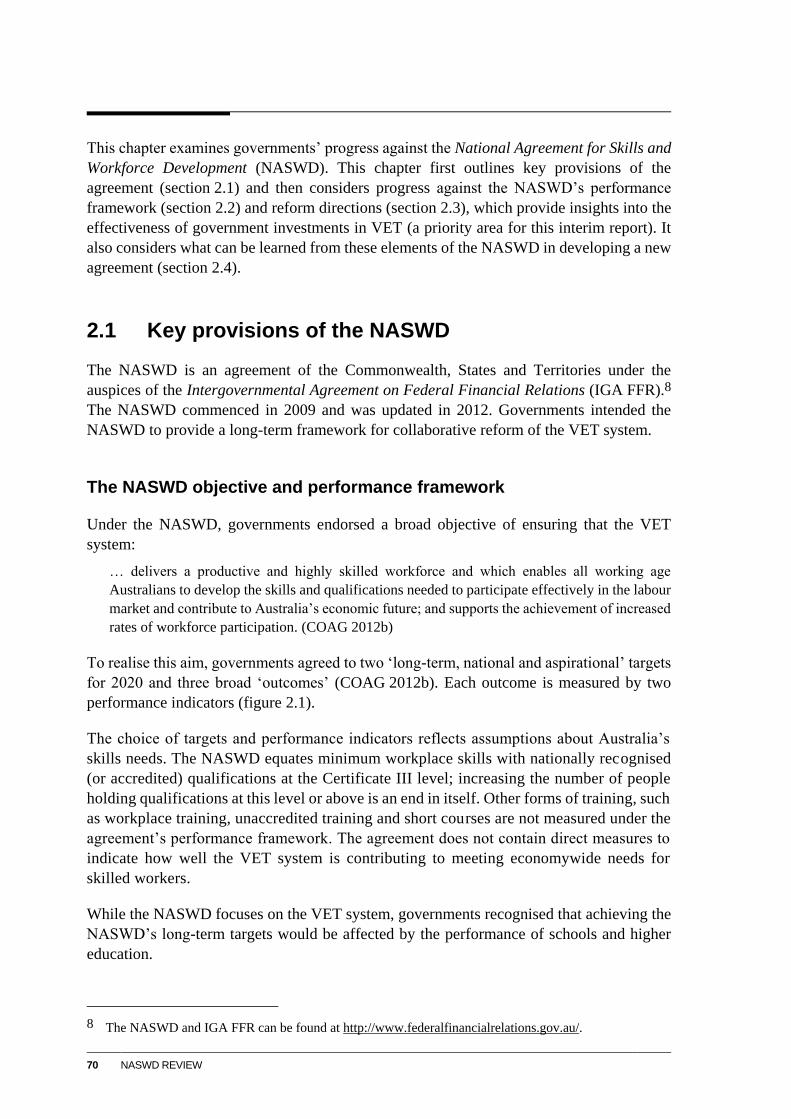
70 NASWD REVIEW
This chapter examines governments’ progress against the National Agreement for Skills and
Workforce Development (NASWD). This chapter first outlines key provisions of the
agreement (section 2.1) and then considers progress against the NASWD’s performance
framework (section 2.2) and reform directions (section 2.3), which provide insights into the
effectiveness of government investments in VET (a priority area for this interim report). It
also considers what can be learned from these elements of the NASWD in developing a new
agreement (section 2.4).
2.1 Key provisions of the NASWD
The NASWD is an agreement of the Commonwealth, States and Territories under the
auspices of the Intergovernmental Agreement on Federal Financial Relations (IGA FFR).8
The NASWD commenced in 2009 and was updated in 2012. Governments intended the
NASWD to provide a long-term framework for collaborative reform of the VET system.
The NASWD objective and performance framework
Under the NASWD, governments endorsed a broad objective of ensuring that the VET
system:
… delivers a productive and highly skilled workforce and which enables all working age
Australians to develop the skills and qualifications needed to participate effectively in the labour
market and contribute to Australia’s economic future; and supports the achievement of increased
rates of workforce participation. (COAG 2012b)
To realise this aim, governments agreed to two ‘long-term, national and aspirational’ targets
for 2020 and three broad ‘outcomes’ (COAG 2012b). Each outcome is measured by two
performance indicators (figure 2.1).
The choice of targets and performance indicators reflects assumptions about Australia’s
skills needs. The NASWD equates minimum workplace skills with nationally recognised
(or accredited) qualifications at the Certificate III level; increasing the number of people
holding qualifications at this level or above is an end in itself. Other forms of training, such
as workplace training, unaccredited training and short courses are not measured under the
agreement’s performance framework. The agreement does not contain direct measures to
indicate how well the VET system is contributing to meeting economywide needs for
skilled workers.
While the NASWD focuses on the VET system, governments recognised that achieving the
NASWD’s long-term targets would be affected by the performance of schools and higher
education.
8 The NASWD and IGA FFR can be found at http://www.federalfinancialrelations.gov.au/.
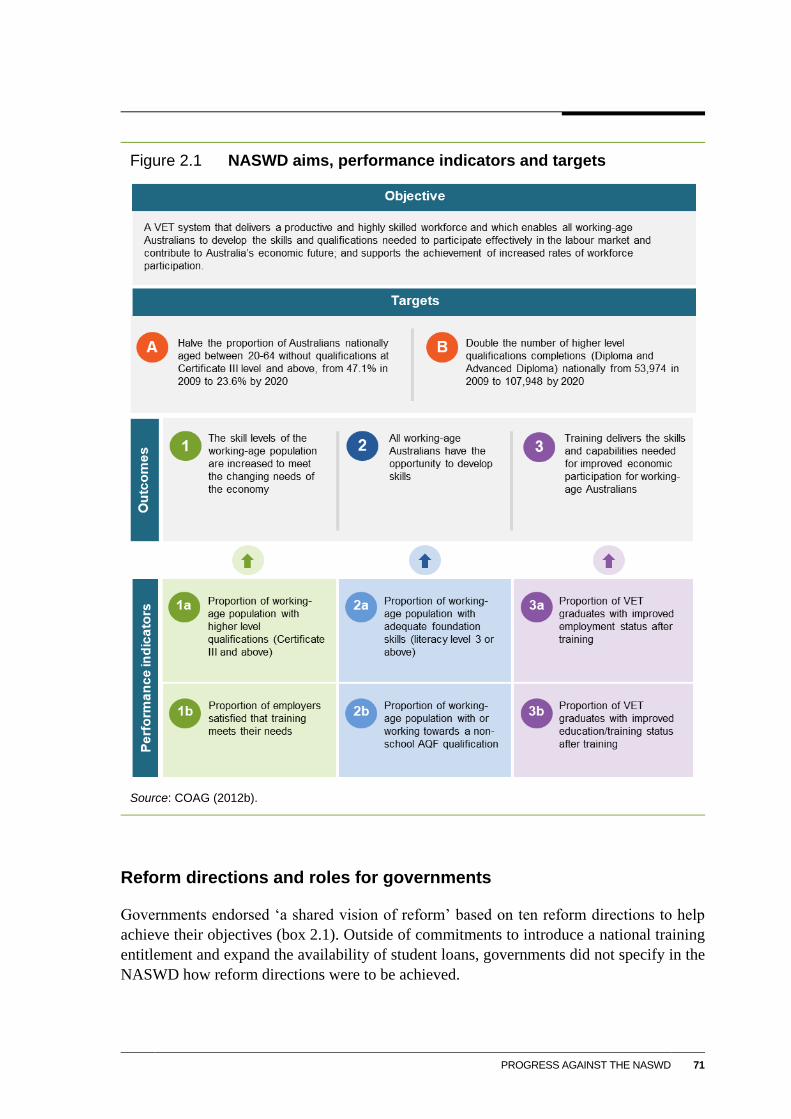
PROGRESS AGAINST THE NASWD 71
Figure 2.1 NASWD aims, performance indicators and targets
Source: COAG (2012b).
Reform directions and roles for governments
Governments endorsed ‘a shared vision of reform’ based on ten reform directions to help
achieve their objectives (box 2.1). Outside of commitments to introduce a national training
entitlement and expand the availability of student loans, governments did not specify in the
NASWD how reform directions were to be achieved.
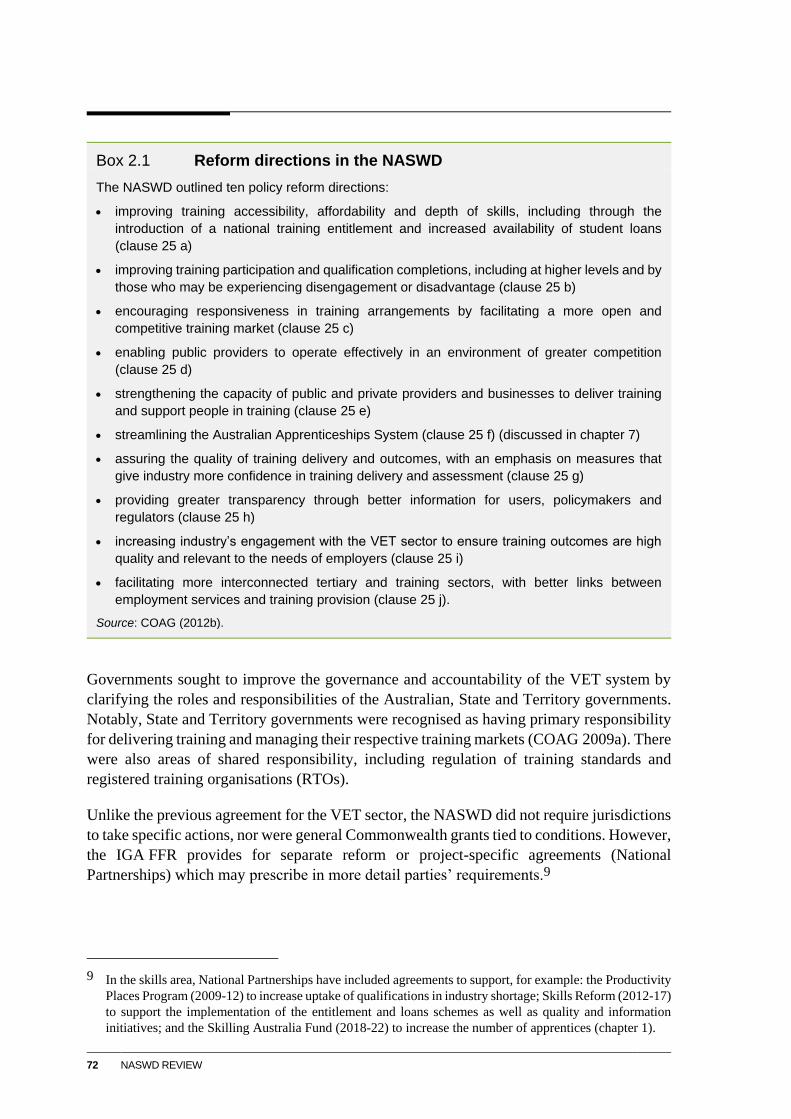
72 NASWD REVIEW
Box 2.1 Reform directions in the NASWD
The NASWD outlined ten policy reform directions:
improving training accessibility, affordability and depth of skills, including through the
introduction of a national training entitlement and increased availability of student loans
(clause 25 a)
improving training participation and qualification completions, including at higher levels and by
those who may be experiencing disengagement or disadvantage (clause 25 b)
encouraging responsiveness in training arrangements by facilitating a more open and
competitive training market (clause 25 c)
enabling public providers to operate effectively in an environment of greater competition
(clause 25 d)
strengthening the capacity of public and private providers and businesses to deliver training
and support people in training (clause 25 e)
streamlining the Australian Apprenticeships System (clause 25 f) (discussed in chapter 7)
assuring the quality of training delivery and outcomes, with an emphasis on measures that
give industry more confidence in training delivery and assessment (clause 25 g)
providing greater transparency through better information for users, policymakers and
regulators (clause 25 h)
increasing industry’s engagement with the VET sector to ensure training outcomes are high
quality and relevant to the needs of employers (clause 25 i)
facilitating more interconnected tertiary and training sectors, with better links between
employment services and training provision (clause 25 j).
Source: COAG (2012b).
Governments sought to improve the governance and accountability of the VET system by
clarifying the roles and responsibilities of the Australian, State and Territory governments.
Notably, State and Territory governments were recognised as having primary responsibility
for delivering training and managing their respective training markets (COAG 2009a). There
were also areas of shared responsibility, including regulation of training standards and
registered training organisations (RTOs).
Unlike the previous agreement for the VET sector, the NASWD did not require jurisdictions
to take specific actions, nor were general Commonwealth grants tied to conditions. However,
the IGA FFR provides for separate reform or project-specific agreements (National
Partnerships) which may prescribe in more detail parties’ requirements.9
9 In the skills area, National Partnerships have included agreements to support, for example: the Productivity
Places Program (2009-12) to increase uptake of qualifications in industry shortage; Skills Reform (2012-17)
to support the implementation of the entitlement and loans schemes as well as quality and information
initiatives; and the Skilling Australia Fund (2018-22) to increase the number of apprentices (chapter 1).
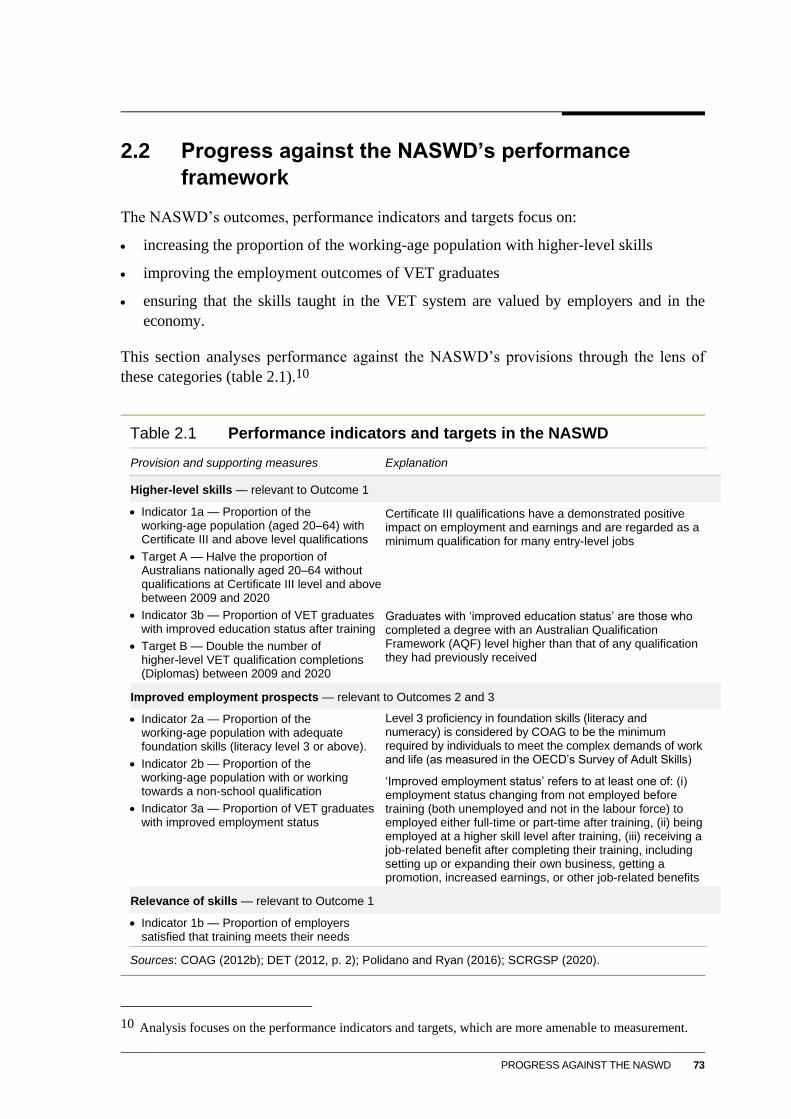
PROGRESS AGAINST THE NASWD 73
2.2 Progress against the NASWD’s performance
framework
The NASWD’s outcomes, performance indicators and targets focus on:
increasing the proportion of the working-age population with higher-level skills
improving the employment outcomes of VET graduates
ensuring that the skills taught in the VET system are valued by employers and in the
economy.
This section analyses performance against the NASWD’s provisions through the lens of
these categories (table 2.1).10
Table 2.1 Performance indicators and targets in the NASWD
Provision and supporting measures Explanation
Higher-level skills — relevant to Outcome 1
Indicator 1a — Proportion of the working-age population (aged 20–64) with Certificate III and above level qualifications
Target A — Halve the proportion of Australians nationally aged 20–64 without qualifications at Certificate III level and above between 2009 and 2020
Indicator 3b — Proportion of VET graduates with improved education status after training
Target B — Double the number of higher-level VET qualification completions (Diplomas) between 2009 and 2020
Certificate III qualifications have a demonstrated positive impact on employment and earnings and are regarded as a minimum qualification for many entry-level jobs
Graduates with ‘improved education status’ are those who completed a degree with an Australian Qualification Framework (AQF) level higher than that of any qualification they had previously received
Improved employment prospects — relevant to Outcomes 2 and 3
Indicator 2a — Proportion of the working-age population with adequate foundation skills (literacy level 3 or above).
Indicator 2b — Proportion of the working-age population with or working towards a non-school qualification
Indicator 3a — Proportion of VET graduates with improved employment status
Level 3 proficiency in foundation skills (literacy and numeracy) is considered by COAG to be the minimum required by individuals to meet the complex demands of work and life (as measured in the OECD’s Survey of Adult Skills)
‘Improved employment status’ refers to at least one of: (i) employment status changing from not employed before training (both unemployed and not in the labour force) to employed either full-time or part-time after training, (ii) being employed at a higher skill level after training, (iii) receiving a job-related benefit after completing their training, including setting up or expanding their own business, getting a promotion, increased earnings, or other job-related benefits
Relevance of skills — relevant to Outcome 1
Indicator 1b — Proportion of employers satisfied that training meets their needs
Sources: COAG (2012b); DET (2012, p. 2); Polidano and Ryan (2016); SCRGSP (2020).
10 Analysis focuses on the performance indicators and targets, which are more amenable to measurement.
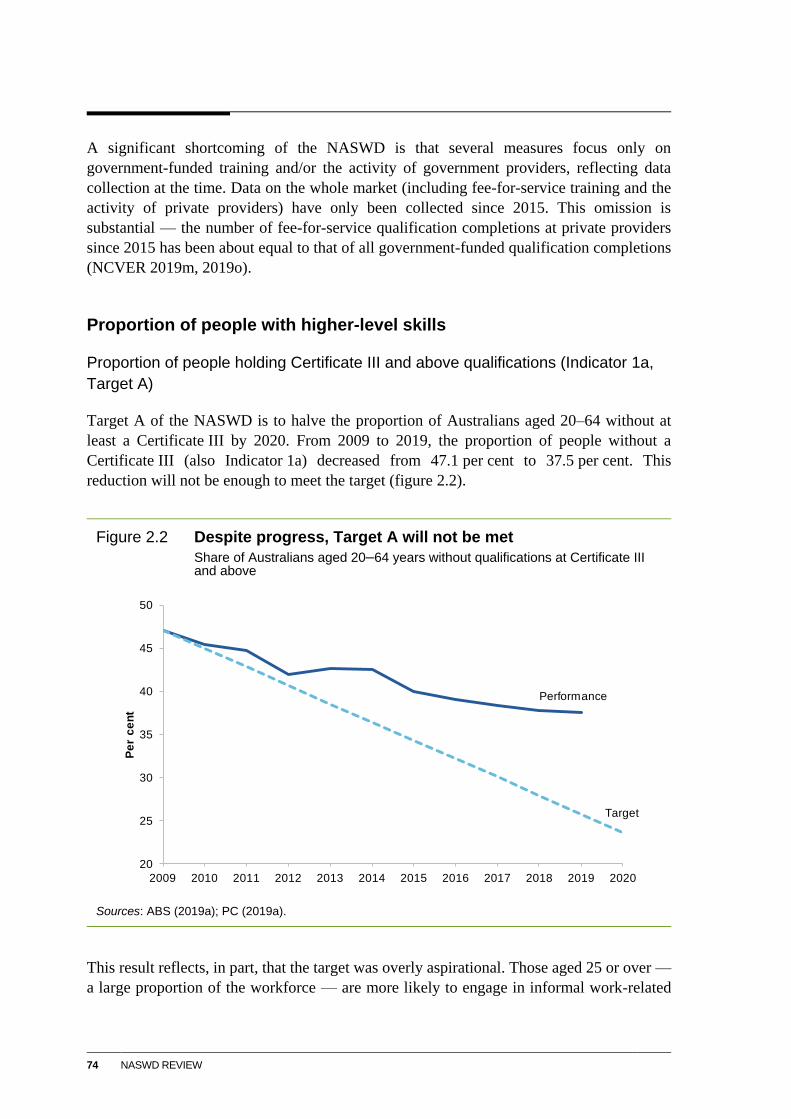
74 NASWD REVIEW
A significant shortcoming of the NASWD is that several measures focus only on
government-funded training and/or the activity of government providers, reflecting data
collection at the time. Data on the whole market (including fee-for-service training and the
activity of private providers) have only been collected since 2015. This omission is
substantial — the number of fee-for-service qualification completions at private providers
since 2015 has been about equal to that of all government-funded qualification completions
(NCVER 2019m, 2019o).
Proportion of people with higher-level skills
Proportion of people holding Certificate III and above qualifications (Indicator 1a,
Target A)
Target A of the NASWD is to halve the proportion of Australians aged 20–64 without at
least a Certificate III by 2020. From 2009 to 2019, the proportion of people without a
Certificate III (also Indicator 1a) decreased from 47.1 per cent to 37.5 per cent. This
reduction will not be enough to meet the target (figure 2.2).
Figure 2.2 Despite progress, Target A will not be met
Share of Australians aged 20–64 years without qualifications at Certificate III and above
Sources: ABS (2019a); PC (2019a).
This result reflects, in part, that the target was overly aspirational. Those aged 25 or over —
a large proportion of the workforce — are more likely to engage in informal work-related
20
25
30
35
40
45
50
2009 2010 2011 2012 2013 2014 2015 2016 2017 2018 2019 2020
Pe
r c
en
t
Performance
Target
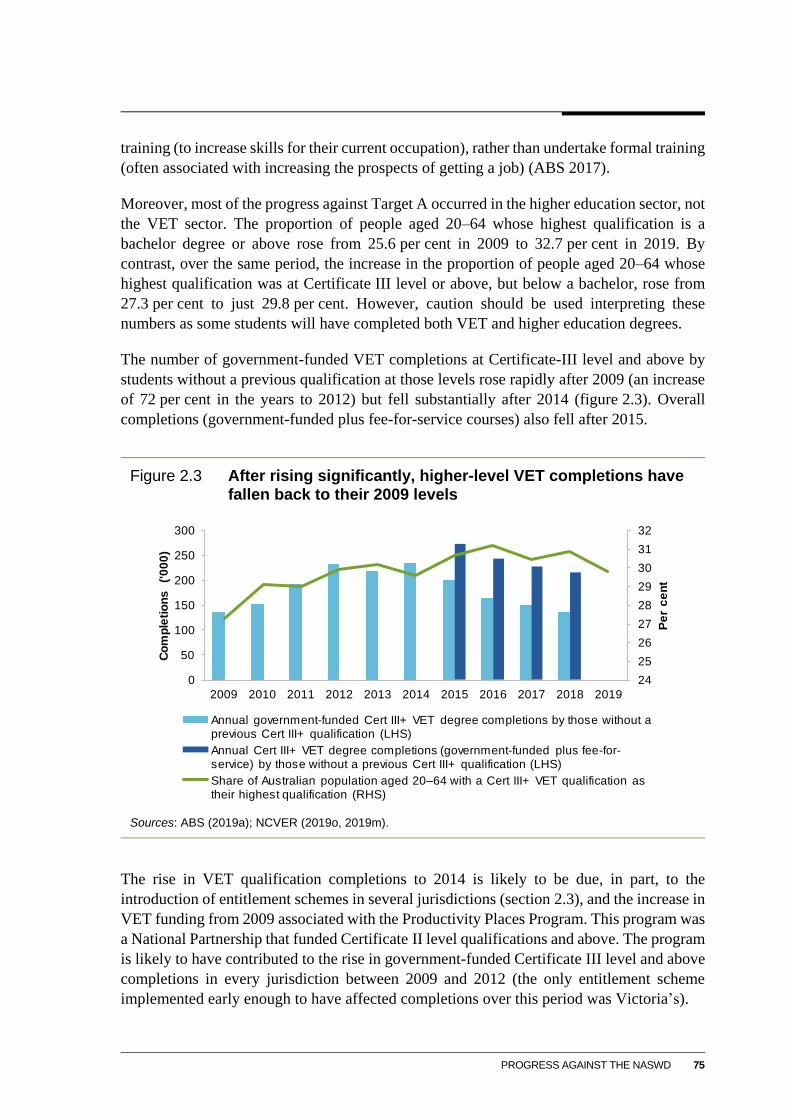
PROGRESS AGAINST THE NASWD 75
training (to increase skills for their current occupation), rather than undertake formal training
(often associated with increasing the prospects of getting a job) (ABS 2017).
Moreover, most of the progress against Target A occurred in the higher education sector, not
the VET sector. The proportion of people aged 20–64 whose highest qualification is a
bachelor degree or above rose from 25.6 per cent in 2009 to 32.7 per cent in 2019. By
contrast, over the same period, the increase in the proportion of people aged 20–64 whose
highest qualification was at Certificate III level or above, but below a bachelor, rose from
27.3 per cent to just 29.8 per cent. However, caution should be used interpreting these
numbers as some students will have completed both VET and higher education degrees.
The number of government-funded VET completions at Certificate-III level and above by
students without a previous qualification at those levels rose rapidly after 2009 (an increase
of 72 per cent in the years to 2012) but fell substantially after 2014 (figure 2.3). Overall
completions (government-funded plus fee-for-service courses) also fell after 2015.
Figure 2.3 After rising significantly, higher-level VET completions have fallen back to their 2009 levels
Sources: ABS (2019a); NCVER (2019o, 2019m).
The rise in VET qualification completions to 2014 is likely to be due, in part, to the
introduction of entitlement schemes in several jurisdictions (section 2.3), and the increase in
VET funding from 2009 associated with the Productivity Places Program. This program was
a National Partnership that funded Certificate II level qualifications and above. The program
is likely to have contributed to the rise in government-funded Certificate III level and above
completions in every jurisdiction between 2009 and 2012 (the only entitlement scheme
implemented early enough to have affected completions over this period was Victoria’s).
24
25
26
27
28
29
30
31
32
0
50
100
150
200
250
300
2009 2010 2011 2012 2013 2014 2015 2016 2017 2018 2019
Pe
r c
en
t
Co
mp
leti
on
s
('0
00
)
Annual government-funded Cert III+ VET degree completions by those without a previous Cert III+ qualification (LHS)
Annual Cert III+ VET degree completions (government-funded plus fee-for-service) by those without a previous Cert III+ qualification (LHS)
Share of Australian population aged 20–64 with a Cert III+ VET qualification as their highest qualification (RHS)
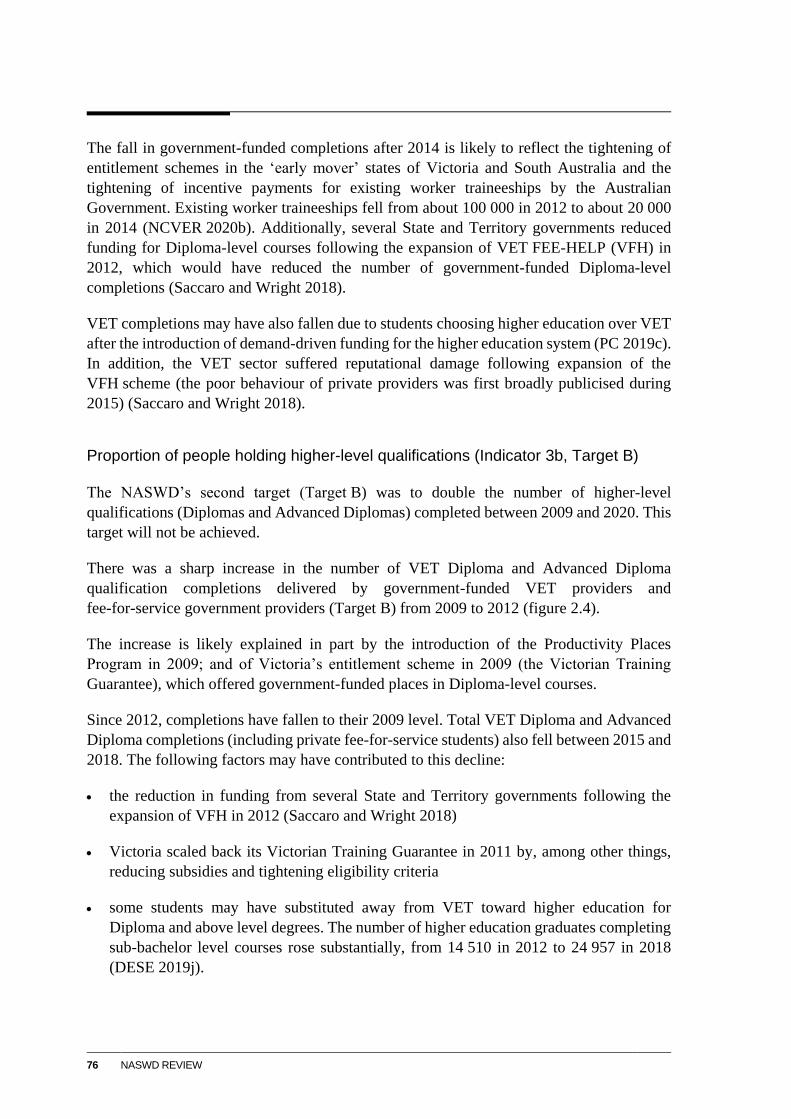
76 NASWD REVIEW
The fall in government-funded completions after 2014 is likely to reflect the tightening of
entitlement schemes in the ‘early mover’ states of Victoria and South Australia and the
tightening of incentive payments for existing worker traineeships by the Australian
Government. Existing worker traineeships fell from about 100 000 in 2012 to about 20 000
in 2014 (NCVER 2020b). Additionally, several State and Territory governments reduced
funding for Diploma-level courses following the expansion of VET FEE-HELP (VFH) in
2012, which would have reduced the number of government-funded Diploma-level
completions (Saccaro and Wright 2018).
VET completions may have also fallen due to students choosing higher education over VET
after the introduction of demand-driven funding for the higher education system (PC 2019c).
In addition, the VET sector suffered reputational damage following expansion of the
VFH scheme (the poor behaviour of private providers was first broadly publicised during
2015) (Saccaro and Wright 2018).
Proportion of people holding higher-level qualifications (Indicator 3b, Target B)
The NASWD’s second target (Target B) was to double the number of higher-level
qualifications (Diplomas and Advanced Diplomas) completed between 2009 and 2020. This
target will not be achieved.
There was a sharp increase in the number of VET Diploma and Advanced Diploma
qualification completions delivered by government-funded VET providers and
fee-for-service government providers (Target B) from 2009 to 2012 (figure 2.4).
The increase is likely explained in part by the introduction of the Productivity Places
Program in 2009; and of Victoria’s entitlement scheme in 2009 (the Victorian Training
Guarantee), which offered government-funded places in Diploma-level courses.
Since 2012, completions have fallen to their 2009 level. Total VET Diploma and Advanced
Diploma completions (including private fee-for-service students) also fell between 2015 and
2018. The following factors may have contributed to this decline:
the reduction in funding from several State and Territory governments following the
expansion of VFH in 2012 (Saccaro and Wright 2018)
Victoria scaled back its Victorian Training Guarantee in 2011 by, among other things,
reducing subsidies and tightening eligibility criteria
some students may have substituted away from VET toward higher education for
Diploma and above level degrees. The number of higher education graduates completing
sub-bachelor level courses rose substantially, from 14 510 in 2012 to 24 957 in 2018
(DESE 2019j).
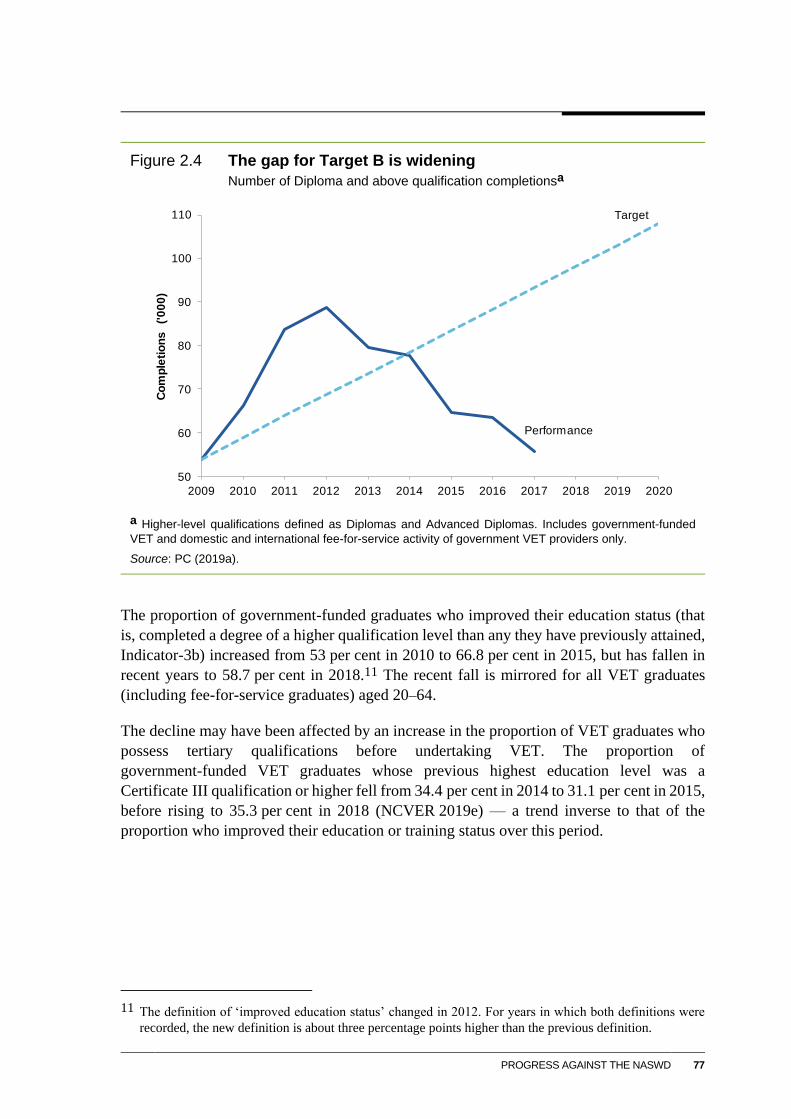
PROGRESS AGAINST THE NASWD 77
Figure 2.4 The gap for Target B is widening
Number of Diploma and above qualification completionsa
a Higher-level qualifications defined as Diplomas and Advanced Diplomas. Includes government-funded
VET and domestic and international fee-for-service activity of government VET providers only.
Source: PC (2019a).
The proportion of government-funded graduates who improved their education status (that
is, completed a degree of a higher qualification level than any they have previously attained,
Indicator-3b) increased from 53 per cent in 2010 to 66.8 per cent in 2015, but has fallen in
recent years to 58.7 per cent in 2018.11 The recent fall is mirrored for all VET graduates
(including fee-for-service graduates) aged 20–64.
The decline may have been affected by an increase in the proportion of VET graduates who
possess tertiary qualifications before undertaking VET. The proportion of
government-funded VET graduates whose previous highest education level was a
Certificate III qualification or higher fell from 34.4 per cent in 2014 to 31.1 per cent in 2015,
before rising to 35.3 per cent in 2018 (NCVER 2019e) — a trend inverse to that of the
proportion who improved their education or training status over this period.
11 The definition of ‘improved education status’ changed in 2012. For years in which both definitions were
recorded, the new definition is about three percentage points higher than the previous definition.
50
60
70
80
90
100
110
2009 2010 2011 2012 2013 2014 2015 2016 2017 2018 2019 2020
Co
mp
leti
on
s
('0
00
)
Performance
Target
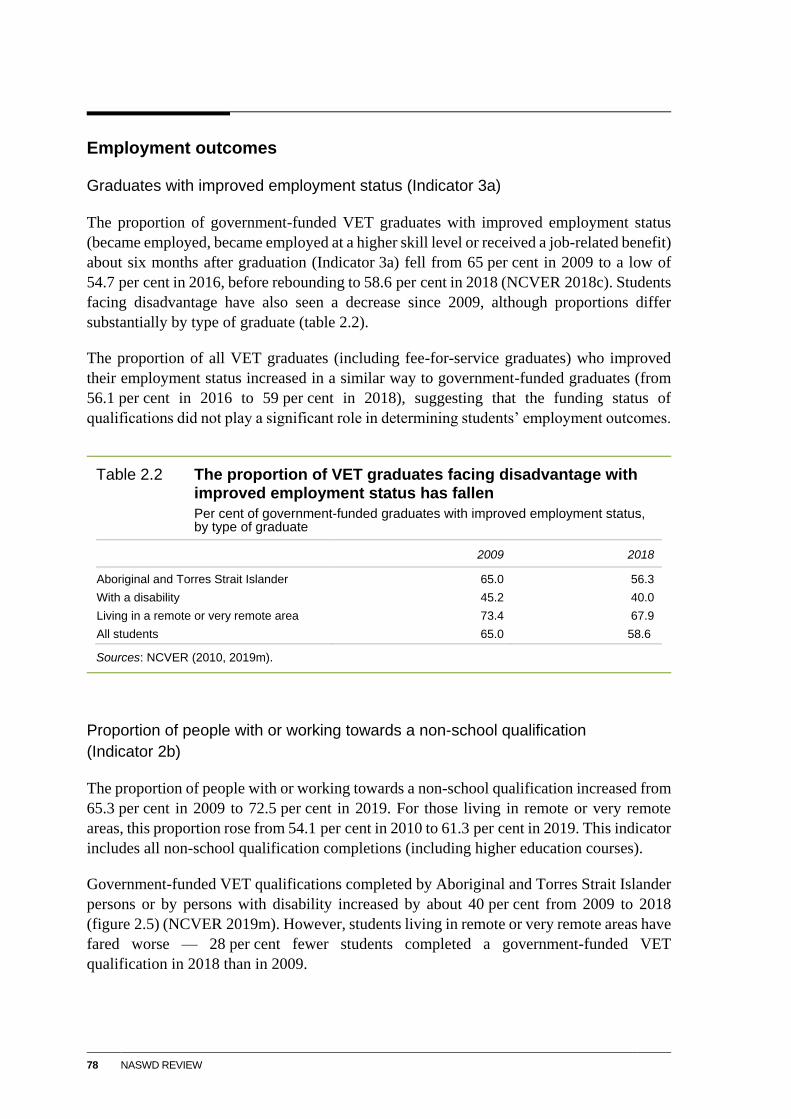
78 NASWD REVIEW
Employment outcomes
Graduates with improved employment status (Indicator 3a)
The proportion of government-funded VET graduates with improved employment status
(became employed, became employed at a higher skill level or received a job-related benefit)
about six months after graduation (Indicator 3a) fell from 65 per cent in 2009 to a low of
54.7 per cent in 2016, before rebounding to 58.6 per cent in 2018 (NCVER 2018c). Students
facing disadvantage have also seen a decrease since 2009, although proportions differ
substantially by type of graduate (table 2.2).
The proportion of all VET graduates (including fee-for-service graduates) who improved
their employment status increased in a similar way to government-funded graduates (from
56.1 per cent in 2016 to 59 per cent in 2018), suggesting that the funding status of
qualifications did not play a significant role in determining students’ employment outcomes.
Table 2.2 The proportion of VET graduates facing disadvantage with improved employment status has fallen
Per cent of government-funded graduates with improved employment status, by type of graduate
2009 2018
Aboriginal and Torres Strait Islander 65.0 56.3
With a disability 45.2 40.0
Living in a remote or very remote area 73.4 67.9
All students 65.0 58.6
Sources: NCVER (2010, 2019m).
Proportion of people with or working towards a non-school qualification
(Indicator 2b)
The proportion of people with or working towards a non-school qualification increased from
65.3 per cent in 2009 to 72.5 per cent in 2019. For those living in remote or very remote
areas, this proportion rose from 54.1 per cent in 2010 to 61.3 per cent in 2019. This indicator
includes all non-school qualification completions (including higher education courses).
Government-funded VET qualifications completed by Aboriginal and Torres Strait Islander
persons or by persons with disability increased by about 40 per cent from 2009 to 2018
(figure 2.5) (NCVER 2019m). However, students living in remote or very remote areas have
fared worse — 28 per cent fewer students completed a government-funded VET
qualification in 2018 than in 2009.
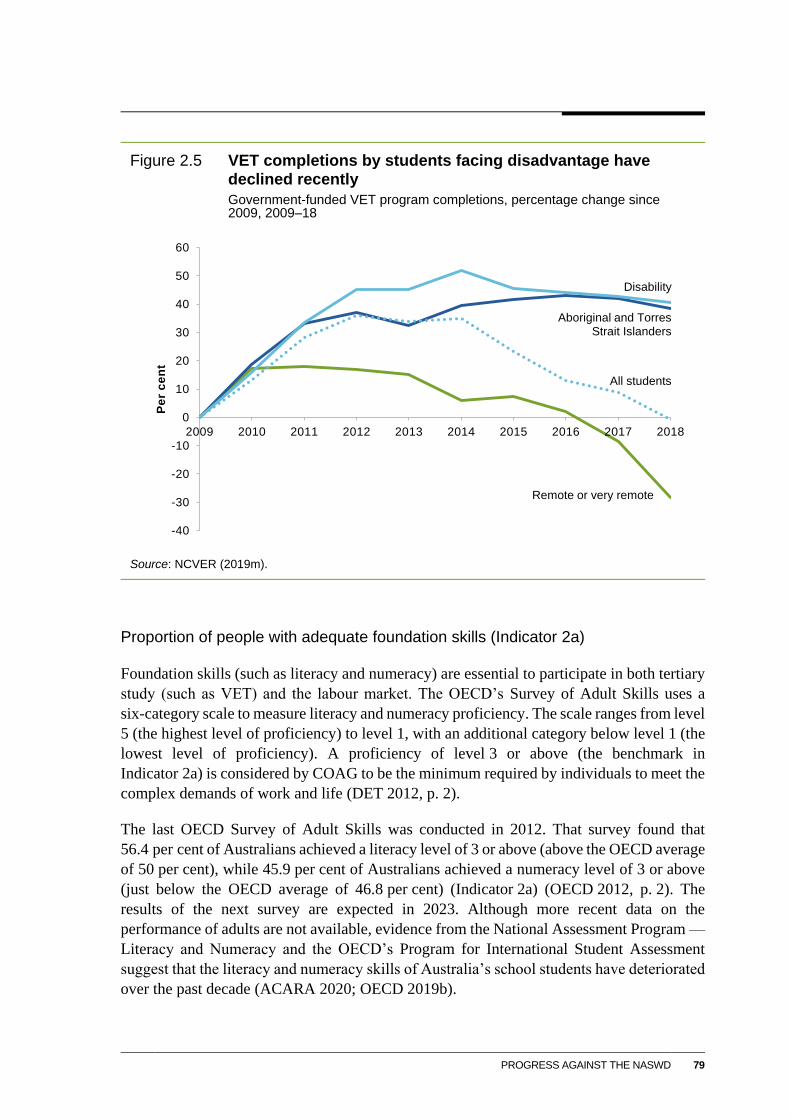
PROGRESS AGAINST THE NASWD 79
Figure 2.5 VET completions by students facing disadvantage have declined recently
Government-funded VET program completions, percentage change since 2009, 2009–18
Source: NCVER (2019m).
Proportion of people with adequate foundation skills (Indicator 2a)
Foundation skills (such as literacy and numeracy) are essential to participate in both tertiary
study (such as VET) and the labour market. The OECD’s Survey of Adult Skills uses a
six-category scale to measure literacy and numeracy proficiency. The scale ranges from level
5 (the highest level of proficiency) to level 1, with an additional category below level 1 (the
lowest level of proficiency). A proficiency of level 3 or above (the benchmark in
Indicator 2a) is considered by COAG to be the minimum required by individuals to meet the
complex demands of work and life (DET 2012, p. 2).
The last OECD Survey of Adult Skills was conducted in 2012. That survey found that
56.4 per cent of Australians achieved a literacy level of 3 or above (above the OECD average
of 50 per cent), while 45.9 per cent of Australians achieved a numeracy level of 3 or above
(just below the OECD average of 46.8 per cent) (Indicator 2a) (OECD 2012, p. 2). The
results of the next survey are expected in 2023. Although more recent data on the
performance of adults are not available, evidence from the National Assessment Program —
Literacy and Numeracy and the OECD’s Program for International Student Assessment
suggest that the literacy and numeracy skills of Australia’s school students have deteriorated
over the past decade (ACARA 2020; OECD 2019b).
-40
-30
-20
-10
0
10
20
30
40
50
60
2009 2010 2011 2012 2013 2014 2015 2016 2017 2018
Pe
r c
en
t
Remote or very remote
Aboriginal and Torres Strait Islanders
Disability
All students
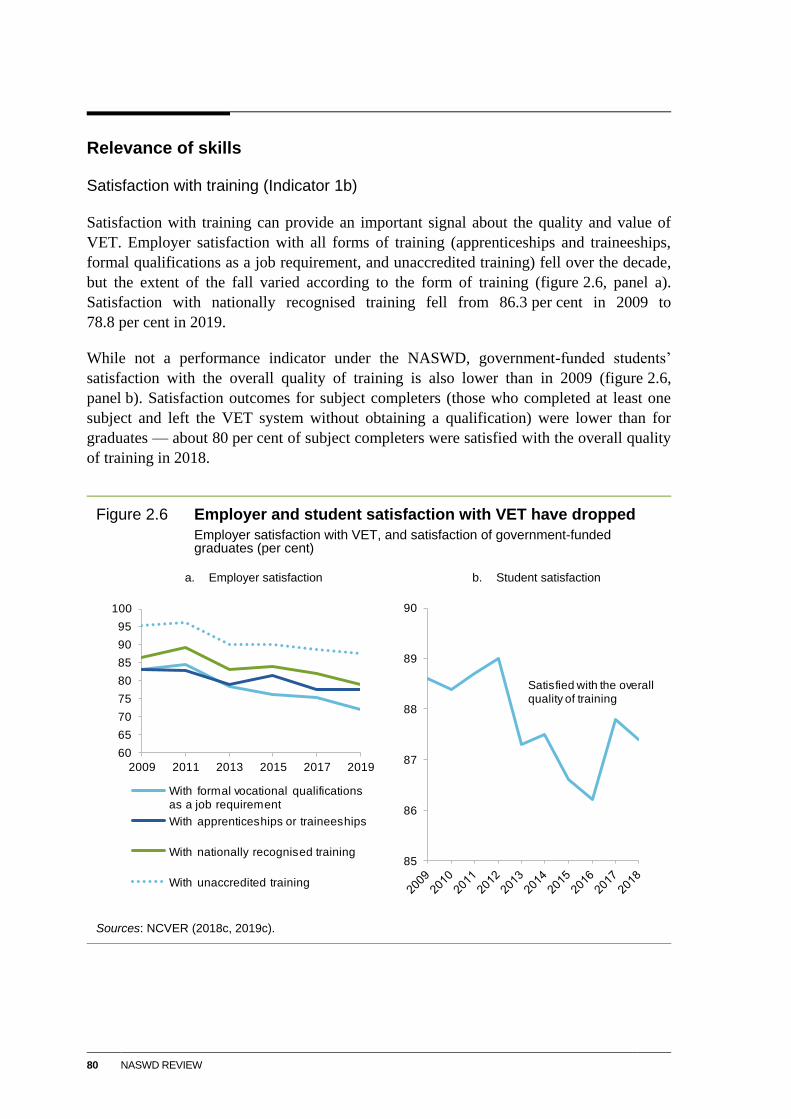
80 NASWD REVIEW
Relevance of skills
Satisfaction with training (Indicator 1b)
Satisfaction with training can provide an important signal about the quality and value of
VET. Employer satisfaction with all forms of training (apprenticeships and traineeships,
formal qualifications as a job requirement, and unaccredited training) fell over the decade,
but the extent of the fall varied according to the form of training (figure 2.6, panel a).
Satisfaction with nationally recognised training fell from 86.3 per cent in 2009 to
78.8 per cent in 2019.
While not a performance indicator under the NASWD, government-funded students’
satisfaction with the overall quality of training is also lower than in 2009 (figure 2.6,
panel b). Satisfaction outcomes for subject completers (those who completed at least one
subject and left the VET system without obtaining a qualification) were lower than for
graduates — about 80 per cent of subject completers were satisfied with the overall quality
of training in 2018.
Figure 2.6 Employer and student satisfaction with VET have dropped
Employer satisfaction with VET, and satisfaction of government-funded graduates (per cent)
a. Employer satisfaction b. Student satisfaction
Sources: NCVER (2018c, 2019c).
60
65
70
75
80
85
90
95
100
2009 2011 2013 2015 2017 2019
With formal vocational qualifications as a job requirement
With apprenticeships or traineeships
With nationally recognised training
With unaccredited training
85
86
87
88
89
90
Satisfied with the overall quality of training
PROGRESS AGAINST THE NASWD 81
Relevance of qualifications to employment
The relevance of an individual’s qualification to their job can indicate whether the skills
taught in the qualification are valued. The proportion of people with a Certificate III/IV
degree as their highest qualification working in the field of their qualification rose from
61.1 per cent in 2010-11 to 73.9 per cent in 2015 (ABS 2012, 2016).
INTERIM FINDING 2.1 — NASWD PERFORMANCE FRAMEWORK
Governments’ targets on skills formation will not be met. Progress against other
performance measures, such as employer satisfaction and improvements in
employment and education status, is mixed.
2.3 Progress on reform directions
There has been some progress against the NASWD’s reform directions (box 2.1), as outlined
below. Progress to streamline support for apprenticeships is considered in chapter 7, which
discusses coordination and streamlining opportunities across the system.
Improving access to VET (NASWD clauses 25 a and b)
Governments sought to improve access, especially for students facing disadvantage, and help
achieve the NASWD targets by introducing a national training entitlement (a guaranteed
subsidised training place for all working-age Australians undertaking their first
Certificate III or above qualification) and extending the availability of income contingent
student loans.
The Australian Government expanded access to the student loan scheme, VET FEE-HELP,
in 2013 by removing the restriction that loans could only be offered for Diploma and
Graduate Diploma qualifications with articulation (credit transfer) arrangements with a
higher education provider. Upon its expansion, the Australian Government also removed the
20 per cent loan fee applying to subsidised training places and streamlined other
administrative requirements (DIISRTE 2012). Governments intended that this initiative
would work with any offer of entitlements above the minimum Certificate III level to
promote competition in the market (Saccaro and Wright 2018).
In addition to reducing financial barriers to training, the national training entitlement and
expanded loans scheme were intended to promote a more responsive training market through
‘user choice’-led competition, with students permitted to choose their preferred training
provider (Bowman and McKenna 2016a; COAG 2012b).
82 NASWD REVIEW
A national, but not uniform, training entitlement
COAG agreed in the 2012 National Partnership Agreement on Skills Reform that
jurisdictions would introduce or strengthen entitlement schemes based on the following
essential criteria:
the entitlement was to be available as a minimum to all working-age Australians without
a Certificate III or higher qualification subject to meeting any State (or Territory)
eligibility criteria
schemes should cover foundation skills or lower qualifications contained within a
Certificate III
schemes should be open to any registered training organisation (RTO), public or private,
provided they meet state criteria for provision of subsidised services (COAG 2012d).
Beyond these requirements, the design and implementation of entitlement schemes were left
to each State and Territory government to decide.
Jurisdictions implemented the national entitlement in different ways and at different times.
Victoria and South Australia, the first two states to introduce entitlements, had schemes most
closely aligned to the idea of demand-led services, and at first, did not restrict course
selection or cap the number of government-funded places.
Victoria and South Australia tightened their schemes in 2011 and 2013, respectively, due to
concerns on such issues as the public value of some subsidised training, higher than expected
costs, and unscrupulous conduct by a few providers (ACIL Allen Consulting 2015a; DEECD
(Vic) 2012; Hetherington and Rust 2013). Victoria’s and South Australia’s experience
influenced the design of subsidy schemes elsewhere. Notably, governments shifted from
supporting competition through greater user choice to a more managed market, which saw
greater use of contestable government contracts.
Since 2015, all jurisdictions have restricted entitlements to cover only courses deemed to
meet industry skills needs. (The availability of income contingent loans has also been
restricted to include only courses reflecting employment goals and skills needs.) Entitlement
schemes (as is the case for other course subsidy programs) differ across States and Territories
with respect to student eligibility, provider requirements and subsidy rates. Students can still
choose between providers, but only courses from a pre-selected list.
The extent of user choice is difficult to discern. Although not directly attributable to the
NASWD, some jurisdictions adjusted subsidy models to introduce greater competition and
choice, albeit in a more gradual fashion (NCVER 2019h).
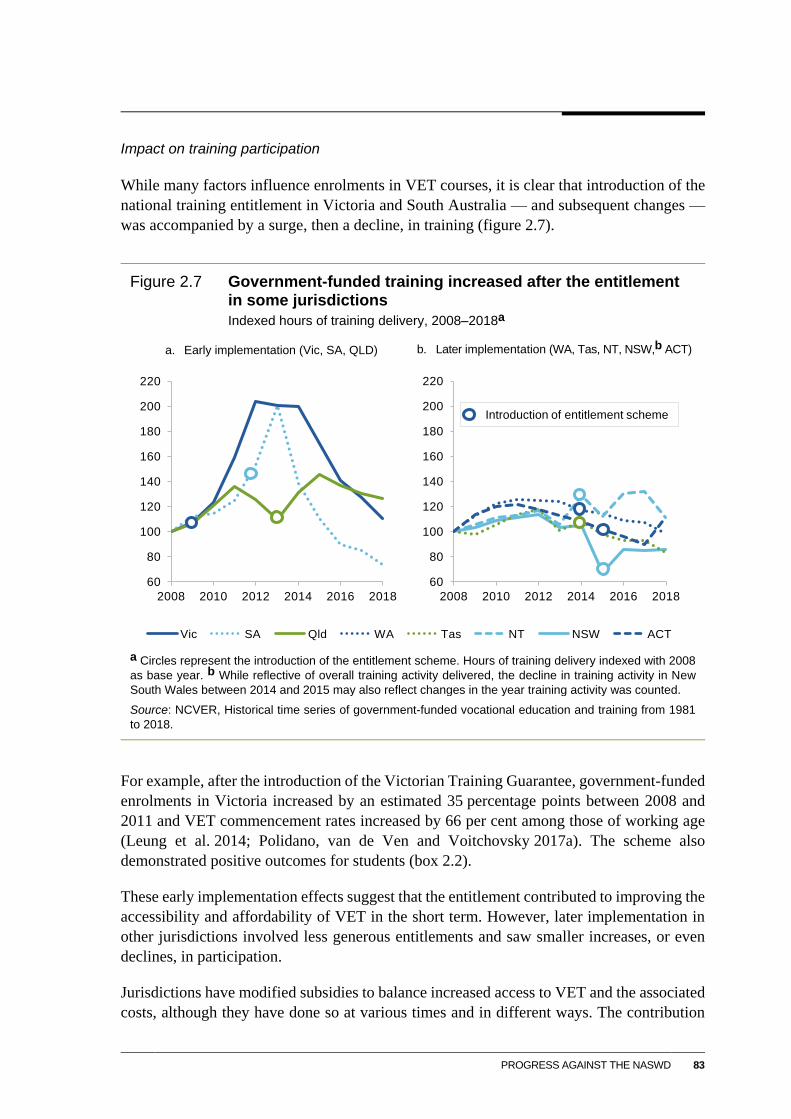
PROGRESS AGAINST THE NASWD 83
Impact on training participation
While many factors influence enrolments in VET courses, it is clear that introduction of the
national training entitlement in Victoria and South Australia — and subsequent changes —
was accompanied by a surge, then a decline, in training (figure 2.7).
Figure 2.7 Government-funded training increased after the entitlement in some jurisdictions
Indexed hours of training delivery, 2008–2018a
a. Early implementation (Vic, SA, QLD) b. Later implementation (WA, Tas, NT, NSW,b ACT)
a Circles represent the introduction of the entitlement scheme. Hours of training delivery indexed with 2008
as base year. b While reflective of overall training activity delivered, the decline in training activity in New
South Wales between 2014 and 2015 may also reflect changes in the year training activity was counted.
Source: NCVER, Historical time series of government-funded vocational education and training from 1981
to 2018.
For example, after the introduction of the Victorian Training Guarantee, government-funded
enrolments in Victoria increased by an estimated 35 percentage points between 2008 and
2011 and VET commencement rates increased by 66 per cent among those of working age
(Leung et al. 2014; Polidano, van de Ven and Voitchovsky 2017a). The scheme also
demonstrated positive outcomes for students (box 2.2).
These early implementation effects suggest that the entitlement contributed to improving the
accessibility and affordability of VET in the short term. However, later implementation in
other jurisdictions involved less generous entitlements and saw smaller increases, or even
declines, in participation.
Jurisdictions have modified subsidies to balance increased access to VET and the associated
costs, although they have done so at various times and in different ways. The contribution
60
80
100
120
140
160
180
200
220
2008 2010 2012 2014 2016 2018
60
80
100
120
140
160
180
200
220
2008 2010 2012 2014 2016 2018
Introduction of entitlement scheme
60
80
100
120
140
160
180
200
220
2008 2009 2010 2011 2012 2013 2014 2015 2016 2017 2018
Vic SA Qld WA Tas NT NSW ACT
84 NASWD REVIEW
of changes in subsidy settings, and their subsequent effects on training participation across
jurisdictions, are discussed further in chapter 5.
Box 2.2 The Victorian Training Guarantee
Under the Victorian Training Guarantee (VTG), students aged 15 to 19 years had access to a
government-funded training place at any qualification level. Students aged 20 years and over had
access to any foundation skills, or for a qualification higher than the level already held.
For students aged 15 to 19 years, the VTG was estimated to improve chances of full-time
employment, improve student course satisfaction, as well as increase completion rates and
enrolments in areas of skill demand. Enrolment growth was mostly captured by private providers,
where courses were less aligned to areas of identified skills need than public providers. A potential
explanation for this is that, compared to older age groups, these students were less concerned
about employment prospects and more likely to enrol in courses with high consumption value,
such as health and fitness courses.
Increased participation was less evident for those aged 20 to 24 years, possibly because of
‘upskilling’ eligibility restrictions — students could only take courses higher than the level already
held — given initial concerns about student ‘churn’ through lower-level qualifications. Some
students might have otherwise benefitted from reskilling, or from courses at the same Australian
Qualification Framework level.
For students aged 25 to 54 years, there was evidence of improved participation, better matching
to identified areas of skills demand, and increases in expected wage premiums, including among
those who were unemployed, from a non-English speaking background, living in a low
socioeconomic status area, with a disability, or of Aboriginal and Torres Strait Islander
backgrounds.
Sources: Hetherington and Rust (2013); Leung et al. (2014); McVicar and Polidano (2015); Polidano, van
de Ven and Voitchovsky (2017a); Victorian Government (2008).
Expansion of VET FEE-HELP
The expanded VFH scheme operated between 2013 and 2016. VFH was tightened in 2015
and replaced in January 2017 by VET Student Loans (VSL) following evidence of
significant unscrupulous conduct by some training providers.
Several reviews have documented significant design flaws with VFH, including that
providers received the full fee upfront per enrolment, while self-reporting enrolment
numbers. This created incentives to maximise enrolments, with few checks and balances to
ensure students were genuinely enrolled and undertaking their courses (ANAO 2017;
DOE 2016; EERC 2015). In contrast to governments’ intentions under the National
Partnership Agreement on Skills Reform, the expansion of loan availability was not
accompanied by an adequate quality framework for training, supervision of providers and
courses, information for students to enable them to make informed choices between
providers, or monitoring of the cost of tuition fees. There were also inadequate complaint
mechanisms when problems did emerge.
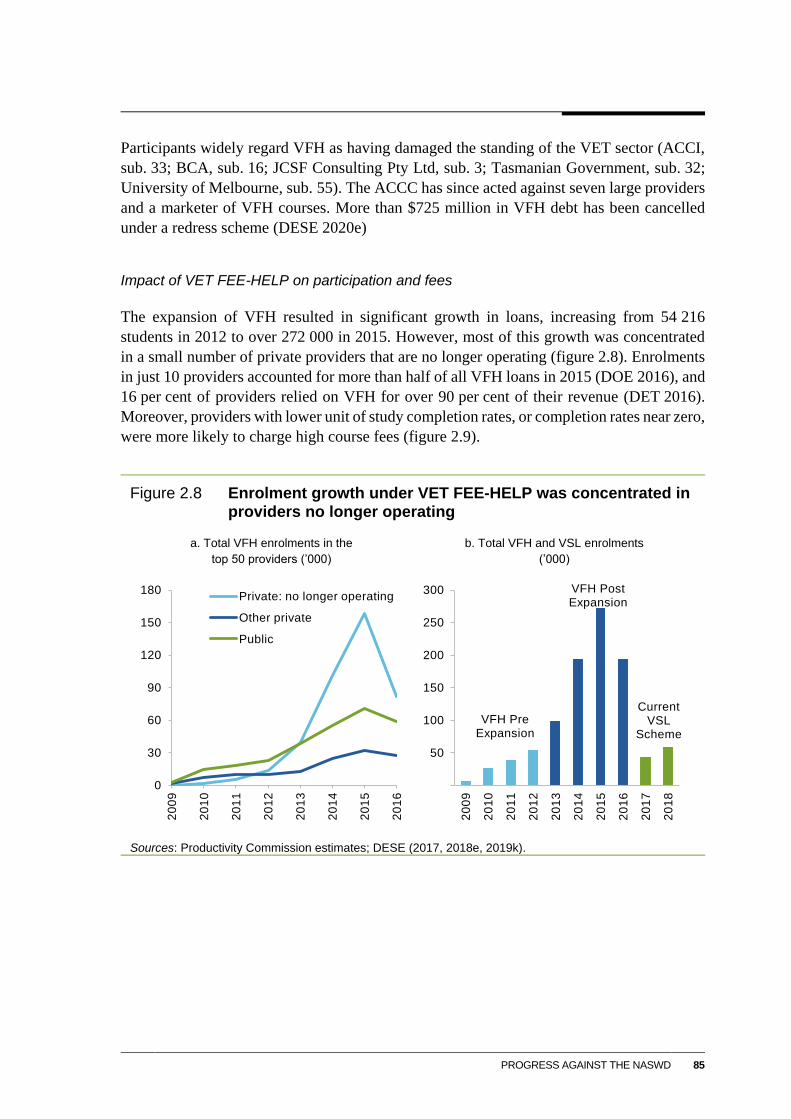
PROGRESS AGAINST THE NASWD 85
Participants widely regard VFH as having damaged the standing of the VET sector (ACCI,
sub. 33; BCA, sub. 16; JCSF Consulting Pty Ltd, sub. 3; Tasmanian Government, sub. 32;
University of Melbourne, sub. 55). The ACCC has since acted against seven large providers
and a marketer of VFH courses. More than $725 million in VFH debt has been cancelled
under a redress scheme (DESE 2020e)
Impact of VET FEE-HELP on participation and fees
The expansion of VFH resulted in significant growth in loans, increasing from 54 216
students in 2012 to over 272 000 in 2015. However, most of this growth was concentrated
in a small number of private providers that are no longer operating (figure 2.8). Enrolments
in just 10 providers accounted for more than half of all VFH loans in 2015 (DOE 2016), and
16 per cent of providers relied on VFH for over 90 per cent of their revenue (DET 2016).
Moreover, providers with lower unit of study completion rates, or completion rates near zero,
were more likely to charge high course fees (figure 2.9).
Figure 2.8 Enrolment growth under VET FEE-HELP was concentrated in providers no longer operating
a. Total VFH enrolments in the
top 50 providers (’000)
b. Total VFH and VSL enrolments
(’000)
Sources: Productivity Commission estimates; DESE (2017, 2018e, 2019k).
0
30
60
90
120
150
180
20
09
20
10
20
11
20
12
20
13
20
14
20
15
20
16
Private: no longer operating
Other private
Public
VFH Pre Expansion
VFH Post Expansion
Current VSL
Scheme
50
100
150
200
250
300
20
09
20
10
20
11
20
12
20
13
20
14
20
15
20
16
20
17
20
18
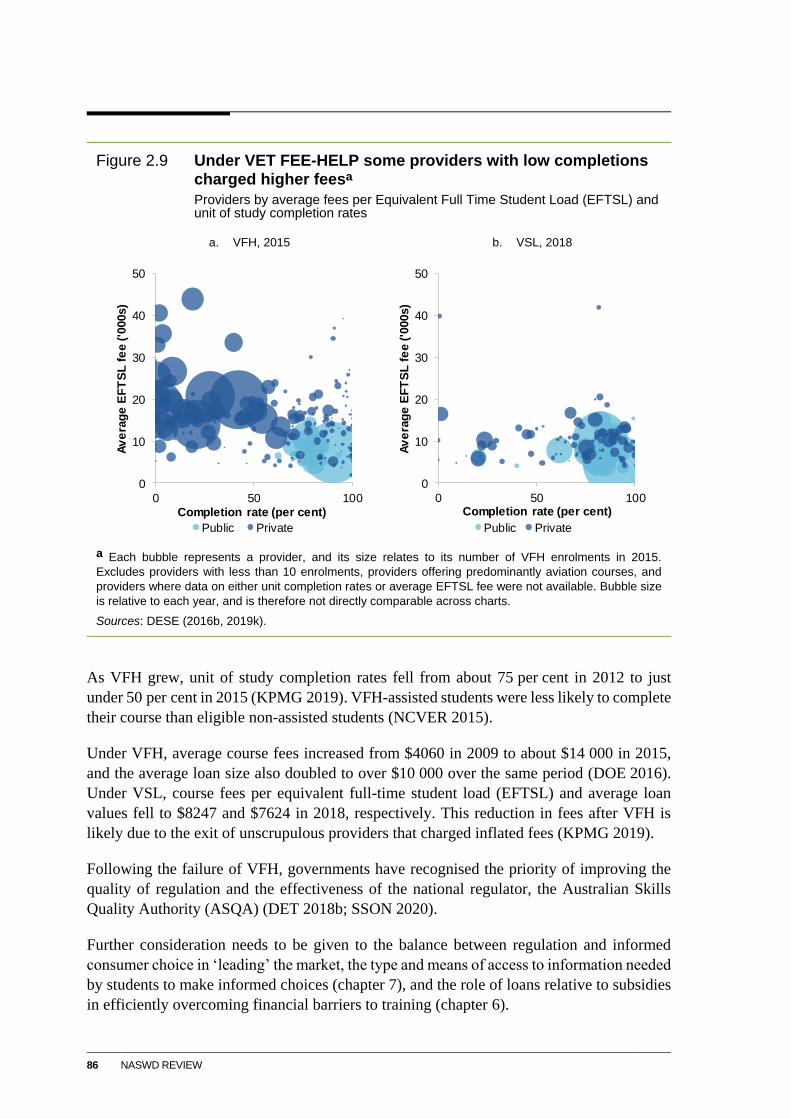
86 NASWD REVIEW
Figure 2.9 Under VET FEE-HELP some providers with low completions charged higher feesa
Providers by average fees per Equivalent Full Time Student Load (EFTSL) and unit of study completion rates
a. VFH, 2015 b. VSL, 2018
a Each bubble represents a provider, and its size relates to its number of VFH enrolments in 2015.
Excludes providers with less than 10 enrolments, providers offering predominantly aviation courses, and
providers where data on either unit completion rates or average EFTSL fee were not available. Bubble size
is relative to each year, and is therefore not directly comparable across charts.
Sources: DESE (2016b, 2019k).
As VFH grew, unit of study completion rates fell from about 75 per cent in 2012 to just
under 50 per cent in 2015 (KPMG 2019). VFH-assisted students were less likely to complete
their course than eligible non-assisted students (NCVER 2015).
Under VFH, average course fees increased from $4060 in 2009 to about $14 000 in 2015,
and the average loan size also doubled to over $10 000 over the same period (DOE 2016).
Under VSL, course fees per equivalent full-time student load (EFTSL) and average loan
values fell to $8247 and $7624 in 2018, respectively. This reduction in fees after VFH is
likely due to the exit of unscrupulous providers that charged inflated fees (KPMG 2019).
Following the failure of VFH, governments have recognised the priority of improving the
quality of regulation and the effectiveness of the national regulator, the Australian Skills
Quality Authority (ASQA) (DET 2018b; SSON 2020).
Further consideration needs to be given to the balance between regulation and informed
consumer choice in ‘leading’ the market, the type and means of access to information needed
by students to make informed choices (chapter 7), and the role of loans relative to subsidies
in efficiently overcoming financial barriers to training (chapter 6).
0
10
20
30
40
50
0 50 100
Av
era
ge
EF
TS
L f
ee
('0
00s)
Completion rate (per cent)
Public Private
0
10
20
30
40
50
0 50 100
Av
era
ge
EF
TS
L f
ee
('0
00s)
Completion rate (per cent)
Public Private
PROGRESS AGAINST THE NASWD 87
INTERIM FINDING 2.2 — GOVERNMENT-FUNDED VET PARTICIPATION
Key reforms under the NASWD — the national training entitlement and expansion of
student loans (VET FEE-HELP) — initially increased participation but incentives were
later wound back because of escalating costs and rorting. Overall participation rates are
now at or below pre-NASWD levels.
A responsive and efficient market (NASWD clauses 25 c, d and e)
Governments believed a ‘more open and competitive training market’ would improve access
to training, affordability and course quality (COAG 2012b). Greater user choice — through
the national entitlement and income contingent loans — was expected to drive this change
in the market. These initiatives built on a series of competition reforms since the 1990s
(Ryan 2011).
Anticipating a more competitive market, governments agreed to implement reforms to help
public training providers (TAFEs, skills institutes, polytechnic and dual-sector government
universities) adjust to the new conditions (COAG 2012a, 2012b).
As noted above, competition is now being promoted through contestable contracts for
subsidised services rather than user choice. Quality and other concerns, such as the failure
of VET FEE-HELP, have prompted a renewed emphasis on public provision in some States
and Territories.
A more open and competitive training market?
The NASWD performance framework did not include indicators related to competition or the
efficiency of the VET market. More generally, governments do not systematically monitor
how efficiently the market is operating, as may be indicated by measures of how well scarce
resources are being allocated and how well services are meeting and anticipating needs.
The proportion of government funding that is contestable and the market share of public
providers provides an insight, although limited, into how the VET market has changed.
Available estimates indicate that, overall, the proportion of government funding that is
contestable has increased since the introduction of the NASWD from 21 to about 50 per cent
of total funding in 2018 (figure 2.10), with non-TAFE RTOs securing 41 per cent of that
pool (SCRGSP 2020). In 2018, public providers received more than 70 per cent of
government funding for VET delivery and capital (NCVER 2019d). The share of
government-funded training hours delivered by private providers has increased since 2008,
but public providers remain dominant (figure 2.11).
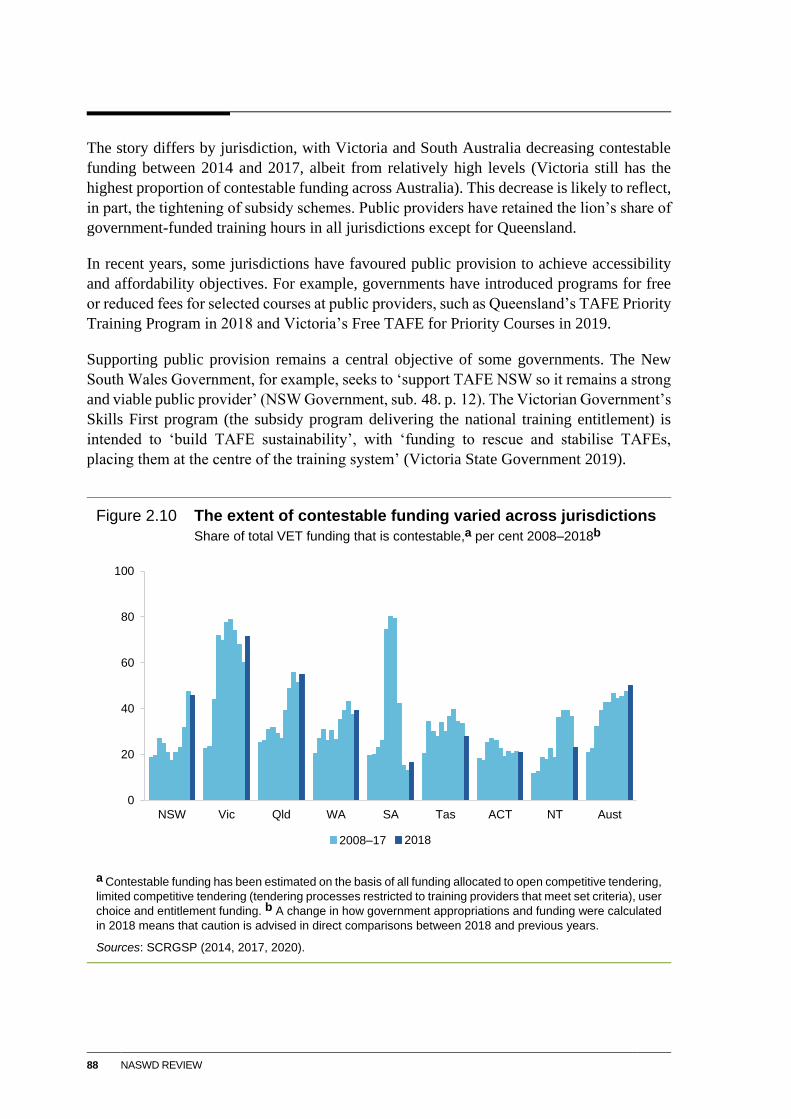
88 NASWD REVIEW
The story differs by jurisdiction, with Victoria and South Australia decreasing contestable
funding between 2014 and 2017, albeit from relatively high levels (Victoria still has the
highest proportion of contestable funding across Australia). This decrease is likely to reflect,
in part, the tightening of subsidy schemes. Public providers have retained the lion’s share of
government-funded training hours in all jurisdictions except for Queensland.
In recent years, some jurisdictions have favoured public provision to achieve accessibility
and affordability objectives. For example, governments have introduced programs for free
or reduced fees for selected courses at public providers, such as Queensland’s TAFE Priority
Training Program in 2018 and Victoria’s Free TAFE for Priority Courses in 2019.
Supporting public provision remains a central objective of some governments. The New
South Wales Government, for example, seeks to ‘support TAFE NSW so it remains a strong
and viable public provider’ (NSW Government, sub. 48. p. 12). The Victorian Government’s
Skills First program (the subsidy program delivering the national training entitlement) is
intended to ‘build TAFE sustainability’, with ‘funding to rescue and stabilise TAFEs,
placing them at the centre of the training system’ (Victoria State Government 2019).
Figure 2.10 The extent of contestable funding varied across jurisdictions
Share of total VET funding that is contestable,a per cent 2008–2018b
a Contestable funding has been estimated on the basis of all funding allocated to open competitive tendering,
limited competitive tendering (tendering processes restricted to training providers that meet set criteria), user
choice and entitlement funding. b A change in how government appropriations and funding were calculated
in 2018 means that caution is advised in direct comparisons between 2018 and previous years.
Sources: SCRGSP (2014, 2017, 2020).
0
20
40
60
80
100
NSW Vic Qld WA SA Tas ACT NT Aust
2008–17 2018
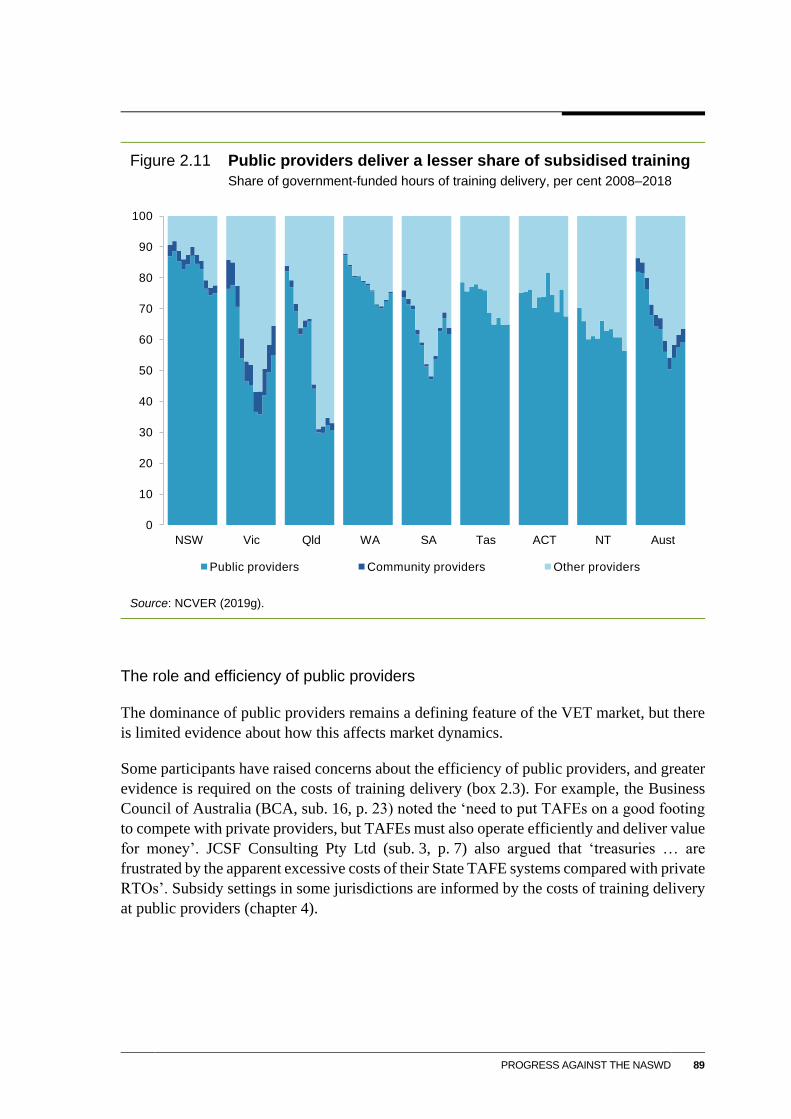
PROGRESS AGAINST THE NASWD 89
Figure 2.11 Public providers deliver a lesser share of subsidised training
Share of government-funded hours of training delivery, per cent 2008–2018
Source: NCVER (2019g).
The role and efficiency of public providers
The dominance of public providers remains a defining feature of the VET market, but there
is limited evidence about how this affects market dynamics.
Some participants have raised concerns about the efficiency of public providers, and greater
evidence is required on the costs of training delivery (box 2.3). For example, the Business
Council of Australia (BCA, sub. 16, p. 23) noted the ‘need to put TAFEs on a good footing
to compete with private providers, but TAFEs must also operate efficiently and deliver value
for money’. JCSF Consulting Pty Ltd (sub. 3, p. 7) also argued that ‘treasuries … are
frustrated by the apparent excessive costs of their State TAFE systems compared with private
RTOs’. Subsidy settings in some jurisdictions are informed by the costs of training delivery
at public providers (chapter 4).
0
10
20
30
40
50
60
70
80
90
100
Public providers Community providers Other providers
NTNSW Vic Qld WA SA Tas ACT Aust
90 NASWD REVIEW
Box 2.3 Factors affecting the cost of delivery at public providers
There is some evidence that public providers may have higher costs than private providers. VET
delivery is often labour-intensive, and employee expenses constitute the largest share of total
expenses — estimated at over 60 per cent based on a sample of public and not-for-profit
providers. For public providers, high labour costs may reflect restrictions in State and Territory
industrial awards which set wages and conditions. For example, the Queensland Audit Office
(2019) identified that:
The Queensland Government’s current award and industrial relations agreements mean that TAFEQ is
not able to significantly reduce its costs due to an employee-cost structure that it cannot fully control. It,
therefore, cannot compete directly on cost with the private sector. (p. 11)
Analysis of TAFE NSW suggested that the cost per hour taught by a full-time TAFE teacher may
be up to double that of ‘reputable private competitors’ based on 2013 data (BCG 2015). Some
public providers also have a significant proportion of non-teaching staff, and they made up
42 per cent of TAFE NSW’s full time-equivalent staff in 2018 (TAFE NSW 2019).
Participants identified regional or remote operations as a major factor explaining why public
provider costs may be higher given increased wage or other input costs (AEU Federal Office,
sub. 21; WA Government, sub. 20). In Western Australia for example, lecturers are paid remote
allowances and country incentives under their agreement. Empirical evidence also suggests that
remoteness is an important factor affecting TAFE efficiency (Fieger et al. 2017; Fieger, Karmel
and Stanwick 2010).
Others expressed scepticism about the flexibility of public providers to meet tailored needs.
The Industry Skills Advisory Council NT (sub. 57) stated that public providers did not offer
particular courses needed by industry or flexibly meet the training needs of existing workers.
The Alliance of First Nations Independent Education and Training Providers (sub. 63)
argued that Aboriginal and Torres Strait Islander-owned RTOs are more efficient providers
of specialised services, as the size and culture of TAFEs and universities create difficulties
for Aboriginal and Torres Strait Islander students, resulting in poorer outcomes despite their
more stable funding.
All governments are committed to supporting public providers, yet their role vis-à-vis other
providers is poorly defined (despite the recommendations of earlier reviews), and remains
subject to debate (ACIL Allen Consulting 2015a, 2015b; ESC 2011a). Participants raised
several rationales for ongoing (or greater) support for public providers, including to:
service thin markets, by qualification and geography, where the financial viability of
provision is affected by insufficient demand or higher costs of delivery. For example, the
Western Australian Government (sub. 20, pp. 4–5) noted that:
Many of the localised markets for VET are not viable for more than one provider, if any. While
a common feature of regional and remote markets, it is also true for thin markets in the
metropolitan area. …
The TAFE College infrastructure and overheads to deliver these technical and thin market
courses often would not provide a return on investment for any private providers resulting in the
State being required to be a sole provider.
PROGRESS AGAINST THE NASWD 91
maintain certainty of supply or act as a ‘provider of last resort’, for example, in the case
of the exit of another provider
service particular student cohorts, such as those requiring greater student support
fulfil other activities such as the maintenance of general facilities for community use
(Tasmanian Government, sub. 32; Victorian Government, sub. 58; Victorian TAFE
Association, sub. 27; WA Government, sub. 20).
The Commission agrees that, in thin markets, improving the efficiency of service delivery
by nurturing competition is challenging. However, this does not, of itself, mean that public
provision is the only or most efficient means of service delivery. Subsidy models across
jurisdictions typically incorporate loadings and concessions to account for the additional
costs of service delivery, as may occur in thin markets (chapters 4 and 6). Moreover,
governments can use various policy options to service thin markets, including facilitating
competition for, rather than in, the market. There is merit in further consideration by State
and Territory governments of the tools available to assess potential market capacity or the
efficiency of provision, such as market testing or benchmarking.
There is also a need for greater transparency regarding the funding and delivery of public
providers. All jurisdictions continue to provide block funding to public providers, reflecting
that their costs and efficiency may potentially be affected by industrial relations arrangements,
constraints on the use of assets, and community service obligations (CSOs). Jurisdictions do
not typically itemise expenditure for public providers by purpose, making it challenging to
isolate contributions toward CSOs or other costs (box 2.4). For example, although Queensland
has a specific State Contribution Grant for public providers (which accounted for 29 per cent
of total VET funding in Queensland in 2017-18), the grant also covers ‘quality teaching and
teaching resources’, and ‘training infrastructure … integral to the delivery of quality training
across Queensland’ (QLD Auditor-General 2019, pp. 21, 27; TAFE Queensland 2019, p. 24).
The need for better funding information is discussed in chapter 6.
92 NASWD REVIEW
Box 2.4 Community service obligations of public providers
Study participants have pointed to the community service obligations (CSOs) of public providers
that involve additional costs and therefore funding requirements. CSOs typically occur when:
… a government specifically requires a public enterprise to carry out activities relating to outputs or inputs
which it would not elect to do on a commercial basis, and which the government does not require other
businesses in the public or private sector to generally undertake, or which it would only do commercially
at higher prices. (IC 1997, p. 7)
These obligations and their associated funding remain unclear or appear to be provided on an ad
hoc basis. For example:
TasTAFE receives a ‘Community Services Funding Obligation’, but it is not clear how this
funding is linked to its legislative requirement to service rural and isolated communities ‘where
other providers of vocational education and training, cannot or are not, effectively meeting the
demand’ (Tasmanian Government 2013; TasTAFE 2019)
the Victorian Government provided $200 million of ‘community service funding’ over four years
through a TAFE Rescue Fund, but any specific obligations were not publicly identifiable
(Herbert 2016).
There is also limited public information on measures used to monitor the delivery of CSOs. In their
Strategic Plan, TAFE NSW expressed an intention to improve the transparency and accountability
of CSO funding through ‘a more effective model to allocate, monitor and report impact’ of these
funds (TAFE NSW 2016).
Some study participants stated that funding models and performance measures should reflect
these obligations. For example, the Victorian TAFE Association (sub. 27) noted:
… provision of long-term funding to explicitly support and enable TAFE to meet community obligations.
It would manifest in pricing policies that recognise the diverse markets, cohorts and thin industry sectors
that would cease to function without the presence of TAFE. Explicit recognition of the special role of
TAFE would also require the development of performance measures beyond the financial, to more
properly gauge the rich contribution of TAFE, and to enable a fairer comparison of its role vis a vis private
training providers. (p. 7)
The funding of public providers also raises concerns related to principles of competitive
neutrality. Master Builders Australia (sub. 41, p. 9) raised concerns that:
… many jurisdictions preference VET funding to their public institutions (TAFEs) over industry
and private training providers. … it should be acknowledged that for many courses public VET
institutes are in direct competition with industry and private training providers.
All jurisdictions have competitive neutrality policies and an associated complaint
mechanism, which the Commission understands applies to the business activities of TAFEs
and, with qualifications, to other public providers (NCC 2002). However, there is a lack of
clarity about what constitutes compliance with these principles with regard to VET funding
arrangements. Several public providers, including TAFE NSW and TAFE Queensland,
receive funding to address the ‘competitive disadvantage’ of public provision (QLD Auditor-
General 2019; TAFE NSW 2016). Conversely, Navitas, in its submission to the Joyce
PROGRESS AGAINST THE NASWD 93
Review, argued that those same funding arrangements provide public providers with a net
competitive advantage:
… there is a lack of truly contestable State/Territory Government funding available to
independent education providers. … This funding arrangement does not reflect a ‘level playing
field’ for public and independent providers ... (2019, p. 4)
Early efforts to promote a ‘more open and competitive training market’ have stalled.
Improving the efficiency of the training market is no longer an explicit priority for most
governments, and this aim does not feature in the draft VET Reform Roadmap released by
COAG senior officials (SSON 2020).
The question of the policy settings that would best promote a dynamic, efficient and
responsive training market, and the efficient meeting of governments’ social policy goals,
deserves further consideration. As part of this, governments should clarify the nature of any
special role for public providers and more transparently fund services and account for
treatment that attaches to this role.
In its final report, the Commission will also consider other arrangements to support a
well-functioning market, such as consumer protection (box 2.5).
Box 2.5 Consumer protection arrangements in VET
While the Australian Skills Quality Authority provides a complaints mechanism, it does not act on
individual complaints and has no consumer protection powers or responsibilities. Both the Joyce
and Braithwaite reviews proposed the need for a dedicated VET Ombudsman, but differed on the
model, with either a Tertiary Ombudsman spanning VET, higher education students and overseas
students (Braithwaite 2018); or an expanded remit for the Australian Government VET Student
Loans Ombudsman to resolve consumer complaints against RTOs (Joyce 2019).
At present, State and Territory governments also provide consumer protection arrangements as
part of contracting arrangements with providers (or in the case of Queensland, through a separate
Training Ombudsman). In response to the Braithwaite Review, the Australian Government
committed to undertake further analysis and consultation to explore these issues (DET 2018b).
The Commission invites views from participants on the adequacy of consumer protection
arrangements.
INTERIM FINDING 2.3 — VET MARKET COMPETITION AND EFFICIENT TRAINING DELIVERY
Early efforts to promote a ‘more open and competitive training market’ have stalled.
Improving the efficiency of training markets is no longer an explicit priority for most
governments.
Further work is required by governments on the policy settings that best facilitate a
responsive and efficient training market. This includes a more clearly defined role for
public providers.
94 NASWD REVIEW
INFORMATION REQUEST — ROLE OF COMPETITION IN THE VET MARKET
What role should competition play in meeting users’ needs, including the quantity,
type and quality, and regional accessibility of VET services?
How should the efficiency of the VET market be measured?
What is the appropriate (and exclusive) role of public providers, and why?
Are additional consumer protection arrangements required to support a
well-functioning VET market? What are the costs and benefits of different models of
consumer protection established by governments, including ombudsmans’ offices?
Quality of training (NASWD clauses 25 g and i)
The NASWD recognised the importance of strengthening industry engagement in VET to
improve the quality and relevance of training, and reforms to ‘give industry more confidence
in the standards of training delivery and assessment’ (COAG 2012b).
The most significant change to managing training quality following agreement to the
NASWD was establishment of the ASQA in 2011.12 ASQA has since replaced regulators in
all jurisdictions except Western Australia and Victoria (chapter 7).
Participants raised concerns about ASQA’s approach to overseeing RTOs, including the
burden and cost of compliance requirements (Motor Trade Association SA/NT, sub. 18;
NSW Water Directorate, sub. 45; Queensland Water Directorate, sub. 30), inconsistency in
audit requirements (Master Builders Australia, sub. 41) and what they considered to be too
much of a focus on minor issues not affecting training quality (University of Wollongong,
sub. 19). Others have continued to raise concerns about regulatory standards, including
standards for RTO registration and course accreditation (ACIL Allen Consulting 2015b;
Braithwaite 2018; Deloitte Touche Tohmatsu 2015; Joyce 2019; Noonan et al. 2019).
Following a recent ‘Rapid Review’ of ASQA, the Australian Government has announced
intentions to expand ASQA’s educative role, improve its regulatory approach, ensure audit
decisions are transparent, and improve data collection and use to identify poor quality
providers (Cash 2019; Cash and Irons 2020).
Apart from concerns about the effectiveness of ASQA, views about the extent and causes of
problems with training quality are mixed (box 2.6). Some participants have pointed to
declining employer satisfaction rates (performance indicator 1b) as evidence of systemic
quality problems, but this indicator does not shed light on the causes of employer
dissatisfaction.
12 ASQA was established in July 2011 to deliver consistent, national regulation of RTOs. It oversees the
registration and market entry of RTOs, accredits courses, and manages compliance through audits and
penalties, such as deregistration.
PROGRESS AGAINST THE NASWD 95
Governments intended to improve confidence in the standards of training delivery and
assessment ‘… by developing and piloting independent validation of training provider
assessments’ (COAG 2012b). Trials were conducted under the National Partnership
Agreement on Skills Reform. One pilot in South Australia for the Certificate III in Aged Care
found that employers were generally satisfied with the quality of training and competence
of staff employed following training (ACIL Allen Consulting 2015a). Limited information
is available on other pilots.
Box 2.6 Concerns raised by participants on quality
The relevance of training packages
The problems here appear to be more about lengthy times taken to update and create new
courses, rather than a lack of adequate input from industry (Australian Computer Society, sub. 49;
Queensland Water Directorate, sub. 30; chapter 7).
The variable quality of training providers
Participants have noted that some poor performing RTOs are affecting the reputation of the sector
as a whole rather than this being endemic in the sector (ACA, sub. 46; AEU Federal Office,
sub. 21; Australian Trucking Association, sub. 17; Chamber of Commerce and Industry of
Western Australia, sub. 54; Motor Trade Association SA/NT, sub. 18, Queensland Water
Directorate, sub. 30;). The Australian Chamber of Commerce and Industry (sub. 33) noted:
… generally, employers’ satisfaction with VET delivery has fallen, but still stays overwhelmingly positive.
… Overall, the issue of quality presents a mixed picture, although it is an area where there has been
undeniably a focus of governments and stakeholders.(pp. 13–14)
The practice of some providers of delivering unreasonably short courses can place pressure on
other providers to compete (ACA, sub. 46; AEU Federal Office, sub. 21; ASQA 2017; Australian
Trucking Association, sub. 17; Braithwaite 2018; Joyce 2019; LDCT, sub. 34). At the same time,
longer courses are not necessarily higher quality, and there is evidence that students are more
likely to withdraw when courses are longer (Misko and Korbel 2019).
The quality of teachers
Participants held different views about what factors have affected teacher quality. Some
suggested that the minimum requirements for VET teaching (completion of a Certificate IV in
Training and Assessment) were insufficient (Adult Learning Australia (ALA) and Neighbourhood
Houses Victoria (NHVic), sub. 12; CQUniversity, sub. 26), and others felt that requirements were
too restrictive (NSW Utilities and Electrotechnology Industry Training Advisory Body (UE ITAB),
sub. 31; Victorian TAFE Association, sub. 27). Several participants raised concerns that lower
wages in VET teaching compared to those in industry make it challenging to attract quality VET
teachers (Tasmanian Government, sub. 32; University of Wollongong, sub. 19).
The adequacy of assessment arrangements remains a concern. Master Builders Australia
(sub. 41) recommended exploring the suitability of independent assessment for VET
qualifications, as did the Joyce Review. The Commission also previously recommended that
the Australian Government, in conjunction with ASQA and the Australian Industry and
Skills Committee, should investigate areas of VET where an independent certification model
could robustly test a person’s skills. The draft VET Reform Roadmap signals governments’
96 NASWD REVIEW
intentions to again pilot independent assessments and Victoria has committed initial funding
to this end (SSON 2020). While independent assessment and validation models vary, the
principle of unbundling the acquisition and the testing of skills merits further consideration
(discussed further in chapter 6).
Employers’ dissatisfaction with training also merits further investigation. ASQA is working
to establish itself as a leading practice regulator and is currently undergoing reform. It would
be appropriate to let reforms be fully implemented and subsequently review their impact on
perceptions of the quality of training and regulator performance. The Commission will
further consider quality issues in its final report.
Information for governments and users (NASWD clause 25 h)
Governments intended that the NASWD would prompt the development and use of better
information to support accountability and assist their decision-making, and enable users of
the VET system to make more informed choices.
Information for governments
While governments have made progress in coordinating national datasets since the NASWD
was established, there remain significant opportunities to better measure system
performance, improve the use and sharing of VET information and improve transparency of
information on VET funding arrangements.
The NASWD performance framework provides lessons on measuring VET system
performance. A new, post-NASWD framework should include measures that:
present a complete picture of VET activity, with performance measures capturing all
fee-for-service activity as well as government-funded activity
capture the contribution of VET to foundation skills — the current indicator (proportion
of Australians who achieve a proficiency in literacy and numeracy of level 3 or above)
is a poor measure. The Survey of Adult Skills runs only every 10 years, limiting timely
comparisons and, as a population survey of the overall stock of skills, it may be difficult
to meaningfully assess changes over time. Measuring the number of students undertaking
foundation skills courses and individuals’ outcomes after studying (such as the
proportion employed or in further study), would be more informative indicators of VET’s
contribution to foundation skills. However, there is no agreed national classification for
identifying courses that teach these skills. A means of classification is required to
measure the contribution of VET to developing foundation skills
incorporate other measures of skills attainment — the current performance indicators
focus primarily on course completions. While completing a VET course will be a
measure of success for many students, some may obtain what they need from training
without completing. The National Centre for Vocational Education Research (NCVER)
National Student Outcomes Survey records the reasons for not continuing with training
PROGRESS AGAINST THE NASWD 97
— the number of those who ‘got what they wanted from training’ could be used as a
supplementary indicator of success to completions
capture longer-term outcomes — improved data access and sharing arrangements could
provide a more complete picture of the success of VET in improving the outcomes of
students in the longer term (box 2.7). Presently, data on student outcomes are only available
about six months after completion through the National Student Outcomes Survey.
Box 2.7 Richer data can shed light on longer-term outcomes
More complete datasets, achieved through data linkage and integration, would allow the
longer-term employment benefits of VET to be assessed. Some work is already underway.
Using the Unique Student Identifier (USI) as a linkage key to combine various data sources can
shed light on students’ educational pathways after VET, such as tracking the extent to which lower
level VET qualifications are used as a stepping stone to higher-level VET qualifications. In 2019,
the Department of Education, Skills and Employment undertook a pilot project to statistically
identify and link students with both a USI and its higher education level equivalent, the
Commonwealth Higher Education Student Support Number (CHESSN) (DESE 2019b). This
linkage formed an experimental dataset to analyse the flows between the two sectors.
The New South Wales Government’s Pathways for the Future project brings together secondary
school, tertiary education and employment data with New South Wales and Commonwealth data
to better understand the range of educational pathways and outcomes (Training Services
NSW 2019; NSW Government, sub. 48, pp. 26–27). The New South Wales Government has also
partnered with the Australian Taxation Office, linking student data with their Tax File Numbers, to
enable a high-level analysis of student employment and income outcomes. Student data could
also be linked with data from other government agencies to monitor outcomes, such as the
Department of Social Services.
Some legislative and regulatory changes may assist the expansion of this work. The New South
Wales Government (sub. 48, p. 27) noted that ‘connecting this wide scope of data across multiple
jurisdictions and privacy regimes has been extremely complex’, and supported measures to
‘simplify and align the legislative and regulatory frameworks governing the use of data’.
Indicators of longer-term outcomes should be complementary to, and not replace, those of
short-term outcomes. While longer-term outcomes can provide greater detail, they are less
‘timely’ — they deliver information about system performance less quickly (a downside when
using indicators to guide policy).
Quantitative performance indicators can provide useful diagnostics and benchmarks to
monitor the system as a whole but often do not shed light on causality. Systematic policy
evaluation — beyond the measurement of system performance — is required to assess what
works. This typically requires richer data as well as judgments about how to interpret the
evidence to evaluate the effectiveness of interventions (PC 2019b). Moreover, while data
collection and monitoring are essential, greater use should also be made of data analysis to
inform policy change and system design (PC 2016).
98 NASWD REVIEW
A strong evidence base is essential to support evaluation, and efforts by governments to
develop more complete datasets, for example, through the Total VET Activity collection and
the Performance Information for VET project will assist future evaluation (DET 2018b).
As detailed in chapter 4 and appendix D, there are deficiencies in the publication of
information on VET funding, including where most funding for VET delivery is spent,
whether funding programs are meeting their objectives, and the broader impacts of spending
on system outcomes. Addressing this is critical to support governments’ and other parties’
assessments of the effectiveness of government’s stewardship of the VET system.
INTERIM RECOMMENDATION 2.1 — INFORMATION ON VET SYSTEM PERFORMANCE
Australian, State and Territory governments should develop improved performance
measures to provide a more complete picture of system performance. Any future
sector-wide performance framework should better measure:
total VET activity
the contribution of VET to developing the foundation skills of Australians
skills obtained through the VET system when students do not complete a course
students’ longer-term labour market outcomes.
Guidance for school students
Despite the NASWD identifying the need for greater transparency to help students, there are
still significant concerns about the quality of career information and advice for students.
One of the main ways students obtain information and advice in secondary school is through
career advisors (Bisson and Stubley 2017; Hargreaves and Osborne 2017). Studies, reviews
and participants to this study (South Australian Government, sub. 11; Victorian TAFE
Association, sub. 27) have raised concerns that career advisors rarely have personal
experience with VET, appear to favour universities and mistakenly see VET as offering only
trade qualifications (Joyce 2019; Woolcott 2017; Bisson and Stubley 2017).
Similarly, many consider that schools are focused on the Australian Tertiary Admission Rank
(ATAR) and higher education pathways (Ai Group, sub. 47; University of Wollongong,
sub. 19; Year13 Pty Ltd, sub. 8). They therefore do not provide complete or impartial advice
on options for further study. The Industry Skills Advisory Council NT (sub. 57, p. 6), for
example, stated ‘VET Career Pathways are poorly articulated to school leavers and there is
inconsistent information available in contrast to the Higher Education pathway’.
Many teachers and parents consider VET less prestigious and rewarding than university
(HRSCEET 2018; Joyce 2019). This view could stem from the tendency for VET career
pathways to be promoted to students who are less academically inclined. This perception is
reinforced because VET in Schools is often used to retain students at risk of dropping out.
PROGRESS AGAINST THE NASWD 99
There is increasing recognition among governments that effective career guidance in schools
can improve student choices. For example, a national career education strategy, Future
Ready: A student focused National Career Education Strategy was developed in 2019
(DESE 2019f). In addition, in line with recommendations of the Joyce Review, an
independent National Careers Institute was established in 2019 to improve the quality of
career development services (DESSFB 2020a).
Chapter 7 discusses further the adequacy and form of information available to students. For
the final report, the Commission will consider whether there are gaps in the provision of
career information and advice to students that need to be addressed.
INFORMATION REQUEST — CAREER GUIDANCE FOR STUDENTS
What changes could be made to ensure school students have appropriate career
information and advice?
Pathways and transitions (NASWD clause 25 j)
The NASWD committed governments to facilitate more interconnected tertiary and training
sectors that cross boundaries between school, vocational and higher education, and better
links to the labour market (clause 25 j). Participants to this study expressed significant
reservations about the effectiveness of VET in Schools as a pathway to employment, the
effectiveness of pathways and transitions between the VET and higher education sectors,
and transitions from education to employment.
Some of these issues have been considered by recent reviews such as the Joyce Review, the
Noonan Review of the Australian Qualifications Framework (AQF), the Education
Council’s Review of Senior Secondary Pathways, and reviews by the South Australian and
Victorian Governments of the effectiveness of VET in schools as a pathway to employment.
A summary of the policy issues is below.
Effectiveness of VET in Schools as a pathway to employment
VET in Schools aims to provide students with the opportunity to acquire workplace skills
acknowledged through nationally recognised qualifications while completing their Senior
Secondary Certificate of Education (DESSFB 2014a).
Participants to this study argued that many school students who complete VET qualifications
at secondary school do not know how to apply the skills they have been taught, and therefore
VET in Schools programs are not an effective pathway to post-school training or
employment (Australian Chamber of Commerce and Industry, sub. 33; Master Builders
Australia, sub. 41).
100 NASWD REVIEW
Others have said that VET qualifications studied in school lack:
coherence — studies are not well linked to other school programs or career pathway
(Clarke 2012; Polesel et al. 2015)
relevance and quality — VET in School programs are criticised as failing to meet
industry standards or developing skills relevant for employment. For example, Skills
Impact (sub. 28, p. 26) said:
‘ … it is virtually impossible for VET in Schools programs to meet the required definition,
however participants receive qualifications that state they are fully competent to perform work
to an industry standard’.
These findings accord with earlier observations that some consider the main value of VET
in Schools to be encouraging students to stay in school and engaging those who are less
academically inclined, rather than laying the ground for future careers.
The draft VET Reform Roadmap outlines intentions to improve the quality and delivery of
VET in schools (SSON 2020).
Transitions between tertiary education sectors
Simple and flexible pathways between education sectors can improve transitions for
individuals, support lifelong learning and provide the skills continuum required by many
occupations and professions (box 2.8).
Box 2.8 A lifelong approach to learning
The changing nature of work will compel a growing number of Australians to continue engaging
in education. Individuals will need to become more responsive to change within their jobs and in
the mix of jobs available in the economy. This means that, to be productive or employable,
workers will need to take a lifelong learning approach to education — upskilling to adjust their
existing skill sets to work more productively in existing occupations and reskilling to acquire new
skills when they change occupations. A tertiary education system that supports lifelong learning
will help Australians to smoothly adapt to the changing nature of work.
Source: AlphaBeta (2019).
Recent studies and reviews have observed that moving between sectors can be difficult
because of differences in training approaches and sector-specific training provider standards.
They noted a lack of sufficient guidance to students and provision for articulation
arrangements in both sectors’ regulatory frameworks (HRSCEET 2018; Joyce 2019;
PROGRESS AGAINST THE NASWD 101
Noonan et al. 2019; Shergold 2019). In noting the shortcomings of current arrangements, the
Queensland Nursing and Midwives’ Union (QNMU) (sub. 15, p. 7) stated:
… there is … a strong need to ensure nursing VET courses are articulated to nursing university
courses. This would support the career progression of nurses, life-long learning of nurses and
ensure clinical and quality standards flow from VET to university study.
The Noonan Review of the AQF recommended policy changes to better align standards in
the VET and higher education sectors for credit and recognition of prior learning and to
broaden the scope of credit recognition, including recognising individuals moving from
higher education to VET and shorter-form credentials (micro-credentials) (Noonan et
al. 2019). The Australian Government has accepted these recommendations, and the COAG
Skills Council is pursuing implementation of reforms (SSON 2020).
One issue not addressed by the Noonan Review is students’ low awareness of credit transfer
arrangements. Research by the Ithaca Group (2018) found that many students did not know
that they can claim credit for courses undertaken. This situation could reflect several factors,
including:
the usefulness and reliability of information on student credit varying considerably across
institutions
cumbersome recognition of prior learning (RPL) processes — for example, portfolio
requirements that involve multiple forms of documentation, the mapping of prior study
to learning outcomes and gathering of evidence from third parties, which is time
consuming to compile
minimal cost savings — in some VET contexts, the cost to students of obtaining an RPL
assessment is similar to the cost of a training program, meaning students have little
incentive to follow the RPL pathway (Ithaca Group 2018).
Transitions from education to employment
Employers seek employees with a range of values, attributes and general skills, as well as
technical skills and knowledge. Desirable non-technical attributes include, for example,
being accountable, the ability to work in teams, initiative, self-management, and
communication skills.
Participants in this study and other reviews argued that some students lack workplace skills,
which poses a barrier to transitioning to employment (Ai Group 2018; HRSCEET 2018;
Ithaca Group 2016). For example, Master Builders Australia (sub 41, p. 11) noted ‘a key
challenge employers’ face when hiring an apprentice is a lack of work-ready candidates’.
Workplace skills play a critical role in smoothing students’ transition to employment but are
difficult to teach. Students are unlikely to develop these skills in schools or classrooms
because workplace-ready skills are generally learnt and developed over time in the
workplace. Exposing students to real-world situations through work-integrated learning or

102 NASWD REVIEW
industry engagement in education and training (via, for example, the offer of work placement
or internships) would help develop these skills.
Governments have recognised the importance of building students’ skills and general
capabilities to improve their transition from education to employment. The national career
education strategy, Future Ready: A student focused National Career Education Strategy,
focuses on strengthening collaboration between schools, employers and local communities
to improve student engagement with work environments, and support successful transition
to further education, training and work (DESE 2019f). The Australian Government also has
programs to help certain groups needing additional support, such as disengaged and
unemployed young people, transition to employment — these include Jobs PaTH,
Transitions to Work, and jobactive.
For the final report, the Commission will consider whether further changes are needed to
achieve more seamless transitions from education to employment.
INFORMATION REQUEST — PATHWAYS AND TRANSITIONS
The Commission seeks evidence on:
the usefulness of VET in schools in developing work-ready skills
what can be done to improve students’ awareness of credit entitlements between the
VET and higher education sectors
the extent to which time-consuming processes for credit and recognition of prior
learning are a barrier to students applying for credit
the effectiveness of programs and services aimed at assisting groups to move from
education to employment (such as Jobs PaTH, Transitions to Work and jobactive)
whether there are gaps in government initiatives aimed at improving students’
workplace-ready skills and, more broadly, transitions from education to employment.
2.4 Where to for a new agreement?
As part of a new intergovernmental approach to support Australia’s skills system, the
NASWD was intended to promote cooperation between governments, facilitate reform,
improve accountability, and set a new framework for financial transfers from the Australian
Government to State and Territory governments.
While the NASWD has served some useful functions, governments have stepped back from
some of its policy aspirations. The context for intergovernmental co-operation has also
evolved. The COAG Reform Council was intended to be an independent body monitoring
progress under the agreement but was disbanded in 2014.
PROGRESS AGAINST THE NASWD 103
The COAG Skills Council is now the main forum for co-operation on VET policy and delivery.
The Council is expected to negotiate a new national funding agreement for VET by 2021 and
has published a draft VET Reform Roadmap, which will inform this new agreement.
This section examines how well the NASWD has worked as an intergovernmental agreement
and, drawing on the lessons learnt, recommends a new principles-based intergovernmental
agreement to guide and advance collaboration on skills policy reform by governments.
How well has the NASWD worked as an intergovernmental agreement?
Early adherence to the NASWD’s goals, and the associated National Partnership Agreement
on Skills Reform, demonstrated governments’ commitment to coordinated national reform.
The NASWD gave all governments significant flexibility to determine how best to pursue
agreed reform directions. This allowed governments to learn from each other’s approaches
and experiences (for example, toward implementing the national training entitlement, and
following the market reaction to VET FEE-HELP) — a key benefit of cooperative
federalism.
Of particular merit in the NASWD and the IGA FFR was the clearer specification of
jurisdictions’ responsibilities, in particular, recognition of States and Territories’ primary
responsibility for service delivery, and the untying of the majority of grants from the
Australian Government. While the latter reflects constitutional divisions of power, it is also
a recognition of subsidiarity — State and Territory governments’ primary accountability for
expenditure and the quality of services to their own communities (box 2.9).
Box 2.9 Subsidiarity — a principle easily lost
Deciding where to draw the lines of responsibility between the tiers of government has been a
perennial issue since federation. The principle of subsidiarity — implicit in federation — suggests
that responsibility for a function should, where practical, be devolved to the extent possible, so
that government is accessible and accountable to those affected by its decisions.
Given vertical fiscal imbalance, the Australian Government must fund many of the activities for
which State and Territory governments have key responsibility. However, the Australian
Government’s revenue raising capacity does not give it any intrinsic superiority in judging how to
allocate funding or regulate. The principle of subsidiarity does not preclude the desirability of a
national role for the Australian Government if there are sufficient benefits. Moreover, jurisdictions
will consent to that role if the vehicle for achieving it is well designed and serves their purpose —
for example, the benefits of a national regulator have been accepted by most governments.
The removal of input controls was important for achieving the benefits of flexibility and
subsidiarity but it placed much greater importance on the performance framework to provide
assurance on the use of Commonwealth grants. More generally, there was reliance on the
performance framework providing all governments assurance on progress against their
agreed goals for the VET sector, so facilitating ongoing collaboration on reform.
104 NASWD REVIEW
In the event, the NASWD’s performance framework was not sufficient to hold governments
to account on either of these fronts. Part of the explanation is that the NASWD targets were
not realistic, and agreed performance measures, while necessarily high-level, provided limited
insights into VET system performance. Performance measures were not reviewed after 2012,
despite a commitment to their ongoing improvement. There has been little pressure on
governments to account for progress on, or departures from, reform directions, with only one
formal review of commitments since 2009 (by ACIL Allen in 2015). As this chapter has
discussed, many reform directions have not been achieved and some, in particular the
commitments to greater competition, a comprehensive entitlement and wider use of income
contingent loans, have, following policy implementation failures, not been pursued.
The need to improve accountability and assurance for funding remains
The need for meaningful reporting of progress against governments’ agreed goals for VET,
and for assurance from the States and Territories on the use of Commonwealth grants,
remains. The latter is a practical matter, as accountability for use of funds must be acquitted
by at least one level of government. In this case, it is sensible for State and Territory
governments, as the spending governments, to provide assurance, although this need not be
through (or solely through) a national performance framework. As the IGA FFR recognises,
States and Territories should report to their own communities on the efficiency of
expenditure, the quality of services and outcomes.
The Commission’s analysis has highlighted that State and Territory governments should
more transparently report on program spending and outcomes (chapter 6). More meaningful
indicators of system performance (recommendation 2.1) and of reform progress may also
assist (for example, if governments aim to improve connections between VET and higher
education, appropriate indicators will be needed to measure progress).
The level of assurance required by the Australian Government for Specific Purpose
Payments funding remains a key matter for the negotiation of future funding arrangements.
The experience with the NASWD suggests that accountability for system performance and
the prudent use of taxpayer funds need not be served by a single mechanism. Agreeing shared
principles could also assist with providing accountability for funding or to guide reform
activities undertaken by jurisdictions (discussed below).
PROGRESS AGAINST THE NASWD 105
INTERIM FINDING 2.4 — THE NASWD NEEDS REPLACEMENT
The NASWD is overdue for replacement. Governments have stepped back from several
key policy aspirations. The performance framework has limited value for assessing the
functioning of the VET system. Its targets have not been met and some performance
indicators have proved to be deficient.
Some principles of the NASWD remain pertinent for a future intergovernmental
agreement, including equitable access to training and contestability. Reforms are still
needed to give students better information, increase user choice, improve quality
assurance, and create a more interconnected education and training system.
Many of the principles in the Intergovernmental Agreement on Federal Financial
Relations, including recognising the Australian Government’s interest in areas
traditionally the responsibility of State and Territory governments, clarifying all
governments’ roles, and allowing State and Territory governments flexibility in the use
of grants, are a sound basis for negotiating any new agreement.
A future intergovernmental agreement
The Commission’s consultations so far indicate that participants remain supportive of
intergovernmental co-operation, and of an intergovernmental agreement. For example, the
South Australian Government noted that:
A well-designed and governed National Agreement with clearly articulated outcomes is the
appropriate mechanism to support intergovernmental cooperation in this sector. (sub. 11, p. 3)
Participants generally expressed support for the NASWD’s high-level objective, and the
intent behind defining reform directions and outcomes to progress such an objective (ACTU,
sub. 6; BCA, sub. 16; CCIWA, sub. 54).
The design of any future intergovernmental agreement will be important if it is to sustain
commitment to shared policy objectives while maintaining flexibility for State and Territory
governments to implement policy. Experiences under the NASWD show how poor policy
design and implementation can weaken governments’ collective commitment to agreed
objectives (even when these goals remain fundamentally valid). This highlights the potential
value of overarching principles to guide policy.
The choice of principles included in a future agreement is equally important. The draft VET
Reform Roadmap incorporates some of the NASWD reform directions (such as better
information for students, improved quality assurance, a more interconnected education and
training system, enhanced data and accountability, and greater streamlining) (SSON 2020).
However, the draft Roadmap is missing some important goals, including contestability and
the promotion of a workably competitive market.

106 NASWD REVIEW
A principles-based agreement
A principles-based intergovernmental agreement could be a practical way to foster cooperative
reform by governments, by balancing policy coherence across jurisdictions with a pragmatic
recognition that governments will wish to retain flexibility about their policy choices.
The policies that would give effect to agreed principles could be pursued in different ways
— via a separate intergovernmental agreement or settled either bilaterally or unilaterally. A
principles-based approach could, for example, affirm that contestability and market delivery
of services are both desirable, while allowing governments to determine how to reform the
market and mitigate any risks.
Mechanisms such as bilateral agreements (between the Australian Government and a State
or Territory government) could also continue to complement national agreements. The
New South Wales Government (sub. 48) suggested that bilateral agreements could be used
to set out implementation strategies and performance indicators for specific endeavours and
may reduce the scope of unilateral policy changes that could affect other governments
achieving their goals.
It is expected that the Commonwealth would become a partner in achieving targets and executing
objectives, as critical levers to address skill shortages such as skilled migration are managed by
the Commonwealth Government. The bilateral arrangements would also cover financial
contributions of the Commonwealth to the VET system. (p. 7)
The experience of intergovernmental agreements in other areas13 can also guide a
principles-based approach. Common principles were coupled with other mechanisms to
facilitate cooperation and greater accountability, such as public reporting, independent
oversight and agreed benchmarks to assess policy decisions. Together, these helped to align
policies across jurisdictions.
Notwithstanding this, further consideration is required to establish what supporting
mechanisms would best sustain coordinated reform in the VET sector and ensure
accountability for government progress against stated reform objectives. The NASWD and
IGA FFR experience suggests that, while independent reporting bodies can assist, they can
risk losing their salience (or existence) over time, and require buy in from all governments.
Institutional supports can be helpful, such as where governments build in commitments to
arm’s-length periodic reviews, or governments could make use of existing bodies (in this
regard, the National Skills Commission could assist if a Memorandum of Understanding
between governments were established to agree its tasks). The Commission invites
participants’ views and will consider this further in its final report.
13 Some examples include the National Competition Agreement and the Intergovernmental Agreement on the
Environment.
PROGRESS AGAINST THE NASWD 107
Principles for a new agreement
The NASWD includes many sound principles that were intended to shape the actions of
governments. A new agreement could re-endorse these principles to promote policy
coherence across governments in support of a national training market. These include:
efficiency, to ensure the training delivered best meets users’ needs and offers value for
money (clauses 2, 9, 10f)
equitable access, particularly in respect of access for students facing disadvantage and
promotion of foundational skills as a stepping stone to further training (2, 10b, 6)
quality training delivery and teaching (2, 7, 10c, 25i, 28b)
system design that enhances economywide economic participation and productivity (3,
4, 18, 19.3, 25b)
responsiveness and resilience to changes in the economy and technological change (3, 9)
provision of information for informed student and employer choice (7, 10d, 25h)
publicly available data and information to support analysis of programs, system
performance and accountability for government funding (10d, 20, 21, 24, 25h)
coherent linkages with other parts of the education and training system (schools and
higher education), and with employers (8, 10, 23, 25i and j)
stability in funding arrangements to provide greater certainty for jurisdictions making
investment (10e).
The draft VET Reform Roadmap includes, at its core, a number of these principles, with an
emphasis on improving the relevance, quality and accessibility of the VET system. However,
market efficiency is absent and should be added to these priorities. At the same time, the
imperative for efficiency should be more precise than in the NASWD. The principle of
‘efficiency’ could be broken into separate components, including:
efficient delivery, to ensure training services are delivered to students in an effective
manner and at an efficient cost
efficient pricing and subsidies, establishing common objectives that serve as the basis of
price-setting methodologies for different courses, regions, and students, including a
recognition of potential trade-offs between quality and cost (chapter 4)
additionality and return on investment, noting that the economic impact of subsidies to
VET should be judged according to their ability to elicit additional training (discussed
further in chapter 5)
incentives for innovation, noting that improvements in efficiency and productivity in the
sector are likely to come from providers themselves, and this should be reflected in the
approach to policy and regulation
clarity on the role of public providers, including any service obligations distinct from
those of other providers
108 NASWD REVIEW
competitive neutrality, which is intended to remove distortions to resource allocation that
arise from public ownership and to improve competition (Australian Government 1996).
In VET policy, this would involve ensuring that state-owned providers do not enjoy
competitive advantages over their private sector competitors simply by virtue of their
ownership.
Moreover, some principles not included in the NASWD should be included in any future
agreement. For example:
consumer focus, as recognition that (even if guided), students have the best overall
understanding of their preferences and life goals. The principle that government services
should be centred on ‘customers’ rather than suppliers is now widely recognised in
disability care14 and Indigenous services,15 but much less so in VET. Ultimately,
students and employers are the customers, and the design of the system should reflect
this (box 2.10). An effective student-centred approach with genuine user choice could
also mean less need for governments to negotiate and prescribe system outcomes
fiscal sustainability, reflecting that future policies would benefit from rigorous tests of
the long-run fiscal sustainability. This principle would have been a valuable inclusion in
the NASWD, given the eventual financial cost of poorly designed entitlement and loan
programs
neutral, but not equivalent, treatment of higher education (VET and universities), with
policy settings that minimise distortions in students’ choice between sectors, given the
connected, but bifurcated post-secondary school education system (chapter 3).
These principles provide a useful starting point for a future agreement, although some further
consideration is required as to how best incorporate them in a future agreement.
14 For example, the National Disability Insurance Scheme Act, 2013 (Cwlth) states that one of the objects of
the NDIS is to enable people with disability to exercise choice and control in the pursuit of their goals and
the planning and delivery of their supports (section 3(1)(e)).
15 In 2017, the Commission identified six areas of human services that would benefit from increased ‘informed
user choice’, including end-of-life care services, social housing, family and community services, services
in remote Indigenous communities, patient choice over referred health services, and public dental services
(PC 2017a). In Indigenous services, the concept of ‘community voice’ is particularly relevant (p. 27).
PROGRESS AGAINST THE NASWD 109
Box 2.10 A student-centred approach
Giving students as much consumer sovereignty and flexibility as possible requires several
important supports:
choice and power — students should be able to choose between RTOs and courses based
on the degree to which they meet their needs and their pricing and quality. An element of this
is the desirability of avoiding obstacles to (virtuous) product variety, because some subsidy
and pricing approaches risk undermining training organisations’ capacity to provide
differentiated services and to innovate
good information and navigation of services provided in a meaningful way. Informed choice
must be underpinned by disclosure of prices, the quality of the providers, and their course
offerings, among other factors (chapter 7)
provision of gateway services to improve matching efficiency, such as appropriate career
advice. Students come with varying preferences and capabilities, and the value of their
investments may often only be realised if these are well-matched to courses. Poor matching
limits students’ attainment of competencies and retention rates
the availability of support services — mentoring and pastoral care — recognising that effective
training requires more than standard tuition
high quality regulation and consumer protection, accompanied by efficient compliance.
VET FEE-HELP served many students very poorly due to poor regulatory oversight
value for money — which largely comes down to ensuring workable competition, such that
costs are minimised and margins are not excessive or permanent
credible qualifications — the value of training is not just about the acquisition of skills, but proof
to employers that they have been genuinely acquired.
INTERIM RECOMMENDATION 2.2 — A NEW PRINCIPLES-BASED AGREEMENT
Australian, State and Territory governments should negotiate a new, principles-based
intergovernmental agreement. Such an agreement should commit governments to
developing an efficient, competitive market driven by the informed choices of students
and employers. The agreement’s principles should include:
centring policy on the consumer, including information provision for informed choice
equitable access
recognition of fiscal sustainability and the stability of funding
transparency about where funding is allocated, including detailed information on
course subsidies, costs and the size and nature of funding to public providers
efficient pricing and delivery
designing incentives to increase the likelihood of eliciting training
competitive neutrality between public and private provision
neutral, but not equivalent treatment of the VET and higher education sectors.

110 NASWD REVIEW
INFORMATION REQUEST — DESIGNING A NEW INTERGOVERNMENTAL AGREEMENT
If a new principles-based agreement was negotiated in line with interim
recommendation 2.2:
how should it consider other educational sectors, informal training and
non-government funded training?
what other mechanisms to facilitate reform and improve accountability would best
complement an agreement?
WHY GOVERNMENTS INVEST IN VET 111
3 Why governments invest in VET
Key points
Governments invoke many reasons to invest in VET — preventing skill shortages, supporting
people to overcome social disadvantage, avoiding the risk of foregone public benefits from
under-investment in training and the need for some degree of parity — for equity reasons if
nothing else — between higher education and the VET sector.
These rationales are generally valid but:
– skill shortages are not rigorously measured, reflecting problematic conceptual frameworks
and poor data
– there are sizeable private benefits from higher-level VET qualifications but returns to the
lowest-level qualifications are small or even sometimes negative. High private benefits
provide a strong incentive for students to invest without government support, regardless of
whether there are also public benefits
– there is good evidence of public returns to education, but it is not apparent that subsidy
policies are intended to increase marginal public returns.
The different rationales have different implications for policy:
– skill shortages imply that caps on subsidised places are justified
– public benefits suggest that course subsidies should be more widely available
– public benefits would also be consistent with the desirability of aligning the treatment of
course subsidies in the higher education and VET sectors.
The overarching intent of the Australian, State and Territory governments’ investment in the
VET system is to increase the level of skill formation and to generate future economic and
social benefits. Governments’ investments extend beyond the $6.1 billion of funding for the
system to other measures to stimulate the take-up of education — most notably about
$0.5 billion in concessional student loans.
As with other government interventions, the key issues are the rationales for government
action, the size and distribution of the (public and private) benefits, the choice and design of
policy instruments and the effectiveness of these instruments in achieving governments’
goals. Such issues play out differently depending on the jurisdiction and on the form of the
investment. This variety — a product of history and federation — adds complexity to the
overall assessment of investments in VET, but also has the benefit of providing insights into
the impacts of different policies.
112 NASWD REVIEW
This chapter is the first of four complementary chapters that collectively address three of the
seven terms of reference, which are:
‘options for nationally consistent government funding and pricing arrangements that
maximise efficiency, transparency and the supply of trained workers for the economy
and promote consistency of incentives’ (ToR 3)
‘options to promote consistency in funding and loan arrangements between the VET and
higher education sectors, and on any cross sector impacts that there might be’ (ToR 4)
(The broader issues associated with this ToR will be addressed in the final report.)
‘options to ensure government investment in VET encourages increased participation in
training by all Australians and is commensurate with the outcomes and benefits derived
by individuals, business, industry, the local and national economy and society more
generally’ (ToR 5).
This chapter focuses on the rationales for government interventions in VET and how these
link to financial incentives for skill formation. (It does not cover selective subsidies paid to
TAFEs to meet their higher operating costs, which are more a form of industry assistance
than measures aimed at increasing skill formation — these are discussed in chapters 2 and 6.)
The next chapter examines the way governments fund and price courses using subsidies, the
main avenue for government investment. Chapter 5 examines the impacts of such incentives
since these determine the design of subsidy arrangements. Chapter 6 brings together the
policy options to improve the targeting, design and implementation of governments’
investments in VET.
3.1 Rationales for a government role in VET
The National Agreement for Skills and Workforce Development (NASWD) sought to create
a more skilled workforce and facilitate employment for all Australians — leading to a more
prosperous Australia (chapter 2). State and Territory governments are explicit that their
programs should ‘ … contribute significantly to the state’s [NSW] output’, ‘support us [the
QLD Government] in creating jobs for a strong economy’ or contribute to the Government
of Western Australia’s ‘plans to grow and diversify the economy’ (DESBT (Qld) 2018, p. 1;
NSW Government. sub 48, p. 1; Western Australian Government. sub 20. p. 1).
The link between vocational training and prosperity is sound. There is compelling evidence
that completing a VET qualification typically raises productivity and leads to higher labour
income. The literature on economic growth points to strong links to skill formation generally
(Sianesi and van Reenen 2003; Vu, Hammes and Im 2012).
However, this general link is not, per se, a sufficient argument for government interventions
to increase vocational skill formation. Private parties, such as students and employers, have
strong incentives to invest in education so public investment may not always be necessary.
The key issue is the public value of such policies (QLD Auditor-General 2019).
WHY GOVERNMENTS INVEST IN VET 113
The public value of policy measures and their design depend in turn on their rationale,
efficiency and effectiveness. There are many in-principle rationales for government
investments in skill formation. These rationales have varying validity and materiality, and
justify different policies. The main rationales are:
1. the possibility that labour markets may not always resolve skill shortages quickly
2. that the expected private benefits to students may be insufficient to deliver all socially
valuable investments in VET
3. averting the risk that students’ choice of post-school education could be distorted by
different funding for VET and higher education, leading some students to choose
university when the VET sector better meets their needs
4. even when there are sufficient private incentives for training, it may be equitable for
students to share some of the public benefits of their investments
5. concerns about the immediate affordability of courses, accentuated by the difficulty that
students have in accessing commercial loans
6. overcoming information gaps that could discourage investment, such as ignorance by
students about the long-run private returns to training
7. concerns that employers have inadequate incentives to train given the costs involved
(such as minimum wages) and the risk that other employers may poach their staff
8. removing the barriers to participation by students facing disadvantage and groups
affected by structural change in the economy
9. the ambition to promote high-growth industries by expanding the supply of specialist
workers
10. the concern that, without governments’ interventions, VET providers would not provide
sufficient mentoring and pastoral support services for students, and upfront assessment of
needs.
While these rationales can justify government interventions in the VET market, the
interventions need to take different forms to address different problems. Governments can
use a wide array of interventions — subsidies for courses and the training of apprentices,
information provision, loans, the tax treatment of education and training costs, changes to
labour market regulations, and the development of a more competitive market to put
downward pressure on fees. While all of these interventions may be important elements of
an overall government strategy to support an effective VET system, this chapter focuses on
those rationales central to the design of government financial incentives for skill formation
(rationales 1, 2 and 3).
114 NASWD REVIEW
3.2 The concept of skill shortages
What are skill shortages?
The term ‘skill shortage’ has been described as ‘a slippery concept with many meanings’
(Richardson 2007, p. 7).
Skill shortages are typically described as occurring when employers struggle to fill vacancies
for a given occupation at ‘current levels of remuneration and conditions of employment and
in reasonably accessible locations’ (DOE 2017, p. 5). The skill (or priority) lists used by
Australian, State and Territory governments to determine training priorities and skilled
immigration draw on qualitative information from employers about their perceptions of
occupations in short supply and measures of the share of vacancies filled in a given time by
qualified applicants. Some jurisdictions also use other factors to place courses on their priority
lists. There are two crucial aspects of this approach to defining and measuring shortages:
first, a shortage may occur if employers cannot find candidates with enough experience
or with the appropriate intangible skills (such as communication skills). For instance, in
considering child care occupations in 2018, the Department of Jobs and Small Business
found that two thirds of qualified applicants were unsuitable because of insufficient
experience in child care or a specific aspect of the job, they submitted a poor application,
or lacked communications skills or other general employability skills (DJSB 2019). This
problem will not be remedied by increasing the number of graduates with the relevant
qualifications
second, the shortage is defined as the inability to recruit a worker at the going wage
(including any bonuses). From the employees’ perspective, this notion of shortage could
be re-framed as a job that does not pay enough to encourage applications by skilled
candidates (or to train for that job or to move from another job).
The above approach to framing shortages varies from standard labour market models. These
accept that labour shortages can exist as economies change, but presupposes that such shortages
will usually be transient. There have been instances, such as during the resources boom, where
wages and labour supply were highly responsive to significant shortages (box 3.1).
Skill shortages often persist
Yet, Australian Government data suggest highly persistent skill shortages in a range of
occupations. For example, automotive electricians, panel beaters, arborists (in shortage for
each of the 10 years to 2018) and hairdressers and sheet metalworkers (9 out of the past
10 years)(DESE 2019d). It is even possible that the vacancy data alone could underestimate
real shortages if employers are no longer advertising for positions (which is why qualitative
evidence from employers about recruitment problems is valuable, although subjective). A
decade long or more shortage seems difficult to explain for some occupations that rely on
traineeships taking one to two years to complete.
WHY GOVERNMENTS INVEST IN VET 115
Box 3.1 Labour market responses to shocks
Resources investment boom
The mining investment boom provides a recent example of a demand shock that precipitated a
skills shortage in parts of the Australian labour market. The massive, sustained increase in
demand for mineral resources associated with economic development in China was met via
augmentation of the workforce with skilled labour from overseas and reallocations within the
domestic labour market. The resources boom raised wage rates for low-skill occupations and
discouraged people aged 15-24 years from remaining in school, attending VET or university or, if
they did study, to do so more often on a part time basis (Bishop 2019). For this group, further
training at this time would have been inimical to a responsive labour market.
National Disability Insurance Scheme (NDIS)
The demand for service providers and carers created by governments’ decision to establish the
NDIS is an example of a policy shock that necessitated national and state-based strategies to
raise workforce levels (PC 2017b). When the Productivity Commission reviewed the NDIS in 2017
it found that workforce needs would not be met without government strategic direction — the sector
needed to more than double to 160 000 employees in five years (PC 2017b, 2017c).
The Australian Government recently released an updated workforce strategy, which sets out
short-term goals to support workforce development, including working with State and Territory
governments to identify gaps and skills needs and reducing barriers for workers to move between
aged care, healthcare and disability care (DSS 2019). Over the long term, the Australian
Government’s strategy is to oversee the NDIS market to enable mainstream employment and
training services to meet training and employment needs.
Wage responses to specific occupational shortages
There is weak evidence that specific occupations in short supply (measured at the 4 digit ANZSCO
occupational category level and using measures of shortages produced by the Department of
Education, Skills and Employment) have a positive link to wage growth (ABS 2019b;
DESE 2019d). For example, from 2012 to 2018, average weekly earnings (AWE) growth in those
occupations with shortages in every year over this period was 28 per cent (median growth) and
35 per cent (average growth), while wage growth in occupations where there were no shortages
in any of these years was 15 per cent (median) and 20 per cent (average growth). However, some
occupations in short supply had very low wage growth (for example, automotive electricians with
6 per cent, roof tilers with 1 per cent), while some with no short supply at all grew strongly
(agricultural technicians with 46 per cent). Overall, wages are not consistently responsive to
perceived shortages. While AWE includes regular frequent bonuses, it does not include irregular
or infrequent bonuses — which employers will sometimes use to attract labour and address
shortages without locking in wages over the longer run (Leal 2019).
Many factors contribute to persistent shortages. Skill mismatch is the most important. It
occurs when the skills of the workforce do not match the skills demanded by employers. One
example of mismatch is when employers want more than a qualification; they are seeking
employees with experience, soft and non-technical skills (DESE 2020c). These attributes
cannot be created quickly, or at all, through training, especially if there is significant job
turnover — leading to shortages. The same problem arises when employers look for more
specialist skills within an occupational class, which may require additional years of training.
116 NASWD REVIEW
Skill mismatches may also occur spatially, when skilled workers may be available in one
area, but not in the region where employers need the skills (DESSFB 2019d).
In other instances, the training market is not responsive to shortages. For instance, a niche
occupation that requires specialist training for a handful of students is unlikely to be an
attractive investment for training organisations. An illustration is stonemason positions,
which are hard to fill because training is not provided in all States and Territories
(DESE 2018c).
Finally, the usual role of wages in attracting people to acquire skills in short supply can be
affected by wage frictions. One instance is where employers are unable to raise wages, as
can occur when a budget-constrained government funds health and social services — the
National Disability Insurance Scheme being an illustration. In that instance, meeting
workforce needs has been highly managed by government (box 3.1). Another instance is the
impact of minimum wages. If too high, minimum wages compress the wage distribution,
lowering the premium for skilled work and the associated incentives to train (Hoeckel 2008,
p. 5). In addition, high minimum wages may discourage employers from recruiting
inexperienced workers who may be seen as insufficiently productive.
The persistence of shortages warrants further analysis by the National Skills Commission,
including an assessment of the materiality of the above factors and the extent to which the
training system can address them.
Long-term unfilled vacancies in some occupations not only indicates issues in labour and
training markets, but also raises doubts about the effectiveness of government interventions
intended to overcome them.
The derivation and use of skill lists is challenging
Notwithstanding the prominence given by all Australian governments to elaborate skill lists,
their usefulness is limited by data problems, methodological challenges and their application.
As observed recently:
There remains relatively little empirical research on … causes of skill shortages and, particularly,
on their consequences for firm behaviour and for firm performance (Healy, Mavromaras and
Sloane 2015)
Some jurisdictions have also acknowledged the difficulties they face in producing useful
forecasts, not least the importance of filling data gaps. For instance, in its submission to this
study, the NSW Government noted:
To ensure the quality and effectiveness of skills needs assessments, the NSW Government
supports increasing and improving the use of robust, data-driven processes, including data
collection, integration and analysis at the national level to identify and respond to skills needs in
national, regional and local labour markets. (sub. 48, p. 12)
WHY GOVERNMENTS INVEST IN VET 117
On the methodological front, a major difficulty in producing skill lists is the plethora of
methods, used in tandem or by themselves, to forecast skill deficiencies. These involve
consultation with employers, examination of the difficulties in filling vacancies, statistical
methods that take past trends and project them into the future, and models that take into
account the factors driving shortages (such as wage adjustment, and shifts in the demand for
goods and services).
Each method faces problems in providing accurate assessments of skill needs. The summary
of their difficulties — identified in a review that is now nearly 20 years old — remains
relevant (Shah and Burke 2003).
Employer judgments about shortages need to take account of why an employer may
perceive a shortage, and therefore the imperative for training. For example, as noted
above, lack of experience in an occupation is not a factor that training can resolve.
Using vacancy measures tend to exaggerate skills needs because they do not fully take
into account job-to-job turnover within and across occupations, which may more quickly
resolve shortages than additional training.
Time series approaches assume that past patterns of demand will persist, whereas more
sophisticated and rigorous ‘structural’ models, such as the MONASH model (Meagher
and Pang 2011) embody many assumptions about the way labour markets behave.
A major hurdle for all approaches to forming skill lists is taking into account employers’ and
students’ behavioural responses to shortages. For instance, employers may raise wages to
attract workers in short supply, or they may adapt their business models so they are less
reliant on labour, but the extent to which they do so is difficult to forecast given all the
complexities of labour markets described earlier.
For example, predicting the retirement behaviour of Australians, can be critical for areas
where shortages are acute, but forecasts have tended to severely overestimate retirement
rates (as in the Australian Government’s early intergenerational reports).
Similarly, students’ collective choices in response to subsidies encouraging them to enrol
in qualifications in short supply may lead to excess enrolments in an occupation in
apparent short supply, leading to a surplus.
Finally, while the Australian Bureau of Statistics periodically updates its classification of
skills (the Australian and New Zealand Standard Classification of Occupations), which are
the basis for most skills lists, the classification inevitably fails to recognise the impacts of
technological change on the specialised skills that employers need.
Developing regional skill lists involve a further dimension of complexity and the need for
additional detailed data. Skill lists formulated at the national level may have little relevance
to the needs of regional employers. For instance, the Chamber of Commerce and Industry of
Western Australia noted that the 10 occupations eligible for the Australian Government’s
Additional Identified Skills Shortage (AISS) payments are not experiencing skills shortages
in Western Australia (CCIWA 2019, p. 3). The lack of alignment between incentives and the
118 NASWD REVIEW
local labour market means that AISS payments are unlikely to be useful in the Western
Australian context.
Quite apart from the difficulties in forecasting skill shortages, their value also depends on
whether they are up-to-date. The occupations on the Australian Government’s National
Skills Needs List, the basis for apprenticeship employer incentives, have not changed since
2011 and now only one third of the occupations on that list meet the definition of a shortage
(DESSFB 2019e).
The implication of these difficulties is, that in some instances, it may not be sensible to use
skill lists to allocate subsidies (an observation the Commission makes in chapter 7 in relation
to some apprenticeships). Furthermore, given the above problems, highly granular forecasts
of skill shortages as the basis for variations in subsidy rates is likely to be asking too much
of skill forecasts — an issue covered further in chapters 4 and 6.
INFORMATION REQUEST — IDENTIFYING AND ACTING ON SKILLS SHORTAGES
What are useful ways of defining and measuring the skills shortages (and surpluses)
relevant to the VET sector?
What factors are causing an apparently persistent shortage of skilled workers in some
occupations, despite these occupations being a priority for government support?
To what extent are skills forecasts based on future industry growth a useful and
reliable basis for providing course subsidies?
In what circumstances do skills shortages justify course and employer subsidies and
at what level of granularity?
3.3 Public and private benefits
There is an extensive literature on the effects of training on future wages — the typical
measure of private returns. There is less evidence on public returns. The relative importance
and nature of public and private benefits are — as discussed above — relevant to the
rationale for subsidising VET, and the likely outcomes.16
16 The problem is not peculiar to the VET system. The Bradley Review into higher education found that
‘subsidies across fields of study appears to bear little relationship to the actual cost of teaching or to any
notional public benefit’ (Bradley et al. 2008a, p. 161).
WHY GOVERNMENTS INVEST IN VET 119
Private benefits vary but are usually large
A substantial body of Australian evidence generally finds high private lifetime benefits of
VET (in comparison with the outcomes for less qualified people), reflecting a sequence of
beneficial labour market outcomes.17 VET completion:
raises the probability of employment and lowers it for unemployment (DOE 2019a;
Wilkins 2015, p. 72; Wilkins and Lass 2018, p. 109)
increases the likelihood of full time work generally (Wilkins 2015, p. 72; Wilkins and
Lass 2018, p. 109). It also increases the likelihood of obtaining full-time employment for the
first three years for men after completion of the qualification (Wilkins 2017, pp. 59–60)
increases the returns to work experience for males but not females (Wilkins 2016, p. 50)
reduces any spell in poverty (Wilkins 2016, p. 33)
increases wage rates (Sinning 2014, p. 27; Wei 2010, pp. 16–17; Wilkins 2015, p. 72;
Wilkins and Lass 2018, p. 109) or overall income (DOE 2019c; Karmel and Fieger 2012;
Long and Shah 2008).
The calculated returns to VET depend partly on the level of granularity of the VET
classifications used in the modelling, and on the benchmark group. In general, if the
benchmark group are people who did not complete year 12, then Certificate III/IVs and
Diploma/Advanced Diplomas produce good returns (with equivocal results for
Certificate I/IIs). If the reference group are people who have completed year 12, only
Diploma/Advanced Diplomas generate significant positive returns (Lee and Coelli 2010;
Leigh 2008).
Not all empirical analyses demonstrate private benefits from qualifications. Some evidence
shows negative private premiums from completing some non-trade apprenticeships,
particularly for sales workers, male community and personal service workers, and female
labourers (Nelms et al. 2017, p. 33). Other empirical analysis also shows that the returns to
VET depend on whether students are undertaking courses while also working, or are
relinquishing employment to train (Ryan 2002). While not definitive, these findings raise
questions about whether students always make training investment decisions in their
financial interest.
There are also intangible private job returns that cannot be measured easily in dollars, but
that influence students’ choices. After controlling for income, longer durations of education
are associated with better jobs (such as greater job prestige, satisfaction, autonomy, and sense
of accomplishment) and non-pecuniary benefits outside the labour market, such as health
benefits (DOE 2019b; Oreopoulos and Salvanes 2011; Stromback and Dockery 2005).
These are backwards-looking results. The private benefits of vocational education may change
given the increasing shift away from routine to non-routine manual and cognitive tasks
17 The different studies use different methods, control variables, benchmark groups and datasets, but
nevertheless reach general agreement about the direction of the effects.
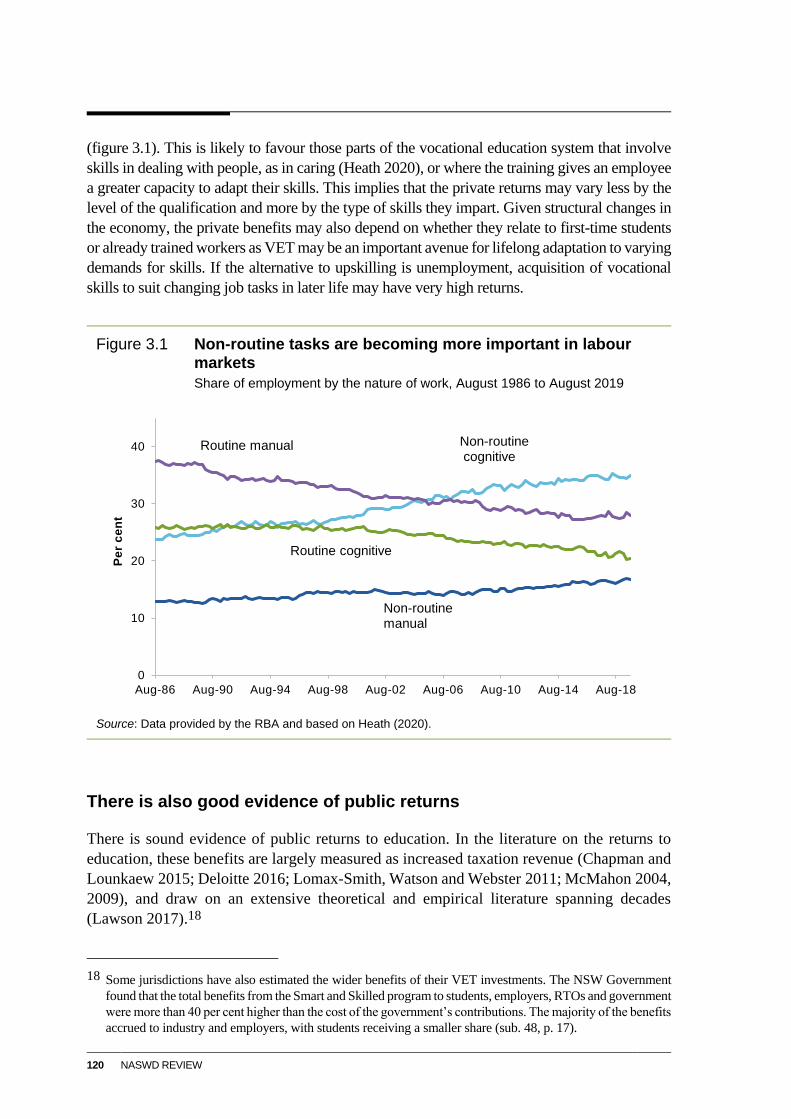
120 NASWD REVIEW
(figure 3.1). This is likely to favour those parts of the vocational education system that involve
skills in dealing with people, as in caring (Heath 2020), or where the training gives an employee
a greater capacity to adapt their skills. This implies that the private returns may vary less by the
level of the qualification and more by the type of skills they impart. Given structural changes in
the economy, the private benefits may also depend on whether they relate to first-time students
or already trained workers as VET may be an important avenue for lifelong adaptation to varying
demands for skills. If the alternative to upskilling is unemployment, acquisition of vocational
skills to suit changing job tasks in later life may have very high returns.
Figure 3.1 Non-routine tasks are becoming more important in labour markets
Share of employment by the nature of work, August 1986 to August 2019
Source: Data provided by the RBA and based on Heath (2020).
There is also good evidence of public returns
There is sound evidence of public returns to education. In the literature on the returns to
education, these benefits are largely measured as increased taxation revenue (Chapman and
Lounkaew 2015; Deloitte 2016; Lomax-Smith, Watson and Webster 2011; McMahon 2004,
2009), and draw on an extensive theoretical and empirical literature spanning decades
(Lawson 2017).18
18 Some jurisdictions have also estimated the wider benefits of their VET investments. The NSW Government
found that the total benefits from the Smart and Skilled program to students, employers, RTOs and government
were more than 40 per cent higher than the cost of the government’s contributions. The majority of the benefits
accrued to industry and employers, with students receiving a smaller share (sub. 48, p. 17).
0
10
20
30
40
Aug-86 Aug-90 Aug-94 Aug-98 Aug-02 Aug-06 Aug-10 Aug-14 Aug-18
Pe
r c
en
t
Non-routinecognitive
Routine cognitive
Non-routinemanual
Routine manual
WHY GOVERNMENTS INVEST IN VET 121
As income is taxed, increases in earnings due to education generate government revenue.
The tax revenue gain only occurs when incomes exceed the tax-free threshold so that the
revenue gain will be larger for people on higher marginal tax rates. This suggests that the
revenue gains are greatest for Diplomas and Advanced Diplomas and are much less for
Certificate I/IIs (usually undertaken by students on lower wages who often do not enjoy a
significant uplift in future wages). Revenue gains will also be smaller for part-time workers
for the same reason. The tax benefits can be substantial, with one study finding that tax
benefits added about 7 percentage points to the private rate of return for skilled labour for
both males and females in 2006 (Wei 2010, pp. 16–17).
The lower government outlays associated with higher incomes also produces fiscal benefits.
For example, the estimated reliance on the age pension is 87 per cent for people whose
highest level of educational attainment is a Certificate III/IV, while it is 77 per cent for
Diploma qualifications and less again for higher education qualifications (DOE 2019c).
There is also a link between the public returns to VET and skill shortages (as discussed in
the earlier section). The fundamental policy concern about any persistent skill shortages is
that the training system is not allocating its resources to skill formation with the greatest
economic benefits. Such missed opportunities — to the extent that they are material and
genuine — are public returns that could justify policy intervention.
In addition, in non-competitive markets, workers may not fully capture the incremental
productivity gains from education. Nor do they do so when education encourages innovation
that cannot be fully appropriated by the firm — with this being a likely major factor shaping
long-term economic growth (Chapman 2006). However, it is unlikely that proficiency in
vocationally-oriented skills is as important to innovation as analytical skills acquired in
higher education given that R&D tends to be intensive in high-level skills.
There are also intangible public benefits, such as less crime, intergenerational benefits and,
less clearly, improved social capital.
For instance, an Australian study found that the 75 per cent increase in VET participation in
Victoria under the Victorian Training Guarantee led to 4.5 per cent, 11.3 per cent and
12.8 per cent reductions in person, property and drug crime rates respectively (Jha and
Polidano 2016).19 Given the costs of crime, the study estimated that every dollar of
additional VET spending saved 18 cents. A single study is not sufficient to infer that the
benefits of VET spending in Australia are of this magnitude. Meta-analysis of the
international research on the impact of additional years of education on crime find different
magnitudes of effects but overwhelmingly they show reductions in crime can be causally
related to education (Hjalmarsson and Lochner 2012).20
19 Causality was established by comparing results with New South Wales where no such policy stimulus to
VET took place. Analysis was at the postcode level rather than for individuals — which often results in less
robust results.
20 However, rigorous studies (all US) of the effects of VET on recidivism show no robust results (Newton et
al. 2018). If this also applies in Australia, it implies that VET reduces the probability of first offences.
122 NASWD REVIEW
Participation in post-school VET may also have intergenerational benefits, as a greater
duration of parental education is generally associated with better outcomes for children
(Oreopoulos and Salvanes 2011). In part, the causal avenue is that, to the extent that VET
increases household income, children have better opportunities and suffer less deprivation.
Another transmission mechanism is that additional years of education for parents tends to
increase the duration of their children’s’ investment in schooling — although rigorous
analysis suggests not by much (Holmlund, Lindahl and Plug 2010). These intergenerational
effects include both private and public benefits as parents and society have a stake in child
welfare outcomes.
Improved social capital from training — such as civic engagement and social participation
— is often claimed and is supported by qualitative evidence (for example, Allison, Gorringe
and Lacey 2006; Priest 2009). However, while there are associations between VET and
social capital, the magnitude of the causal effect is harder to establish (Sabates, Salter and
Obolenskaya 2012). This is important because causality may be bi-directional, such that
social embeddedness may be both a cause and effect of the take up of vocational education.
This means that a policy that stimulated VET may have weaker impacts on social capital
than the statistical associations and qualitative evidence might suggest.
Unlike the evidence on the private economic returns to education, there is less complete
evidence about the effects of different Certificate levels of VET on social benefits. As noted
earlier, the tax benefits are likely to be greater for higher-level vocational qualifications. On
the other hand, the intangible social benefits may be higher for lower-level vocational
qualifications. This reflects that reduced crime and intergenerational benefits are likely to be
higher for disadvantaged students, who are overrepresented among Certificate I/II
qualifications (Karmel and Lim 2013, p. 18; Myconos, Dommers and Clarke 2018, p. 4).
INTERIM FINDING 3.1 — PUBLIC AND PRIVATE RETURNS TO VET
There are significant private and public economic returns to VET, with returns larger for
Diploma and Advanced Diploma VET courses.
There are also indirect benefits — such as reduced crime and intergenerational
economic mobility — which may be greatest for lower-level VET qualifications.
Why do public and private benefits matter?
The main implication of high private returns (tangible and non-tangible) is that, if
well-informed, many students will have a strong motive to undertake VET without the need
for government incentives. In effect, society may be able to free-ride on the incentives for
students to undertake study.
There are several caveats to this conclusion.
WHY GOVERNMENTS INVEST IN VET 123
First, by their nature, the public benefits to education cannot be appropriated by the student
and therefore will not influence the decision to undertake training. At the margin, there could
be underinvestment by students whose private rate of return is insufficient to motivate
undertaking study. This may justify some level of government support, although the amount
is difficult to determine.21 As a heuristic, some argue that subsidy levels should be based on
the share of the total social value of education that is public (as raised by Lomax-Smith,
Watson and Webster 2011, p. 108).
Second, regardless of whether private benefits are enough to drive investment in VET, there
is an equity argument for requiring contributions from all the parties (society at large,
employers and students) who benefit. This is a societal choice exercised by government, and
shaped by social norms about what is fair.
Third, students may underestimate returns that are distant in time and inherently uncertain,
so that they may fail to undertake training even if it would privately pay to do so (Damgaard
and Nielsen 2018). Complicating matters further, once the returns to education vary across
students, it seems even more heroic to assume that students can reliably make the most
advantageous decisions about their training. For instance, job mismatch should be low if
people can accurately assess the relevance of their training to future labour market needs.
However, while job mismatch resulting from overskilling is relatively uncommon for more
highly trained VET graduates, with 62 per cent of people with Certificate III/IV/Diplomas
well matched to their jobs, only 45 per cent of people with Certificate I/II and below are well
matched (Mavromaras, McGuinness and Fok 2010, p. 14).
Overall, the public returns to VET justify some level of government support. However,
unlike the rationale of addressing skill shortages, the existence of public benefits justifies
broad access to subsidies (as in higher education), not just access limited to occupations in
short supply.
3.4 Consistency with the higher education system
The VET funding system lies between the fully subsidised public school and the generally
heavily subsidised higher education systems. People’s transitions to work and education are
shaped by the measures that governments use to favour some pathways over others. For
instance, the advent of the demand-driven university system saw a large increase in the
uptake of higher education (with shifts away from VET), as have past policy initiatives (like
income contingent loans) that made universities more accessible to a broader range of
students (PC 2019c).
21 The optimum subsidy level depends on the nature of the marginal public and private benefits and costs in
the relevant market, and the cost of raising funds for subsidies — which are empirical issues.
124 NASWD REVIEW
Even with the now suspended demand-led system, most Australians who want to go to
university can do so and attract a subsidy. In contrast, the VET system is aptly described as
a ‘demand-managed system’ (Fowler 2017, p. 7)
In this context, subsidies for VET are justified to avert the risk that students will be otherwise
encouraged to enter the subsidised higher education sector even if the VET sector better
meets their and society’s needs.
This comes into sharp relief for:
occupations where there are regulatory requirements such as occupational licensing that
require completion of VET. In these cases, governments would risk shortages of
high-value vocational occupations if funding were to overly favour higher education
occupations that are close substitutes, but where different sectors provide the training —
as in nursing (box 3.2). A more neutral treatment of government funding between the
two sectors is likely to be efficient for qualifications that embody overlapping skills
Australian Qualifications Framework (AQF) 5/6 qualifications in general. The boundary
between higher education and VET at the AQF 5/6 level is blurred with both sectors
offering qualifications at that level, but with differential treatment. The differences
include requirements that access to VET Student Loans are limited to qualifications on
skill lists on the one hand with no such provision in higher education (Fowler 2018)
students whose expected outcomes would be greater from training in the VET than the
higher education system. For instance, male students with low Australian Tertiary
Admission Ranks (ATARs) undertaking VET courses often get better wage outcomes
than students with the same ATARs pursuing university bachelor’s degrees (Norton,
Cherastidtham and Mackey 2019)
students whose best career path commences in VET and then continue in the
higher education system.
Apart from the efficiency arguments for some degree of parity in the treatment of the two
sectors, there are equity arguments for treating higher education and VET on a more similar
footing. While there are some exceptions, most VET students have lower lifetime earnings
than higher education graduates (figure 3.2), so transfers that favour the latter over the
former may be inequitable even after taking account of progressive tax rates — again a
matter for political judgment.
WHY GOVERNMENTS INVEST IN VET 125
Box 3.2 Becoming a nurse: To register or to enrol …
Prospective nurses need to decide whether to pursue a career as a registered nurse (RN) or an
enrolled nurse (EN). Each entails different duties, licensing conditions and qualifications, which
are provided by different institutions.
A RN is more highly paid, works independently and in teams, is accountable and responsible for
their actions and can delegate to ENs and other healthcare workers. An EN is supervised by a
RN, either directly or indirectly, to provide nursing care but performs relatively less complex
procedures. Both are governed by separate Standards for Practice as dictated by the Nursing
and Midwifery Board (NMBA) and local policies and procedures.
A RN must complete a minimum three-year bachelor’s degree approved by the NMBA to be
registered with the NMBA. An EN has to complete a Certificate IV or a Diploma from a RTO, that
is also separately NMBA-approved, and then register with the NMBA to practice. Registration for
both RNs and ENs incurs a fee, which varies depending on the type of registration sought (there
are five). There are also mandatory standards relating to continuing professional development,
professional indemnity insurance arrangements and recency of practice.
A RN student, because they attend a university, has access to a Commonwealth-funded
university place with no upfront fees and a no-fee income contingent HECS loan.
An EN, because they need to attend a VET institution, potentially has access to a fully subsidised
course. If the course is not fully subsidised, but the student is studying a Diploma, they may have
access to an income contingent loan. The difference between course fees and the applicable loan
cap will determine whether the student faces upfront costs (appendix E). If the student is
undertaking a Certificate IV, they would not have access to an income contingent loan.
Sources: Queensland Health (2019), NSW Health (2020) and NMBA (2020).
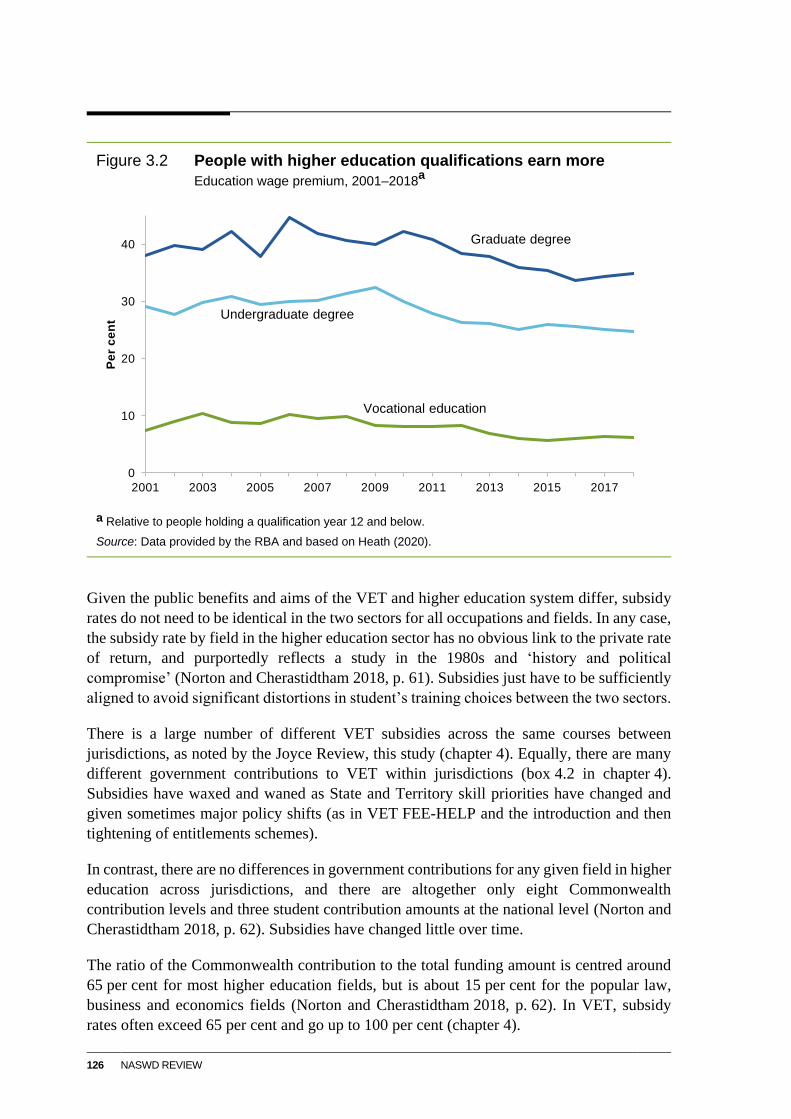
126 NASWD REVIEW
Figure 3.2 People with higher education qualifications earn more
Education wage premium, 2001–2018a
a Relative to people holding a qualification year 12 and below.
Source: Data provided by the RBA and based on Heath (2020).
Given the public benefits and aims of the VET and higher education system differ, subsidy
rates do not need to be identical in the two sectors for all occupations and fields. In any case,
the subsidy rate by field in the higher education sector has no obvious link to the private rate
of return, and purportedly reflects a study in the 1980s and ‘history and political
compromise’ (Norton and Cherastidtham 2018, p. 61). Subsidies just have to be sufficiently
aligned to avoid significant distortions in student’s training choices between the two sectors.
There is a large number of different VET subsidies across the same courses between
jurisdictions, as noted by the Joyce Review, this study (chapter 4). Equally, there are many
different government contributions to VET within jurisdictions (box 4.2 in chapter 4).
Subsidies have waxed and waned as State and Territory skill priorities have changed and
given sometimes major policy shifts (as in VET FEE-HELP and the introduction and then
tightening of entitlements schemes).
In contrast, there are no differences in government contributions for any given field in higher
education across jurisdictions, and there are altogether only eight Commonwealth
contribution levels and three student contribution amounts at the national level (Norton and
Cherastidtham 2018, p. 62). Subsidies have changed little over time.
The ratio of the Commonwealth contribution to the total funding amount is centred around
65 per cent for most higher education fields, but is about 15 per cent for the popular law,
business and economics fields (Norton and Cherastidtham 2018, p. 62). In VET, subsidy
rates often exceed 65 per cent and go up to 100 per cent (chapter 4).
0
10
20
30
40
2001 2003 2005 2007 2009 2011 2013 2015 2017
Pe
r c
en
t
Graduate degree
Undergraduate degree
Vocational education

WHY GOVERNMENTS INVEST IN VET 127
INTERIM FINDING 3.2 — ALIGNED TREATMENT OF VET AND HIGHER EDUCATION
The use of subsidies in the university system provides a robust efficiency and equity
rationale for subsidies in the VET system.
However, given the public benefits and aims of the VET and higher education systems
differ, subsidy rates do not need to be identical in the two sectors for all occupations and
fields.

MECHANICS OF VET COURSE FUNDING 129
4 Mechanics of VET course funding
Key points
States and Territories use course subsidies primarily to meet skill needs and increase
participation in training, particularly by students facing disadvantage. States and Territories
use similar approaches to setting and managing subsidies.
All jurisdictions use skill lists to decide which courses to subsidise, estimate course costs
and set subsidy rates, and manage course subsidies through contracts with Registered
Training Organisations.
Most jurisdictions set higher subsidy rates for lower level qualifications — reflecting State
and Territory governments’ views that they have relatively higher expected public benefits.
Apprenticeships are also prioritised.
However, there is significant variation in policy priorities and the approaches used to
determine which courses receive subsidies. Consequently, the number of courses
subsidised, the value of subsidies and student fees vary widely across States and Territories.
Differences in subsidy settings include how course costs are calculated, the range of subsidy
rates, loadings for delivery to higher cost students and concessional fees for students facing
disadvantage.
There is a general lack of transparency on subsidy settings and the rationales for subsidies.
There is also a lack of transparency on course costs faced by students.
Lack of transparency affects the capacity of students, employers, training providers and
governments to make informed decisions on investment in training.
Although the Commission was not able to assess the effectiveness of each jurisdiction’s
approach to subsidy setting and management, our analysis revealed some issues.
Data used to estimate course costs (which inform subsidy rates) are dated in most States
and Territories and are not a sound basis for setting subsidies.
The complexity of subsidy arrangements in some jurisdictions is likely to be inefficient.
Fixing student fees can stifle competition, inhibit allocative efficiency, and reduce
incentives to improve the quality of training. There are more direct instruments than price
regulation to address issues of quality management, information asymmetries and
budget control.
This chapter analyses vocational education and training (VET) course funding and pricing
in each State and Territory. It assesses the different approaches used by governments to set
course subsidies and student fees in the government-funded segment of the VET market.
Commission estimates based on available data suggest, in aggregate, about 46 per cent of
VET funding ($2.8 billion) was spent on course subsidies in 2018.
130 NASWD REVIEW
While governments use similar methods to identify priority courses, set subsidy rates and
regulate registered training organisations (RTOs) to deliver subsidised training, detailed
information can be lacking on each of these steps. Each government also has its own policy
priorities that shape decisions. There is better information on how student fees are set but it
is difficult to analyse the impact of fees on student choices, the quality and efficiency of
training, and the functioning of the VET market.
There is a plethora of VET programs and policies. The Commission has faced difficulties
obtaining the information required to undertake a comprehensive analysis of course subsidy
settings in each State and Territory. Reflecting this, the analysis in this chapter focuses
mainly on subsidy settings for non-apprenticeship courses.
The Commission is seeking more information to complete its analysis. In particular, the
Commission would welcome information on how the approaches used by States and
Territories work in practice to meet governments’ economic and social policy goals.
4.1 The approach to subsidising VET courses
Subsidies for courses are primarily intended to encourage the take up of training in priority
occupations (based on skill lists) or by students facing disadvantage. Subsidies are paid to
RTOs to allow them to deliver training with lower fees for students, including for courses
that may not be viable without the subsidy (box 4.1).
There are three key steps involved in funding and pricing VET courses.
1. Determining which courses to subsidise. All governments create lists of courses eligible
for a subsidy (skill lists). While governments have various reasons for placing courses
on their skill lists, the main reason is training workers for industries considered to be
facing skills shortages and/or with ‘growth potential’ (appendix D). Priority is often
given to courses deemed to offer higher economic or social returns (apprentices in the
first case, lower-level Australian Qualification Framework (AQF) courses in the second
case). A related goal is promoting participation in training by students facing
disadvantage (for example, people living outside metropolitan areas, unemployed people,
people with disabilities and Aboriginal and Torres Strait Islanders).22
2. Setting course subsidies. Subsidy rates vary according to the priority attached to each
course. For example, apprentices are eligible for higher course subsidy rates than
non-apprentice students undertaking the same course, as are students studying
foundational courses (leading to Certificates I and II) compared to students completing
Diplomas. For students facing disadvantage, higher subsidies are usually provided
through loadings paid to RTOs (reflecting that these students are higher-cost learners)
and concessions for eligible students (to increase their participation).
22 For the rest of this chapter, a student facing disadvantage is defined to include all of these groups, unless
otherwise stated.
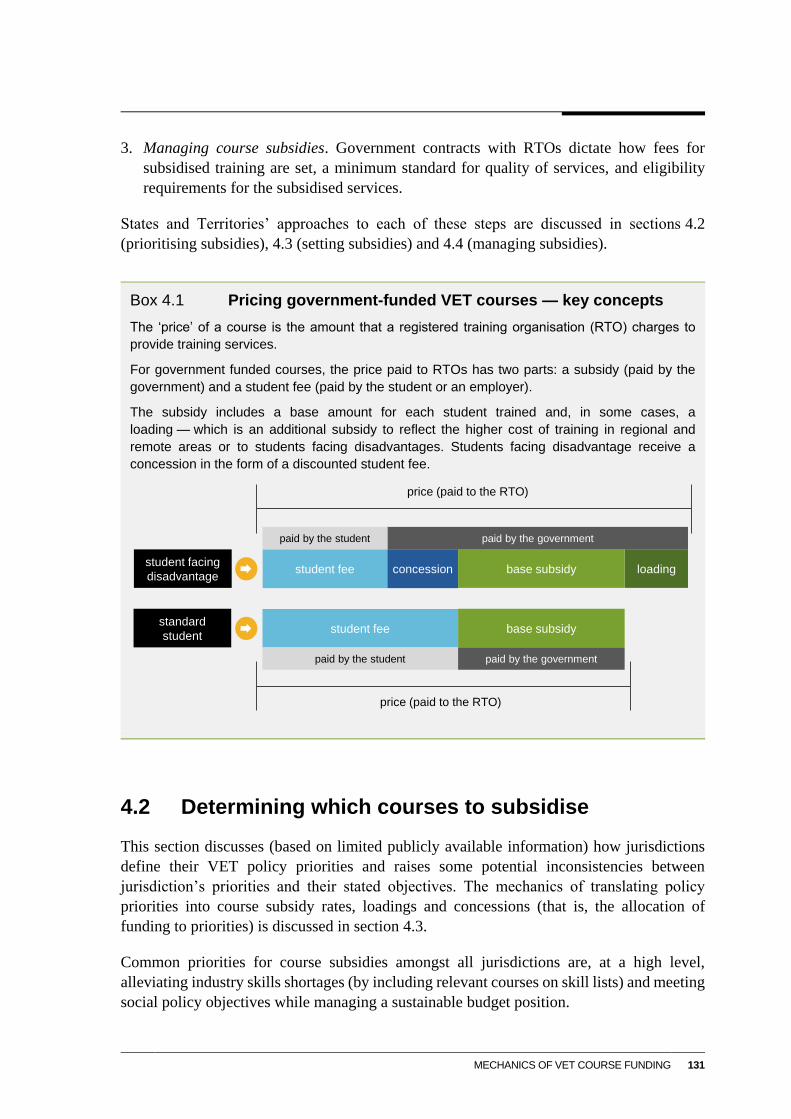
MECHANICS OF VET COURSE FUNDING 131
3. Managing course subsidies. Government contracts with RTOs dictate how fees for
subsidised training are set, a minimum standard for quality of services, and eligibility
requirements for the subsidised services.
States and Territories’ approaches to each of these steps are discussed in sections 4.2
(prioritising subsidies), 4.3 (setting subsidies) and 4.4 (managing subsidies).
Box 4.1 Pricing government-funded VET courses — key concepts
The ‘price’ of a course is the amount that a registered training organisation (RTO) charges to
provide training services.
For government funded courses, the price paid to RTOs has two parts: a subsidy (paid by the
government) and a student fee (paid by the student or an employer).
The subsidy includes a base amount for each student trained and, in some cases, a
loading — which is an additional subsidy to reflect the higher cost of training in regional and
remote areas or to students facing disadvantages. Students facing disadvantage receive a
concession in the form of a discounted student fee.
4.2 Determining which courses to subsidise
This section discusses (based on limited publicly available information) how jurisdictions
define their VET policy priorities and raises some potential inconsistencies between
jurisdiction’s priorities and their stated objectives. The mechanics of translating policy
priorities into course subsidy rates, loadings and concessions (that is, the allocation of
funding to priorities) is discussed in section 4.3.
Common priorities for course subsidies amongst all jurisdictions are, at a high level,
alleviating industry skills shortages (by including relevant courses on skill lists) and meeting
social policy objectives while managing a sustainable budget position.
standard
student
student facing
disadvantageloadingstudent fee concession
base subsidystudent fee
base subsidy
paid by the student paid by the government
price (paid to the RTO)
paid by the governmentpaid by the student
price (paid to the RTO)
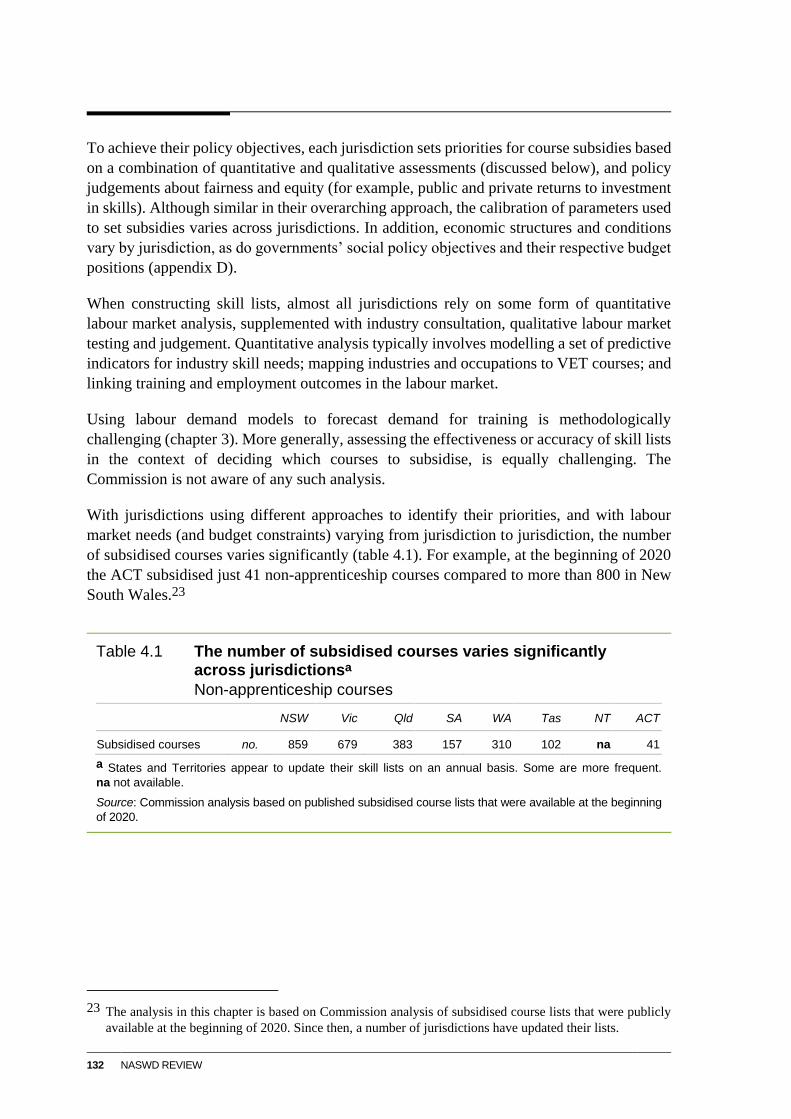
132 NASWD REVIEW
To achieve their policy objectives, each jurisdiction sets priorities for course subsidies based
on a combination of quantitative and qualitative assessments (discussed below), and policy
judgements about fairness and equity (for example, public and private returns to investment
in skills). Although similar in their overarching approach, the calibration of parameters used
to set subsidies varies across jurisdictions. In addition, economic structures and conditions
vary by jurisdiction, as do governments’ social policy objectives and their respective budget
positions (appendix D).
When constructing skill lists, almost all jurisdictions rely on some form of quantitative
labour market analysis, supplemented with industry consultation, qualitative labour market
testing and judgement. Quantitative analysis typically involves modelling a set of predictive
indicators for industry skill needs; mapping industries and occupations to VET courses; and
linking training and employment outcomes in the labour market.
Using labour demand models to forecast demand for training is methodologically
challenging (chapter 3). More generally, assessing the effectiveness or accuracy of skill lists
in the context of deciding which courses to subsidise, is equally challenging. The
Commission is not aware of any such analysis.
With jurisdictions using different approaches to identify their priorities, and with labour
market needs (and budget constraints) varying from jurisdiction to jurisdiction, the number
of subsidised courses varies significantly (table 4.1). For example, at the beginning of 2020
the ACT subsidised just 41 non-apprenticeship courses compared to more than 800 in New
South Wales.23
Table 4.1 The number of subsidised courses varies significantly across jurisdictionsa
Non-apprenticeship courses
NSW Vic Qld SA WA Tas NT ACT
Subsidised courses no. 859 679 383 157 310 102 na 41
a States and Territories appear to update their skill lists on an annual basis. Some are more frequent.
na not available.
Source: Commission analysis based on published subsidised course lists that were available at the beginning
of 2020.
23 The analysis in this chapter is based on Commission analysis of subsidised course lists that were publicly
available at the beginning of 2020. Since then, a number of jurisdictions have updated their lists.
MECHANICS OF VET COURSE FUNDING 133
In addition to skill lists, governments also use training modes, qualification levels and
training providers (public and private providers) as criteria for deciding which courses to
fund.24 There is a lack of transparency about these other criteria and the methods used to
operationalise them. To some extent, prioritisation appears to reflect common assumptions
among States and Territories about public and private returns to training, and other more
disparate policy priorities. In application, the prioritisation process can lead to seemingly
inconsistent outcomes.
All jurisdictions prioritise lower AQF qualifications (for example, a Certificate I
qualification is more heavily subsidised than an Advanced Diploma). This reflects the
assumption that public returns from skill formation are larger for lower level qualifications,
including foundation courses (chapter 5). Conversely, the private returns to training tend to
be higher for graduates with high level qualifications (chapter 3).
However, prioritising subsidies based only on assumptions of public and private return is
not general practice (indeed that could be inconsistent with the aims of skill lists, which are
designed to prioritise training in areas of industry need).
Rather, States and Territories often target high — even the highest — subsidies at courses
with strong economic returns. For example, the Queensland Government directs the highest
rate of public subsidy at courses ‘assessed as highly effective in generating outcomes for
graduates’ (DESBT (Qld) 2019c). Similarly, the Western Australian Government assigns
the ‘highest priority’ to apprenticeships and traineeships because they are ‘employment
based’ (pers. comm., Western Australian Government, 25 February 2020). The approach of
directing high subsidies to apprentices and trainees appears to be common practice across
many jurisdictions (section 4.3).
This leads to a situation where high public subsidies are directed at courses that are expected
to have high public returns (for example, foundational courses) and/or high private returns
(for example, apprenticeships). As discussed in chapter 3, directing public subsidies toward
courses with high private returns may be inefficient.
On equity grounds, all jurisdictions provide subsidies for students facing disadvantage
(section 4.3; appendix D), although eligibility criteria differ by jurisdiction. For example, all
States and Territories except Tasmania and the ACT provide loadings for students in regional
areas. Victoria, New South Wales, Western Australia and the ACT also offer loadings for
Aboriginal and Torres Strait Islander (ATSI) students.
Likewise, a student’s eligibility for concessions varies by jurisdiction, but they tend to be
available for students receiving government benefits. New South Wales, Victoria and
Queensland have specific concessions for ATSI students and Western Australia, Tasmania,
Queensland and South Australia provide concessions to prisoners (appendix D).
24 A number of submissions to the Joyce Review (including Navitas (2019)) stated that public providers
received preferential treatment by governments — this issue and others are discussed in chapter 2.
134 NASWD REVIEW
4.3 How VET course subsidies are set
Subsidy setting by jurisdictions has two parts.
Estimating the cost of delivery for each course.
Assigning a subsidy rate for each course.
Various ‘building blocks’ are used to estimate the cost of courses before deciding on the
subsidy rate. The process is summarised in figure 4.1 below.
Estimating course costs
As course subsidies are set as a proportion of course costs, accurate estimates of the cost of
training is vital — TAFE Directors Australia considers it a ‘first order issue’ (sub. 59, p. 11).
However, estimating costs is not an easy task. Given the large number of VET courses, ways
of compiling qualifications and provider operating models, it is not feasible to estimate costs
for individual providers. The alternative — sampling cost profiles from a range of
providers — must control for variations in teaching methods, student needs, and provider,
locational and course characteristics:
… calculating cost in education and training is not a precise science. Costs will differ across
qualifications, and will differ within qualifications according to location, and/or learner
characteristics … Cost is also impacted by the environment in which the provider operates … but,
it is also reflective of how a product is delivered. If class sizes are … small, the latest equipment or
technology is made readily available, or industry secondments are offered, the cost of delivery will
generally be greater than delivery without those components. (BCA, sub. 16, p. 30)
Jurisdictions try to take some of these factors into account (for example, loadings for
higher-cost learners and delivery into regional areas). The key steps in estimating costs are
outlined below, with similarities and differences summarised in table 4.2.
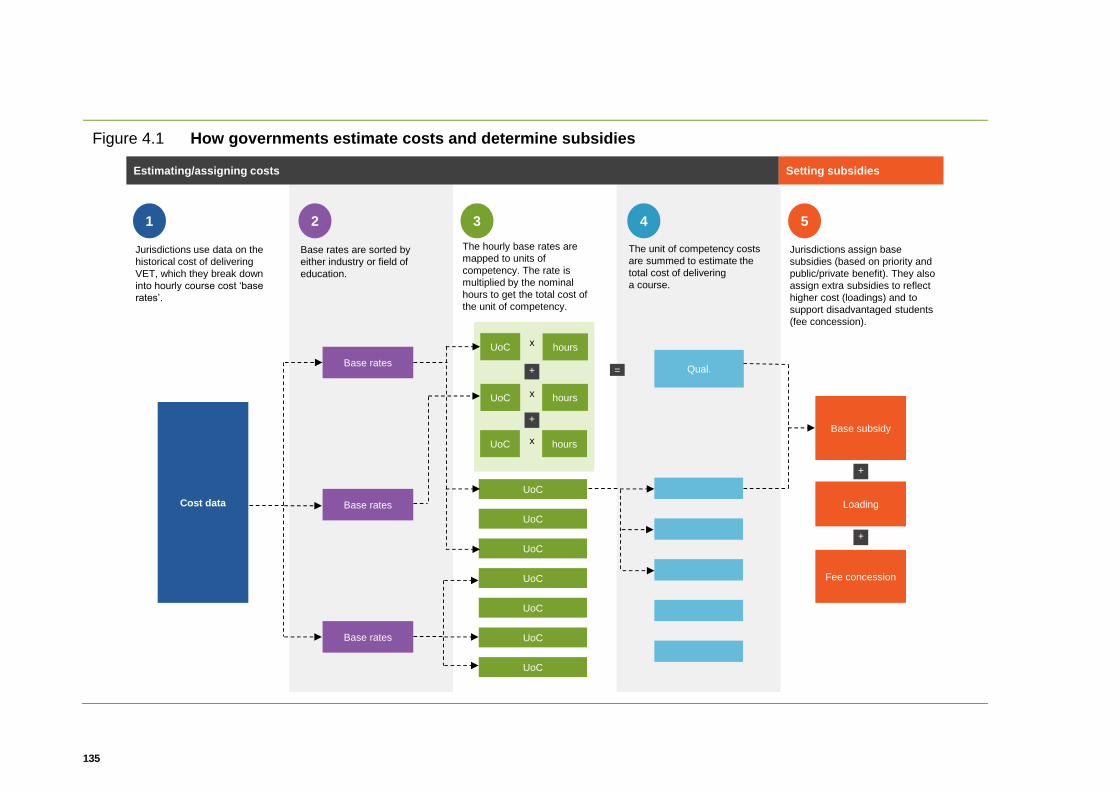
135
Figure 4.1 How governments estimate costs and determine subsidies
Cost data
Base rates
Base rates
Base rates
Qual.
Estimating/assigning costs Setting subsidies
Jurisdictions use data on the
historical cost of delivering
VET, which they break down
into hourly course cost ‘base
rates’.
Base rates are sorted by
either industry or field of
education.
The hourly base rates are
mapped to units of
competency. The rate is
multiplied by the nominal
hours to get the total cost of
the unit of competency.
The unit of competency costs
are summed to estimate the
total cost of delivering
a course.
Jurisdictions assign base
subsidies (based on priority and
public/private benefit). They also
assign extra subsidies to reflect
higher cost (loadings) and to
support disadvantaged students
(fee concession).
=
UoC hours
UoC hours
UoC hoursx
+
x
x
+Base subsidy
Loading
Fee concession
+
+
5431 2
UoC
UoC
UoC
UoC
UoC
UoC
UoC
=
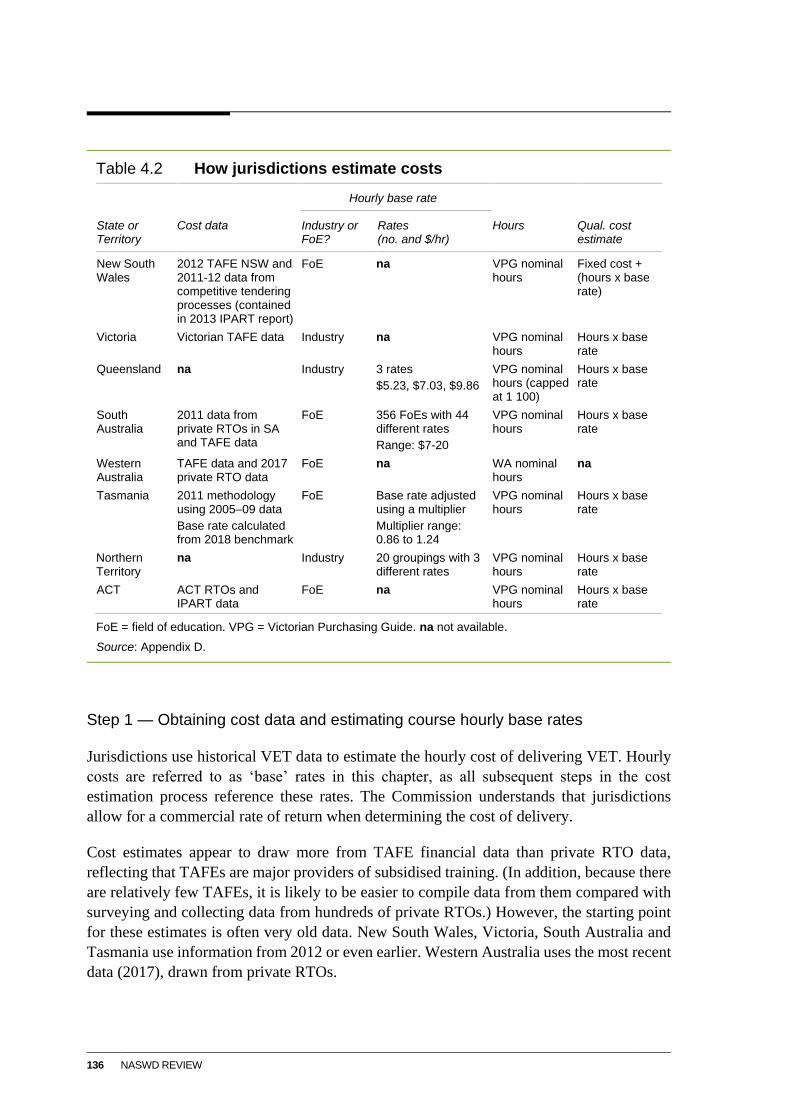
136 NASWD REVIEW
Table 4.2 How jurisdictions estimate costs
Hourly base rate
State or Territory
Cost data Industry or FoE?
Rates (no. and $/hr)
Hours Qual. cost estimate
New South Wales
2012 TAFE NSW and 2011-12 data from competitive tendering processes (contained in 2013 IPART report)
FoE na VPG nominal hours
Fixed cost + (hours x base rate)
Victoria Victorian TAFE data Industry na VPG nominal hours
Hours x base rate
Queensland na Industry 3 rates
$5.23, $7.03, $9.86
VPG nominal hours (capped at 1 100)
Hours x base rate
South Australia
2011 data from private RTOs in SA and TAFE data
FoE 356 FoEs with 44 different rates
Range: $7-20
VPG nominal hours
Hours x base rate
Western Australia
TAFE data and 2017 private RTO data
FoE na WA nominal hours
na
Tasmania 2011 methodology using 2005–09 data
Base rate calculated from 2018 benchmark
FoE Base rate adjusted using a multiplier
Multiplier range: 0.86 to 1.24
VPG nominal hours
Hours x base rate
Northern Territory
na Industry 20 groupings with 3 different rates
VPG nominal hours
Hours x base rate
ACT ACT RTOs and IPART data
FoE na VPG nominal hours
Hours x base rate
FoE = field of education. VPG = Victorian Purchasing Guide. na not available.
Source: Appendix D.
Step 1 — Obtaining cost data and estimating course hourly base rates
Jurisdictions use historical VET data to estimate the hourly cost of delivering VET. Hourly
costs are referred to as ‘base’ rates in this chapter, as all subsequent steps in the cost
estimation process reference these rates. The Commission understands that jurisdictions
allow for a commercial rate of return when determining the cost of delivery.
Cost estimates appear to draw more from TAFE financial data than private RTO data,
reflecting that TAFEs are major providers of subsidised training. (In addition, because there
are relatively few TAFEs, it is likely to be easier to compile data from them compared with
surveying and collecting data from hundreds of private RTOs.) However, the starting point
for these estimates is often very old data. New South Wales, Victoria, South Australia and
Tasmania use information from 2012 or even earlier. Western Australia uses the most recent
data (2017), drawn from private RTOs.
MECHANICS OF VET COURSE FUNDING 137
In the absence of more recent data, jurisdictions apply inflation factors, typically using the
Consumer Price Index. A better approximation of inflation in the VET sector, which controls
for the influence of subsidies, would be a VET-specific producer price index — which does
not exist.25 The producer price index for education is only available for higher education.
That index has experienced inflation of 28 per cent since 2012 (ABS 2020).
More substantively, the sector has changed in many ways since 2012 (for example, in
teaching methods and funding arrangements), which suggest the cost profiles of TAFEs, and
the sector as a whole, are different today. Compounding this is that the TAFE sector likely
has higher cost structures than private RTOs (discussed below), meaning that cost estimates
based on TAFE data might overstate the actual cost of delivery for many private providers.
INTERIM FINDING 4.1 — DATA UNDERPINNING SUBSIDY RATES
Data used to estimate course costs (which inform subsidy rates) are dated in most
States and Territories and are not a sound basis for setting subsidies.
There is little transparency on the nature of actual RTO cost data, or how jurisdictions
calculate base rates.
Step 2 — Classifying hourly base rates
To recognise the different costs of delivering different VET courses, jurisdictions modify or
‘sort’ base rates according to fields of education or industry.
A field of education is a classification that maps education into different categories under
the Australian Standard Classification of Education (ASCED). The ASCED classifies
fields of education at ‘broad’, ‘narrow’ and ‘detailed’ levels. There are 12 fields of
education at the broad level (including, for example, ‘Education’, ‘Health’ and ‘Creative
Arts’) and 356 at the detailed level (for example, under the broad field of Health, there are
56 narrow fields including ‘General Nursing’, ‘Midwifery’ and ‘Mental Health Nursing’).
Industry classifications are based on the 2006 Australian and New Zealand Standard
Industrial Classification (ANZSIC). The ANZSIC groups industries across 19 divisions
and 96 subdivisions.
The way jurisdictions use the ASCED and ANZSIC to sort hourly base rates differs widely.
For example, Tasmania calculates a single base rate for VET delivery and then adjusts this
rate by factors of between 0.86 and 1.24 depending on the relevant field of education at the
broad level (12 categories). South Australia sorts each of the 356 detailed fields of education
into 44 hourly base rates, resulting in some common rates across different fields of
25 The education price index includes subsidised prices which can make it difficult to determine whether price
changes are caused by changing subsidies or changes in underlying costs. For instance, if a subsidy is
reduced, prices will likely increase, meaning that the price index will rise regardless of costs.
138 NASWD REVIEW
education. Queensland and the Northern Territory use ANZSIC classifications to group
industries into high, medium and low-cost categories and assigns rates to these categories.
There is little transparency on rationales underpinning jurisdictions’ approaches to sorting
and grouping hourly base rates.
Step 3 — Assigning units of competency to a base rate and hours of delivery
VET courses are composed of units of competency. Across the VET sector there are more
than 17 000 units (DET nd, p. 1). Each unit of competency is mapped to a field of education
or industry (depending on the approach used in step 2). The mapping of each unit of
competency to a field of education/industry produces a corresponding hourly base rate.
For each unit of competency, the hourly base rate is multiplied by the estimated hours
required to deliver the unit to give the total estimated cost for the unit (base rate x hours).
New South Wales also incorporates a fixed cost component for its calculation.
There is no national standard for hours of delivery for each unit of competency. However,
the approach is similar in most cases. Every jurisdiction except for Western Australia
assumes that the number of hours required to complete a unit of competency is the nominal
hours listed in the relevant Victorian Purchasing Guide (VPG).26 Western Australia uses its
own nominal hours. Although Queensland uses the VPG, it caps hours for cost-setting
purposes at a maximum of 1100 hours.
The different assumptions on hours to deliver units of competency can lead to very different
estimates of course costs.
Based on a comparison of more than 200 courses subsidised in both Western Australia
and Victoria, course hours in Victoria are, on average, about 30 per cent higher than in
Western Australia. An extreme example is the Diploma of Agriculture, which has
1500 course hours under the VPG but only 495 in Western Australia, hence assumed
costs would be about three times higher if the base rates of delivery were the same. (An
analysis of base rates for Western Australia and New South Wales — the only
jurisdictions for which data are available — is below).
The Commission has hours data for a large sample of subsidised courses in Queensland.
About 20 per cent of these courses require more than 1100 hours of training (according
to the VPG), with some requiring as many as 2000 hours. Thus, even if the base rate of
delivery for these courses in Queensland was similar to other jurisdictions that also use
the VPG, the total estimated cost would be lower in Queensland than in those
jurisdictions.
26 The VPG provides information to RTOs on the provision of training packages, including stating the nominal
hours for each unit of competency and the maximum and minimum hours for each training qualification.
These settings are determined by Curriculum Maintenance Managers in Victoria, however the process they
use is unclear (ESC 2011b).
MECHANICS OF VET COURSE FUNDING 139
The methods outlined in steps 2 and 3 recognise that training costs vary by hours of delivery
and field of education/industry, but do not differentiate between cost drivers such as RTO
size or training delivery modes. The impact on service providers from using only a single
cost of training is unclear.
South Australia’s cost estimates are highly disaggregated. Its 44 hourly base rates range from
about $7 to $20 and when assigned to the 356 fields of education, can differ by as little as
five cents per hour. By comparison, Queensland’s approach is coarser and only uses three
rates ($5.23, $7.03 and $9.86), which differ by about $2 and $3.
There is a trade-off between greater precision in cost estimation (which is likely to have
diminishing benefits) and higher levels of administrative complexity. And although data are
not available to assess the relative effectiveness of these more granular costings, the effect
of such small differences in subsidies and student fees is likely to have a small (if any) effect
on student demand.
Step 4 — Total cost of a course
The costs for each unit of competency required to complete a course are summed to provide
an estimated total cost of the course. The number of units of competency can vary
significantly depending on the course. Generally, higher-level courses have more units of
competency than lower level courses, meaning that higher-level courses usually take longer
and are, therefore, more expensive to deliver (box 4.2).
A note on the treatment of public providers
Publicly available information on how costs are estimated for RTOs is not always consistent
with how TAFEs receive funding. Confidential information provided to the Commission
shows that, for example, at least one jurisdiction uses a different cost base for TAFEs and
that these can be more than double the estimated cost base for private RTOs. Using a higher
cost base produces higher subsidies. In addition, TAFEs sometimes receive funding for
delivery in regional areas in block amounts, rather than the stated rates for loadings (these
are discussed below).
Given the need to understand TAFE (plus other) costs in order to set subsidies in future,
there is a need for greater transparency on how TAFE costs are calculated and taken into
account, and the reasons for differences in approach by jurisdictions.
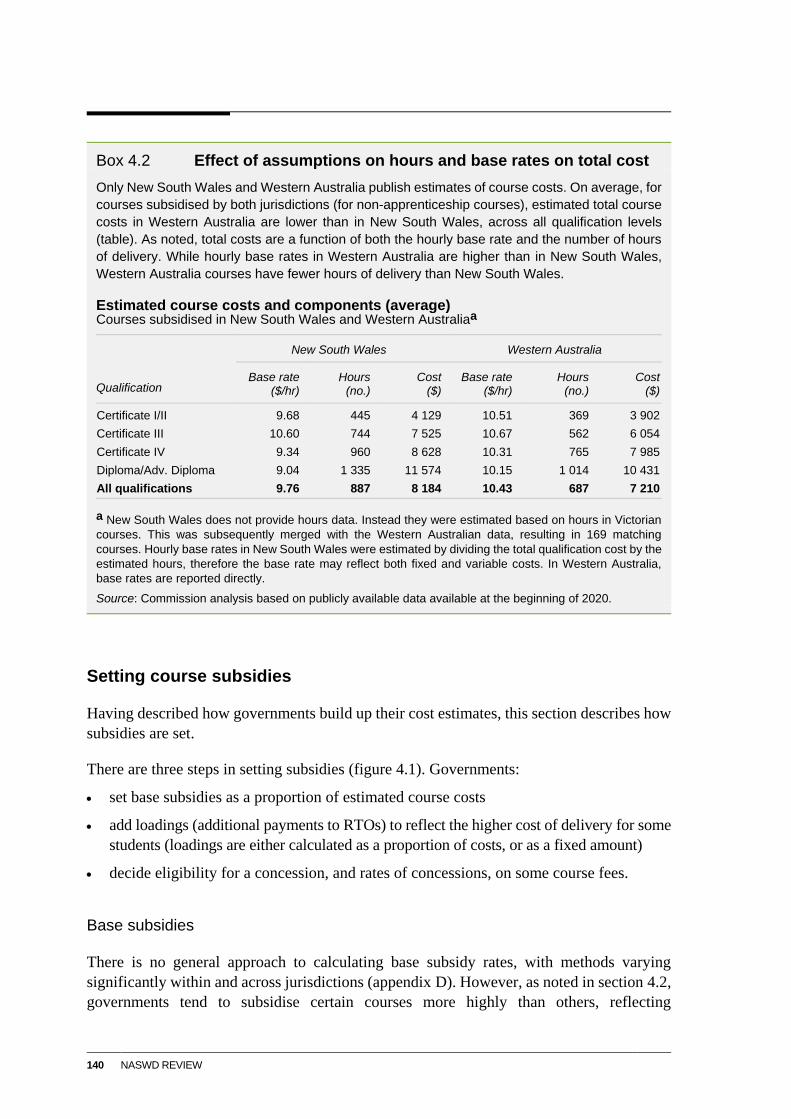
140 NASWD REVIEW
Box 4.2 Effect of assumptions on hours and base rates on total cost
Only New South Wales and Western Australia publish estimates of course costs. On average, for
courses subsidised by both jurisdictions (for non-apprenticeship courses), estimated total course
costs in Western Australia are lower than in New South Wales, across all qualification levels
(table). As noted, total costs are a function of both the hourly base rate and the number of hours
of delivery. While hourly base rates in Western Australia are higher than in New South Wales,
Western Australia courses have fewer hours of delivery than New South Wales.
Estimated course costs and components (average) Courses subsidised in New South Wales and Western Australiaa
New South Wales Western Australia
Qualification Base rate
($/hr) Hours
(no.) Cost
($) Base rate
($/hr) Hours
(no.) Cost
($)
Certificate I/II 9.68 445 4 129 10.51 369 3 902
Certificate III 10.60 744 7 525 10.67 562 6 054
Certificate IV 9.34 960 8 628 10.31 765 7 985
Diploma/Adv. Diploma 9.04 1 335 11 574 10.15 1 014 10 431
All qualifications 9.76 887 8 184 10.43 687 7 210
a New South Wales does not provide hours data. Instead they were estimated based on hours in Victorian
courses. This was subsequently merged with the Western Australian data, resulting in 169 matching
courses. Hourly base rates in New South Wales were estimated by dividing the total qualification cost by the
estimated hours, therefore the base rate may reflect both fixed and variable costs. In Western Australia,
base rates are reported directly.
Source: Commission analysis based on publicly available data available at the beginning of 2020.
Setting course subsidies
Having described how governments build up their cost estimates, this section describes how
subsidies are set.
There are three steps in setting subsidies (figure 4.1). Governments:
set base subsidies as a proportion of estimated course costs
add loadings (additional payments to RTOs) to reflect the higher cost of delivery for some
students (loadings are either calculated as a proportion of costs, or as a fixed amount)
decide eligibility for a concession, and rates of concessions, on some course fees.
Base subsidies
There is no general approach to calculating base subsidy rates, with methods varying
significantly within and across jurisdictions (appendix D). However, as noted in section 4.2,
governments tend to subsidise certain courses more highly than others, reflecting
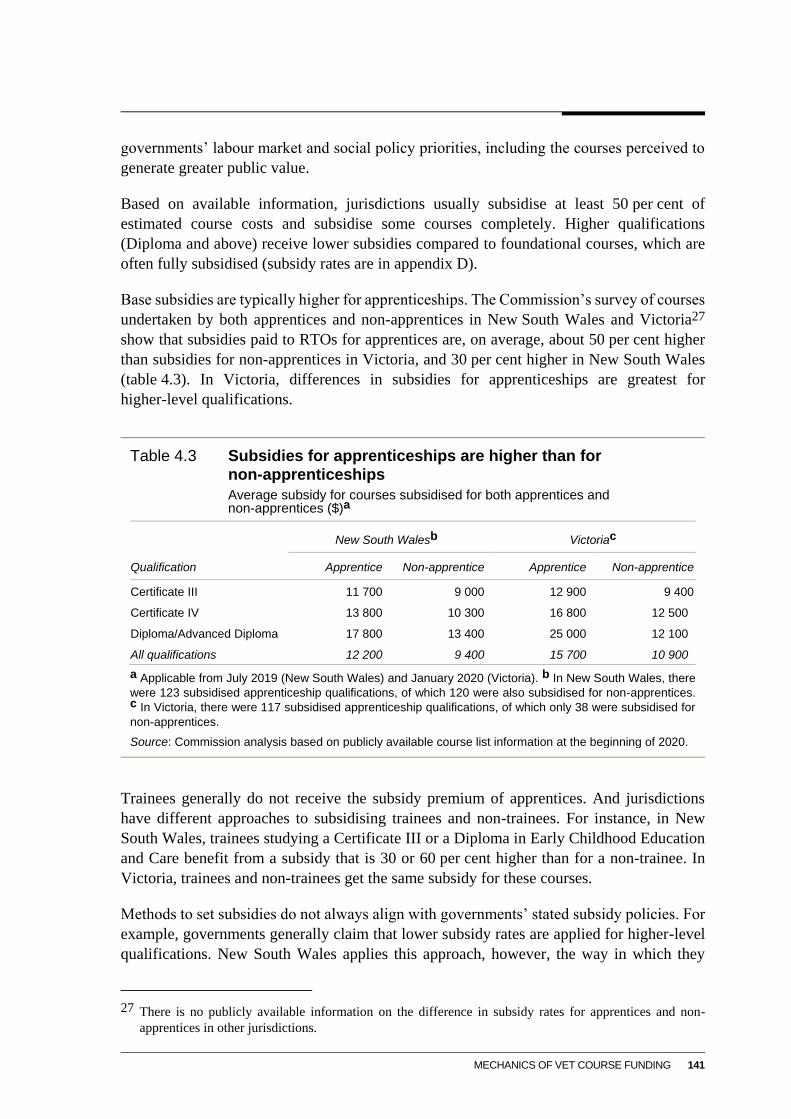
MECHANICS OF VET COURSE FUNDING 141
governments’ labour market and social policy priorities, including the courses perceived to
generate greater public value.
Based on available information, jurisdictions usually subsidise at least 50 per cent of
estimated course costs and subsidise some courses completely. Higher qualifications
(Diploma and above) receive lower subsidies compared to foundational courses, which are
often fully subsidised (subsidy rates are in appendix D).
Base subsidies are typically higher for apprenticeships. The Commission’s survey of courses
undertaken by both apprentices and non-apprentices in New South Wales and Victoria27
show that subsidies paid to RTOs for apprentices are, on average, about 50 per cent higher
than subsidies for non-apprentices in Victoria, and 30 per cent higher in New South Wales
(table 4.3). In Victoria, differences in subsidies for apprenticeships are greatest for
higher-level qualifications.
Table 4.3 Subsidies for apprenticeships are higher than for non-apprenticeships
Average subsidy for courses subsidised for both apprentices and non-apprentices ($)a
New South Walesb Victoriac
Qualification Apprentice Non-apprentice Apprentice Non-apprentice
Certificate III 11 700 9 000 12 900 9 400
Certificate IV 13 800 10 300 16 800 12 500
Diploma/Advanced Diploma 17 800 13 400 25 000 12 100
All qualifications 12 200 9 400 15 700 10 900
a Applicable from July 2019 (New South Wales) and January 2020 (Victoria). b In New South Wales, there
were 123 subsidised apprenticeship qualifications, of which 120 were also subsidised for non-apprentices. c In Victoria, there were 117 subsidised apprenticeship qualifications, of which only 38 were subsidised for
non-apprentices.
Source: Commission analysis based on publicly available course list information at the beginning of 2020.
Trainees generally do not receive the subsidy premium of apprentices. And jurisdictions
have different approaches to subsidising trainees and non-trainees. For instance, in New
South Wales, trainees studying a Certificate III or a Diploma in Early Childhood Education
and Care benefit from a subsidy that is 30 or 60 per cent higher than for a non-trainee. In
Victoria, trainees and non-trainees get the same subsidy for these courses.
Methods to set subsidies do not always align with governments’ stated subsidy policies. For
example, governments generally claim that lower subsidy rates are applied for higher-level
qualifications. New South Wales applies this approach, however, the way in which they
27 There is no publicly available information on the difference in subsidy rates for apprentices and non-
apprentices in other jurisdictions.
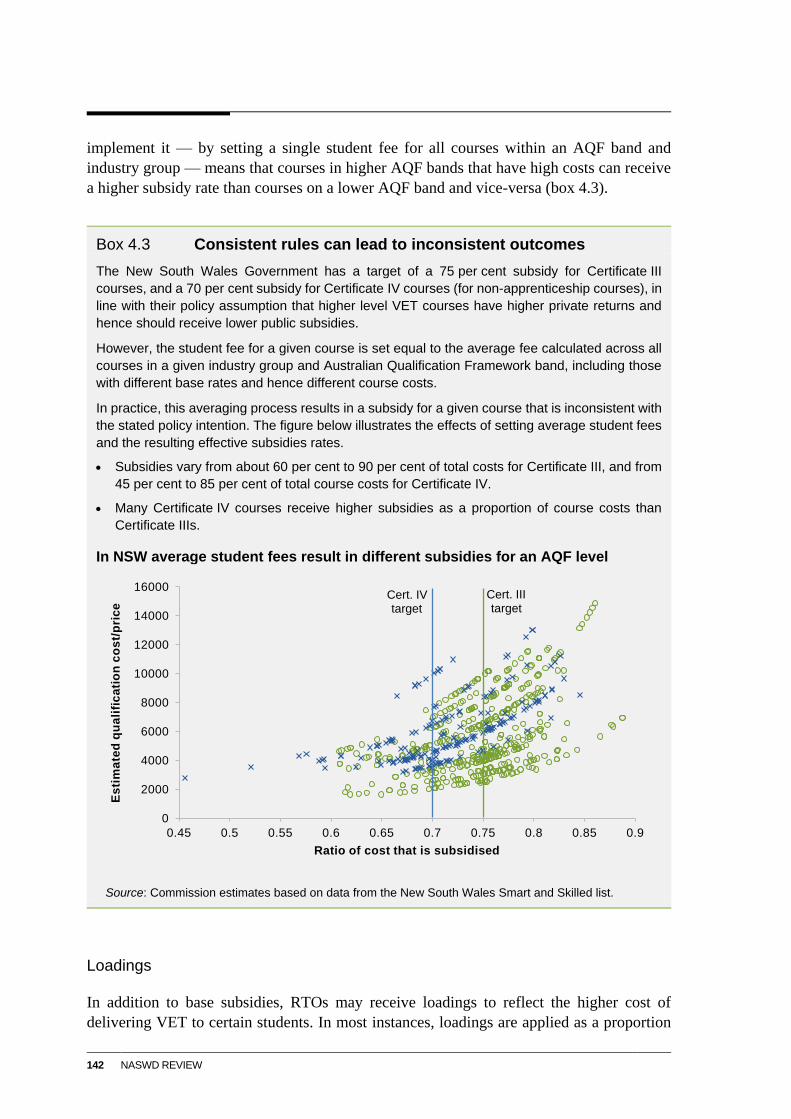
142 NASWD REVIEW
implement it — by setting a single student fee for all courses within an AQF band and
industry group — means that courses in higher AQF bands that have high costs can receive
a higher subsidy rate than courses on a lower AQF band and vice-versa (box 4.3).
Box 4.3 Consistent rules can lead to inconsistent outcomes
The New South Wales Government has a target of a 75 per cent subsidy for Certificate III
courses, and a 70 per cent subsidy for Certificate IV courses (for non-apprenticeship courses), in
line with their policy assumption that higher level VET courses have higher private returns and
hence should receive lower public subsidies.
However, the student fee for a given course is set equal to the average fee calculated across all
courses in a given industry group and Australian Qualification Framework band, including those
with different base rates and hence different course costs.
In practice, this averaging process results in a subsidy for a given course that is inconsistent with
the stated policy intention. The figure below illustrates the effects of setting average student fees
and the resulting effective subsidies rates.
Subsidies vary from about 60 per cent to 90 per cent of total costs for Certificate III, and from
45 per cent to 85 per cent of total course costs for Certificate IV.
Many Certificate IV courses receive higher subsidies as a proportion of course costs than
Certificate IIIs.
In NSW average student fees result in different subsidies for an AQF level
Source: Commission estimates based on data from the New South Wales Smart and Skilled list.
Loadings
In addition to base subsidies, RTOs may receive loadings to reflect the higher cost of
delivering VET to certain students. In most instances, loadings are applied as a proportion
0
2000
4000
6000
8000
10000
12000
14000
16000
0.45 0.5 0.55 0.6 0.65 0.7 0.75 0.8 0.85 0.9
Es
tim
ate
d q
ua
lifi
ca
tio
n c
os
t/p
ric
e
Ratio of cost that is subsidised
Cert. IV target
Cert. III target
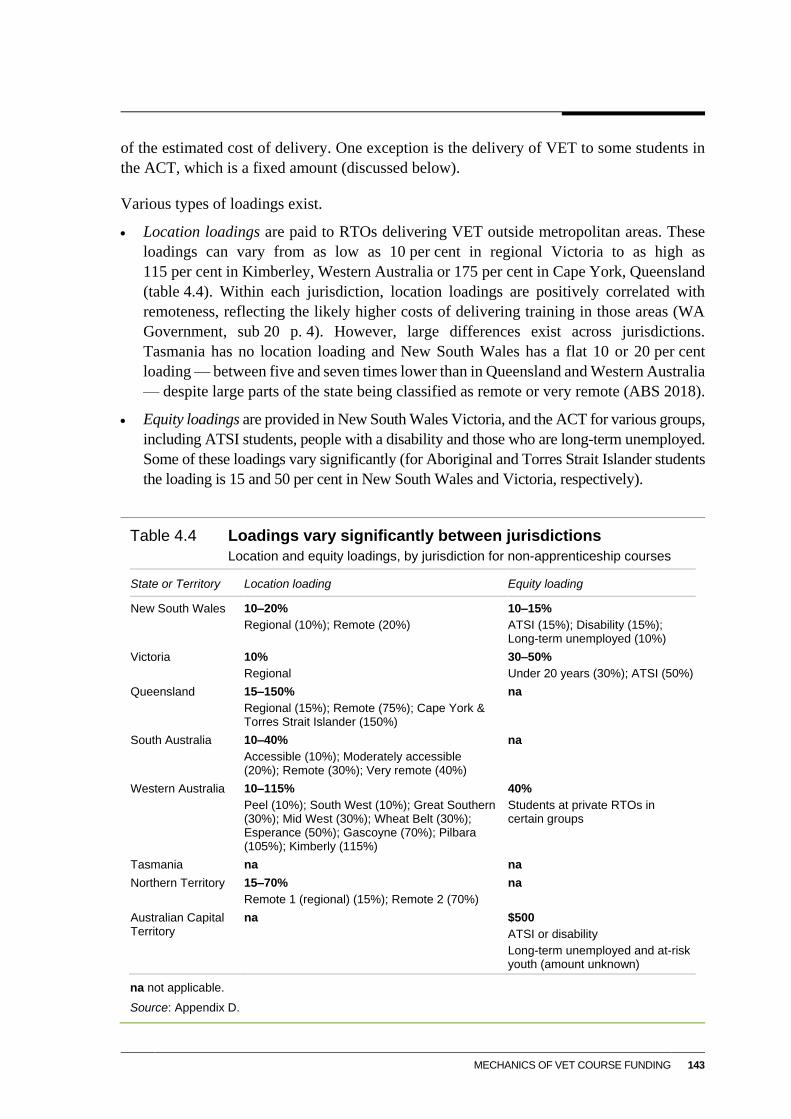
MECHANICS OF VET COURSE FUNDING 143
of the estimated cost of delivery. One exception is the delivery of VET to some students in
the ACT, which is a fixed amount (discussed below).
Various types of loadings exist.
Location loadings are paid to RTOs delivering VET outside metropolitan areas. These
loadings can vary from as low as 10 per cent in regional Victoria to as high as
115 per cent in Kimberley, Western Australia or 175 per cent in Cape York, Queensland
(table 4.4). Within each jurisdiction, location loadings are positively correlated with
remoteness, reflecting the likely higher costs of delivering training in those areas (WA
Government, sub 20 p. 4). However, large differences exist across jurisdictions.
Tasmania has no location loading and New South Wales has a flat 10 or 20 per cent
loading — between five and seven times lower than in Queensland and Western Australia
— despite large parts of the state being classified as remote or very remote (ABS 2018).
Equity loadings are provided in New South Wales Victoria, and the ACT for various groups,
including ATSI students, people with a disability and those who are long-term unemployed.
Some of these loadings vary significantly (for Aboriginal and Torres Strait Islander students
the loading is 15 and 50 per cent in New South Wales and Victoria, respectively).
Table 4.4 Loadings vary significantly between jurisdictions
Location and equity loadings, by jurisdiction for non-apprenticeship courses
State or Territory Location loading Equity loading
New South Wales 10–20%
Regional (10%); Remote (20%)
10–15%
ATSI (15%); Disability (15%); Long-term unemployed (10%)
Victoria 10%
Regional
30–50%
Under 20 years (30%); ATSI (50%)
Queensland 15–150%
Regional (15%); Remote (75%); Cape York & Torres Strait Islander (150%)
na
South Australia 10–40%
Accessible (10%); Moderately accessible (20%); Remote (30%); Very remote (40%)
na
Western Australia 10–115%
Peel (10%); South West (10%); Great Southern (30%); Mid West (30%); Wheat Belt (30%); Esperance (50%); Gascoyne (70%); Pilbara (105%); Kimberly (115%)
40%
Students at private RTOs in certain groups
Tasmania na na
Northern Territory 15–70%
Remote 1 (regional) (15%); Remote 2 (70%)
na
Australian Capital Territory
na $500
ATSI or disability
Long-term unemployed and at-risk youth (amount unknown)
na not applicable.
Source: Appendix D.
144 NASWD REVIEW
The ACT also has a loading for VET in thin markets and for public providers (10 per cent
each) (appendix D).
As loadings are calculated as a percentage of the estimated course cost, the value of the
loading is higher for courses that are more costly to deliver. The advantage of this approach
is its simplicity and not having to be updated often. But it can also lead to large differences
in estimates of training costs, which may or may not be reasonable.
There is no clear rationale for the differences in some loadings (for example, ATSI students
in New South Wales and Victoria) and the basis on which the rates are determined is not
transparent.
Concessions
In addition to subsidy payments to RTOs, eligible students can receive fee concessions for
some courses. Like subsidies, concessions can help address skills needs (by providing
greater incentives for students to undertake training) and improve participation in training
by certain groups of people. Governments’ rationales appear to focus more on the latter.
Eligibility criteria for concessions typically require that a student be either an Aboriginal and
Torres Strait Islander, a person with a disability, or long-term unemployed.
There are few similarities in how jurisdictions determine targets and concessions
(appendix D). For example, New South Wales has a fixed concession fee of $160 for
Certificate II and $240 for Certificate III and IV. Western Australia and South Australia have
fixed per hour concessions, meaning that the nominal discount varies with course hours.
Victoria offers a fixed percentage discount on the total course fee. Some jurisdictions provide
different concessions for apprenticeships. Aboriginal and Torres Strait Islander apprentices
in Queensland are exempt from paying student fees.
Concessions can further change fees for eligible students, which raises questions about the
intended effect of government support. For example, in Queensland, while there is a positive
correlation between base subsidies paid to RTOs and concession subsidies for students
facing disadvantage, different concession rates can change the policy intention of priorities
set out with base subsidies (box 4.4).
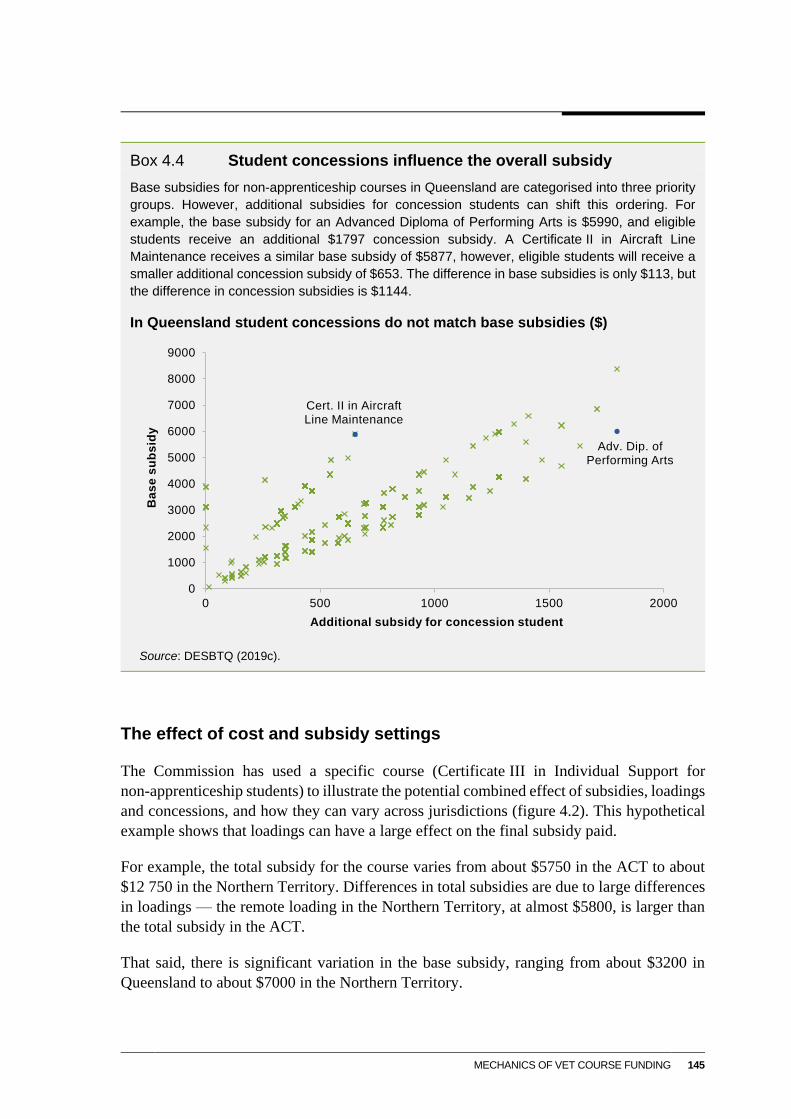
MECHANICS OF VET COURSE FUNDING 145
Box 4.4 Student concessions influence the overall subsidy
Base subsidies for non-apprenticeship courses in Queensland are categorised into three priority
groups. However, additional subsidies for concession students can shift this ordering. For
example, the base subsidy for an Advanced Diploma of Performing Arts is $5990, and eligible
students receive an additional $1797 concession subsidy. A Certificate II in Aircraft Line
Maintenance receives a similar base subsidy of $5877, however, eligible students will receive a
smaller additional concession subsidy of $653. The difference in base subsidies is only $113, but
the difference in concession subsidies is $1144.
In Queensland student concessions do not match base subsidies ($)
Source: DESBTQ (2019c).
The effect of cost and subsidy settings
The Commission has used a specific course (Certificate III in Individual Support for
non-apprenticeship students) to illustrate the potential combined effect of subsidies, loadings
and concessions, and how they can vary across jurisdictions (figure 4.2). This hypothetical
example shows that loadings can have a large effect on the final subsidy paid.
For example, the total subsidy for the course varies from about $5750 in the ACT to about
$12 750 in the Northern Territory. Differences in total subsidies are due to large differences
in loadings — the remote loading in the Northern Territory, at almost $5800, is larger than
the total subsidy in the ACT.
That said, there is significant variation in the base subsidy, ranging from about $3200 in
Queensland to about $7000 in the Northern Territory.
Cert. II in Aircraft Line Maintenance
Adv. Dip. of Performing Arts
0
1000
2000
3000
4000
5000
6000
7000
8000
9000
0 500 1000 1500 2000
Ba
se
su
bs
idy
Additional subsidy for concession student
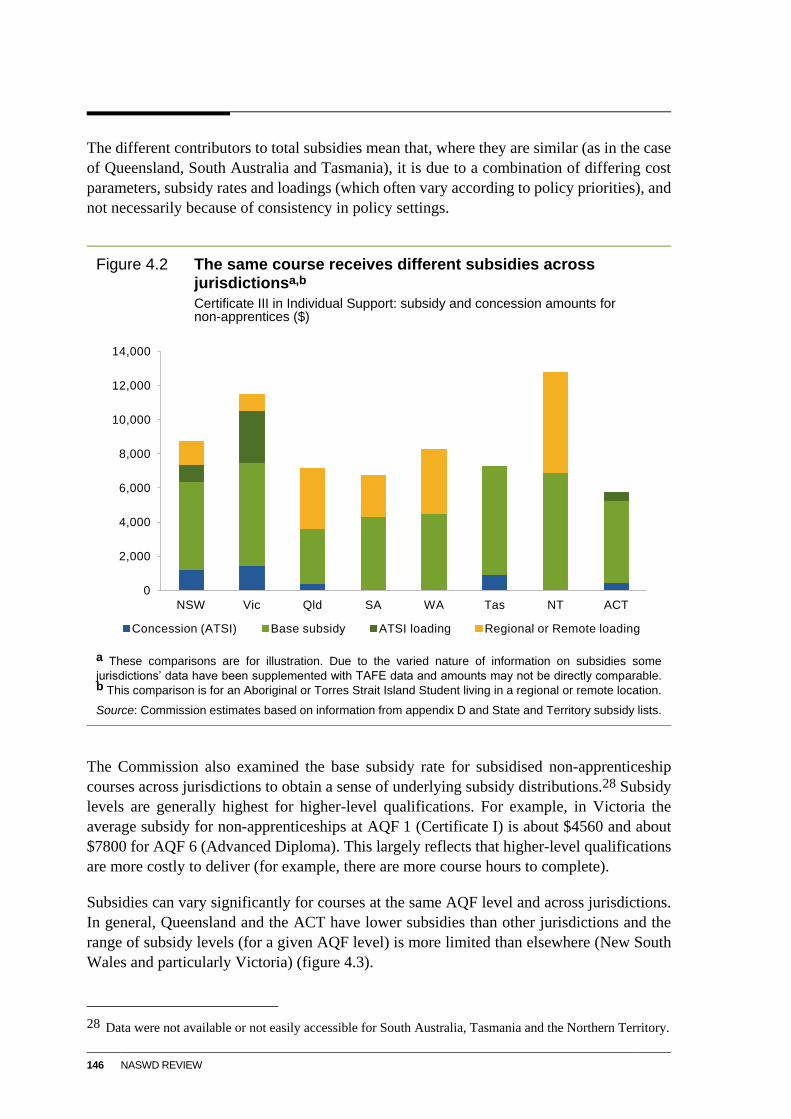
146 NASWD REVIEW
The different contributors to total subsidies mean that, where they are similar (as in the case
of Queensland, South Australia and Tasmania), it is due to a combination of differing cost
parameters, subsidy rates and loadings (which often vary according to policy priorities), and
not necessarily because of consistency in policy settings.
Figure 4.2 The same course receives different subsidies across jurisdictionsa,b
Certificate III in Individual Support: subsidy and concession amounts for non-apprentices ($)
a These comparisons are for illustration. Due to the varied nature of information on subsidies some
jurisdictions’ data have been supplemented with TAFE data and amounts may not be directly comparable. b This comparison is for an Aboriginal or Torres Strait Island Student living in a regional or remote location.
Source: Commission estimates based on information from appendix D and State and Territory subsidy lists.
The Commission also examined the base subsidy rate for subsidised non-apprenticeship
courses across jurisdictions to obtain a sense of underlying subsidy distributions.28 Subsidy
levels are generally highest for higher-level qualifications. For example, in Victoria the
average subsidy for non-apprenticeships at AQF 1 (Certificate I) is about $4560 and about
$7800 for AQF 6 (Advanced Diploma). This largely reflects that higher-level qualifications
are more costly to deliver (for example, there are more course hours to complete).
Subsidies can vary significantly for courses at the same AQF level and across jurisdictions.
In general, Queensland and the ACT have lower subsidies than other jurisdictions and the
range of subsidy levels (for a given AQF level) is more limited than elsewhere (New South
Wales and particularly Victoria) (figure 4.3).
28 Data were not available or not easily accessible for South Australia, Tasmania and the Northern Territory.
0
2,000
4,000
6,000
8,000
10,000
12,000
14,000
NSW Vic Qld SA WA Tas NT ACT
Concession (ATSI) Base subsidy ATSI loading Regional or Remote loading
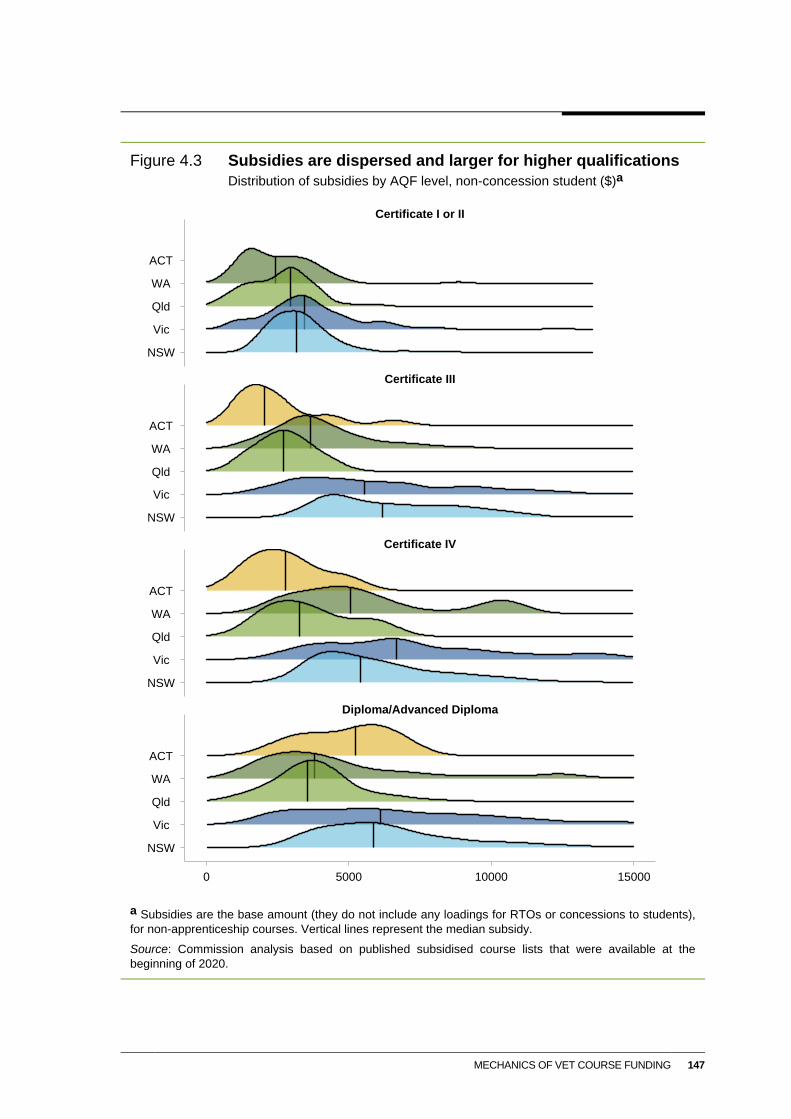
MECHANICS OF VET COURSE FUNDING 147
Figure 4.3 Subsidies are dispersed and larger for higher qualifications
Distribution of subsidies by AQF level, non-concession student ($)a
a Subsidies are the base amount (they do not include any loadings for RTOs or concessions to students),
for non-apprenticeship courses. Vertical lines represent the median subsidy.
Source: Commission analysis based on published subsidised course lists that were available at the
beginning of 2020.
Diploma/Advanced Diploma
Certificate IV
Certificate III
Certificate I or II
0 5000 10000 15000
NSW
Vic
Qld
WA
ACT
NSW
Vic
Qld
WA
ACT
NSW
Vic
Qld
WA
ACT
NSW
Vic
Qld
WA
ACT
148 NASWD REVIEW
4.4 How jurisdictions manage VET course subsidies
Jurisdictions impose controls over subsidised services via conditions in contracts with RTOs,
including rules on allowable course costs and fees, regulation of the quality of services and
course completion milestones. These controls are additional to those imposed by the national
regulatory framework. The additional controls on RTOs only apply in the
government-funded segment of the VET market. RTOs can provide training in the
fee-for-service market without the additional controls imposed through contracts associated
with government subsidies.
Price and fee regulation
While all jurisdictions use contracts to manage risks, New South Wales and Western
Australia more strictly regulate course prices and student fees through contracts with RTOs.
Other jurisdictions tend to allow RTOs more freedom in setting student fees, although
Queensland is an exception as it regulates student fees for apprenticeships and
traineeships.29 The stark difference between New South Wales’ and Western Australia’s and
other jurisdictions’ approaches to regulating course costs and fees highlights the question of
whether stricter controls are necessary.
The Commission lacks essential information to assess the relative merits of the different
approaches. Ordinarily, information on the structure of the market, the behaviour of
participants and outcomes would permit analysis of the relative merits of States’ and
Territories’ approaches. However, there is little readily-available information on: prices and
student fees in less regulated jurisdictions; recent cost data for providers (data are limited to
dated TAFE and user choice data); quality indicators that can support comparisons of service
quality across jurisdictions; and information on the VET fee-for-service market before 2015.
Notwithstanding these information gaps, the Commission has attempted to outline the two
approaches to price and fee regulation.
Jurisdictions that regulate prices and fees more heavily
New South Wales and Western Australia set the prices RTOs must adopt and specify the
fees they can charge in schedules to their contracts.30 Both States require that course prices
be equal to the estimated costs of courses, as calculated via the steps described in section 4.3
and detailed in appendix D.
New South Wales set its subsidies, prices, and student fees in 2015 (based on a 2013 IPART
report). New South Wales has only updated these amounts once (in 2016, to reflect general
29 Queensland regulates student fees for apprenticeships and traineeships to $1.60 for each nominal hour of
training. The rationale for this is unclear.
30 New South Wales applies the same student fees as non-apprenticeship training, however, it applies a
maximum student fee of $2000 for apprenticeship courses.
MECHANICS OF VET COURSE FUNDING 149
price inflation). The 2016 increase only applied to course prices (not student fees), which
means subsidy levels were increased. Western Australia last examined the costs of delivering
training for private RTOs in 2017. It is undertaking a review of TAFE and private providers
costs for its current funding model review.
New South Wales’ and Western Australia’s primary reason for regulating prices is to prevent
RTOs delivering poor quality training. New South Wales has also stated that price controls
are intended to ensure the viability of TAFEs and assist budget management.
Regulating prices to prevent low quality training
New South Wales and Western Australia regulate prices to avoid a ‘race to the bottom’ on
quality (WA Government, sub. 20, p. 7; NSW Government, sub. 48). This position partly
reflects risk aversion in response to corrupt conduct in Victoria after the introduction of its
entitlement scheme and expanded access to student loans (chapter 2).
More generally, the case for price regulation to assure service quality is unclear. While both
states regulate course costs, they largely do not specify, for example, inputs to training that
might address risks to the quality of service delivery. This means that RTOs can reduce costs
and quality and still receive a full subsidy if students complete training — making quality
controls through price regulation ineffective.
Jurisdictions do mitigate the incentive to reduce quality with quality management through
the contracting process (discussed below). Both New South Wales and Western Australia
monitor quality with a range of indicators and tools, including growth in student numbers,
completion rates, student satisfaction, personnel turnover and audit reports.
Supporting TAFEs and budget control
New South Wales regulates prices and student fees to ensure that the public provider remains
‘competitive’ with private providers. The New South Wales Government has stated that one
priority for its Smart and Skilled subsidy program is to ensure TAFE viability. New South Wales
manages its VET market — regulating prices and student fees and guaranteeing TAFEs’ share
of training — to support the public provider (NSW Auditor-General 2015, p. 15).
Another priority of Smart and Skilled is to ensure budget certainty (NSW Government,
sub. 48, p. 13). This is one of the rationales for regulating prices as well as student fees and
placing financial caps on each RTO.
If budget control is a goal, regulating prices seems an unnecessary extra step. Jurisdictions
can control budgets through limits on the aggregate amount of government subsidies. They
could implement this in several ways, including fixing subsidies and capping total student
numbers in the state (not per RTO). They need not fix fees. Deregulation of fees, on the other
hand, would give RTOs greater freedom to act in a more competitive manner, including
investing in improved services and offering temporary discounts to attract students.
150 NASWD REVIEW
Price regulation can weaken RTO incentives to satisfy student needs
As implied above, fixing student fees can stifle competition, inhibit allocative efficiency,
and reduce incentives to improve the quality of training. Public and private RTOs have an
incentive to lower costs — improvements in efficiency that reduce the costs of training result
in higher profits. However, students do not benefit because fixed prices prevent RTOs
converting cost savings into lower student fees (which one would reasonably expect in a
well-functioning market).
Additionally, regulating prices can prevent RTOs from providing high quality training that
costs more to provide than the regulated price and subsidy compensates for. This suppresses
incentives to improve services.
INTERIM FINDING 4.2 — PRICE CONTROLS ARE INEFFICIENT
Fixing student fees can stifle competition, inhibit allocative efficiency and reduce
incentives to improve the quality of training.
There are more direct instruments to address issues of quality management, information
asymmetries and budget control.
Jurisdictions with minimal price and fee regulation
Victoria, Queensland, South Australia, Tasmania, the Northern Territory and the ACT
impose less stringent regulations on student fees and prices. In Victoria and the Northern
Territory, RTOs need not charge a student fee. In Queensland, South Australia and
Tasmania, the only regulation is that RTOs must charge a student fee greater than zero
(except for apprenticeships in Queensland — see footnote 9). In the ACT, RTOs must charge
a minimum fee, which ranges from $100 to $380. Apart from ensuring that students
contribute to the cost of training, this requirement minimises the risk of fraudulent conduct
(for example, paying inducements) as occurred with the VET FEE-HELP scheme.
Price disclosure is poor
In jurisdictions with less regulated fees, RTOs must publish prices for training on their
websites. However, RTOs do not provide pricing information in an accessible way, for
example, by providing information about prices and student fees on their websites. Where
RTOs do provide price information it can be unclear whether the price refers to the full cost,
or the price after a subsidy or concession is applied. This is a problem in all jurisdictions.
The My Skills website publishes course prices for various courses across the country, but
the disclosure of such information is voluntary for RTOs and, in many cases, does not
include information on the student fee for government-subsidised training (chapter 7).
MECHANICS OF VET COURSE FUNDING 151
Low fees could reflect healthy competition — or poor-quality training
There is some evidence that private providers are charging lower student fees than public
providers. For example, analysis of student fees paid (based on 2017-18 student enrolments)
to both private and public providers found that 65 per cent of students training with private
RTOs were charged less than $250 in student fees compared to 12 per cent at public
providers. By comparison, 63 per cent of students at public providers were charged more
than $750, compared to 8 per cent at private RTOs. In some cases, private RTOs were
charging $1 for a course (QLD Auditor-General 2019, p. 50).
Low fees in a deregulated training market could suggest a number of things, good or bad. It
could reflect the market working well and RTOs competing by reducing student fees to low
levels to win more students. On the other hand, it could reflect students selecting providers
with lower student fees when they are uncertain about the quality of providers. The
Commission seeks further information on the cost, prices and quality of deregulated services.
Information asymmetries may dampen price signals and limit competition
Compared to the VET market, there is more information available to prospective higher
education students about the quality of teaching institutions. There are several websites (for
example, Times Higher Education and QS World University Rankings) that rank higher
education institutions on key indicators, including employment outcomes, post-education
salaries, value for money (employment outcomes corrected by price), research output,
teaching quality and reputation. Such a tool could be useful for prospective VET students in
choosing an RTO to train with.
Without easy access to high quality information (for example, about the price, quality and
mode of delivery of different providers), students will not be able to make informed
decisions. Moreover, less information could reduce competition between providers because
students cannot effectively compare offers. These risks are particularly acute in education
markets because students are not frequent purchasers of training over their lives. The
Commission has proposed reforms to improve the relevance and accessibility of information
to students (chapter 6).
Quality regulation through contracts
State and Territory governments impose additional quality regulation on RTOs. This is
typically in the form of formal or informal quality frameworks that outline how jurisdictions
regulate the conduct of RTOs through training contracts. The framework typically includes
eligibility criteria for providing subsidised services, statements of expectations (in some cases
these are outlined in the quality framework) and performance and compliance monitoring.
Eligibility criteria: Jurisdictions have many common eligibility criteria, which may
include registration with the Australian Skills Quality Authority (ASQA), the Victorian
152 NASWD REVIEW
Regulations and Qualifications Authority or the Training Accreditation Council Western
Australia, proof of previous audits, records of contractual compliance and financial and
insurance requirements. Some jurisdictions have eligibility criteria unique to their
jurisdictions. For example, in Queensland RTOs need to provide evidence of employer
and industry linkages in Queensland (DESBT (Qld) 2019b, p. 2).
Statements of expectations: The purpose of these are to outline government expectations
at a high-level of RTO behaviour. While some clauses have measurable outcomes, most
are principles based.
Performance and compliance monitoring: Jurisdictions conduct contract audits and
monitoring, including investigations, assessments and annual reviews. Most State and
Territory departments have a risk-based approach to auditing. This means that they only
audit RTOs that have a high risk of underperforming or non-compliance with a contract.
If any contractual breaches are identified, immediate sanctions can be placed on the
contract, including termination.
A question is the extent to which States and Territories’ requirements in contracts, including
the regulation of RTO conduct, and eligibility and monitoring requirements reflect
deficiencies in national regulation, or risks particular to the provision of subsidised services.
If arrangements seek to compensate for deficiencies in national regulation, it may imply
transient concerns (to the extent that governments have agreed to improve regulation and are
reviewing ASQA). If the goal is to raise the bar on quality regulation, this may imply that
there are some aspects of quality regulation that are best managed by State or Territory
governments (box 4.5).
Box 4.5 Deregistering RTOs — the ultimate sanction
To the extent that deregistering RTOs indicates effectiveness in detecting and sanctioning
non-compliant behaviour, quality regulation by the States and Territories appears to be working.
For example:
the Queensland Government has removed 200 contracted RTOs since the strengthening of
its quality framework in 2016
the Victorian Government has removed 43 contracted providers through the Skills First audit
and review strategy since 2015 (DET (Vic) 2020)
the New South Wales Government has removed 100 RTOs from the Smart and Skilled
program since its introduction in 2015 (NSW Government 2018).
MECHANICS OF VET COURSE FUNDING 153
Subsidy payment arrangements
Governments’ arrangements for paying subsidies to RTOs aim to maximise the number of
course completions. To this end, payments to RTOs occur in one of three ways across
jurisdictions:
at different milestones throughout the course (for example, enrolment or completion) in
New South Wales, Queensland, Western Australia and the ACT
on completion of each unit of competency in South Australia
periodically, based on hours of training completed rather than on milestones in Victoria.
Payment structures of this nature have their flaws, including risking:
large gaps between milestone payments, which could cause cash flow problems for RTOs
RTOs being disadvantaged by milestone payments (at completion) if students drop out
after most of the training is provided
completion milestone payments encouraging RTOs to simply pass students and receive
the subsidy rather than fairly grading them. Quality monitoring will mitigate this risk but
may not completely remove it.
The latter tensions may apply more generally to training quality. RTOs are sometimes paid
up to 100 per cent of the cost of the course to provide training and students often pay a small
or no student fee, thus having limited ‘skin in the game’. In these circumstances, there may
be weak incentives for both parties to act in the public interest — the student obtains a course
at a low cost and the RTO receives a subsidy for limited effort. Policy measures that could
deal with these issues are discussed in chapter 6.
4.5 Conclusions
The primary focus of this chapter was to explain and analyse the approaches to VET course
funding and pricing in each State and Territory and to evaluate the scope for reform.
Information gaps and lack of transparency make it difficult to reach definite conclusions, but
there are good reasons to doubt that the complex, disparate and opaque mix of course
subsidies used is efficient.
154 NASWD REVIEW
INTERIM FINDING 4.3 — JURISDICTIONS’ APPROACHES TO SUBSIDISING COURSES
State and Territory governments share the same goal that subsidies should increase
participation in training, particularly by students facing disadvantage and in skill areas in
short supply or with other public benefits. All take the same key steps in setting subsidies
and managing subsidised services.
However, there is significant variation in policy priorities and the approaches used to
determine which courses receive subsidies, and in overseeing course costs and student
fees. Consequently, subsidies and student fees for the same courses can vary widely
across Australia.
The effects of different settings on the behaviour of students and training providers are
poorly understood.
A primary goal of subsidies is to address skills shortages, but, as discussed in chapter 3, there
are questions about whether subsidies are the best or only instrument for doing so.
Evidence on the administrative arrangements of subsidies suggest they are not strongly
supporting their policy goals, and possibly undermining them. Issues include the
outdated information used to calculate base rates for costs, that different classes of
subsidies can work at cross purposes with each other, and the wide disparities in practice
on methodological matters. Some of these, such as cost estimation, could potentially be
guided by best practice.
Different approaches to funding and pricing subsidies create unnecessary costs and
complexity for RTOs and other parties, as noted in the Joyce Review.
The lack of transparency surrounding subsidy rates, course fees and prices make it
difficult for RTOs, employers and students to make informed decisions.
The same lack of transparency makes it difficult for governments to objectively assess
the performance of policy and programs. This has knock-on effects to students, training
providers and governments’ own abilities to make informed decisions on investment in
training. And lack of exposure of processes and outcomes to scrutiny inevitably
perpetuates costs and inefficiencies.
INTERIM FINDING 4.4 — LACK OF TRANSPARENCY IN SUBSIDY SETTING
There is a general lack of transparency on subsidy-setting processes and the rationales
for subsidies. There is also a lack of transparency on course costs faced by students.
This transparency deficit adversely affects the ability of students and training providers
to make informed decisions on investment in training.
IMPACTS OF SUBSIDIES 155
5 Impacts of subsidies
Key points
Broad entitlement schemes — such as the original Victorian Training Guarantee and South
Australia’s Skills for All program — did not cap student places and allowed students to choose
from a wide range of subsidised courses.
– These schemes produced sharp increases in enrolments.
Other schemes that capped student places and/or limited student choices to courses on
skills/priority lists had much smaller impacts on enrolments.
There is little evidence that employer incentives for trade apprenticeships have been effective
in increasing commencements.
– This is likely to reflect that these incentives typically comprise less than 2 per cent of the
total costs of taking on a trade apprentice.
In contrast, financial incentives initially increased trainee numbers, although this partly
reflected rorting rather than genuine training. As programs were tightened to prevent
misconduct, trainee numbers fell sharply.
Complementary policies providing support and guidance to students helps to match students
to courses that suit their capabilities and increases the likelihood of completing training.
While there are strong rationales for government investment in training (chapter 3), a key
question is whether policies are inducing additional training in the courses identified as
priorities. This chapter concentrates on the two principal investments by governments in skill
formation — the $2.8 billion of course subsidies managed by State and Territory
governments (section 5.1) and the $500 million of the Australian Government’s employer
incentive payments for training apprentices and trainees (section 5.2). The chapter also
considers the effectiveness of student supports, which are intended to lift completion rates
by matching students to courses (section 5.3). These support services complement financial
investments and may sometimes be substitutes for them.
5.1 The impacts of course subsidies
While qualitative evidence indicates that students’ decision-making is swayed by many
factors other than price (like training location, advice from trusted parties, timetables, and
the quality of providers), price is still an important factor (Brown 2017; Guthrie et al. 2014,
p. 50). However, the evidence does not reveal the degree students respond to the changes in
relative fees produced by subsidies. The response to subsidies depends on their magnitude,
the courses and qualifications involved, the types of students eligible for them and any
constraints on their take-up.
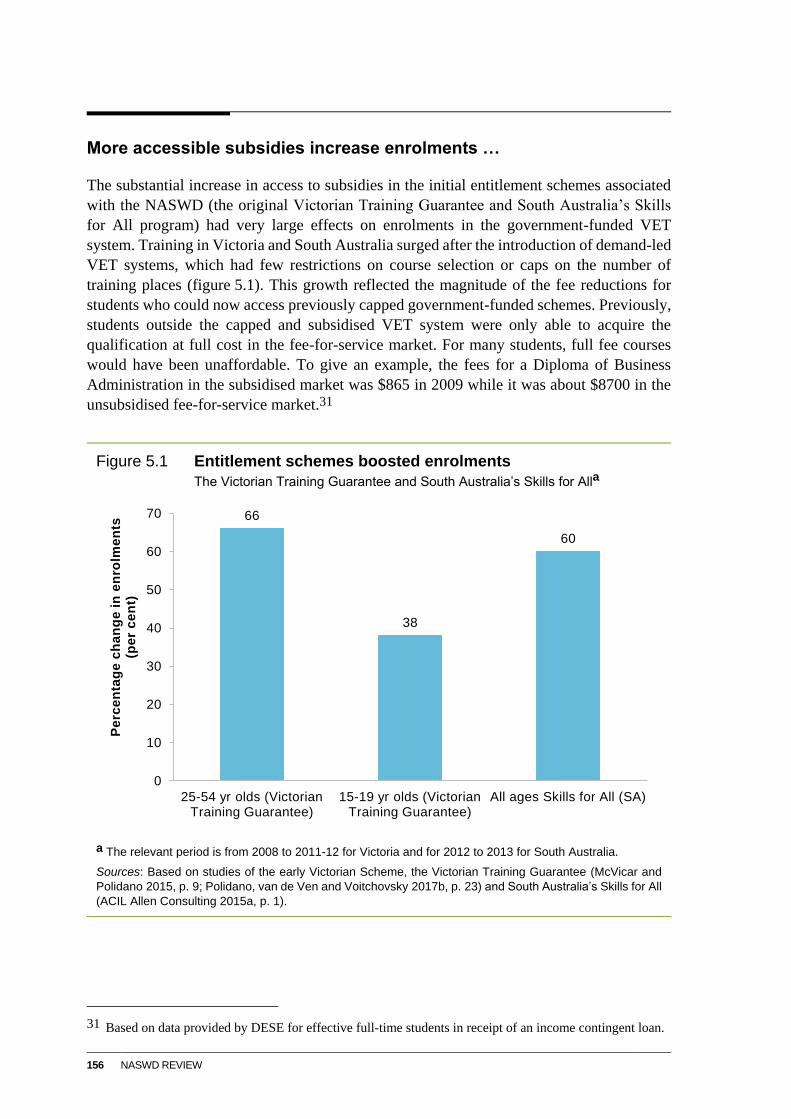
156 NASWD REVIEW
More accessible subsidies increase enrolments …
The substantial increase in access to subsidies in the initial entitlement schemes associated
with the NASWD (the original Victorian Training Guarantee and South Australia’s Skills
for All program) had very large effects on enrolments in the government-funded VET
system. Training in Victoria and South Australia surged after the introduction of demand-led
VET systems, which had few restrictions on course selection or caps on the number of
training places (figure 5.1). This growth reflected the magnitude of the fee reductions for
students who could now access previously capped government-funded schemes. Previously,
students outside the capped and subsidised VET system were only able to acquire the
qualification at full cost in the fee-for-service market. For many students, full fee courses
would have been unaffordable. To give an example, the fees for a Diploma of Business
Administration in the subsidised market was $865 in 2009 while it was about $8700 in the
unsubsidised fee-for-service market.31
Figure 5.1 Entitlement schemes boosted enrolments
The Victorian Training Guarantee and South Australia’s Skills for Alla
a The relevant period is from 2008 to 2011-12 for Victoria and for 2012 to 2013 for South Australia.
Sources: Based on studies of the early Victorian Scheme, the Victorian Training Guarantee (McVicar and
Polidano 2015, p. 9; Polidano, van de Ven and Voitchovsky 2017b, p. 23) and South Australia’s Skills for All
(ACIL Allen Consulting 2015a, p. 1).
31 Based on data provided by DESE for effective full-time students in receipt of an income contingent loan.
66
38
60
0
10
20
30
40
50
60
70
25-54 yr olds (Victorian Training Guarantee)
15-19 yr olds (Victorian Training Guarantee)
All ages Skills for All (SA)
Pe
rce
nta
ge
ch
an
ge
in
en
rolm
en
ts
(pe
r c
en
t)
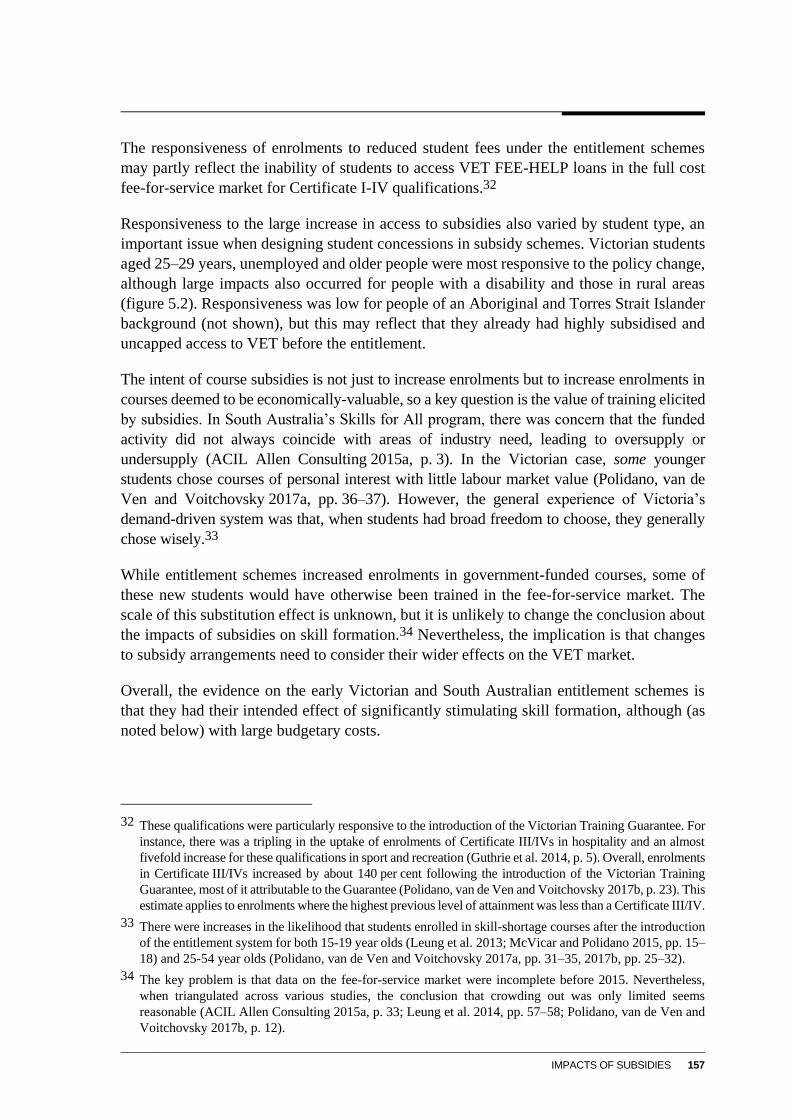
IMPACTS OF SUBSIDIES 157
The responsiveness of enrolments to reduced student fees under the entitlement schemes
may partly reflect the inability of students to access VET FEE-HELP loans in the full cost
fee-for-service market for Certificate I-IV qualifications.32
Responsiveness to the large increase in access to subsidies also varied by student type, an
important issue when designing student concessions in subsidy schemes. Victorian students
aged 25–29 years, unemployed and older people were most responsive to the policy change,
although large impacts also occurred for people with a disability and those in rural areas
(figure 5.2). Responsiveness was low for people of an Aboriginal and Torres Strait Islander
background (not shown), but this may reflect that they already had highly subsidised and
uncapped access to VET before the entitlement.
The intent of course subsidies is not just to increase enrolments but to increase enrolments in
courses deemed to be economically-valuable, so a key question is the value of training elicited
by subsidies. In South Australia’s Skills for All program, there was concern that the funded
activity did not always coincide with areas of industry need, leading to oversupply or
undersupply (ACIL Allen Consulting 2015a, p. 3). In the Victorian case, some younger
students chose courses of personal interest with little labour market value (Polidano, van de
Ven and Voitchovsky 2017a, pp. 36–37). However, the general experience of Victoria’s
demand-driven system was that, when students had broad freedom to choose, they generally
chose wisely.33
While entitlement schemes increased enrolments in government-funded courses, some of
these new students would have otherwise been trained in the fee-for-service market. The
scale of this substitution effect is unknown, but it is unlikely to change the conclusion about
the impacts of subsidies on skill formation.34 Nevertheless, the implication is that changes
to subsidy arrangements need to consider their wider effects on the VET market.
Overall, the evidence on the early Victorian and South Australian entitlement schemes is
that they had their intended effect of significantly stimulating skill formation, although (as
noted below) with large budgetary costs.
32 These qualifications were particularly responsive to the introduction of the Victorian Training Guarantee. For
instance, there was a tripling in the uptake of enrolments of Certificate III/IVs in hospitality and an almost
fivefold increase for these qualifications in sport and recreation (Guthrie et al. 2014, p. 5). Overall, enrolments
in Certificate III/IVs increased by about 140 per cent following the introduction of the Victorian Training
Guarantee, most of it attributable to the Guarantee (Polidano, van de Ven and Voitchovsky 2017b, p. 23). This
estimate applies to enrolments where the highest previous level of attainment was less than a Certificate III/IV.
33 There were increases in the likelihood that students enrolled in skill-shortage courses after the introduction
of the entitlement system for both 15-19 year olds (Leung et al. 2013; McVicar and Polidano 2015, pp. 15–
18) and 25-54 year olds (Polidano, van de Ven and Voitchovsky 2017a, pp. 31–35, 2017b, pp. 25–32).
34 The key problem is that data on the fee-for-service market were incomplete before 2015. Nevertheless,
when triangulated across various studies, the conclusion that crowding out was only limited seems
reasonable (ACIL Allen Consulting 2015a, p. 33; Leung et al. 2014, pp. 57–58; Polidano, van de Ven and
Voitchovsky 2017b, p. 12).
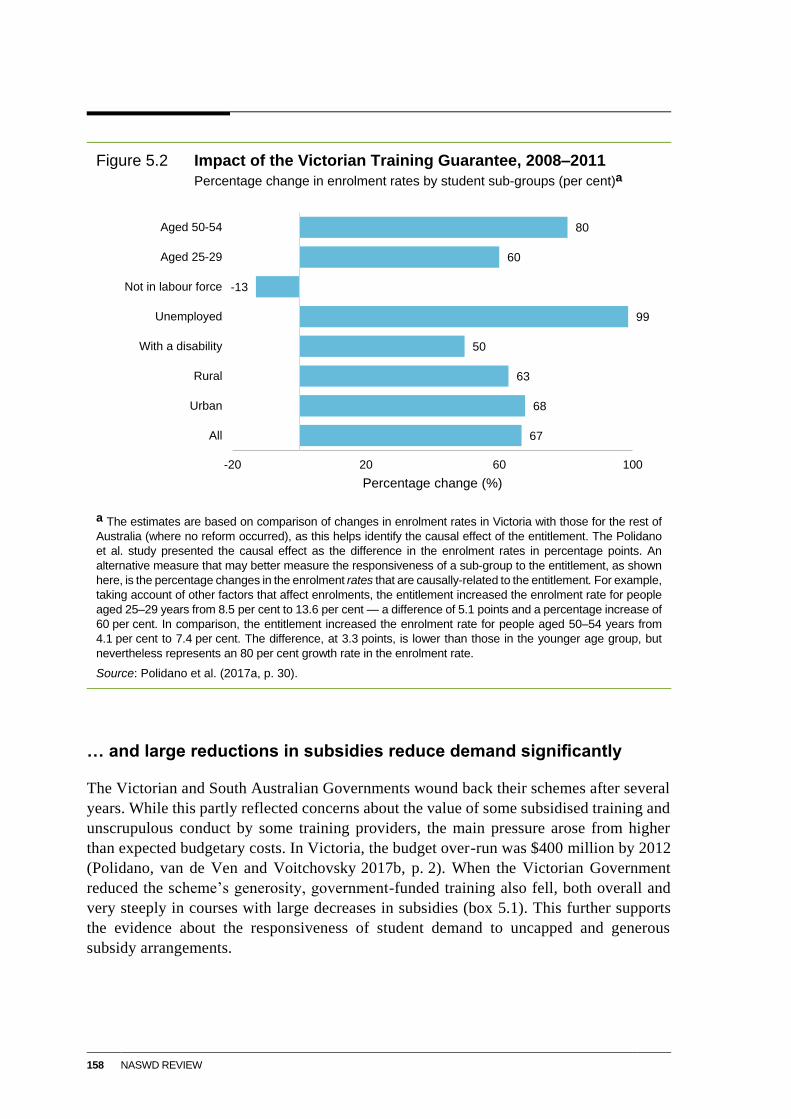
158 NASWD REVIEW
Figure 5.2 Impact of the Victorian Training Guarantee, 2008–2011
Percentage change in enrolment rates by student sub-groups (per cent)a
a The estimates are based on comparison of changes in enrolment rates in Victoria with those for the rest of
Australia (where no reform occurred), as this helps identify the causal effect of the entitlement. The Polidano
et al. study presented the causal effect as the difference in the enrolment rates in percentage points. An
alternative measure that may better measure the responsiveness of a sub-group to the entitlement, as shown
here, is the percentage changes in the enrolment rates that are causally-related to the entitlement. For example,
taking account of other factors that affect enrolments, the entitlement increased the enrolment rate for people
aged 25–29 years from 8.5 per cent to 13.6 per cent — a difference of 5.1 points and a percentage increase of
60 per cent. In comparison, the entitlement increased the enrolment rate for people aged 50–54 years from
4.1 per cent to 7.4 per cent. The difference, at 3.3 points, is lower than those in the younger age group, but
nevertheless represents an 80 per cent growth rate in the enrolment rate.
Source: Polidano et al. (2017a, p. 30).
… and large reductions in subsidies reduce demand significantly
The Victorian and South Australian Governments wound back their schemes after several
years. While this partly reflected concerns about the value of some subsidised training and
unscrupulous conduct by some training providers, the main pressure arose from higher
than expected budgetary costs. In Victoria, the budget over-run was $400 million by 2012
(Polidano, van de Ven and Voitchovsky 2017b, p. 2). When the Victorian Government
reduced the scheme’s generosity, government-funded training also fell, both overall and
very steeply in courses with large decreases in subsidies (box 5.1). This further supports
the evidence about the responsiveness of student demand to uncapped and generous
subsidy arrangements.
67
68
63
50
99
-13
60
80
-20 20 60 100
All
Urban
Rural
With a disability
Unemployed
Not in labour force
Aged 25-29
Aged 50-54
Percentage change (%)
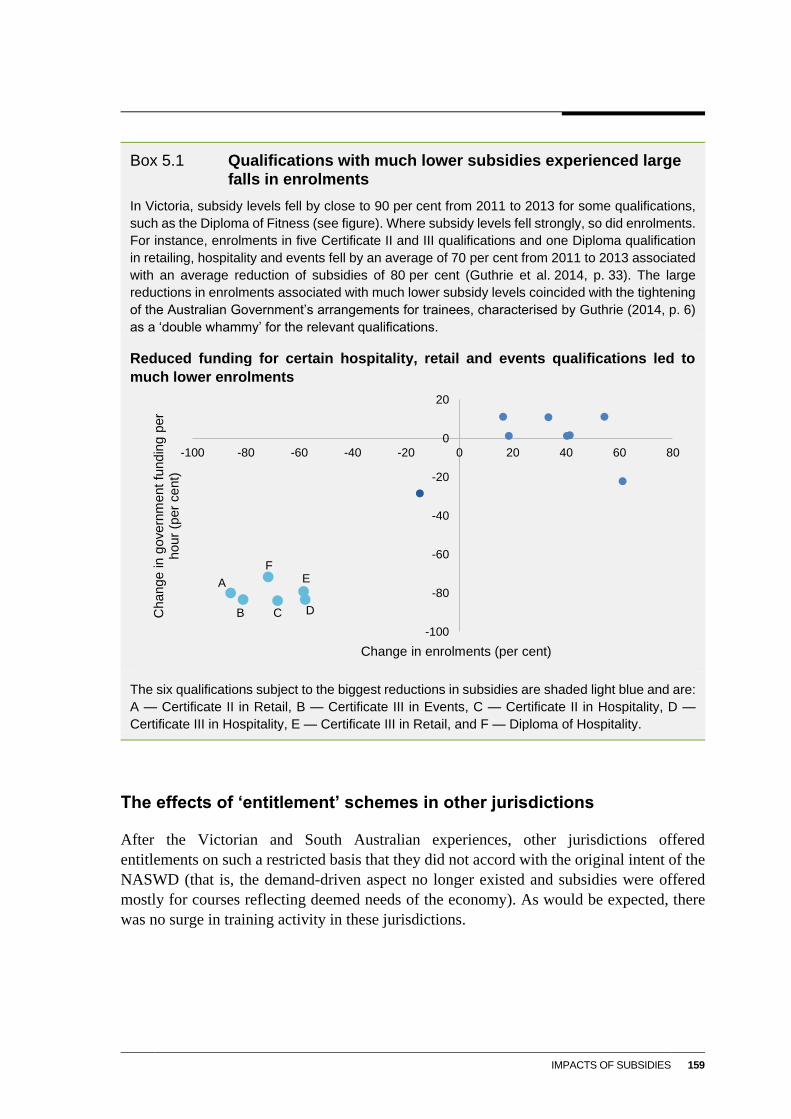
IMPACTS OF SUBSIDIES 159
Box 5.1 Qualifications with much lower subsidies experienced large falls in enrolments
In Victoria, subsidy levels fell by close to 90 per cent from 2011 to 2013 for some qualifications,
such as the Diploma of Fitness (see figure). Where subsidy levels fell strongly, so did enrolments.
For instance, enrolments in five Certificate II and III qualifications and one Diploma qualification
in retailing, hospitality and events fell by an average of 70 per cent from 2011 to 2013 associated
with an average reduction of subsidies of 80 per cent (Guthrie et al. 2014, p. 33). The large
reductions in enrolments associated with much lower subsidy levels coincided with the tightening
of the Australian Government’s arrangements for trainees, characterised by Guthrie (2014, p. 6)
as a ‘double whammy’ for the relevant qualifications.
Reduced funding for certain hospitality, retail and events qualifications led to
much lower enrolments
The six qualifications subject to the biggest reductions in subsidies are shaded light blue and are:
A — Certificate II in Retail, B — Certificate III in Events, C — Certificate II in Hospitality, D —
Certificate III in Hospitality, E — Certificate III in Retail, and F — Diploma of Hospitality.
The effects of ‘entitlement’ schemes in other jurisdictions
After the Victorian and South Australian experiences, other jurisdictions offered
entitlements on such a restricted basis that they did not accord with the original intent of the
NASWD (that is, the demand-driven aspect no longer existed and subsidies were offered
mostly for courses reflecting deemed needs of the economy). As would be expected, there
was no surge in training activity in these jurisdictions.
-100
-80
-60
-40
-20
0
20
-100 -80 -60 -40 -20 0 20 40 60 80
Ch
ang
e in
gove
rnm
ent
fund
ing p
er
hou
r (p
er
ce
nt)
Change in enrolments (per cent)
A
B C
E
D
F
160 NASWD REVIEW
Re-calibrating course subsidy rates in capped systems appear to have
small impacts
Changes in subsidy rates and student fees for already very subsidised courses appear to have
little impact on demand. For example, IPART found that, following a 95 per cent increase
in student fees in New South Wales in 2004, the number of government-funded VET
students fell by only 12 per cent (IPART 2013, p. 189).35 Student fees were low before this
major policy change and remained highly subsidised.
As significant percentage increases in low fees result in only relatively modest increases in
the dollar contributions of students, it is unsurprising that demand hardly changes. If the
dollar increase is low, other factors will be more important to student decision-making.
Recent surveys and studies suggest that study mode, location, duration and delivery type are
at least as important as cost, as is the quality of the training provider, including their
reputation and history of regulatory compliance (Brown 2017; EY Sweeney 2017; Mentally
Friendly 2019).
The implication is that, in the capped, highly-subsidised systems now used by all State and
Territory governments, even sizeable differences in the subsidy rates between courses on
skills/priority lists are unlikely to substantially influence the decisions of students to choose
one course over another. This, along with other considerations, suggests that streamlining of
subsidy rates may be justified (chapter 6).
5.2 Incentives for trade apprentices and trainees —
‘chalk and cheese’
Apprenticeships (trade and non-trade) combine training and paid employment. Apprentices
and trainees work, receive supervised on-the-job training, and undertake formal study with
a registered training organisation (RTO). Governments’ payments to, and tax exemptions
for, employers of apprentices should be seen against the background of minimum wage
setting by the Fair Work Commission for trainees and apprentices, and requirements that
such workers be paid by the employer when undertaking formal off-site training.36
There are multiple avenues for supporting apprenticeships, which has been a priority for
governments in alleviating observed labour market shortages amid ongoing concerns that trade
apprenticeship enrolments and completions have been persistently inadequate (Canavan 2019;
35 IPART cites other empirical analysis finding low responsiveness of student demand to fee increases. A
NATSEM study found that a 10 per cent increase in fees would reduce demand by between 0.1 and
1.7 per cent (IPART 2013, p. 189). An earlier (less credible) study found that a 10 per cent increase in VET
fees would reduce enrolments by 0.6 per cent and decrease student hours of study by 0.8 per cent (Access
Economics 2004, p. iii). All these studies relate to periods when fees were low and remained highly
subsidised after the fee changes.
36 If minimum wages are above the productive value of the employee, then government funding of employers
for training apprenticeships could be re-conceptualised as (at least part) subsidies to employees.
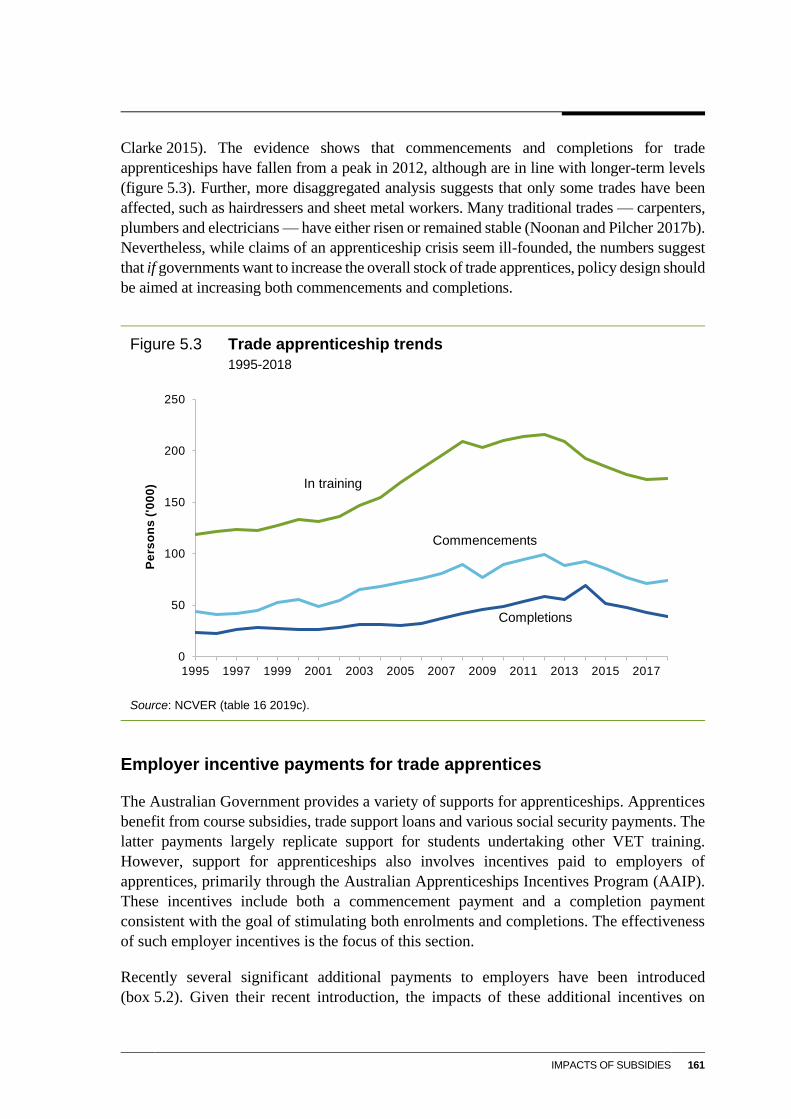
IMPACTS OF SUBSIDIES 161
Clarke 2015). The evidence shows that commencements and completions for trade
apprenticeships have fallen from a peak in 2012, although are in line with longer-term levels
(figure 5.3). Further, more disaggregated analysis suggests that only some trades have been
affected, such as hairdressers and sheet metal workers. Many traditional trades — carpenters,
plumbers and electricians — have either risen or remained stable (Noonan and Pilcher 2017b).
Nevertheless, while claims of an apprenticeship crisis seem ill-founded, the numbers suggest
that if governments want to increase the overall stock of trade apprentices, policy design should
be aimed at increasing both commencements and completions.
Figure 5.3 Trade apprenticeship trends
1995-2018
Source: NCVER (table 16 2019c).
Employer incentive payments for trade apprentices
The Australian Government provides a variety of supports for apprenticeships. Apprentices
benefit from course subsidies, trade support loans and various social security payments. The
latter payments largely replicate support for students undertaking other VET training.
However, support for apprenticeships also involves incentives paid to employers of
apprentices, primarily through the Australian Apprenticeships Incentives Program (AAIP).
These incentives include both a commencement payment and a completion payment
consistent with the goal of stimulating both enrolments and completions. The effectiveness
of such employer incentives is the focus of this section.
Recently several significant additional payments to employers have been introduced
(box 5.2). Given their recent introduction, the impacts of these additional incentives on
0
50
100
150
200
250
1995 1997 1999 2001 2003 2005 2007 2009 2011 2013 2015 2017
Pe
rso
ns
('0
00
)
Commencements
Completions
In training
162 NASWD REVIEW
apprenticeship training is unknown. However, there is reasonable evidence about the
responsiveness of employers to AAIP payments, which is likely to be relevant.
Box 5.2 New employer incentives have been introduced, but it is too early to examine their effects
Among the significant additional payments to employers are the:
Additional Identified Skills Shortage Payment from July 2019, which provides additional
payments to the Australian Apprenticeships Incentives Program of $2000 for commencement
and $2000 for completion, supplemented by payments to apprentices. The payment applies
to 10 broad occupations in short supply
Australian Apprentice Wage Subsidy trial for regional Australia (which offers wage subsidies
between 25 and 75 per cent of the award wage, depending on the year of training)
Supporting Apprentices and Trainees, which is a temporary program introduced during the
COVID-19 pandemic that provides a 50 per cent wage subsidy for apprentices being trained
by small businesses.
Sources: Australian Government (2020c, 2020b) and DESE (2018d).
Employer incentives in the AAIP are relatively modest and are widely seen as having little
effect on decision-making by employers (Deloitte 2012; Karmel and Rice 2011; McDowell et
al. 2011; Nechvoglod, Karmel and Saunders 2009; Pfeifer 2016). One likely reason for this is
that employer incentive payments only cover a small share of the costs of hiring and training
a trade apprentice. The Commission has updated an early study,37 finding that in 2020
employer incentives (which have remained fixed in nominal terms) now account for less than
2 per cent of the full costs of hiring and training a trade apprentice. Moreover, the effective
incentive is less than the notional payment of $4000 as most of the payment (62.5 per cent) is
paid on completion of a training contract with the employer, which occurs in less than half of
all trade apprenticeships (Australian Government 2019a; NCVER 2019b).
The real value of the employer incentive has diminished over time, reflecting inflation and
the smaller group of apprentices eligible for the subsidy. At the beginning of the decade,
employer incentives applied to almost all trade apprentices and trainees but are now limited
to new apprentices and existing workers in occupations on the National Skills Needs List or
enrolled in nursing, aged, disability and childcare. Many employers are no longer eligible
for incentives.
Incentives for employers are intended to reduce the cost of hiring an apprentice. The
effectiveness of these incentives depends on how sensitive employers are to these costs —
in other words, how elastic is employers’ demand for apprentices. The lower the elasticity
of demand for apprentices, the less effective incentives will be. The limited Australian
37 These estimates are based on six case studies of electrical, plumbing and refrigeration apprenticeships
(Nechvoglod, Karmel and Saunders 2009). The methodology has been adopted by other Australian studies
(for example, Dockery et al. 1997, 2001) and has been widely used overseas (Dionisius et al. 2008; Wolter
and Ryan 2010, p. 541).
IMPACTS OF SUBSIDIES 163
evidence suggests that demand elasticities are low (Toner 2003). Overseas studies generally
find similarly small responses to apprenticeship incentives (Brébion 2020; Frontier
Economics 2017) and, for some industries, zero impacts (Westergaard-Nielsen and
Rasmussen 1997).
Beyond the modest value of the incentive, another possible explanation for the low
responsiveness to apprenticeship incentives is that employers have other, stronger motives
to take on apprentices. Employers consistently report that the level of economic activity and
the need for more skilled staff are more important considerations when deciding to engage
an apprentice. Over the past decade, on average less than 5 per cent of employers nominated
financial incentives as a main reason for their decision to hire an apprentice — the lowest of
the ten categories of reasons they could give (figure 5.4).38
As many employers will train apprentices without the need for an incentive, governments
will often provide incentive payments to businesses for training that would have occurred
anyway. The less responsive demand is to incentives, the greater the budgetary cost of
inducing an additional apprentice commencement — a key policy challenge for
governments. For instance, some estimates suggest the budgetary cost per additional
commencement could be between $6500 and $47 000, and between $16 000 and $530 000
per additional completion, depending on the program (Deloitte 2012, p. 50).
Non-trade apprenticeships
In contrast to trade apprenticeships, non-trade apprenticeships (primarily trainees) have been
sensitive to incentives. Traineeships rose sharply from the 1990s to reach a peak of almost
300 000 in 2012 (figure 5.5). However, much of the increase was in industries deemed to be
low priority, such as retailing, and was associated with strategic behaviour. Incentives
amounted to a large proportion of trainee wages (about 20 per cent) and some employers
were designating their existing employees as ‘trainees’ to claim the incentive, rather than
hiring new trainees (NCVER 2011b). In effect, some employers used traineeship incentives
as wage subsidies rather than assisting with training costs (Noonan and Pilcher 2017a). By
2012, existing workers accounted for 44 per cent of all trainee commencements (Noonan
and Pilcher 2017a).
Traineeships were generally not valued by employers beyond the level of the government
subsidy (Noonan and Pilcher 2017a, p. 10). There was little evidence that trainees were
developing skills, becoming more productive and improving their employment prospects as
a result of the traineeship (Karmel, Blomberg and Vnuk 2010; Karmel and Rice 2011;
Muhlemann 2016; NCVER 2011b; Noonan and Pilcher 2017a; OECD 2018; Snell and
Hart 2007). Another concern was that the wage outcomes for trainees in some occupations
were worse than if they had not trained (Nelms et al. 2017).
38 The better question, for our purposes, would have been ‘would you have employed an apprentice without
the incentive?’.
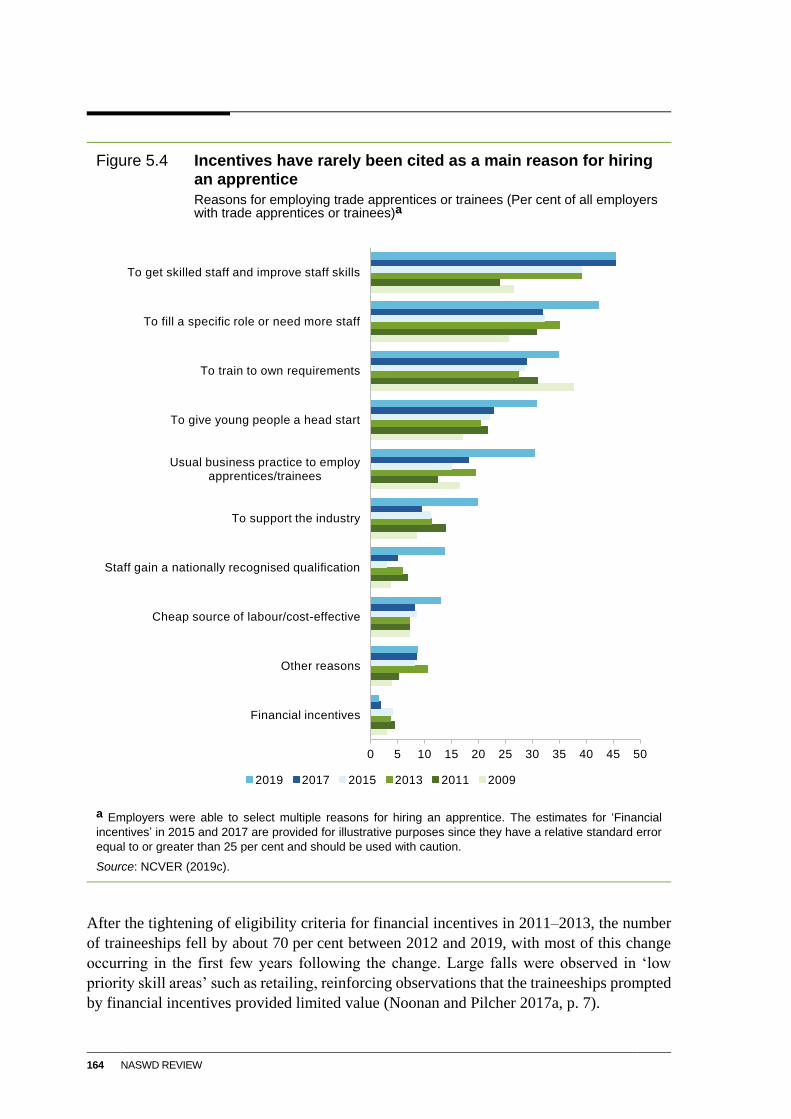
164 NASWD REVIEW
Figure 5.4 Incentives have rarely been cited as a main reason for hiring an apprentice
Reasons for employing trade apprentices or trainees (Per cent of all employers with trade apprentices or trainees)a
a Employers were able to select multiple reasons for hiring an apprentice. The estimates for ‘Financial
incentives’ in 2015 and 2017 are provided for illustrative purposes since they have a relative standard error
equal to or greater than 25 per cent and should be used with caution.
Source: NCVER (2019c).
After the tightening of eligibility criteria for financial incentives in 2011–2013, the number
of traineeships fell by about 70 per cent between 2012 and 2019, with most of this change
occurring in the first few years following the change. Large falls were observed in ‘low
priority skill areas’ such as retailing, reinforcing observations that the traineeships prompted
by financial incentives provided limited value (Noonan and Pilcher 2017a, p. 7).
0 5 10 15 20 25 30 35 40 45 50
Financial incentives
Other reasons
Cheap source of labour/cost-effective
Staff gain a nationally recognised qualification
To support the industry
Usual business practice to employ apprentices/trainees
To give young people a head start
To train to own requirements
To fill a specific role or need more staff
To get skilled staff and improve staff skills
2019 2017 2015 2013 2011 2009
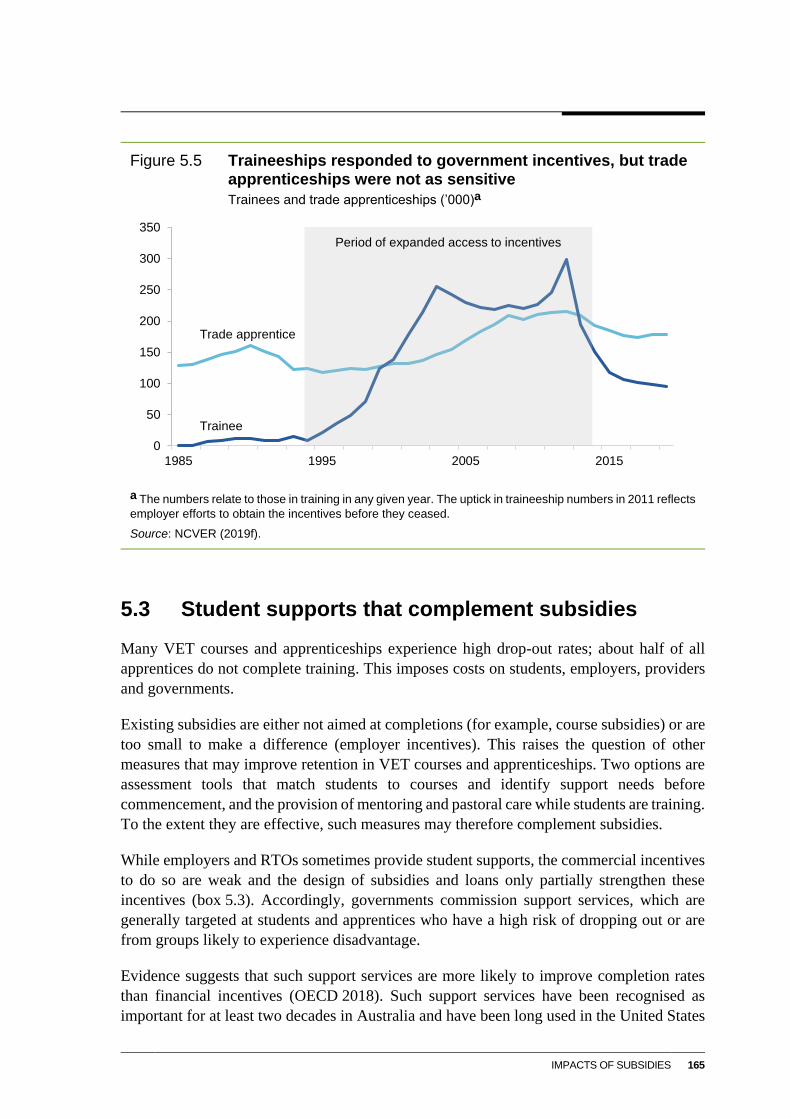
IMPACTS OF SUBSIDIES 165
Figure 5.5 Traineeships responded to government incentives, but trade apprenticeships were not as sensitive
Trainees and trade apprenticeships (’000)a
a The numbers relate to those in training in any given year. The uptick in traineeship numbers in 2011 reflects
employer efforts to obtain the incentives before they ceased.
Source: NCVER (2019f).
5.3 Student supports that complement subsidies
Many VET courses and apprenticeships experience high drop-out rates; about half of all
apprentices do not complete training. This imposes costs on students, employers, providers
and governments.
Existing subsidies are either not aimed at completions (for example, course subsidies) or are
too small to make a difference (employer incentives). This raises the question of other
measures that may improve retention in VET courses and apprenticeships. Two options are
assessment tools that match students to courses and identify support needs before
commencement, and the provision of mentoring and pastoral care while students are training.
To the extent they are effective, such measures may therefore complement subsidies.
While employers and RTOs sometimes provide student supports, the commercial incentives
to do so are weak and the design of subsidies and loans only partially strengthen these
incentives (box 5.3). Accordingly, governments commission support services, which are
generally targeted at students and apprentices who have a high risk of dropping out or are
from groups likely to experience disadvantage.
Evidence suggests that such support services are more likely to improve completion rates
than financial incentives (OECD 2018). Such support services have been recognised as
important for at least two decades in Australia and have been long used in the United States
0
50
100
150
200
250
300
350
1985 1995 2005 2015
Period of expanded access to incentives
Trade apprentice
Trainee
166 NASWD REVIEW
(Bond 1999). The most recent review of the Australian apprenticeship system (the ‘Expert
Panel’) found that mentoring and pastoral care are the most significant support strategies for
boosting completion rates (McDowell et al. 2011). Its importance has also generally been
supported by qualitative evidence (Billett et al. 2015, p. 13).
Box 5.3 RTOs and employers provide supports, but they are not enough
Some RTOs and employers provide high-quality student mentoring and pastoral assistance. For
example, the Victorian Government cited VFA Learning’s Student Wellbeing Assistance Program
as best practice (DET 2017a). The program achieved a 74 per cent completion rate compared to
the 50 per cent norm.
RTOs have some commercial incentives to provide support services without government
assistance. For instance, providing high-quality student support may sometimes be an effective
marketing tool. However, these commercial incentives are blunted given prospective students
often will not have the information to differentiate a high-quality support service from a poor one.
Depending on the occupation and industry, employers have varying incentives to avoid drop-outs
by apprentices, with this depending crucially on whether they benefit from training apprentices
only after completion of the training. The evidence suggests that some employers do not face a
net cost from training apprentices during the training period because of the productive work
undertaken by students (Dockery et al. 1997, 2001). In any case, for many employers, especially
small businesses, the ability to provide supports to apprentices is limited by resource constraints
and expertise, although group trainers less frequently face this problem (O’Dwyer 2019, p. 6).
One avenue through which governments could leave support in the hands of trainers is through
governments’ design of subsidies and student loans as these affect the incentives of RTOs and
employers to provide mentoring and pastoral care. Through regulation, RTOs are unable to
require full student pre-payment for a qualification, while VET student loans can only be provided
in stages (addressing one problem in the design of VET FEE-HELP). Governments could intensify
regulatory or financial incentives for course completion, but this would create perverse incentives
to rate students as competent given that RTOs self-accredit. It could also result in statistical
discrimination, such that whole groups with a higher average probability of not completing a
course would be denied access — a challenge the Commission encountered in developing
options for universities to have ‘skin in the game’ for the outcomes of their students (PC 2017d).
There may be some policy approaches that could mitigate these risks, but it is unlikely that
governments could leave student support and mentoring to the discretion of providers.
The prospects for effective use of incentives to improve apprenticeship completion rates is even
weaker. As discussed in section 5.2, while employers only receive the full Australian Government
incentive payment after completion of apprenticeship training, this is unlikely to be a major driver
of employer behaviour given the modest impact of such payments.
Assessments of government-funded mentoring and pastoral care programs suggest they are
generally effective at raising retention rates for the targeted students and apprentices
(box 5.4). Given their impacts, there is a basis for strengthening the role of such services —
an option floated in chapter 6. The design of any initiatives should take into account the
lessons from recent evaluations of programs.
IMPACTS OF SUBSIDIES 167
Box 5.4 Evaluations have generally shown positive effects
The Australian Government’s Kickstart Mentoring Initiative found that retention rates improved by
an average of 14.6 per cent for mentored apprentices compared to previous years’ retention rates
(Quantum Consulting 2011, p. 55). There was significant variation in the outcomes achieved by
different mentoring service providers, which in part can be attributed to their different approaches,
such as mentors per apprentice and frequency of contact.
Similarly, the Australian Apprenticeship Mentoring program, which supported apprentices in their
first year of training (when the risk of dropping out is greatest), found that the average program
participant had a retention rate of just over 5 percentage points higher than a comparable
apprentice who did not participate in the program (Deloitte 2014, p. 32). The rates varied between
6.4 and 2.6 per cent depending on the service provider.
While based on the perspectives of just one employer group, the MTA found the Industry
Specialist Mentoring for Australian Apprentices Program lifted retention rates to 81 per cent, up
from 40 per cent in 2017, and 6 percentage points higher than the target (MTA Qld 2019).
A long-term study of the effect of mentoring for Indigenous apprentices showed that, after
60 months, completion rates for those with a caseworker were about 55 per cent compared to
rates of about 30 per cent without a caseworker (Trendle 2014, p. 55).
The evaluation of the Australian Apprenticeship Support Network reached equivocal conclusions.
On the one hand, it accepted the importance of support:
Both career-oriented mentoring and also psychosocial mentoring (often referred to as ‘pastoral care’) are
required for apprentices to thrive and to increase retention (DET 2018a, p. 28)
On the other hand, the evaluation was unable to determine the impact of the program on
apprenticeship retention (DET 2018a, pp. 16–18). Each service provider had a target completion
rate, with most meeting or exceeding those targets. However, data inadequacies and the difficulty
of attributing any effects without controlling for other determinants of retention meant the
evaluation could not reach a conclusion about the program’s effectiveness.
There is some evidence from overseas relevant to Australian circumstances. In New Zealand,
which shares many features of the Australian apprenticeship system, a firm-based initiative found
that the apprenticeship turnover rate per year was 12 per cent for the group receiving support
compared to 23 per cent for those without (Johnson 2016, pp. 40, 43–44). Support also
decreased the average duration of apprenticeships.
Student supports are best aimed at the preventable factors precipitating non-completion.
Among other factors, VET students often drop out due to personal reasons or because the
training does not meet their expectations (NCVER 2019l). Similarly, apprentices tend to
withdraw from training due to lack of interest, employment conditions, relationship
breakdowns, health problems, learning difficulties and behavioural problems
(Bednarz 2014; Karmel and Roberts 2012; NCVER 2011b, 2011a; Snell and Hart 2008).
Support services do not need to target all of the risks for non-completion, since sometimes
non-completion is desirable or cannot be addressed successfully through student support. For
example, a student may only wish to complete several units of competency without obtaining
a full qualification — a desirable feature of a flexible VET system. And sometimes businesses
fail. About one quarter of apprentices lost their job during the global financial crisis
168 NASWD REVIEW
(Bednarz 2014, p. 14) — a predictable risk that has prompted the Australian Government to
increase support to employers of apprentices during the COVID-19 pandemic.
Existing programs are highly targeted and small, which provides one rationale for extending
their reach. For instance the Australian Government’s Industry Specialist Mentoring
Program covers less than 10 per cent of trade apprentices and New South Wales’ Way Ahead
for Aboriginal People Program mentored 2–5 per cent of Aboriginal apprentices in New
South Wales in 2007–2010 (National Australian Apprenticeship Association 2017; Tony
Powers and Associates 2011). On that basis, there are grounds to expand their reach
(chapter 6).
Moreover, non-completion affects some groups more than others, particularly people with a
disability, an Aboriginal and Torres Strait Islander background, aged under 20 years and new
workers (O’Dwyer and Korbel 2019, p. 12). This can work against the goals of the course
concessions intended to encourage students from such groups (as described in chapter 4),
highlighting the importance of high-quality tailored support services for such students.
In addition, evaluations of mentoring programs indicate that their detailed design and
organisation can significantly affect their impacts. For instance, student retention is greatest
when there are fewer than 150 mentees per mentor (Quantum Consulting 2011), while short
program and contract duration (less than two years) makes it difficult to attract mentors.
Duplication of Commonwealth and State/Territory programs has also reduced the efficiency
of programs and caused confusion (Deloitte 2014) — a problem addressed in chapter 7.
Upfront assessment of needs
Upfront assessment of needs (UAN) is a filter for entry into VET for students. In South
Australia, the government has developed a tool to assess the ability of a prospective VET
student to successfully complete the qualification (SSA 2019). The tool includes assessment
of the suitability of the participant for the qualification, their literacy and numeracy skills
and their support needs if they commence training. It can trigger referral to contracted
Learner Support Services. Such pre-assessment is intended to increase the likelihood that
students enrol in courses they can complete. By its nature, it is hard to evaluate the UAN,
although it has strong face value. Some indirect evidence suggests the effectiveness of this
approach. The evaluation of the Kickstart Mentoring Initiative found that service providers
achieved higher retention rates for apprentices if their service delivery was guided by formal
risk assessment (Quantum Consulting 2011).
POLICY OPTIONS FOR INVESTMENT IN VET 169
6 Policy options for investment in VET
Key points
There is a clear capacity to better allocate the $6.1 billion in governments’ spending on VET
to improve outcomes.
Any expansion of governments’ funding of the VET system may be best undertaken by
giving more students access to loans rather than increasing subsidies to registered training
organisations (RTOs).
Given the unnecessary and bewildering complexity of course subsidies, there are good
grounds to pursue simplification.
One option is to shrink the excessive number of course subsidies to a single rate or a small
number of subsidy bands. Jurisdictions would still be free to set subsidies and their
distribution among courses and students
Another option — proposed by the Joyce Review — is to introduce binding arrangements
on all governments to apply a nationally consistent set of course subsidies, based on the
efficient cost of delivery, with loadings for the higher cost of providing services to some
locations and students groups.
Governments should use common best practice methods to measure base costs, determine
loadings and identify skill shortages.
There may be scope to use student vouchers instead of subsidy payments to RTOs,
consistent with the broader desirability of centring the VET system on its customers.
The existing VET Student Loans (VSL) program is far more restrictive than its counterpart in
the higher education sector, a legacy of the abuses of its poorly designed and implemented
predecessor, VET FEE-HELP.
Income contingent loans have many advantages compared to subsidies and could make VET
more affordable for many students, without large budgetary costs for governments.
There is a continuum of options for liberalising VSL, including raising loan caps and extending
eligibility to more or all Diplomas or even to selected Certificate level courses.
Liberalisation of VSL could be funded by redirecting subsidies that would otherwise be
passed to RTOs.
Changes to VSL would need to be accompanied by strong measures to prevent rorting,
although the basic framework for achieving that is already largely in place.
Given that incentives to employers to train apprentices appear to have little effect, other
student support options to leverage or substitute for subsidies may be preferable, including
mentoring and pastoral care and the use of industry levies as an alternative funding source.
Community service obligations should be well-defined and transparently funded, and not used
as a pretext for industry support to public providers. Community service obligations should be
subject to market testing and contestability.
The greater potential for online delivery of VET — brought into sharp relief by the COVID-19
pandemic — will require reformulation of policies relating to subsidies, pricing, cost estimation
and accreditation.
170 NASWD REVIEW
The Commission has proposed a set of principles in a new agreement (chapter 2) to guide
vocational education and training (VET) policy towards a more efficient use of resources
and better outcomes for users, driven by the informed choices of students and employers
and, more broadly, a well-functioning training market. Many current policies do not align
well with these principles.
This chapter provides options to improve the funding and pricing of VET courses
(summarised in table 6.1), as requested in the terms of reference.
The current system is heavily weighted towards opaque subsidies to producers, reflecting
the premise that lowering fees will attract students into the training needed to alleviate skill
shortages. The chapter raises options to improve the design and delivery of subsidies and the
scope to use student vouchers instead of subsidy payments to registered training
organisations (RTOs) (section 6.1).
Income contingent loans have many advantages compared to subsidies. The chapter
identifies options to improve user choice and lift participation by making more courses
eligible for VET student loans. Current restrictions by Australian Qualifications Framework
(AQF) level or inclusion on a skill/priority list could be relaxed in many different ways.
Strong risk management safeguards would need to be in place (section 6.2).
There is evidence to suggest that incentive payments to employers of trade apprentices have
little impact on commencements and completions (section 6.3). It may be more effective to
expand support services to improve student retention in apprenticeships and VET courses
(section 6.4).
Public providers’ responsibility for delivering community service obligations (CSOs) is
often cited as a reason to limit the scope of contestability. However, a lack of clarity about
these CSOs and a lack of transparency about the allocation of funds raises the question of
whether uncontested public delivery of services is an efficient or effective way of meeting
customers’ needs (section 6.5).
Everyone involved in VET — students, employers, RTOs, career advisers to name just some
stakeholders — faces challenges navigating Australia’s jumble of subsidies, prices, and cost
determination methods, a task complicated by an acute transparency deficit (section 6.6).
This study is occurring during the massive disruption caused by the COVID-19 pandemic
(chapter 1). In the short-run, this crisis has required large funding changes for RTOs and
apprenticeships, although these are likely to be transitory. However, the pandemic has raised
questions that may have longer-run effects on the VET system that would affect the form of
investment in skill formation, and the types of training eligible for assistance (section 6.7).
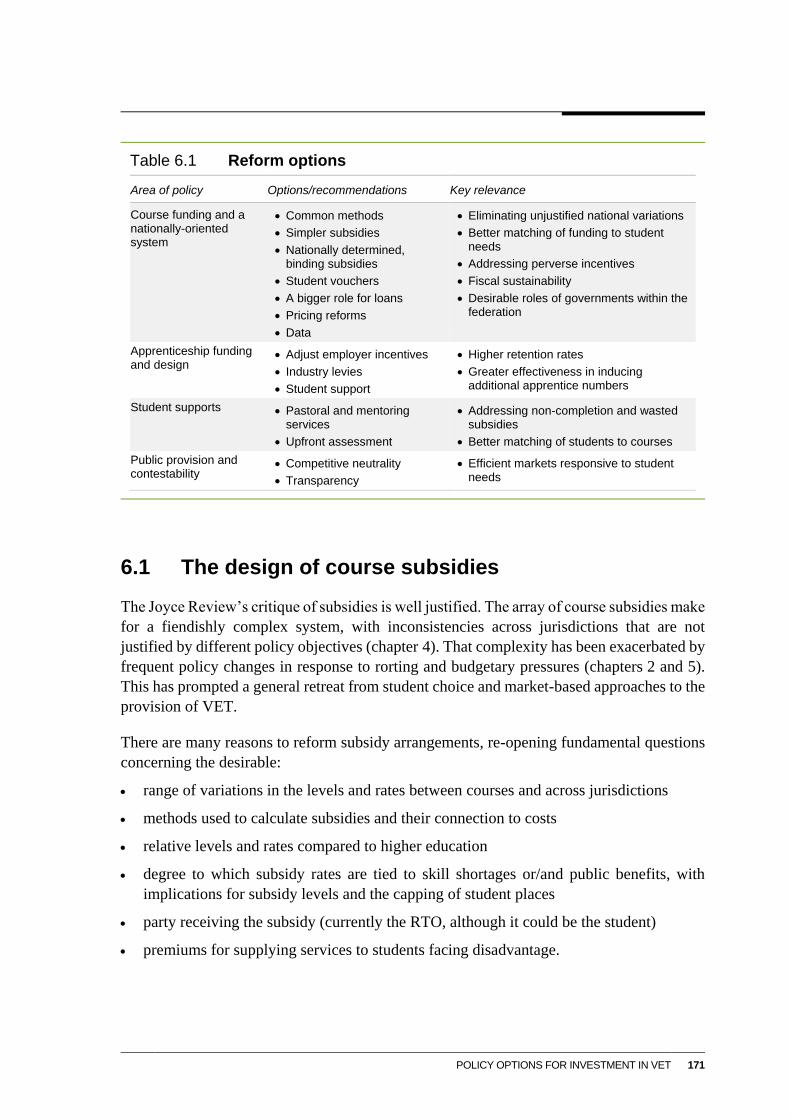
POLICY OPTIONS FOR INVESTMENT IN VET 171
Table 6.1 Reform options
Area of policy Options/recommendations Key relevance
Course funding and a nationally-oriented system
Common methods
Simpler subsidies
Nationally determined, binding subsidies
Student vouchers
A bigger role for loans
Pricing reforms
Data
Eliminating unjustified national variations
Better matching of funding to student needs
Addressing perverse incentives
Fiscal sustainability
Desirable roles of governments within the federation
Apprenticeship funding and design
Adjust employer incentives
Industry levies
Student support
Higher retention rates
Greater effectiveness in inducing additional apprentice numbers
Student supports Pastoral and mentoring services
Upfront assessment
Addressing non-completion and wasted subsidies
Better matching of students to courses
Public provision and contestability
Competitive neutrality
Transparency
Efficient markets responsive to student needs
6.1 The design of course subsidies
The Joyce Review’s critique of subsidies is well justified. The array of course subsidies make
for a fiendishly complex system, with inconsistencies across jurisdictions that are not
justified by different policy objectives (chapter 4). That complexity has been exacerbated by
frequent policy changes in response to rorting and budgetary pressures (chapters 2 and 5).
This has prompted a general retreat from student choice and market-based approaches to the
provision of VET.
There are many reasons to reform subsidy arrangements, re-opening fundamental questions
concerning the desirable:
range of variations in the levels and rates between courses and across jurisdictions
methods used to calculate subsidies and their connection to costs
relative levels and rates compared to higher education
degree to which subsidy rates are tied to skill shortages or/and public benefits, with
implications for subsidy levels and the capping of student places
party receiving the subsidy (currently the RTO, although it could be the student)
premiums for supplying services to students facing disadvantage.
172 NASWD REVIEW
If rigour isn’t possible, simplicity may be better
The bewildering complexity of subsidies reflects their varying goals and the multiple
methods used to derive them. Governments seek to calibrate subsidies to skill shortages and
other economic and social priorities, to which they add multiple loadings for the higher costs
of provision for some students and concessions for students facing disadvantage, all overlaid
by differences across the jurisdictions in methods and priorities (chapter 4). The reasons
given by jurisdictions for differentiating subsidy rates are not necessarily reflected in the
way rates are calculated (box 4.2; chapter 4).
It is unlikely that the complicated process of developing subsidies — which typically leads
to dozens of marginally different rates between courses — truly captures the economic or
social returns from these courses. Conversely, rules of thumb have their own shortcomings.
In both instances, they are exacerbated by data deficiencies. The data used to inform cost
estimates are typically out of date and give too much weight to the cost structures of public
providers, which are not representative of the overall market.
Subsidies for lower-level courses illustrate the analytical dilemmas facing governments.
Such courses typically have high subsidy rates because their lower average private returns
mean students are less likely to undertake them without a subsidy. However, these courses
also have low public economic returns (chapter 3), so requiring a sufficient intangible public
return (such as intergenerational benefits) to be worth a subsidy on cost-benefit grounds.
These benefits cannot be precisely measured and will vary across fields of study, student
groups, and other factors. What this means is that not enough is known to set subsidy rates
in a ‘scientific’ way.
Options for greater national funding consistency
False precision therefore invokes Occam’s razor, suggesting that governments should
consider options for simpler and more consistent treatment of subsidies.
(i) Streamlining subsidies
As finely calibrated subsidy rates are unlikely to sway student choices or reflect real
differences in the public/private returns from different courses, there are strong grounds for
simplifying subsidies.
Simplification could take various forms, including:
(a) a single subsidy rate for all courses on a skill/priority list, set as a constant percentage
of course costs. This approach would not affect relative prices between courses
(b) a flat dollar subsidy for all courses on the skill/priority list. While very simple, this
would mean that students would pay a higher share of the costs for high-cost courses,
POLICY OPTIONS FOR INVESTMENT IN VET 173
which may be seen as inequitable. It could also mean that the subsidy could exceed the
cost of a course. Unless the student was able to pocket the difference, this would
discourage students from seeking value for money
(c) a small set of subsidies whose values would be a share of the average (or efficient) cost
of delivering groups of similar courses.
In each case, State and Territory governments would (in line with the subsidiarity principle)
still decide on the rates for their own jurisdictions and the eligibility criteria for subsidised
courses. Loadings for the higher costs of teaching some groups of students would still apply,
as would concessions.
(ii) National determination of subsidy rates?
As recommended by Joyce, a more significant change would be to apply the approach (c)
above, but using the same subsidy rate for all jurisdictions and with the costs of each group
of courses based on the average national cost of delivery. Loadings would provide additional
funding for the costs of provision in regional Australia and for some groups of students. State
and Territory governments would be bound by these nationally consistent subsidy levels, but
would be free to decide how many subsidised places to offer.
This approach is similar to activity-based funding of hospitals. While Joyce did not specify
the number of groupings of courses, he clearly envisaged a small number, pointing to the
eight categories used in the higher education sector (Joyce 2019, p. 75). Joyce’s
recommendation would have the virtue of simplifying subsidy rates and making their
derivation transparent. In a workably competitive market, it would create strong incentives
for RTOs to minimise costs.
However, national consistency per se is not always a virtue. State and Territory governments
would lose the capacity to vary subsidy rates to meet the needs of their local labour market or
their social policy objectives. Governments would not have the option of changing subsidy
rates (including loadings) or to fund more student places (possibly at lower unit cost).
In addition, different jurisdictions may legitimately have different views about the desired
subsidy rates for students facing disadvantage. Some might give greater prominence to
participation by Aboriginal and Torres Strait Islander Australians, especially if the structure
of their industries suggested that there would be jobs to fill if the training ensued. Others
might legitimately focus on students from low-socioeconomic backgrounds or regional
areas. The subsidy rates might vary by group as might the eligibility criteria, in accordance
with the principle of subsidiarity.
A broader risk posed by steps to improve and mandate national consistency is that policy
errors have Australia-wide ramifications (as in VET FEE-HELP, and poor national
regulatory oversight), whereas mistakes by individual jurisdictions are at least quarantined.
If there are high levels of uncertainty about policy impacts, it may be better to have a
174 NASWD REVIEW
jurisdictional portfolio of policies to learn from. There might, therefore, be scepticism about
the degree to which the Australian Government has the incentives or knowledge to respond
to State and Territory needs.
The Joyce Review (2019, p. 58) rightly pointed to the overly-centralised and bureaucratic
process used to develop and amend qualifications and training packages (a matter discussed
further in chapter 7). There is a risk that centralised subsidy setting might lead to similar
problems.
The decisive issue in assessing the Joyce Review’s option is the degree of desirable State
and Territory autonomy compared to the benefits from national consistency.
Regardless of whether there is a national agreement that binds parties to consistent subsidy
levels, the analytical work by the National Skills Commission on a common national
approach to determine costs (as discussed further below) will be useful to the State and
Territory governments.
OPTION 6.1 — SCOPE FOR MORE NATIONALLY-CONSISTENT COURSE SUBSIDIES
Australian, State and Territory governments should consider:
adopting a nationally consistent set of course subsidies, based on the efficient cost
of delivery for groups of similar courses, with loadings to address higher delivery
costs in some locations and to some student groups (as in the Joyce Review), or
simplifying the large number of different subsidy rates for courses but otherwise
leaving jurisdictions to set their own subsidy rates and their allocation.
INFORMATION REQUEST — SIMPLIFICATION OF SUBSIDY GROUPINGS
In judging the relative merits of alternatives in option 6.1:
how should subsidy groupings be simplified?
what criteria should be used to bundle courses and set subsidy rates?
what are the trade-offs between the greater simplicity of adopting nationally
consistent subsidies and the reduced discretion for jurisdictions?
(iii) Common methods and greater transparency
A minimalist option would be the adoption of common methodologies, underpinned by
greater transparency in information about costs and methods. A common approach to
estimating course costs and setting subsidy rates would help States and Territories adopt
better practice and promote transparency in methods. Any such approach would require
regular updating of cost bases with reference to the market as a whole — a significant
POLICY OPTIONS FOR INVESTMENT IN VET 175
departure from current practice. Common approaches do not mean common outcomes, as
cost-reflective base costs and loadings may vary between jurisdictions. Nor should they
exclude room for improvement, with approaches desirably building in capacity to review
practice and adopt methodological advances. Similarly, there are good grounds for using
consistent methods to determine skills shortages, which are a major determinant of the
eligibility of courses for subsidies. These would still take into account the regional
dimensions of shortages. A prime function of the Australian Government’s National Skills
Commission (due to be formally established in July 2020) will be to develop these more
consistent methods.
Equally, there are grounds to assess whether the various concessions to students in regional
and remote areas, Aboriginal and Torres Strait Islander Australians and lower
socio-economic groups are achieving their goals or can be improved. In this case, there may
be more scope for quantitative analysis of the level and form of concessions that induce the
greatest participation rates for students facing disadvantage. This leaves open the potential
for trials to assess these effects rigorously and to share the results among jurisdictions so that
their choices about concession rates are informed by their likely impacts.
An advantage of this minimalist approach is that it would leave jurisdictions to make their
own policy judgments about subsidy settings and the courses and student groups they wish
to support, while addressing the methodological quirks that lead to unjustified variations.
Regardless of the options (i) and (ii) above that might further achieve national consistency,
governments should use common methodologies and consider consistent approaches to the
determination of skill shortages.
INTERIM RECOMMENDATION 6.1 — COMMON METHODS FOR COSTING
State and Territory governments should use common methods to measure costs and
determine loadings.
OPTION 6.2 — CONSISTENT METHODS FOR ASSESSING SKILLS SHORTAGES
Australian, State and Territory governments could consider adopting consistent
approaches to the determination of skills shortages, while taking account of variations
in local labour markets, with this task undertaken by the National Skills Commission.
Vouchers and capping
State and Territory governments provide subsidies to RTOs. An alternative would be to
allocate the funding to students as a voucher-style entitlement. Vouchers would support user
choice and should make providers more responsive to their customers. The value of the
176 NASWD REVIEW
voucher would be equivalent to some or all of the subsidy that would otherwise have been
provided to RTOs. In its simplest form, the voucher could be a percentage discount on any
chosen course’s costs. In more elaborate versions, it would reflect course costs across a few
groupings of similar courses, as envisaged by Joyce.
In some jurisdictions, like New South Wales, student places for subsidised courses are
capped. Where places are capped, introducing vouchers would be more complex as their
numbers would have to be limited to replicate the outcome of direct rationed funding of
RTOs. Vouchers could be allocated on meeting eligibility criteria (such as some measure of
likely success in the occupation) but would be unlike universally available vouchers.
While capping may be justified because of budget constraints or the desire to limit
enrolments in occupations, caps also raise an equity issue. Capping means that students
studying the same subject could face different net fees, solely depending on whether they
had access to the subsidy before caps were exceeded. The materiality of this issue is unclear,
and, in any case, the same problem already applies to students who must pay full fees if they
fail to secure a capped place.
OPTION 6.3 — SWITCHING FROM SUPPLIER TO CUSTOMER SUBSIDIES
State and Territory governments could consider re-configuring subsidies paid to RTOs
as student vouchers, with the voucher value depending on the method used to calculate
subsidies as specified in option 6.1.
INFORMATION REQUEST — IMPACTS OF VOUCHERS
In judging option 6.3:
how would vouchers be provided for courses with capped places?
what impacts would vouchers have on effective competition?
what are the risks of vouchers?
Pricing regulations can have unintended impacts
Subsidies and pricing are intimately connected as the price of a course (what the RTO is
paid) is equal to the subsidy plus a student fee. There are two key interactions.
First, while large subsidies improve affordability by lowering the student fee, they also may
reduce the incentives of students to choose carefully. The experiences of the demand-driven
schemes in Victoria and South Australia is that some students chose courses with high
personal consumption rather than vocational value (chapter 5). The usual disciplines on a
service provider in a market where customers bear the full costs of purchasing the product
POLICY OPTIONS FOR INVESTMENT IN VET 177
are also weakened. There is also a risk of fraudulent conduct by RTOs (for example, giving
inducements to students to undertake training). In Queensland, South Australia, Tasmania
and the ACT, RTOs must charge a (modest) minimum student fee so that students have ‘skin
in the game’. On face value, minimum fees seem a sensible approach to counter the perverse
incentives associated with high subsidy rates.
Second, in a well-functioning VET market, high subsidies would be reflected in lower student
fees as competing RTOs bid down any margin between the two. Different jurisdictions have
different levels of comfort about whether markets would deliver subsidy-reflective student
fees. New South Wales and Western Australia regulate most heavily by fixing student fees for
all qualifications (allowing neither lower nor higher fees). In that case, the payment to the RTO
— the ‘price’ of the service — is entirely regulated as the subsidy level is also set. (Queensland
sets some student fees, but only for apprenticeship courses.)
However, beyond a requirement to have a minimum student fee, regulated prices and student
fees can have perverse impacts because they reduce the ability of RTOs to differentiate based
on quality and mode of delivery. For example, price regulations do not prevent RTOs from
reducing quality, but can prevent RTOs from delivering higher-quality training at a higher
price or delivering high-quality courses at lower than capped prices, as is the case in
New South Wales.
Consequently, there are good grounds for the New South Wales and Western Australian
Governments to remove price controls (as should the Queensland Government for
apprenticeship courses). The risks of excessive student fees would be mitigated through the
provision of information to students and possibly some initial price monitoring.
INTERIM RECOMMENDATION 6.2 — PRICE CONTROLS SHOULD BE REMOVED
Governments should not cap the prices of VET courses.
6.2 An increased role for loans?
Course subsidies have overly elaborate designs, do not apply for many courses, have only
partial effectiveness in changing students’ course choices, and involve large government
outlays. By contrast, income contingent loans have promising features that suggest they
could play — when robustly designed and with effective integrity safeguards — a larger role
in government funding of the VET system:
loans address the difficulty many students face in paying upfront for VET (upfront
payments are still required for many courses)
loans directly target the market failure that credit is not available for uncertain investment
in human capital
students receive a signal that training is a long-term investment
178 NASWD REVIEW
the contingent nature of loans means they do not have adverse equity effects if training
does not deliver its expected dividends
the long-term fiscal costs of loans should be less than subsidies
loans give students a portable entitlement that promotes user choice
clearly disclosed loans require ‘skin in the game’ from students who will have stronger
incentives to choose efficient, lower-priced RTOs and to choose suitable qualifications
and courses
loans allow students to choose based on their preferences and on the likely benefits of
courses and careers.
These intrinsic advantages have been obscured by the widespread rorting of
VET FEE-HELP, but these failures were a symptom of poor policy design and
implementation, rather than a failure in the concept.
INTERIM FINDING 6.1 — WELL-DESIGNED VET STUDENT LOANS IMPROVE AFFORDABILITY
Poor design, rather than poor policy justification, was the source of the rorting of
VET FEE-HELP. A well-designed VET student loan scheme can improve affordability
and access to VET courses with few fiscal risks to government.
Lessons learnt from VET FEE-HELP
In considering the potential for wider use of VET Student Loans (VSL), it is critical to take
into account the lessons from the VET FEE-HELP program failure. The VET FEE-HELP
scheme (2012–2016) was very similar to the income contingent loan (ICL) scheme available
in higher education, but the characteristics of the students, the market and the regulator were
quite different.
The key flaws of VET FEE-HELP have been deeply scrutinised (ANAO 2017; Saccaro
and Wright 2018; Toner 2018). Most relate to poor and tardy monitoring of the conduct of
RTOs (and particularly their marketing and pricing strategies), unresponsive regulation,
little auditing of the training provided and its value, and design features that gave weak
incentives for student diligence (no upfront fees) or the genuine supply of training (an RTO
could get the entire loan funding on student commencement). These problems were
accentuated by the absence of the information and consumer protections that underpin
informed student choice. In effect, almost all of the essential prerequisites for a
well-functioning competitive market were missing.
VSL addressed many of the deficiencies in VET FEE-HELP. Stricter compliance and
reporting measures were introduced for VSL providers and have proven effective in
preventing provider misconduct (ANAO 2019; KPMG 2019). Loan brokers were banned.
And the financial incentives for misconduct have been alleviated by requirements that loan
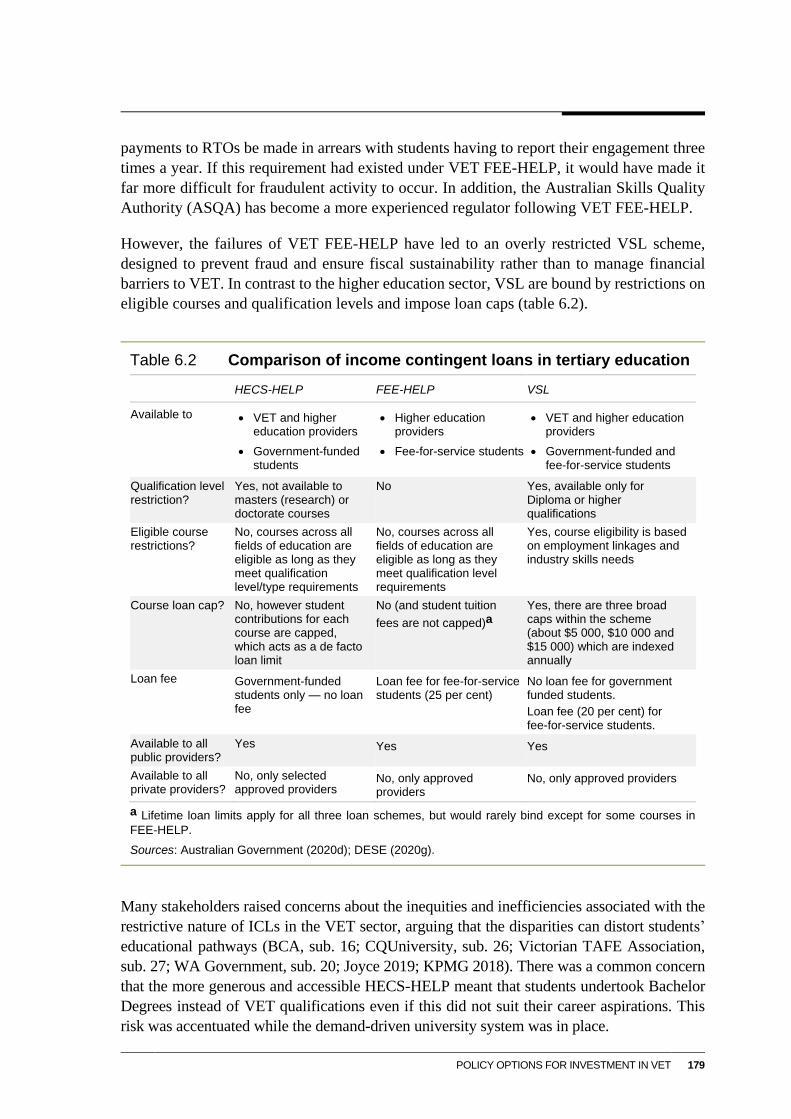
POLICY OPTIONS FOR INVESTMENT IN VET 179
payments to RTOs be made in arrears with students having to report their engagement three
times a year. If this requirement had existed under VET FEE-HELP, it would have made it
far more difficult for fraudulent activity to occur. In addition, the Australian Skills Quality
Authority (ASQA) has become a more experienced regulator following VET FEE-HELP.
However, the failures of VET FEE-HELP have led to an overly restricted VSL scheme,
designed to prevent fraud and ensure fiscal sustainability rather than to manage financial
barriers to VET. In contrast to the higher education sector, VSL are bound by restrictions on
eligible courses and qualification levels and impose loan caps (table 6.2).
Table 6.2 Comparison of income contingent loans in tertiary education
HECS-HELP FEE-HELP VSL
Available to VET and higher education providers
Government-funded students
Higher education providers
Fee-for-service students
VET and higher education providers
Government-funded and fee-for-service students
Qualification level restriction?
Yes, not available to masters (research) or doctorate courses
No Yes, available only for Diploma or higher qualifications
Eligible course restrictions?
No, courses across all fields of education are eligible as long as they meet qualification level/type requirements
No, courses across all fields of education are eligible as long as they meet qualification level requirements
Yes, course eligibility is based on employment linkages and industry skills needs
Course loan cap? No, however student contributions for each course are capped, which acts as a de facto loan limit
No (and student tuition
fees are not capped)a
Yes, there are three broad caps within the scheme (about $5 000, $10 000 and $15 000) which are indexed annually
Loan fee Government-funded students only — no loan fee
Loan fee for fee-for-service students (25 per cent)
No loan fee for government funded students.
Loan fee (20 per cent) for fee-for-service students.
Available to all public providers?
Yes Yes Yes
Available to all private providers?
No, only selected approved providers
No, only approved providers
No, only approved providers
a Lifetime loan limits apply for all three loan schemes, but would rarely bind except for some courses in
FEE-HELP.
Sources: Australian Government (2020d); DESE (2020g).
Many stakeholders raised concerns about the inequities and inefficiencies associated with the
restrictive nature of ICLs in the VET sector, arguing that the disparities can distort students’
educational pathways (BCA, sub. 16; CQUniversity, sub. 26; Victorian TAFE Association,
sub. 27; WA Government, sub. 20; Joyce 2019; KPMG 2018). There was a common concern
that the more generous and accessible HECS-HELP meant that students undertook Bachelor
Degrees instead of VET qualifications even if this did not suit their career aspirations. This
risk was accentuated while the demand-driven university system was in place.
180 NASWD REVIEW
Four aspects of the VSL scheme design have been highlighted as problematic, and are
therefore the basis for the reform options proposed by the Commission. These are the
administrative and reporting burden for providers of VSL, restrictions on eligible courses,
strict boundaries on the qualification level for which students can access an ICL, and the
caps on the amounts that can be borrowed for each course.
Reform options for VSL
Administrative and reporting burden on providers could be reduced
Regardless of more significant reform directions for VSL, simpler and more streamlined
administrative and compliance arrangements are warranted. Compliance and administration
requirements for VSL providers are not sufficiently targeted, increasing administrative
burdens on low-risk providers (ANAO 2019, p. 57), with some exiting the scheme or
declining to participate (KPMG 2019). RTOs approved by State and Territory governments
for subsidies may not be approved by the Australian Government for loans (Joyce 2019,
p. 71). There may be scope to align approvals and to ease burdens for RTOs with a proven
record of ethical conduct and the delivery of high-quality training. This would expand the
choice for students and give RTOs an additional incentive to perform. These steps would not
weaken other arrangements that justifiably seek to reduce risks.
Courses eligible for ICLs might be expanded
The VSL program’s significant restrictions on eligible courses appears arbitrary and lack a
clear rationale, which suggests the scope for ending them. A course is only eligible for VSL
if it is subsidised by at least two States and Territories, or is a science, technology,
engineering or mathematics (STEM) course, or is tied to licensing requirements for a
particular occupation (DET 2017b). There is limited flexibility to go outside these criteria.
TAFEs, universities and other government training organisations can apply to the Australian
Government to have their course added to the eligibility list on a case-by-case basis, but must
demonstrate strong evidence of employer support and employment outcomes (DET 2017b).
Yet the problem that VSL is intended to overcome are the difficulties in accessing upfront
funding, which applies to courses regardless of whether they fit the above criteria.
The consequence is that about one third of the total number of accredited courses at the
Diploma or higher level are ineligible for VSL. Analysis of enrolment data for 2018 also
showed that about 45 per cent of students in Diploma or above qualifications did not access
a subsidy or VSL.39 (It is not clear how many students were eligible for a loan but chose not
to access one, but it is likely that some students did not access a loan because their
qualification was employer funded.) Accordingly, changes to the current eligibility
requirements would overcome a significant impediment to the demand for higher-level VET
39 Commission estimates based on NCVER enrolment data and VSL unpublished data.
POLICY OPTIONS FOR INVESTMENT IN VET 181
qualifications (NSW Government, sub. 48; SA Government, sub. 11; Victorian TAFE
Association, sub. 27).
ICLs could be made available for lower-level qualifications
The current restriction that the VSL program is only available to students studying some
Diploma or higher-level qualifications could be relaxed to extend ICLs to lower-level
qualifications, particularly Certificates III and IV.40 Students face fees of thousands of
dollars for many of these Certificates as indicated by the examples given in tables E.3 and
E.4 in appendix E.
Such qualifications are very important to skill formation. Certificate III/IVs account for a
significant share of subsidised courses, with preliminary figures indicating that they
accounted for 62 per cent of program completions in 2018 (NCVER 2019a, table 12).
Employers and licensing regulations often require at least Certificate III level qualifications
as a precursor to employment (Adult Learning Australia, sub. 12, p. 15; Charles Darwin
University, sub. 44, p. 4; WA Government, sub. 20, p. 9). Occupations projected to be in
highest demand to 2023 (such as child care workers, and aged and disabled carers) require
or benefit from the completion of (at least) a Certificate III qualification (JobOutlook 2020).
Average student fees for Certificate I/II qualifications are typically much lower than
higher-level Certificates, reducing the impediments to training posed by upfront fees. The
average wages of those acquiring such qualifications are also lower, so that the likelihood of
hitting the threshold for repayment of loans is also smaller, with budgetary risks for
governments. Concessions for groups of students facing disadvantage may be a reasonable
alternative.
Some limits on borrowing for each course may be justified, but the limits may be
too low
While a loan cap may be an effective measure to counter the risk of misconduct by, and lack
of competition between, RTOs, their levels may not be justified. The settings for loan caps
must balance two major considerations.
On the one hand, they may help underpin an efficient market by:
putting downward pressure on fees and reducing students’ long-term loan liabilities
(DET 2017b) avoiding the problems in VET FEE-HELP, where loan amounts could be
massive.41 The basis for limiting risks through caps is accentuated by the dominance of
40 A view also put by several stakeholders (Charles Darwin University, sub. 44; JCFC Consulting, sub. 3;
Dawkins, Hurley and Noonan 2019; Fowler 2019a)
41 The Joyce Review and the ANAO audit of VSL found that the use of loan caps in VSL led to a reduction
in fees from the high levels under VET FEE-HELP (ANAO 2019; Joyce 2019). A survey of providers
undertaken during a recent evaluation of VSL, however, revealed that the reduction in average course fees
182 NASWD REVIEW
small privately-owned RTOs whose financial incentives may not be aligned with student
interests unless there is sufficiently rigorous regulatory oversight and where —
New South Wales and Western Australia aside — they are permitted to set student
contributions at any level. In contrast, in higher education, the majority of students are
enrolled in undergraduate and postgraduate courses with a limited number of
government-funded public providers,42 and where the student contribution of their
tuition fees is capped
requiring that a student may have to pay some share of their tuition fees upfront
overcomes the problem, present in VET FEE-HELP, that a course may appear to be
‘free’, and encourage students to make careful qualification choices.
On the other hand, the lower the loan cap, the more it undermines the purpose of loans to
provide finance for students finding student fees unaffordable, especially for students who
might have to train in the fee-for-service market and who are disadvantaged (appendix E).
Further, it could divert students to other VET courses that are cheaper or to higher education,
where loans are available. Neither may suit their capabilities or career aspirations. Equally,
it may have adverse consequences for the VET market, and indirectly students, by affecting
the quality and type of courses they offer (akin to the problems posed by price regulation)
and discouraging RTOs from applying to offer VSL (as noted by KPMG 2019).
Given the other measures now in place that can address misconduct and excessive pricing,
an option is to raise what appear to be excessively stringent caps. Such an option could still
require a student to pay something upfront.
How far to go?
A reform agenda for VSL could choose any combination of the above possible changes to
the current framework. Table 6.3 presents one such spectrum. A conservative option would
be to relax course restrictions, which would make all Diplomas/Advanced Diplomas eligible
for loans, increasing access to loans and reducing students’ upfront costs. A further step
would be to widen eligibility to students studying Certificate III/IVs. The most far-reaching
initiative would be to allow access to VSL for all students in nationally recognised training
programs. In that instance, the quid pro quo for the Australian Government’s exposure to
greater loan liabilities would be its withdrawal from (or reduction in its) funding through its
agreement with State and Territory governments.
Moreover, any expansion of governments’ funding of the VET system may be best
undertaken through a greater re-orientation to loans rather than more subsidies.
under VSL was likely to have been driven by the exit of unscrupulous providers (many of which charged
inflated fees), instead of reductions in course fees by the RTOs that remained in the market (KPMG 2019,
p. 24).
42 In general, public universities are not permitted to enrol domestic undergraduate students on a full-fee basis,
however they face no rules for domestic post-graduate students (DET 2015). FEE-HELP students made up
12 per cent of enrolled students receiving HELP loans for domestic higher education course expenses in
2017 (Universities Australia 2019, p. 16).
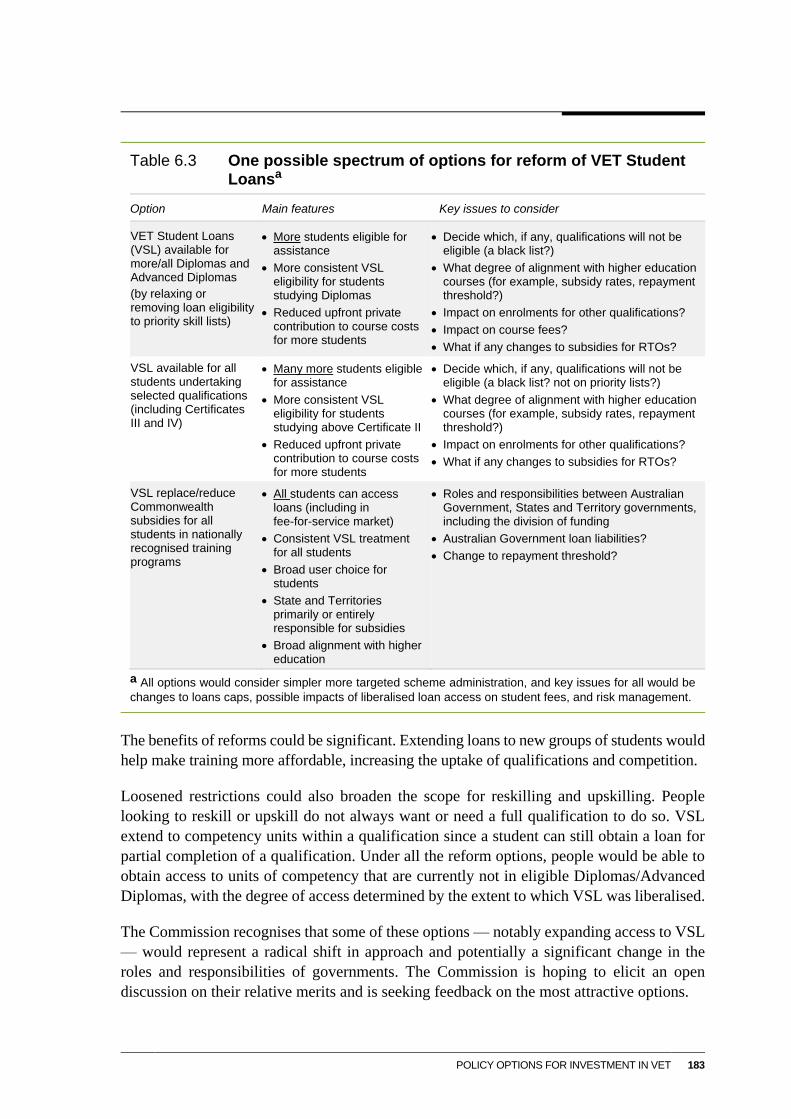
POLICY OPTIONS FOR INVESTMENT IN VET 183
Table 6.3 One possible spectrum of options for reform of VET Student Loansa
Option Main features Key issues to consider
VET Student Loans (VSL) available for more/all Diplomas and Advanced Diplomas
(by relaxing or removing loan eligibility to priority skill lists)
More students eligible for assistance
More consistent VSL eligibility for students studying Diplomas
Reduced upfront private contribution to course costs for more students
Decide which, if any, qualifications will not be eligible (a black list?)
What degree of alignment with higher education courses (for example, subsidy rates, repayment threshold?)
Impact on enrolments for other qualifications?
Impact on course fees?
What if any changes to subsidies for RTOs?
VSL available for all students undertaking selected qualifications (including Certificates III and IV)
Many more students eligible for assistance
More consistent VSL eligibility for students studying above Certificate II
Reduced upfront private contribution to course costs for more students
Decide which, if any, qualifications will not be eligible (a black list? not on priority lists?)
What degree of alignment with higher education courses (for example, subsidy rates, repayment threshold?)
Impact on enrolments for other qualifications?
What if any changes to subsidies for RTOs?
VSL replace/reduce Commonwealth subsidies for all students in nationally recognised training programs
All students can access loans (including in fee-for-service market)
Consistent VSL treatment for all students
Broad user choice for students
State and Territories primarily or entirely responsible for subsidies
Broad alignment with higher education
Roles and responsibilities between Australian Government, States and Territory governments, including the division of funding
Australian Government loan liabilities?
Change to repayment threshold?
a All options would consider simpler more targeted scheme administration, and key issues for all would be
changes to loans caps, possible impacts of liberalised loan access on student fees, and risk management.
The benefits of reforms could be significant. Extending loans to new groups of students would
help make training more affordable, increasing the uptake of qualifications and competition.
Loosened restrictions could also broaden the scope for reskilling and upskilling. People
looking to reskill or upskill do not always want or need a full qualification to do so. VSL
extend to competency units within a qualification since a student can still obtain a loan for
partial completion of a qualification. Under all the reform options, people would be able to
obtain access to units of competency that are currently not in eligible Diplomas/Advanced
Diplomas, with the degree of access determined by the extent to which VSL was liberalised.
The Commission recognises that some of these options — notably expanding access to VSL
— would represent a radical shift in approach and potentially a significant change in the
roles and responsibilities of governments. The Commission is hoping to elicit an open
discussion on their relative merits and is seeking feedback on the most attractive options.
184 NASWD REVIEW
Risk management
A challenge in redesigning VSL is the shadow cast by the scarring experiences of the
widespread rorting of VET FEE-HELP, with its costly impacts on thousands of students,
governments and the reputation of the entire sector.
Accordingly, any expansion of loans in the VET sector would have to be accompanied by
effective regulation of course quality and market conduct of RTOs, and accessible and
relevant information on courses for students (as discussed in chapter 7). Data analytics to
detect problematic trends in the uptake of courses may also mitigate risks.
An expansion of loan availability will also increase fiscal risks given their income contingent
nature. The requirement that State and Territory governments must bear 50 per cent of the
risk of non-payment of loans addresses any cost shifting between States and Territories and
the Commonwealth for the subsidised part of the market. No such risk sharing arrangement
applies to fee-for-service students, although the requirement that they pay a loan fee of
20 per cent of the loan amount creates incentives for such students to only study courses they
expect to produce good returns. Fiscal risks could be further reduced by re-considering the
threshold for re-payment to limit unrecovered loans, especially if restrictions are relaxed to
include qualifications where expected earnings are below the current threshold, which may
often occur for the lowest-level qualifications.
As floated in previous Commission analysis of ICLs in the higher education sector, there are
grounds for collecting unpaid debts from deceased estates, which would bring such loans
into line with the treatment of other public and private debts (PC 2017e, p. 69).
To the extent that the Australian Government was concerned to further moderate risks, it could
include some course restrictions where the risks were deemed highest. For example, the
Business Council of Australia and the Ai Group (2016) recommends a ‘black list’ approach
(that is, the Government would nominate ineligible course loans), leaving remaining courses
eligible for loans. Similarly, the Australian Government could set a transition path to a less
restrictive system, testing risk as caps and course restrictions are lifted.
POLICY OPTIONS FOR INVESTMENT IN VET 185
OPTION 6.4 — A LARGER ROLE FOR INCOME CONTINGENT LOANS
Income contingent loans have significant advantages. Governments should consider
making VET Student Loans available for a wider range of qualifications. Current
restrictions — by AQF level or inclusion on a skill/priority list — could be relaxed to
support greater user choice and participation, as could loan caps.
The degree to which restrictions should be relaxed should be based on risks, costs and
administrative complexity.
Widening access to loans should largely maintain the existing strong regulations that
reduce risks associated with loans, but could also include the adoption of a ‘black list’
that identifies courses ineligible for loan support, setting a transition path to a
less-restrictive system, testing risk as caps and course restrictions are lifted, and
reducing the income thresholds for loan repayment.
INFORMATION REQUEST — IMPLEMENTING AN EXPANDED LOANS SCHEME
If VET Student Loans (VSL) were expanded in line with option 6.4:
to what degree and where should restrictions on the VSL scheme be eased?
what would be the costs and benefits (to governments and students) of:
– removing course list restrictions?
– expanding the VSL scheme to Certificate-level qualifications?
– re-orienting the role of the Australian Government from a direct funder of the VET
system to an issuer of income contingent loans to all students in nationally
recognised training programs?
– changing the loan caps?
what would be the appropriate roles and responsibilities of Australian, State and
Territory governments in the VET system if the prime responsibility of the Australian
Government was to extend VSL rather than provide subsidies?
which parts of the VSL administration and reporting requirements are most
burdensome?
what aspects of a system architecture and settings may need to be in place to reduce
risks, assure quality and support the operation of a well-functioning market, including
consideration of ‘black lists’, repayment thresholds, and recovery of unpaid debt from
deceased estates?
186 NASWD REVIEW
6.3 Government supports for trade apprenticeships
While governments’ financial support for trade apprenticeships is messy and intersecting,
the system is, by comparison with course subsidies, quite simple and the solutions to its
messiness relatively easy to remedy (chapter 7). The Achilles heel of current arrangements
is that the payments made under the general program — the Australian Apprenticeships
Incentives Program (AAIP) — appear to have limited impacts on enrolments, with few
prospects that this could be addressed without substantial budgetary implications (chapter 5).
Currently, apprenticeship arrangements are in disarray due to the COVID-19 pandemic, with
an emergency program providing wage subsidies to maintain attachment of apprentices to
their workplaces (chapter 5). Precipitate changes to the AAIP would not be warranted during
the pandemic and its immediate aftermath. However, over the longer run, there are grounds
to seek alternative ways of supporting apprenticeships, recognising that training levels may
be lower than desirable (a proposition that is hard to test).
There are several policy options.
Address barriers to apprenticeships
One option — which could be combined with all others — is to address barriers to hiring
apprentices, including their foundational skills, work readiness, and unnecessarily restrictive
award conditions set by the Fair Work Commission. For example:
the business sector often expresses concern that many young people do not have
sufficient numeracy or literacy skills to undertake an apprenticeship (Noonan 2016a,
p. 30). Issues surrounding the VET sector’s role in supplying foundational skills will be
examined in the final report and may be one direction for addressing this barrier
Australia’s workplace relations system recognises that apprentices are not as productive
during their training as fully-trained workers, and accordingly allows employers to pay
below the normal minimum wage. There is little empirical evidence about the extent to
which apprentice minimum wages are binding. The more frequently they are, the greater
the possibility that they act as an impediment to training. Awards involve another
peculiarity with possible impacts on employer incentives. The award system has two
approaches for increases in pay, which vary by award. One is purely time-based, so that
each year, the pay rate climbs. The other is based on competency
apprentices often drop-out because of personal difficulties and insufficient support,
Mentoring and pastoral care has some potential to improve retention rates (discussed
briefly below). This would have the indirect benefit of increasing the willingness of
employers to recruit apprentices since it would raise the returns to training.
POLICY OPTIONS FOR INVESTMENT IN VET 187
Target incentives
Another option is to re-orient employer incentives to particular types of apprenticeships
where the public or social benefits are deemed larger. Some experimentation is already under
way, with several initiatives launched in 2019 aiming to encourage recruitment of
apprentices in regional Australia, with disabilities, and in occupations with very significant
shortages (chapter 5). The Commission has not examined these recent initiatives and their
impacts will only become apparent after some while.
Free-riding and levies?
Free-riding may result in underinvestment in training apprentices
A business that trains an apprentice is subject to the risk that, at the completion of training,
competitors can poach skilled workers without having to make their own investments in
training — an example of ‘free-riding’. The free rider problem may therefore lead to
under-investment in apprenticeships. Its materiality depends on the extent to which
employers’ training costs are offset by the work performed by apprentices during their
training or through a sufficient period of retention after they qualify. Factors like loyalty,
firm-specific skills, career prospects, thin local markets, and uncertainty by other employers
about the quality of apprentices they have not trained may overcome or diminish the
free-rider problem. There is also no problem if the value of the work undertaken by an
apprentice during their training exceeds their training costs — which sometimes occurs
(chapter 5).
Participants in this review did not raise concerns about free riding, but anecdotal claims
about its importance have been raised periodically. South Australia’s Training and Skills
Commission (2019) found that stakeholders raised the problem, but that there was little
evidence about its materiality. A 2006 NSW Parliamentary Report into the skills shortages
in rural and regional New South Wales also highlighted this issue. Participants in that inquiry
argued that some organisations were poaching apprentices, trained and skilled staff from
other organisations, leading to animosity between sectors of the business community and a
reluctance to train staff for fear of losing them once trained (NSW SCSD 2006). There has
also been some media commentary on the issue particularly during periods of high skill
demand, such as the mining and construction booms (ABC News 2005; Mining.com 2011;
Turnbull 2012).
Empirical evidence suggests that poaching risks may be more acute for small firms because
the scope for retaining apprentices upon completion is likely to be less for small firms
(Muhlemann 2016, p. 29; OECD 2018). This could be because smaller firms cannot offer a
job to the qualified apprentice as a skilled worker, or because the apprentice might prefer to
work for larger employers with better career prospects or remuneration. Using German and
Swiss data, Muhlemann (2016) found that, relative to small firms, large companies were
significantly more likely to retain apprentices. There is scant Australian evidence.
188 NASWD REVIEW
Industry levies are sometimes used to counter free-rider problems …
While employer incentives are one approach to resolving the free-rider problem, a
commonly suggested alternative are industry levies. The most recent Australian
apprenticeship review (McDowell et al. 2011, p. 59) recommended an employer
contribution scheme and redirecting government funding from incentives to support
services, suggesting:
It is time to move away from government support in the form of direct financial payments to
employers. The current system has been in place for many years and the outcomes being achieved
do not represent an acceptable return on government investment.
The Australian Government accepted part of this recommendation and has focused more on
support services, while leaving incentives largely unchanged.
Governments and industry sectors here and overseas have used levy schemes to encourage
employers to contribute to apprenticeship training (OECD 2018). Training levies address the
free-riding problem and can give employers a sense of ownership of, and involvement in,
training. They may further stimulate training, as employers are often directly involved in
managing the training fund and identifying training priorities.
In the early 1990s (1990–1994), the Australian Government experimented with a national
levy — the National Training Guarantee (NTG). The NTG was introduced to address a
rapidly changing need for skills in industry. It required all employers above the payroll
threshold to spend a minimum percentage of payroll in each financial year on training. The
minimum expenditure was set at 1 per cent for 1990-91 and 1991-92, rising to 1.5 per cent
in 1992. The payroll threshold was set at $200 000 in 1990-91, indexed to annual movements
of average weekly earnings — in 1993-94 it stood at $226 000 (Fraser 1996, p. 1).
Most State and Territory governments have also established levies (underpinned by
legislation) to raise funds from businesses to be reinvested into industry training. The
construction industry has used training levies since the 1990s to encourage training
(table 6.4). In the industry, a training board (or its equivalent) administers the funds raised
through the levies.
… but the evidence on the success of levies is mixed
Overseas evidence on the effectiveness of levies is mixed, with some studies showing that
larger firms tend to benefit more than smaller firms (Dar and Whitehead 2003;
Johanson 2009; Muller and Behringer 2012; OECD 2018; Smith and Billett 2005). This is
an important finding given that free-rider risk appears to be greater for smaller firms.
Overseas evidence also shows that the effectiveness of levies depends on policy goal, design
(universal or sectoral), and the social, cultural or economic environment of the country.
In the Australian context, it is unclear whether levies (alone) have been effective in
encouraging investment in training in the construction sector, relative to other sectors where
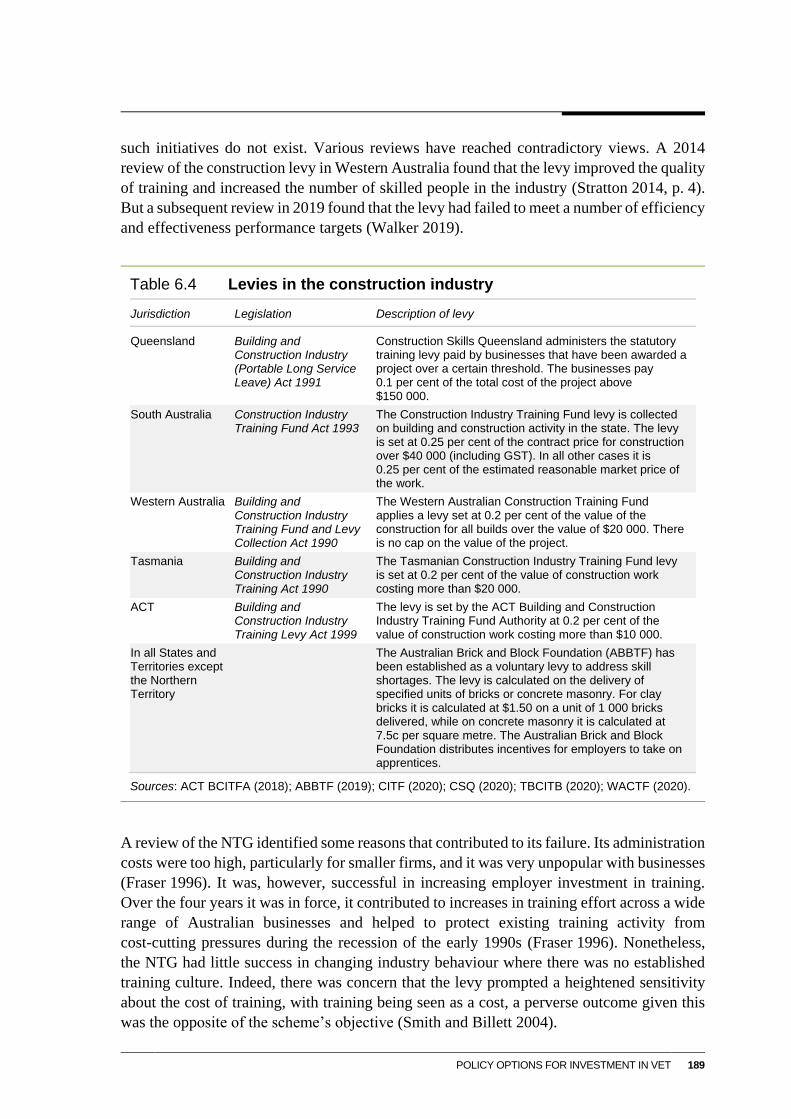
POLICY OPTIONS FOR INVESTMENT IN VET 189
such initiatives do not exist. Various reviews have reached contradictory views. A 2014
review of the construction levy in Western Australia found that the levy improved the quality
of training and increased the number of skilled people in the industry (Stratton 2014, p. 4).
But a subsequent review in 2019 found that the levy had failed to meet a number of efficiency
and effectiveness performance targets (Walker 2019).
Table 6.4 Levies in the construction industry
Jurisdiction Legislation Description of levy
Queensland Building and Construction Industry (Portable Long Service Leave) Act 1991
Construction Skills Queensland administers the statutory training levy paid by businesses that have been awarded a project over a certain threshold. The businesses pay 0.1 per cent of the total cost of the project above $150 000.
South Australia Construction Industry Training Fund Act 1993
The Construction Industry Training Fund levy is collected on building and construction activity in the state. The levy is set at 0.25 per cent of the contract price for construction over $40 000 (including GST). In all other cases it is 0.25 per cent of the estimated reasonable market price of the work.
Western Australia Building and Construction Industry Training Fund and Levy Collection Act 1990
The Western Australian Construction Training Fund applies a levy set at 0.2 per cent of the value of the construction for all builds over the value of $20 000. There is no cap on the value of the project.
Tasmania Building and Construction Industry Training Act 1990
The Tasmanian Construction Industry Training Fund levy is set at 0.2 per cent of the value of construction work costing more than $20 000.
ACT Building and Construction Industry Training Levy Act 1999
The levy is set by the ACT Building and Construction Industry Training Fund Authority at 0.2 per cent of the value of construction work costing more than $10 000.
In all States and Territories except the Northern Territory
The Australian Brick and Block Foundation (ABBTF) has been established as a voluntary levy to address skill shortages. The levy is calculated on the delivery of specified units of bricks or concrete masonry. For clay bricks it is calculated at $1.50 on a unit of 1 000 bricks delivered, while on concrete masonry it is calculated at 7.5c per square metre. The Australian Brick and Block Foundation distributes incentives for employers to take on apprentices.
Sources: ACT BCITFA (2018); ABBTF (2019); CITF (2020); CSQ (2020); TBCITB (2020); WACTF (2020).
A review of the NTG identified some reasons that contributed to its failure. Its administration
costs were too high, particularly for smaller firms, and it was very unpopular with businesses
(Fraser 1996). It was, however, successful in increasing employer investment in training.
Over the four years it was in force, it contributed to increases in training effort across a wide
range of Australian businesses and helped to protect existing training activity from
cost-cutting pressures during the recession of the early 1990s (Fraser 1996). Nonetheless,
the NTG had little success in changing industry behaviour where there was no established
training culture. Indeed, there was concern that the levy prompted a heightened sensitivity
about the cost of training, with training being seen as a cost, a perverse outcome given this
was the opposite of the scheme’s objective (Smith and Billett 2004).
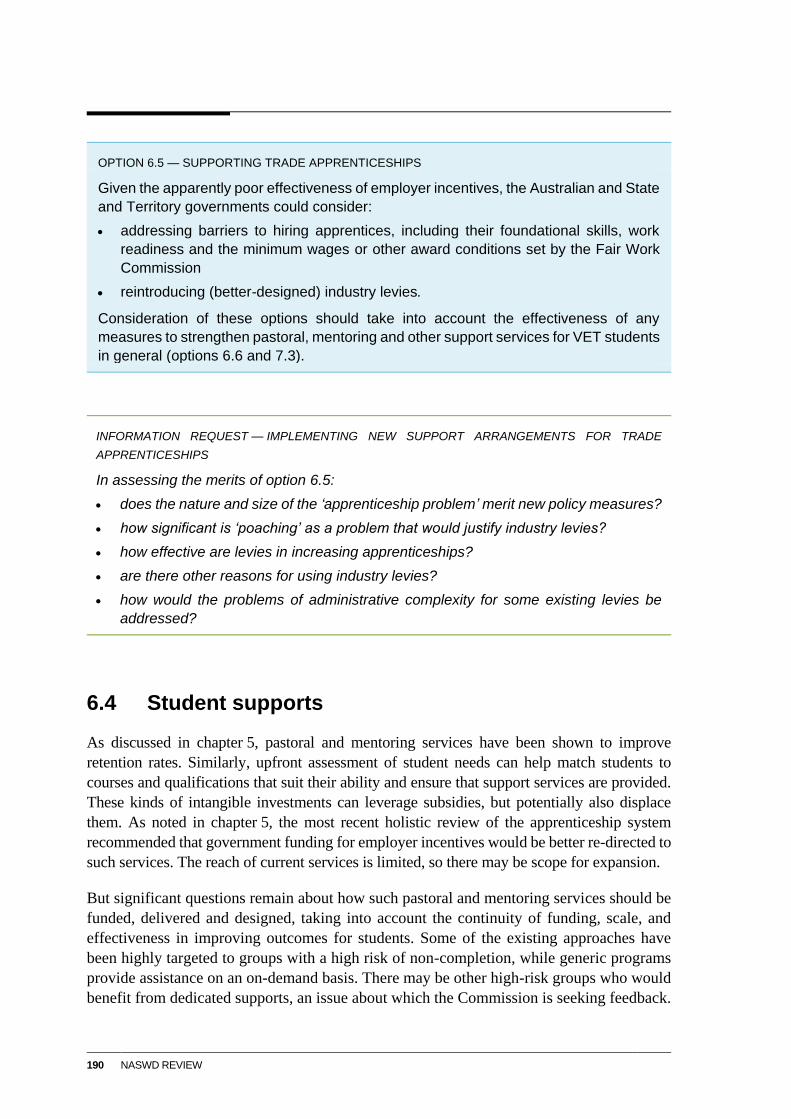
190 NASWD REVIEW
OPTION 6.5 — SUPPORTING TRADE APPRENTICESHIPS
Given the apparently poor effectiveness of employer incentives, the Australian and State
and Territory governments could consider:
addressing barriers to hiring apprentices, including their foundational skills, work
readiness and the minimum wages or other award conditions set by the Fair Work
Commission
reintroducing (better-designed) industry levies.
Consideration of these options should take into account the effectiveness of any
measures to strengthen pastoral, mentoring and other support services for VET students
in general (options 6.6 and 7.3).
INFORMATION REQUEST — IMPLEMENTING NEW SUPPORT ARRANGEMENTS FOR TRADE
APPRENTICESHIPS
In assessing the merits of option 6.5:
does the nature and size of the ‘apprenticeship problem’ merit new policy measures?
how significant is ‘poaching’ as a problem that would justify industry levies?
how effective are levies in increasing apprenticeships?
are there other reasons for using industry levies?
how would the problems of administrative complexity for some existing levies be
addressed?
6.4 Student supports
As discussed in chapter 5, pastoral and mentoring services have been shown to improve
retention rates. Similarly, upfront assessment of student needs can help match students to
courses and qualifications that suit their ability and ensure that support services are provided.
These kinds of intangible investments can leverage subsidies, but potentially also displace
them. As noted in chapter 5, the most recent holistic review of the apprenticeship system
recommended that government funding for employer incentives would be better re-directed to
such services. The reach of current services is limited, so there may be scope for expansion.
But significant questions remain about how such pastoral and mentoring services should be
funded, delivered and designed, taking into account the continuity of funding, scale, and
effectiveness in improving outcomes for students. Some of the existing approaches have
been highly targeted to groups with a high risk of non-completion, while generic programs
provide assistance on an on-demand basis. There may be other high-risk groups who would
benefit from dedicated supports, an issue about which the Commission is seeking feedback.
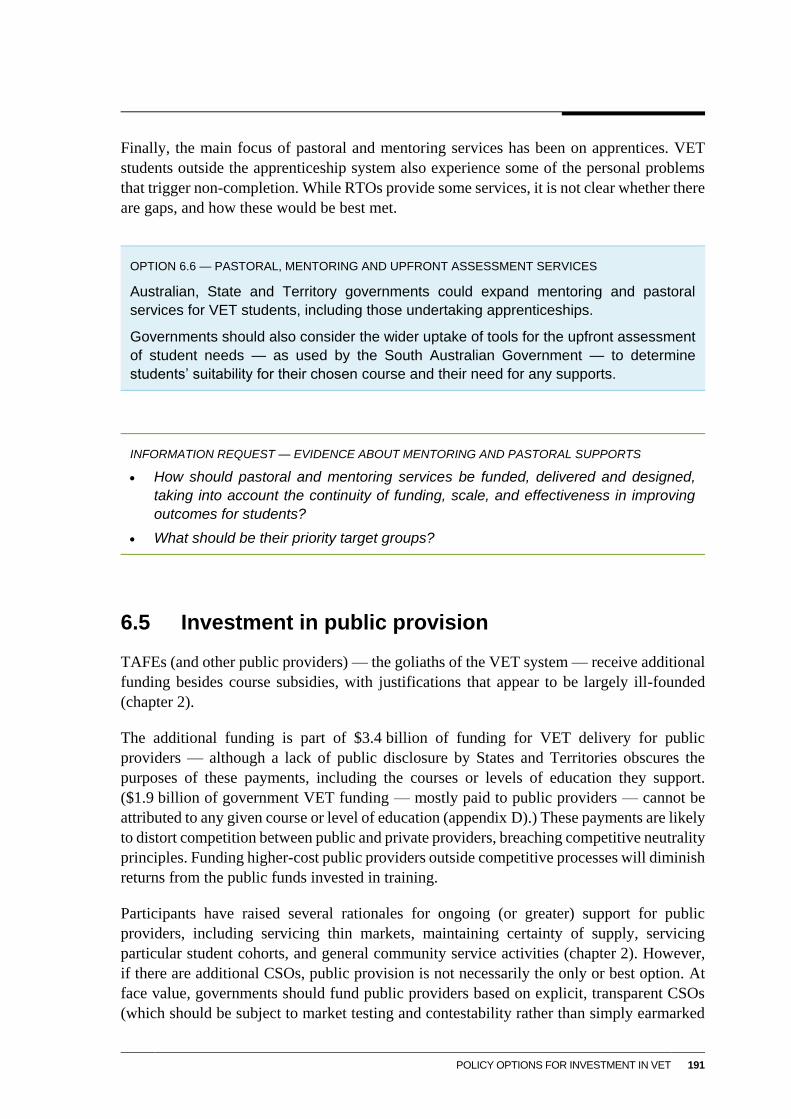
POLICY OPTIONS FOR INVESTMENT IN VET 191
Finally, the main focus of pastoral and mentoring services has been on apprentices. VET
students outside the apprenticeship system also experience some of the personal problems
that trigger non-completion. While RTOs provide some services, it is not clear whether there
are gaps, and how these would be best met.
OPTION 6.6 — PASTORAL, MENTORING AND UPFRONT ASSESSMENT SERVICES
Australian, State and Territory governments could expand mentoring and pastoral
services for VET students, including those undertaking apprenticeships.
Governments should also consider the wider uptake of tools for the upfront assessment
of student needs — as used by the South Australian Government — to determine
students’ suitability for their chosen course and their need for any supports.
INFORMATION REQUEST — EVIDENCE ABOUT MENTORING AND PASTORAL SUPPORTS
How should pastoral and mentoring services be funded, delivered and designed,
taking into account the continuity of funding, scale, and effectiveness in improving
outcomes for students?
What should be their priority target groups?
6.5 Investment in public provision
TAFEs (and other public providers) — the goliaths of the VET system — receive additional
funding besides course subsidies, with justifications that appear to be largely ill-founded
(chapter 2).
The additional funding is part of $3.4 billion of funding for VET delivery for public
providers — although a lack of public disclosure by States and Territories obscures the
purposes of these payments, including the courses or levels of education they support.
($1.9 billion of government VET funding — mostly paid to public providers — cannot be
attributed to any given course or level of education (appendix D).) These payments are likely
to distort competition between public and private providers, breaching competitive neutrality
principles. Funding higher-cost public providers outside competitive processes will diminish
returns from the public funds invested in training.
Participants have raised several rationales for ongoing (or greater) support for public
providers, including servicing thin markets, maintaining certainty of supply, servicing
particular student cohorts, and general community service activities (chapter 2). However,
if there are additional CSOs, public provision is not necessarily the only or best option. At
face value, governments should fund public providers based on explicit, transparent CSOs
(which should be subject to market testing and contestability rather than simply earmarked
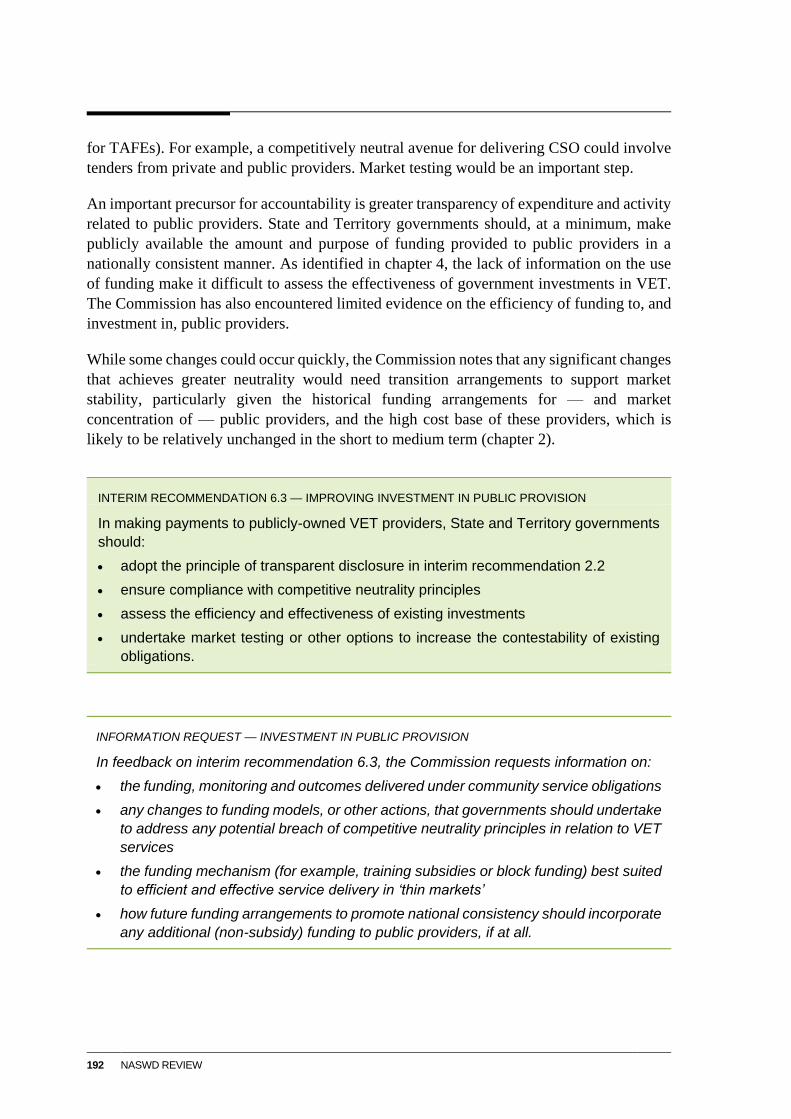
192 NASWD REVIEW
for TAFEs). For example, a competitively neutral avenue for delivering CSO could involve
tenders from private and public providers. Market testing would be an important step.
An important precursor for accountability is greater transparency of expenditure and activity
related to public providers. State and Territory governments should, at a minimum, make
publicly available the amount and purpose of funding provided to public providers in a
nationally consistent manner. As identified in chapter 4, the lack of information on the use
of funding make it difficult to assess the effectiveness of government investments in VET.
The Commission has also encountered limited evidence on the efficiency of funding to, and
investment in, public providers.
While some changes could occur quickly, the Commission notes that any significant changes
that achieves greater neutrality would need transition arrangements to support market
stability, particularly given the historical funding arrangements for — and market
concentration of — public providers, and the high cost base of these providers, which is
likely to be relatively unchanged in the short to medium term (chapter 2).
INTERIM RECOMMENDATION 6.3 — IMPROVING INVESTMENT IN PUBLIC PROVISION
In making payments to publicly-owned VET providers, State and Territory governments
should:
adopt the principle of transparent disclosure in interim recommendation 2.2
ensure compliance with competitive neutrality principles
assess the efficiency and effectiveness of existing investments
undertake market testing or other options to increase the contestability of existing
obligations.
INFORMATION REQUEST — INVESTMENT IN PUBLIC PROVISION
In feedback on interim recommendation 6.3, the Commission requests information on:
the funding, monitoring and outcomes delivered under community service obligations
any changes to funding models, or other actions, that governments should undertake
to address any potential breach of competitive neutrality principles in relation to VET
services
the funding mechanism (for example, training subsidies or block funding) best suited
to efficient and effective service delivery in ‘thin markets’
how future funding arrangements to promote national consistency should incorporate
any additional (non-subsidy) funding to public providers, if at all.
POLICY OPTIONS FOR INVESTMENT IN VET 193
6.6 Information is lacking or opaque
The Commission’s analysis has been constrained by poor information. Different
jurisdictions collect different data and to different degrees. The result is that it is not possible
to obtain a reliable national picture on the proportion of funding going to different purposes
(provision of funding to public providers being an exemplar). States and Territories also do
not publish information on the fee-for-service market, which limits insight into how
government subsidies affect the behaviour of both funded and non-funded providers.
Sometimes information is years out of date, so that important decisions about costs are
ill-informed.
There is a general lack of information and transparency about the course cost estimation
process including on inputs, methodologies, the rationales for them and assessments of their
effectiveness. There are marked differences across jurisdictions — as shown in chapter 4 —
but a forensic analysis of costs and subsidies is not possible with current limited data.
On request by the Commission, some, but not all, States and Territories provided more
information on their subsidy arrangements and their impacts. Most of the information
provided to the Commission was given on a confidential basis. Prima facie, the degree of
secrecy is concerning given that the starting point should be transparency in the allocation
and use of public funds.
The Commission understands that States and Territories are working towards making more
detailed information on allocations of funding routinely available in the future.
6.7 The challenge posed by online delivery
The disruption of COVID-19 has thrown into sharper relief the potential for new platforms
for learning, including the possibility for entirely online acquisition of some skills
(chapter 1). Where this is feasible, it would elevate the issue of national consistency, and
open up the potential for greater competition in the supply of some qualifications.
It has significant implications for subsidy setting, pricing, quality assurance and regulation.
Currently, State and Territory governments provide subsidies to RTOs resident in their
jurisdiction. The prospect of fully online learning for some qualifications raises questions
about arrangements that might facilitate subsidy payments by one jurisdiction to an RTO in
another, or indeed, in a more radical re-working of the system, to reputable providers
internationally. This would involve challenges in estimating costs.
For example, massive open online courses (MOOCs) are seen as the province of the higher
education sector, a preconception that should be open to challenge. MOOCs (and
gamification) have the advantage that it becomes economic to make large upfront
investments in high quality and engaging ways of transmitting knowledge, with very low
incremental access costs for students.
194 NASWD REVIEW
This feature of online delivery has several implications for delivery and pricing. For
example, subsidies could be paid to meet the fixed costs of such online approaches, with
near zero pricing given that use of such courses by any one student does not limit its use by
another. Such provision is time agnostic and so can suit people of older ages already in jobs,
for whom time away from work is an impediment to further training. In 2016-17, the two
main obstacles to undertaking non-formal training was too much work/not enough time
(45 per cent of people who want to do more training) and financial reasons (26 per cent) —
both of which are partly alleviated by this new model for provision (ABS 2017, table 14.2).
Moreover, MOOCs increase the scope for variety. In a traditional model of training, variety
is costly because the number of students who might access training through a local training
provider becomes smaller with higher degrees of specificity of a course or unit of
competency — a problem that does not exist where costs can be spread across large numbers
of students across a nation (or globally).
The seeming Achilles heel of such models of training is accreditation. However,
accreditation and knowledge provision could be unbundled — as is the case for drivers’
licenses. The Commission saw considerable scope for such an approach in its assessment of
Australia’s higher education system, and it may have equal, if not more application in VET.
Governments’ role would be to develop reputable certification models where these were not
already available. (Businesses sometimes already provide quality certification, as in
Microsoft’s exams for certifying IT skills relevant to its platforms.)
The degree to which new platforms for learning are practical is only partly tested. For
example, online delivery is not suitable for many courses (such as when competency in using
equipment is an essential part of skills acquisition). Many students may prefer face-to-face
contact. Similarly, independent accreditation may be too administratively costly for many
online courses. The Commission is seeking feedback on new ways in which people could
acquire skills and their implications for subsidy setting, price regulation, national
consistency, and regulation.
INFORMATION REQUEST — THE CHALLENGES OF ONLINE DELIVERY
What is the scope to increase the use of fully online delivery of VET, with what
advantages, risks and policy challenges?
How should subsidy arrangements be configured for payments across jurisdictions
for online delivery of services?
What subsidy, pricing and costing approaches are appropriate for services that have
high fixed costs and low incremental costs?
To what degree could accreditation be separated from training?
What types of training are most suited to innovative models of training?
What actions would governments need to take to maximise the potential for the
adoption of innovative delivery of training or new types of training?
COORDINATION AND STREAMLINING OF VET SUPPORTS 195
7 Coordination and streamlining of
VET supports
Key points
Recent initiatives to simplify apprenticeship supports, streamline training packages and create
a single, national source of careers and training information will improve the functioning of the
vocational education and training (VET) system, but there is scope for more reform.
Governments’ support services for apprentices are still complicated to navigate and
duplicative. This can deter students from enrolling in the VET sector and may discourage
employers from taking on apprentices.
– Employers of apprentices would benefit from a genuine one-stop-shop for advice and
support, including identifying relevant awards, training providers and government
incentives.
– The Australian Government should examine the costs and benefits of extending eligibility
for trade apprenticeship supports to all new and existing workers rather than targeting
eligibility for support based on an updated National Skills Needs List.
– Jurisdictions should continue working together to reduce duplication in apprenticeship
support services, such as advice, mentoring and pastoral care.
The process of developing, updating and endorsing training packages is cumbersome and
rigid, as it requires vetting by multiple parties. This is time consuming, but initiatives are in train
to streamline the process.
– To further speedup development and approval, Industry Reference Committees could be
delegated power to commission updates of training packages and approve straightforward
changes to training products.
With multiple regulators of training quality, there is a need to streamline oversight of registered
training organisations (RTOs).
– While there is merit in Victoria and Western Australia ultimately moving to a national
regulator, in the first instance, the Australian Standards and Qualification Authority and its
Victorian and Western Australian counterparts should align regulatory interpretations to
address RTOs’ concerns about inconsistency and overlap.
Quality information is important to enable students to make informed training decisions.
– The National Careers Institute should publish better and more accessible information for
students. Information should: cover course prices and subsidy levels; be tailored to different
cohorts of users, such as school leavers and mature-aged students; and be user-tested to
ensure it is effective in aiding informed training and career decisions.
A customer-centred approach in the VET system requires the twin supports of good regulation
and information for students and employers (its key customers). But ‘getting it right’ in these
areas is no easy task, underscoring the need for trials and ongoing review.
196 NASWD REVIEW
Governments share responsibility for funding, regulating and setting policy directions for
the vocational education and training (VET) system, and few areas are the exclusive domain
of one level of government (chapter 1). The large extent of shared activity makes it essential
that governments’ roles are clearly defined and that they work together to avoid costly
duplication and confusing VET system users.
In 2012, all governments committed to ‘strengthen, streamline and harmonise’ the
apprenticeship system as part of the updated National Agreement for Skills and Workforce
Development (NASWD). Since then, governments have gone beyond this aim to simplify
the training system by, among other things, reducing the number of training products and
improving regulation of training providers (COAG 2019c; DESE 2020b).Under the auspices
of the Council of Australian Governments (COAG) Skills Council, senior officials have
flagged further reforms to streamline training package arrangements, reduce red tape in the
apprenticeship system and better coordinate consumer information (SSON 2020).
This chapter first assesses progress against the aim in the NASWD aim of streamlining the
apprenticeship system (section 7.1). It then considers other areas where there is further scope
for streamlining and coordination, including:
duplication in and complexity of incentives and support services for apprenticeships
(section 7.2)
inefficiencies in training package development (section 7.3)
the existence of multiple regulators of service quality (section 7.4)
improving the quality and user-friendliness of information for students (section 7.5).
The streamlining and coordination options presented in this chapter propose, overall,
refinement to the current system rather than a radical restructuring of it. In many cases, they
build on existing initiatives to improve administrative efficiency.
Nevertheless, there are aspects of the VET system that are performing poorly where
potentially large gains could be made by fundamentally reimagining the rationale and nature
of government intervention. The allocation of government expenditure is a case in point
(chapters 3 to 6).
7.1 Progress against the NASWD
Commonwealth, State and Territory governments share responsibility for regulating
apprenticeships. (Box 7.1 outlines the key features of apprenticeships and the terminology
used in this report to describe them.) The Commonwealth is primarily responsible for
regulating employment conditions and the States and Territories for the delivery of training.
The latter ranges from determining which VET courses are subsidised to administering
training contracts and resolving disputes between employers and apprentices.
Apprenticeship arrangements have traditionally differed between jurisdictions.
COORDINATION AND STREAMLINING OF VET SUPPORTS 197
Box 7.1 What is an apprenticeship?
An apprenticeship combines vocational training with on-the-job experience. Traditionally,
apprenticeships were the primary pathway into a trade occupation such as plumbing and
carpentry. Over time, however, apprenticeships have extended into non-trade areas such as
nursing, childcare and retailing. Typically, apprenticeships in non-trade areas are called
traineeships (Karmel, Blomberg and Vnuk 2010).
Apprenticeships in trade occupations generally take 3 to 4 years to complete, while traineeships
take 1 to 2 years. In both cases, an employer and apprentice enter into a training contract, which
outlines the employer’s and apprentice’s obligations, including supervision and working hours
(Australian Apprenticeship Pathways 2020). The apprentice, employer and registered training
organisation are also required to have a training plan setting out the details of how an apprentice
will complete their qualification, including the units they will study, mode of delivery and
assessment methods (Training Services NSW 2018).
A note on terminology
While most State and Territory governments use the terms ‘apprentice’ and ‘trainee’, the
Australian Government uses ‘apprentice’ to refer to both. In this report, the Commission follows
the Australian Government’s approach unless discussing specific issues relevant to apprentices
or trainees. In these cases, the terms ‘trade apprentice’ and ‘trainee’ are used, respectively.
As noted earlier, under the NASWD, governments agreed to strengthen, streamline and
harmonise the Australian Apprenticeship System (clause 25 f). To achieve this, the National
Partnership Agreement on Skills Reform identified areas that could be harmonised,
including the rights and obligations of apprentices and employers, rules on the creation,
change and transfer of training contracts, rules on employment (such as the number of
training hours required and minimum apprenticeship ages) and assessment and credit
transfer arrangements (COAG 2012d).
Good progress has been made in implementing the NAWSD goals for streamlining the
apprenticeship system. States and Territories now have largely similar, legislative
arrangements for their apprenticeship systems (Misko 2020).
Employers and apprentices have similar rights and obligations in relation to training and
work activities. Jurisdictions have also generally aligned training hours (although in
Victoria part-time apprentices are required to work and study a total of 13 hours per week
rather than the 15 hours required in all other jurisdictions).
Most jurisdictions provide for apprenticeship terms of up to four years except in New
South Wales (NSW), where some apprenticeships can take five years.
Similar to other jurisdictions, apprentices in Queensland and the ACT are now able to
transfer employers without cancelling their contracts (DESBT (Qld) 2020; DTBI 2019;
Skills Canberra nd; Skills SA 2020; Skills Tasmania nd; Training Services NSW 2012;
Victorian Registration and Qualifications Authority 2019; Western Australia
Department of Training and Workforce Development 2018).
198 NASWD REVIEW
However, some unfinished business remains. There is still a difference in the classification
of trade apprenticeship and traineeship qualifications in about 8 per cent of cases (Fowler
and Stanwick 2017). Minimum age requirements also differ across States and Territories —
15 years in Victoria, Western Australia, the ACT and the Northern Territory, 16 years in
South Australia, and the completion of year 10 in New South Wales, Queensland and
Tasmania. Processes to assess the suitability of employers also vary. For example, in South
Australia, employers must register with the relevant regulator, the South Australian Training
and Skills Commission, and in Western Australia the Australian Apprenticeship Support
Network (AASN)43 checks the suitability of employers before training contracts are
approved by the State Training Authority (STA) (Misko and Wibrow 2020b).
Participants had mixed views on the significance of the remaining differences. On the one
hand, some, including the Australian Chamber of Commerce and Industry (ACCI), the
Australian Industry Group (Ai Group), and the Business Council of Australia (BCA) (2017)
cited the complexity facing employers with apprentices in different States and Territories,
and called for a national apprenticeship system. On the other hand, many employers reported
few issues in completing administrative processes to employ an apprentice, and participants
questioned the value of further harmonising arrangements, noting that remaining differences
reflected local needs (Fowler 2019b; Misko and Wibrow 2020b).
INTERIM FINDING 7.1 — STREAMLINING APPRENTICESHIPS
Governments have made progress in harmonising and streamlining the apprenticeship
system, but there is scope to further simplify arrangements for student support and
system administration.
7.2 Support services for apprenticeships
While governments have made progress towards harmonising their apprenticeship systems
and there are delineations between the Commonwealth’s and the States and Territories’
primary responsibilities (in employment and training, respectively), the interests of
governments are ‘tightly interwoven’ and can often overlap (Fowler 2019b). Both levels of
government, for example, provide financial incentives as well as support services to both
employers and apprentices (figure 7.1).
43 Discussed in section 7.2.
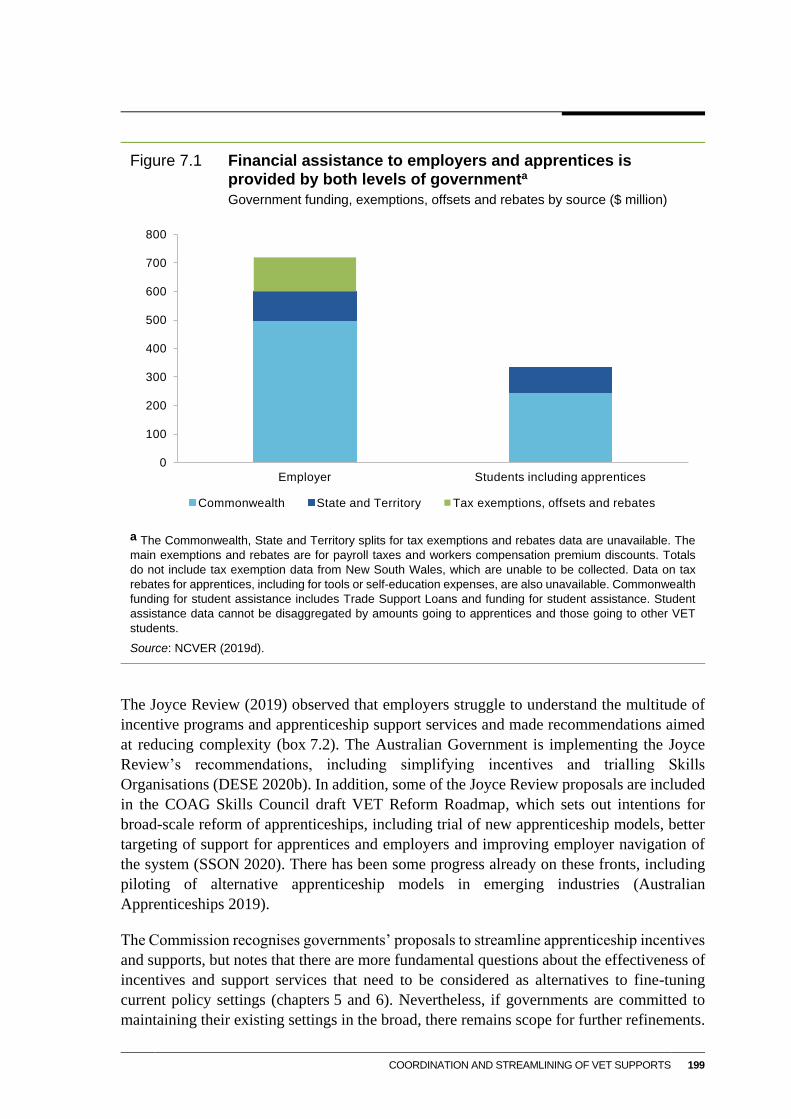
COORDINATION AND STREAMLINING OF VET SUPPORTS 199
Figure 7.1 Financial assistance to employers and apprentices is provided by both levels of governmenta
Government funding, exemptions, offsets and rebates by source ($ million)
a The Commonwealth, State and Territory splits for tax exemptions and rebates data are unavailable. The
main exemptions and rebates are for payroll taxes and workers compensation premium discounts. Totals
do not include tax exemption data from New South Wales, which are unable to be collected. Data on tax
rebates for apprentices, including for tools or self-education expenses, are also unavailable. Commonwealth
funding for student assistance includes Trade Support Loans and funding for student assistance. Student
assistance data cannot be disaggregated by amounts going to apprentices and those going to other VET
students.
Source: NCVER (2019d).
The Joyce Review (2019) observed that employers struggle to understand the multitude of
incentive programs and apprenticeship support services and made recommendations aimed
at reducing complexity (box 7.2). The Australian Government is implementing the Joyce
Review’s recommendations, including simplifying incentives and trialling Skills
Organisations (DESE 2020b). In addition, some of the Joyce Review proposals are included
in the COAG Skills Council draft VET Reform Roadmap, which sets out intentions for
broad-scale reform of apprenticeships, including trial of new apprenticeship models, better
targeting of support for apprentices and employers and improving employer navigation of
the system (SSON 2020). There has been some progress already on these fronts, including
piloting of alternative apprenticeship models in emerging industries (Australian
Apprenticeships 2019).
The Commission recognises governments’ proposals to streamline apprenticeship incentives
and supports, but notes that there are more fundamental questions about the effectiveness of
incentives and support services that need to be considered as alternatives to fine-tuning
current policy settings (chapters 5 and 6). Nevertheless, if governments are committed to
maintaining their existing settings in the broad, there remains scope for further refinements.
0
100
200
300
400
500
600
700
800
Employer Students including apprentices
Commonwealth State and Territory Tax exemptions, offsets and rebates
200 NASWD REVIEW
In particular, this section focuses on the design of governments’ incentive programs — how
programs at different levels of government interact and the administration of the main
incentive program, the Australian Government’s Australian Apprenticeships Incentives
Program. Like many parts of this report, the Commission agrees with the Joyce Review’s
identification of problems in the apprenticeship system, but comes to different conclusions
about the magnitude of the problems and ways to address them.
Box 7.2 Joyce Review recommendations on apprenticeship support
With the aim of streamlining apprenticeship supports, the Joyce Review recommended the
Australian Government:
simplify its main employer incentive program (to be called Incentives for Australian
Apprenticeships)
annually update the National Skills Needs List to include occupations facing existing and
expected shortages. Once established, the National Skills Commission would take
responsibility for future updates to the list
replace Australian Apprenticeship Support Network providers with industry bodies (called
Skills Organisations) to increase industry’s role in promoting apprenticeships, designing
apprenticeship support and developing training packages. The Review also recommended
that Skills Organisations create a list of their preferred registered training organisations for
employers to use when deciding where to train their apprentice or trainee. This list would also
inform funding decisions by the Commonwealth and States and Territories.
Source: Joyce (2019).
Simplifying governments’ administrative arrangements for managing
incentives
A frequent complaint with the processes used to manage incentive payments for employers
to hire and retain apprentices is how difficult they are to understand and use. For example,
Queensland Water Directorate stated:
[Hiring trade apprentices and trainees] would be further assisted by streamlining of the various
State and Federal Government incentives available to employers for the recruitment and retention
of trainees. At a recent [Queensland Water Directorate] forum, members reported that they were
unaware of the incentives available to them and found navigating the system to determine their
entitlements confusing. Simplification of the incentives offered and mechanisms for accessing
those would be of benefit. (sub. 30, p. 8)
One source of the problem stems from both levels of government providing incentive
payments to employers (table 7.1). Because they do so on a similar basis, and there is no
clear complementarity between programs, they can cause confusion about whether, for
instance, an employer can claim incentive payments offered by both States and Territories
and the Commonwealth.
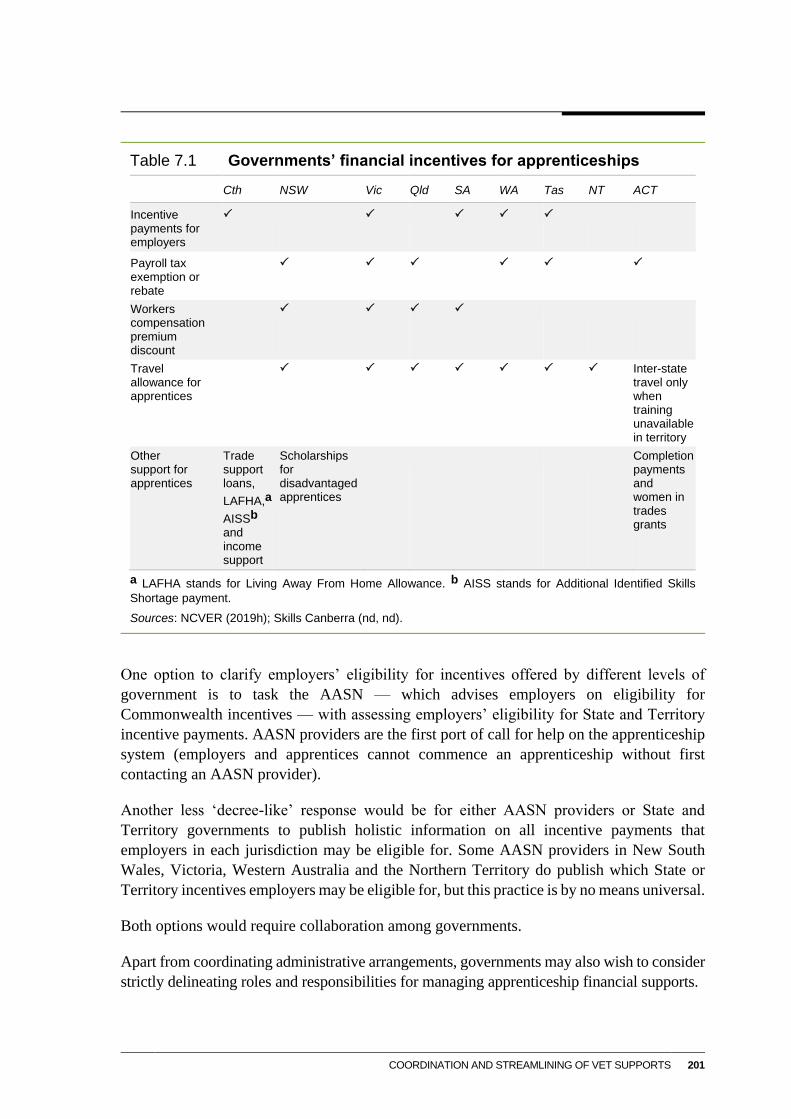
COORDINATION AND STREAMLINING OF VET SUPPORTS 201
Table 7.1 Governments’ financial incentives for apprenticeships
Cth NSW Vic Qld SA WA Tas NT ACT
Incentive payments for employers
Payroll tax exemption or rebate
Workers compensation premium discount
Travel allowance for apprentices
Inter-state travel only when training unavailable in territory
Other support for apprentices
Trade support loans,
LAFHA,a
AISSb and income support
Scholarships for disadvantaged apprentices
Completion payments and women in trades grants
a LAFHA stands for Living Away From Home Allowance. b AISS stands for Additional Identified Skills
Shortage payment.
Sources: NCVER (2019h); Skills Canberra (nd, nd).
One option to clarify employers’ eligibility for incentives offered by different levels of
government is to task the AASN — which advises employers on eligibility for
Commonwealth incentives — with assessing employers’ eligibility for State and Territory
incentive payments. AASN providers are the first port of call for help on the apprenticeship
system (employers and apprentices cannot commence an apprenticeship without first
contacting an AASN provider).
Another less ‘decree-like’ response would be for either AASN providers or State and
Territory governments to publish holistic information on all incentive payments that
employers in each jurisdiction may be eligible for. Some AASN providers in New South
Wales, Victoria, Western Australia and the Northern Territory do publish which State or
Territory incentives employers may be eligible for, but this practice is by no means universal.
Both options would require collaboration among governments.
Apart from coordinating administrative arrangements, governments may also wish to consider
strictly delineating roles and responsibilities for managing apprenticeship financial supports.

202 NASWD REVIEW
There is no obvious preferred level of government for fulfilling this purpose. While the
Commonwealth has been the dominant provider of employer incentives nationally since the
1970s, States and Territories have increased their incentive programs in recent years
(NCVER 2019f). Most other forms of financial support for apprenticeships are available
exclusively at the State and Territory level, avoiding the problems that some employers face
understanding and using financial incentives when multiple payment options coexist. These
include payroll tax exemptions and rebates, discounts on worker compensation premiums
and travel allowance for apprentices (table 7.1).
OPTION 7.1 — BETTER COORDINATING AND STREAMLINING INFORMATION ON APPRENTICESHIP
INCENTIVES
To better coordinate and streamline information on their multiple apprenticeship
incentives, Australian, State and Territory governments could implement one or more of
the following options:
task the Australian Apprenticeship Support Network to assist employers in
determining their eligibility for benefits offered by both the Australian and relevant
State or Territory governments
publish clearer information on all incentive payments that employers in each
jurisdiction may be eligible for
strictly delineate the roles and responsibilities for managing apprenticeship supports.
INFORMATION REQUEST — ASSESSING STREAMLINING OPTIONS
In assessing the policy alternatives in option 7.1:
what are the relative costs and benefits?
are there alternative ways to encourage governments to coordinate or streamline
their employer incentive programs?
Simplifying Commonwealth incentives
The Joyce Review singled out the Commonwealth’s main incentive program (the Australian
Apprenticeships Incentive Program, which will be rebranded as Incentives for Australian
Apprenticeships) as a candidate for streamlining as its current design was found to be
confusing employers. It is the single largest apprenticeship incentive program administered
by any Australian Government — costing about $500 million per year — and has been
incrementally redesigned over the past 20 years to more precisely target recipients
(DESE 2019h). In response to the Joyce Review, the Australian Government is streamlining
this program and updating the National Skills Needs List (NSNL), which is used to direct
incentives towards areas of skills gaps (DESE 2020b).
COORDINATION AND STREAMLINING OF VET SUPPORTS 203
The new incentives program, Incentives for Australian Apprenticeships, will more than
halve the number of payment types (from 31 to 14) and harmonise eligibility rules for
full- and part-time apprentices, and apprentices studying Certificate III/IV and
Diploma/Advanced Diploma qualifications (box 7.3). Consistent with previous
arrangements, the new incentives will apply to all new worker apprentices (both trade
apprentices and trainees), and existing workers (those employed for more than three months)
in occupations on the updated NSNL and in caring occupations.44 Employers of eligible
trade apprentices and trainees will continue to attract the same standard payment rates —
$1500 on commencement and $2500 on completion. The Additional Identified Skills
Shortage payment and wage subsidy trials will continue once the new incentives are rolled
out (DESSFB 2019e).
These changes are likely to make it easier for employers to understand the incentives, but
there is scope to further streamline the design of incentives. In particular, stakeholders have
raised concerns about the Department of Education, Skills and Employment’s (DESE)
proposal to annually update the NSNL to direct incentives for employers with existing
worker trade apprentices to emerging areas of skills needs (DESSFB 2019e). The proposed
methodology, which has not yet been agreed by the Australian Government, involves:
forecasting (primarily trade) occupations expected to experience apprentice shortages in
the next five years
consulting industry on predicted skills shortages
updating the list of occupations likely to experience shortages.
Putting aside questions about the accuracy of skills shortage forecasts (considered in
chapter 3), this proposed methodology could undermine the intent of streamlining
incentives. Some stakeholders have argued that regular changes to the list may disrupt
workforce planning, as occupations may only remain on the NSNL for a year
(DESSFB 2019e). The Ai Group stated that regular revisions to the list will create
uncertainty for employers, apprentices and AASN providers as system administrators.
If the methodology is applied annually, the occupations on the list will change annually. An
incentive that appears in one year may disappear in the next. For a four year apprenticeship, an
employer who takes on an apprentice every year will receive different payments for different
apprentices in different years. Some of those apprentices might be eligible for Trade Support
Loans and others might not be. This model would create a challenge for businesses, and would
be complex for the Australian Apprenticeship Support Network to administer. (Ai Group nd,
p. 3)
44 DESE is reviewing the National Skills Needs List with a view to updating the methodology to determine
skills shortages, revising the trade occupations on the list, and formalising arrangements to annually review
and update the list. The four priority non-trade occupations (aged care, disability care, childcare and
enrolled nursing) will be included on the list and be subject to ongoing monitoring (DESSFB 2019e).

204 NASWD REVIEW
Box 7.3 Australian Government apprenticeship programs
The Australian Government funds three main apprenticeship incentive programs.a
From July 2021,b the Incentives for Australian Apprenticeships Program will pay employers $1500
when an apprentice commences and $2500 on completion if the apprentice is a new worker or
an existing worker (that is, employed for more than three months) studying a Certificate III or
above in an occupation on the National Skills Needs List (NSNL) or in aged care, disability care,
childcare or enrolled nursing. Employers may be eligible for additional payments if they:
operate in rural and regional areas and take on apprentices in occupations at a Certificate III
or above on the NSNL
have school-based apprentices or mature-aged apprentices (aged 45 years and over) who are
disadvantaged
have an adult apprentice (aged 21 years and over) who is training towards an occupation on
the NSNL and studying a Certificate III or IV qualification.
Employers may also be eligible for $750 on commencement and another $750 on completion if
they hire apprentices at the Certificate II level who are Aboriginal and Torres Strait Islander
people, people with disability, school-based apprentices, mature-aged apprentices, rural and
regional apprentices or apprentices with severe barriers to employment. Additional payments are
available for employers with school-based apprentices, mature-aged apprentices who are
disadvantaged, and group training organisations.
The Additional Identified Skills Shortage Incentive Payment provides $4000 to employers if their
apprentice completes training in a course leading to one of 10 occupations experiencing skills
shortages — including carpenters and joiners, plumbers, hairdressers, air-conditioning and
refrigeration mechanics, bricklayers and stonemasons, plasterers, bakers and pastry cooks,
vehicle painters, tilers and arborists. These apprentices will also receive $2000 when they
complete their training.
The Australian Apprentice Wage Subsidy trial, which gives financial support to a capped number
of employers. The wage subsidy amounts to:
75 per cent of the first year award wage
50 per cent of the second year award wage
25 per cent of the third year award wage.
a The Australian Government’s response to COVID-19 includes an apprenticeship wage subsidy. Between
1 January 2020 and 30 September 2020, 50 per cent of an apprentice’s wage will be subsidised, up to a
maximum of $21 000 per eligible apprentice. The subsidy will be available to small businesses employing
fewer than 20 workers that retain an apprentice. Employers of any size and Group Training Organisations
that re-engage an out-of-work apprentice will also be eligible for the subsidy (DESE 2018d). b The Australian
Government had originally planned for Australian Apprenticeships to commence on 1 July 2020, but
announced on 11 May 2020 that rollout would be delayed until July 2021 because of COVID-19
(DESE 2020b).
Source: Australian Government (nd).
At present, the use of the NSNL to determine existing worker eligibility probably excludes
a very small number of employers since only 15 per cent of trades are not on the list and
existing workers have historically made up less than one-fifth of those commencing trade
apprenticeships (DESSFB 2019e; NCVER 2019f; figure 7.2). While it is not clear how many
employers will be affected by the proposed changes to the NSNL, if its current use is
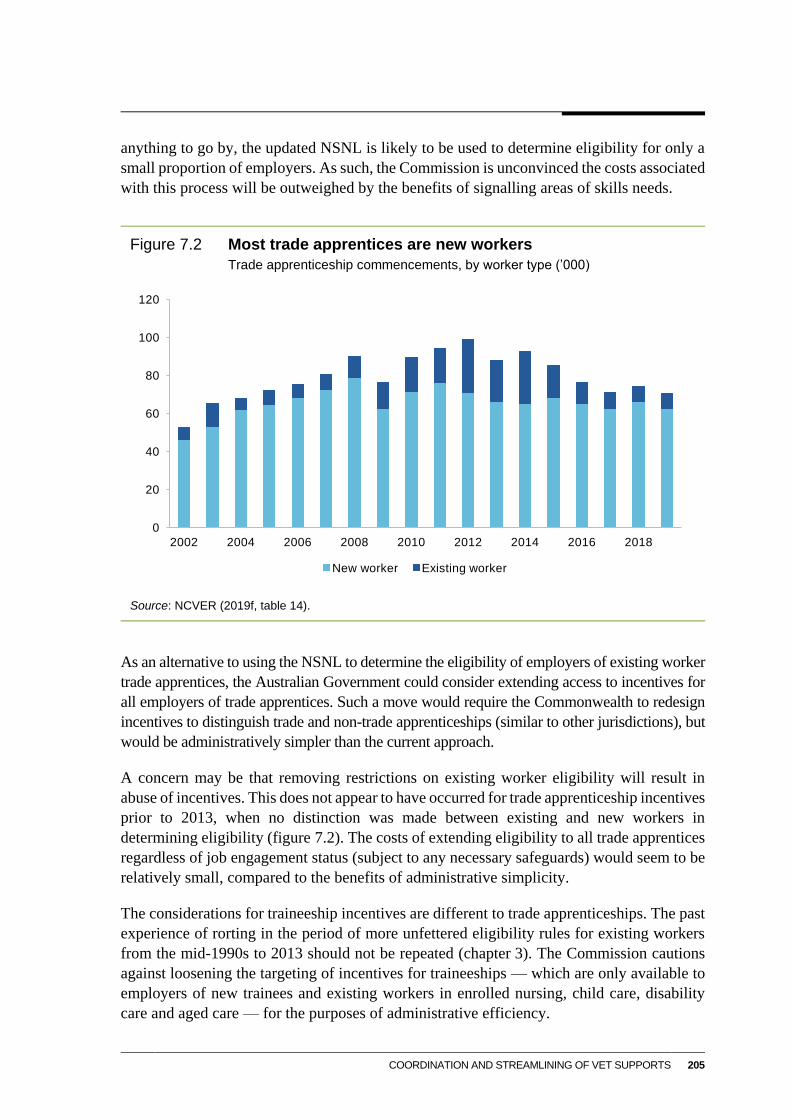
COORDINATION AND STREAMLINING OF VET SUPPORTS 205
anything to go by, the updated NSNL is likely to be used to determine eligibility for only a
small proportion of employers. As such, the Commission is unconvinced the costs associated
with this process will be outweighed by the benefits of signalling areas of skills needs.
Figure 7.2 Most trade apprentices are new workers
Trade apprenticeship commencements, by worker type (’000)
Source: NCVER (2019f, table 14).
As an alternative to using the NSNL to determine the eligibility of employers of existing worker
trade apprentices, the Australian Government could consider extending access to incentives for
all employers of trade apprentices. Such a move would require the Commonwealth to redesign
incentives to distinguish trade and non-trade apprenticeships (similar to other jurisdictions), but
would be administratively simpler than the current approach.
A concern may be that removing restrictions on existing worker eligibility will result in
abuse of incentives. This does not appear to have occurred for trade apprenticeship incentives
prior to 2013, when no distinction was made between existing and new workers in
determining eligibility (figure 7.2). The costs of extending eligibility to all trade apprentices
regardless of job engagement status (subject to any necessary safeguards) would seem to be
relatively small, compared to the benefits of administrative simplicity.
The considerations for traineeship incentives are different to trade apprenticeships. The past
experience of rorting in the period of more unfettered eligibility rules for existing workers
from the mid-1990s to 2013 should not be repeated (chapter 3). The Commission cautions
against loosening the targeting of incentives for traineeships — which are only available to
employers of new trainees and existing workers in enrolled nursing, child care, disability
care and aged care — for the purposes of administrative efficiency.
0
20
40
60
80
100
120
2002 2004 2006 2008 2010 2012 2014 2016 2018
New worker Existing worker
206 NASWD REVIEW
The Commission considers that the Australian Government should examine the costs and
benefits of extending eligibility for trade apprenticeship incentives as a potentially preferable
option to more targeted eligibility (and complex incentive arrangements) based on an
updated NSNL.
OPTION 7.2 — STREAMLINING TRADE APPRENTICESHIP INCENTIVES
In considering how to streamline trade apprenticeship incentives, the Australian
Government could consider extending eligibility for trade apprenticeship incentives to all
workers, regardless of their tenure with the employer.
Additional payments for targeted groups are also complicated
In most cases, Australian Apprenticeships Incentive Program payments are only available when
an employer takes on apprentices who are studying for a Certificate III or higher qualification
(box 7.3). However, an exception is applied for employers of apprentices studying for a
Certificate II if they are from a group likely to experience disadvantage. These groups include
Aboriginal and Torres Strait Islander Australians, job seekers facing severe barriers to
employment, people with disability, mature-aged apprentices, school-based apprentices and
apprentices in regional and rural areas. Employers are eligible for $1500 per apprentice ($750 on
commencement and $750 on completion) studying for a Certificate II and employers with
mature aged or school-based apprentices get a further $1500 (Australian Government 2019a).
However, there are also additional payments of $1500 per apprentice for employers with
apprentices studying at the Certificate III or above level if their apprentices are in regional
and rural areas and studying towards an occupation on the National Skills Priority List,
school based or qualify as a disadvantaged mature-aged worker. They can receive a further
$4000 if they hire an apprentice aged 21 years and over and are working towards an
occupation on the NSNL (Australian Government 2019a).
Between 2016-17 and 2018-19, these additional incentives represented 20 per cent of the
value of employer incentives for apprentices (DESE, pers. comm., 22 May 2020).
There may be good policy reasons for targeting different groups for additional incentive
payments at the Certificate II and Certificate III and above levels, but it is unclear whether
they differ intentionally or simply reflect incremental policy changes. Added layers of
targeting can be costly to employers and apprentices trying to navigate the system and need
to be part of a broader assessment of their effects on users of the apprenticeship system.
INFORMATION REQUEST — EMPLOYER INCENTIVES TARGETING DISADVANTAGED GROUPS
What are the benefits and costs of targeting disadvantaged groups for additional
incentives at the Certificate II, and Certificate III and above qualification levels?
COORDINATION AND STREAMLINING OF VET SUPPORTS 207
Other supports for apprenticeships
As discussed in chapter 5, apprenticeship support services such as mentoring and pastoral
care flank financial incentives and can play a decisive role in the success or otherwise of an
apprenticeship. They can be effective in increasing apprenticeship completion rates and are
features of best-practice employment arrangements (Karmel and Roberts 2012;
NCVER 2011b, 2011a).45 Conversely, apprentices commonly report ‘lack of mentoring and
support’ as reasons for non-completion (Bednarz 2014; Mitchell, Dobbs and Ward 2008;
Snell and Hart 2007, 2008).
However, the Joyce Review (2019) questioned whether the ‘bewildering’ array of support
service providers — which includes the Australian, State and Territory governments and the
private sector — was constraining the effectiveness of support services and confusing users of
the apprenticeship system. It recommended that provision of support services move from AASN
providers to its proposed industry-led Skills Organisations (box 7.2). In response, the Australian
Government is trialling Skills Organisations in the human services care, digital technology and
mining industries (DESSFB 2020b). As these pilots have only recently commenced, there is
little information on their effectiveness for the Commission to comment on.
At face value, apprenticeship support services potentially overlap — with AASN providers,
State Training Authorities (STAs) and private Group Training Organisations (GTOs) all
providing support. And some State and Territory governments administer their own
apprentice support programs.46
This section takes a closer look at the nature and size of support services provided by each
party to assess the extent of duplication. It then considers the case for overhauling the
provision of support services and puts forward options to improve service delivery.
Extent of duplication in support service delivery
In assessing the potential for overlap in apprenticeship support services, the Commission has
first considered whether private sector and government providers offer similar services to
similar types of apprentices. Where different providers target different types of apprentices
and employers, this could indicate a limited degree of service duplication.
Private sector support services are primarily delivered by GTOs, which hire apprentices and
place them with employers for work experience. They recruit, manage training and provide
45 Support services are not the only factor influencing completion rates — apprentice age and gender, whether
a qualification is required for an occupation, in-training and post-completion wage rates, and employer
characteristics all contribute (NCVER 2011a).
46 For example, Victoria established a Support Officers program, which provides mentoring and support for
disadvantaged apprentices at risk of dropping out of training, after the Commonwealth discontinued funding
in 2014 for the same purpose (Victorian Auditor-General 2014). Between 2009 and 2014, the Commonwealth
funded the Apprenticeships Support Officer program under the auspices of the National Partnership on Youth
Attainment and Transition. The Victorian Government designed and managed the program.

208 NASWD REVIEW
pastoral care throughout the apprentice’s training period (O’Dwyer and Korbel 2019). GTOs
only service a small part of the apprenticeship system — accounting for 8.3 per cent of
apprentices in the December quarter of 2018 — and are particularly helpful for small- to
medium-sized businesses that face impediments (or do not have capacity) to hire and mentor
apprentices (O’Dwyer and Korbel 2019). In return, businesses pay GTOs a fee to host an
apprentice for on-the-job work experience (McDowell et al. 2011; O’Dwyer and
Korbel 2019). For apprentices, the structured mentoring and field officer visits are key
reasons why they choose a GTO. Other reasons why apprentices choose GTOs include
flexibility to undertake on-the-job work experience at different businesses and employment
security (O’Dwyer and Korbel 2019).
But the GTO model does not work for all apprentices and employers. Some apprentices
prefer to work for an employer directly rather than a GTO because they feel more connected
to work where they are directly employed and there can be poor continuity of on-the-job
learning if job rotations are frequent (O’Dwyer and Korbel 2019).
Government providers, on the other hand, target apprentices at risk of dropping out of
training. For example, the Commonwealth-funded AASNs provide mentoring and pastoral
care for employers and apprentices who face barriers to completing training. These barriers
could include workplace issues such as bullying, or personal issues such as relationship
breakdown or ill-health. In addition, AASNs provide services for all apprentices and
employers such as:
marketing and information on the apprenticeship system
screening and assessing the suitability of prospective apprentices and employers
matching suitable apprentices and employers
giving advice on apprenticeship obligations, preparing training contracts and assessing
eligibility for Commonwealth financial support
helping users navigate state-based administrative systems, and working with STAs as
necessary, such as when apprentices and employers are seeking STA approval for
training contracts
‘checking in’ with apprentices periodically to see how they are managing their
apprenticeship (DET 2018a; McDowell et al. 2011; National Australian Apprenticeships
Association, sub. 39; MEGT 2020).
Many stakeholders regard AASNs as a trusted intermediary, supporting users to navigate the
apprenticeships system (DESE 2020f; Misko and Wibrow 2020a). This positive sentiment
also came through in a recent performance evaluation of AASN providers conducted by
Ithaca Group (2018a), although it found there remained some overlap between these and
other support services (box 7.4). In particular, some STAs also play a role in delivering
support services. They are also responsible for administering VET funding and regulating
apprenticeships. This includes approving training contracts and plans and, in some
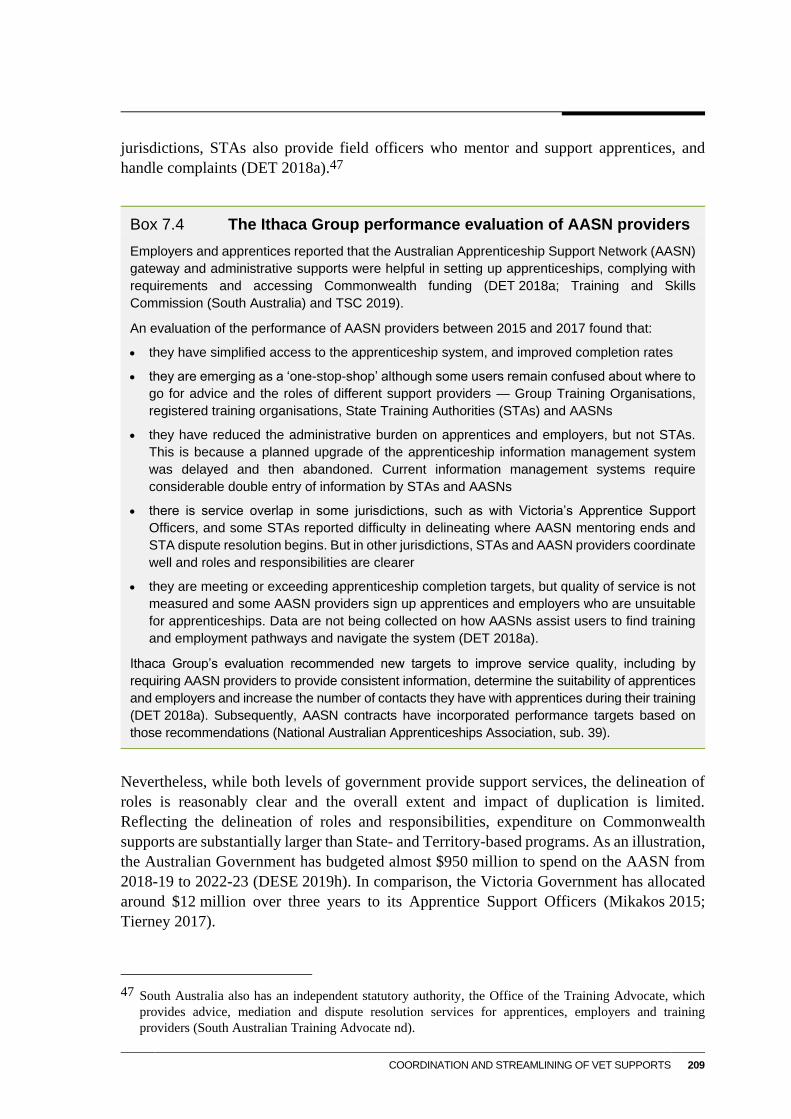
COORDINATION AND STREAMLINING OF VET SUPPORTS 209
jurisdictions, STAs also provide field officers who mentor and support apprentices, and
handle complaints (DET 2018a).47
Box 7.4 The Ithaca Group performance evaluation of AASN providers
Employers and apprentices reported that the Australian Apprenticeship Support Network (AASN)
gateway and administrative supports were helpful in setting up apprenticeships, complying with
requirements and accessing Commonwealth funding (DET 2018a; Training and Skills
Commission (South Australia) and TSC 2019).
An evaluation of the performance of AASN providers between 2015 and 2017 found that:
they have simplified access to the apprenticeship system, and improved completion rates
they are emerging as a ‘one-stop-shop’ although some users remain confused about where to
go for advice and the roles of different support providers — Group Training Organisations,
registered training organisations, State Training Authorities (STAs) and AASNs
they have reduced the administrative burden on apprentices and employers, but not STAs.
This is because a planned upgrade of the apprenticeship information management system
was delayed and then abandoned. Current information management systems require
considerable double entry of information by STAs and AASNs
there is service overlap in some jurisdictions, such as with Victoria’s Apprentice Support
Officers, and some STAs reported difficulty in delineating where AASN mentoring ends and
STA dispute resolution begins. But in other jurisdictions, STAs and AASN providers coordinate
well and roles and responsibilities are clearer
they are meeting or exceeding apprenticeship completion targets, but quality of service is not
measured and some AASN providers sign up apprentices and employers who are unsuitable
for apprenticeships. Data are not being collected on how AASNs assist users to find training
and employment pathways and navigate the system (DET 2018a).
Ithaca Group’s evaluation recommended new targets to improve service quality, including by
requiring AASN providers to provide consistent information, determine the suitability of apprentices
and employers and increase the number of contacts they have with apprentices during their training
(DET 2018a). Subsequently, AASN contracts have incorporated performance targets based on
those recommendations (National Australian Apprenticeships Association, sub. 39).
Nevertheless, while both levels of government provide support services, the delineation of
roles is reasonably clear and the overall extent and impact of duplication is limited.
Reflecting the delineation of roles and responsibilities, expenditure on Commonwealth
supports are substantially larger than State- and Territory-based programs. As an illustration,
the Australian Government has budgeted almost $950 million to spend on the AASN from
2018-19 to 2022-23 (DESE 2019h). In comparison, the Victoria Government has allocated
around $12 million over three years to its Apprentice Support Officers (Mikakos 2015;
Tierney 2017).
47 South Australia also has an independent statutory authority, the Office of the Training Advocate, which
provides advice, mediation and dispute resolution services for apprentices, employers and training
providers (South Australian Training Advocate nd).
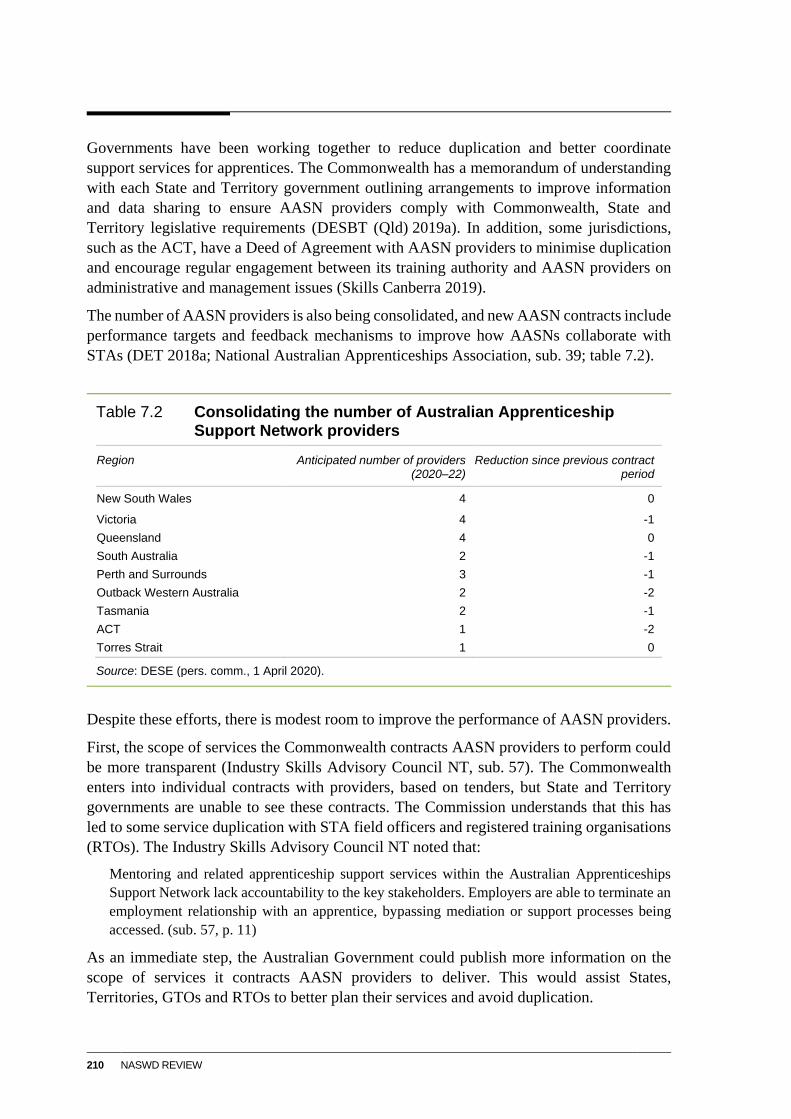
210 NASWD REVIEW
Governments have been working together to reduce duplication and better coordinate
support services for apprentices. The Commonwealth has a memorandum of understanding
with each State and Territory government outlining arrangements to improve information
and data sharing to ensure AASN providers comply with Commonwealth, State and
Territory legislative requirements (DESBT (Qld) 2019a). In addition, some jurisdictions,
such as the ACT, have a Deed of Agreement with AASN providers to minimise duplication
and encourage regular engagement between its training authority and AASN providers on
administrative and management issues (Skills Canberra 2019).
The number of AASN providers is also being consolidated, and new AASN contracts include
performance targets and feedback mechanisms to improve how AASNs collaborate with
STAs (DET 2018a; National Australian Apprenticeships Association, sub. 39; table 7.2).
Table 7.2 Consolidating the number of Australian Apprenticeship Support Network providers
Region Anticipated number of providers (2020–22)
Reduction since previous contract period
New South Wales 4 0
Victoria 4 -1
Queensland 4 0
South Australia 2 -1
Perth and Surrounds 3 -1
Outback Western Australia 2 -2
Tasmania 2 -1
ACT 1 -2
Torres Strait 1 0
Source: DESE (pers. comm., 1 April 2020).
Despite these efforts, there is modest room to improve the performance of AASN providers.
First, the scope of services the Commonwealth contracts AASN providers to perform could
be more transparent (Industry Skills Advisory Council NT, sub. 57). The Commonwealth
enters into individual contracts with providers, based on tenders, but State and Territory
governments are unable to see these contracts. The Commission understands that this has
led to some service duplication with STA field officers and registered training organisations
(RTOs). The Industry Skills Advisory Council NT noted that:
Mentoring and related apprenticeship support services within the Australian Apprenticeships
Support Network lack accountability to the key stakeholders. Employers are able to terminate an
employment relationship with an apprentice, bypassing mediation or support processes being
accessed. (sub. 57, p. 11)
As an immediate step, the Australian Government could publish more information on the
scope of services it contracts AASN providers to deliver. This would assist States,
Territories, GTOs and RTOs to better plan their services and avoid duplication.
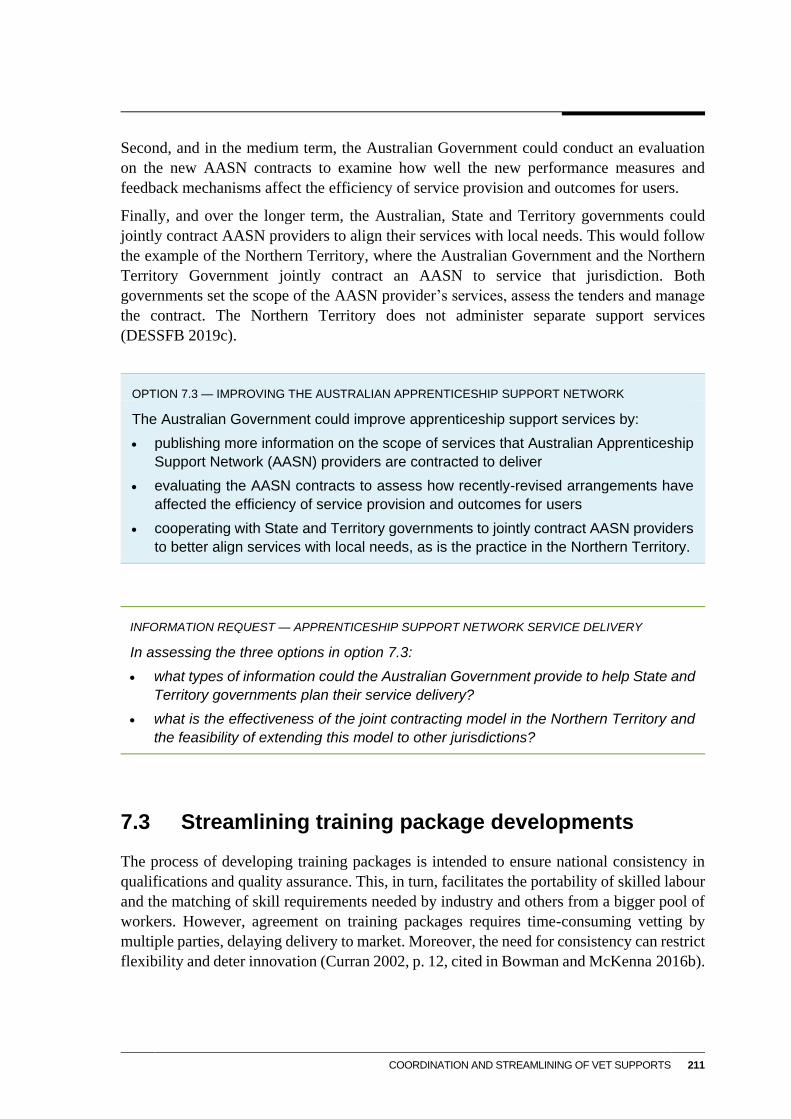
COORDINATION AND STREAMLINING OF VET SUPPORTS 211
Second, and in the medium term, the Australian Government could conduct an evaluation
on the new AASN contracts to examine how well the new performance measures and
feedback mechanisms affect the efficiency of service provision and outcomes for users.
Finally, and over the longer term, the Australian, State and Territory governments could
jointly contract AASN providers to align their services with local needs. This would follow
the example of the Northern Territory, where the Australian Government and the Northern
Territory Government jointly contract an AASN to service that jurisdiction. Both
governments set the scope of the AASN provider’s services, assess the tenders and manage
the contract. The Northern Territory does not administer separate support services
(DESSFB 2019c).
OPTION 7.3 — IMPROVING THE AUSTRALIAN APPRENTICESHIP SUPPORT NETWORK
The Australian Government could improve apprenticeship support services by:
publishing more information on the scope of services that Australian Apprenticeship
Support Network (AASN) providers are contracted to deliver
evaluating the AASN contracts to assess how recently-revised arrangements have
affected the efficiency of service provision and outcomes for users
cooperating with State and Territory governments to jointly contract AASN providers
to better align services with local needs, as is the practice in the Northern Territory.
INFORMATION REQUEST — APPRENTICESHIP SUPPORT NETWORK SERVICE DELIVERY
In assessing the three options in option 7.3:
what types of information could the Australian Government provide to help State and
Territory governments plan their service delivery?
what is the effectiveness of the joint contracting model in the Northern Territory and
the feasibility of extending this model to other jurisdictions?
7.3 Streamlining training package developments
The process of developing training packages is intended to ensure national consistency in
qualifications and quality assurance. This, in turn, facilitates the portability of skilled labour
and the matching of skill requirements needed by industry and others from a bigger pool of
workers. However, agreement on training packages requires time-consuming vetting by
multiple parties, delaying delivery to market. Moreover, the need for consistency can restrict
flexibility and deter innovation (Curran 2002, p. 12, cited in Bowman and McKenna 2016b).
212 NASWD REVIEW
Study participants acknowledged these tensions, raising two main concerns; the first on the
prescriptive detail of training package products preventing flexibility of training; and the
second on the cumbersome process of developing and updating training packages.
Tensions between training flexibility and consistency
Participants supported a nationally-consistent training system, but many raised concerns
about how consistency, flexibility and timeliness are balanced. Several submissions
commented on how training products are defined and delays in updating qualifications (for
example, Queensland Water Directorate, sub. 30; Australian Computer Society, sub. 49).
Other participants argued that the narrow definition of training package products —
qualifications and ‘units of competency’ targeted to job-specific skills and job readiness —
are a barrier to a flexible and adaptable VET system, and limit mobility across occupations
and industries (Hodge 2018; Schubert, Goedegebuure and Meek 2018). They pointed to the
fewer than 30 per cent of VET graduates working in the same occupation as their
qualification as a sign that narrowly focused training packages are not meeting labour market
needs (Moodie and Wheelahan 2018; Wheelahan and Moodie 2011).
It is not clear if these concerns are significant. While training packages set out in detail the
knowledge and skills needed in an occupation, students have some flexibility in how they
combine units of competency to form qualifications, and can choose nationally accredited
qualifications, courses and subjects outside of training packages to meet their needs. RTOs
also have the flexibility to decide how nationally recognised training is designed and delivered.
Further, VET graduate employment outcomes provide some evidence that training packages
are delivering skills needed by the labour market. About 60 per cent of graduates found their
qualification relevant to their current job or found employment in the occupation they trained
in, with only 12 per cent of graduates reporting their training was not relevant to their current
job (NCVER 2019l).48
In addition, informal and unaccredited training, including workplace training, provides
another way of developing skills. Indeed, employers are increasingly using unaccredited
training to meet specific training needs, including adapting to new technology. Surveys
conducted by the National Centre for Vocational Education Research (NCVER) show that
24 per cent of employers using unaccredited training in 2019 did so in response to new
technology, up from 12 per cent in 2017.49 In some cases, employers use competencies in
training packages as the basis for their unaccredited training (NSW Utilities and
Electrotechnology, sub. 31). For example, Skills Impact noted:
48 Graduates are those students who have been awarded a completed nationally recognised qualification,
including training package qualifications and accredited qualifications.
49 Almost half of all employers surveyed used unaccredited training, and of these, 87 per cent were satisfied
that the training met their skills needs (NCVER 2019c).
COORDINATION AND STREAMLINING OF VET SUPPORTS 213
… most training in the pulp and paper manufacturing industry is unaccredited, with accredited
training mainly used for licensed occupations … Regardless, companies of all sizes have
confirmed that their training is based on the qualifications and units of competency from the PPM
Pulp and Paper Manufacturing Training Package, which adds value both to workplace processes
and worker’s professional development (and therefore transferability). (sub. 28, p. 12)
Greater flexibility is expected to arise from the Australian Government’s acceptance of the
Noonan Review’s (Noonan et al. 2019) recommendation to develop guidelines to facilitate
the recognition of shorter-form credentials (such as micro-credentials).50
Taken together, the VET system and informal training avenues appear to provide enough
avenues to meet student, employer and RTO needs. However the Commission seeks further
input on problems caused by the approach to training package design and how these could
be addressed.
INFORMATION REQUEST — FLEXIBILITY ALLOWED BY TRAINING PACKAGES
How could the approach to developing training packages more effectively manage the
trade-offs between consistency and flexibility?
Timeliness is a concern, but it is being addressed
The current process for developing training packages is involved, with many players and
layers of supervision, including oversight by the COAG Skills Council and industry-led
content development (figure 7.3). As a result, the process is time consuming. The Joyce
Review found that, on average, it takes 12 months to develop a training package and it can
take years for the training package to be endorsed.
Joyce recommended a major shake-up of the process for developing and updating training
packages. In essence, Skills Organisations would replace and subsume the roles of the
Australian Industry and Skills Committee (AISC), Industry Reference Committees (IRCs)
and Skills Service Organisations (SSOs) and be responsible for developing training
packages for the Australian Skills Quality Authority’s (ASQA) approval (box 7.2). As
mentioned in section 7.2, the Australian Government is piloting Skills Organisations in
line with the Joyce Review’s recommendation.
50 The Noonan Review (2019) defined a micro-credential as a certification of assessed learning that is
additional, alternative or complementary to, or a component part of, a formal qualification.
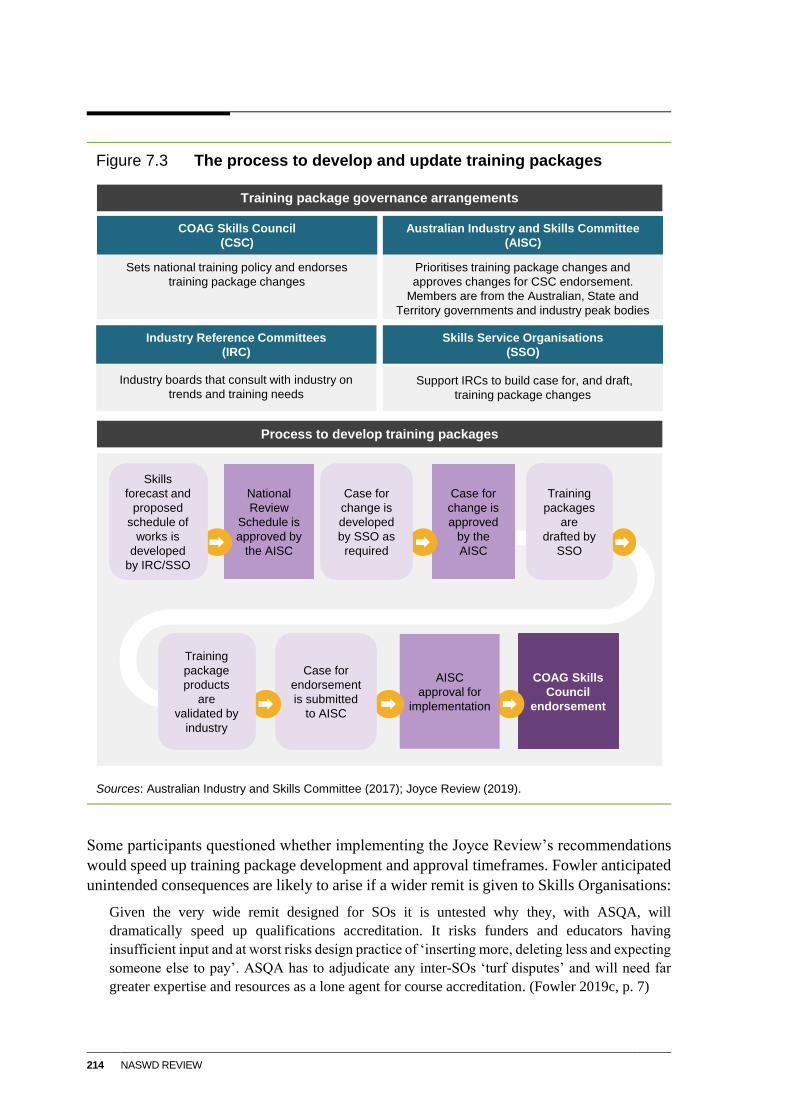
214 NASWD REVIEW
Figure 7.3 The process to develop and update training packages
Sources: Australian Industry and Skills Committee (2017); Joyce Review (2019).
Some participants questioned whether implementing the Joyce Review’s recommendations
would speed up training package development and approval timeframes. Fowler anticipated
unintended consequences are likely to arise if a wider remit is given to Skills Organisations:
Given the very wide remit designed for SOs it is untested why they, with ASQA, will
dramatically speed up qualifications accreditation. It risks funders and educators having
insufficient input and at worst risks design practice of ‘inserting more, deleting less and expecting
someone else to pay’. ASQA has to adjudicate any inter-SOs ‘turf disputes’ and will need far
greater expertise and resources as a lone agent for course accreditation. (Fowler 2019c, p. 7)
Training package governance arrangements
Prioritises training package changes and
approves changes for CSC endorsement.
Members are from the Australian, State and
Territory governments and industry peak bodies
Sets national training policy and endorses
training package changes
COAG Skills Council
(CSC)
Australian Industry and Skills Committee
(AISC)
Support IRCs to build case for, and draft,
training package changes
Industry boards that consult with industry on
trends and training needs
Industry Reference Committees
(IRC)
Skills Service Organisations
(SSO)
Process to develop training packages
National
Review
Schedule is
approved by
the AISC
Case for
change is
approved
by the
AISC
COAG Skills
Council
endorsement
Skills
forecast and
proposed
schedule of
works is
developed
by IRC/SSO
Case for
change is
developed
by SSO as
required
AISC
approval for
implementation
Case for
endorsement
is submitted
to AISC
Training
package
products
are
validated by
industry
Training
packages
are
drafted by
SSO
COORDINATION AND STREAMLINING OF VET SUPPORTS 215
Many participants argued that recently-established governance arrangements (which have
been in operation for three years) need time to settle in and, if given the chance, will deliver
palpable benefits (DESE 2020f; Fowler 2019b). Skills Impact, an SSO, went further,
claiming progress had already been made, noting the existing architecture operated much
faster than the previous system:
… under the current IRC/SSO model, units of competency and qualifications are being reviewed
and updated more regularly. As a result, many of the speed to market concerns have already been
addressed but are not yet recognised as being addressed. Nor has the IRC/SSO system been in
place long enough to develop a body of evidence to support this, and the organic improvement
of speed to market is only just starting to make an impact as the system settles into its rhythm.
(sub. 28, pp. 17–18)
There is some evidence to support claims that the timeliness of training package updates is
improving under the existing governance arrangements. Since 2016, the year the current
governance structure was introduced, the:
number of training packages has fallen from 77 to 59 (Joyce 2019)
number of nationally recognised qualifications has declined from 1611 to 1458 (Joyce 2019)
average time taken to develop and endorse training packages has fallen. For example,
changes to the Australian Meat Processing training package that commenced in 2017
took 23 months on average to complete, while those commencing in 2018 took
17 months (Skills Impact, pers. comm., 28 February 2020).
Efforts to further streamline training packages and their development within the existing
governance arrangements are continuing (box 7.5).
However, participants have also raised concerns about the performance of the existing
governance arrangements that will not be addressed by the proposed changes to streamline
training packages. In particular, participants pointed to the lengthy process for approving
training package changes. For example:
Another key issue that affects speed to market is the amount of review, support and endorsement
that needs to take place in order for a change to be approved. Skills Impact contends that the
bureaucracy associated with the endorsement process is a major barrier slowing the system down.
(Skills Impact, sub. 28, p. 18)
To accelerate the development and approval of training packages several participants
proposed that responsibility for approving straightforward, non-controversial or minor
changes to training packages be devolved from the AISC and COAG to IRCs (ACCI 2019;
DESE 2020f; Skills Impact; sub. 28). Examples include changes to skill sets or units of
competency that have well-established industry support. One participant also favoured
giving IRCs the power to endorse cases for change (instead of the AISC) where industry
identifies a new work standard or technology (Skills Impact, sub. 28).
216 NASWD REVIEW
Box 7.5 Proposed initiatives to streamline training packages
The COAG Skills Council’s Draft VET Reform Roadmap outlines reforms over the next five years
to streamline the VET system and to make it more responsive to changing workforce and industry
needs. Key reforms include:
reducing the number of training products
developing a framework for recognising micro-credentials
replacing the Standards for Training Packages and Accredited Courses with new standards
that are less prescriptive and complex
piloting new qualification models.
These reforms complement the Australian Industry and Skills Committee’s and the SSON’s
priorities to simplify training products and speed up training product development and approval
processes. The priorities include removing obsolete training products, promoting generic training
products where industry-specific content is not needed, reducing overly specific content in training
products and fast-tracking straightforward changes (AISC 2020).
Giving more power to IRCs to approve changes may reduce ministerial oversight of all
training package changes, but could take months off the time taken to update training
packages. While there should always be scope for judgement, it would seem prudent to
allow, as in other regulatory fields (planning, environmental management and others) less
control and supervision where it is commensurate with lower risks.
INTERIM RECOMMENDATION 7.1 — TRAINING PACKAGE UPDATE AND APPROVAL PROCESSES
Reforms planned or underway to streamline the development and updating of training
content should address most stakeholder concerns. To further improve the timeliness of
the process, the COAG Skills Council should consider delegating to Industry Reference
Committees the power to:
commission updates to training packages where there is an industry-agreed change
to work standards or a new technology
approve straightforward, non-controversial or minor changes to training packages.
7.4 Multiple regulators
The VET system has three main regulators of RTOs — ASQA, the Victorian Registration
and Qualifications Authority and the Training Accreditation Council in Western Australia.
Streamlining them into a single regulator is an option.
All regulators operate under the same framework for overseeing RTOs and accrediting
courses. ASQA is solely responsible for RTOs operating across jurisdictions and those
teaching international students (even when they operate in one jurisdiction). Further, ASQA
COORDINATION AND STREAMLINING OF VET SUPPORTS 217
and the two State-based regulators meet regularly to streamline their operations and discuss
common issues (Joyce 2019).
However, submitters to the Joyce and Braithwaite reviews and to this review have observed
that these arrangements do not work seamlessly and can create problems for both students
and RTOs. The Consumer Action Law Centre (2018), for example, observed that students
in Victoria and Western Australia have difficulty knowing where to lodge complaints about
a training provider. And the Independent Tertiary Education Council Australia (ITECA)
submitted:
Training providers operating across multiple jurisdictions face enormous complexity in the
design, administration, quality assurance and delivery of qualifications that are intended to hold
national portability and recognition. (sub. 53, p. 8)
Further, many RTOs consider there is duplication, inconsistency and overlap in regulatory
and reporting requirements between Commonwealth and State regulatory agencies, creating
unnecessary compliance costs and confusion. For example, the Victorian TAFE Association
asserted ASQA and the Victorian regulator often have different interpretations of regulatory
standards, which created uncertainty for RTOs. It stated that RTOs seeking clarification from
regulators are often ‘pushed [from one regulator] on to another, only to be pushed back
again’ (Victorian TAFE Association 2017, p. 5). RTOs also raised concerns about additional
reporting required by State and Territory governments as part of providing subsidised
courses to students (chapter 4).
These are not new issues, but they have renewed calls for a single training regulator to help
ensure a more ‘national’ training system. The Braithwaite Review (2018), for example,
considered a single regulator was important for improving the reputation of, and confidence
in, the vocational education sector as students, employers and RTOs would be confident that
training providers are all held to the same national standard.
On the other hand, the reason Victoria has kept its own regulator is because of a lack of
confidence in ASQA (Victorian Government, sub. 58, p. 5). Participants from Western
Australia considered that having a local regulator made it easier to align course accreditation
with local needs. For example, the Chamber of Commerce and Industry of Western Australia
(CCIWA) submitted:
While a single regulator for the system could be considered to provide a national public benefit,
this would have risks. A single national regulator would be detrimental for Western Australia,
given the recent under-performance of the Commonwealth regulator, … ASQA, and the practical
disadvantage faced by Western Australia in not being in close physical proximity to the
regulatory body. Furthermore, the ability for State-based regulators to accredit certain types of
qualifications based on specialised local needs provides distinct advantages for States with
unique skills requirements such as Western Australia. (sub. 54, p. 8)
However, there is nothing to preclude ASQA from accrediting local courses if there is a
demonstrated need. Moreover, those States and Territories that have referred regulatory
powers to the Commonwealth still have scope to address local skills needs. Tasmania, for
218 NASWD REVIEW
example, funds locally-approved skill sets based on training packages to respond to industry
needs. These skill sets accounted for 15 per cent of government-funded enrolments in 2017
(Tasmanian Government 2019).
On balance, there is merit in Victoria and Western Australia moving to a single national
model to improve the efficiency and consistency of training regulation. Doing so is unlikely
to materially constrain Victoria and Western Australia’s flexibility to meet local training
needs, but would reduce confusion for RTOs and students and reduce compliance burdens
for the sector. It is reasonable that Victorian and Western Australian stakeholders receive
some assurance on improvements to the national regulatory approach before their respective
governments refer their powers, and in the meantime, regulators should work together to
reduce inconsistencies in their regulatory interpretations.
INTERIM RECOMMENDATION 7.2 — QUALITY REGULATION
The Victorian and Western Australian Governments should ultimately follow other State
and Territory governments in referring regulation of training organisations to the
Australian Skills Quality Authority (ASQA).
In the first instance, ASQA, the Victorian Registration and Qualification Authority and
the Training Accreditation Council in Western Australia should seek to address
stakeholders’ concerns about inconsistencies and overlap in requirements between
regulators, including different interpretations of regulatory standards.
7.5 Information for VET students (and employers)
The VET system offers more than 1400 nationally recognised qualifications, other formal
credentials, and training in short courses (chapter 1). It is serviced by close to 4000 RTOs,
which may operate under different regulatory conditions depending on where they are
located and whether they teach international students. Easily accessible and curated
information on services that allows comparisons between courses and providers, and clear
understanding of the costs and obligations involved in training is critical in a
‘customer-centred’ VET training system.
Well-curated information helps students and employers to make informed training
decisions, which are more likely to result in them investing in education and training they
value and fulfilling their aspirations. Employers that recruit VET graduates and purchase
VET for their existing workforce also benefit from curated information on price and quality
of courses and RTOs.
The role of information and how it is provided takes on greater prominence in a VET system
that aims to instil competition among training providers — a reform direction of the NASWD
— and the efficient allocation of resources.
COORDINATION AND STREAMLINING OF VET SUPPORTS 219
While it is difficult to get the detail and balance of information right, there is room for
improvement in the information that is available and in the way it is offered. Participants to
this review noted:
there is a ‘great deal of information, but it is scattered across a range of websites and
poor information has ‘stymied a learner-centric approach and contributed to poor
decisions on the part of learners’ (BCA, sub. 16, pp. 6, 8). The NSW Utilities and
Electrotechnology Industry Training Advisory Body asserted that it ‘would take a
mathematical genius to navigate the myriad of initiatives … to find the actual and
authoritative information required’ (sub. 31, p. 7)
the absence of a reliable, government-recognised information hub was leading early
childhood education students to rely on information provided by RTOs, which is partial
and does not enable students to make informed decisions about courses and providers
(Australian Childcare Alliance, sub. 46)
both students and employers ‘face a complex choice between a plethora of courses and
numerous providers. The connection with employment opportunities, whether there is a
return on out of pocket costs and the quality of training on offer is often unclear’ (South
Australian Government, sub. 11, p. 5).
Students are missing key information to make training decisions
Students receive an abundance of information from various governments, as well as
privately-run websites that publish labour market prospects, and training and career options
(Joyce 2019; box 7.6). But these websites often present conflicting advice.
Past reviews have found that students need consistent information on course entry
requirements, course length, employment outcomes, subsidies and fees (Braithwaite 2018).
Prospective students also need information tailored to their circumstances, for example:
school students need information to help them identify their interests, values and skills,
and how these link to suitable education, training and occupation options (Gore et
al. 2017)
mature-aged individuals considering upskilling or reskilling need information about
future occupational trends, the transferability of their skills and experience, and reskilling
opportunities (Griffin and Beddie 2011).
220 NASWD REVIEW
Box 7.6 The myriad sources of VET information
The Commonwealth has a range of websites providing career and training information, including:
the My Skills website, which provides a national directory of RTOs and courses
the Australian Apprenticeships website, which is a hub for apprentices and employers
Job Outlook, which provides careers and labour market information by region
the Labour Market Information Portal, which provides labour force projections and vacancy data
Job Jumpstart, which offers a ‘single source’ of information for young people wanting career
and job search information
Quality Indicators for Learning and Teaching, which publishes information about higher
education graduate outcomes
Course Seeker, which provides information on higher education entry requirements
together with the States and Territories, the myfuture website, which is described as Australia’s
national career information service.
State and Territory governments also have their own websites with careers guidance, labour
market information and education and training options. For example, New South Wales’
Skills Portal and Victoria’s Skills Gateway allow students to search and compare occupations,
while the ACT’s Pathways website assists individuals in career planning and transitions.
Private organisations also publish skills and careers advice, for example the New South Wales
Business Chamber’s Skillsroad seeks to ease transitions from school to further study or work,
and SEEK has a dedicated website for training options.
Source: Joyce (2019).
Publicly available information does not provide sufficient information of this type. National
initiatives set up to be the main source of information for VET students, such as the My Skills
platform, does not have accurate pricing information. There is no requirement for RTOs to
publish pricing information unless they offer VET Student Loans, and even then there is no
mechanism to ensure prices are up-to-date. Only about one in five RTOs provide price
information on My Skills for some training.51 And students cannot make easy comparisons
between VET and higher education qualifications and providers (BCA, sub. 16; University
of Wollongong, sub. 19).
… information is generally not across VET and [higher education]. For example, if someone was
interested in engineering, they would need to move between My Skills and [Quality Indicators
for Learning and Teaching], or the newer site, to look at the differences between the VET and
[higher education] qualifications, and they would then have to go to each provider’s website to
get additional information. (BCA, sub. 16, p. 8)
The lack of useful, consistent and impartial information contributes to students’ poor training
decisions. For example, Gore et al. (2017) found that lack of understanding of VET offerings
51 Based on data drawn from myskills.gov.au on 7 May 2020. Data is provided voluntarily by providers and
may be incomplete or out-of-date. Providers can display a course price at none, some or all of their
locations. Totals do not include data for providers that request their profile not be viewable on My Skills.
COORDINATION AND STREAMLINING OF VET SUPPORTS 221
led to a misalignment between students’ occupational aspirations and their education
intentions, with some students intending to pursue university pathways despite aspiring to
an occupation that required VET qualifications, and vice versa.
How information is presented matters
Students need information conveyed in ways that are salient, granular enough, trusted, used
and interpreted correctly (Loewenstein, Sunstein and Golman 2014; Saniter and
Siedler 2014; Weil et al. 2006; Winston 2008). To be effective, online information needs to
be better than the myriad of informal avenues that students already comfortably use to
acquire information that reflects their local area and preferences — such as word of mouth
from trusted parties, websites, and guides (Brown 2017, p. 37).
Information provision should be user tested to ensure it is effective. The principle that the
design of the method for disseminating information is as important as the information itself is
widely recognised in several areas, including health, safety, and finance. It has been shown in
these areas that poorly-designed dissemination of even factual information can generate
adverse outcomes. For example, the Behavioural Economics Team of the Australian
Government found that presenting information about retirement income plans in tables with
simple text-based descriptions of the key features of plans was more effective than tables
showing numerical estimates. Presenting information in a simpler way helped improve
superannuation members’ understanding of products and align choices with preferences
(Australian Government 2017b).
In addition to meeting the design criteria above, effective use of information depends on
students’ inherent skills. As Brown put it:
… these data appear to reinforce the importance of equipping students with the skills and
knowledge needed to navigate, access and interpret information at the course level (across RTOs)
and at the course and RTO level (within specific RTOs) in order to make informed decisions.
(2017, p. 38)
It is conceivable that an online portal might improve this kind of literacy.
Improving the provision of VET information
As with other prospective areas for governments to coordinate and streamline their support
for VET, some initiatives are already being put in place to enhance the provision of VET
information.
The draft VET Reform Roadmap gives prominence to quality frameworks, but is vague
about their content. Such a framework could consider ratings systems of providers,
supplemented by more specific information about their performance. This may be useful for
customers in making their choices, including in trading off one aspect of a provider, say their
proximity, against another, such as the quality of their student supports. Ratings systems can
222 NASWD REVIEW
encourage more responsive customer services. Such rating systems are used in Australia for
employment services (Jobactive) and disability services, and overseas for key human
services, such as hospitals and aged care facilities. There could be pitfalls in performance
metrics as they can sometimes have perverse incentives (such as to maximise completions
or to ‘cream skim’ the best students). However, this suggests that the metrics should be well
designed, not that they be dismissed without consideration.
Investigation of the merits and nature of any rating system would fall naturally to the
Australian Government’s National Careers Institute (NCI) — whose creation stemmed from
the recommendations of the Joyce Review (DESSFB 2020a) — and would be aligned with
its objectives. The main objectives of the NCI are to:
be a single, authoritative source of careers information
promote VET
consolidate existing Commonwealth careers information sources and improve linkages
between administrative datasets
create a digital platform that enables students to easily find accurate information on
training and career options and addresses inconsistency in government-provided
information (DESSFB 2019b).
Participants to this study were very supportive of the establishment of the NCI (Year13,
sub. 8; ACCI, sub. 33).
The NCI is consulting with stakeholders and undertaking market research to inform its role
and priorities in preparation for the launch of its digital platform in July 2020. The NCI’s
recent statements indicate it recognises that students need different types of information
across their working lives to make informed decisions; and that the way information is
delivered is just as important as the information itself (DESSFB 2019b). For example, the
NCI is exploring how students and career advisors source information, their motivations,
how they feel when they search for information, and what delivery modes they prefer
(DESE 2020a; DESSFB 2019b).
Participants in this review also proposed ways that the NCI could improve the quality of
careers and training information. These included:
tailoring information to different types of users, such as young people, careers advisors,
matured-aged workers looking to upskill or retrain (Year 13, sub. 8; BCA, sub. 16)
allowing easy comparison with higher education qualifications and providers (BCA,
sub. 16; University of Wollongong, sub. 19).
The Commission considers the NCI should extend its work on information provision to
fill gaps in the information available on course prices and subsidies. State and Territory
governments should work with the Commonwealth to reduce duplication and
inconsistent information, establishing the NCI as a central information hub. Moreover,
provision of information has to extend beyond provision to methods of disclosure that
COORDINATION AND STREAMLINING OF VET SUPPORTS 223
change behaviour — no easy task — but one that could be adopted by the NCI. The
Commission supports the NCI’s efforts to test the effectiveness of different methods of
information presentation and delivery.
INTERIM RECOMMENDATION 7.3 — IMPROVING THE PROVISION OF VET INFORMATION
The National Careers Institute should extend its work on information provision to fill
significant information gaps in course prices, subsidies and RTO quality, and test that
information is salient to students, trusted, used and interpreted correctly.
Australian, State and Territory governments should work together to establish the
Institute as a central information hub.

CONDUCT OF THE REVIEW 225
A Conduct of the review
The Commission received the terms of reference for this review on 15 November 2019. It
subsequently released an issues paper on 22 November 2019 inviting public submissions and
highlighting particular matters on which it sought information.
In total, 63 public submissions were received and placed on the review website. A list of all
public submissions is contained in table A.1. The Commission also received two brief
comments, and these are also available on the website.
During the course of the review, the Commission held informal consultations and discussions
with Australian, State and Territory government officials, regulatory bodies, industry groups
and agencies, service providers and academics, as well as a number of individuals and
organisations from a variety of backgrounds. Table A.2 lists these participants.
The Commission would like to thank all those who contributed to this review.
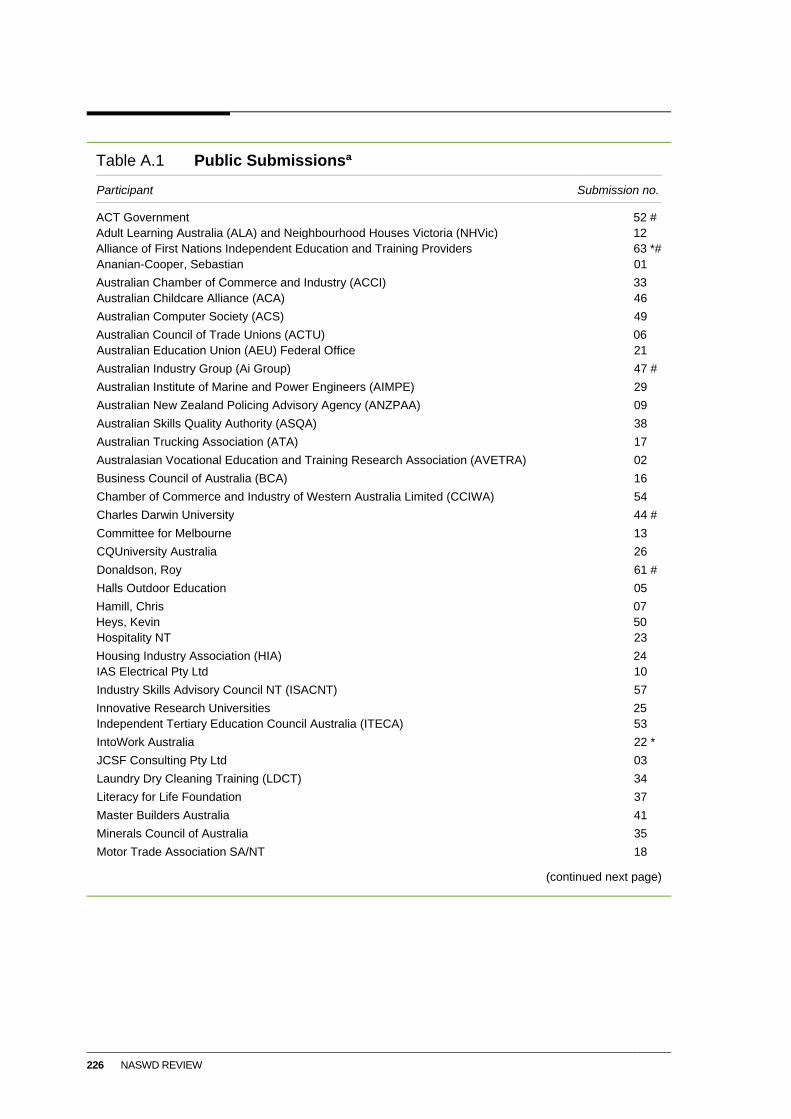
226 NASWD REVIEW
Table A.1 Public Submissionsª
Participant Submission no.
ACT Government 52 #
Adult Learning Australia (ALA) and Neighbourhood Houses Victoria (NHVic) 12
Alliance of First Nations Independent Education and Training Providers 63 *#
Ananian-Cooper, Sebastian 01
Australian Chamber of Commerce and Industry (ACCI) 33
Australian Childcare Alliance (ACA) 46
Australian Computer Society (ACS) 49
Australian Council of Trade Unions (ACTU) 06
Australian Education Union (AEU) Federal Office 21
Australian Industry Group (Ai Group) 47 #
Australian Institute of Marine and Power Engineers (AIMPE) 29
Australian New Zealand Policing Advisory Agency (ANZPAA) 09
Australian Skills Quality Authority (ASQA) 38
Australian Trucking Association (ATA) 17
Australasian Vocational Education and Training Research Association (AVETRA) 02
Business Council of Australia (BCA) 16
Chamber of Commerce and Industry of Western Australia Limited (CCIWA) 54
Charles Darwin University 44 #
Committee for Melbourne 13
CQUniversity Australia 26
Donaldson, Roy 61 #
Halls Outdoor Education 05
Hamill, Chris 07
Heys, Kevin 50
Hospitality NT 23
Housing Industry Association (HIA) 24
IAS Electrical Pty Ltd 10
Industry Skills Advisory Council NT (ISACNT) 57
Innovative Research Universities 25
Independent Tertiary Education Council Australia (ITECA) 53
IntoWork Australia 22 *
JCSF Consulting Pty Ltd 03
Laundry Dry Cleaning Training (LDCT) 34
Literacy for Life Foundation 37
Master Builders Australia 41
Minerals Council of Australia 35
Motor Trade Association SA/NT 18
(continued next page)
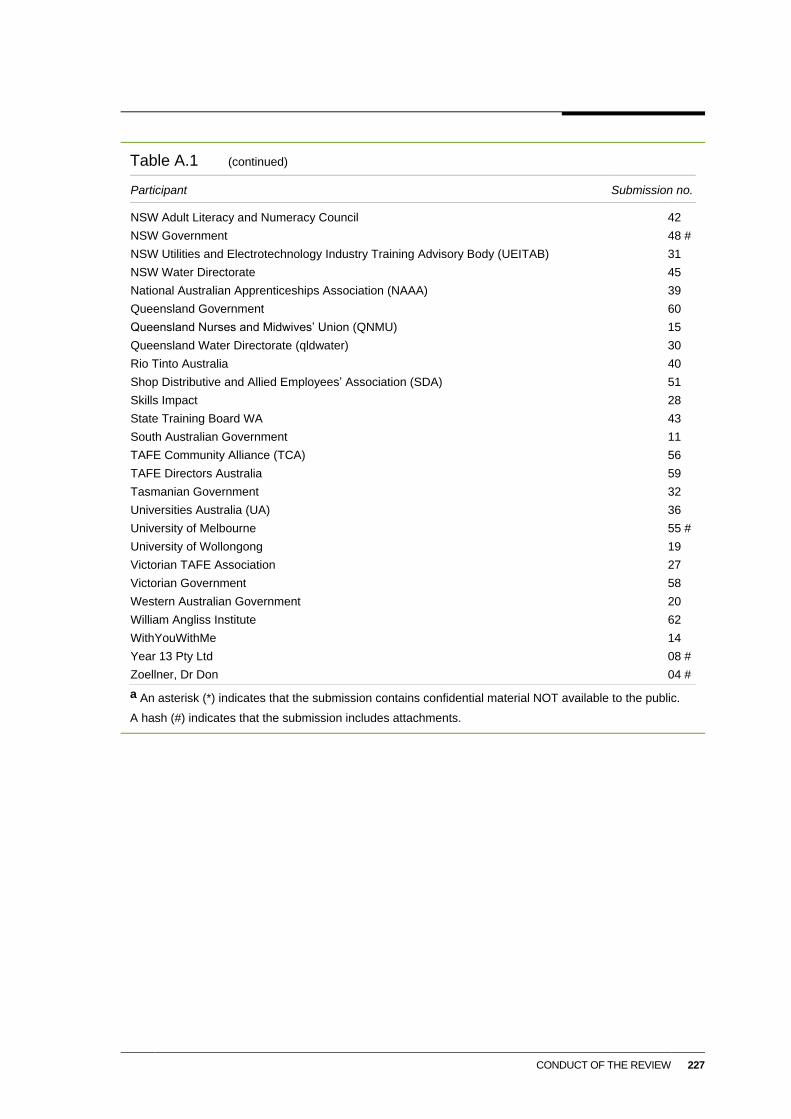
CONDUCT OF THE REVIEW 227
Table A.1 (continued)
Participant Submission no.
NSW Adult Literacy and Numeracy Council 42
NSW Government 48 #
NSW Utilities and Electrotechnology Industry Training Advisory Body (UEITAB) 31
NSW Water Directorate 45
National Australian Apprenticeships Association (NAAA) 39
Queensland Government 60
Queensland Nurses and Midwives’ Union (QNMU) 15
Queensland Water Directorate (qldwater) 30
Rio Tinto Australia 40
Shop Distributive and Allied Employees’ Association (SDA) 51
Skills Impact 28
State Training Board WA 43
South Australian Government 11
TAFE Community Alliance (TCA) 56
TAFE Directors Australia 59
Tasmanian Government 32
Universities Australia (UA) 36
University of Melbourne 55 #
University of Wollongong 19
Victorian TAFE Association 27
Victorian Government 58
Western Australian Government 20
William Angliss Institute 62
WithYouWithMe 14
Year 13 Pty Ltd 08 #
Zoellner, Dr Don 04 #
a An asterisk (*) indicates that the submission contains confidential material NOT available to the public.
A hash (#) indicates that the submission includes attachments.
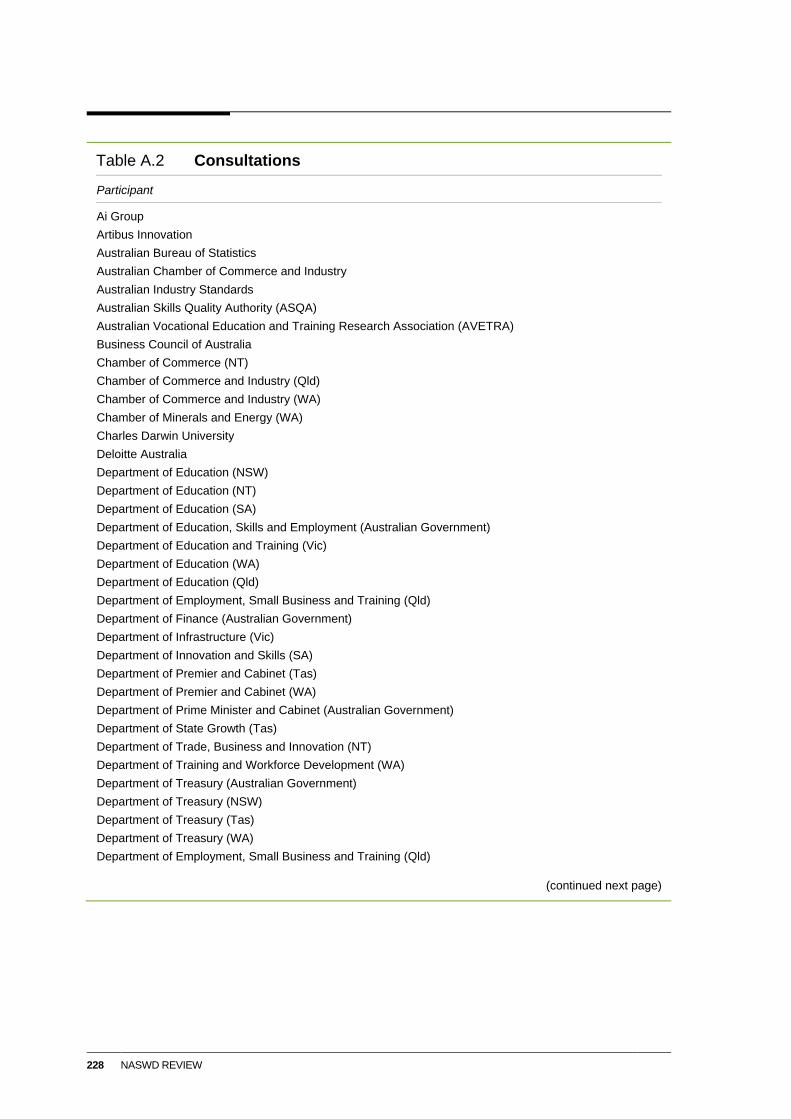
228 NASWD REVIEW
Table A.2 Consultations
Participant
Ai Group
Artibus Innovation
Australian Bureau of Statistics
Australian Chamber of Commerce and Industry
Australian Industry Standards
Australian Skills Quality Authority (ASQA)
Australian Vocational Education and Training Research Association (AVETRA)
Business Council of Australia
Chamber of Commerce (NT)
Chamber of Commerce and Industry (Qld)
Chamber of Commerce and Industry (WA)
Chamber of Minerals and Energy (WA)
Charles Darwin University
Deloitte Australia
Department of Education (NSW)
Department of Education (NT)
Department of Education (SA)
Department of Education, Skills and Employment (Australian Government)
Department of Education and Training (Vic)
Department of Education (WA)
Department of Education (Qld)
Department of Employment, Small Business and Training (Qld)
Department of Finance (Australian Government)
Department of Infrastructure (Vic)
Department of Innovation and Skills (SA)
Department of Premier and Cabinet (Tas)
Department of Premier and Cabinet (WA)
Department of Prime Minister and Cabinet (Australian Government)
Department of State Growth (Tas)
Department of Trade, Business and Innovation (NT)
Department of Training and Workforce Development (WA)
Department of Treasury (Australian Government)
Department of Treasury (NSW)
Department of Treasury (Tas)
Department of Treasury (WA)
Department of Employment, Small Business and Training (Qld)
(continued next page)
CONDUCT OF THE REVIEW 229
Table A.2 (continued)
Participant
Education, Economic Development, Economic and Financial, and General Policy and Cabinet Directorates (ACT Government)
Expert Panel on Skills
Hospitality NT
Independent Tertiary Education Council Australia (ITECA)
Industry Skills Advisory Council (NT)
Literacy for Life Foundation
National Centre for Vocational Education Research (NCVER)
National Skills Commissioner
Noonan, Professor Peter, Mitchell Institute for Education and Health Policy
NSW Education Standards Authority
NSW Productivity Commission
NSW Skills Board
Peta Furnell Consulting
Queensland Training Ombudsman
Resources Industry Training Council (WA)
Steven Joyce Advisory
Skills Canberra
Skills Impact
Skills Tasmania
TAFE Directors Australia
Tertiary Education Quality and Standards Agency (TEQSA)
Training Accreditation Council (WA)
Training and Skills Commission (SA)
The Pivot Institute
Victorian Skills Commissioner
Work and Training (Tas)
Year 13

THE NASWD 231
B The NASWD
The National Agreement for Skills and Workforce Development (NASWD)52 is the most
recent of a series of intergovernmental agreements between the Australian, State and Territory
governments seeking to ensure effective governance and development of vocational education
and skills system. These types of intergovernmental arrangements date from the 1970s when
the Australian Government first identified education as a national priority.
The 2009 NASWD is a schedule to the Intergovernmental Agreement on Federal Financial
Relations (IGA FFR), and was established alongside new National Agreements on health
(healthcare and health), education, disability services, housing and homelessness, and
Indigenous reforms (COAG 2009a). The IGA FFR sought to address two key features of
Australia’s federal system:
vertical fiscal imbalance, where State and Territory governments have large expenditure
responsibilities relative to their revenue-raising capacities, and therefore rely on financial
transfers from the Australian Government
the shared interests and potential for overlap in the roles and responsibilities of the
Australian, State and Territory governments.
The IGA FFR recognised State and Territory governments’ primary responsibility for
service delivery, as well as the necessity for coordinated action by governments to address
economic and social challenges of national concern.
Under the IGA FFR, restrictions on the major specific purpose payments (SPPs) from the
Australian Government to the States and Territories were removed or broadened in favour
of agreements on shared outcomes (COAG 2009b). Separate to the NASWD, the IGA FFR
sets out a National Skills and Workforce Development Specific Purpose Payment, which
provides for the SPP amount allocated by the Australian Government to the States and
Territories to increase each year in accordance with composite wage/price indexes
(COAG 2009a, Appendix D). This amount is distributed to each State and Territory
government based on its population share.
The IGA FFR structure also provides for National Partnerships, agreements that support
the delivery of specified projects, facilitate reforms or reward those jurisdictions that
deliver on nationally significant reforms. Project Agreements are a simpler form of
National Partnership, for low value and/or low risk projects. National Partnerships and
Project Agreements are typically time-limited. Funding for National Partnerships can
52 The revised 2012 version of the NASWD can be found at http://www.federalfinancialrelations.gov.au/
content/npa/skills/national-partnership/skills-reform_NA.pdf.
232 NASWD REVIEW
include funding conditions and incentive payments for achievement of milestones or
performance benchmarks.
The NASWD shares outcomes and objectives with other national agreements under the
IGA FFR. For example, the National Indigenous Reform Agreement established specific
outcomes for reducing the level of disadvantage experienced by Indigenous Australians
(COAG 2012b), and the agreement required reporting of Indigenous participation under
several of the overall NASWD indicators that assess access to training.
Under the National Disability Agreement, all Australian governments agreed to ‘improve
provision of skills and opportunities to enhance the capability of people with disability to
participate in social, economic and community activities’ (COAG 2009c). Similarly, the
National School Reform Agreement signed in late 2018 specified outcomes that are relevant
for skills and workforce development — for example, ensuring that students gain the skills
they need to transition to further study and/or work — and sets targets that complement those
in the NASWD — for example, lifting the Year 12 (equivalent) or Certificate III attainment
rate to 90 per cent by 2020 (COAG 2018).
B.1 Key elements of the NASWD
Governments’ overarching objectives for the vocational education and training (VET)
system were expressed in the 2009 NASWD:
13. All working aged Australians have the opportunity to develop the skills and qualifications
needed, including through a responsive training system, to enable them to be effective
participants in and contributors to the modern labour market.
14. Individuals are assisted to overcome barriers to education, training and employment, and are
motivated to acquire and utilise new skills.
15. Australian industry and businesses develop, harness and utilise the skills and abilities of the
workforce. (COAG 2009b, pp. 4–5)
Although the VET system serves a variety of learning purposes (appendix C), the NASWD
focuses on its role in conferring skills that improve labour market prospects and outcomes.
The NASWD specifies roles and responsibilities for the two levels of government, consistent
with this objective and the philosophy of the IGA FFR.
The Australian Government provides funding to the States and Territories to support their
training systems and provides specific interventions and assistance for industry
investment, apprenticeships, literacy and numeracy and to those seeking to enter the
workforce. It also publishes the Annual National Report and ensures data are collected
and published.
The States and Territories determine the allocation of VET funding within their
jurisdictions, oversee expenditure and ensure the efficient operation of their training
market.
THE NASWD 233
Regulation of registered training organisations (RTOs), quality assurance, data
provision, industry support, reform directions and establishing strategic policy initiatives
are described as shared responsibilities (COAG 2009b, 2012b).
The division of roles and responsibilities puts boundaries around the degree of national
intervention in the funding arrangements for providers, while describing areas of joint
interest where there were anticipated to be significant national labour market and system
performance issues at play.
This approach was significantly different from the agreement immediately preceding the
NASWD, the Commonwealth-State Agreement for Skilling Australia’s Workforce
(CSASAW). The CSASAW required greater accountability for Commonwealth investment
in VET and required States and Territories to submit plans to the Commonwealth Minister
setting out how the funds would be spent and what would be achieved.
The CSASAW arrangements were seen as burdensome, overly prescriptive about how
jurisdictions should deliver training and unclear on the roles and responsibilities of the States
and Territories (COAG 2008). The aim of the NASWD was a more high-level approach,
outlining what should be achieved in the sector rather than how. COAG outlined a number
of benefits it hoped would be achieved through the agreement (COAG 2008):
improved public accountability with an outcomes-based reporting framework
greater flexibility to respond to individual State and Territory needs
clearer roles and responsibilities for all governments
improved funding certainty for the States and Territories
fairer distribution of funding between jurisdictions
reduced administrative costs.
Accountability for the achievement of objectives was to be achieved through public
reporting of agreed indicators. Advice on progress would be requested by COAG from a
new body, the COAG Reform Council. The COAG Reform Council was also to report to
COAG on specific measures attached to National Partnership Agreements, particularly
where funding was conditional on achievement of outcomes. The Ministerial Council for
Vocational and Technical Education had overall responsibility for the national training
system, on behalf of COAG.
The NASWD set out two key national targets related to the VET sector:
halving the proportion of Australians aged between 20 and 64 years without
qualifications at Certificate III level and above between 2009 and 2020
doubling the number of higher level qualifications completions (Diploma and Advanced
Diploma) between 2009 and 2020.
234 NASWD REVIEW
The outcomes agreed in the 2009 NASWD were:
reducing gaps in foundation skills among the working age population to enable effective
educational, labour market and social participation
ensuring that the working age population has the depth and breadth of skills and
capabilities required for the 21st century labour market
that the supply of skills provided by the national training system responds to meet
changing labour market demand
skills are used effectively to increase labour market efficiency, productivity, innovation
and ensure increased utilisation of human capital (COAG 2009b).
The NASWD also set out output measures and proxy outcome measures. As part of the
agreement, the States and Territories agreed to maintain levels of overall enrolments and
completions, and enrolments and completions by Aboriginal and Torres Strait Islander
Australians, at average levels (calculated between 2004 and 2006 or 2005 and 2007) in the
period from 2009 to 2012.
The challenges of measuring the specified outcomes were considered by the COAG Reform
Council in 2009, with a number of deficiencies identified. Development continued on the
measures in the lead up to the 2012 revisions to the NASWD, which resulted in the
performance framework in the present agreement, with revised outcome indicators and no
output measures.
Changes in 2012
The NASWD was revised in 2012 following changes in economic conditions — including
the global financial crisis, rapid structural change and industry restructuring. The 2012
NASWD, and the associated National Partnership Agreement on Skills Reform, provided
for a student entitlement to training, wherever the training is undertaken, with the intention
of increasing competition and user choice in the VET system.
The overall objective in the NASWD was streamlined and focussed more specifically on the
training system as a whole.
18. The objective of this National Agreement is a VET system that delivers a productive and
highly skilled workforce and which enables all working age Australians to develop the skills and
qualifications needed to participate effectively in the labour market and contribute to Australia’s
economic future; and supports the achievement of increased rates of workforce participation.
(COAG 2012b, p. 4)
The revised 2012 agreement retained the main elements of the original agreement, including
the targets. The roles and responsibilities of the parties were largely unchanged and are set
out in box B.1.
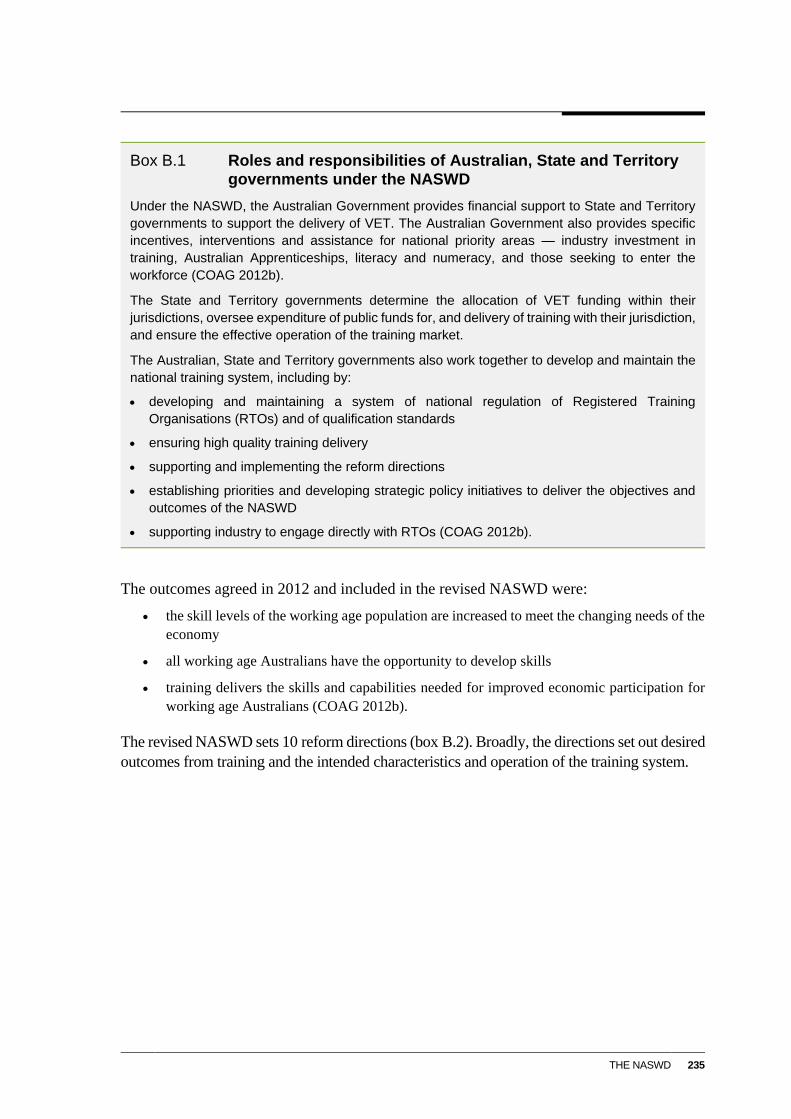
THE NASWD 235
Box B.1 Roles and responsibilities of Australian, State and Territory governments under the NASWD
Under the NASWD, the Australian Government provides financial support to State and Territory
governments to support the delivery of VET. The Australian Government also provides specific
incentives, interventions and assistance for national priority areas — industry investment in
training, Australian Apprenticeships, literacy and numeracy, and those seeking to enter the
workforce (COAG 2012b).
The State and Territory governments determine the allocation of VET funding within their
jurisdictions, oversee expenditure of public funds for, and delivery of training with their jurisdiction,
and ensure the effective operation of the training market.
The Australian, State and Territory governments also work together to develop and maintain the
national training system, including by:
developing and maintaining a system of national regulation of Registered Training
Organisations (RTOs) and of qualification standards
ensuring high quality training delivery
supporting and implementing the reform directions
establishing priorities and developing strategic policy initiatives to deliver the objectives and
outcomes of the NASWD
supporting industry to engage directly with RTOs (COAG 2012b).
The outcomes agreed in 2012 and included in the revised NASWD were:
the skill levels of the working age population are increased to meet the changing needs of the
economy
all working age Australians have the opportunity to develop skills
training delivers the skills and capabilities needed for improved economic participation for
working age Australians (COAG 2012b).
The revised NASWD sets 10 reform directions (box B.2). Broadly, the directions set out desired
outcomes from training and the intended characteristics and operation of the training system.
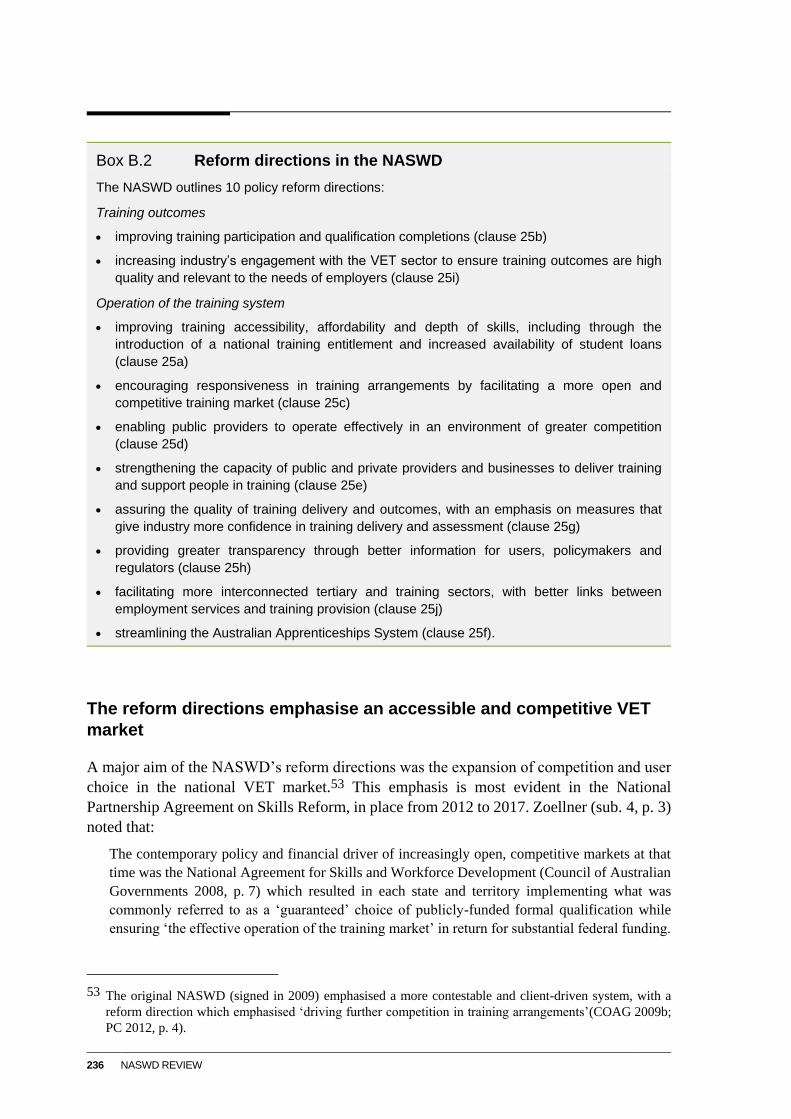
236 NASWD REVIEW
Box B.2 Reform directions in the NASWD
The NASWD outlines 10 policy reform directions:
Training outcomes
improving training participation and qualification completions (clause 25b)
increasing industry’s engagement with the VET sector to ensure training outcomes are high
quality and relevant to the needs of employers (clause 25i)
Operation of the training system
improving training accessibility, affordability and depth of skills, including through the
introduction of a national training entitlement and increased availability of student loans
(clause 25a)
encouraging responsiveness in training arrangements by facilitating a more open and
competitive training market (clause 25c)
enabling public providers to operate effectively in an environment of greater competition
(clause 25d)
strengthening the capacity of public and private providers and businesses to deliver training
and support people in training (clause 25e)
assuring the quality of training delivery and outcomes, with an emphasis on measures that
give industry more confidence in training delivery and assessment (clause 25g)
providing greater transparency through better information for users, policymakers and
regulators (clause 25h)
facilitating more interconnected tertiary and training sectors, with better links between
employment services and training provision (clause 25j)
streamlining the Australian Apprenticeships System (clause 25f).
The reform directions emphasise an accessible and competitive VET
market
A major aim of the NASWD’s reform directions was the expansion of competition and user
choice in the national VET market.53 This emphasis is most evident in the National
Partnership Agreement on Skills Reform, in place from 2012 to 2017. Zoellner (sub. 4, p. 3)
noted that:
The contemporary policy and financial driver of increasingly open, competitive markets at that
time was the National Agreement for Skills and Workforce Development (Council of Australian
Governments 2008, p. 7) which resulted in each state and territory implementing what was
commonly referred to as a ‘guaranteed’ choice of publicly-funded formal qualification while
ensuring ‘the effective operation of the training market’ in return for substantial federal funding.
53 The original NASWD (signed in 2009) emphasised a more contestable and client-driven system, with a
reform direction which emphasised ‘driving further competition in training arrangements’(COAG 2009b;
PC 2012, p. 4).
THE NASWD 237
When the NASWD was revised in 2012, there were no explicit commitments in the
agreement on output or funding levels. These elements were incorporated into the National
Partnership Agreement on Skills Reform.
These reforms built on a history of competition-based reforms in VET by governments since
the 1990s, including establishing a national VET system architecture to facilitate the
development of a national VET market (box B.3).
As a continuation of this ongoing national reform agenda, the NASWD and the National
Partnership sought to improve:
market design across jurisdictions to provide greater user choice and improve the
accessibility of training, through income contingent loans (ICLs) and entitlement
schemes (akin to a voucher system) (clause 25a)
the efficiency and responsiveness of supply, through greater contestability of funding
and support for public providers to operate in a more competitive environment
(clauses 25c, d and e)
the underlying system architecture, particularly in relation to quality concerns, and the
information available to students and governments (clauses 25g and h).
The National Partnership was intended to support about 375 000 additional students over
five years to complete their qualifications, and improve training enrolments and completions
in high-level skills and among key groups of disadvantaged students, including Aboriginal
and Torres Strait Islander Australians (COAG 2012b). The training entitlement to a
government-subsidised training place extended to at least the first Certificate III qualification
and income contingent loans were made available for government-subsidised Diploma and
Advanced Diploma students. The My Skills website was to be developed, so students and
employers could make better choices about training.
Overall, the 2012 NASWD aimed to create a more agile training system that ‘is responsive
to contemporary economic conditions; and meets the skills needs of the economy and
industry and the preferences of students’ (COAG 2011, p. 4).
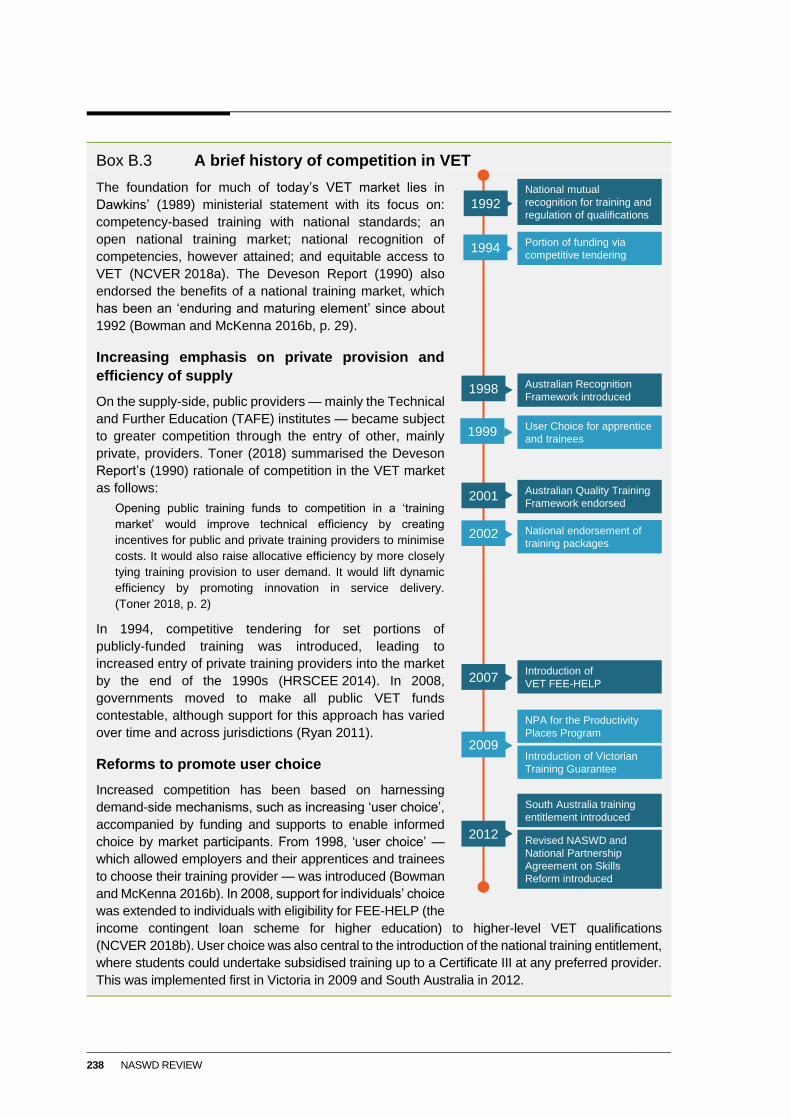
238 NASWD REVIEW
Box B.3 A brief history of competition in VET
The foundation for much of today’s VET market lies in
Dawkins’ (1989) ministerial statement with its focus on:
competency-based training with national standards; an
open national training market; national recognition of
competencies, however attained; and equitable access to
VET (NCVER 2018a). The Deveson Report (1990) also
endorsed the benefits of a national training market, which
has been an ‘enduring and maturing element’ since about
1992 (Bowman and McKenna 2016b, p. 29).
Increasing emphasis on private provision and
efficiency of supply
On the supply-side, public providers — mainly the Technical
and Further Education (TAFE) institutes — became subject
to greater competition through the entry of other, mainly
private, providers. Toner (2018) summarised the Deveson
Report’s (1990) rationale of competition in the VET market
as follows:
Opening public training funds to competition in a ‘training
market’ would improve technical efficiency by creating
incentives for public and private training providers to minimise
costs. It would also raise allocative efficiency by more closely
tying training provision to user demand. It would lift dynamic
efficiency by promoting innovation in service delivery.
(Toner 2018, p. 2)
In 1994, competitive tendering for set portions of
publicly-funded training was introduced, leading to
increased entry of private training providers into the market
by the end of the 1990s (HRSCEE 2014). In 2008,
governments moved to make all public VET funds
contestable, although support for this approach has varied
over time and across jurisdictions (Ryan 2011).
Reforms to promote user choice
Increased competition has been based on harnessing
demand-side mechanisms, such as increasing ‘user choice’,
accompanied by funding and supports to enable informed
choice by market participants. From 1998, ‘user choice’ —
which allowed employers and their apprentices and trainees
to choose their training provider — was introduced (Bowman
and McKenna 2016b). In 2008, support for individuals’ choice
was extended to individuals with eligibility for FEE-HELP (the
income contingent loan scheme for higher education) to higher-level VET qualifications
(NCVER 2018b). User choice was also central to the introduction of the national training entitlement,
where students could undertake subsidised training up to a Certificate III at any preferred provider.
This was implemented first in Victoria in 2009 and South Australia in 2012.
National mutual
recognition for training and
regulation of qualifications
Australian Recognition
Framework introduced
Australian Quality Training
Framework endorsed
Introduction of
VET FEE-HELP
Portion of funding via
competitive tendering
User Choice for apprentice
and trainees
National endorsement of
training packages
NPA for the Productivity
Places Program
Introduction of Victorian
Training Guarantee
South Australia training
entitlement introduced
Revised NASWD and
National Partnership
Agreement on Skills
Reform introduced
1994
1992
1998
1999
2007
2009
2012
2002
2001

THE NASWD 239
B.2 Other national partnerships and program
agreements
There are now one active National Partnership Agreement and two Project Agreements for
skills and workforce development (CFFR 2019). These agreements fund specific projects
and facilitate the delivery of reforms outlined in the NASWD.
The National Partnership on the Skilling Australians Fund. The objective of this Fund is
to increase the uptake of apprenticeships and traineeships, pre-apprenticeships,
pre-traineeships, higher apprenticeships, and other relevant employment-related training.
All jurisdictions, except Victoria and Queensland, have signed this Partnership. The
Skilling Australians Fund ($1.5 billion) was established in the 2017-18 Budget and ends
on 22 June 2022.
The Project Agreement for the New South Wales Infrastructure Skills Centre. The
initiative ($5.94 million) is aimed at establishing the New South Wales Infrastructure
Skills Centre to provide a one-stop shop for infrastructure jobs and training to meet
demands of Sydney’s infrastructure sector. The Agreement was signed 20 June 2017 and
ends on 30 June 2022.
The North-West Tasmania Job Ready Generation Package. The package ($3.15 million)
is aimed at building the skills of younger Tasmanians in agri-tourism through
apprenticeships and training. The Agreement was signed on 15 March 2019 and ends on
30 August 2022.
Past National Partnership Agreements
Several other National Partnership Agreements have been made to support workforce skills
(PC 2012).
National Partnership Agreement on Productivity Places Program (2009–2012) — aimed
to reduce skills shortages and increase productivity of industry and enterprises through
an increase in the number of people with qualifications at Certificate III and above for
employed workers and Certificate II and above for jobseekers.
National Partnership Agreement on Youth Attainment and Transitions (2009–2013) —
aimed to achieve a national Year 12 or equivalent attainment rate of 90 per cent by 2015,
provide an education or training entitlement to people aged 15–24 years, better engage
young people in education and training, assist people aged 15–24 years to make a
successful transition from schooling into further education, training or employment, and
better align Australian and State and Territory programs and services related to youth,
careers and transitions.
National Partnership Agreement on Pre-Apprenticeship Training (2010–2011) — aimed
to develop and manage innovative programs and projects to increase the number of
pre-apprenticeship training opportunities within each jurisdiction.
240 NASWD REVIEW
National Partnership Agreement on Training Places for Single and Teenage Parents
(2012–2015) — aimed to improve job readiness of single and teenage parents through
participation in training with a view to increasing their workforce participation.
National Partnership Agreement on Skills Reform (2012–2017) — as discussed above,
provided for an entitlement to a training place for everyone of working age for
qualifications at Certificate III and above and the extension of Commonwealth income
contingent loans.
B.3 Monitoring and reporting on the NASWD
The accountability framework at the heart of the IGA FFR and the NASWD relied on
performance indicators built on sound data, public transparency, a regular reporting regime
and active supervision by COAG and its councils. A number of these elements were achieved.
The COAG Reform Council was established to provide independent advice about progress
of the reforms under the National Agreements and advise on whether reward payments under
the National Partnerships should be made. The Productivity Commission was tasked with
reporting against the National Agreement indicators, first to the COAG Reform Council and
later to COAG itself. The Productivity Commission provided analysis of approaches to
assessing progress (PC 2011) and the potential benefits if reforms achieved the specified
outcomes (PC 2012). Performance indicators in the Report on Government Services
produced by the Productivity Commission were amended to incorporate the key indicators
from the national agreements.
The National Centre for Vocational Education Research is also involved in reporting and
analysing aspects of VET sector performance.
Public COAG documents suggest that COAG received relatively little analysis of the
aggregate performance of the VET sector. The COAG Reform Council did not report
specifically on VET, spending the majority of its time examining the progress of regulatory
changes, including the Seamless National Economy initiatives (CRC 2009). Later COAG
Reform Council work was concerned with housing and Indigenous issues. The COAG
Reform Council was disbanded in 2014.
OPERATION OF THE VET SYSTEM 241
C Operation of the VET system
C.1 Introduction
This appendix provides background information on the vocational education and training
(VET) system: the providers, frameworks and regulators that act together to provide
nationally recognised training to the benefit of students and employers. The appendix covers:
what role the VET system plays (section C.2)
who uses the VET system (section C.3)
who provides vocational education (section C.4).
This information supports the analysis contained in the report by exploring key features of
the system and examining recent history.
C.2 What role does the VET system play?
VET and higher education together comprise the tertiary education sector. The education
provided by higher education institutions tends towards the abstract and theoretical, while
vocational education concentrates more on developing vocation-specific skills. The blurred
lines between these areas are highlighted by the fact that many definitions just state that
higher education is provided by universities and leads to a degree qualification and
vocational education is provided by registered training organisations (RTOs) and leads to a
VET qualification.
The two sectors are potentially complementary. The abstract frameworks acquired through
higher education may need additional practical skills to be applied in the workplace.
Similarly, a VET graduate may need to apply more abstract analytical approaches to progress
in the workplace and tackle more complex problems.
However, the providers in each sector are also competitors, seeking to attract both domestic
and international students. Universities, in particular, have broadened their offerings to
attract students who would previously have undertaken VET courses. There has also been a
trend in some occupations, for example nursing and childcare, to raise the occupational entry
requirements to higher level qualifications.
The options available to VET students range from formal qualifications delivered by
approved public and private providers (including schools, private businesses, community
organisations and universities as well as traditional TAFE colleges) to informal workplace
242 NASWD REVIEW
training. Training may equip students with foundation skills, such as language, literacy,
numeracy and digital skills, skills of general application, such as business management or
marketing, or skills that qualify students to work in specialist occupations.
Nationally recognised training is training that meets: the approved course descriptions
(including the competencies to be achieved); course and provider standards; and
accreditation arrangements that have been developed for VET. There are four types of
training programs, which may lead to nationally recognised qualifications or Statements of
Attainment (box C.1). Subjects not delivered as part of a nationally recognised program can
still be included under the classification of nationally recognised training if they meet the
requirements — subjects include, for example, short courses drawing from the health
training package: first aid courses, various occupational health and safety courses and
responsible service of alcohol. All VET student data reported in this appendix relate to
nationally recognised training.
Nationally recognised training programs cover around 50 per cent of VET students and the
majority of training effort as measured by full year training equivalents (FYTEs). It is also
where the bulk of government funding is directed (figure C.1). A large share of the subjects
not delivered as part of a nationally recognised program is made up of first aid, resuscitation
and responsible service of alcohol subjects, as well as a range of workplace safety short
courses — many of these courses meet employees’ regulatory requirements.
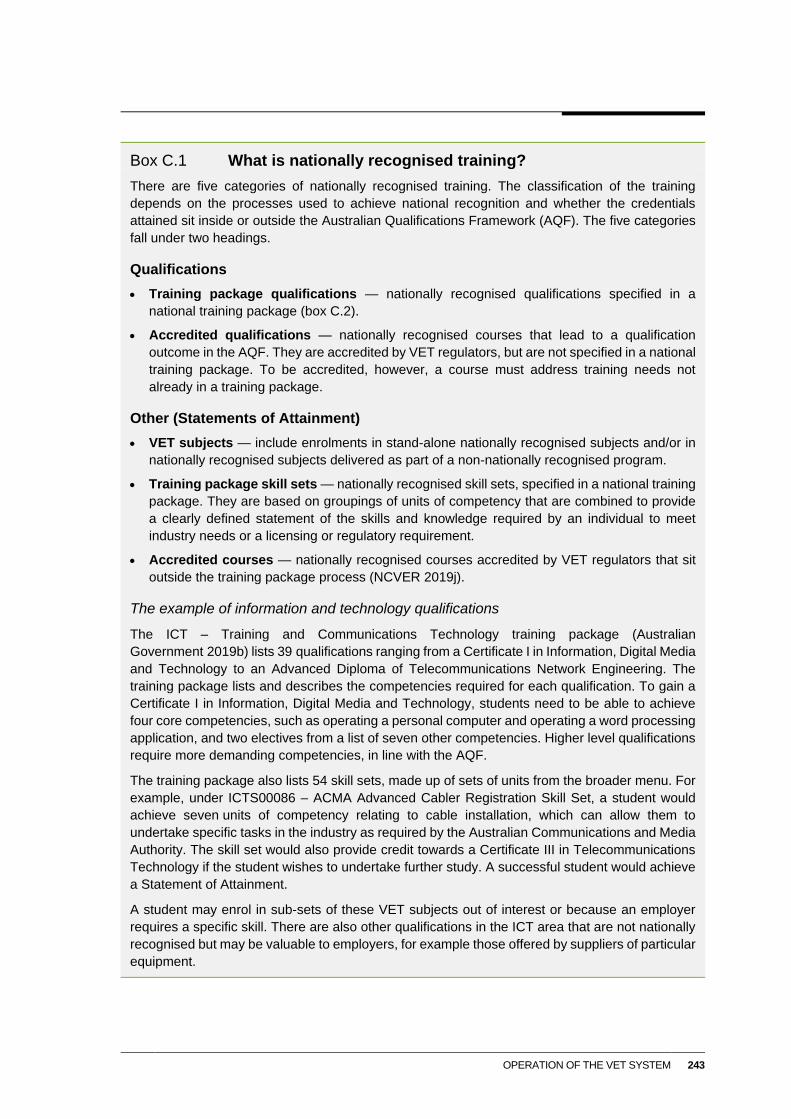
OPERATION OF THE VET SYSTEM 243
Box C.1 What is nationally recognised training?
There are five categories of nationally recognised training. The classification of the training
depends on the processes used to achieve national recognition and whether the credentials
attained sit inside or outside the Australian Qualifications Framework (AQF). The five categories
fall under two headings.
Qualifications
Training package qualifications — nationally recognised qualifications specified in a
national training package (box C.2).
Accredited qualifications — nationally recognised courses that lead to a qualification
outcome in the AQF. They are accredited by VET regulators, but are not specified in a national
training package. To be accredited, however, a course must address training needs not
already in a training package.
Other (Statements of Attainment)
VET subjects — include enrolments in stand-alone nationally recognised subjects and/or in
nationally recognised subjects delivered as part of a non-nationally recognised program.
Training package skill sets — nationally recognised skill sets, specified in a national training
package. They are based on groupings of units of competency that are combined to provide
a clearly defined statement of the skills and knowledge required by an individual to meet
industry needs or a licensing or regulatory requirement.
Accredited courses — nationally recognised courses accredited by VET regulators that sit
outside the training package process (NCVER 2019j).
The example of information and technology qualifications
The ICT – Training and Communications Technology training package (Australian
Government 2019b) lists 39 qualifications ranging from a Certificate I in Information, Digital Media
and Technology to an Advanced Diploma of Telecommunications Network Engineering. The
training package lists and describes the competencies required for each qualification. To gain a
Certificate I in Information, Digital Media and Technology, students need to be able to achieve
four core competencies, such as operating a personal computer and operating a word processing
application, and two electives from a list of seven other competencies. Higher level qualifications
require more demanding competencies, in line with the AQF.
The training package also lists 54 skill sets, made up of sets of units from the broader menu. For
example, under ICTS00086 – ACMA Advanced Cabler Registration Skill Set, a student would
achieve seven units of competency relating to cable installation, which can allow them to
undertake specific tasks in the industry as required by the Australian Communications and Media
Authority. The skill set would also provide credit towards a Certificate III in Telecommunications
Technology if the student wishes to undertake further study. A successful student would achieve
a Statement of Attainment.
A student may enrol in sub-sets of these VET subjects out of interest or because an employer
requires a specific skill. There are also other qualifications in the ICT area that are not nationally
recognised but may be valuable to employers, for example those offered by suppliers of particular
equipment.
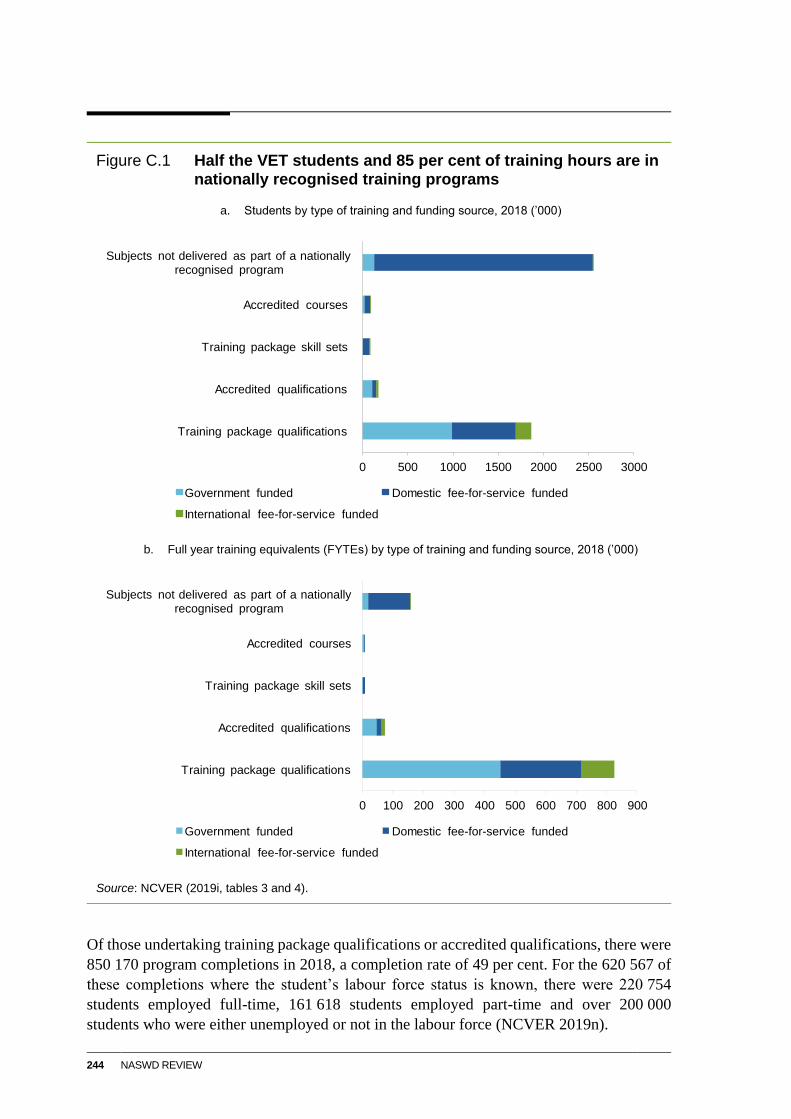
244 NASWD REVIEW
Figure C.1 Half the VET students and 85 per cent of training hours are in nationally recognised training programs
a. Students by type of training and funding source, 2018 (’000)
b. Full year training equivalents (FYTEs) by type of training and funding source, 2018 (’000)
Source: NCVER (2019i, tables 3 and 4).
Of those undertaking training package qualifications or accredited qualifications, there were
850 170 program completions in 2018, a completion rate of 49 per cent. For the 620 567 of
these completions where the student’s labour force status is known, there were 220 754
students employed full-time, 161 618 students employed part-time and over 200 000
students who were either unemployed or not in the labour force (NCVER 2019n).
0 500 1000 1500 2000 2500 3000
Training package qualifications
Accredited qualifications
Training package skill sets
Accredited courses
Subjects not delivered as part of a nationally recognised program
Government funded Domestic fee-for-service funded
International fee-for-service funded
0 100 200 300 400 500 600 700 800 900
Training package qualifications
Accredited qualifications
Training package skill sets
Accredited courses
Subjects not delivered as part of a nationally recognised program
Government funded Domestic fee-for-service funded
International fee-for-service funded
OPERATION OF THE VET SYSTEM 245
Training packages are a critical foundation for maintaining standards and ensuring common
content for VET qualifications (box C.2). They are intended to enable employers to quickly
assess the suitability of job applicants and their skill levels.
Box C.2 Training packages set the competency standards for occupations
Training packages set the competency standards that VET students are required to achieve for
nationally recognised training.
Training packages are the basis of most VET programs, including Australian Apprenticeships
(that is, an apprenticeship or a traineeship), VET in Schools, recognition of existing skills,
occupational licencing and courses offered by registered training organisations (DESSFB nd).
There are 57 training packages covering over 1400 qualifications and 1400 skills sets (Australian
Government 2019b). Each qualification within these training packages describes VET products
in terms of:
… the range of knowledge and skills (known as competencies) required by individuals to successfully
operate in different industries and occupations … and how the competencies can be packaged into [one
of around 1400] nationally recognised qualifications that align to the AQF. (Schubert 2018, p. 4)
Four packages (Business Services, Community Services, Tourism, Travel and Hospitality and
Construction, Plumbing and Services Integrated Framework, the consolidated training package
for much of the construction sector) accounted for 44 per cent of training package enrolments in
2018 (NCVER 2019p).
C.3 Who uses the VET system?
The users of the VET system are students and employers. In 2018, there were 4.1 million
students enrolled in the VET system. Students also undertook informal training, largely
on-the-job with their employer, but also training with private providers, employer
associations, equipment manufacturers and suppliers and others (NCVER 2019c).
Students
Students undertake VET for many reasons. VET qualifications may be an option on the
school curriculum, a stepping stone to a new job in a new industry, a regulatory or licensing
requirement for entry into an occupation, a way to upgrade skills in an existing job, or a
pathway to higher education (DPMC 2014, p. 3). People also access the VET system to
broaden their own knowledge, learn languages for travel and learn new skills to enrich their
personal lives. Some of these directions are illustrated in figure C.2.
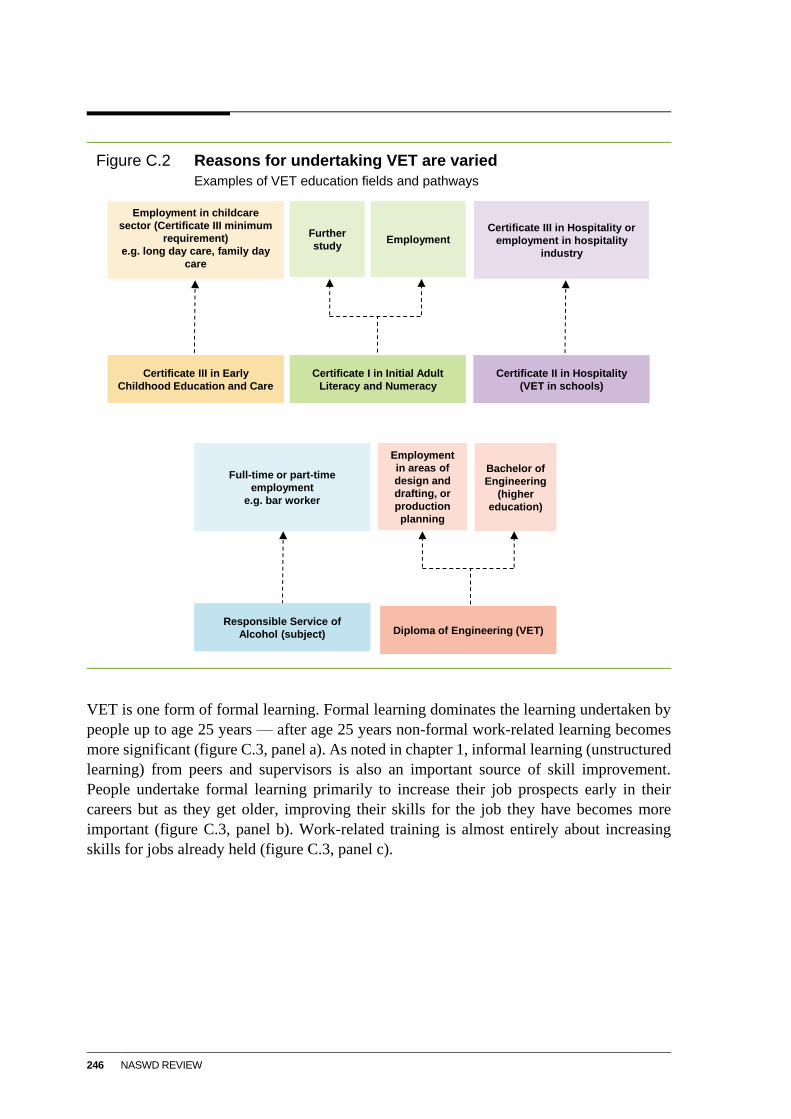
246 NASWD REVIEW
Figure C.2 Reasons for undertaking VET are varied
Examples of VET education fields and pathways
VET is one form of formal learning. Formal learning dominates the learning undertaken by
people up to age 25 years — after age 25 years non-formal work-related learning becomes
more significant (figure C.3, panel a). As noted in chapter 1, informal learning (unstructured
learning) from peers and supervisors is also an important source of skill improvement.
People undertake formal learning primarily to increase their job prospects early in their
careers but as they get older, improving their skills for the job they have becomes more
important (figure C.3, panel b). Work-related training is almost entirely about increasing
skills for jobs already held (figure C.3, panel c).
Employment in childcare
sector (Certificate III minimum
requirement)
e.g. long day care, family day
care
Certificate III in Hospitality or
employment in hospitality
industry
Further
study
Certificate III in Early
Childhood Education and Care
Certificate I in Initial Adult
Literacy and Numeracy
Employment
Certificate II in Hospitality
(VET in schools)
Employment
in areas of
design and
drafting, or
production
planning
Responsible Service of
Alcohol (subject) Diploma of Engineering (VET)
Bachelor of
Engineering
(higher
education)
Full-time or part-time
employment
e.g. bar worker
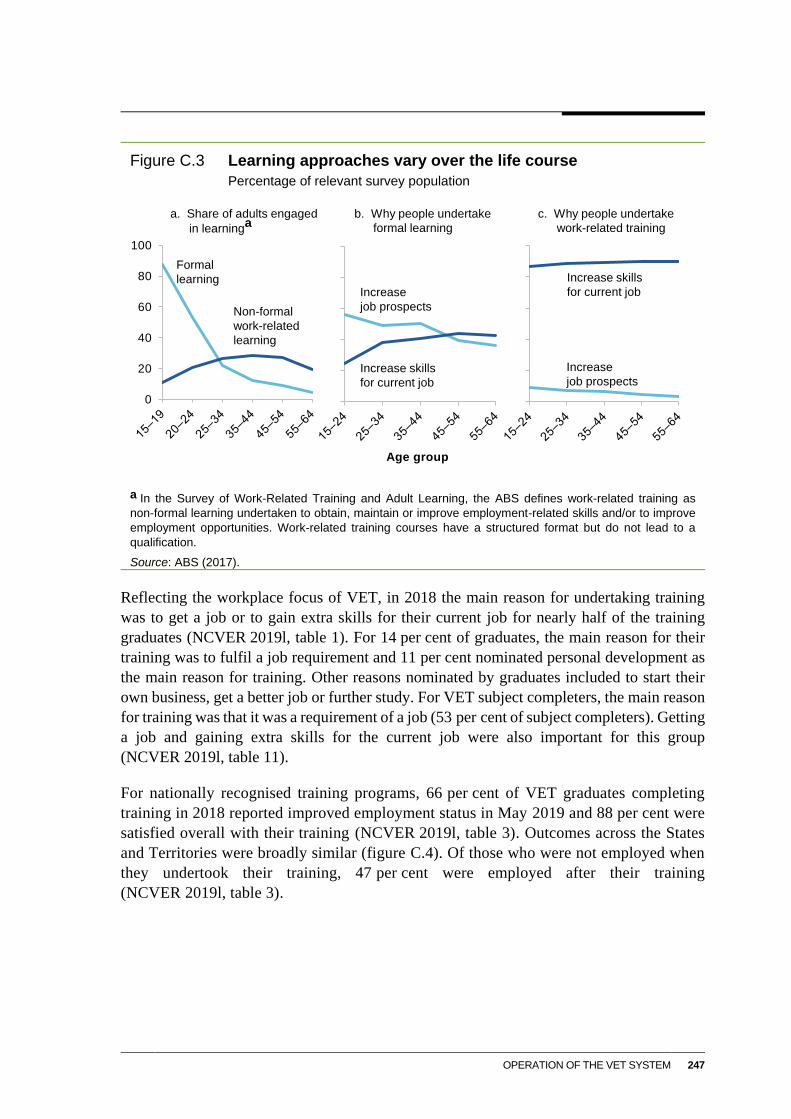
OPERATION OF THE VET SYSTEM 247
Figure C.3 Learning approaches vary over the life course
Percentage of relevant survey population
a In the Survey of Work-Related Training and Adult Learning, the ABS defines work-related training as
non-formal learning undertaken to obtain, maintain or improve employment-related skills and/or to improve
employment opportunities. Work-related training courses have a structured format but do not lead to a
qualification.
Source: ABS (2017).
Reflecting the workplace focus of VET, in 2018 the main reason for undertaking training
was to get a job or to gain extra skills for their current job for nearly half of the training
graduates (NCVER 2019l, table 1). For 14 per cent of graduates, the main reason for their
training was to fulfil a job requirement and 11 per cent nominated personal development as
the main reason for training. Other reasons nominated by graduates included to start their
own business, get a better job or further study. For VET subject completers, the main reason
for training was that it was a requirement of a job (53 per cent of subject completers). Getting
a job and gaining extra skills for the current job were also important for this group
(NCVER 2019l, table 11).
For nationally recognised training programs, 66 per cent of VET graduates completing
training in 2018 reported improved employment status in May 2019 and 88 per cent were
satisfied overall with their training (NCVER 2019l, table 3). Outcomes across the States
and Territories were broadly similar (figure C.4). Of those who were not employed when
they undertook their training, 47 per cent were employed after their training
(NCVER 2019l, table 3).
Age group
Increase
job prospects
Increase skills
for current job
0
20
40
60
80
100
Formal
learning
Non-formal
work-related
learning
Increase skills
for current job
Increase
job prospects
a. Share of adults engaged
in learningab. Why people undertake
formal learning
c. Why people undertake
work-related training
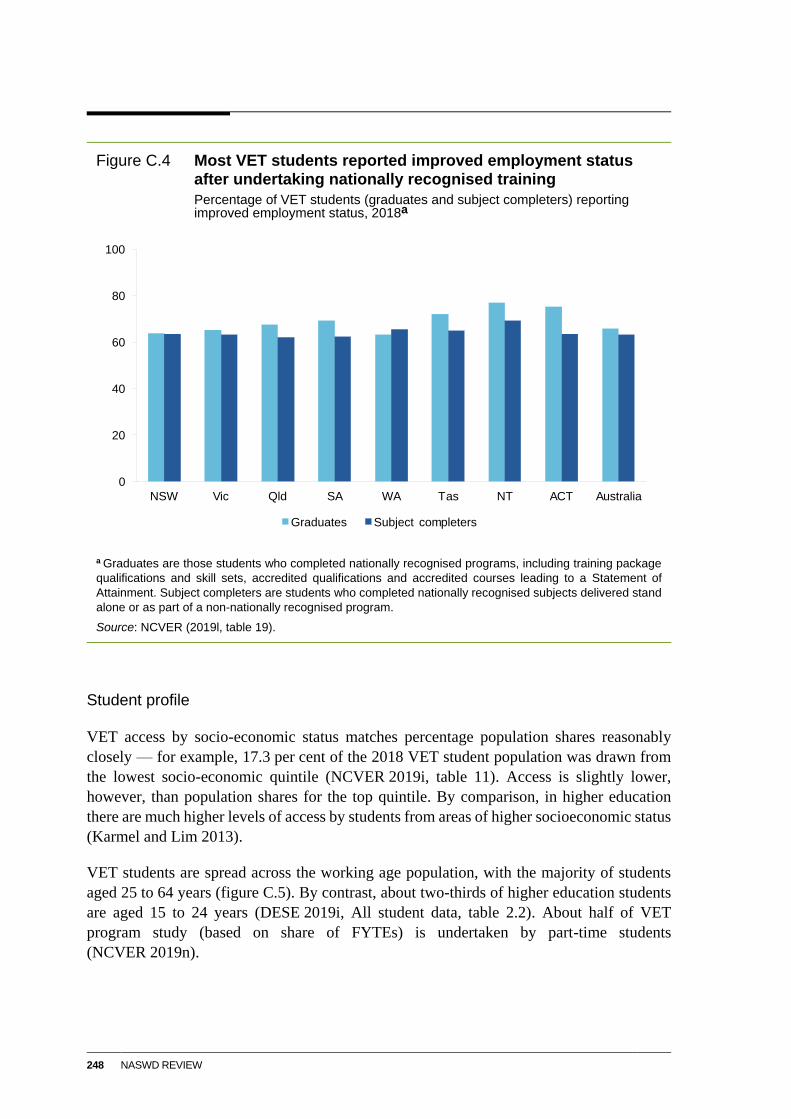
248 NASWD REVIEW
Figure C.4 Most VET students reported improved employment status after undertaking nationally recognised training
Percentage of VET students (graduates and subject completers) reporting improved employment status, 2018a
a Graduates are those students who completed nationally recognised programs, including training package
qualifications and skill sets, accredited qualifications and accredited courses leading to a Statement of
Attainment. Subject completers are students who completed nationally recognised subjects delivered stand
alone or as part of a non-nationally recognised program.
Source: NCVER (2019l, table 19).
Student profile
VET access by socio-economic status matches percentage population shares reasonably
closely — for example, 17.3 per cent of the 2018 VET student population was drawn from
the lowest socio-economic quintile (NCVER 2019i, table 11). Access is slightly lower,
however, than population shares for the top quintile. By comparison, in higher education
there are much higher levels of access by students from areas of higher socioeconomic status
(Karmel and Lim 2013).
VET students are spread across the working age population, with the majority of students
aged 25 to 64 years (figure C.5). By contrast, about two-thirds of higher education students
are aged 15 to 24 years (DESE 2019i, All student data, table 2.2). About half of VET
program study (based on share of FYTEs) is undertaken by part-time students
(NCVER 2019n).
0
20
40
60
80
100
NSW Vic Qld SA WA Tas NT ACT Australia
Graduates Subject completers
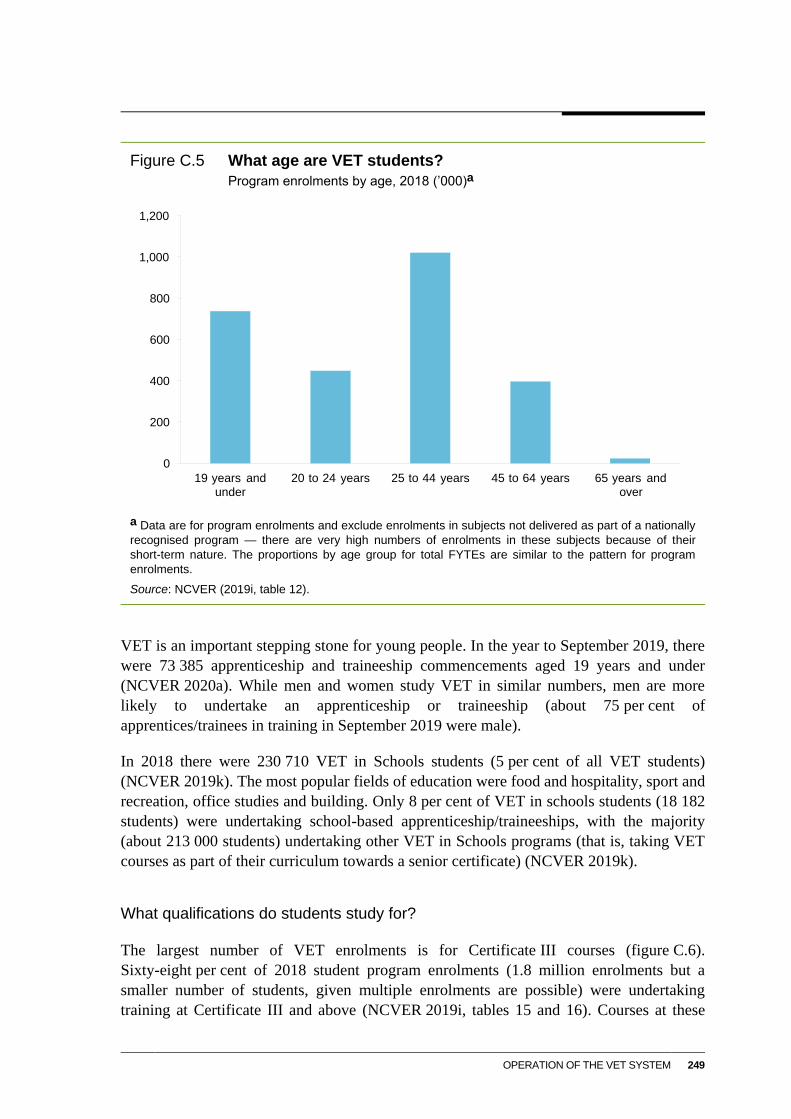
OPERATION OF THE VET SYSTEM 249
Figure C.5 What age are VET students?
Program enrolments by age, 2018 (’000)a
a Data are for program enrolments and exclude enrolments in subjects not delivered as part of a nationally
recognised program — there are very high numbers of enrolments in these subjects because of their
short-term nature. The proportions by age group for total FYTEs are similar to the pattern for program
enrolments.
Source: NCVER (2019i, table 12).
VET is an important stepping stone for young people. In the year to September 2019, there
were 73 385 apprenticeship and traineeship commencements aged 19 years and under
(NCVER 2020a). While men and women study VET in similar numbers, men are more
likely to undertake an apprenticeship or traineeship (about 75 per cent of
apprentices/trainees in training in September 2019 were male).
In 2018 there were 230 710 VET in Schools students (5 per cent of all VET students)
(NCVER 2019k). The most popular fields of education were food and hospitality, sport and
recreation, office studies and building. Only 8 per cent of VET in schools students (18 182
students) were undertaking school-based apprenticeship/traineeships, with the majority
(about 213 000 students) undertaking other VET in Schools programs (that is, taking VET
courses as part of their curriculum towards a senior certificate) (NCVER 2019k).
What qualifications do students study for?
The largest number of VET enrolments is for Certificate III courses (figure C.6).
Sixty-eight per cent of 2018 student program enrolments (1.8 million enrolments but a
smaller number of students, given multiple enrolments are possible) were undertaking
training at Certificate III and above (NCVER 2019i, tables 15 and 16). Courses at these
0
200
400
600
800
1,000
1,200
19 years and under
20 to 24 years 25 to 44 years 45 to 64 years 65 years and over
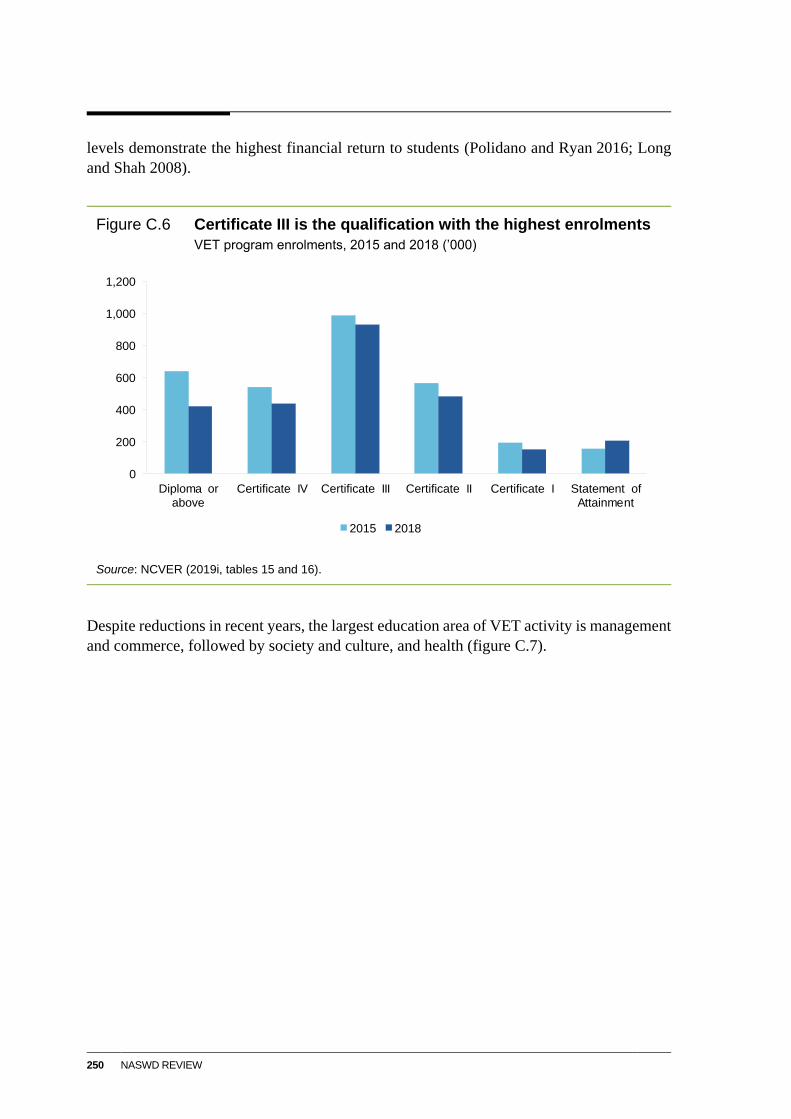
250 NASWD REVIEW
levels demonstrate the highest financial return to students (Polidano and Ryan 2016; Long
and Shah 2008).
Figure C.6 Certificate III is the qualification with the highest enrolments
VET program enrolments, 2015 and 2018 (’000)
Source: NCVER (2019i, tables 15 and 16).
Despite reductions in recent years, the largest education area of VET activity is management
and commerce, followed by society and culture, and health (figure C.7).
0
200
400
600
800
1,000
1,200
Diploma or above
Certificate IV Certificate III Certificate II Certificate I Statement of Attainment
2015 2018
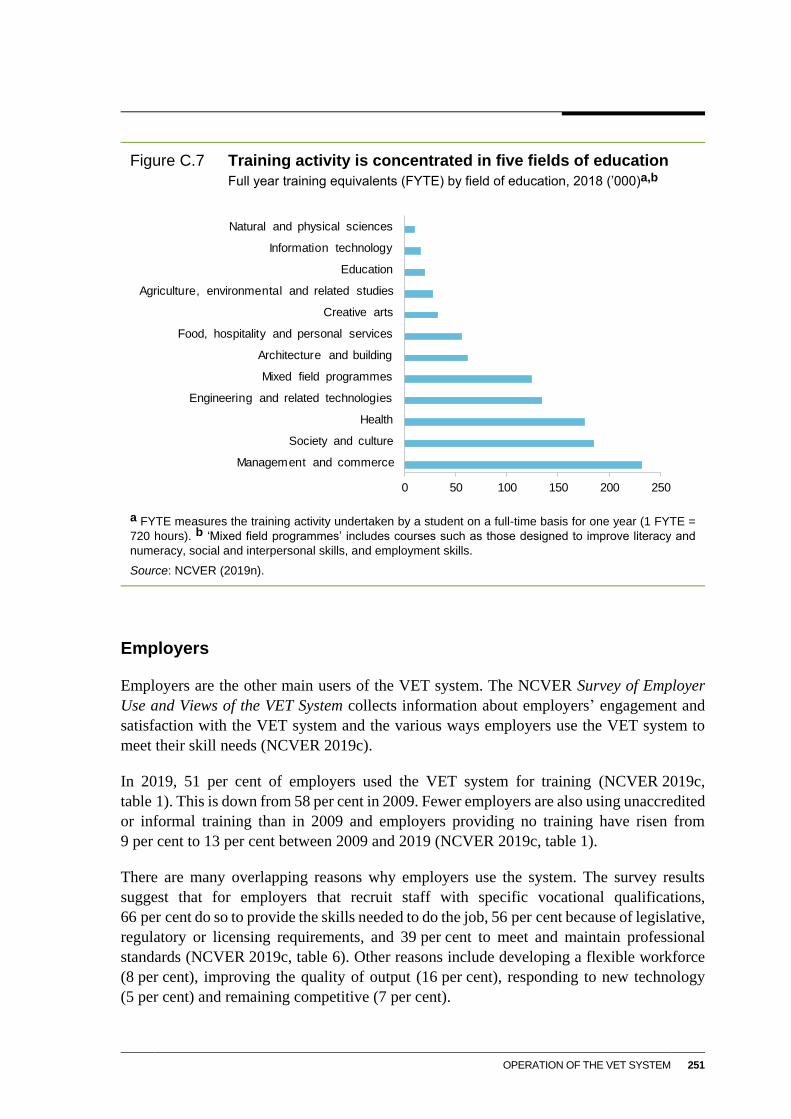
OPERATION OF THE VET SYSTEM 251
Figure C.7 Training activity is concentrated in five fields of education
Full year training equivalents (FYTE) by field of education, 2018 (’000)a,b
a FYTE measures the training activity undertaken by a student on a full-time basis for one year (1 FYTE =
720 hours). b ‘Mixed field programmes’ includes courses such as those designed to improve literacy and
numeracy, social and interpersonal skills, and employment skills.
Source: NCVER (2019n).
Employers
Employers are the other main users of the VET system. The NCVER Survey of Employer
Use and Views of the VET System collects information about employers’ engagement and
satisfaction with the VET system and the various ways employers use the VET system to
meet their skill needs (NCVER 2019c).
In 2019, 51 per cent of employers used the VET system for training (NCVER 2019c,
table 1). This is down from 58 per cent in 2009. Fewer employers are also using unaccredited
or informal training than in 2009 and employers providing no training have risen from
9 per cent to 13 per cent between 2009 and 2019 (NCVER 2019c, table 1).
There are many overlapping reasons why employers use the system. The survey results
suggest that for employers that recruit staff with specific vocational qualifications,
66 per cent do so to provide the skills needed to do the job, 56 per cent because of legislative,
regulatory or licensing requirements, and 39 per cent to meet and maintain professional
standards (NCVER 2019c, table 6). Other reasons include developing a flexible workforce
(8 per cent), improving the quality of output (16 per cent), responding to new technology
(5 per cent) and remaining competitive (7 per cent).
0 50 100 150 200 250
Management and commerce
Society and culture
Health
Engineering and related technologies
Mixed field programmes
Architecture and building
Food, hospitality and personal services
Creative arts
Agriculture, environmental and related studies
Education
Information technology
Natural and physical sciences
252 NASWD REVIEW
In 2019, 79 per cent of employers using nationally recognised training were satisfied with
the training as a way of meeting their skill needs (NCVER 2019c, table 7). This is lower than
the 87 per cent satisfaction rating among employers using unaccredited training.
Large employers are the most intensive users of the VET system — 82 per cent of large
employers reported using VET providers for training in the 12 months before the 2019
survey and 58 per cent of large employers used nationally recognised training
(NCVER 2019c, tables 4 and 5). Large employers using nationally recognised training also
reported the highest satisfaction rate of 90 per cent (NCVER 2019c, table 7). Just 15 per cent
of small employers used nationally recognised training with an associated satisfaction rate
of 77 per cent (NCVER 2019c, tables 5 and 7). Small employers are also less likely to use
unaccredited training.
Large employers are relatively more intensive users of training for apprentices and trainees.
Forty-seven per cent of large employers used VET training for apprentices or trainees in the
12 months leading up to the survey in 2019 (NCVER 2019c, table 5).
C.4 Who provides vocational education?
There are over 3800 active RTOs (NCVER 2019i, Table 2). Around Australia, there were
35 TAFE institutes in 2018 operating in over 2000 locations (SCRGSP 2020, table 5A.7).
Universities, schools, enterprises and community providers made up the remaining RTOs.
In 2018, private providers accounted for almost two-thirds of total VET students (table C.1).
In 2018, private training providers had the highest number of FYTEs (57 per cent), while
TAFE institutes had 30 per cent of FYTEs (NCVER 2019n). For private training providers,
the largest source of revenue by FYTE was domestic fee-for-service funding while for TAFE
institutes the largest source was government funding (figure C.8, panel a).
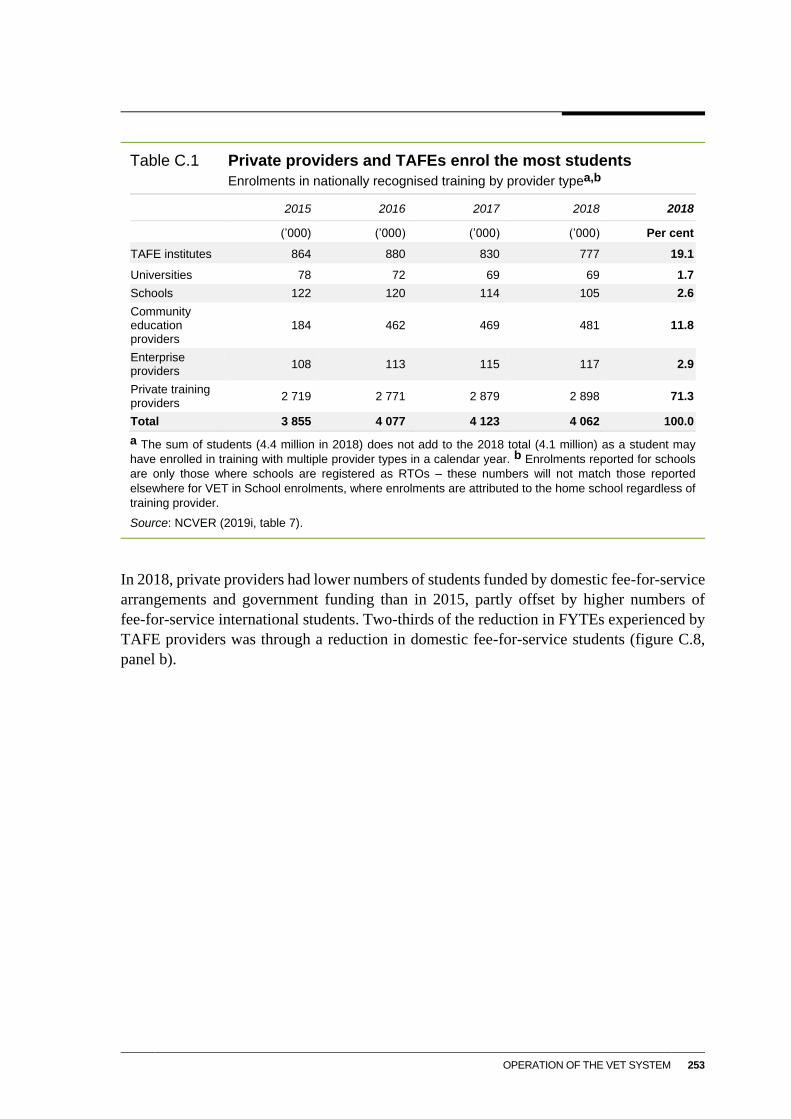
OPERATION OF THE VET SYSTEM 253
Table C.1 Private providers and TAFEs enrol the most students
Enrolments in nationally recognised training by provider typea,b
2015 2016 2017 2018 2018
(’000) (’000) (’000) (’000) Per cent
TAFE institutes 864 880 830 777 19.1
Universities 78 72 69 69 1.7
Schools 122 120 114 105 2.6
Community education providers
184 462 469 481 11.8
Enterprise providers
108 113 115 117 2.9
Private training providers
2 719 2 771 2 879 2 898 71.3
Total 3 855 4 077 4 123 4 062 100.0
a The sum of students (4.4 million in 2018) does not add to the 2018 total (4.1 million) as a student may
have enrolled in training with multiple provider types in a calendar year. b Enrolments reported for schools
are only those where schools are registered as RTOs – these numbers will not match those reported
elsewhere for VET in School enrolments, where enrolments are attributed to the home school regardless of
training provider.
Source: NCVER (2019i, table 7).
In 2018, private providers had lower numbers of students funded by domestic fee-for-service
arrangements and government funding than in 2015, partly offset by higher numbers of
fee-for-service international students. Two-thirds of the reduction in FYTEs experienced by
TAFE providers was through a reduction in domestic fee-for-service students (figure C.8,
panel b).
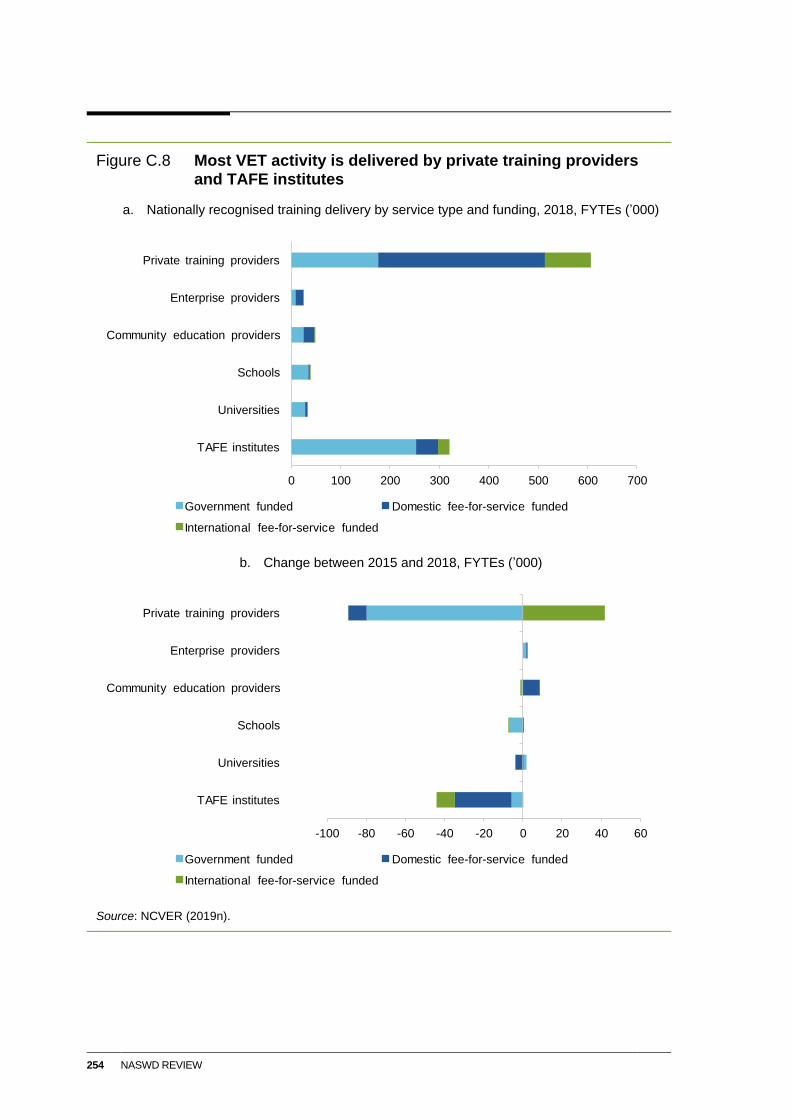
254 NASWD REVIEW
Figure C.8 Most VET activity is delivered by private training providers and TAFE institutes
a. Nationally recognised training delivery by service type and funding, 2018, FYTEs (’000)
b. Change between 2015 and 2018, FYTEs (’000)
Source: NCVER (2019n).
0 100 200 300 400 500 600 700
TAFE institutes
Universities
Schools
Community education providers
Enterprise providers
Private training providers
Government funded Domestic fee-for-service funded
International fee-for-service funded
-100 -80 -60 -40 -20 0 20 40 60
TAFE institutes
Universities
Schools
Community education providers
Enterprise providers
Private training providers
Government funded Domestic fee-for-service funded
International fee-for-service funded
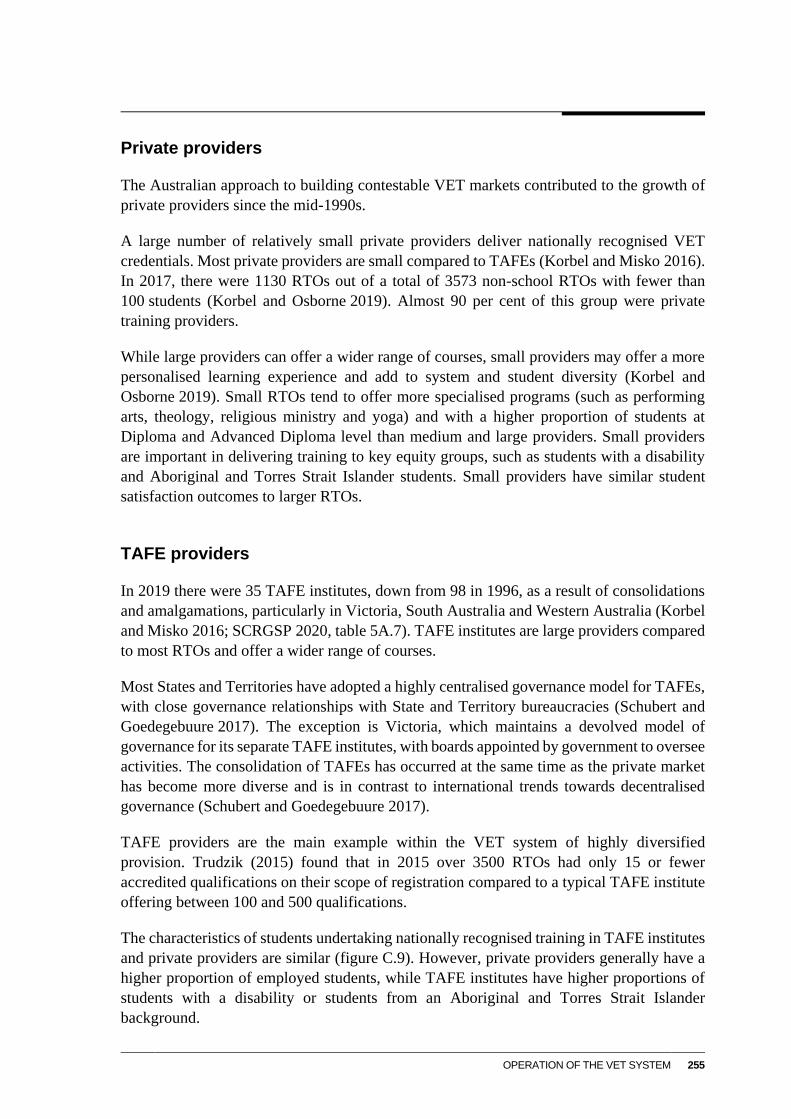
OPERATION OF THE VET SYSTEM 255
Private providers
The Australian approach to building contestable VET markets contributed to the growth of
private providers since the mid-1990s.
A large number of relatively small private providers deliver nationally recognised VET
credentials. Most private providers are small compared to TAFEs (Korbel and Misko 2016).
In 2017, there were 1130 RTOs out of a total of 3573 non-school RTOs with fewer than
100 students (Korbel and Osborne 2019). Almost 90 per cent of this group were private
training providers.
While large providers can offer a wider range of courses, small providers may offer a more
personalised learning experience and add to system and student diversity (Korbel and
Osborne 2019). Small RTOs tend to offer more specialised programs (such as performing
arts, theology, religious ministry and yoga) and with a higher proportion of students at
Diploma and Advanced Diploma level than medium and large providers. Small providers
are important in delivering training to key equity groups, such as students with a disability
and Aboriginal and Torres Strait Islander students. Small providers have similar student
satisfaction outcomes to larger RTOs.
TAFE providers
In 2019 there were 35 TAFE institutes, down from 98 in 1996, as a result of consolidations
and amalgamations, particularly in Victoria, South Australia and Western Australia (Korbel
and Misko 2016; SCRGSP 2020, table 5A.7). TAFE institutes are large providers compared
to most RTOs and offer a wider range of courses.
Most States and Territories have adopted a highly centralised governance model for TAFEs,
with close governance relationships with State and Territory bureaucracies (Schubert and
Goedegebuure 2017). The exception is Victoria, which maintains a devolved model of
governance for its separate TAFE institutes, with boards appointed by government to oversee
activities. The consolidation of TAFEs has occurred at the same time as the private market
has become more diverse and is in contrast to international trends towards decentralised
governance (Schubert and Goedegebuure 2017).
TAFE providers are the main example within the VET system of highly diversified
provision. Trudzik (2015) found that in 2015 over 3500 RTOs had only 15 or fewer
accredited qualifications on their scope of registration compared to a typical TAFE institute
offering between 100 and 500 qualifications.
The characteristics of students undertaking nationally recognised training in TAFE institutes
and private providers are similar (figure C.9). However, private providers generally have a
higher proportion of employed students, while TAFE institutes have higher proportions of
students with a disability or students from an Aboriginal and Torres Strait Islander
background.
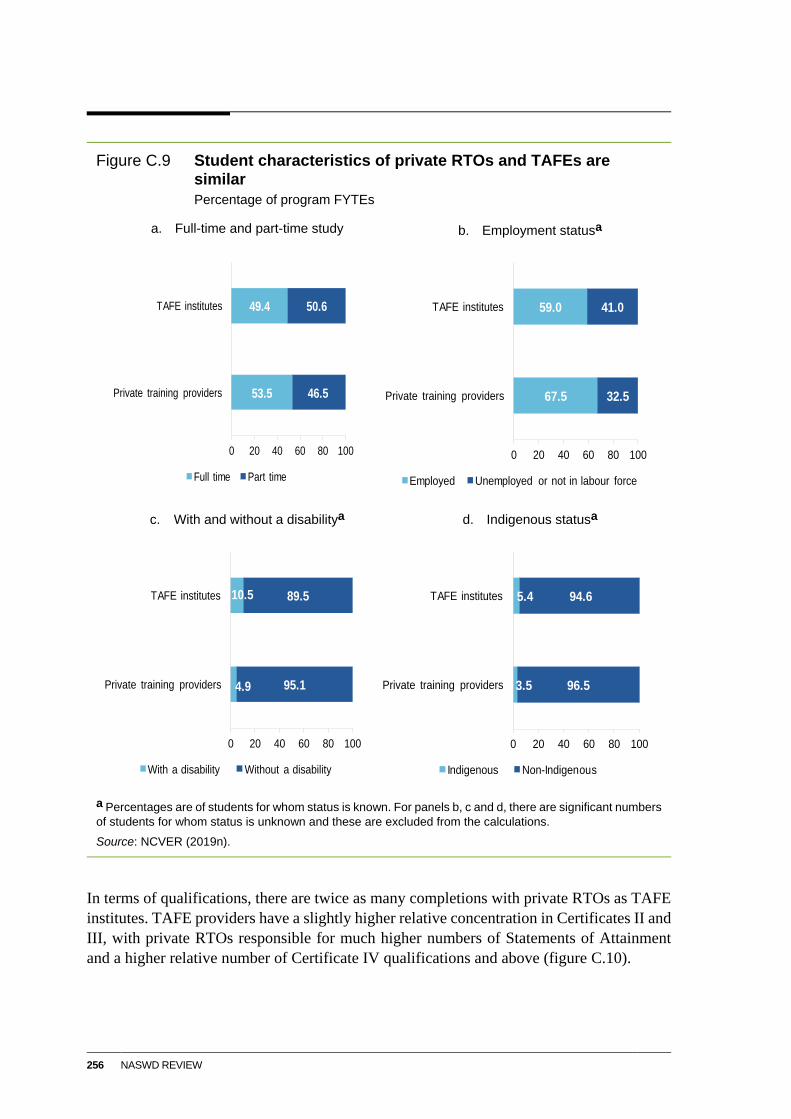
256 NASWD REVIEW
Figure C.9 Student characteristics of private RTOs and TAFEs are similar
Percentage of program FYTEs
a. Full-time and part-time study b. Employment statusa
c. With and without a disabilitya d. Indigenous statusa
a Percentages are of students for whom status is known. For panels b, c and d, there are significant numbers
of students for whom status is unknown and these are excluded from the calculations.
Source: NCVER (2019n).
In terms of qualifications, there are twice as many completions with private RTOs as TAFE
institutes. TAFE providers have a slightly higher relative concentration in Certificates II and
III, with private RTOs responsible for much higher numbers of Statements of Attainment
and a higher relative number of Certificate IV qualifications and above (figure C.10).
53.5
49.4
46.5
50.6
0 20 40 60 80 100
Private training providers
TAFE institutes
Full time Part time
67.5
59.0
32.5
41.0
0 20 40 60 80 100
Private training providers
TAFE institutes
Employed Unemployed or not in labour force
4.9
10.5
95.1
89.5
0 20 40 60 80 100
Private training providers
TAFE institutes
With a disability Without a disability
3.5
5.4
96.5
94.6
0 20 40 60 80 100
Private training providers
TAFE institutes
Indigenous Non-Indigenous
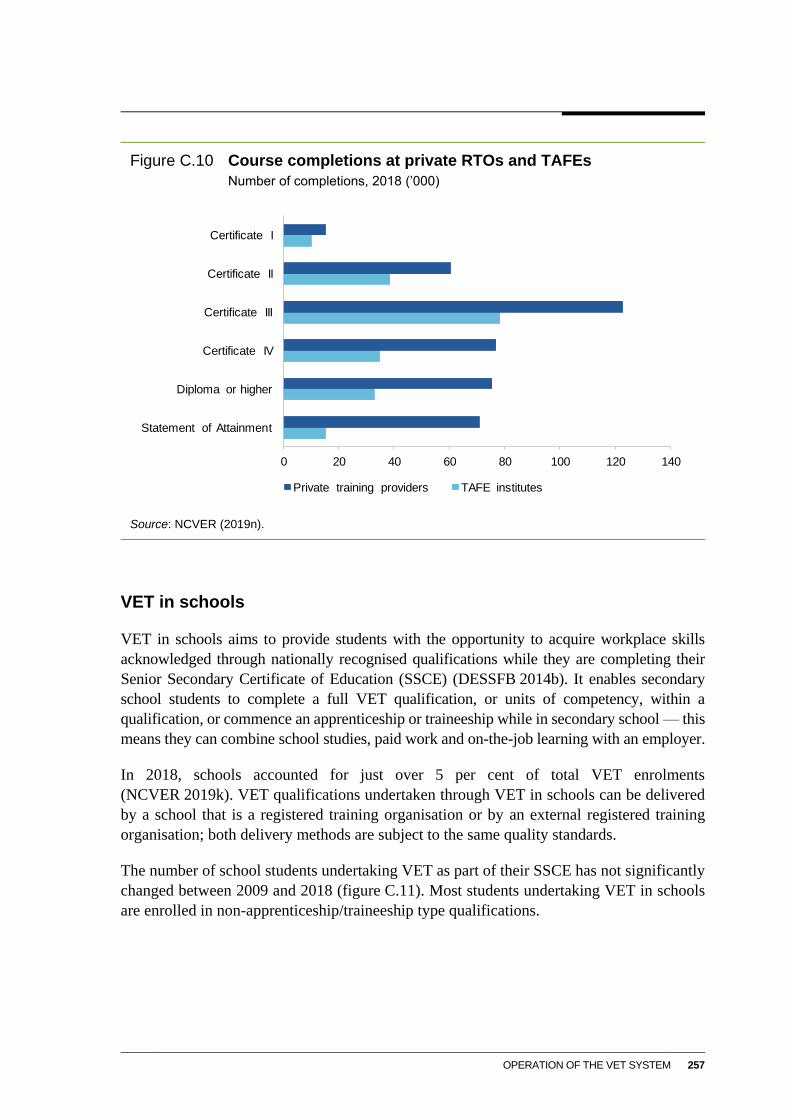
OPERATION OF THE VET SYSTEM 257
Figure C.10 Course completions at private RTOs and TAFEs
Number of completions, 2018 (’000)
Source: NCVER (2019n).
VET in schools
VET in schools aims to provide students with the opportunity to acquire workplace skills
acknowledged through nationally recognised qualifications while they are completing their
Senior Secondary Certificate of Education (SSCE) (DESSFB 2014b). It enables secondary
school students to complete a full VET qualification, or units of competency, within a
qualification, or commence an apprenticeship or traineeship while in secondary school — this
means they can combine school studies, paid work and on-the-job learning with an employer.
In 2018, schools accounted for just over 5 per cent of total VET enrolments
(NCVER 2019k). VET qualifications undertaken through VET in schools can be delivered
by a school that is a registered training organisation or by an external registered training
organisation; both delivery methods are subject to the same quality standards.
The number of school students undertaking VET as part of their SSCE has not significantly
changed between 2009 and 2018 (figure C.11). Most students undertaking VET in schools
are enrolled in non-apprenticeship/traineeship type qualifications.
0 20 40 60 80 100 120 140
Statement of Attainment
Diploma or higher
Certificate IV
Certificate III
Certificate II
Certificate I
Private training providers TAFE institutes
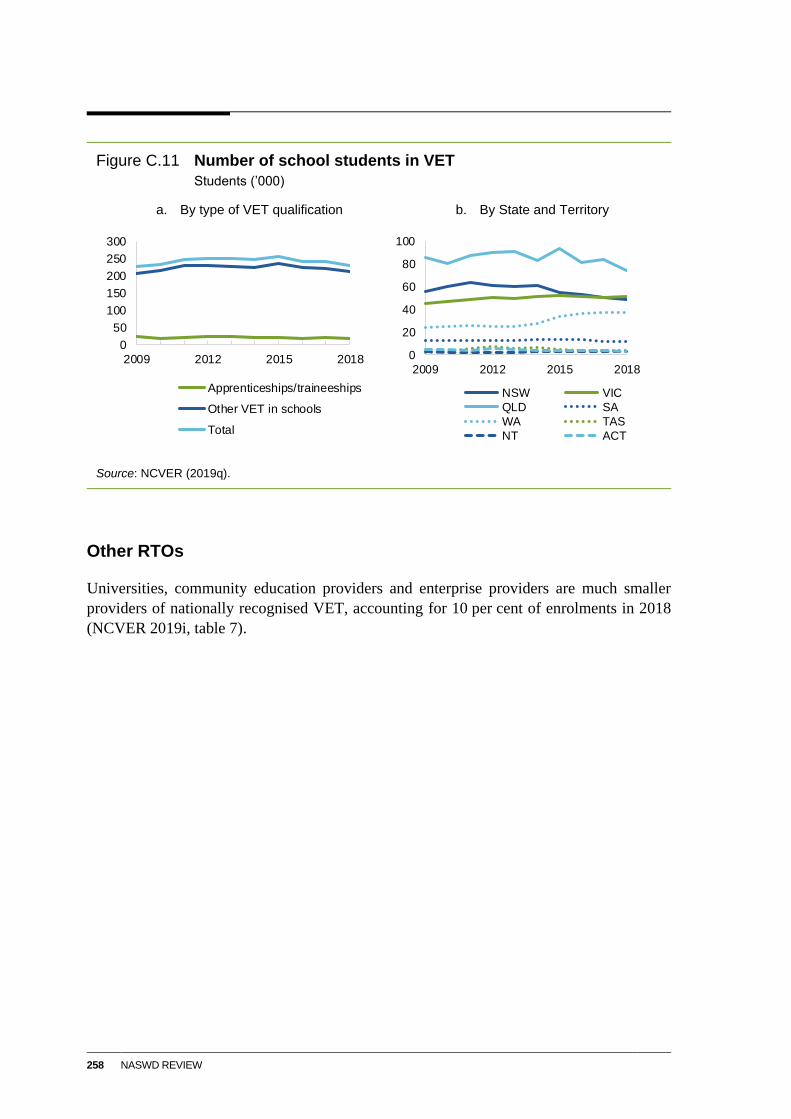
258 NASWD REVIEW
Figure C.11 Number of school students in VET
Students (’000)
a. By type of VET qualification b. By State and Territory
Source: NCVER (2019q).
Other RTOs
Universities, community education providers and enterprise providers are much smaller
providers of nationally recognised VET, accounting for 10 per cent of enrolments in 2018
(NCVER 2019i, table 7).
0
50
100
150
200
250
300
2009 2012 2015 2018
Apprenticeships/traineeships
Other VET in schools
Total
0
20
40
60
80
100
2009 2012 2015 2018
NSW VIC
QLD SA
WA TAS
NT ACT
GOVERNMENT FUNDING OF VET 259
D Government funding of VET
This appendix contains additional detail about government-funded vocational education and
training (VET).
Section D.1 provides information about VET funding arrangements, including VET
delivery.
Section D.2 describes jurisdictions’ aims and objectives for VET funding and how they
determine which courses receive subsidies.
Section D.3 outlines the VET funding and pricing models for subsidised courses in each
jurisdiction.
D.1 Where does government funding for VET go?
Funding for VET
Governments report VET funding to the National Centre for Vocational Education and
Research (NCVER) on an annual basis using the reporting framework for the new National
VET Funding Collection, which was endorsed by COAG ministers in 2017.
The broad pattern of government and private funding flows in the formal VET system is
illustrated in figure D.1.
Funding comes from Australian, State and Territory governments, students and employers.
Government funding is used to directly support the provision of VET as well as regulate and
support the sector.
The Australian Government distributes ongoing specific purpose payments (SPPs) to the
States and Territories through the Intergovernmental Agreement on Federal Financial
Relations (IGA FFR) (chapter 1).54 Australian Government funding is also provided to the
States and Territories through time-limited National Partnerships and Project Agreements,
such as the 2012 National Partnership Agreement on Skills Reform and the National
Partnership on the Skilling Australians Fund (NPSAF).
54 The National Agreement for Skills and Workforce Development (NASWD) SPP base funding was assigned
in 2009-10 and is indexed annually by a composite index reflecting the average share of labour and capital
costs incurred in the VET sector across jurisdictions.
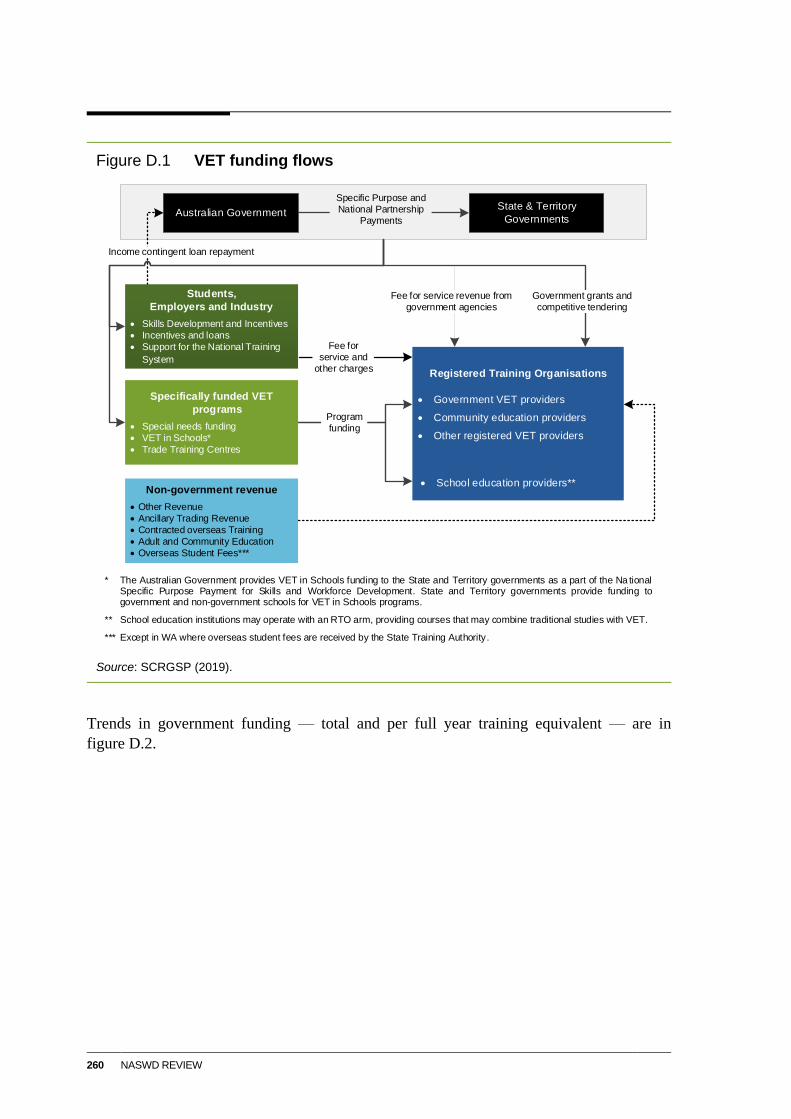
260 NASWD REVIEW
Figure D.1 VET funding flows
Source: SCRGSP (2019).
Trends in government funding — total and per full year training equivalent — are in
figure D.2.
Income contingent loan repayment
Specific Purpose and National Partnership
Payments
Fee for service and
other charges
Government grants and competitive tendering
* The Australian Government provides VET in Schools funding to the State and Territory governments as a part of the Na tional Specific Purpose Payment for Skills and Workforce Development. State and Territory governments provide funding to government and non-government schools for VET in Schools programs.
** School education institutions may operate with an RTO arm, providing courses that may combine traditional studies with VET.
*** Except in WA where overseas student fees are received by the State Training Authority.
Fee for service revenue from government agencies
Program funding
Australian GovernmentState & Territory
Governments
Registered Training Organisations
Government VET providers
Community education providers
Other registered VET providers
School education providers**Non-government revenue
Other Revenue
Ancillary Trading Revenue
Contracted overseas Training
Adult and Community Education
Overseas Student Fees***
Students,
Employers and Industry
Skills Development and Incentives
Incentives and loans
Support for the National Training
System
Specifically funded VET
programs
Special needs funding
VET in Schools*
Trade Training Centres
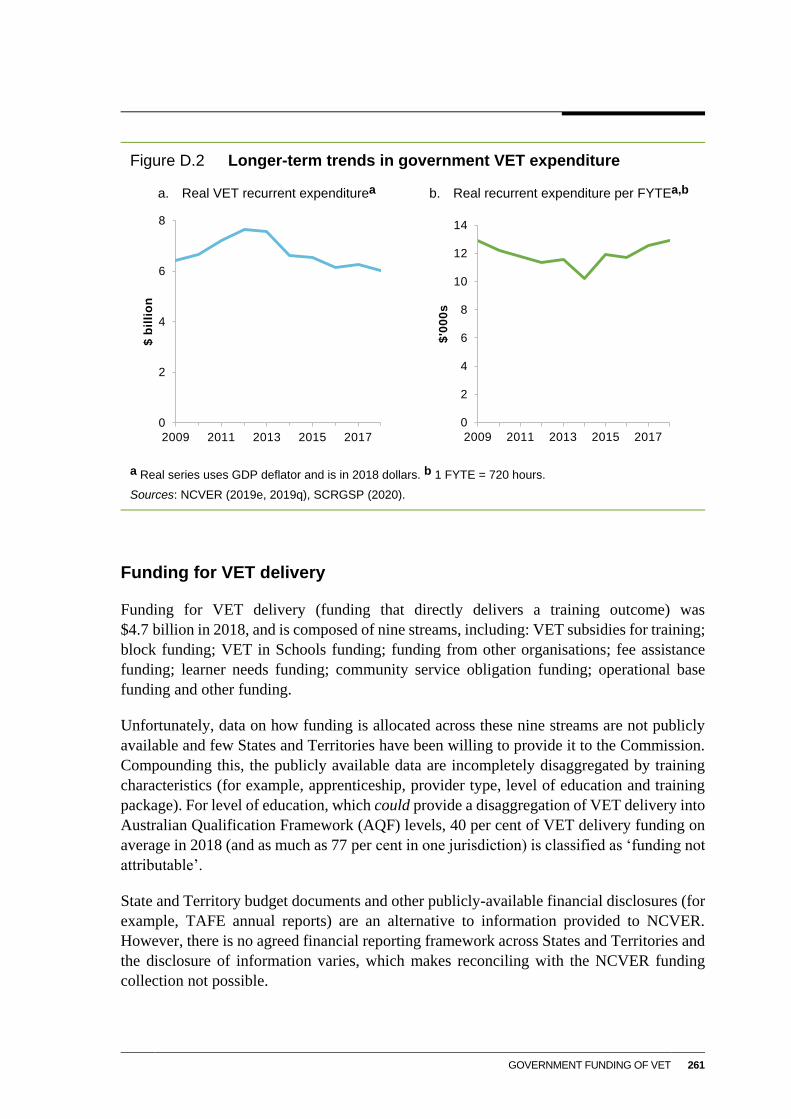
GOVERNMENT FUNDING OF VET 261
Figure D.2 Longer-term trends in government VET expenditure
a. Real VET recurrent expenditurea b. Real recurrent expenditure per FYTEa,b
a Real series uses GDP deflator and is in 2018 dollars. b 1 FYTE = 720 hours.
Sources: NCVER (2019e, 2019q), SCRGSP (2020).
Funding for VET delivery
Funding for VET delivery (funding that directly delivers a training outcome) was
$4.7 billion in 2018, and is composed of nine streams, including: VET subsidies for training;
block funding; VET in Schools funding; funding from other organisations; fee assistance
funding; learner needs funding; community service obligation funding; operational base
funding and other funding.
Unfortunately, data on how funding is allocated across these nine streams are not publicly
available and few States and Territories have been willing to provide it to the Commission.
Compounding this, the publicly available data are incompletely disaggregated by training
characteristics (for example, apprenticeship, provider type, level of education and training
package). For level of education, which could provide a disaggregation of VET delivery into
Australian Qualification Framework (AQF) levels, 40 per cent of VET delivery funding on
average in 2018 (and as much as 77 per cent in one jurisdiction) is classified as ‘funding not
attributable’.
State and Territory budget documents and other publicly-available financial disclosures (for
example, TAFE annual reports) are an alternative to information provided to NCVER.
However, there is no agreed financial reporting framework across States and Territories and
the disclosure of information varies, which makes reconciling with the NCVER funding
collection not possible.
0
2
4
6
8
2009 2011 2013 2015 2017
$ b
illi
on
0
2
4
6
8
10
12
14
2009 2011 2013 2015 2017$
'00
0s
262 NASWD REVIEW
D.2 What are governments’ aims for VET and how do
they determine subsidised skills lists?
Aims and Objectives
Victoria
The Victorian Government’s expectations for the VET sector are that it:
strongly supports industry to meet the evolving needs of the economy
provides Victorians with the skills needed for initial and continuing employment
promotes equity and addresses disadvantage
aligns with government priorities, with an emphasis on economic growth sectors. (DET
(Vic) 2019a, p. 46)
Consistent with this, the Victorian Government’s aims for VET policy include to provide
‘high-quality training … aligned to industry and workforce needs’ with additional supports
to ‘high needs learners’ (DET (Vic) 2019b).
The Victorian Government provides subsidised training to registered training organisations
(RTOs) (chosen via a contestable funding arrangement) for training that meets skills needs
and other priorities (for example, skills needs for the National Disability Insurance Scheme
and the response to the Royal Commission into Family Violence, and general foundational
courses to suit learners with low education). Courses fitting these criteria are included in the
funded course list (DET (Vic) 2019b).
Dedicated programs include the following.
Regional and Specialist Training Fund (grants worth $35 million in 2018-19). This
provides additional payments to RTOs to encourage service provision in regional areas
‘in which training providers do not offer courses through the contestable process’ (DET
(Vic) 2016, p. 1, 2019a, p. 242).
Workforce Training and Innovation fund ($29.2 million in 2018-19), which provides
funding of between $5000 and $5 million to collaborative projects between RTOs
(including TAFEs) and industry to ‘deliver innovation in training, workforce
development and applied research’ (DET (Vic) 2019d, 2019a, p. 11).
Reconnect program. Grants worth $30 million over the two years to 2019-20 were
provided to RTOs to provide long-term unemployed people who have not completed
year 12 with intensive support (for example, training assistance, supervised work
experience, health, accommodation and relationship supports (DET (Vic) 2019c).
TAFE Rescue Fund programs ($243 million for TAFEs in 2018-19). For example, under
the Free TAFE for Priority Courses initiative (introduced in 2019) 30 TAFE courses and
20 pre-apprenticeship courses were free (DET (Vic) 2019a, p. 12).

GOVERNMENT FUNDING OF VET 263
New South Wales
The New South Wales (NSW) Government’s course funding program is called Smart and
Skilled. It was introduced in 2015 to:
increase participation in VET
meet industry training needs
support TAFE NSW so that it remains a strong and viable public training provider
give students greater choice by opening VET to private training providers
improve the quality of VET
support disadvantaged students (DOE (NSW) 2017).
Smart and Skilled was also designed to be budget neutral, and student caps are used to pursue
this goal.
Subsidised training is divided into two broad funding streams: the Entitlement stream and
the Targeted Priorities stream.
The Entitlement stream subsidises qualifications on the NSW Skills List related to:
foundation skills training (Certificate levels I or II), a combination of basic reading,
writing, numeracy and oral communication
full qualifications leading to Certificate levels II or III
apprenticeship and traineeship training from Certificate Level II to Advanced Diploma.
The Targeted Priorities stream subsidises qualifications on the NSW Skills List for:
full qualifications leading to a Certificate Level IV, Diploma or Advanced Diploma, not
undertaken as an apprenticeship or traineeship
pre-vocational training to get people ready for work
part-qualifications for priority occupations and industry sectors where a small amount of
retraining of the workforce may be needed to meet skill needs.
Queensland
The Queensland Government’s annual VET investment plan articulates the following
high-level objectives (DESBT (Qld) 2018):
Developing skills specific to Queensland’s current and future workforce needs by
providing opportunities for individuals to continue to skill, reskill and upskill throughout
their working lives.
Preparing all Queenslanders to meet industry and employer needs in the labour market
(with a focus on small business).
264 NASWD REVIEW
Supporting regional jobs growth by integrating regional-specific and industry-specific
needs and connecting local people with local jobs.
Ensuring inclusivity and equity of access by providing extra support for some
Queenslanders in priority groups and who have higher needs.
Ensuring viability of the public provider in recognition of its critical role in supporting
jobs in regional centres, and also encouraging public provider innovation.
There are four key VET programs in Queensland:
1. User Choice (for apprenticeships)
2. Certificate III Guarantee (C3G) and Higher Level Skills (HLS) (entitlement and skill
priority programs)
3. Skilling Queenslanders for Work (additional support to meet access and
equity/foundational skills objectives)
4. Direct grants to TAFE Queensland.
South Australia
South Australia’s skills policy objectives include focusing on occupations in demand and
industry sectors with predicted future growth (SADIS 2019).
South Australia’s primary program, Skilling South Australia, is aimed at increasing
apprentices and trainees. It aims at increasing VET participation and ensuring the
qualifications meet the needs of industry.
Another focus of the South Australian Government has been ensuring the viability and
efficiency of its public provider. In its policy document A Fresh Start for TAFE SA, the South
Australian Government flagged introducing a new funding model to improve the public
provider’s efficiency and incentives to invest in its workforce, by incorporating greater
funding contestability (DFESA 2018).
Western Australia
The 2018–2021 West Australian State Training Plan identified funding priorities, policy
priorities and priority actions (DTWD (WA) 2018). Its stated funding priorities are:
State priority occupations
apprenticeships and traineeships
social assistance and allied health
to diversify and broaden WA’s skills base.
GOVERNMENT FUNDING OF VET 265
Western Australia’s policy priorities are to:
increase the number of Western Australians with post-school qualifications
enhance links between its industries and the VET sector
meet the growing skill demands of its social assistance and allied health workforce
be responsive to emerging industries, and advances in technology and innovation.
Priority actions are to:
increase student participation in VET through TAFE and private training providers
make VET more adaptive to industry needs, and foster partnerships with local industries
develop and implement a coordinated workforce development plan and VET pathways.
Tasmania
The Tasmanian government focuses VET funding on raising ‘education and skills levels and
ensuring that the disparate population has access to relevant skills linked to local economies’
(sub. 32, p. 5).
The Tasmanian Government has six training and workforce development priorities for
2018–21:
1. Invest in training and workforce development activities in priority industries to drive
economic growth and employment.
2. Facilitate a high quality, responsive and flexible training system.
3. Support TasTAFE to be a high quality, contemporary and responsive public provider.
4. Support more apprenticeships and traineeships.
5. Support all Tasmanians to access training and gain skills to participate in the economy
and community.
6. Promote vocational pathways within a modern economy. (DSG (Tas) 2018)
Northern Territory
As stated in the VET investment framework, the Northern Territory Government’s priorities
for the VET sector are:
supporting specific parts of NT economy as identified in the NT Economic Development
Framework (which itself is designed to increase private sector investment in the NT)
creating a skilled and capable workforce to attract and deliver new major projects in the
Territory
meeting industry and business needs to ensure they have the capability and capacity to
develop and grow
266 NASWD REVIEW
increasing Aboriginal workforce participation by upskilling and reskilling of Aboriginal
people. (NT Government 2017, 2018, 2020).
The VET investment framework is based on five principles.
1. Targeted: quantitative approach to investing in VET in priority identified areas.
2. Considered: ongoing consultation with peak industry bodies, businesses and registered
training organisations.
3. Flexible: flexibly meet government priorities in delivering a skilled workforce.
4. Responsive: quickly respond to changing economic and employment conditions.
5. Transparent: allow the public, businesses and industry to easily understand how the
government intends to invest in VET. (NT Government 2020)
The framework is focused on increasing enrolments and completions in apprenticeships and
traineeships, higher level skills, increasing support for equity cohorts and addressing
foundation skill gaps (NT Government 2020).
Australian Capital Territory
The Commission has only discovered the ACT Government’s Skills and Training Policy
Directions paper from 2014. It articulated the following high-level policy objectives:
strengthening engagement with industry, business and other stakeholders to maximise
training and employment outcomes
targeting government funding to support training in areas of highest needs to best provide
the skills needed by industry, students and the ACT community
ensuring training is of the highest quality
providing better access to training with additional supports to promote completions,
particularly for those experiencing disadvantage. (ETD (ACT) 2015)
How do governments determine skill lists and rank policy priorities?
Victoria
The Funded Course List (FCL) contains the courses that attract subsidies and the amounts are
publicly available on the Skills First website. The Victorian Government stated that the FCL
is reviewed regularly, with courses added as required by industry needs (DOE (Vic) 2020).
The 2020 FCL has about 800 courses (Victorian Government, sub. 58). ‘Prior to the
implementation of Skills First in 2017, the Victorian Government funded over 1500 courses,
and many of these delivered limited economic or social value for the State’ (Victorian
Government, sub. 58, p. 7).
GOVERNMENT FUNDING OF VET 267
The stated aims for courses on the FCL are to:
Align with industry needs and workforce demands.
Represent Government priorities, including rolling out the National disability Insurance Scheme
(NDIS), responding to family violence, and completing Victoria’s infrastructure projects.
Have a strong jobs outcome, such as apprenticeships.
Meet other social needs, such as foundation skill courses. (DOE (Vic) 2020)
The FCL is also devised in consultation with industry (Victorian Government, sub. 58).
New South Wales
The NSW Skills List outlines the qualifications eligible for a government subsidy under its
Smart and Skilled program. The Skills List is developed through industry and community
consultation and labour market research. Its training department considers the following
criteria for adding a qualification to the Skills List:
strong evidence of continuing and future industry need for the qualification
good employment outcomes, including improving job and career outcomes like wages
pathway to further study
entry level qualification to gain employment in an occupation or industry
supports regional economic development and communities
provides support for small business
benefits disadvantaged/equity groups (including market-based or social benefits)
supports key government strategies (for example, implementing the National Disability
Insurance Scheme). (Training Services NSW 2020)
The first two criteria are given the most weighting for assessment.
The NSW Skills List is reviewed twice a year, to ensure it meets the changing needs of
industry. Furthermore, the list is updated regularly during the year to reflect changes to
qualifications and vocational training orders for apprenticeships and traineeships.
Queensland
Priority courses are ranked on a graded scale. A priority ranking from 1 (high) to 4 (low) is
used, with the highest priority given to qualifications that:
support skills demand and long-term workforce planning priorities identified in consultation
with industry
are assessed as highly effective in generating outcomes for graduates, based on a range of
factors, including:
- occupational demand and supply, and projections for employment
268 NASWD REVIEW
- relative earnings of qualified and unqualified persons employed in relevant occupations
- employment outcomes gained by graduates. (DESBT (Qld) 2019d)
Queensland’s priority skills list is updated annually.
Western Australia
The Western Australian Government develops a State Priority Occupation List (SPOL) each
year. There are five separate categories for priority occupations.
State priority 1 – The highest priority occupations where structural and market-driven issues
are impacting at the State level.
State priority 2 – The second highest level of priority where structural and/or market-driven
issues are impacting at the State level.
State priority 3 – The third tier of priority and representing either occupations of pending
concern and/or where supply is essential for the State’s economy.
Other identified occupations – Refers to occupations where there is inconsistent or conflicting
evidence relating to structural or market driven issues. These occupations are closely
monitored by the Department.
Not identified as a priority – Refers to occupations with no evidence for inclusion on the
priority list. (DTWD (WA) 2019)
The SPOL is used for a variety of purposes:
The SPOL … focuses on current skills shortages, but also the maintenance of occupational supply
chains to both support employment growth and satisfy net replacement need in order to prevent
future skills shortages in the State. (Western Australian Government, sub 20. p. 6)
Under Future Skills WA, eligible students are guaranteed a place in a range of State priority
training programs. The qualifications obtained from these programs aim to equip people to
work in occupations that are, or are expected to be, in high demand (based on the SPOL). In
addition to using the SPOL the determination of priority qualifications also takes into
account other considerations, including:
… overall budget outcomes; the mix of public and private investment in training; industry advice
on preferred training pathways; achievement of Commonwealth and State funding agreement
outputs; and the directions articulated in the State Training Plan. (DTWD (WA) 2013, p. 20)
South Australia
South Australia maintains a Subsidised Training List (STL), outlining courses that are
eligible for subsidy in South Australia. It was unclear to the Commission how or what
specific criteria were used to determine how courses are allocated to the STL.
GOVERNMENT FUNDING OF VET 269
Government investment is targeted towards training activities that complement rather than
replace existing funds from other sources (such as individual investment or employers).
The number of training places allocated are then determined by taking into account the
following priorities: maintaining a balanced budget, commitments to existing students and
contracts, providing stability in the training market, and aligning the economic and social
needs of South Australia (DFESA 2018; Training and Skills Commission, SA 2017).
Northern Territory
The Northern Territory skilled occupation priority list (NTSOPL) is produced annually and
published in March each year. It contains a list of skilled occupations that are ‘in high
demand or considered critical by business and industry in the Northern Territory’ (DTBI
(NT) 2019, p. 3). It is used to help target skills in the NT through linking training funding to
skills demand, but also for other reasons, including targeting workers through skilled
migration schemes. As noted in chapter 4 the Northern Territory Government determines
VET funding allocations on a case by case basis (not through set course subsidies).
There is a two-step process to develop the NTSOPL. First, the preliminary list of occupations
is determined. Second, that list is refined (some occupations are removed). The first step to
determine the preliminary list, includes that the occupation satisfy four criteria:
quality data: there must be adequate information about the occupation to assess and
validate it. The occupation must be clearly defined (with a 6 digit ANZSCO code)
skill level: the occupation must have specialised skills that require extended learning and
training time (for example, through post-school qualifications)
clear pathways: the occupation must have a clear education and/or training pathway
occupational impact: the occupation will be considered if any disruption in its supply
would result in significant industry or economic impacts. (DTBI (NT) 2019)
The preliminary list is then refined by including factors such as its relative priority (for
example ‘high priority’ or ‘priority’ and the list is circulated to industry association and other
bodies for feedback and consideration. If an occupation is not identified as a priority it is not
included on the NTSOPL (DTBI (NT) 2019).If an occupation is not identified as a priority
it is not included on the NTSOPL (DTBI (NT) 2019).
Other
As far as the Commission is aware, information on how skills lists are determined in
Tasmania and the ACT is not publicly available.
270 NASWD REVIEW
D.3 Funding and pricing of subsidised courses
States and Territories use funding contracts with RTOs and accompanying policy documents
to regulate the provision of subsidised courses. This section contains tables that outline key
regulatory settings.
The data in the tables represent the Commission’s understanding of a broad range of VET
funding and pricing measures in the States and Territories in 2020. All States and Territories
were consulted on the accuracy of the information presented and the Commission has
endeavoured to ensure that the information is relevant and up to date. That said, given the
plethora of VET programs and policies and how frequently the settings change, as well as
the difficulties that the Commission has faced in obtaining information, this list may not be
comprehensive.
Tables D.1–8 contain summaries of each of the State and Territory VET policy settings,
including information on:
fees, prices and subsidies for subsidised courses
how the costs of courses are derived for the purposes of determining subsidies. As
explained in chapter 4, jurisdictions calculate an hourly cost (base rate) for each
qualification. This can vary by industry or field of education. The qualification cost
estimate is the number of hours multiplied by the base rate, plus any fixed costs
the cost methodology, including data source and year. In addition to the qualification cost
estimate, loadings are added, which reflect the higher cost of provision to some groups,
including due to the location of training delivery or a student’s background. The numbers
in the table reflect the additional percentage loading applied to the base qualification
estimate
contract and quality management. Some States and Territories set out quality frameworks
that outline their approaches to managing the quality of services and contracts with
RTOs. These frameworks usually specify, among other things: RTO eligibility
requirements; statements of expectations; performance monitoring and compliance
requirements; and consumer protection provisions. It also outlines key aspects of State
and Territory quality frameworks.
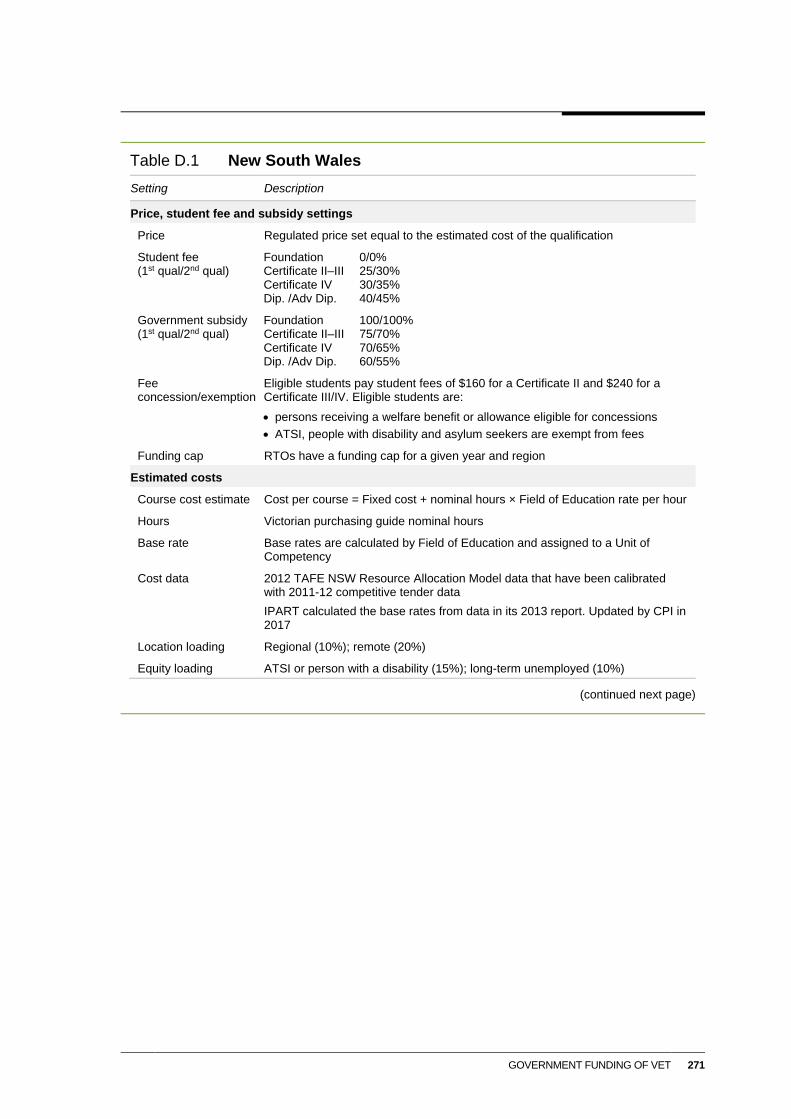
GOVERNMENT FUNDING OF VET 271
Table D.1 New South Wales
Setting Description
Price, student fee and subsidy settings
Price Regulated price set equal to the estimated cost of the qualification
Student fee (1st qual/2nd qual)
Foundation 0/0% Certificate II–III 25/30% Certificate IV 30/35% Dip. /Adv Dip. 40/45%
Government subsidy (1st qual/2nd qual)
Foundation 100/100% Certificate II–III 75/70% Certificate IV 70/65% Dip. /Adv Dip. 60/55%
Fee concession/exemption
Eligible students pay student fees of $160 for a Certificate II and $240 for a Certificate III/IV. Eligible students are:
persons receiving a welfare benefit or allowance eligible for concessions
ATSI, people with disability and asylum seekers are exempt from fees
Funding cap RTOs have a funding cap for a given year and region
Estimated costs
Course cost estimate Cost per course = Fixed cost + nominal hours × Field of Education rate per hour
Hours Victorian purchasing guide nominal hours
Base rate Base rates are calculated by Field of Education and assigned to a Unit of Competency
Cost data 2012 TAFE NSW Resource Allocation Model data that have been calibrated with 2011-12 competitive tender data
IPART calculated the base rates from data in its 2013 report. Updated by CPI in 2017
Location loading Regional (10%); remote (20%)
Equity loading ATSI or person with a disability (15%); long-term unemployed (10%)
(continued next page)
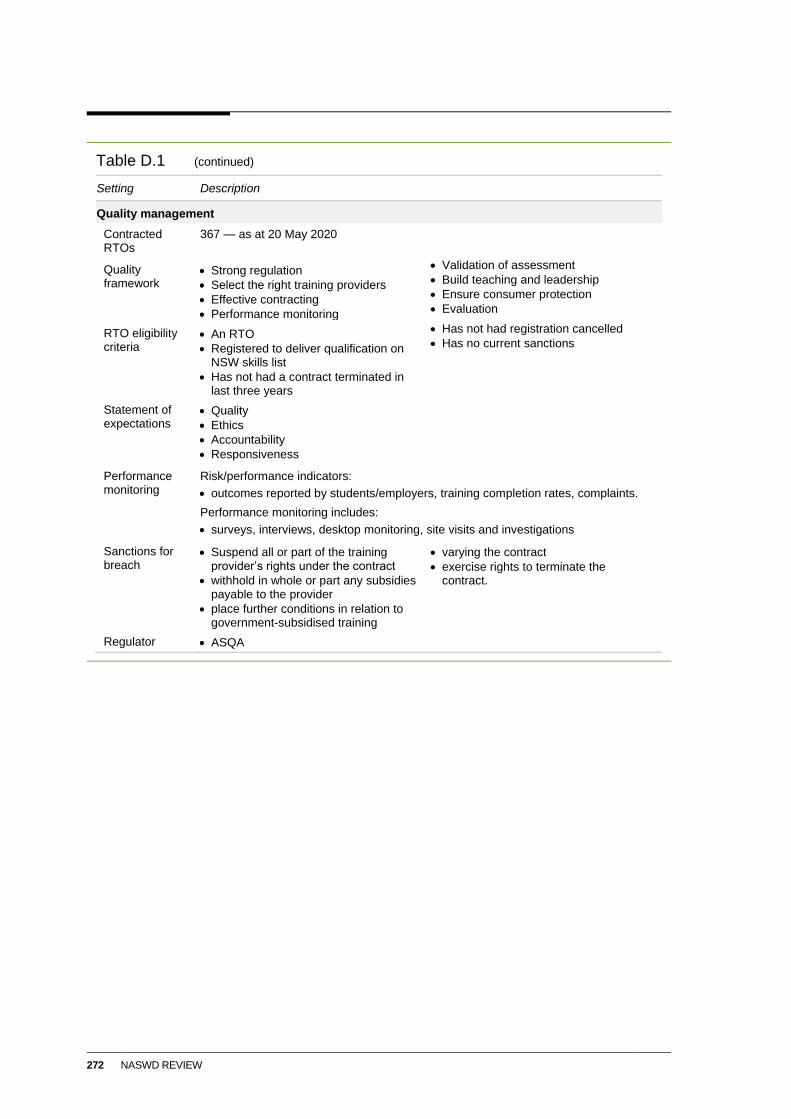
272 NASWD REVIEW
Table D.1 (continued)
Setting Description
Quality management
Contracted RTOs
367 — as at 20 May 2020
Quality framework
Strong regulation
Select the right training providers
Effective contracting
Performance monitoring
Validation of assessment
Build teaching and leadership
Ensure consumer protection
Evaluation
RTO eligibility criteria
An RTO
Registered to deliver qualification on NSW skills list
Has not had a contract terminated in last three years
Has not had registration cancelled
Has no current sanctions
Statement of expectations
Quality
Ethics
Accountability
Responsiveness
Performance monitoring
Risk/performance indicators:
outcomes reported by students/employers, training completion rates, complaints.
Performance monitoring includes:
surveys, interviews, desktop monitoring, site visits and investigations
Sanctions for breach
Suspend all or part of the training provider’s rights under the contract
withhold in whole or part any subsidies payable to the provider
place further conditions in relation to government-subsidised training
varying the contract
exercise rights to terminate the contract.
Regulator ASQA
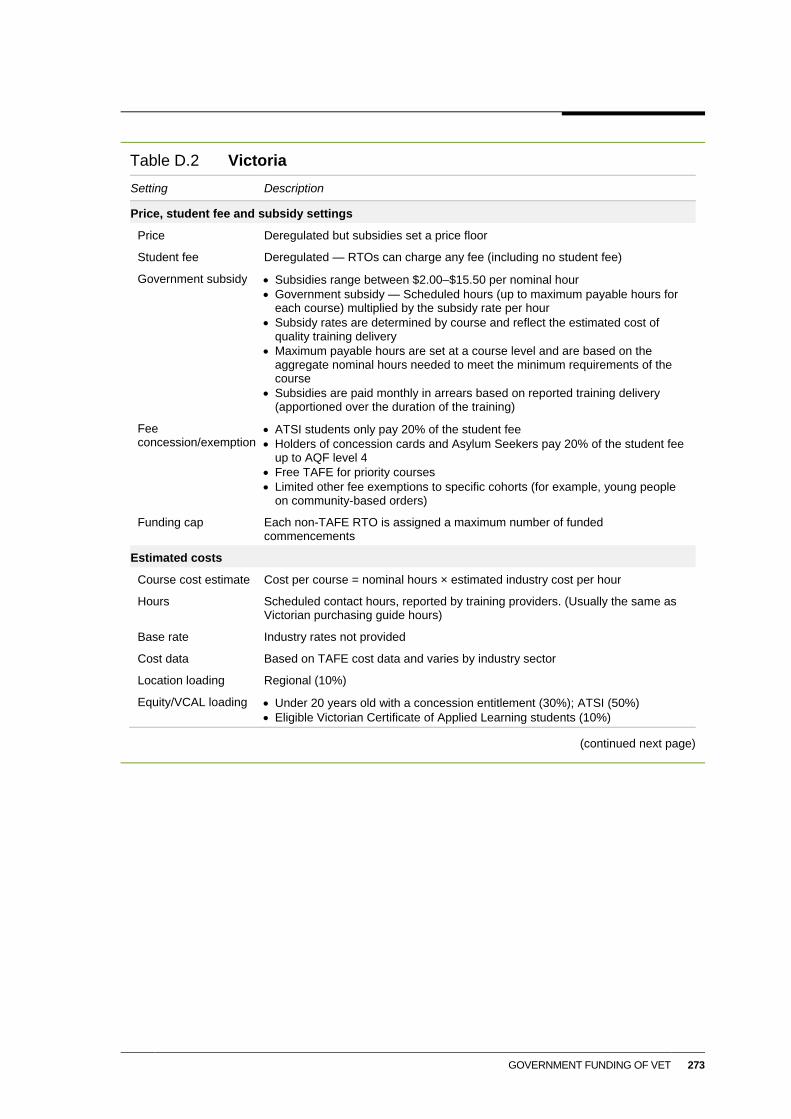
GOVERNMENT FUNDING OF VET 273
Table D.2 Victoria
Setting Description
Price, student fee and subsidy settings
Price Deregulated but subsidies set a price floor
Student fee Deregulated — RTOs can charge any fee (including no student fee)
Government subsidy Subsidies range between $2.00–$15.50 per nominal hour
Government subsidy — Scheduled hours (up to maximum payable hours for each course) multiplied by the subsidy rate per hour
Subsidy rates are determined by course and reflect the estimated cost of quality training delivery
Maximum payable hours are set at a course level and are based on the aggregate nominal hours needed to meet the minimum requirements of the course
Subsidies are paid monthly in arrears based on reported training delivery (apportioned over the duration of the training)
Fee concession/exemption
ATSI students only pay 20% of the student fee
Holders of concession cards and Asylum Seekers pay 20% of the student fee up to AQF level 4
Free TAFE for priority courses
Limited other fee exemptions to specific cohorts (for example, young people on community-based orders)
Funding cap Each non-TAFE RTO is assigned a maximum number of funded commencements
Estimated costs
Course cost estimate Cost per course = nominal hours × estimated industry cost per hour
Hours Scheduled contact hours, reported by training providers. (Usually the same as Victorian purchasing guide hours)
Base rate Industry rates not provided
Cost data Based on TAFE cost data and varies by industry sector
Location loading Regional (10%)
Equity/VCAL loading Under 20 years old with a concession entitlement (30%); ATSI (50%)
Eligible Victorian Certificate of Applied Learning students (10%)
(continued next page)
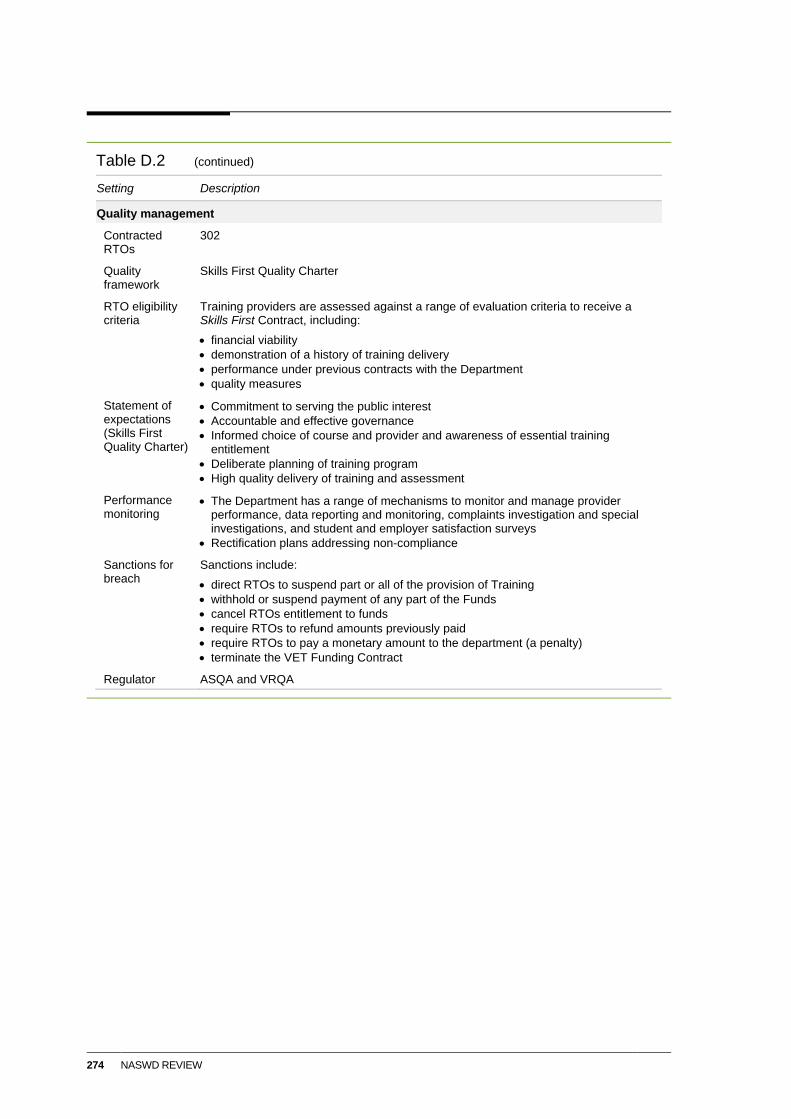
274 NASWD REVIEW
Table D.2 (continued)
Setting Description
Quality management
Contracted RTOs
302
Quality framework
Skills First Quality Charter
RTO eligibility criteria
Training providers are assessed against a range of evaluation criteria to receive a Skills First Contract, including:
financial viability
demonstration of a history of training delivery
performance under previous contracts with the Department
quality measures
Statement of expectations (Skills First Quality Charter)
Commitment to serving the public interest
Accountable and effective governance
Informed choice of course and provider and awareness of essential training entitlement
Deliberate planning of training program
High quality delivery of training and assessment
Performance monitoring
The Department has a range of mechanisms to monitor and manage provider performance, data reporting and monitoring, complaints investigation and special investigations, and student and employer satisfaction surveys
Rectification plans addressing non-compliance
Sanctions for breach
Sanctions include:
direct RTOs to suspend part or all of the provision of Training
withhold or suspend payment of any part of the Funds
cancel RTOs entitlement to funds
require RTOs to refund amounts previously paid
require RTOs to pay a monetary amount to the department (a penalty)
terminate the VET Funding Contract
Regulator ASQA and VRQA
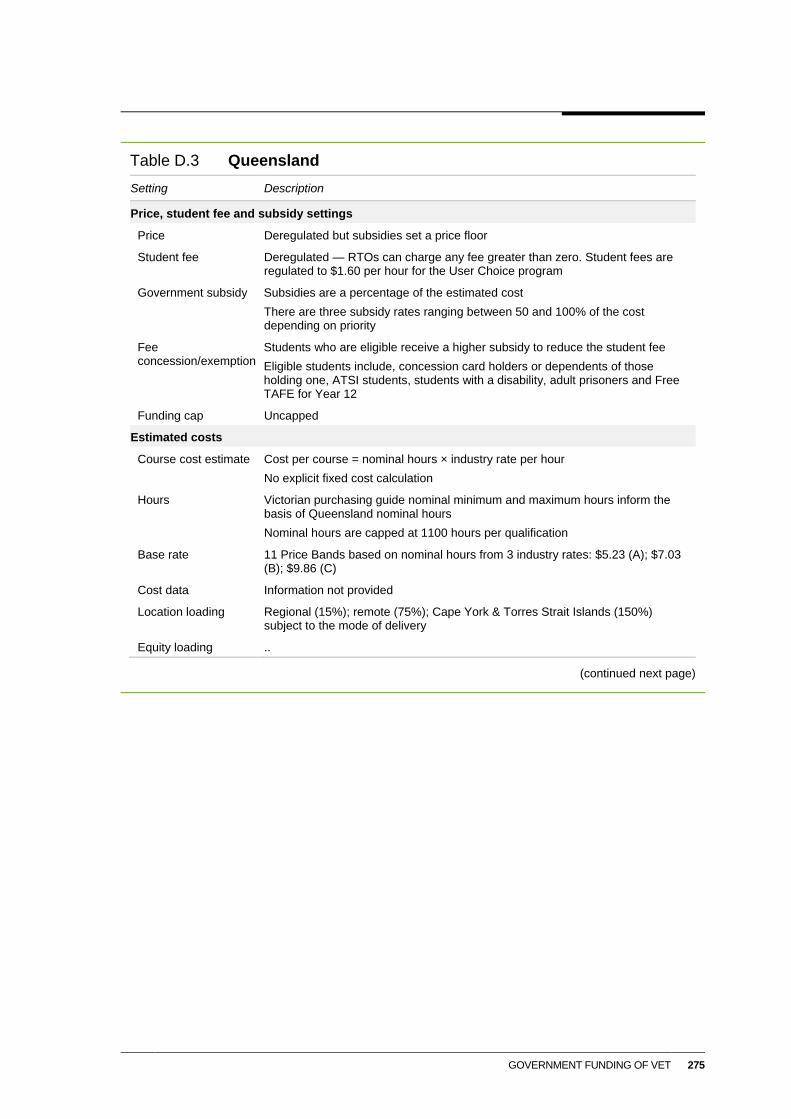
GOVERNMENT FUNDING OF VET 275
Table D.3 Queensland
Setting Description
Price, student fee and subsidy settings
Price Deregulated but subsidies set a price floor
Student fee Deregulated — RTOs can charge any fee greater than zero. Student fees are regulated to $1.60 per hour for the User Choice program
Government subsidy Subsidies are a percentage of the estimated cost
There are three subsidy rates ranging between 50 and 100% of the cost depending on priority
Fee concession/exemption
Students who are eligible receive a higher subsidy to reduce the student fee
Eligible students include, concession card holders or dependents of those holding one, ATSI students, students with a disability, adult prisoners and Free TAFE for Year 12
Funding cap Uncapped
Estimated costs
Course cost estimate Cost per course = nominal hours × industry rate per hour
No explicit fixed cost calculation
Hours Victorian purchasing guide nominal minimum and maximum hours inform the basis of Queensland nominal hours
Nominal hours are capped at 1100 hours per qualification
Base rate 11 Price Bands based on nominal hours from 3 industry rates: $5.23 (A); $7.03 (B); $9.86 (C)
Cost data Information not provided
Location loading Regional (15%); remote (75%); Cape York & Torres Strait Islands (150%) subject to the mode of delivery
Equity loading ..
(continued next page)
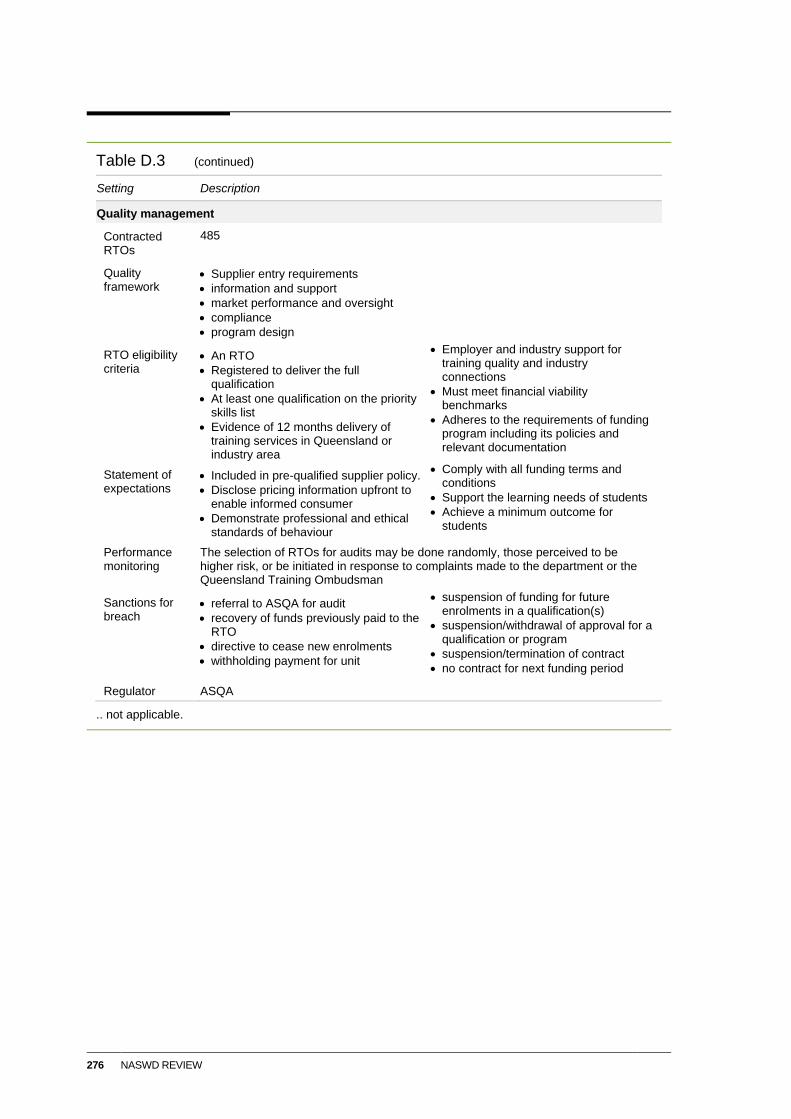
276 NASWD REVIEW
Table D.3 (continued)
Setting Description
Quality management
Contracted RTOs
485
Quality framework
Supplier entry requirements
information and support
market performance and oversight
compliance
program design
RTO eligibility criteria
An RTO
Registered to deliver the full qualification
At least one qualification on the priority skills list
Evidence of 12 months delivery of training services in Queensland or industry area
Employer and industry support for training quality and industry connections
Must meet financial viability benchmarks
Adheres to the requirements of funding program including its policies and relevant documentation
Statement of expectations
Included in pre-qualified supplier policy.
Disclose pricing information upfront to enable informed consumer
Demonstrate professional and ethical standards of behaviour
Comply with all funding terms and conditions
Support the learning needs of students
Achieve a minimum outcome for students
Performance monitoring
The selection of RTOs for audits may be done randomly, those perceived to be higher risk, or be initiated in response to complaints made to the department or the Queensland Training Ombudsman
Sanctions for breach
referral to ASQA for audit
recovery of funds previously paid to the RTO
directive to cease new enrolments
withholding payment for unit
suspension of funding for future enrolments in a qualification(s)
suspension/withdrawal of approval for a qualification or program
suspension/termination of contract
no contract for next funding period
Regulator ASQA
.. not applicable.
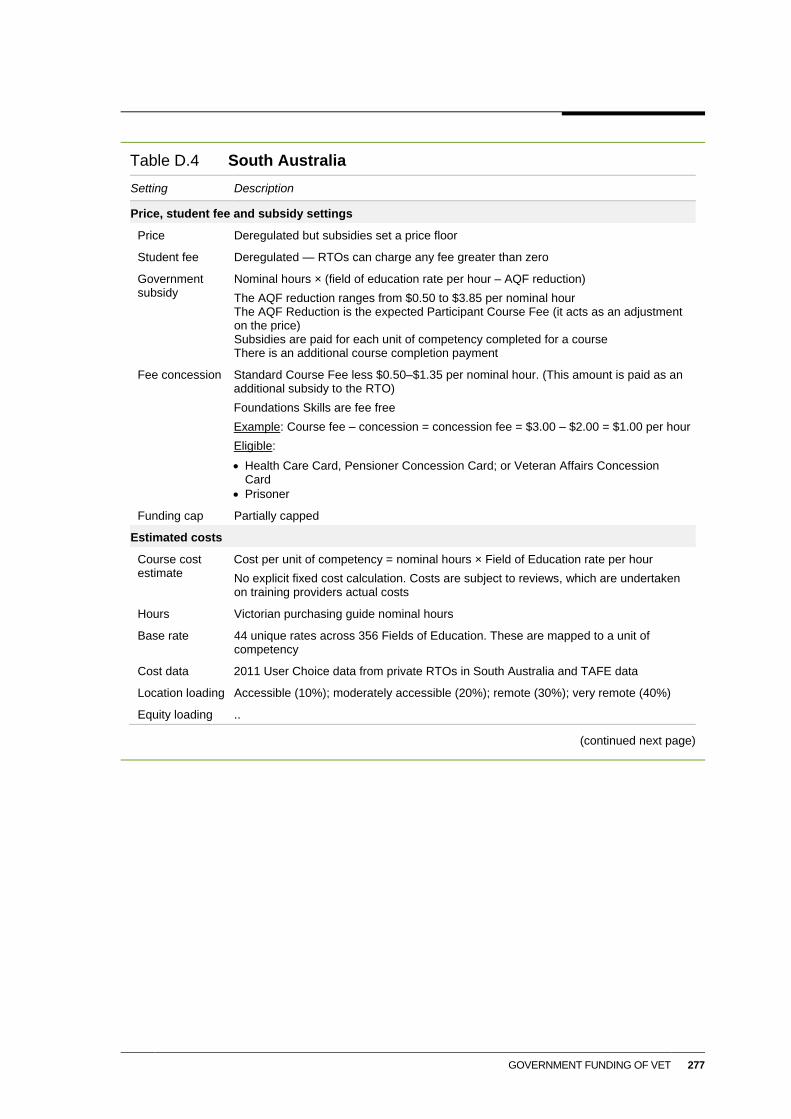
GOVERNMENT FUNDING OF VET 277
Table D.4 South Australia
Setting Description
Price, student fee and subsidy settings
Price Deregulated but subsidies set a price floor
Student fee Deregulated — RTOs can charge any fee greater than zero
Government subsidy
Nominal hours × (field of education rate per hour – AQF reduction)
The AQF reduction ranges from $0.50 to $3.85 per nominal hour The AQF Reduction is the expected Participant Course Fee (it acts as an adjustment on the price) Subsidies are paid for each unit of competency completed for a course There is an additional course completion payment
Fee concession Standard Course Fee less $0.50–$1.35 per nominal hour. (This amount is paid as an additional subsidy to the RTO)
Foundations Skills are fee free
Example: Course fee – concession = concession fee = $3.00 – $2.00 = $1.00 per hour
Eligible:
Health Care Card, Pensioner Concession Card; or Veteran Affairs Concession Card
Prisoner
Funding cap Partially capped
Estimated costs
Course cost estimate
Cost per unit of competency = nominal hours × Field of Education rate per hour
No explicit fixed cost calculation. Costs are subject to reviews, which are undertaken on training providers actual costs
Hours Victorian purchasing guide nominal hours
Base rate 44 unique rates across 356 Fields of Education. These are mapped to a unit of competency
Cost data 2011 User Choice data from private RTOs in South Australia and TAFE data
Location loading Accessible (10%); moderately accessible (20%); remote (30%); very remote (40%)
Equity loading ..
(continued next page)
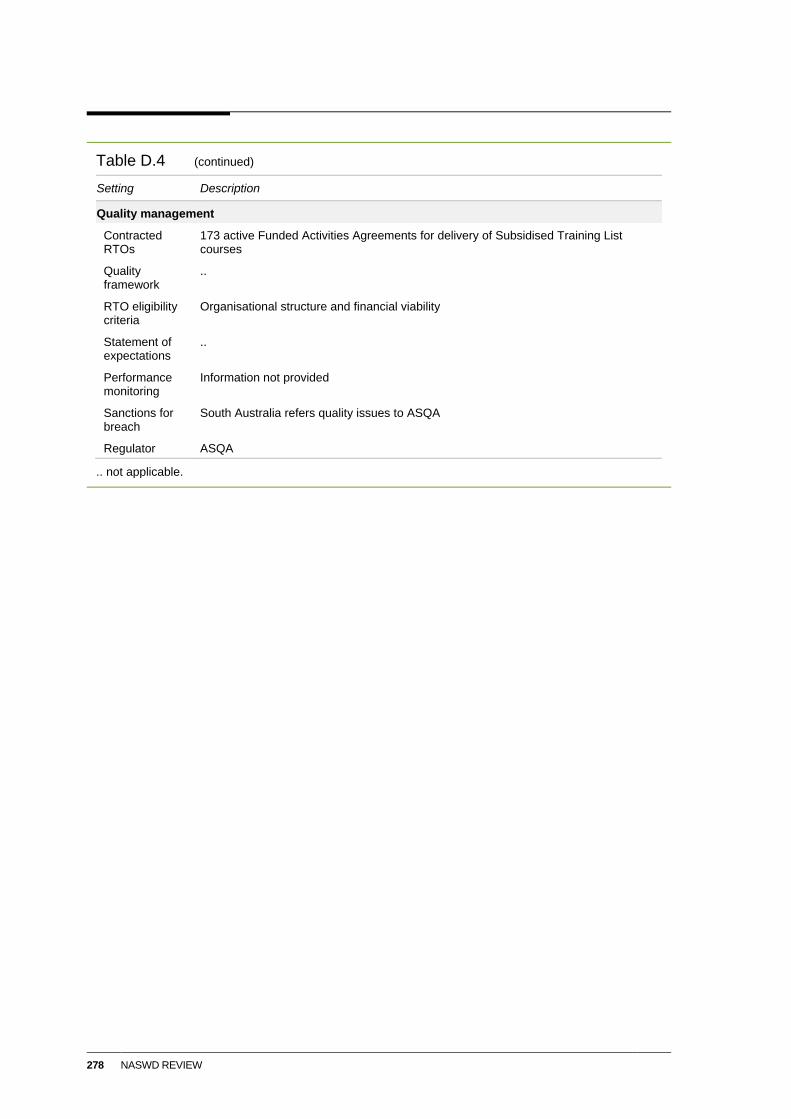
278 NASWD REVIEW
Table D.4 (continued)
Setting Description
Quality management
Contracted RTOs
173 active Funded Activities Agreements for delivery of Subsidised Training List courses
Quality framework
..
RTO eligibility criteria
Organisational structure and financial viability
Statement of expectations
..
Performance monitoring
Information not provided
Sanctions for breach
South Australia refers quality issues to ASQA
Regulator ASQA
.. not applicable.
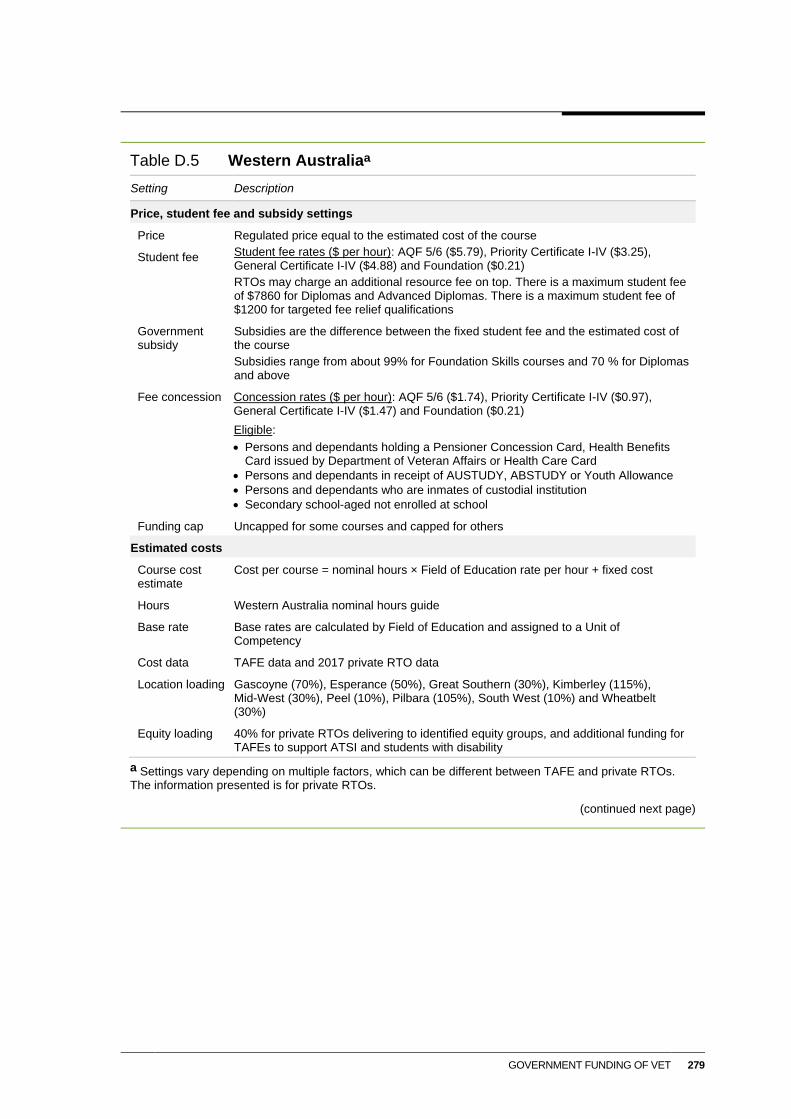
GOVERNMENT FUNDING OF VET 279
Table D.5 Western Australiaa
Setting Description
Price, student fee and subsidy settings
Price Regulated price equal to the estimated cost of the course
Student fee Student fee rates ($ per hour): AQF 5/6 ($5.79), Priority Certificate I-IV ($3.25), General Certificate I-IV ($4.88) and Foundation ($0.21)
RTOs may charge an additional resource fee on top. There is a maximum student fee of $7860 for Diplomas and Advanced Diplomas. There is a maximum student fee of $1200 for targeted fee relief qualifications
Government subsidy
Subsidies are the difference between the fixed student fee and the estimated cost of the course
Subsidies range from about 99% for Foundation Skills courses and 70 % for Diplomas and above
Fee concession Concession rates ($ per hour): AQF 5/6 ($1.74), Priority Certificate I-IV ($0.97), General Certificate I-IV ($1.47) and Foundation ($0.21)
Eligible:
Persons and dependants holding a Pensioner Concession Card, Health Benefits Card issued by Department of Veteran Affairs or Health Care Card
Persons and dependants in receipt of AUSTUDY, ABSTUDY or Youth Allowance
Persons and dependants who are inmates of custodial institution
Secondary school-aged not enrolled at school
Funding cap Uncapped for some courses and capped for others
Estimated costs
Course cost estimate
Cost per course = nominal hours × Field of Education rate per hour + fixed cost
Hours Western Australia nominal hours guide
Base rate Base rates are calculated by Field of Education and assigned to a Unit of Competency
Cost data TAFE data and 2017 private RTO data
Location loading Gascoyne (70%), Esperance (50%), Great Southern (30%), Kimberley (115%), Mid-West (30%), Peel (10%), Pilbara (105%), South West (10%) and Wheatbelt (30%)
Equity loading 40% for private RTOs delivering to identified equity groups, and additional funding for TAFEs to support ATSI and students with disability
a Settings vary depending on multiple factors, which can be different between TAFE and private RTOs. The information presented is for private RTOs.
(continued next page)
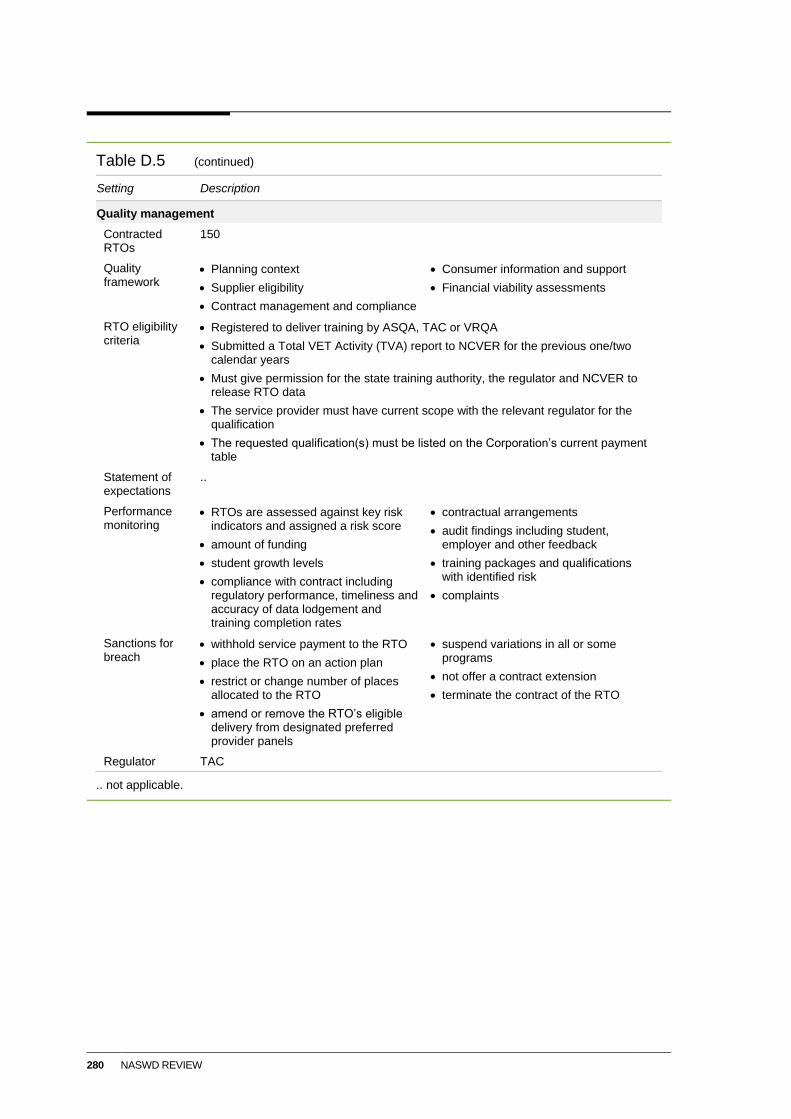
280 NASWD REVIEW
Table D.5 (continued)
Setting Description
Quality management
Contracted RTOs
150
Quality framework
Planning context
Supplier eligibility
Contract management and compliance
Consumer information and support
Financial viability assessments
RTO eligibility criteria
Registered to deliver training by ASQA, TAC or VRQA
Submitted a Total VET Activity (TVA) report to NCVER for the previous one/two calendar years
Must give permission for the state training authority, the regulator and NCVER to release RTO data
The service provider must have current scope with the relevant regulator for the qualification
The requested qualification(s) must be listed on the Corporation’s current payment table
Statement of expectations
..
Performance monitoring
RTOs are assessed against key risk indicators and assigned a risk score
amount of funding
student growth levels
compliance with contract including regulatory performance, timeliness and accuracy of data lodgement and training completion rates
contractual arrangements
audit findings including student, employer and other feedback
training packages and qualifications with identified risk
complaints
Sanctions for breach
withhold service payment to the RTO
place the RTO on an action plan
restrict or change number of places allocated to the RTO
amend or remove the RTO’s eligible delivery from designated preferred provider panels
suspend variations in all or some programs
not offer a contract extension
terminate the contract of the RTO
Regulator TAC
.. not applicable.
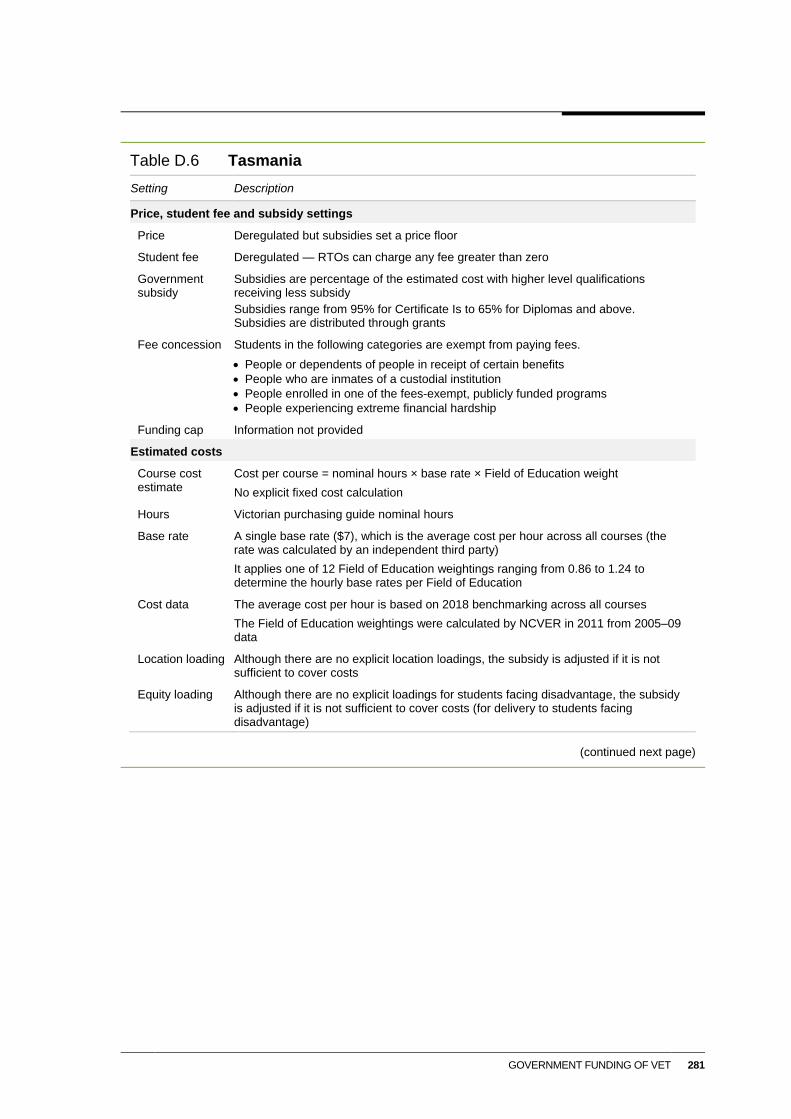
GOVERNMENT FUNDING OF VET 281
Table D.6 Tasmania
Setting Description
Price, student fee and subsidy settings
Price Deregulated but subsidies set a price floor
Student fee Deregulated — RTOs can charge any fee greater than zero
Government subsidy
Subsidies are percentage of the estimated cost with higher level qualifications receiving less subsidy
Subsidies range from 95% for Certificate Is to 65% for Diplomas and above. Subsidies are distributed through grants
Fee concession Students in the following categories are exempt from paying fees.
People or dependents of people in receipt of certain benefits
People who are inmates of a custodial institution
People enrolled in one of the fees-exempt, publicly funded programs
People experiencing extreme financial hardship
Funding cap Information not provided
Estimated costs
Course cost estimate
Cost per course = nominal hours × base rate × Field of Education weight
No explicit fixed cost calculation
Hours Victorian purchasing guide nominal hours
Base rate A single base rate ($7), which is the average cost per hour across all courses (the rate was calculated by an independent third party)
It applies one of 12 Field of Education weightings ranging from 0.86 to 1.24 to determine the hourly base rates per Field of Education
Cost data The average cost per hour is based on 2018 benchmarking across all courses
The Field of Education weightings were calculated by NCVER in 2011 from 2005–09 data
Location loading Although there are no explicit location loadings, the subsidy is adjusted if it is not sufficient to cover costs
Equity loading Although there are no explicit loadings for students facing disadvantage, the subsidy is adjusted if it is not sufficient to cover costs (for delivery to students facing disadvantage)
(continued next page)
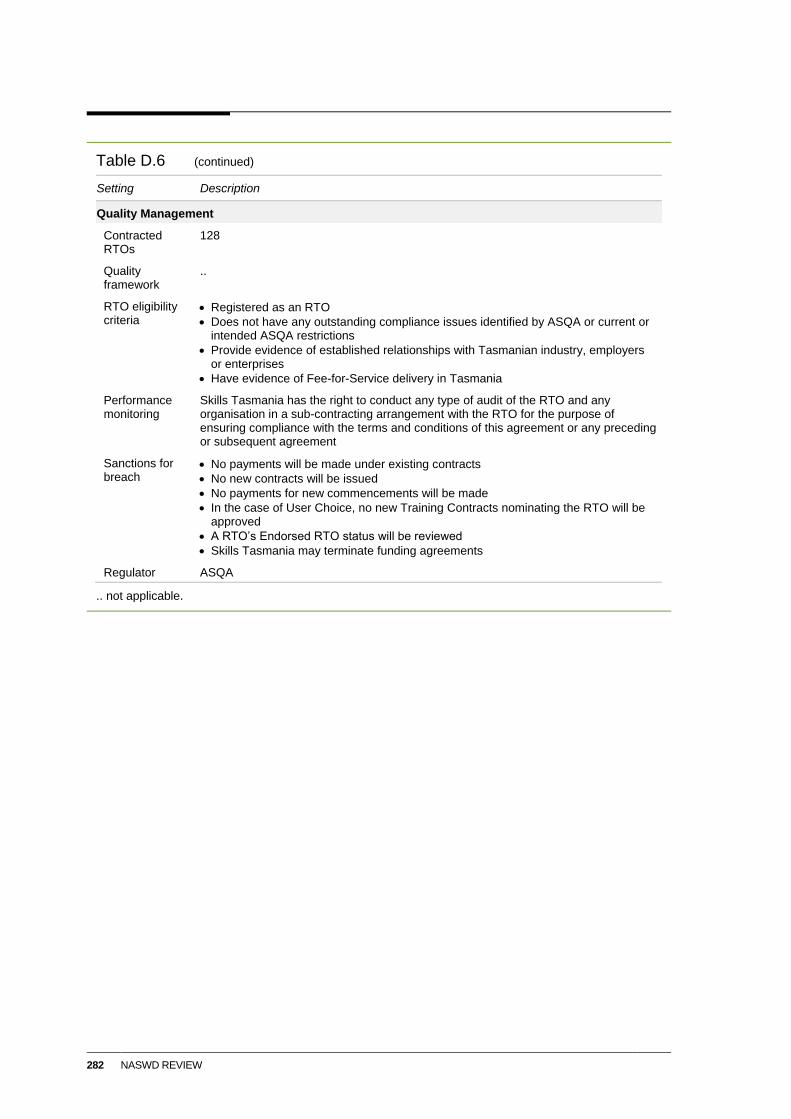
282 NASWD REVIEW
Table D.6 (continued)
Setting Description
Quality Management
Contracted RTOs
128
Quality framework
..
RTO eligibility criteria
Registered as an RTO
Does not have any outstanding compliance issues identified by ASQA or current or intended ASQA restrictions
Provide evidence of established relationships with Tasmanian industry, employers or enterprises
Have evidence of Fee-for-Service delivery in Tasmania
Performance monitoring
Skills Tasmania has the right to conduct any type of audit of the RTO and any organisation in a sub-contracting arrangement with the RTO for the purpose of ensuring compliance with the terms and conditions of this agreement or any preceding or subsequent agreement
Sanctions for breach
No payments will be made under existing contracts
No new contracts will be issued
No payments for new commencements will be made
In the case of User Choice, no new Training Contracts nominating the RTO will be approved
A RTO’s Endorsed RTO status will be reviewed
Skills Tasmania may terminate funding agreements
Regulator ASQA
.. not applicable.
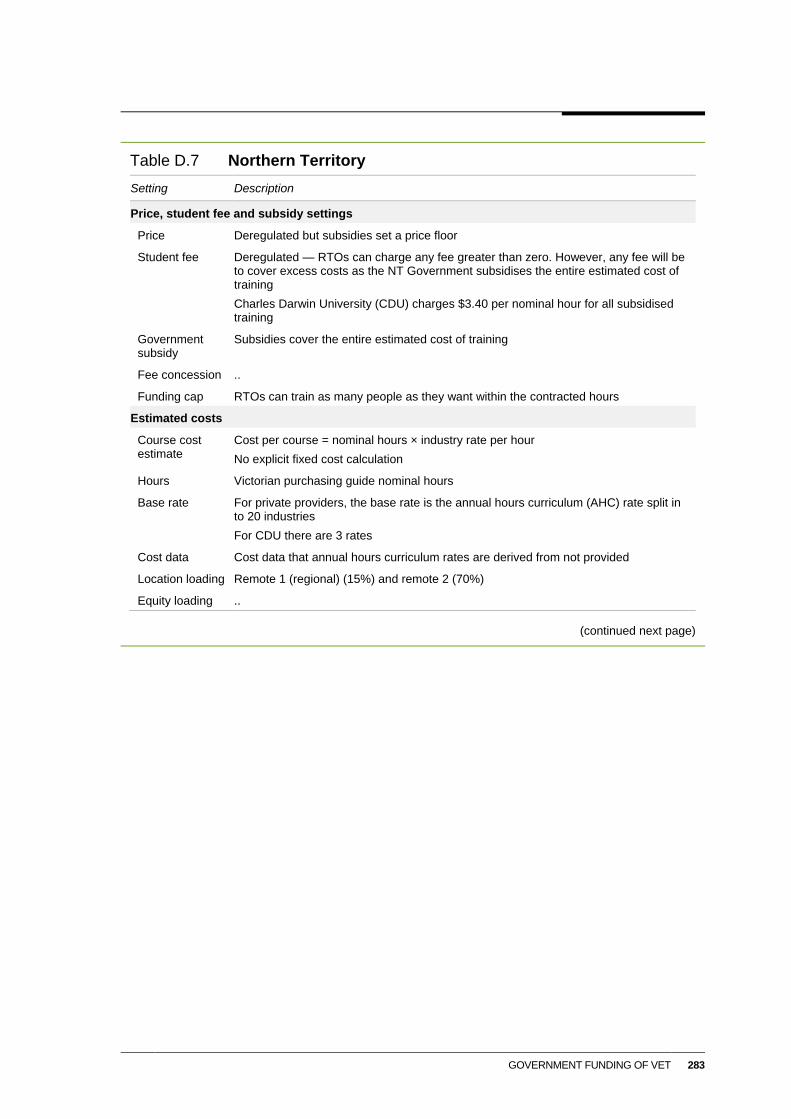
GOVERNMENT FUNDING OF VET 283
Table D.7 Northern Territory
Setting Description
Price, student fee and subsidy settings
Price Deregulated but subsidies set a price floor
Student fee Deregulated — RTOs can charge any fee greater than zero. However, any fee will be to cover excess costs as the NT Government subsidises the entire estimated cost of training
Charles Darwin University (CDU) charges $3.40 per nominal hour for all subsidised training
Government subsidy
Subsidies cover the entire estimated cost of training
Fee concession ..
Funding cap RTOs can train as many people as they want within the contracted hours
Estimated costs
Course cost estimate
Cost per course = nominal hours × industry rate per hour
No explicit fixed cost calculation
Hours Victorian purchasing guide nominal hours
Base rate For private providers, the base rate is the annual hours curriculum (AHC) rate split in to 20 industries
For CDU there are 3 rates
Cost data Cost data that annual hours curriculum rates are derived from not provided
Location loading Remote 1 (regional) (15%) and remote 2 (70%)
Equity loading ..
(continued next page)
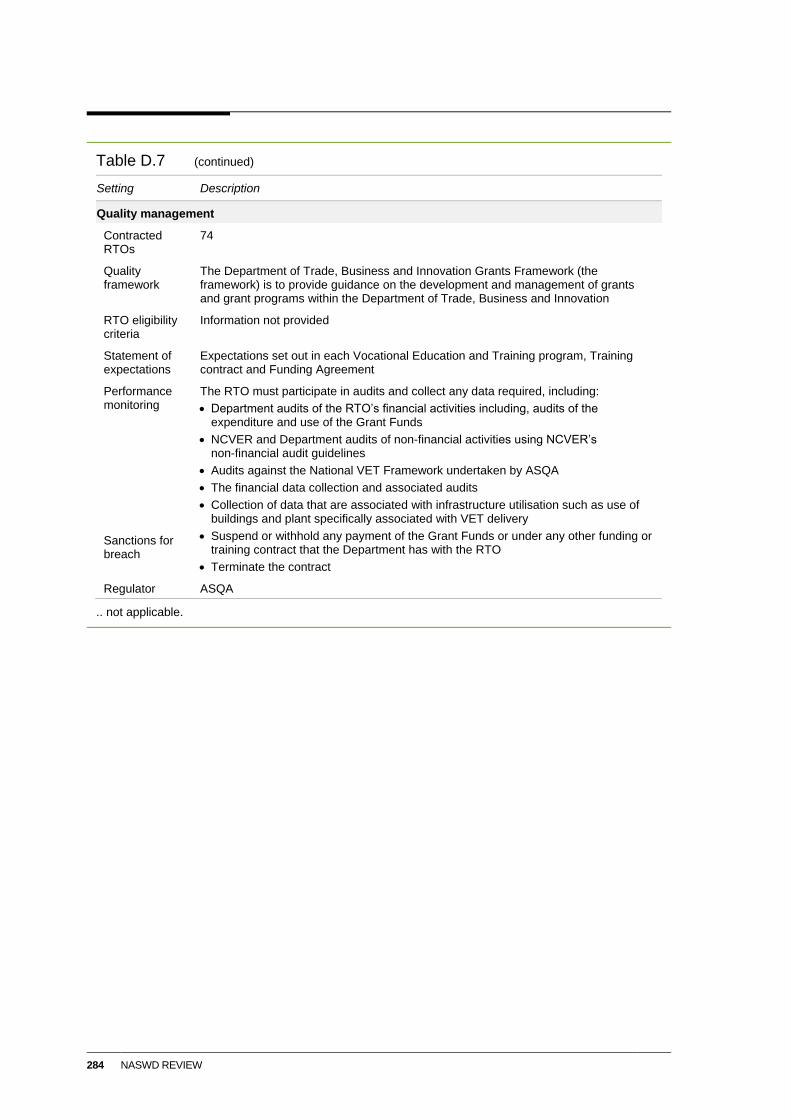
284 NASWD REVIEW
Table D.7 (continued)
Setting Description
Quality management
Contracted RTOs
74
Quality framework
The Department of Trade, Business and Innovation Grants Framework (the framework) is to provide guidance on the development and management of grants and grant programs within the Department of Trade, Business and Innovation
RTO eligibility criteria
Information not provided
Statement of expectations
Expectations set out in each Vocational Education and Training program, Training contract and Funding Agreement
Performance monitoring
The RTO must participate in audits and collect any data required, including:
Department audits of the RTO’s financial activities including, audits of the expenditure and use of the Grant Funds
NCVER and Department audits of non-financial activities using NCVER’s non-financial audit guidelines
Audits against the National VET Framework undertaken by ASQA
The financial data collection and associated audits
Collection of data that are associated with infrastructure utilisation such as use of buildings and plant specifically associated with VET delivery
Sanctions for breach
Suspend or withhold any payment of the Grant Funds or under any other funding or training contract that the Department has with the RTO
Terminate the contract
Regulator ASQA
.. not applicable.
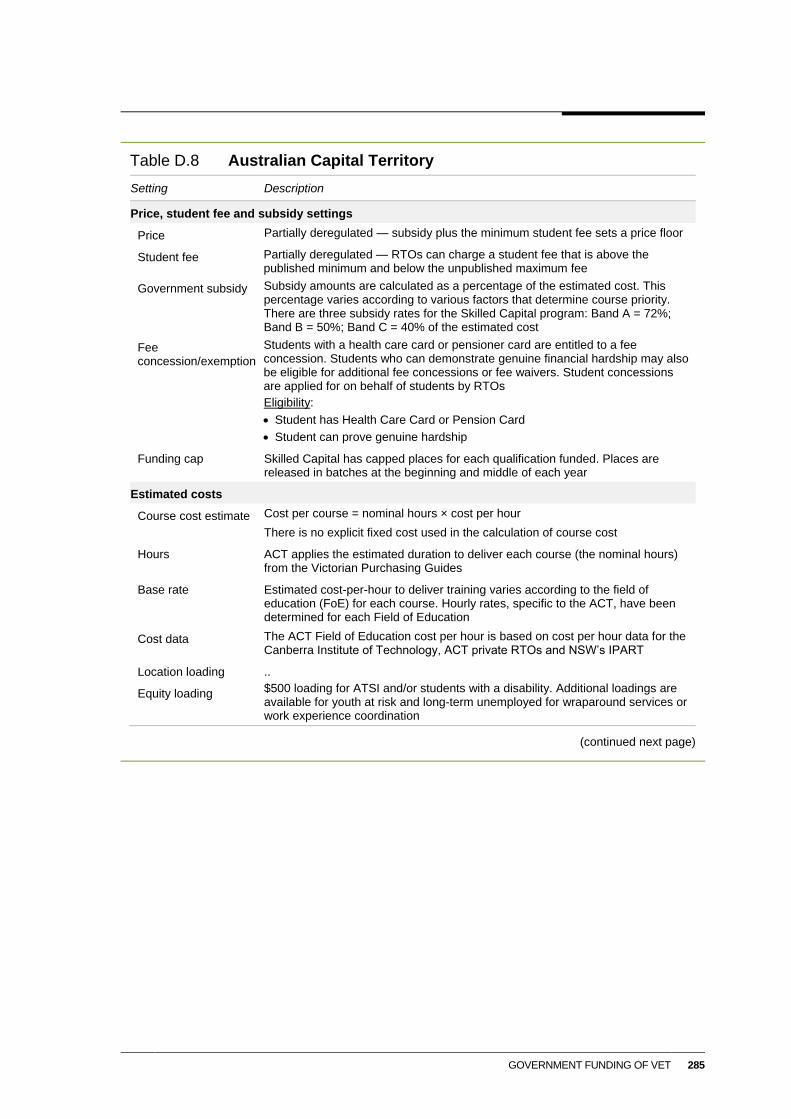
GOVERNMENT FUNDING OF VET 285
Table D.8 Australian Capital Territory
Setting Description
Price, student fee and subsidy settings
Price Partially deregulated — subsidy plus the minimum student fee sets a price floor
Student fee Partially deregulated — RTOs can charge a student fee that is above the published minimum and below the unpublished maximum fee
Government subsidy Subsidy amounts are calculated as a percentage of the estimated cost. This percentage varies according to various factors that determine course priority. There are three subsidy rates for the Skilled Capital program: Band A = 72%; Band B = 50%; Band C = 40% of the estimated cost
Fee concession/exemption
Students with a health care card or pensioner card are entitled to a fee concession. Students who can demonstrate genuine financial hardship may also be eligible for additional fee concessions or fee waivers. Student concessions are applied for on behalf of students by RTOs
Eligibility:
Student has Health Care Card or Pension Card
Student can prove genuine hardship
Funding cap Skilled Capital has capped places for each qualification funded. Places are released in batches at the beginning and middle of each year
Estimated costs
Course cost estimate Cost per course = nominal hours × cost per hour
There is no explicit fixed cost used in the calculation of course cost
Hours ACT applies the estimated duration to deliver each course (the nominal hours) from the Victorian Purchasing Guides
Base rate Estimated cost-per-hour to deliver training varies according to the field of education (FoE) for each course. Hourly rates, specific to the ACT, have been determined for each Field of Education
Cost data The ACT Field of Education cost per hour is based on cost per hour data for the Canberra Institute of Technology, ACT private RTOs and NSW’s IPART
Location loading ..
Equity loading $500 loading for ATSI and/or students with a disability. Additional loadings are available for youth at risk and long-term unemployed for wraparound services or work experience coordination
(continued next page)
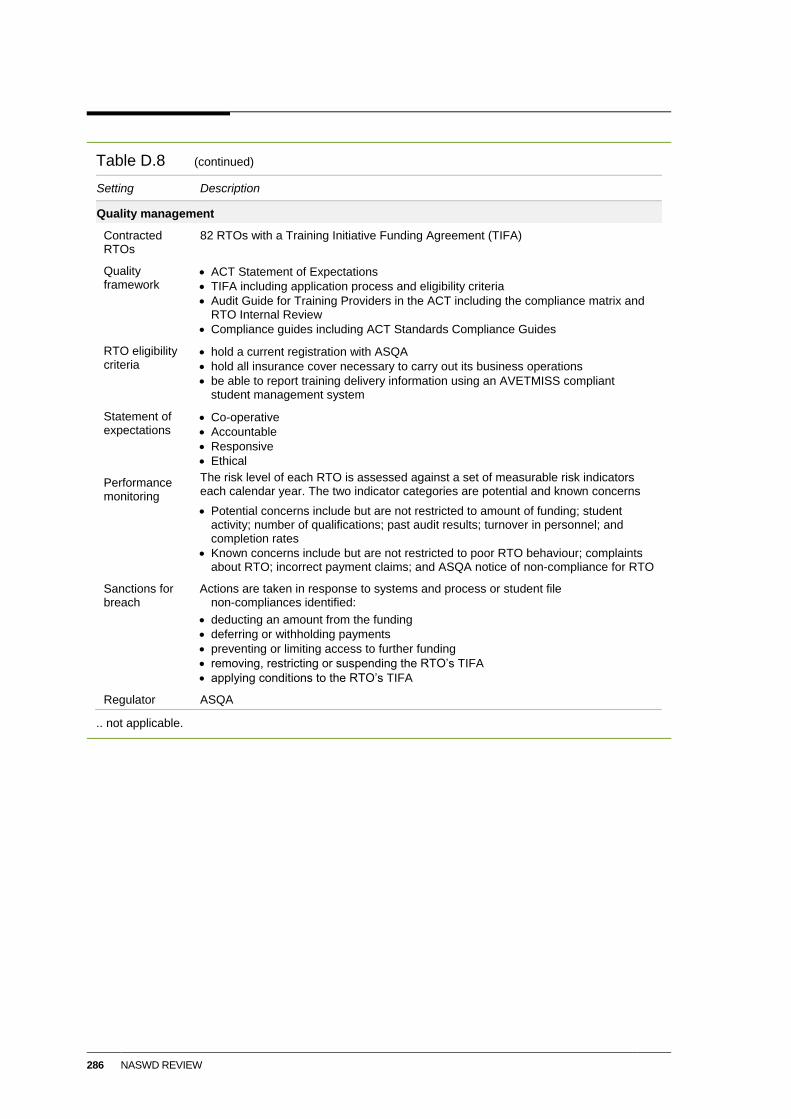
286 NASWD REVIEW
Table D.8 (continued)
Setting Description
Quality management
Contracted RTOs
82 RTOs with a Training Initiative Funding Agreement (TIFA)
Quality framework
ACT Statement of Expectations
TIFA including application process and eligibility criteria
Audit Guide for Training Providers in the ACT including the compliance matrix and RTO Internal Review
Compliance guides including ACT Standards Compliance Guides
RTO eligibility criteria
hold a current registration with ASQA
hold all insurance cover necessary to carry out its business operations
be able to report training delivery information using an AVETMISS compliant student management system
Statement of expectations
Co-operative
Accountable
Responsive
Ethical
Performance monitoring
The risk level of each RTO is assessed against a set of measurable risk indicators each calendar year. The two indicator categories are potential and known concerns
Potential concerns include but are not restricted to amount of funding; student activity; number of qualifications; past audit results; turnover in personnel; and completion rates
Known concerns include but are not restricted to poor RTO behaviour; complaints about RTO; incorrect payment claims; and ASQA notice of non-compliance for RTO
Sanctions for breach
Actions are taken in response to systems and process or student file non-compliances identified:
deducting an amount from the funding
deferring or withholding payments
preventing or limiting access to further funding
removing, restricting or suspending the RTO’s TIFA
applying conditions to the RTO’s TIFA
Regulator ASQA
.. not applicable.
HIGHER EDUCATION POLICY SETTINGS 287
E Higher education policy settings
To inform policy options considered in the interim report, this appendix outlines higher
education policy settings — in particular, the funding and loan arrangements in higher
education. It also outlines the prices and subsidies of various levels of qualification, across
a sample of providers, relating to three occupations — nurse, child educator and carer, and
building designer. This is intended to highlight some of the differences between the VET
and higher education sectors.
E.1 Higher education policy settings
How are universities funded?
Since 1989, higher education in Australia has been jointly funded by student tuition fees and
grants from the Australian Government. Government funding is provided under the Higher
Education Support Act 2003 (HESA) (Cwlth), through the Commonwealth Grant Scheme
(CGS) (DESE 2016a). The Higher Education Loan Programme (HELP) — which enables
students to take out a loan to pay tuition fees — and a number of other grants (box E.1) are
also funded under the HESA.
The HESA is the primary vehicle for Australian Government financial support for higher
education and certain VET. It outlines a number of aspects including: the eligibility
requirements for access to Australian Government funding and HELP; a list of approved
higher education providers, and their administrative and reporting obligations; the Australian
Government contributions provided under the CGS; the maximum student contributions that
universities can charge; and the conditions under which students can take out a HELP loan.
These are discussed in more detail below.
288 NASWD REVIEW
Box E.1 Other Australian Government grants available to higher education providers
Through the Higher Education Support Act 2003 (HESA) (Cwlth), the Australian Government
makes other grants available to higher education providers. These include the:
Disability Support Program — funding to eligible higher education providers with the aim of
improving access for students with disabilities
Indigenous Support Program — grants to higher education providers that aim to assist
providers in meeting the needs of their Aboriginal and Torres Strait Islander students
Structural Adjustment Fund — funding to assist universities to operate more competitively
in the demand-driven funding environment
Higher Education Participation and Partnership Program — aims to support universities’
efforts to increase participation of people who are from low socio-economic status backgrounds
Superannuation Program — aims to provide supplementary funding to eligible higher
education providers to cover certain superannuation expenses for staff
Australian Maths and Science Partnerships Program — aims to improve student
engagement in maths and science courses at university and schools, through innovative
partnerships between universities, schools, and other relevant organisations.
Determinations are made each year confirming the grant amounts paid to each higher education
provider under HESA.
Source: DESE (2018b).
Government contributions — the Commonwealth Grant Scheme
Only public universities and some non-university higher education providers approved by
the Australian Government are eligible to receive funding through the CGS (DESE 2018a).
Students who receive funding through the CGS are enrolled in a Commonwealth-supported
place (CSP). A student must meet the citizenship and residency requirements to access
government support through a CSP.
Each higher education provider that receives CGS funding enters into a funding agreement
with the Australian Government. The agreement outlines, among other things, the amount
of funding provided by the Australian Government to the higher education provider for a
specific period(s), the number of CSPs for medical courses,55 any loadings the higher
education provider might receive, and the conditions to which the CGS is subject to that are
additional to the conditions that apply under the HESA (DESE 2018a).
The CGS provides subsidies for tuition costs for students enrolled in a CSP across a wide
range of discipline areas and qualification levels. In 2020, there were eight funding clusters
(table E.1). The funding rate per cluster varies by field of education. Australian Government
contributions per annual equivalent full time student load (EFTSL) in 2020 varied from a
55 The number of CSPs offered in medicine is capped.
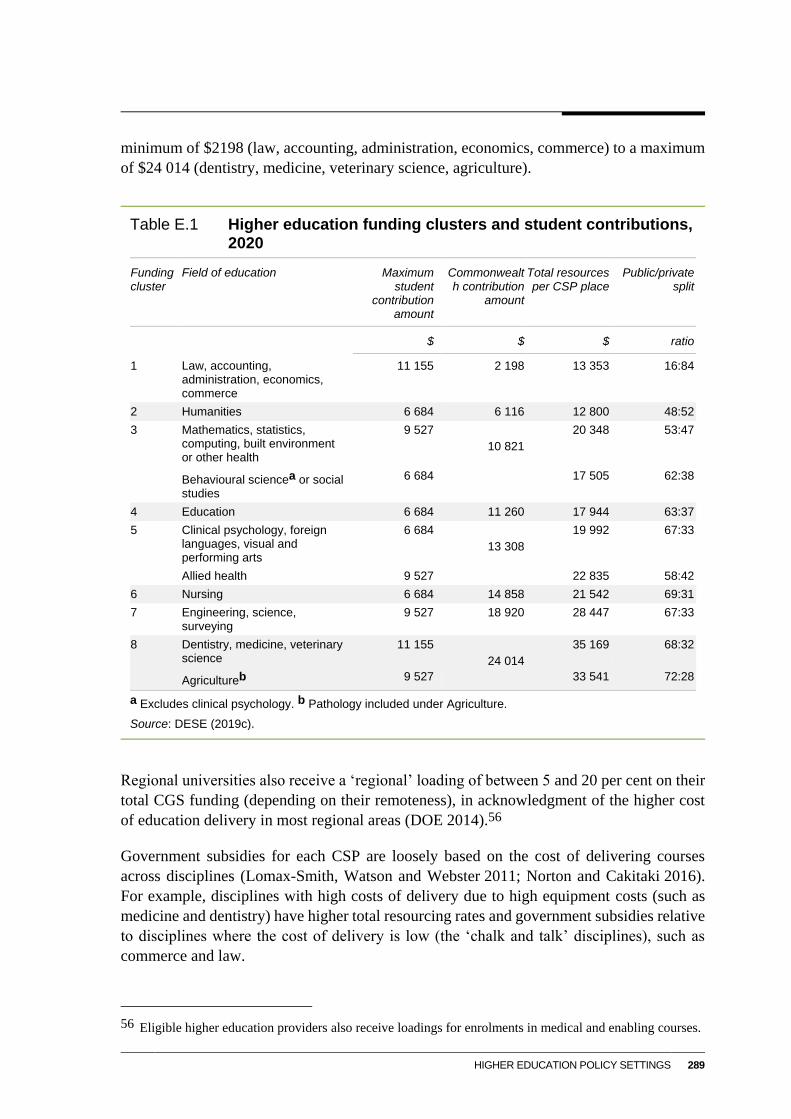
HIGHER EDUCATION POLICY SETTINGS 289
minimum of $2198 (law, accounting, administration, economics, commerce) to a maximum
of $24 014 (dentistry, medicine, veterinary science, agriculture).
Table E.1 Higher education funding clusters and student contributions, 2020
Funding cluster
Field of education Maximum student
contribution amount
Commonwealth contribution
amount
Total resources per CSP place
Public/private split
$ $ $ ratio
1 Law, accounting, administration, economics, commerce
11 155 2 198 13 353 16:84
2 Humanities 6 684 6 116 12 800 48:52
3 Mathematics, statistics, computing, built environment or other health
9 527
10 821
20 348 53:47
Behavioural sciencea or social studies
6 684 17 505 62:38
4 Education 6 684 11 260 17 944 63:37
5 Clinical psychology, foreign languages, visual and performing arts
6 684
13 308
19 992 67:33
Allied health 9 527 22 835 58:42
6 Nursing 6 684 14 858 21 542 69:31
7 Engineering, science, surveying
9 527 18 920 28 447 67:33
8 Dentistry, medicine, veterinary science
11 155
24 014
35 169 68:32
Agricultureb 9 527 33 541 72:28
a Excludes clinical psychology. b Pathology included under Agriculture.
Source: DESE (2019c).
Regional universities also receive a ‘regional’ loading of between 5 and 20 per cent on their
total CGS funding (depending on their remoteness), in acknowledgment of the higher cost
of education delivery in most regional areas (DOE 2014).56
Government subsidies for each CSP are loosely based on the cost of delivering courses
across disciplines (Lomax-Smith, Watson and Webster 2011; Norton and Cakitaki 2016).
For example, disciplines with high costs of delivery due to high equipment costs (such as
medicine and dentistry) have higher total resourcing rates and government subsidies relative
to disciplines where the cost of delivery is low (the ‘chalk and talk’ disciplines), such as
commerce and law.
56 Eligible higher education providers also receive loadings for enrolments in medical and enabling courses.
290 NASWD REVIEW
While the majority of CSPs are offered in bachelor-level courses, the CGS also provides for
an agreed number of CSPs in approved enabling,57 sub-bachelor (Associate Degree and
Diploma) and non-research postgraduate level courses. The agreed number is specified in
each provider’s CGS funding agreement (DESE 2018a).
Relative to the funding models in the VET sector, the higher education funding model is
simple. However, many have criticised the model as too simple and lacking clear policy
principles.
The funding approach in higher education (including the use of funding clusters and the
differentiation of funding by discipline) is largely based on the Relative Funding Model
(RFM) developed and adopted in the late 1980s (Norton and Cakitaki 2016). It is argued
that higher education funding policies reflect the sector’s history and political
compromises rather than consistent policy principles (Bradley et al. 2008b; Lomax-
Smith, Watson and Webster 2011; Norton and Cakitaki 2016)
The funding cluster amounts are not based on up-to-date estimates of the costs of delivery
(G8 Universities 2011; Lomax-Smith, Watson and Webster 2011; Norton and
Cakitaki 2016). Further, the resourcing amounts assume that the cost of delivery is the
same for all qualification levels (enabling, sub-bachelor, bachelor and postgraduate)
within a specific discipline. Evidence, however, suggests that postgraduate qualifications
have higher costs of delivery (due to smaller class sizes), relative to bachelor-level
qualifications (Lomax-Smith, Watson and Webster 2011)
The funding approach leads to cross-subsidisation (Bradley et al. 2008b; Lomax-Smith,
Watson and Webster 2011; Norton and Cakitaki 2016; PC 2017d). Universities have
autonomy in how they spend resources provided for students enrolled in CSPs. This
autonomy, as well as the disparity between government subsidies provided and actual
cost of delivery, have led to universities using some funds provided for teaching purposes
to fund research. Cross subsidisation can create incentive structures that undermine
labour market outcomes of students (for example, driven by oversupply of graduates in
some discipline areas) and teaching quality, and represent a less transparent and
accountable means of providing public funding for research.
The introduction of performance-based funding
Until 2012, the Australian Government had a supply-driven, block-grant system in place.
Under that system, the Australian Government would decide on a block amount of funding
to be provided to universities and on the number of CSPs the universities would have to
deliver. The government then divided the places and available funding between universities,
with universities then selecting students based on the availability of places (Norton 2019).
57 Enabling programs aim to provide students with the requisite background skills and knowledge to undertake
further tertiary education. These courses are targeted at students who enter university through
non-traditional pathways, particularly those without an ATAR. These courses can be undertaken as a
preparatory or concurrent study option.
HIGHER EDUCATION POLICY SETTINGS 291
Under the demand-driven system (which operated from 2012 to 2017), the number of
government funded CSPs for Australian undergraduates was based on the number of
undergraduates enrolling in courses. Fundamentally, every student who enrolled in a
bachelor course (excluding medicine) could get a funded place if they could find a university
to accept them, and there was no limit or cap.
In 2018, new arrangements were introduced that capped the number of CSPs in 2018 and
2019 to 2017 levels (DESE 2019g). This meant that the amount of funding that a university
received through the CGS in 2018 and 2019 was equal to the funding received based on its
2017 enrolments. Therefore, if a university chose to enrol additional students (beyond those
supported by its 2017 level), it did not receive CGS funding for those students (and received
only the student contribution for those enrolments). These new arrangements aimed to curb
higher education spending, after large increases between 2012 and 2017.
From 2020, the amount universities receive from the Commonwealth to support the delivery
of bachelor-level qualifications is to increase in line with the population growth rate of 18–
64 year olds (1.36 per cent in 2020), subject to performance targets being met under the
Performance Based Funding scheme (DESE 2019g). If a university meets their full
performance requirements, this additional funding (based on the national population growth
rate of 18–64 year olds in 2020) will be added to a university’s block grant. Performance
targets focus on four key measures:
graduate employment outcomes — measured by the overall graduate employment rates
student experience — measured by student satisfaction with teaching quality
student success — measured by the adjusted attrition rate
equity group participation — measured by an equally weighted participation rate of
Indigenous, low socio-economic status and regional students (Wellings et al. 2019).
Performance-based funding is intended to ensure that universities focus on the quality of
their teaching and student support, in order to achieve the best possible graduate outcomes.
Student contributions
The Australian Government sets maximum student contribution fees in accordance with the
annual EFTSL. The fees are based on the estimated future private benefits that a student can
generally expect to gain from their degree within a discipline (Lomax-Smith, Watson and
Webster 2011). For example, disciplines with higher expected private benefits — such as
law, commerce, medicine and dentistry — have higher student contributions.
There are three ‘bands’ for student contributions — in 2020 the maximum student
contribution was $11 155 (table E.1). Universities can set the student charge below the
maximum but, in practice, all charge the maximum rate (Lomax-Smith, Watson and
Webster 2011; Norton and Cherastidtham 2015). The maximum band amounts are indexed
to the Consumer Price Index (CPI). Students can pay the student contribution directly to
292 NASWD REVIEW
their university or borrow it through HELP, in which case the Australian Government pays
the university on the student’s behalf.
The Australian Government does not regulate the maximum fees for domestic students who
are not subsidised through CSPs — that is, full-fee-paying students — or fees for
international students. Providers have discretion to determine the level of tuition fees they
charge for these students as long as the fees are not lower than for Commonwealth-supported
students (DOE 2015).
There is considerable variation in the proportion of total resources provided by the Australian
Government and student contributions through CSPs across the disciplines (table E.1). For
example, students studying commerce or law courses — which generally have a low cost of
delivery but high expected private benefits — contribute approximately 84 per cent of total
resources, compared to approximately 28 per cent for agriculture courses, which cost more
to deliver but have lower expected private benefits. The 2011 Lomax-Smith review of higher
education funding argued that there was no clear rationale for the large share of public
funding for some disciplines and the wide diversity in the public-private share of funding
between fields (Lomax-Smith, Watson and Webster 2011).
Higher Education Loan Programs in higher education
The Australian Government provides different forms of HELP to domestic students studying
at approved higher education providers in Australia, including HECS-HELP and
FEE-HELP.
HECS-HELP is available to students in a CSP (Australian Government 2018b). There is
no loan application fee for using HECS-HELP.
FEE-HELP is available for domestic full-fee paying students to pay all or part of their
tuition fees at eligible higher education providers.58 FEE-HELP is also generally
available for postgraduate courses at universities, and in both undergraduate and
postgraduate courses offered by private higher education providers (Australian
Government 2018a). A loan fee of 25 per cent of the tuition fee for each unit applies for
FEE-HELP loans for undergraduate courses (unless enrolled at some selected private
universities or through Open Universities Australia) (Australian Government 2018a).59
Students using a HELP make contributions once they are in the workforce earning annual
income above a certain threshold. In 2019-20, the repayment threshold was a gross income
of $45 881. The repayment rate was 1 per cent of gross income, increasing to a maximum of
58 Pass rate requirements also apply to all non-university FEE-HELP loans. For example, a student needs to
ensure that they pass at least 50 per cent of their total attempted units across the course of study to remain
eligible for FEE-HELP (Australian Government 2018a).
59 The purpose of the loan fee is to recover some of the costs to the Commonwealth associated with the loan
and the repayments (Bradley et al. 2008b).
HIGHER EDUCATION POLICY SETTINGS 293
10 per cent for gross incomes above $134 573 (Australian Government 2020e). The
repayment thresholds are indexed to the CPI.
In January 2020, a combined HELP loan limit was introduced that applied to borrowing for
all tuition-related HELPs — HECS-HELP, FEE-HELP and VET Student Loans (VSL)
(Australian Government 2020d). Under these arrangements, a person’s HELP balance is
renewable. If a student reaches the limit, they can make repayments to reduce their HELP
debt and access HELP until they reach the limit again. In 2020 the limit was $106 319 for
most students and $152 700 for students studying medicine, dentistry and veterinary sciences
(Australian Government 2020d).
How are universities regulated?
The HESA provides the legislative framework for the higher education sector. The Tertiary
Education Quality and Standards Agency (TEQSA) oversees registration, performance and
quality of all providers as Australia’s national higher education regulator.
TEQSA was established in 2012 — through the Tertiary Education Quality and Standards
Agency Act 2011 (Cwlth) — and replaced State- and Territory-based regulation. TEQSA
was established in response to the recommendations of the 2008 review of higher education
(Bradley Review), which noted weaknesses in the existing jurisdictional system of
regulation (Bradley et al. 2008b).
The performance and quality of higher education providers is evaluated using the Higher
Education Standards Framework (Threshold Standards) 2015. This framework sets out the
minimum level of achievement that a provider must meet (and maintain) in order to be
registered to deliver higher education courses of study (TEQSA 2017). Unlike registered
training organisations in VET, universities60 have the power to self-accredit their courses,
and to approve their own courses through academic boards or similar bodies. However, they
must do so in accordance with the Higher Education Standards Framework. A small number
of non-university higher education providers can self-accredit their courses, but most have
their courses approved by TEQSA.
E.2 Case studies — nurse, child educator and carer,
building designer
Tables E.2–E.4 outline fee-for-service and subsidised prices, and subsidies relating to
courses for three occupations — nurse, child educator and carer, and building designer —
across the VET and higher education sectors.
60 Generally, a higher education provider must undertake research in at least three fields of education to be
classified as an university (Norton, Cherastidtham and Mackey 2018).
294 NASWD REVIEW
In general, the fee-for-service price (second column in tables E.2–E.4) is the cost to the
student if the qualification is not subsidised by government or if the provider is not eligible
to receive the subsidy. The subsidised price (fourth column in tables E.2–E.4) is the cost to
the student where the qualification is government subsidised, and both the student and
provider are eligible to receive the subsidy. In the VET sector, with the exception of
New South Wales and Western Australia, prices for government-subsidised qualifications
are not controlled. In higher education, however, this is not the case — the price of
government-subsidised qualifications is capped across Australia. In contrast, the
fee-for-service market in higher education is not regulated. Overall, the price of each VET
qualification and its subsidy differ significantly across jurisdictions.
The upfront payment for each course (third and fifth column in tables E.2–E.4) refers to any
gap between course costs and borrowing limits on Commonwealth loans. The Diploma-level
qualifications listed are eligible for VSL, although different borrowing limits apply for each.
In higher education, there are no borrowing limits for bachelor-level qualifications through
HECS-HELP and FEE-HELP. As such, the limits on borrowing through VSL are a further
source of variation in what students pay (upfront) for VET qualifications, which do not apply
in higher education.
The second-last column in each table shows the maximum subsidy amount applicable in that
jurisdiction, for that particular course, and for that relevant institution (where data are
available). These subsidy amounts also vary across jurisdictions with respect to VET courses.
The last column in each table shows the difference between the fee-for-service and
subsidised course cost. There are many instances where the difference between a full-fee and
a subsidised course cost varies substantially to the subsidy amount, implying that a degree
of cross-subsidisation occurs.
It should be noted that, for some occupations (such as nursing, child educator, and carer),
qualifications offered in VET and higher education lead to different occupational scope of
practice. For example, a student who completes a Diploma of Nursing will be qualified as
an enrolled nurse, while, a student who completes a Bachelor of Nursing will be qualified as
a registered nurse. Although both are nurses, the scope of practice is very different. A
registered nurse works independently and in teams, is accountable and responsible for their
actions and can delegate to enrolled nurses and other healthcare workers (NMBA 2017b).
An enrolled nurse is supervised by a registered nurse to provide nursing care but performs
relatively less complex procedures (NMBA 2017a). Both are governed by separate
Standards for Practice as dictated by the Nursing and Midwifery Board (NMBA) and local
policies and procedures.
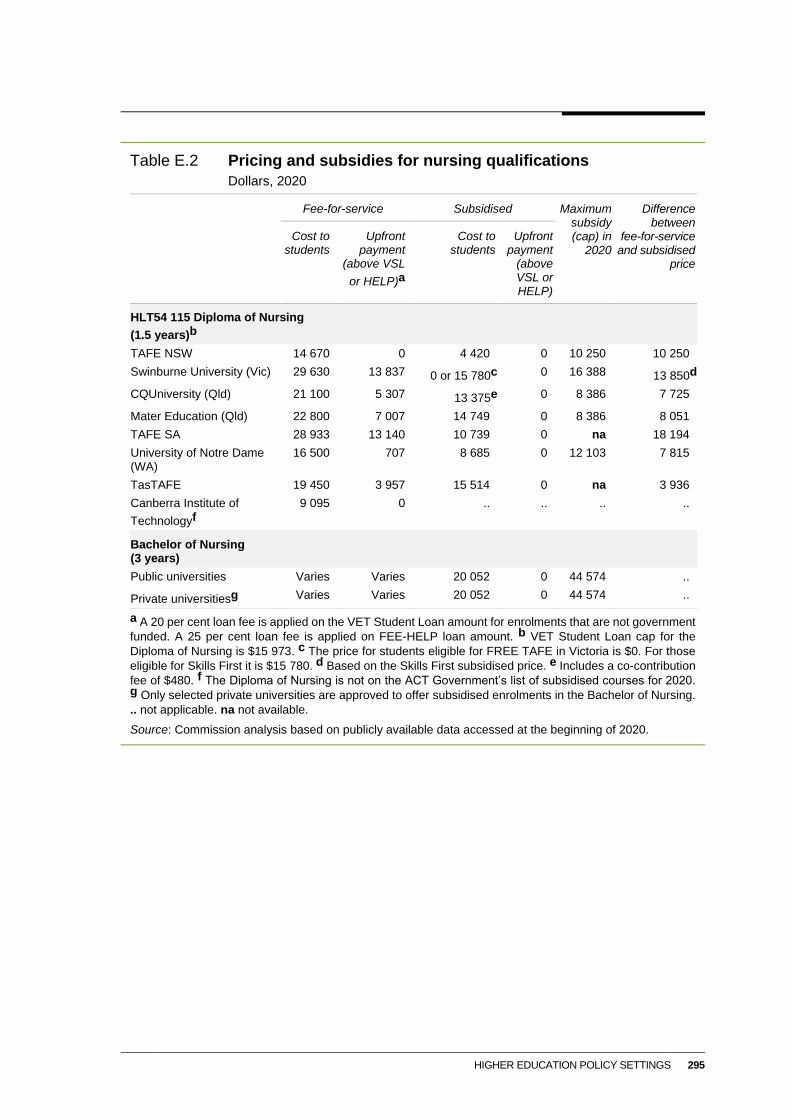
HIGHER EDUCATION POLICY SETTINGS 295
Table E.2 Pricing and subsidies for nursing qualifications
Dollars, 2020
Fee-for-service Subsidised Maximum subsidy (cap) in
2020
Difference between
fee-for-service and subsidised
price
Cost to students
Upfront payment
(above VSL
or HELP)a
Cost to students
Upfront payment
(above VSL or HELP)
HLT54 115 Diploma of Nursing
(1.5 years)b
TAFE NSW 14 670 0 4 420 0 10 250 10 250
Swinburne University (Vic) 29 630 13 837 0 or 15 780c 0 16 388 13 850d
CQUniversity (Qld) 21 100 5 307 13 375e 0 8 386 7 725
Mater Education (Qld) 22 800 7 007 14 749 0 8 386 8 051
TAFE SA 28 933 13 140 10 739 0 na 18 194
University of Notre Dame (WA)
16 500 707 8 685 0 12 103 7 815
TasTAFE 19 450 3 957 15 514 0 na 3 936
Canberra Institute of
Technologyf
9 095 0 .. .. .. ..
Bachelor of Nursing (3 years)
Public universities Varies Varies 20 052 0 44 574 ..
Private universitiesg Varies Varies 20 052 0 44 574 ..
a A 20 per cent loan fee is applied on the VET Student Loan amount for enrolments that are not government
funded. A 25 per cent loan fee is applied on FEE-HELP loan amount. b VET Student Loan cap for the
Diploma of Nursing is $15 973. c The price for students eligible for FREE TAFE in Victoria is $0. For those
eligible for Skills First it is $15 780. d Based on the Skills First subsidised price. e Includes a co-contribution
fee of $480. f The Diploma of Nursing is not on the ACT Government’s list of subsidised courses for 2020. g Only selected private universities are approved to offer subsidised enrolments in the Bachelor of Nursing.
.. not applicable. na not available.
Source: Commission analysis based on publicly available data accessed at the beginning of 2020.
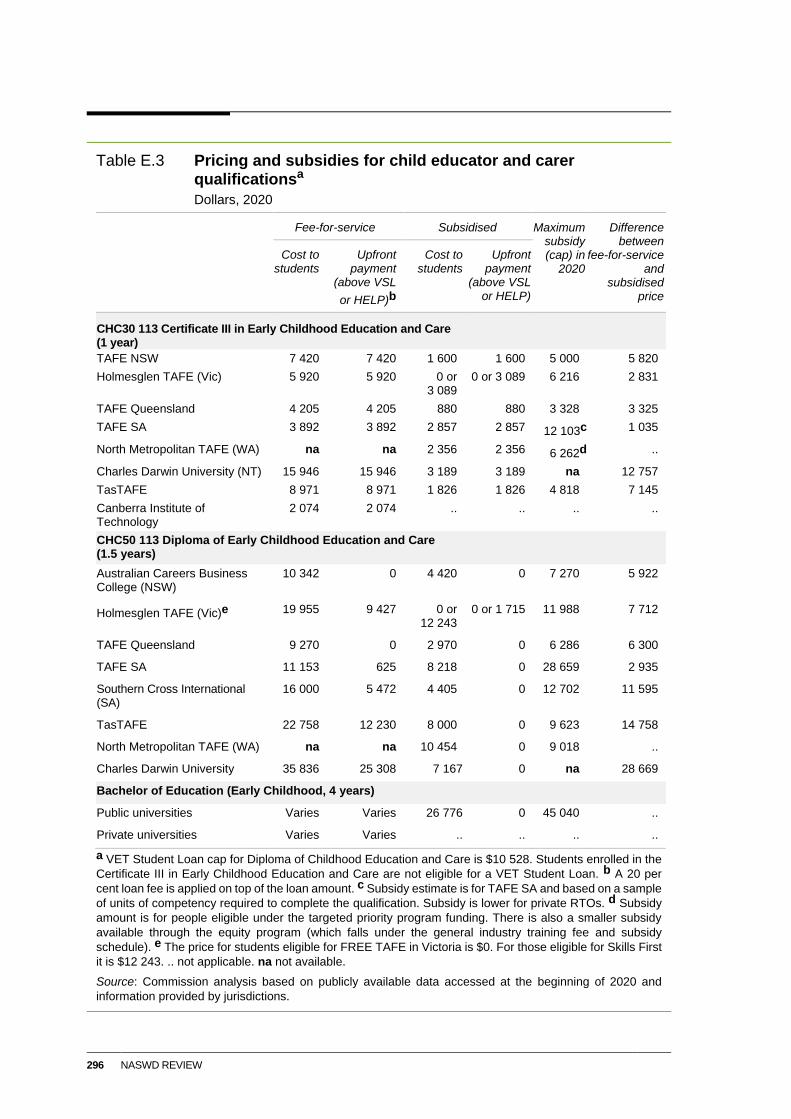
296 NASWD REVIEW
Table E.3 Pricing and subsidies for child educator and carer qualificationsa
Dollars, 2020
Fee-for-service Subsidised Maximum subsidy (cap) in
2020
Difference between
fee-for-service and
subsidised price
Cost to students
Upfront payment
(above VSL
or HELP)b
Cost to students
Upfront payment
(above VSL or HELP)
CHC30 113 Certificate III in Early Childhood Education and Care (1 year)
TAFE NSW 7 420 7 420 1 600 1 600 5 000 5 820
Holmesglen TAFE (Vic) 5 920 5 920 0 or 3 089
0 or 3 089 6 216 2 831
TAFE Queensland 4 205 4 205 880 880 3 328 3 325
TAFE SA 3 892 3 892 2 857 2 857 12 103c 1 035
North Metropolitan TAFE (WA) na na 2 356 2 356 6 262d ..
Charles Darwin University (NT) 15 946 15 946 3 189 3 189 na 12 757
TasTAFE 8 971 8 971 1 826 1 826 4 818 7 145
Canberra Institute of Technology
2 074 2 074 .. .. .. ..
CHC50 113 Diploma of Early Childhood Education and Care (1.5 years)
Australian Careers Business College (NSW)
10 342 0 4 420 0 7 270 5 922
Holmesglen TAFE (Vic)e 19 955 9 427 0 or 12 243
0 or 1 715 11 988 7 712
TAFE Queensland 9 270 0 2 970 0 6 286 6 300
TAFE SA 11 153 625 8 218 0 28 659 2 935
Southern Cross International (SA)
16 000 5 472 4 405 0 12 702 11 595
TasTAFE 22 758 12 230 8 000 0 9 623 14 758
North Metropolitan TAFE (WA) na na 10 454 0 9 018 ..
Charles Darwin University 35 836 25 308 7 167 0 na 28 669
Bachelor of Education (Early Childhood, 4 years)
Public universities Varies Varies 26 776 0 45 040 ..
Private universities Varies Varies .. .. .. ..
a VET Student Loan cap for Diploma of Childhood Education and Care is $10 528. Students enrolled in the
Certificate III in Early Childhood Education and Care are not eligible for a VET Student Loan. b A 20 per
cent loan fee is applied on top of the loan amount. c Subsidy estimate is for TAFE SA and based on a sample
of units of competency required to complete the qualification. Subsidy is lower for private RTOs. d Subsidy
amount is for people eligible under the targeted priority program funding. There is also a smaller subsidy
available through the equity program (which falls under the general industry training fee and subsidy
schedule). e The price for students eligible for FREE TAFE in Victoria is $0. For those eligible for Skills First
it is $12 243. .. not applicable. na not available.
Source: Commission analysis based on publicly available data accessed at the beginning of 2020 and
information provided by jurisdictions.
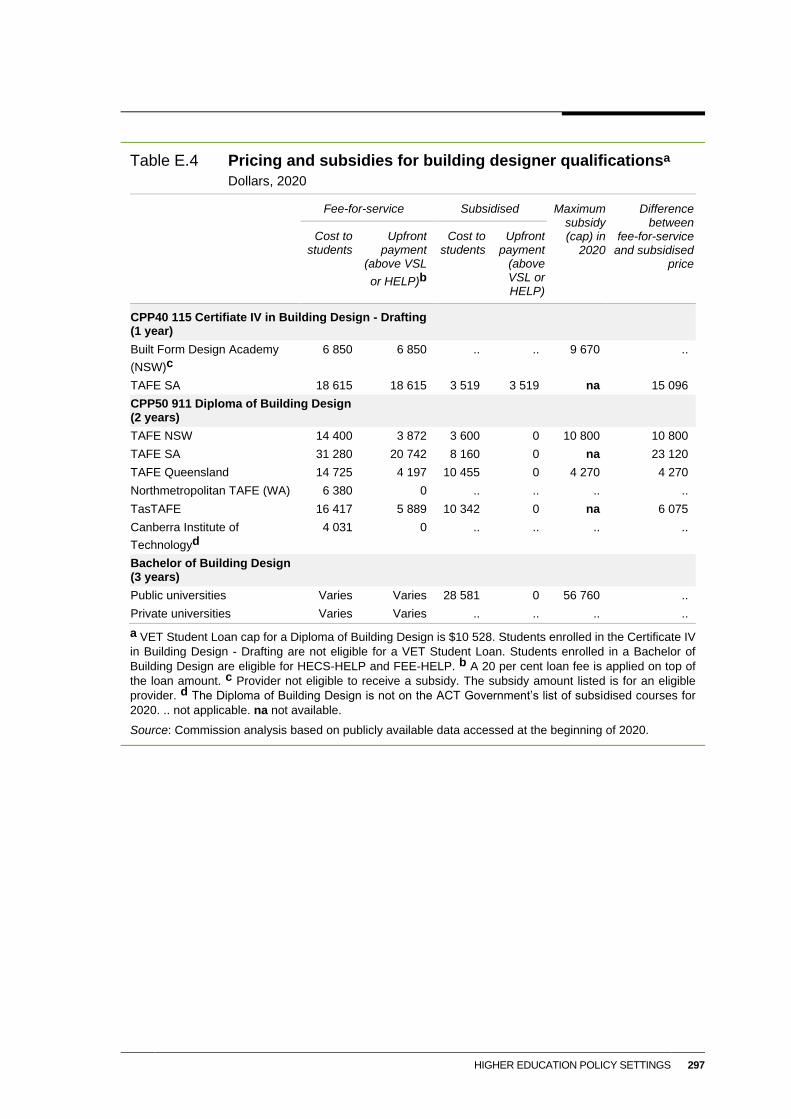
HIGHER EDUCATION POLICY SETTINGS 297
Table E.4 Pricing and subsidies for building designer qualificationsa
Dollars, 2020
Fee-for-service Subsidised Maximum subsidy (cap) in
2020
Difference between
fee-for-service and subsidised
price
Cost to students
Upfront payment
(above VSL
or HELP)b
Cost to students
Upfront payment
(above VSL or HELP)
CPP40 115 Certifiate IV in Building Design - Drafting (1 year)
Built Form Design Academy
(NSW)c
6 850 6 850 .. .. 9 670 ..
TAFE SA 18 615 18 615 3 519 3 519 na 15 096
CPP50 911 Diploma of Building Design (2 years)
TAFE NSW 14 400 3 872 3 600 0 10 800 10 800
TAFE SA 31 280 20 742 8 160 0 na 23 120
TAFE Queensland 14 725 4 197 10 455 0 4 270 4 270
Northmetropolitan TAFE (WA) 6 380 0 .. .. .. ..
TasTAFE 16 417 5 889 10 342 0 na 6 075
Canberra Institute of
Technologyd
4 031 0 .. .. .. ..
Bachelor of Building Design (3 years)
Public universities Varies Varies 28 581 0 56 760 ..
Private universities Varies Varies .. .. .. ..
a VET Student Loan cap for a Diploma of Building Design is $10 528. Students enrolled in the Certificate IV
in Building Design - Drafting are not eligible for a VET Student Loan. Students enrolled in a Bachelor of
Building Design are eligible for HECS-HELP and FEE-HELP. b A 20 per cent loan fee is applied on top of
the loan amount. c Provider not eligible to receive a subsidy. The subsidy amount listed is for an eligible
provider. d The Diploma of Building Design is not on the ACT Government’s list of subsidised courses for
2020. .. not applicable. na not available.
Source: Commission analysis based on publicly available data accessed at the beginning of 2020.

REFERENCES 299
References
ABC News 2005, ‘Minister rejects call for apprentice poaching levy’, ABC News, 30
November.
ABS (Australian Bureau of Statistics) 2012, Learning and Work, Australia, 2010-11, Cat.
no. 4235.0.
—— 2016, Qualifications and Work, Australia, 2015, Cat. no. 4235.0.
—— 2017, Work-Related Training and Adult Learning, Australia, 2016-17, Cat. no. 4234.0.
—— 2018, The Australian Statistical Geography Standard (ASGS) Remoteness Structure,
https://www.abs.gov.au/websitedbs/D3310114.nsf/home/remoteness+structure
(accessed 8 March 2020).
—— 2019a, Education and Work, Cat. no. 6227.0, Canberra.
—— 2019b, Employee Earnings and Hours, Australia, Cat. no. 6306.0, Australian
Government, Canberra.
—— 2020, Producer Price Indexes, Australia, Mar 2020 - Table 34.
ACARA (Australian Curriculum, Assessment and Reporting Authority) 2020, NAPLAN
results - time series.
Access Economics 2004, Future Demand for Vocational Education and Training,
Department of Education, Science and Training, Canberra.
ACCI, Ai Group and BCA (Australian Chamber of Commerce and Industry, Australian
Industry Group and Business Council of Australia) 2017, Coalition of business groups
calls for decisive action to rescue Australia’s ailing apprenticeship system,
https://www.aigroup.com.au/policy-and-research/mediacentre/releases/Joint-
Partnership_Apprentice-Reform-14March/ (accessed 11 March 2020).
—— 2019, Input into Co-Design of National Skills Commission and Skills Organisations.
ACIL Allen Consulting 2015a, Evaluation of Skills for All: Review of the First Phase of
Implementation, Final Report to the South Australian Department of State Development,
Melbourne.
—— 2015b, Review of the National Partnership Agreement on Skills Reform, Final Report
to the Commonwealth and States and Territories, Melbourne.
ACT BCITFA (ACT Building and Construction Industry Training Fund Authority) 2018,
Training Plan 2019, Canberra.
300 NASWD REVIEW
Ai Group and Business Council of Australia 2016, Submission to the VET Student Loans Bill
2016, VET Student Loans (Consequential Amendments and Transitional Provisions) Bill
2016, and VET Student Loans (Charges) Bill 2016, submission 43.
Ai Group (Australian Industry Group) 2018, Skilling: a National Imperative.
—— nd, Review of the Australian Apprenticeships National Skills Needs List - submission,
https://docs.employment.gov.au/sites/default/files/submissions/47062/ai-group.pdf
(accessed 7 May 2020).
AISC (Australian Industry and Skills Committee) 2017, Glossary,
https://aisc.net.au/content/glossary (accessed 8 May 2020).
—— 2020, Streamlining the National Training System, https://aisc.net.au/content/
streamlining-national-training-system (accessed 9 April 2020).
Allison, J., Gorringe, S. and Lacey, J. 2006, Building Learning Communities: Partnerships,
Social Capital and VET Performance, National Centre for Vocational Education
Research, Adelaide.
AlphaBeta 2019, Future Skills: To adapt to the future of work, Australians will undertake a
third more education and training and change what, when and how we learn, Sydney.
ANAO (Australian National Audit Office) 2017, Administration of the VET FEE-HELP
Scheme, Performance Audit, Report No. 31 2016-17, Canberra.
—— 2019, Design and Implementation of the VET Student Loans Program, Canberra.
AQF Council (Australian Qualifications Framework Council) 2013, Australian
Qualifications Framework.
ASQA (Australian Skills Quality Authority) 2017, A Review of Issues Relating to Unduly
Short Training, Melbourne.
Australian Apprenticeship Pathways 2020, Apprenticeships and Traineeships training - How
Does It Work?, https://www.aapathways.com.au/about/apprenticeship-traineeship-
training (accessed 9 April 2020).
Australian Apprenticeships 2019, Apprenticeship training: alternative delivery pilots,
https://www.australianapprenticeships.gov.au/programs (accessed 6 May 2020).
Australian Brick & Block Training Foundation 2019, Australian Brick & Block Training
Foundation, https://australbricks.com.au/abbtf/ (accessed 21 April 2020).
Australian Government 1996, Commonwealth Competitive Neutrality Policy Statement.
—— 2017a, Budget 2017-18, Budget Measures, Budget Paper No. 2 2017-8.
—— 2017b, Supporting retirees in retirement income planning, Department of Prime
Minister and Cabinet, Canberra.
—— 2018a, FEE-HELP, https://studyassist.gov.au/help-loans/fee-help (accessed 22 April 2020).
—— 2018b, HECS-HELP, https://studyassist.gov.au/help-loans/hecs-help (accessed 22 April
2020).
REFERENCES 301
—— 2019a, Simplified and Streamlined Incentives for Australians Apprenticeships - Fact Sheet.
—— 2019b, Training.gov.au: A joint initiative of the Australian and State and Territory
Governments, https://training.gov.au (accessed 9 October 2019).
—— 2020a, A Bill for an Act to provide for the appointment of a National Skills
Commissioner, and for related purposes, Canberra.
—— 2020b, Australian Apprentice Wage Subsidy, Fact sheet.
—— 2020c, Budget 2019-20, Delivering Skills for Today and Tomorrow, Fact Sheet.
—— 2020d, HELP loans, https://www.studyassist.gov.au/help-loans (accessed 21 April 2020).
—— 2020e, Loan repayment, https://studyassist.gov.au/paying-back-your-loan/loan-
repayment (accessed 22 April 2020).
—— nd, Australian Apprenticeships Incentives Program Summary,
https://austapprent.govcms.gov.au/sites/default/files/2019-06/AAIP%20summary
%20Final.pdf (accessed 12 March 2020).
Australian Treasury 2019, Budget 2019-20 - Budget Measures, Budget Paper No. 2.
BCG (Boston Consulting Group) 2015, The NSW Vocational Education and Training market
and TAFE NSW’s competitive position within it, Report to TAFE NSW, Melbourne.
Bednarz, A. 2014, Understanding the Non-Completion of Apprentices, National Centre for
Vocational Education Research, Adelaide.
Billett, S., Choy, S., Dymock, D., Henderson, A., Tyler, M. and Kelly, A. 2015, Towards
More Effective Continuing Education and Training for Australian Workers, Research
Report, National Center for Vocational Education and Research, Adelaide.
Bishop, J. 2019, ‘Education Choices and Labour Supply During the Mining Boom’, Bulletin,
September Quarter, pp. 20–27.
Bisson, R. and Stubley, W. 2017, After the Atar: Understanding How Gen Z Transition into
Further Education and Employment, Year13, Sydney.
Bond, A. 1999, Promoting High Achievement and Low Attrition in Education and Training,
National Centre for Vocational Education Research, Adelaide.
Borland, J. and Coelli, M. 2017, Are Robots Taking Our Jobs?, Melbourne.
Bowman, K. and McKenna, S. 2016a, Jurisdictional approaches to student training and
entitlements: commonalities and differences, Research Report, National Centre for
Vocational Education Research, Adelaide.
—— and —— 2016b, The development of Australia’s national training system: a dynamic
tension between consistency and flexibility, Occasional Paper, National Centre for
Vocational Education Research, Adelaide.
Bradley, D., Noonan, P., Nugent, H. and Scales, B. 2008a, Review of Australian Higher
Education, Final Report, Department of Education Employment and Workplace Relations.
302 NASWD REVIEW
Bradley, D., Noonan, P., Nugent, H. and Scales, B. 2008b, Review of Australian Higher
Education: Final Report, Canberra.
Braithwaite, V. 2018, All eyes on quality: Review of the National Vocational Education and
Training Regulator Act 2011 Report, Report to Assistant Minister for Vocatioinal
Education and Skills, Australian Government, Canberra.
Brébion, C. 2020, The Unexpected Effect of Subsidies to Apprenticeship Contracts on Firms’
Training Behaviour, Laboratoire interdisciplinaire de recherches en sciences de l’action,
p. 64.
Brennan, M. 2019, ‘Future of Markets and TAFE’, speech to the TAFE Directors Australia
(TDA) Convention in Brisbane, 4 September.
Brown, J. 2017, In Their Words: Student Choice in Training Markets - Victorian Examples,
Research Report, National Centre for Vocational Education Research, Adelaide.
Brown, N., te Riele, K., Shelley, B. and Woodroffe, J. 2020, Learning at home during
COVID-19: Effects on vulnerable young Australians, Independent Rapid Response
Report, Peter Underwood Centre for Educational Attainment, University of Tasmania.
Canavan, P. 2019, Apprentice completion rates go from bad to worse, 2 August, Ai Group.
Cash, M. 2019, National vocational education regulator to focus on training excellence,
Media Release, 30 October.
Cash, M. and Irons, S. 2020, Timely ASQA Review will support pandemic recovery, Media
Release, 30 April.
CCIWA (Chamber of Commerce and Industry of Western Australia) 2019, Review of the
Australian Apprenticeships National Skills Needs List, CCIWA Submission to the
Methodology Issues Paper, Perth.
CFFR (Council on Federal Financial Relations) 2019, National Partnerships - Skills and
Workforce Development, http://www.federalfinancialrelations.gov.au/content/npa/
skills.aspx (accessed 23 August 2019).
Chapman, B. 2006, ‘Income contingent loans for higher education: International reforms’,
Handbook of the Economics of Education, vol. 2, pp. 1435–1503.
—— and Lounkaew, K. 2015, ‘Measuring the value of externalities from higher education’,
Higher Education, vol. 70, no. 5, pp. 767–785.
Chrysanthos, N. 2020, ‘Apprenticeships drop by two-thirds amid looming skills shortage’,
Sydney Morning Herald, 4 May.
CITF (Construction Industry Training Fund) 2020, About the Levy, https://citb.org.au/pay-
a-levy/about-the-levy (accessed 21 April 2020).
Clarke, K. 2012, Entry to vocations: the efficacy of VET in Schools, National Centre for
Vocational Education Research, Adelaide.
REFERENCES 303
—— 2015, ‘Australia needs to do more to arrest the decline in apprenticeships’, The
Conversation, http://theconversation.com/australia-needs-to-do-more-to-arrest-the-
decline-in-apprenticeships-47942 (accessed 22 May 2020).
COAG (Council of Australian Governments) 2008, National Agreement for Skills and
Workforce Development (fact sheet), Canberra.
—— 2009a, Intergovernmental Agreement on Federal Financial Relations, Canberra.
—— 2009b, National Agreement for Skills and Workforce Development 2009, Canberra.
—— 2009c, National Disability Agreement, Canberra.
—— 2011, COAG Meeting Communique, 13 February 2011, https://www.coag.gov.au/
meeting-outcomes/coag-meeting-communiqu%C3%A9-13-february-2011 (accessed 29
August 2019).
—— 2012a, COAG Meeting Communique, 13 April 2012, https://www.coag.gov.au/
meeting-outcomes/coag-meeting-communiqu%C3%A9-13-april-2012 (accessed 22
August 2019).
—— 2012b, National Agreement for Skills and Workforce Development 2012, Canberra.
—— 2012c, National Partnership Agreement on Productivity Places Program, Canberra.
—— 2012d, National Partnership Agreement on Skills Reform, Canberra.
—— 2018, National School Reform Agreement, Canberra.
—— 2019a, COAG Meeting Communiqué, 9 August 2019: Vision for VET, Canberra.
—— 2019b, National Partnership on the Skilling Australians Fund, Canberra.
—— 2019c, Communique for the COAG Skills Council Meeting, 22 November.
COAG Education Council 2019, Supporting senior secondary students on a pathway to the
future.
Consumer Action (Consumer Action Law Centre) 2018, Review of the National Vocational
Education and Training Regulator Act 2011 - submission.
Coulter, E. 2020, ‘From Hollywood to hospitals, these Tasmanian businesses are shifting
focus during the coronavirus crisis’, ABC News, 11 April.
CRC (COAG Reform Council) 2009, 2009 COAG Reform Council Report: Report to the
Council of Australian Governments on implementation of the national reform agenda,
Canberra.
CSQ (Construction Skills Queensland) 2020, About us, https://www.csq.org.au/about-us/
(accessed 21 April 2020).
Damgaard, M.T. and Nielsen, H. 2018, ‘Nudging in education’, Economics of Education
Review, vol. 64, June, pp. 313–342.
Dar, A. and Whitehead, T. 2003, Training levies: evidence from evaluations, 6, World Bank
Employment Policy Primer, The World Bank, Washington D.C, pp. 1–17.
304 NASWD REVIEW
Dawkins, J.S. 1989, Improving Australia’s training system, Australian Government
Publishing Service.
Dawkins, P., Hurley, P. and Noonan, P. 2019, Rethinking and revitalising tertiary education
in Australia, Mitchell Institute, Victoria University.
DEECD (Vic) (Department of Education and Early Childhood Development (Victoria))
2012, Refocusing Vocational Training in Victoria.
Deloitte (Deloitte Access Economics) 2012, Econometric Analysis of the Australian
Apprenticeships Incentives Program, Report to the Department of Education
Employment and Workplace Relations, Canberra.
—— 2014, Australian Apprenticeship Mentoring Package: Interim Evaluation, Department
of Industry, Canberra.
—— 2016, Estimating the Public and Private Benefits of Higher Education, Department of
Eudcation and Training, Canberra.
Deloitte Touche Tohmatsu 2015, Review of quality assurance in Victoria’s VET system,
Melbourne.
DESBT (Qld) (Department of Employment, Small Business and Training (Queensland))
2020, About apprenticeships and traineeships, https://desbt.qld.gov.au/training/
apprentices/about (accessed 6 May 2020).
—— 2018, 2018-19 Annual VET Investment Plan.
—— 2019a, Australian Apprenticeship Support Network, https://desbt.qld.gov.au/training/
apprentices/aasn (accessed 8 May 2020).
—— 2019b, Pre-qualified supplier application guide for registered training organisations
2019-20.
—— 2019c, Priority skills list.
—— 2019d, Queensland Priority Skills List - Fact Sheet.
DESE (Department of Education, Skills and Employment) 2016a, Higher Education Support
Act 2003 and Guidelines, https://www.education.gov.au/higher-education-support-act-
2003-and-guidelines (accessed 22 April 2020).
—— 2016b, VET FEE-HELP Statistics: Provider Tables, 2015.
—— 2017, VET FEE-HELP Statistics: Individual Provider Tables, 2016.
—— 2018a, Commonwealth Grant Scheme (CGS), https://www.education.gov.au/
commonwealth-grant-scheme-cgs (accessed 11 March 2020).
—— 2018b, Funding, https://www.education.gov.au/funding (accessed 11 March 2020).
—— 2018c, Stonemason, ANZSCO 3311-12, Canberra.
—— 2018d, Supporting apprentices and trainees, fact sheet, Australian Government.
—— 2018e, VSL Annual report Jan-Dec 2017 - Table 6 addendum.
REFERENCES 305
—— 2019a, 2018 student summary tables, Canberra.
—— 2019b, Better understanding student journeys, 25 July.
—— 2019c, Funding clusters and indexed rates, https://www.education.gov.au/funding-
clusters-and-indexed-rates (accessed 29 October 2019).
—— 2019d, Historical list of skill shortages in Australia, (Excel spreadsheet), Australian
Government.
—— 2019e, International Student Data 2019.
—— 2019f, National Career Education Strategy, https://www.education.gov.au/national-
career-education-strategy (accessed 1 March 2020).
—— 2019g, Performance-Based Funding for the Commonwealth Grant Scheme,
https://www.education.gov.au/performance-based-funding-commonwealth-grant-
scheme-0 (accessed 22 April 2020).
—— 2019h, Portfolio Budget Statements 2019-20 - Education and Training Portfolio,
p. 191.
—— 2019i, Selected Higher Education Statistics - 2018 Student Data, Canberra.
—— 2019j, Selected Higher Education Statistics – Student data - Award Course
Completions Time Series, https://app.powerbi.com/view?r=eyJrIjoiMjIwYzhk
MGYtMjgxNS00YTU1LWJhMDUtYzdlNjNmYmQ2MGZiIiwidCI6ImRkMGNmZD
E1LTQ1NTgtNGIxMi04YmFkLWVhMjY5ODRmYzQxNyJ9 (accessed 10 July 2019).
—— 2019k, VSL Annual report Jan-Dec 2018 - Table 1 to Table 6 addendum.
—— 2020a, Delivering better careers information: Co-design the digital platform project
with the Institute to streamline and strengthen careers development information,
https://www.nci.employment.gov.au/digitalplatform (accessed 8 May 2020).
—— 2020b, Delivering Skills for Today and Tomorrow, https://www.employment.gov.au/
delivering-skills-today-and-tomorrow (accessed 3 April 2020).
—— 2020c, National individual occupational reports, https://docs.employment.gov.au/
collections/national-individual-occupational-reports (accessed 10 April 2020).
—— 2020d, National Register on Vocational Education in Australia.
—— 2020e, Student debt cancelled by the department broken down by each provider.
—— 2020f, ‘This is what we heard’: Skills Organisations co-design consultations,
https://docs.employment.gov.au/system/files/doc/other/so_this_is_what_we_heard_1.p
df (accessed 7 May 2020).
—— 2020g, VET Student Loans, https://www.employment.gov.au/vet-student-loans
(accessed 21 April 2020).
DESSFB (Department of Employment, Skills, Small and Family Business) 2014a,
Preparing Secondary Students for Work, Canberra.
306 NASWD REVIEW
—— 2014b, What is VET delivered to secondary students?,
https://pssfw.myskills.gov.au/What-is-VET-delivered-to-secondary-students/ (accessed
9 January 2020).
—— 2019a, Co-designing the National Skills Commission, Discussion Paper, p. 14.
—— 2019b, National Careers Institute Consultations and Co-design Background Paper.
—— 2019c, Provision of support services in the Northern Territory through the Australian
Apprenticeship Support Network: Closed ATM View - RFT PRN 183377,
https://www.tenders.gov.au/Atm/ShowClosed/86a35c56-60b6-48b6-8f6a-
5c1cde939801?PreviewMode=False (accessed 8 May 2020).
—— 2019d, Ratings Summary - Labour Market Analysis of Skilled Occupations, Canberra.
—— 2019e, Review of the Australian Apprenticeships National Skills Needs List: Issues
Paper, Canberra.
—— 2020a, National Careers Institute, https://www.employment.gov.au/NCI (accessed 8
January 2020).
—— 2020b, Skills Organisations, https://www.employment.gov.au/SO (accessed 16
January 2020).
—— nd, Training packages, https://www.employment.gov.au/training-packages (accessed
11 October 2019).
DET (Department of Education and Training) 2012, National Foundation Skills Strategy for
Adults, September.
—— 2015, New Arrangements for Training Product Development for Australian Industry.
—— 2016, VET FEE-HELP Redesign - Regulatory Impact Statement, Canberra.
—— 2017a, Pastoral Care Intrinsic to the Learning Approach, Victorian Government,
Melbourne.
—— 2017b, VET Student Loans: Review of the VET Student Loans course list and loan caps
methodology - Discussion Paper.
—— 2018a, Australian Apprenticeship Support Network (AASN): Evaluation of the AASN
Model, Final Report, Australian Government, Canberra.
—— 2018b, Australian Government Response to the National Vocational Education and
Training Regulator Act 2011 Review.
—— nd, Fact Sheet - Training Products, https://www.myskills.gov.au/media/1772/back-to-
basics-training-products.pdf (accessed 17 April 2020).
DET (Vic) (Department of Education and Training (Victoria)) 2016, Skills First: Regional.
—— 2019a, Department of Education and Training - 2018-19 Annual Report,
https://education.vic.gov.au/Documents/about/department/2018-19-annual-report.pdf
(accessed 23 February 2020).
REFERENCES 307
—— 2019b, Skills First, https://www.education.vic.gov.au:443/training/providers/funding
/Pages/skillsfirst.aspx?Redirect=1 (accessed 23 February 2020).
—— 2019c, Skills First Reconnect program, https://www.education.vic.gov.au:443/
about/programs/Pages/reconnect-program.aspx (accessed 23 February 2020).
—— 2019d, Workforce Training Innovation Fund, https://www.education.vic.gov.au:443/
training/providers/funding/Pages/wtif.aspx (accessed 23 February 2020).
—— 2020, Training contract enforcement, https://www.education.vic.gov.au/training/
providers/rto/Pages/enforcement.aspx (accessed 24 February 2020).
Deveson, I. (Training Costs Review Committee) 1990, Training costs of award
restructuring: report of the Training Costs Review Committee.
DFESA (Department for Education South Australia) 2018, A fresh start for TAFE SA, p. 8.
DIISRTE (Department of Industry, Innovation, Science, Research and Tertiary Education)
2012, Regulatory Impact Statement: VET FEE-HELP Redesign 2012, Australian
Government, Canberra.
Dionisius, R., Muehlemann, S., Pfeifer, H., Walden, G., Wenzelmann, F. and Wolter, S.C.
2008, Cost and Benefit of Apprenticeship Training: A Comparison of Germany and
Switzerland, IZA DP No. 3465, Institute for the Study of Labor.
DJSB (Department of Jobs and Small Business) 2019, Child Care Occupations, Australia
2018, Canberra.
Dockery, A.M., Koshy, P., Stromback, T. and Ying, W. 1997, The Cost of Training
Apprentices in Australian Firms, June, Centre for Labour Market Research, Curtin
University, Perth.
——, Stromback, T., Norris, K. and Kelly, R. 2001, ‘Costs and benefits of new
apprenticeships’, Australian Bulletin of Labour, vol. 27, no. 3, pp. 193–204.
DOE (Department of Education) 2014, Commonwealth Grant Scheme Guidelines 2012,
https://www.legislation.gov.au/Details/F2014C00829/Html/Text,
http://www.legislation.gov.au/Details/F2014C00829 (accessed 22 April 2020).
—— 2015, Higher Education Administrative Information for Providers, DET, Canberra.
—— 2016, Redesigning VET FEE-HELP: Discussion Paper.
—— 2019a, Benefits of Educational Attainment - Employment and income support,
Australian Government, Canberra.
—— 2019b, Benefits of Educational Attainment - Healthy behaviour, Australian
Government, Canberra.
—— 2019c, Benefits of Educational Attainment - Income, Australian Government, Canberra.
—— 2017, Skill Shortage Research Methodology, Canberra.
DOE (NSW) (Department of Education (NSW)) 2017, About smart and skilled,
https://smartandskilled.nsw.gov.au/about (accessed 23 February 2020).
308 NASWD REVIEW
DOE (Vic) (Department of Education and Training (Victoria)) 2020, Funded course list,
https://www.education.vic.gov.au:443/training/providers/funding/Pages/fundedcourses.
aspx?Redirect=1 (accessed 21 May 2020).
DPMC (Department of the Prime Minister and Cabinet) 2014, Roles and responsibilities in
education - Part B: Vocational Education and Training and Higher Education, Reform
of the Federation White Paper, December, Issues Paper 4,
https://apo.org.au/sites/default/files/resource-files/2014/12/apo-nid56124-1157041.pdf
(accessed 12 January 2019).
DSG (Tas) (Department of State Growth (Tasmania)) 2018, Ministerial Priorities for
Training and Workforce Development 2018–2021 - A stronger training system -
investing in skills for jobs, https://www.skills.tas.gov.au/__data/assets/pdf_file/
0014/201047/Ministerial_Priorities_for_Training_and_Workforce_Development_2018
-21.pdf (accessed 28 February 2020).
DSS (Department of Social Services) 2019, Growing the NDIS Market and Workforce:
Supporting the Market to Deliver Innovative, People-Centred Services so That
Participants Can Achieve Their Goals, Canberra.
DTBI (Department of Trade and Business Innovation Northern Territory) 2019,
Apprenticeship and traineeship policy, https://business.nt.gov.au/publications/
policies/apprenticeship-and-trainee-policies (accessed 6 May 2020).
DTBI (NT) (Department of Trade, Business and Innovation (NT) 2019, Northern Territory
skilled occupation priority list information paper, May, Northern Territory.
DTWD (WA) (Department of Training and Workforce Development (Western Australia))
2013, Western Australian workforce planning and development model,
https://www.dtwd.wa.gov.au/sites/default/files/uploads/Western-Australian-workforce-
planning-and-development-model-paper.pdf (accessed 21 May 2020).
—— 2018, State Training Plan 2018–2021.
—— 2019, State priority Occupation List Summary Paper, https://www.dtwd.wa.gov.au/
sites/default/files/uploads/dtwd-spol-2019-summary.pdf (accessed 21 May 2020).
EERC (Education and Employment References Committee) 2015, Getting Our Money’s
Worth: The Operation, Regulation and Funding of Private Vocational Education and
Training (VET) Providers in Australia.
ESC (Essential Services Commission) 2011a, VET Fee and Funding Review - Volume I:
Blueprint for Change.
—— 2011b, VET Fee and Funding Review - Volume II: Technical Analysis.
ETD (ACT) (Education and Training Directorate (ACT)) 2015, ACT Quality Framework.
EY Sweeney 2017, Enabling Consumer Comparison of Training: Qualitative and
Quantitative Research Report, Unpublished report.
Farshchi, S. 2020, ‘Expect more jobs and more automation in the post-COVID-19 economy’,
Forbes, https://www.forbes.com/sites/shahinfarshchi/2020/04/10/expect-more-jobs-
REFERENCES 309
and-more-automation-in-the-post-covid-19-economy/#3036755129b4 (accessed 21
April 2020).
Fialho, P., Quintini, G. and Vandeweyer, M. 2019, Returns to different forms of job related
training: Factoring in informal learning, 231, OECD Social, Employment and Migration
Working Papers, Organisation for Economic Cooperation and Development, Paris.
Fieger, P., Karmel, T. and Stanwick, J. 2010, An investigation of TAFE efficiency, National
Centre for Vocational Education Research, Adelaide.
——, Villano, R.A., Rice, J. and Cooksey, R. 2017, ‘Two dimensional efficiency
measurements in vocational education: Evidence from Australia’, International Journal
of Productivity and Performance Management, vol. 66, no. 2, pp. 196–215.
Fowler, C. 2017, The boundaries and connections between VET and higher education
sectors: ‘confused, contested and collaborative’, Occasional Paper, National Centre for
Vocational Education Research, Adelaide.
—— 2018, Boundaries and connections between VET and higher education at AQF 5/6, LH
Martin Institute, Melbourne Graduate School of Education.
—— 2019a, ‘Fit-for-future purpose: architectural policies, foundational enablers spanning
HE/VET sectors’, Campus Review, https://www.campusreview.com.au/2019/06/fit-for-
future-purpose-architectural-policies-foundational-enablers-spanning-hevet-sectors/
(accessed 21 April 2020).
—— 2019b, ‘Models for federated cooperation: past practice and future implications for VET’,
Campus Review, https://www.campusreview.com.au/2019/04/models-for-federated-
cooperation-past-practice-and-future-implications-for-vet/ (accessed 12 March 2020).
—— 2019c, ‘The Joyce Review of VET: good summary, incomplete analysis, solutions
need a rework’, Campus Review, https://www.campusreview.com.au/2019/10/the-joyce-
review-of-vet-good-summary-incomplete-analysis-solutions-need-a-rework/ (accessed
19 May 2020).
—— and Stanwick, J. 2017, A chance to be bold and ambitious: make apprenticeships the
lynchpin to a better integrated tertiary education sector, National Centre for Vocational
Education Research, Adelaide.
Fraser, D. 1996, Training guarantee: its impact and legacy 1990-1994, Main Report,
September, DEETYA, Canberra.
Frontier Economics 2017, Estimating the Impact of the October 2015 Increase in the
Apprentice Rate, Final Report, November.
G8 Universities 2011, Submission to the Review of Higher Education Base Funding, G8
Universities, Canberra.
GAN Australia (Global Apprenticeship Network Australia) 2020, Apprenticeship Vacancies
Down Almost 75% Since the Beginning of the Year, https://gan-
australia.org/apprenticeship-vacancies-down-almost-75-since-the-beginning-of-the-
year/ (accessed 4 May 2020).
310 NASWD REVIEW
Gore, J., Ellis, H., Fray, L., Smith, M., Lloyd, A., Berrigan, C., Lyell, A., Weaver, N. and
Holmes, K. 2017, Choosing VET: Investigating the VET Aspirations of School Students,
National Centre for Vocational Education Research, Adelaide.
Griffin, T. and Beddie, F. 2011, Older workers: research readings, National Centre for
Vocational Education and Research.
Guthrie, H., Smith, E., Burt, S. and Every, P. 2014, Review of the Effects of Funding
Approaches on Service Skills Qualifications and Delivery in Victoria, Victoria
University, Melbourne.
Hargreaves, J. and Osborne, K. 2017, Choosing VET: aspirations, intentions and choice,
National Centre for Vocational Education Research, Adelaide.
Healy, J., Mavromaras, K. and Sloane, P. 2015, ‘Adjusting to skill shortages in Australian
SMEs’, Applied Economics, vol. 47, no. 24, pp. 2470–2487.
Heath, A. 2020, Skills, Technology and the Future of Work, Speech to the Career Education
Association of Victoria and the Victorian Commercial Teachers Association Work
Futures Conference, Melbourne.
Herbert, S. 2016, $50 Million for TAFES to support vulnerable Victorians, Media Release,
26 March.
Hetherington, D. and Rust, J. 2013, Training Days-Models of Vocational Training
Provision: Lessons from the Victorian experience, Per Capita.
Hjalmarsson, R. and Lochner, L. 2012, The Impact of Education on Crime: International
Evidence, Research Report, ifo Institute, Munich.
Hodge, S. 2018, The problematic role of CBT in Australian VET, The University of
Melbourne.
Hoeckel, K. 2008, Costs and Benefits in Vocational Education and Training, OECD, Paris.
Holmlund, H., Lindahl, M. and Plug, E. 2010, The Causal Effect of Parents’ Schooling on
Children’s Schooling-A Comparison of Estimation Methods, SSRN Scholarly Paper ID
1705112, Social Science Research Network, Rochester, NY.
Hrastovec, J. 2020, ‘A helping hand – these Australian distilleries are pivoting from booze
to hand-sanitiser production’, The Weekend Edition, 31 March.
HRSCEE (House of Representatives Standing Committee on Education and Employment)
2014, TAFE: an Australian asset. Report of the inquiry into TAFE and its operation,
Canberra.
HRSCEET (House of Representatives Standing Committee on Employment, Education and
Training) 2018, Unique Individuals, Broad Skills: Inquiry into School to Work
Transition, Parliament of Australia, Canberra.
IC (Industry Commission) 1997, Community Service Obligations: Policies and Practices of
Australian Governments, Staff Information Paper, Canberra.
REFERENCES 311
IPART (Independent Pricing and Regulatory Tribunal) 2013, Pricing VET under Smart and
Skilled, Final Report, Sydney.
Ithaca Group 2016, Everybody’s Core Business: Research into the Non-technical
Capabilities Needed for Successful Participation in Work or Further Study, Department
of Education and Training, Canberra.
—— 2018, Credit Pathways in VET and Higher Education, Department of Education and
Training, Canberra.
Jha, N. and Polidano, C. 2016, Vocational Education and Training: A Pathway to the
Straight and Narrow, Melbourne Institute Working Paper No. 21/16, Melbourne Institute
of Applied Economic and Social Research, The University of Melbourne.
JobOutlook 2020, Aged and Disabled Carers, https://joboutlook.gov.au/Occupation?
search=alpha&code=4231 (accessed 21 February 2020).
Johanson, R. 2009, A review of national training funds, SP 0922, Social Protection
discussion paper, The World Bank, Washington D.C, pp. 1–122.
Johnson, S. 2016, A Collaborative Approach to Mentoring: A Model for Industry Training
Organisations and Employers, Research Report, Downer New Zealand and Ako Aotearoa.
Joyce, S. 2019, Strengthening Skills: Expert Review of Australia’s Vocational Education and
Training System, Department of the Prime Minister and Cabinet.
Karmel, T., Blomberg, D. and Vnuk, M. 2010, The Effectiveness of the Traineeship Model,
National Centre for Vocational Education Research, Adelaide.
—— and Fieger, P. 2012, The value of completing a VET qualification, Research Report,
National Centre for Vocational Education Research, Adelaide.
—— and Lim, P. 2013, Socioeconomic Disadvantage and Participation in Tertiary
Education: Preliminary Thoughts, Occasional Paper, National Centre for Vocational
Education Research, Adelaide.
—— and Rice, T. 2011, The Economics of Apprenticeships and Traineeships, National
Centre for Vocational Education Research, Adelaide.
—— and Roberts, D. 2012, The Role of ‘Culture’ in Apprenticeship Completions, National
Centre for Vocational Education Research.
Korbel, P. and Misko, J. 2016, VET provider market structures: history, growth and change,
Research Report, National Centre for Vocational Education Research, Adelaide.
—— and Osborne, K. 2019, The Role and Function of Small VET Providers, National Centre
for Vocational Education Research, Adelaide.
KPMG 2018, Reimagining Australia’s Tertiary Education System, KPMG, Melbourne.
—— 2019, Evaluation of the VET Student Loans Program, Final Report.
Lawson, N. 2017, ‘Liquidity Constraints, Fiscal Externalities, and Optimal Tuition
Subsidies’, American Economic Journal: Economic Policy, vol. 9, no. 4, pp. 313–343.
312 NASWD REVIEW
Leal, H. 2019, ‘Firm-level Insights into Skills Shortages and Wages Growth’, Bulletin,
March Quarter, pp. 1–18.
Lee, S. and Coelli, M. 2010, Analysis of private returns to vocational education and training,
National Centre for Vocational Education Research, Adelaide.
Leigh, A. 2008, ‘Returns to Education in Australia’, Economic Papers, vol. 27, no. 3,
pp. 233–249.
Leung, F., McVicar, D., Polidano, C. and Zhang, R. 2013, Impacts of the Victorian Training
Guarantee on Vet Enrolments,course Choice and Completion, Final report, February,
Melbourne Institute of Applied Economic and Social Research, Melbourne.
——, ——, Polidano, C. and Zhang, R. 2014, Early Impacts of the Victorian Training
Guarantee on Vet Enrolments and Graduate Outcomes, National Center for Vocational
Education and Research, Adelaide.
Loewenstein, G., Sunstein, C. and Golman, R. 2014, ‘Disclosure: Psychology Changes
Everything’, Annual Review of Economics, no. 6, pp. 391–419.
Lomax-Smith, J., Watson, L. and Webster, B. 2011, Higher Education Base Funding
Review: Final Report, Department of Education, Employment and Workplace Relations.
Long, M. and Shah, C. 2008, Private Returns to Vocational Education and Training
Qualifications, Centre for the Economics of Education and Training, Monash University,
Melbourne.
MacMillan, J. 2020, ‘Stood-down apprentices facing uncertain future in post-coronavirus
world’, ABC News, 4 May.
Mavromaras, K., McGuinness, S. and Fok, Y. 2010, The incidence and wage effects of
overskilling among employed VET graduates, National Center for Vocational Education
and Research.
McDowell, J., Oliver, D., Persson, M., Fairbrother, R., Wetzlar, S., Buchanan, J. and
Shipstone, T. 2011, A Shared Responsibility: Apprenticeships for the 21st Century Expert
Panel Paper, Commonwealth of Australia, Canberra.
McMahon, W.W. 2004, The Social and External Benefits of Education, Edward Elgar
Publishing.
—— 2009, Higher Learning, Greater Good: The Private and Social Benefits of Higher
Education, Johns Hopkins University Press.
McVicar, D. and Polidano, C. 2015, If You Get What You Want, Do You Get What You Need?
Course Choice and Achievement Effects of a Vocational Education and Training
Voucher Scheme, Working Paper No. 6/15, Melbourne Institute.
Meagher, G.A. and Pang, F. 2011, Labour marketing forecasting, reliability and workforce
development, Centre of Policy Studies, Monash University.
MEGT 2020, In-Training Services for apprentices, https://www.megt.com.au/apprentices-
and-trainees/get-support-during-my-apprenticeship-or-traineeship/in-training-services
(accessed 13 March 2020).
REFERENCES 313
Mentally Friendly 2019, My Skills Alpha Findings & Recommendations (unpublished),
Commissioned by the Department of Education.
Mikakos, J. 2015, Support For 10,000 First-Year Apprentices Will Continue,
https://www.premier.vic.gov.au/support-for-10000-first-year-apprentices-will-continue/
(accessed 8 May 2020).
Mining.com 2011, The issue of skills poaching in mining: is a training levy the answer?, 5
May, https://www.mining.com/the-issue-of-skills-poaching-in-mining-is-a-training-
levy-the-answer/ (accessed 21 April 2020).
Misko, J. 2020, Traditional trade apprenticeships: training activity, employer incentives and
international practice, National Centre for Vocational Education Research, Adelaide.
—— and Korbel, P. 2019, Do course durations matter to training quality and outcomes?
—— and Wibrow, B. 2020a, Traditional trade apprenticeships: learning from the field,
National Centre for Vocational Education Research, Adelaide.
—— and —— 2020b, Traditional trade apprenticeships: learnings from the field, National
Centre for Vocational Education Research, Adelaide.
Mitchell, J., Dobbs, G. and Ward, J. 2008, A systematic approach to retaining apprentices,
Australian Chamber of Commerce and Industry and Department of Education,
Employment and Workplace Relations, Canberra.
Moodie, G. and Wheelahan, L. 2018, Implications of the human capability approach for
rrelations between Australian vocational and higher education.
mpconsulting 2020, Rapid Review of the Australian Skills Quality Authority’s Regulatory
Practices and Processes, Report prepared for the Department of Education, Skills and
Employment.
MTA Qld (Motor Trades Association of Queensland) 2019, ‘Auto Industry Mentor Program
to end this year’, Motor trader E-Magazine, November, pp. 80–81.
Muhlemann, S. 2016, The Cost and Benefits of Work-based Learning, OECD Education
Working Paper no. 143, OECD, Paris.
Muller, N. and Behringer, F. 2012, Subsidies and Levies as Policy Instruments to Encourage
Employer-Provided Training, OECD Education Working Papers No. 80, OECD, Paris.
Munro, M., Maxim, R. and Whiton, J. 2020, The robots are ready as the COVID-19
recession spreads, The Brookings Institute, https://www.brookings.edu/blog/the-
avenue/2020/03/24/the-robots-are-ready-as-the-covid-19-recession-spreads/ (accessed
21 April 2020).
Myconos, G., Dommers, E. and Clarke, K. 2018, Viewed from the margins: navigating
disadvantage and VET, August, University of Melbourne and Brotherhood of St Laurence.
National Australian Apprenticeship Association 2017, Industry Specialist Mentoring for
Australian Apprentices: Consultation Paper Response.
314 NASWD REVIEW
navitas 2019, Review into the Australian vocational education and training system led by
the Hon Steve Joyce - Navitas Position Paper.
NCC (National Competition Council) 2002, Assessment of governments’ progress in
implementing the National Competition policy and related reforms, August, Volume
one: Assessment, AusInfo, Canberra.
NCVER (National Centre for Vocational Education Research) 2010, 2009 Student Outcomes
Survey Unit Record File.
—— 2011a, Overview of apprenticeship and traineeship institutional structures, Adelaide.
—— 2011b, Overview of the Australian apprenticeship and traineeship system, Adelaide.
—— 2015, A preliminary analysis of the outcomes of students assisted by VET FEE-HELP,
Adelaide.
—— 2018a, VET Knowledge Bank - Landmark documents, http://www.voced.edu.au/vet-
knowledge-bank-landmark-documents (accessed 5 November 2019).
—— 2018b, VET Knowledge Bank - Milestones in the history of VET, http://www.voced.
edu.au/vet-knowledge-bank-history-vet-milestones (accessed 5 November 2019).
—— 2018c, VET Student Outcomes, Adelaide.
—— 2019a, Australian vocational education and training statistics: government-funded
students and courses, 2018, Adelaide.
—— 2019b, Completion and attrition rates for apprentices and trainees 2018, Adelaide.
—— 2019c, Employers’ use and views of the VET system 2019, Adelaide.
—— 2019d, Government funding of VET 2018, Statistical report, Adelaide.
—— 2019e, Government funding of VET 2018: terms and definitions, Adelaide.
—— 2019f, Historical time series of apprenticeships and traineeships in Australia, from
1963, Adelaide.
—— 2019g, Historical time series of government-funded vocational education and training
from 1981 to 2018, Time series data on student numbers and government expenditure in
VET, South Australia.
—— 2019h, Timeline of Australian VET policy initiatives 1998-2018, VET Knowledge
Bank, Adelaide.
—— 2019i, Total VET Students and Courses 2018, Adelaide.
—— 2019j, Total Vet Students and Courses: Terms and Definitions, Adelaide.
—— 2019k, VET in Schools 2018: Data Slicer, Adelaide.
—— 2019l, VET Student Outcomes, Adelaide.
—— 2019m, VOCSTATS dataset: Government-funded students and courses; VET program
completions 2003-18, Adelaide.
—— 2019n, VOCSTATS dataset: Total VET Students and Courses 2018, Adelaide.
REFERENCES 315
—— 2019o, VOCSTATS dataset: TVA program completions 2015-18, Adelaide.
—— 2019p, VOCSTATS dataset: TVA Program Enrolments 2015-2018, Adelaide.
—— 2019q, VOCSTATS dataset: VET in Schools 2018, Adelaide.
—— 2020a, Apprentices and trainees 2019: September quarter - Australia, Adelaide.
—— 2020b, VOCSTATS dataset: Apprentices and Trainees - September 2019, Adelaide.
Nechvoglod, L., Karmel, T. and Saunders, J. 2009, The cost of training apprentices, National
Centre for Vocational Education Research, Adelaide.
Nelms, L., Yuen, K., Pung, A., Farooqui, S., Walsh, J. and Karmel, T. 2017, Factors
affecting apprenticeships and traineeships, Research Report 3/2017, Fair Work
Commission, Canberra.
Newton, D., Day, A., Giles, M., Wodak, J., Graffam, J. and Baldry, E. 2018, ‘The Impact of
Vocational Education and Training Programs on Recidivism: A Systematic Review of
Current Experimental Evidence’, International Journal of Offender Therapy and
Comparative Criminology, vol. 62, no. 1, pp. 187–207.
Nguyen, K. 2020, ‘How coronavirus could reshape the way Australians work forever’, ABC News.
NMBA (Nursing and Midwifery Board of Australia) 2017a, Enrolled nurse standards for
practice, https://www.nursingmidwiferyboard.gov.au/Codes-Guidelines-Statements/
Professional-standards/enrolled-nurse-standards-for-practice.aspx (accessed 22 April 2020).
—— 2017b, Registered nurse standards for practice, https://www.nursingmidwiferyboard
.gov.au/Codes-Guidelines-Statements/Professional-standards/registered-nurse-standards-for-
practice.aspx (accessed 22 April 2020).
—— 2020, Regulating Australia’s nurses and midwives,
https://www.nursingmidwiferyboard.gov.au/ (accessed 7 March 2020).
Noonan, P. 2016a, Laying the foundations for apprenticeship reform, November, New South
Wales Chamber.
Noonan, P. 2016b, VET Funding in Australia - Background, Trends and Future Directions,
Mitchell Policy Paper, Mitchell Institute, Victoria University, Melbourne.
——, Blagaich, A., Kift, S., Lilly, M., Loble, L., More, E. and Persson, M. 2019, Review of
the Australian Qualifications Framework Final Report 2019, Department of Education.
—— and Pilcher, S. 2017a, Finding the Truth in the Apprenticeships Debate, 2017, Mitchell
Institute, Victoria University.
—— and —— 2017b, ‘There is no apprenticeships “crisis” in Australia’, The Conversation,
1 September.
Norton, A. 2019, ‘Demand-driven funding for universities is frozen. What does this mean
and should the policy be restored?’, The Conversation, 6 November.
—— and Cakitaki, B. 2016, Mapping Australian higher education 2016, Grattan Institute,
Melbourne.
316 NASWD REVIEW
—— and Cherastidtham, I. 2015, The cash nexus: how teaching funds research in Australian
universities, Grattan Institute, Melbourne.
—— and —— 2018, Mapping Australian higher education 2018.
Norton, A., Cherastidtham, I. and Mackey, W. 2018, Mapping Australian Higher Education
2018, Grattan Institute, Melbourne.
Norton, A., Cherastidtham, I. and Mackey, W. 2019, Risks and rewards: when is vocational
education a good alternative to higher education?, No. 2019-06, Grattan Institute.
NSW Auditor-General (New South Wales Auditor-General) 2015, Vocational Education
and Training (VET) Reform Department of Education and Communities, Performance
Audit 249, Audit Office of New South Wales.
NSW Government (New South Wales Government) 2018, Providers no longer approved to
deliver Smart and Skilled Subsidised Training, https://smartandskilled.nsw.gov.au/for-
students/consumer-protection-for-students/terminated-providers (accessed 10 February 2020).
—— 2020a, Billions in tax relief for business, $1 billion fund for jobs, and help for the
vulnerable, https://www.nsw.gov.au/news/billions-tax-relief-for-business-1-billion-
fund-for-jobs-and-help-for-vulnerable (accessed 21 April 2020).
—— 2020b, COVID-19 Update - Information for apprentices and trainees,
https://www.training.nsw.gov.au/news/articles/covid-19/faqs_at.html (accessed 4 May 2020).
NSW Health 2020, GradStart: Graduate nursing and midwifery recruitment,
https://www.health.nsw.gov.au/nursing/employment/Pages/recruit.aspx (accessed 7
March 2020).
NSW SCSD (NSW Standing Committee on State Development) 2006, Inquiry into skills
shortages in rural and regional NSW, NSW Parliament, Sydney.
NT Government (Northern Territory Government) 2017, Northern Territory Economic
Development Framework, https://cmsexternal.nt.gov.au/__data/assets/pdf_file/
0008/434546/economic-development-framework.pdf (accessed 26 May 2020).
—— 2018, Skilling the Territory Annual Investment Plan 2018/19.
—— 2020, Investing in VET.
O’Dwyer, L. 2019, Completion rates for group training organisations and direct employers:
how do they compare? Support document: literature review and other appendices,
National Centre for Vocational Education Research, Adelaide.
—— and Korbel, P. 2019, Completion rates for group training organisations and direct
employers: how do they compare?, National Centre for Vocational Education Research,
Adelaide.
OECD (Organisation for Economic Cooperation and Development) 2012, Survey of Adult
Skills - First Results, Paris.
—— 2018, Seven questions about apprenticeships: answers from international experience,
OECD Reviews of Vocational Education and Training, OECD Publishing, Paris.
REFERENCES 317
—— 2019a, 2019 Skills Outlook: Thriving in a Digital World, Paris.
—— 2019b, Results from PISA 2018, Paris.
Oreopoulos, P. and Salvanes, K.G. 2011, ‘Priceless: The Nonpecuniary Benefits of
Schooling’, Journal of Economic Perspectives, vol. 25, no. 1, pp. 159–184.
PC (Productivity Commission) 2011, Impacts and Benefits of COAG Reforms: Framework
Report, Research Report, Canberra.
—— 2012, ‘Economy-wide modelling of impacts of COAG reforms’, Supplement to
Impacts of COAG Reforms: Business Regulation and VET, Canberra.
—— 2016, National Education Evidence Base, Report no. 80, Canberra.
—— 2017a, Introducing Competition and Informed User Choice into Human Services:
Reforms to Human Services, Report no. 85, Canberra.
—— 2017b, National Disability Insurance Scheme (NDIS) Costs, Study Report, Canberra.
—— 2017c, National Disability Insurance Scheme (NDIS) Costs, Position Paper, Canberra.
—— 2017d, Shifting the Dial: 5 Year Productivity Review, Report no. 84, Canberra.
—— 2017e, University Education, Supporting Paper No. 7, Shifting the Dial, Canberra.
—— 2019a, Performance Reporting Dashboard - Skills.
—— 2019b, Review of the National Disability Agreement, Study Report, Canberra.
—— 2019c, The Demand Driven University System: A Mixed Report Card, Commission
Research Paper, Canberra.
Pfeifer, H. 2016, Firms’ motivation for training apprentices: an Australian-German
comparison, National Centre for Vocational Education Research, Adelaide.
Polesel, J., Leahy, M., Rice, S., Gillis, S., Klatt, M. and Clarke, K. 2015, Paving the
Pathway: Addressing Post Year 10 Education, NSW Business Chamber, Sydney.
Polidano, C. and Ryan, C. 2016, Long-Term Outcomes from Australian Vocational
Education, Working Paper no. 35/16, Melbourne Institute Working Paper Series,
University of Melbourne.
——, van de Ven, J. and Voitchovsky, S. 2017a, Making ‘good’ choices: the impact of
entitlement models of upskilling later in life, Research Report, National Centre for
Vocational Education Research, Adelaide.
——, —— and —— 2017b, The Power of Self-Interest: Effects of Education and Training
Entitlements in Later-Life, Melbourne Institute Working Paper Series no. 12/17,
Melbourne Institute Working Paper Series, University of Melbourne.
Priest, S. 2009, What is ‘social capital’ and how can vocational education and training help
develop it?, National Centre for Vocational Education Research, Adelaide.
Prime Minister of Australia 2020a, Advice on Coronavirus, https://www.pm.gov.au/
media/advice-coronavirus (accessed 3 May 2020).
318 NASWD REVIEW
—— 2020b, Border restrictions, https://www.pm.gov.au/media/border-restrictions
(accessed 3 May 2020).
—— 2020c, Update on Coronavirus measures - Media Statement 18 March,
https://www.pm.gov.au/media/update-coronavirus-measures (accessed 3 May 2020).
—— 2020d, Update on Coronavirus measures - Media Statement 20 March,
https://www.pm.gov.au/media/update-coronavirus-measures-0 (accessed 3 May 2020).
—— 2020e, Update on Coronavirus measures - Media Statement 22 March,
https://www.pm.gov.au/media/update-coronavirus-measures-220320 (accessed 3 May 2020).
QLD Auditor-General (Queensland Audit Office) 2019, Investing in vocational education
and training - Report 1: 2019–20, Queensland Audit Office, Queensland.
Quantum Consulting 2011, Review of the Kickstart Mentoring Initiative, Department of
Education, Employment and Workplace Relations, Canberra.
Queensland Government 2020, COVID-19 economic relief package – $4 billion to support
Queenslanders’ health, jobs and businesses, https://www.treasury.qld.gov.au/programs-
and-policies/covid19-package/ (accessed 21 April 2020).
Queensland Health 2019, Nursing and midwifery, https://www.health.qld.gov.au/
employment/work-for-us/clinical/nursing-midwifery (accessed 7 March 2020).
Richardson, S. 2007, What is a skill shortage?, National Centre for Vocational Education
Research, Adelaide.
Ryan, C. 2002, Individual returns to vocational education and training qualifications: Their
implications for lifelong learning, Australian National Training Authority, Adelaide.
Ryan, R. 2011, How VET responds: a historical policy perspective, Occasional Paper,
National Centre for Vocational Education Research, Adelaide.
Sabates, R., Salter, E. and Obolenskaya, P. 2012, ‘The social benefits of initial vocational
education and training for individuals in Europe’, Journal of Vocational Education &
Training, vol. 64, no. 3, pp. 233–244.
Saccaro, F. and Wright, R. 2018, VET FEE-HELP: What went wrong?, University of Melbourne.
SADIS (South Australian Department for Innovation and Skills) 2019, Department for
Innovation and Skills Annual Report 2018-19.
Saniter, N. and Siedler, T. 2014, The Effects of Occupational Knowledge: Job Information
Centers, Educational Choices, and Labor Market Outcomes, IZA Discussion Paper 8100.
Schubert, R. and Goedegebuure, L. 2017, Strengths and Benefits of the Victorian TAFE
Model, LH Martin Institute, Melbourne Graduate School of Education, Melbourne.
——, —— and Meek, L. 2018, Revisioning the system: A critical analysis and the way
forward, The University of Melbourne.
SCRGSP (Steering Committee for the Review of Government Service Provision) 2014,
Report on Government Services 2014, Productivity Commission, Canberra.
REFERENCES 319
—— 2017, Report on Government Services 2017, Productivity Commission, Canberra.
—— 2019, Report on Government Services 2019, Productivity Commission, Canberra.
—— 2020, Report on Government Services 2020 - Part B Child Care Education and
Training, Productivity Comission.
Shah, C. and Burke, G. 2003, Skills shortages: concepts, measurement and implications,
November, Centre for the Economics of Education and Training, Monash University,
Melbourne.
Shergold, P. 2019, Review of Senior Secondary Pathways into Work, Further Education and
Training: Background paper.
Sianesi, B. and van Reenen, J. 2003, ‘The Returns to Education: Macroeconomics’, Journal
of Economic Surveys, vol. 17, no. 2, pp. 157–200.
Sinning, M. 2014, How much is it worth? New estimates of private returns to university
education in Australia, December, University of Queensland, RWI and IZA.
Skills Canberra 2019, 2019 Australian Capital Territory Requirements for Apprenticeship
Network Providers.
—— nd, Australian Apprenticeships, https://www.skills.act.gov.au/apprenticeships
(accessed 6 May 2020a).
—— nd, Students, https://www.skills.act.gov.au/students (accessed 7 May 2020b).
Skills SA, S. 2020, South Australia’s Traineeship and Apprenticeship System: Information
Booklet.
Skills Tasmania nd, Employment conditions for apprentices and trainees,
https://www.skills.tas.gov.au/employers/employing_an_apprentice_or_trainee/employ
ment_conditions_for_apprentices_and_trainees (accessed 6 May 2020).
Smith, A. and Billett, S. 2004, Mechanisms for increasing employer contributions to
training: An international comparison, National Centre for Vocational Education
Research, Adelaide.
—— 2005, ‘Getting employers to spend more on training: lessons from overseas’ in Ball, E.
(ed.), Funding and financing vocational education and training: research readings,
NCVER, Adelaide.
Snell, D. and Hart, A. 2007, ‘I think about leaving every day. Doesn’t everyone?’: Reasons
for non-completion and dissatisfaction amongst apprentices and trainees, Research Unit
for Work and Communications Futures, Monash University, Melbourne.
—— and —— 2008, ‘Reasons for non-completion and dissatisfaction among apprentices
and trainees: a regional case study’, International Journal of Training Research, vol. 6,
no. 1, pp. 44–73.
South Australian Training Advocate nd, About us, https://www.trainingadvocate.sa.gov.au
(accessed 13 March 2020).
320 NASWD REVIEW
SSA (Skills South Australia) 2019, Upfront Assessment of Need Guidelines, Version 1.1, 12
November, South Australian Government, Adelaide.
SSON (Skills Senior Officials Network) 2020, Vocational Education and Training Reform
Roadmap Consultation draft, COAG, Canberra.
Stratton, R. 2014, Review of the Operation and Effectiveness of the Building and Construction
Industry Training Fund and Levy Collection Act 1990, WA Government, Perth.
Stromback, T. and Dockery, A.M. 2005, ‘Straight to Work or a Traineeship: A Comparison
of Two Pathways’, Australian Journal of Labour Economics, vol. 8, no. 4, pp. 309–329.
TAFE NSW 2016, TAFE NSW Strategic Plan 2016-22.
—— 2019, TAFE NSW Annual Report, NSW Government.
TAFE Queensland 2019, TAFE Queensland VET Investment Plan 2018-19.
Tasmanian Government 2013, Training and Workforce Development Act.
—— 2019, Tasmanian Government Submission - Expert Review of Australia’s Vocational
Education and Training System.
TasTAFE 2019, Annual Report 2018-19.
TBCITB (Tasmanian Building & Construction Industry Training Board) 2020, Levy FAQs,
https://www.tbcitb.com.au/levy/faqs/ (accessed 21 April 2020).
TDA (TAFE Directors Australia) 2020, Newsletter 27 April.
TEQSA (Tertiary Education Quality and Standards Agency) 2017, FAQs,
https://www.teqsa.gov.au/faqs (accessed 2 March 2020).
Tierney, G. 2017, More support for Victorian apprentices, https://www.premier.vic.gov.au/
more-support-for-victorian-apprentices/ (accessed 8 May 2020).
Toner, D.P. 2003, Declining Apprentice Training Rates: Causes, Consequences and
Solutions, University of Western Sydney.
Toner, P. 2018, How Economics Explains Failure of the Publicly Funded Privately
Delivered Training Market, University of Melbourne.
Tony Powers and Associates 2011, ‘The Way Ahead’ Mentoring of Aboriginal Apprentices
and Trainees: Follow Up and Assessment.
Training and Skills Commission, SA 2017, Skills for Future Jobs 2020 Series.
Training and Skills Commission (South Australia) and TSC 2019, Future-proofing the South
Australian Apprenticeship and Traineeship System, Recommendations Paper 2019,
Skills for Future Jobs 2020 Series.
Training Services NSW 2012, Part-time apprenticeships and traineeships,
https://www.training.nsw.gov.au/apprenticeships_traineeships/policy/policy_procedure
s/nominal_terms_parttime.html (accessed 6 May 2020).
—— 2018, Training Plan, https://www.training.nsw.gov.au/apprenticeships_traineeships/
training_providers/training_plans/index.html (accessed 9 April 2020).
REFERENCES 321
—— 2019, NSW research project: Pathways for the Future.
—— 2020, Smart and Skilled - NSW Skills List, NSW Government.
Trendle, B. 2014, The effect of a mentoring program on Indigenous apprenticeship
completion in Queensland, NCVER, Adelaide.
Trudzik, L. 2015, State of the tertiary education market, https://www.acilallen.com.au/
insights/australias-private-education-and-training-industry (accessed 6 November 2019).
Turnbull, S. 2012, ‘Mining industry poaching our farmhands’, ABC News, 20 July.
Universities Australia 2019, Higher Education: Facts and Figures July 2019, Universities
Australia, Canberra.
Victoria State Government 2019, Summary: Skills First Evaluation,
https://www.education.vic.gov.au/training/providers/funding/Pages/skillsfirst.aspx?Red
irect=1 (accessed 5 March 2019).
—— 2020, Skilling up Victorians to get through the Coronavirus Crisis,
https://www.premier.vic.gov.au/skilling-up-victorians-to-get-through-the-coronavirus-
crisis/ (accessed 21 April 2020).
Victorian Auditor-General 2014, Apprenticeship and Traineeship Completion, Melbourne.
Victorian Government 2008, Securing jobs for your future: skills for Victoria, Department
of Innovation, Industry and Regional Development.
Victorian Registration and Qualifications Authority 2019, Minimum hours for employment
and training, https://www.vrqa.vic.gov.au:443/apprenticeships/Pages/minimum-hours-
for-employment-and-training.aspx (accessed 6 May 2020).
Victorian TAFE Association 2017, Review of the National Vocational Education and
Training Regulator Act 2011: Victorian TAFE Association Response.
Vu, T.B., Hammes, D.L. and Im, E.I. 2012, ‘Vocational or university education? A new look
at their effects on economic growth’, Economics Letters, vol. 117, no. 2, pp. 426–428.
WACTF (WA Construction Training Fund) 2020, BCITF Levy,
https://ctf.wa.gov.au/industry/bcitf-levy/ (accessed 21 April 2020).
Walker, J. 2019, Review of the Building and Construction Industry Training Fund and Levy
Collection Act 1990, WA Government, Perth, https://www.parliament.wa.gov.au/
publications/tabledpapers.nsf/displaypaper/4013495cac3fbb4f7cc13335482584c800069
3f4/$file/tp-3495.pdf (accessed 26 May 2020).
Wei, H. 2010, Measuring Economic Returns to Post-School Education in Australia, Cat. no.
1351.0.55.032, Australian Bureau of Statistics, Canberra.
Weil, D., Fung, A., Graham, M. and Fagotto, E. 2006, ‘The Effectiveness of Regulatory
Disclosure Policies’, Journal of Policy Analysis and Management, vol. 25, no. 1,
pp. 155–181.
Wellings, P., Black, R., Craven, G., Freshwater, D. and Harding, S. 2019, Performance-
based funding for the commonwealth grant scheme, Department of Education, Canberra.
322 NASWD REVIEW
Westergaard-Nielsen, N. and Rasmussen, A.R. 1997, The impact of subsidies on
Apprenticeship Training, Copenhagen.
Western Australia Department of Training and Workforce Development 2018, Fact Sheet:
School based apprenticeships and traineeships: Minimum hours per week.
Wheelahan, L. and Moodie, G. 2011, The quality of teaching in VET, Final Report and
Evaluations, Australian College of Educators, Mawson.
WHO (World Health Organization) 2020, Coronavirus disease (COVID-19) Situation Report 120.
Wilkins, R. 2015, The Household, Income and Labour Dynamics in Australia Survey:
Selected Findings from Waves 1 to 12, Melbourne Institute of Applied Economic and
Social Research, The University of Melbourne.
—— 2016, The Household, Income and Labour Dynamics in Australia Survey: Selected
Findings from Waves 1 to 14, Melbourne Institute of Applied Economic and Social
Research, The University of Melbourne.
—— 2017, The Household, Income and Labour Dynamics in Australia Survey: Selected
Findings from Waves 1 to 15, Melbourne Institute of Applied Economic and Social
Research, The University of Melbourne.
—— and Lass, I. 2018, The Household, Income and Labour Dynamics in Australia Survey:
Selected Findings from Waves 1 to 16, Melbourne Institute of Applied Economic and
Social Research, The University of Melbourne.
Winston, C. 2008, ‘The Efficacy of Information Policy: A Review of Archon Fung, Mary
Graham, and David Weil’s Full Disclosure: The Perils and Promise of Transparency’,
Journal of Economic Literature, vol. 46, no. 3, pp. 704–717.
Wolter, S. and Ryan, P. 2010, ‘Apprenticeship’, Handbook of the Economics of Education
(eds. Hanushek, E., Machin, S. and Woessmann, L.), Elsevier.
Wong, L. 2020, ‘Fine-dining restaurants turn to takeaway to keep staff employed during
virus lockdown’, ABC News, 4 May.
Woolcott 2017, Drivers of Participation and Completion of VET, Woolcott Research and
Engagement, Sydney.