Embed Size (px)
Citation preview
1
Interim report
September 1, 2012 – February 28, 2013 Second quarter, December 1, 2012 – February 28, 2013
Net sales totaled SEK 702 M (754), down by 6.9 percent.
Write-down of JC-trademark has been made with SEK 260 M.
The operating result amounted to SEK -28 M (-25) excluding write-down of JC-
trademark with SEK 260 M.
The profit before tax amounted to SEK -41 M (-42), excluding write-down of JC-
trademark with SEK 260 M.
Profit after tax amounted to SEK -300 M (-20), corresponding to a profit per
share of SEK -1.81 (-0.12). Profit after tax includes a write-down of JC-
trademark with SEK 203 M.
Cash flow from operating activities amounted to SEK 15 M (37).
Half-Year report, September 1, 2012 – February 28, 2013
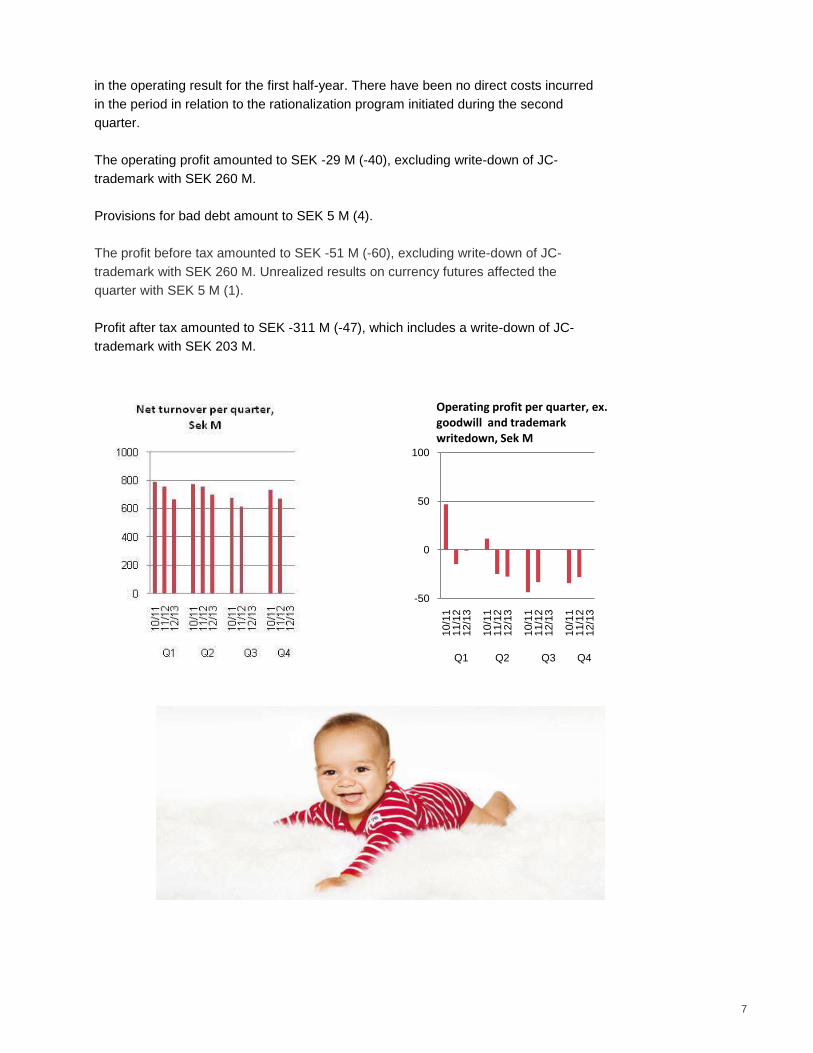
Net sales totaled SEK 1.370 M (1.508), down by 9.2 percent.
Write-down of JC-trademark has been made with SEK 260 M.
The operating profit amounted to SEK -29 M (-40), excluding write-down of JC-
trademark with SEK 260 M.
The profit before tax amounted to SEK -51 M (-60), excluding write-down of JC-
trademark with SEK 260 M.
Profit after tax amounted to SEK -311 M (-47), corresponding to a profit per
share of SEK -1.88 (-0.28). Profit after tax includes a write-down of JC-
trademark with SEK 203 M.
Cash flow from operating activities amounted to SEK -41 M (21).
2
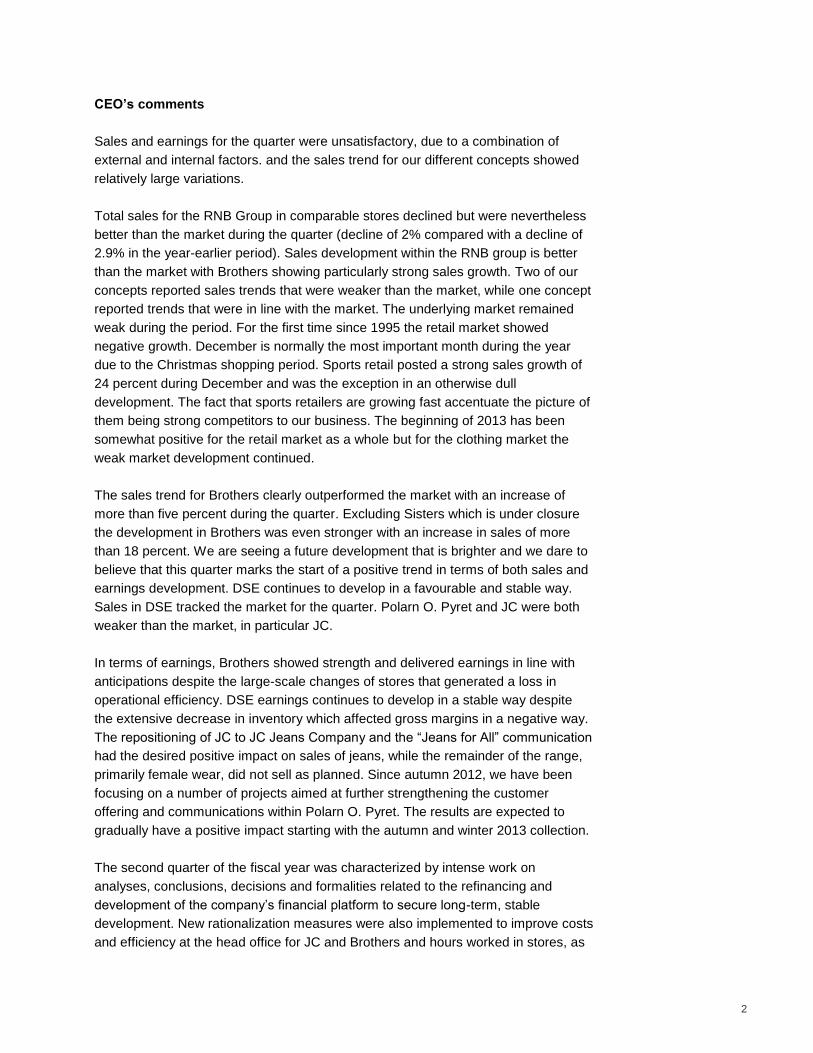
CEO’s comments
Sales and earnings for the quarter were unsatisfactory, due to a combination of
external and internal factors. and the sales trend for our different concepts showed
relatively large variations.
Total sales for the RNB Group in comparable stores declined but were nevertheless
better than the market during the quarter (decline of 2% compared with a decline of
2.9% in the year-earlier period). Sales development within the RNB group is better
than the market with Brothers showing particularly strong sales growth. Two of our
concepts reported sales trends that were weaker than the market, while one concept
reported trends that were in line with the market. The underlying market remained
weak during the period. For the first time since 1995 the retail market showed
negative growth. December is normally the most important month during the year
due to the Christmas shopping period. Sports retail posted a strong sales growth of
24 percent during December and was the exception in an otherwise dull
development. The fact that sports retailers are growing fast accentuate the picture of
them being strong competitors to our business. The beginning of 2013 has been
somewhat positive for the retail market as a whole but for the clothing market the
weak market development continued.
The sales trend for Brothers clearly outperformed the market with an increase of
more than five percent during the quarter. Excluding Sisters which is under closure
the development in Brothers was even stronger with an increase in sales of more
than 18 percent. We are seeing a future development that is brighter and we dare to
believe that this quarter marks the start of a positive trend in terms of both sales and
earnings development. DSE continues to develop in a favourable and stable way.
Sales in DSE tracked the market for the quarter. Polarn O. Pyret and JC were both
weaker than the market, in particular JC.
In terms of earnings, Brothers showed strength and delivered earnings in line with
anticipations despite the large-scale changes of stores that generated a loss in
operational efficiency. DSE earnings continues to develop in a stable way despite
the extensive decrease in inventory which affected gross margins in a negative way.
The repositioning of JC to JC Jeans Company and the “Jeans for All” communication
had the desired positive impact on sales of jeans, while the remainder of the range,
primarily female wear, did not sell as planned. Since autumn 2012, we have been
focusing on a number of projects aimed at further strengthening the customer
offering and communications within Polarn O. Pyret. The results are expected to
gradually have a positive impact starting with the autumn and winter 2013 collection.
The second quarter of the fiscal year was characterized by intense work on
analyses, conclusions, decisions and formalities related to the refinancing and
development of the company’s financial platform to secure long-term, stable
development. New rationalization measures were also implemented to improve costs
and efficiency at the head office for JC and Brothers and hours worked in stores, as
3
well as the discontinuation of Sisters and the discontinuation or divestment of Kosta.
Work on the planned strategic review of JC has been initiated.
During the quarter, work continued on earlier communicated strategic initiatives,
such as e-shopping, the cooperation with Medmera and product coordination. We
opened the first Polarn O. Pyret store in the Netherlands on February 22, and the
next store will be opened in April. We have a number of new P O. P stores under
development in Nordby, Ingelsta and Kupolen. The Hermès store at NK has been
undergoing remodeling and expansion and was re-opened, with an expanded retail
area, on March 22.
Ongoing efficiency enhancements launched during the quarter
Work to streamline head office functions for JC and Brothers has been conducted at
a high pace during the winter and a largely new organization has been in place since
March 1. The implementation of the new organization will generate some positive
cost effects for the current fiscal year. The discontinuation of Sisters is progressing
as planned and is expected to be fully implemented by January 31, 2014. The
discontinuation or divestment of Kosta Outlet Mode will be completed by September
30, 2013. As of March, hours worked in stores in all four concepts have been
reduced further to match the weak market trend.
Financial structure
The change in the loan structure announced in the first quarter has now been
implemented but will be replaced by a renegotiated loan, accompanied by a new
share issue. The proceeds from the new share issue will be used to repay part of the
existing loans, and will to a certain extent function as a liquidity buffer to enable
continued development of the DSE operation, to realize the growth potential in
Polarn O. Pyret and to continue the conversion work in Brothers and the streamlining
measures currently in progress. Following implementation of the new financial
structure, interest expense is estimated to be reduced from approximately SEK 65 M
annually to slightly more than SEK 10 M. The sharply reduced interest expense, as
well as the new financial structure, will provide RNB with the conditions that have
long been needed for the company to complete, according to plan, the change and
development work on the operations included in the Group.
Forecast
During 2013, we will continue to focus on increasing sales efficiency and developing
the concept to generate new revenue. Work to streamline our business through the
actions described above will also continue to be a focus for RNB.
We will continue to concentrate on the international expansion of PO.P where the
opening of our first store in the Netherlands was the first step. Regarding the DSE
business we will continue to develop this according to our plan. The expansion and
remodeling of the Hermès store is completed and will be the most extensive project
at NK during 2013. The emerging signs of improvement in the Brothers business are
4
energizing the ongoing turn-around work. The strategic overview of JC will require
definite choices during the second half of the year.
As we have already communicated, we expect to establish a stronger financial
platform. Accordingly, I am confident that we will succeed in maintaining a high pace
in the change process and in terms of RNB RETAIL AND BRANDS’ development
and profitability potential prior to the end of the current fiscal year and for the
2013/2014 fiscal year.
Magnus Håkansson
5
Operations
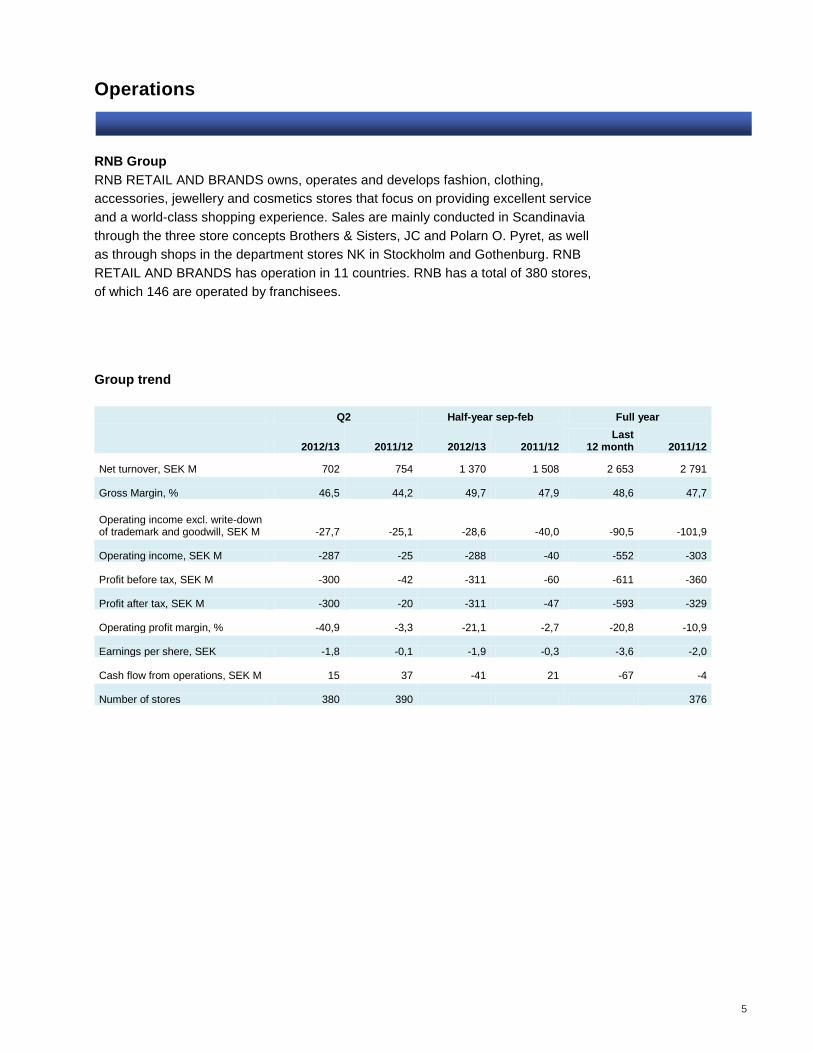
RNB Group
RNB RETAIL AND BRANDS owns, operates and develops fashion, clothing,
accessories, jewellery and cosmetics stores that focus on providing excellent service
and a world-class shopping experience. Sales are mainly conducted in Scandinavia
through the three store concepts Brothers & Sisters, JC and Polarn O. Pyret, as well
as through shops in the department stores NK in Stockholm and Gothenburg. RNB
RETAIL AND BRANDS has operation in 11 countries. RNB has a total of 380 stores,
of which 146 are operated by franchisees.
Group trend
Q2 Half-year sep-feb Full year
2012/13 2011/12 2012/13 2011/12 Last
12 month 2011/12
Net turnover, SEK M 702 754 1 370 1 508 2 653 2 791
Gross Margin, % 46,5 44,2 49,7 47,9 48,6 47,7
Operating income excl. write-down of trademark and goodwill, SEK M -27,7 -25,1 -28,6 -40,0 -90,5 -101,9
Operating income, SEK M -287 -25 -288 -40 -552 -303
Profit before tax, SEK M -300 -42 -311 -60 -611 -360
Profit after tax, SEK M -300 -20 -311 -47 -593 -329
Operating profit margin, % -40,9 -3,3 -21,1 -2,7 -20,8 -10,9
Earnings per shere, SEK -1,8 -0,1 -1,9 -0,3 -3,6 -2,0
Cash flow from operations, SEK M 15 37 -41 21 -67 -4
Number of stores 380 390 376
6
Revenues and earnings
Second quarter, December 1, 2012 – February 28, 2013
RNB´s net sales during the quarter totaled SEK 702 M (754), a decrease with 6.9
percent. In the second quarter of the previous year, sales from the closed down
operations in Norway and Denmark were included by a total of SEK 43 M.
In the previous year’s quarter 2 result, losses from the operations in Norway (JC)
and Denmark (Dept Stores) were included with SEK 22 M.
The operating result in the second quarter has been negatively impacted by the 30
franchise stores taken over during quarter 3 and 4 previous year. Compared to the
second quarter 2011/12, the effect is SEK -13 M.
The gross margin in the quarter was 46.5 percent (44.2).
Costs for the currently ongoing refinancing process of SEK 4 M have been included
in the operating result for the quarter. There have been no direct costs incurred in
the quarter in relation to the rationalization program initiated during the second
quarter.
The operating result amounted to SEK -28 M (-25) excluding write-down of JC-
trademark with SEK 260 M.
Provisions for bad debt amount to SEK 3 M (3).
The profit before tax amounted to SEK -41 M (-42), excluding write-down of JC-
trademark with SEK 260 M. Unrealized results on currency futures affected the
quarter with SEK 2 M (-5).
Profit after tax amounted to SEK -300 M (-20), which includes a write-down of JC-
trademark with SEK 203 M.
Half-Year, September 1, 2012 – February 28, 2013
RNB´s net sales during the period totaled SEK 1.370 M (1.508), a decrease with 9.2
percent In the half-year of the previous year, sales from the now closed down
operations in Norway and Denmark were included by a total of SEK 80 M. Sales in
comparable proprietary stores declined by 4.2 percent during the period.
In the half-year of the previous year the result losses from the operations in Norway
(JC) and Denmark (Dept Stores) were included with SEK -64 M.
The operating result in the first half-year has been negatively impacted by the 30
franchise stores taken over during the second half-year in the previous year.
Compared to the first half-year 2011/12, the effect is SEK -20 M.
The gross margin in the quarter was 49.7 percent (47.9).
Costs for the currently ongoing refinancing process of SEK 4 M have been included
7
in the operating result for the first half-year. There have been no direct costs incurred
in the period in relation to the rationalization program initiated during the second
quarter.
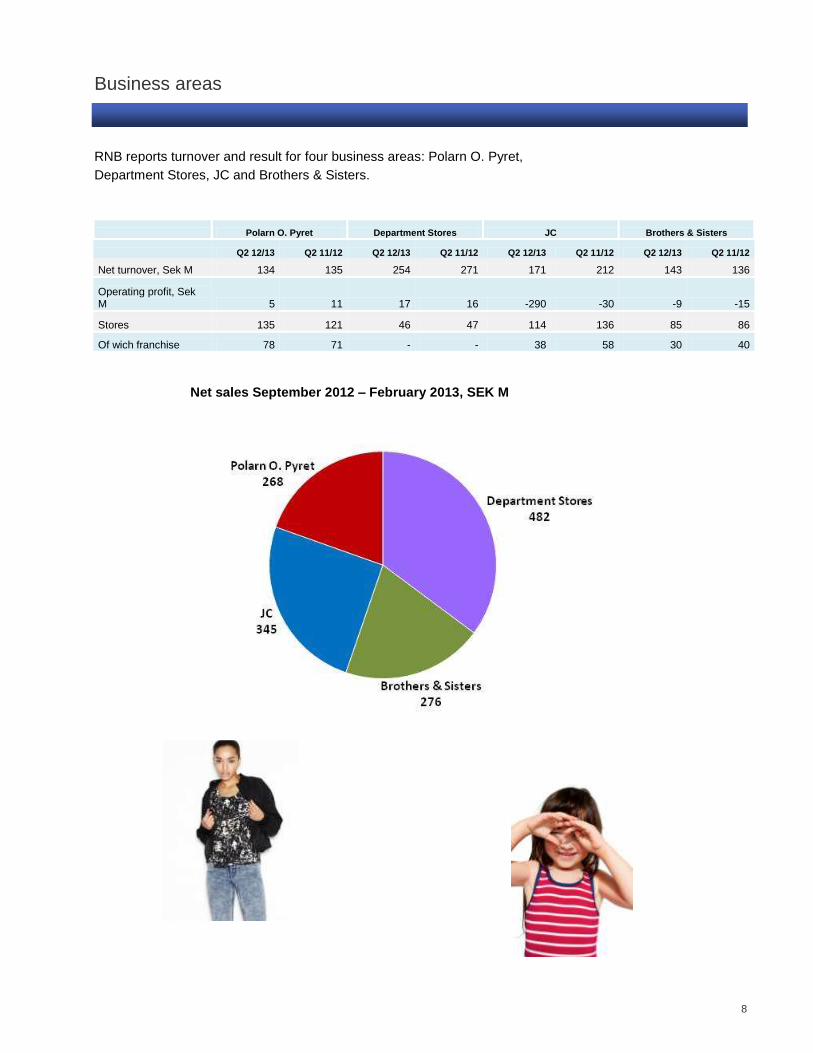
The operating profit amounted to SEK -29 M (-40), excluding write-down of JC-
trademark with SEK 260 M.
Provisions for bad debt amount to SEK 5 M (4).
The profit before tax amounted to SEK -51 M (-60), excluding write-down of JC-
trademark with SEK 260 M. Unrealized results on currency futures affected the
quarter with SEK 5 M (1).
Profit after tax amounted to SEK -311 M (-47), which includes a write-down of JC-
trademark with SEK 203 M.
-50
0
50
10010/1
111/1
212/1
3
10/1
111/1
212/1
3
10/1
111/1
212/1
3
10/1
111/1
212/1
3
Q1 Q2 Q3 Q4
Operating profit per quarter, ex. goodwill and trademarkwritedown, Sek M
8
Business areas
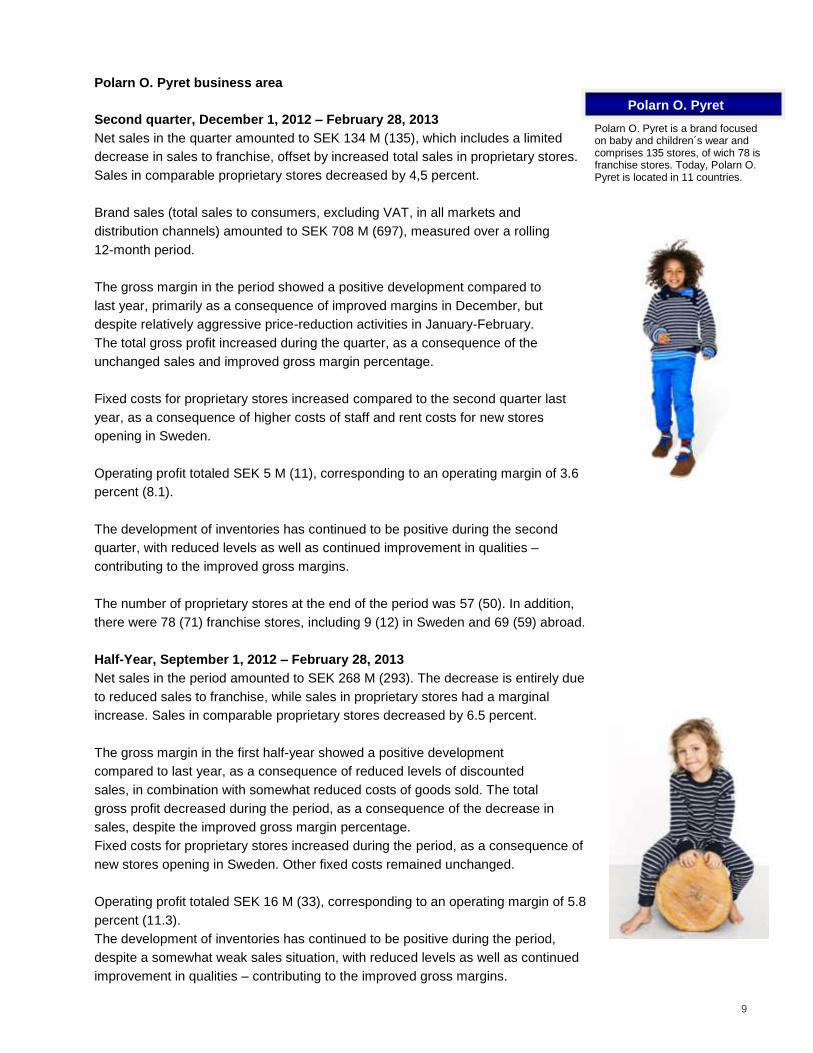
RNB reports turnover and result for four business areas: Polarn O. Pyret,
Department Stores, JC and Brothers & Sisters.
Polarn O. Pyret Department Stores JC Brothers & Sisters
Q2 12/13 Q2 11/12 Q2 12/13 Q2 11/12 Q2 12/13 Q2 11/12 Q2 12/13 Q2 11/12
Net turnover, Sek M 134 135 254 271 171 212 143 136
Operating profit, Sek M 5 11 17 16 -290 -30 -9 -15
Stores 135 121 46 47 114 136 85 86
Of wich franchise 78 71 - - 38 58 30 40
Net sales September 2012 – February 2013, SEK M
…
9
Polarn O. Pyret business area
Second quarter, December 1, 2012 – February 28, 2013
Net sales in the quarter amounted to SEK 134 M (135), which includes a limited
decrease in sales to franchise, offset by increased total sales in proprietary stores.
Sales in comparable proprietary stores decreased by 4,5 percent.
Brand sales (total sales to consumers, excluding VAT, in all markets and
distribution channels) amounted to SEK 708 M (697), measured over a rolling
12-month period.
The gross margin in the period showed a positive development compared to
last year, primarily as a consequence of improved margins in December, but
despite relatively aggressive price-reduction activities in January-February.
The total gross profit increased during the quarter, as a consequence of the
unchanged sales and improved gross margin percentage.
Fixed costs for proprietary stores increased compared to the second quarter last
year, as a consequence of higher costs of staff and rent costs for new stores
opening in Sweden.
Operating profit totaled SEK 5 M (11), corresponding to an operating margin of 3.6
percent (8.1).
The development of inventories has continued to be positive during the second
quarter, with reduced levels as well as continued improvement in qualities –
contributing to the improved gross margins.
The number of proprietary stores at the end of the period was 57 (50). In addition,
there were 78 (71) franchise stores, including 9 (12) in Sweden and 69 (59) abroad.
Half-Year, September 1, 2012 – February 28, 2013
Net sales in the period amounted to SEK 268 M (293). The decrease is entirely due
to reduced sales to franchise, while sales in proprietary stores had a marginal
increase. Sales in comparable proprietary stores decreased by 6.5 percent.
The gross margin in the first half-year showed a positive development
compared to last year, as a consequence of reduced levels of discounted
sales, in combination with somewhat reduced costs of goods sold. The total
gross profit decreased during the period, as a consequence of the decrease in
sales, despite the improved gross margin percentage.
Fixed costs for proprietary stores increased during the period, as a consequence of
new stores opening in Sweden. Other fixed costs remained unchanged.
Operating profit totaled SEK 16 M (33), corresponding to an operating margin of 5.8
percent (11.3).
The development of inventories has continued to be positive during the period,
despite a somewhat weak sales situation, with reduced levels as well as continued
improvement in qualities – contributing to the improved gross margins.
Polarn O. Pyret
Polarn O. Pyret is a brand focused on baby and children´s wear and comprises 135 stores, of wich 78 is franchise stores. Today, Polarn O. Pyret is located in 11 countries.
10
Department Stores business area
Second quarter, December 1, 2012 – February 28, 2013
Net sales in the Department Stores business area amounted to SEK 254 M (271),
down 6.2 percent. In the corresponding quarter last year sales from the now
discontinued Danish operation was included with SEK 9 M. Sales in comparable
proprietary stores decreased 2.9 percent.
The gross margin in the period decreased compared to last year, primarily due to
price-reduction activities in order to reduce inventory levels in this quarter.
Fixed costs in Sweden, for stores as well as central head office functions, remained
unchanged compared to last year.
Operating profit totaled SEK 17 M (16). Eliminating the impact on results in the
second quarter last year from the discontinued Danish operation of SEK 6 M, the
operating profit fell by SEK 5 M.
Inventory levels in the Department Stores business area developed positively in the
quarter, with a reduced total level as well as a continued positive development of the
aging structure.
Half-Year, September 1, 2012 – February 28, 2013
Net sales in the Department Stores business area amounted to SEK 482 M (526),
down 8.3 percent. In the corresponding the period last year sales from the now
discontinued Danish operation was included with SEK 37 M. Sales in comparable
proprietary stores decreased 2.8 percent.
The gross margin in the period remained in principle unchanged compared to last
year, with a marginal decrease due to slightly more aggressive price-reduction
activities in this half-year, as a consequence from continued focus on reductions in
inventories..
Fixed costs in Sweden, for stores as well as central head office functions
decreased by SEK 2 M from last year.
Operating profit totaled SEK 36 M (30). Out of the improved profit, SEK 6 M was
generated from last years inclusion in the half-year result of the operation at Illum,
Denmark – this business was discontinued in January, 2012.
Inventory levels in the Department Stores business area developed positively in the
quarter, with a reduced total level as well as a continued positive development of the
aging structure.
Department Stores
The business area comprises operations
at the department stores NK Stockholm,
NK Gothenburg and Kosta Outlet. The
number of proprietary stores at the end
of the period, was 46 (47) with a total
retail area of 17 113 square meters
(16 818).
11
JC business area
Second quarter, December 1, 2012 – February 28, 2013
Net sales for JC amounted to SEK 171 M (212), a reduction of -19.5 percent. Out of
the decrease, SEK 34 M, related to the closed down business Norway. Sales in
comparable proprietary stores decreased 11.2 percent.
Brand sales (total sales to consumers excluding VAT in all markets and in all
distribution channels) measured on a rolling 12-month basis amounted to SEK 838
M (1.030).
Gross margin in the period developed positively compared to the second quarter in
the previous accounting year, primarily as a consequence of the discontinuation of
the Norwegian business. The gross margin for the other businesses remained stable
versus last year. However, the decreased sales volumes generated a drop in gross
profits for the quarter.
Fixed costs for the business area increased versus the second quarter last year
(excl. Norway), almost entirely relating to new proprietary stores (newly opened and
taken over from franchisees). Fixed costs for like-for-like stores as well as central
head office functions have decreased in the quarter compared to last year.
Operating profit in JC amounts to SEK -30 M (-30) excluding write-down of JC-
trademark with SEK 260 M.
Inventories levels have remained stable, with improved aging structures.
Half-Year, September 1, 2012 – February 28, 2013
Net sales for JC amounted to SEK 345 M (414), down -16.6 percent. Out of the
decrease SEK 58 M, related to the closed down business Norway. Sales in
comparable proprietary stores decreased 8.5 percent.
Gross margin in the period developed positively compared to the first half-year in
the previous accounting year for the franchise business, while margins in proprietary
stores remained largely unchanged. The decreased sales volumes generated a drop
in gross profits compared to last year.
Fixed costs for the business area increased versus the first half-year last year (excl.
Norway), almost entirely relating to new proprietary stores (newly opened and taken
over from franchisees). Fixed costs for like-for-like stores increased marginally, while
costs for central head office functions have mainly remained stable in the quarter.
Operating profit in JC amounts to SEK -50 M (-75), excluding write-down of JC-
trademark with SEK 260 M.
Inventories levels have remained stable in the first half-year, with continued
improvements in aging structures.
JC
The business area has a total of 114 (136) stores, of which 38 (58) are operated by franchisees.
12
Brothers & Sisters business area
Second quarter, December 1, 2012 – February 28, 2013
Net sales for Brothers & Sisters totaled SEK 143 M (136), up 5.3
percent. Sales in comparable proprietary stores increased 5.1 percent.
Net sales for Brothers continued to increase, and amounted to SEK 122 M (103),
equal to an increase of 18.1 percent.
The increase in sales is generated from like-for-like stores (+11.2 percent) as well as
new stores, while sales to franchisees decrease.
Net sales for Sisters decreased, according to plan, to SEK 21 M (33) as a
consequence from reduced sales areas and the discontinuation of the internal
product range. This represents a reduction of 35.2 percent.
Brand sales (total sales to consumers excluding VAT in all markets and in all
distribution channels) measured on a rolling 12-month basis amounted to
SEK 647 M (691).
The total gross margin for the business area has increased compared to the same
quarter last year, due to a positive development for Brothers in proprietary stores as
well as for franchise sales, while the gross margin for Sisters decreased, mainly due
to the phasing out of the internal product range.
Increases in fixed costs for new proprietary stores have been covered by gross
profits from the added sales volumes. Fixed costs in like-for-like stores and closed
down stores as well as head office functions have decreased compared to last year.
Operating profit for Brothers & Sisters totaled SEK -9 M (-15).
The quality, as well as the level, of inventories has continued to develop well, with a
certain increase in the quarter.
Half-Year, September 1, 2012 – February 28, 2013
Net sales for Brothers & Sisters totaled SEK 276 M (282), down 2.4
percent. Sales in comparable proprietary stores declined 0.4 percent.
Net sales for Brothers continued to increase, and amounted to SEK 235 M (213),
equal to an increase of 10.5 percent.
The increase in sales is generated from like-for-like stores (+6.9 percent) as well as
new stores, while sales to franchisees decrease.
Net sales for Sisters decreased, according to plan, to SEK 40 M (69) as a
consequence from reduced sales areas and the discontinuation of the internal
product range. This represents a reduction of 41.9 percent.
The gross margin for the business area has increase compared to the first half year
2011/12, leading to an increase in gross profits.
Increases in fixed costs for new proprietary stores have been covered by gross
profits from the added sales volumes. Fixed costs in like-for-like stores and for the
franchise business increased slightly, while head office costs have decreased, and
Brothers & Sisters
The business area has a total of 85 (86) stores, of which 30 (40) are operated by franchisees.
13
additionally, cost reductions have followed from the closing down of some stores in
the first half year.
Operating profit for Brothers & Sisters totaled SEK -15 M (-9).
The quality, as well as the level, of inventories has continued to develop well, with a
certain increase in the first half year, primarily from non-seasonal products.
Financial position and liquidity The Group had total assets of SEK 1 475 M compared with SEK 1 802 M at the end
of the prior fiscal year. Shareholders’ equity amounted to SEK 317 M (911), resulting
in an equity/assets ratio of 21.5 percent (46.3).
At February 28, 2013, inventories totaled SEK 464 M compared with SEK 451 M a
year earlier.
Cash flow from operating activities was SEK -41 M (21). Working capital has been
positively impacted by a decrease in inventory levels, in combination with reduced
receivables, although the effect from decreased liabilities to suppliers in the quarter
generated a net increase in working capital by SEK 10 M (-49). The reported change
in inventory levels in the first half of the previous year were significantly impacted by
discounted sales and write-offs.
Cash flow after investments was SEK -78 M (-30).
Net debt amounted to SEK 673 M compared with SEK 528 M a year earlier.
Consolidated cash and cash equivalents at the close of the interim-report period,
including unutilized overdraft facilities, amounted to SEK 51 M compared with SEK
146 M at the end of the preceding fiscal year.
The Board of Directors of RNB concludes that the available working capital for the
Group is not sufficient to cover the necessary funding for the next 12-month period,
as the required capital exceeds the Groups available short- and long-term funding.
The Group has therefore, in the second quarter, announced a fully guaranteed rights
issue of approx. SEK 450 M. In relation to, and subject to, a successful rights issue,
the Group has renegotiated its long-term funding, covering the period to May 2016
(with a possible prolongation to May 2017).
Investments and depreciation/amortization
Investments during the period totaled SEK 42 M (51). Depreciation/amortization
during the period amounted to SEK 298 M (46), which includes a write-down of the
JC-trademark with SEK 260 M.
Personnel The average number of employees during the period was 1 358 (1 414).
14
Related-party transactions No transactions have taken place between the Group and related parties that have
materially affected the Group's financial position and results.
The Company has two loans from majority shareholder Konsumentföreningen
Stockholm,totaling SEK 585 M at market interest rate and covenant terms.
For further information on transactions with related parties, see Note 4 in the Annual
Report 2011/2012, page 70.
Tax paid During the interim-report period, the Group has paid tax of SEK 3 M (3).
Parent Company
Net sales in the Parent Company amounted to SEK 73 M (72). After net financial
items a loss of SEK -341 M (-39) was reported. Investments during the period totaled
SEK 7 M (23).
Accounting principles
This report was prepared in accordance with IAS 34 Interim Reporting and the
Swedish Annual Accounts Act. The interim report for the Parent Company was
prepared in accordance with the Swedish Annual Accounts Act and the Swedish
Financial Reporting Board’s recommendation RFR 2 - Accounting for Legal Entities.
The accounting policies applied correspond with those stated in the 2010/2011
Annual Report. Press and analyst meeting With reference to the interim report on the second quarter of 2012/2013, RNB will be
holding a press and analyst conference. The conference will be held at the company’s
premises at Regeringsgatan 29 today, March 25, 2013 at 09:30 a.m.
Risks and uncertainties RNB is exposed to a number of risks that are in full or in part beyond the company’s control but which could affect its earnings. Financial risks
- Currency exposure comprising purchases of goods and sales in international markets.
- Interest-rate exposure associated with the Group’s net debt. - Financial covenants to lenders. Strategic and operational risks
- In common with all retailers, the demand for RNB’s products is affected by fluctuations in the general state of the economy. - Competition from other players active in the same segment as RNB. - Identification of constantly shifting fashion trends and consumer preferences.
In other respects, refer to the detailed description of the Group’s management of
financial risks in the 2011/2012 Annual Report.
15
Future publication dates Q3 Interim Report for 2012/2013 27 June, 2013
Year-End Report for 2012/2013 24 October, 2013
The Board of Directors and the President declare that the report provides an accurate
view of the development of the Group’s operations, position and earnings and also
describes significant risks and uncertainties facing the Group and the subsidiaries
including in the Group.
Stockholm, March 25, 2013
RNB RETAIL AND BRANDS AB (publ)
Board of Directors and President, RNB RETAIL AND BRANDS (publ)
Laszlo Kriss Jan Carlzon Ann-Sofie Danielsson
Chairman of the Board
Michael Lemner Mikael Solberg Per Thunell
Ivar Fransson Magnus Håkansson
President and CEO
For further information, please contact: Magnus Håkansson, President, Tel: +46 (0)8-410 520 02, +46 (0)768-87 20 02 Stefan Danieli, CFO, Tel: +46 (0)8-410 522 25, +46 (0)768-87 22 25 This is the type of information that must be published by RNB RETAIL AND BRANDS AB (publ) in accordance with the Swedish Securities Market Act and/or the Financial
Instruments Trading Act. The information was submitted for publishing on March 25, 2013, at 7:00 a.m.
16
Review report RNB RETAIL AND BRANDS AB (publ), org. nr 556495-4682
Introduction We have reviewed the condensed interim report for RNB RETAIL AND BRANDS AB
(publ) as at February 28, 2013 and for the six months period then ended. The Board of
Directors and the Managing Director are responsible for the preparation and presentation of
this interim report in accordance with IAS 34 and the Swedish Annual Accounts Act. Our
responsibility is to express a conclusion on this interim report based on our review.
Scope of review We conducted our review in accordance with the Swedish Standard on Review Engagements,
SÖG 2410 Review of Interim Reports Performed by the Independent Auditor of the Entity. A
review consists of making inquiries, primarily of persons responsible for financial and
accounting matters, and applying analytical and other review procedures. A review is
substantially less in scope than an audit conducted in accordance with International Standards
on Auditing, ISA, and other generally accepted auditing standards in Sweden. The
procedures performed in a review do not enable us to obtain assurance that we would become
aware of all significant matters that might be identified in an audit. Accordingly, we do not
express an audit opinion.
Conclusion Based on our review, nothing has come to our attention that causes us to believe that the
interim report is not prepared, in all material aspects, in accordance with IAS 34 and the
Swedish Annual Accounts Act regarding the Group, and in accordance with the Swedish
Annual Accounts Act regarding the Parent Company.
Emphasis of matter Without qualifying our conclusion we would like to draw attention to the future need for
capital described in the interim financial statements. The Board has according to this called to
an extra general meeting to decide about a new share issue. A material condition to ensure
and finance future operations is that the proposed new share issue is decided by the extra
general meeting.
Stockholm March, 25, 2013
Ernst & Young AB
Johan Eklund
Authorized Public Accountant
17
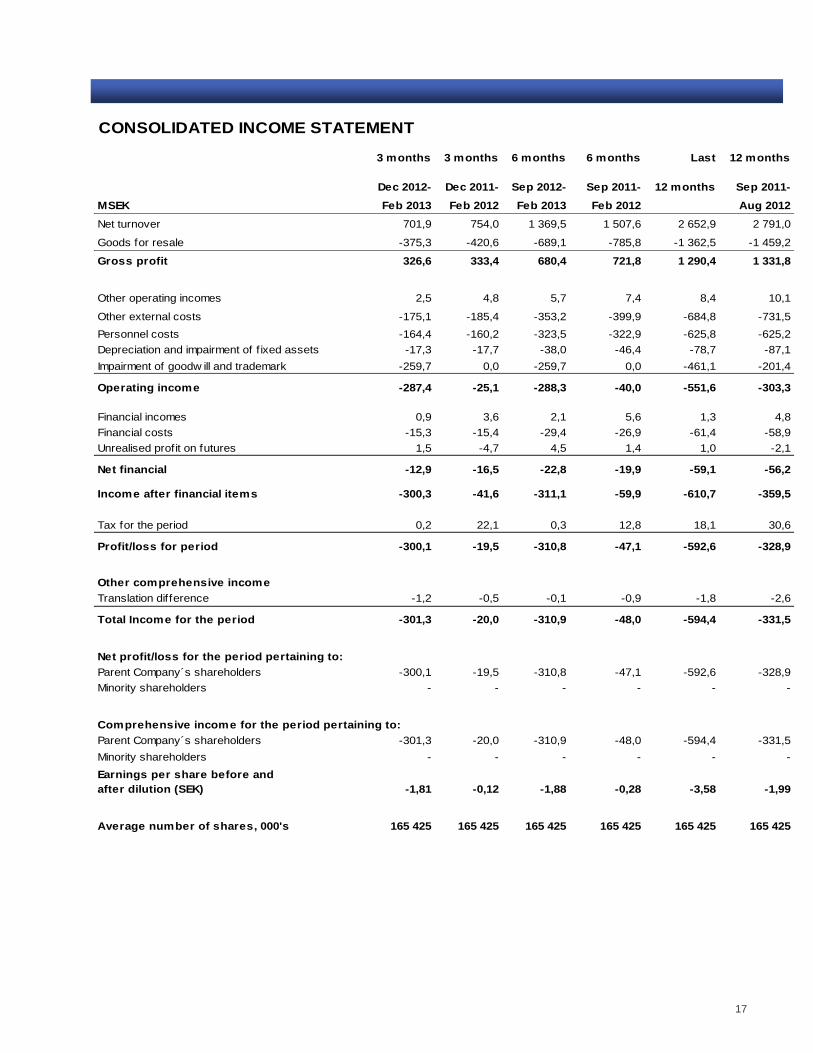
CONSOLIDATED INCOME STATEMENT
3 months 3 months 6 months 6 months Last 12 months
Dec 2012- Dec 2011- Sep 2012- Sep 2011- 12 months Sep 2011-
MSEK Feb 2013 Feb 2012 Feb 2013 Feb 2012 Aug 2012
Net turnover 701,9 754,0 1 369,5 1 507,6 2 652,9 2 791,0
Goods for resale -375,3 -420,6 -689,1 -785,8 -1 362,5 -1 459,2
Gross profit 326,6 333,4 680,4 721,8 1 290,4 1 331,8
Other operating incomes 2,5 4,8 5,7 7,4 8,4 10,1
Other external costs -175,1 -185,4 -353,2 -399,9 -684,8 -731,5
Personnel costs -164,4 -160,2 -323,5 -322,9 -625,8 -625,2
Depreciation and impairment of f ixed assets -17,3 -17,7 -38,0 -46,4 -78,7 -87,1
Impairment of goodw ill and trademark -259,7 0,0 -259,7 0,0 -461,1 -201,4
Operating income -287,4 -25,1 -288,3 -40,0 -551,6 -303,3
Financial incomes 0,9 3,6 2,1 5,6 1,3 4,8
Financial costs -15,3 -15,4 -29,4 -26,9 -61,4 -58,9
Unrealised profit on futures 1,5 -4,7 4,5 1,4 1,0 -2,1
Net financial -12,9 -16,5 -22,8 -19,9 -59,1 -56,2
Income after financial items -300,3 -41,6 -311,1 -59,9 -610,7 -359,5
Tax for the period 0,2 22,1 0,3 12,8 18,1 30,6
Profit/loss for period -300,1 -19,5 -310,8 -47,1 -592,6 -328,9
Other comprehensive income
Translation difference -1,2 -0,5 -0,1 -0,9 -1,8 -2,6
Total Income for the period -301,3 -20,0 -310,9 -48,0 -594,4 -331,5
Net profit/loss for the period pertaining to:
Parent Company´s shareholders -300,1 -19,5 -310,8 -47,1 -592,6 -328,9
Minority shareholders - - - - - -
Comprehensive income for the period pertaining to:
Parent Company´s shareholders -301,3 -20,0 -310,9 -48,0 -594,4 -331,5
Minority shareholders - - - - - -
Earnings per share before and
after dilution (SEK) -1,81 -0,12 -1,88 -0,28 -3,58 -1,99
Average number of shares, 000's 165 425 165 425 165 425 165 425 165 425 165 425
18
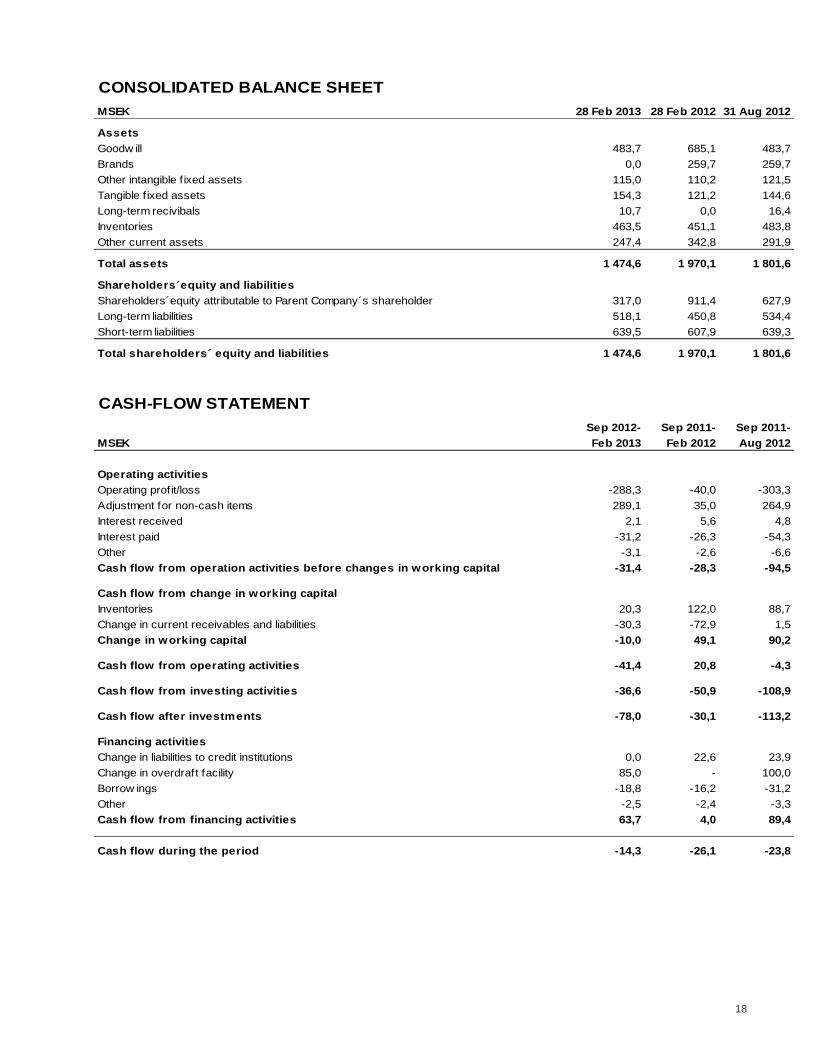
CONSOLIDATED BALANCE SHEET
MSEK 28 Feb 2013 28 Feb 2012 31 Aug 2012
Assets
Goodw ill 483,7 685,1 483,7
Brands 0,0 259,7 259,7
Other intangible f ixed assets 115,0 110,2 121,5
Tangible f ixed assets 154,3 121,2 144,6
Long-term recivibals 10,7 0,0 16,4
Inventories 463,5 451,1 483,8
Other current assets 247,4 342,8 291,9
Total assets 1 474,6 1 970,1 1 801,6
Shareholders´equity and liabilities
Shareholders´equity attributable to Parent Company´s shareholder 317,0 911,4 627,9
Long-term liabilities 518,1 450,8 534,4
Short-term liabilities 639,5 607,9 639,3
Total shareholders´ equity and liabilities 1 474,6 1 970,1 1 801,6
CASH-FLOW STATEMENT
Sep 2012- Sep 2011- Sep 2011-
MSEK Feb 2013 Feb 2012 Aug 2012
Operating activities
Operating profit/loss -288,3 -40,0 -303,3
Adjustment for non-cash items 289,1 35,0 264,9
Interest received 2,1 5,6 4,8
Interest paid -31,2 -26,3 -54,3
Other -3,1 -2,6 -6,6
Cash flow from operation activities before changes in working capital -31,4 -28,3 -94,5
Cash flow from change in working capital
Inventories 20,3 122,0 88,7
Change in current receivables and liabilities -30,3 -72,9 1,5
Change in working capital -10,0 49,1 90,2
Cash flow from operating activities -41,4 20,8 -4,3
Cash flow from investing activities -36,6 -50,9 -108,9
Cash flow after investments -78,0 -30,1 -113,2
Financing activities
Change in liabilities to credit institutions 0,0 22,6 23,9
Change in overdraft facility 85,0 - 100,0
Borrow ings -18,8 -16,2 -31,2
Other -2,5 -2,4 -3,3
Cash flow from financing activities 63,7 4,0 89,4
Cash flow during the period -14,3 -26,1 -23,8
19
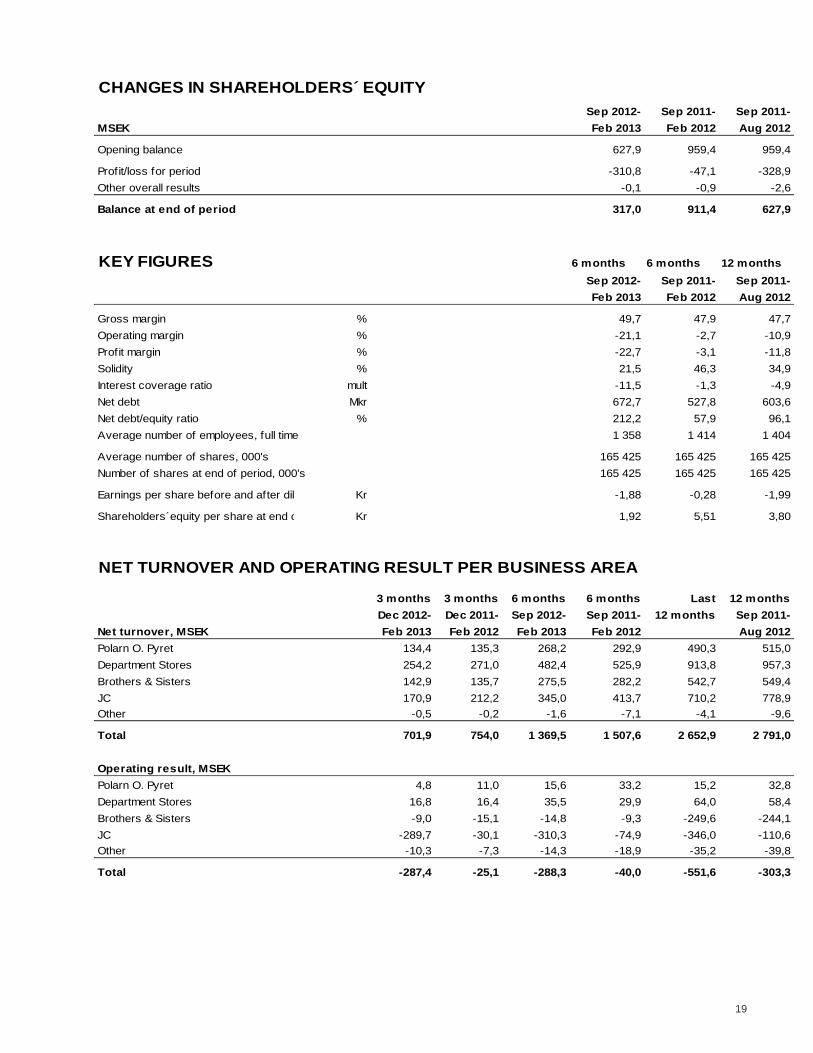
CHANGES IN SHAREHOLDERS´ EQUITY
Sep 2012- Sep 2011- Sep 2011-
MSEK Feb 2013 Feb 2012 Aug 2012
Opening balance 627,9 959,4 959,4
Profit/loss for period -310,8 -47,1 -328,9
Other overall results -0,1 -0,9 -2,6
Balance at end of period 317,0 911,4 627,9
KEY FIGURES 6 months 6 months 12 months
Sep 2012- Sep 2011- Sep 2011-
Feb 2013 Feb 2012 Aug 2012
Gross margin % 49,7 47,9 47,7
Operating margin % -21,1 -2,7 -10,9
Profit margin % -22,7 -3,1 -11,8
Solidity % 21,5 46,3 34,9
Interest coverage ratio mult -11,5 -1,3 -4,9
Net debt Mkr 672,7 527,8 603,6
Net debt/equity ratio % 212,2 57,9 96,1
Average number of employees, full time 1 358 1 414 1 404
Average number of shares, 000's 165 425 165 425 165 425
Number of shares at end of period, 000's 165 425 165 425 165 425
Earnings per share before and after dilution (SEK) Kr -1,88 -0,28 -1,99
Shareholders´equity per share at end of period Kr 1,92 5,51 3,80
NET TURNOVER AND OPERATING RESULT PER BUSINESS AREA
3 months 3 months 6 months 6 months Last 12 months
Dec 2012- Dec 2011- Sep 2012- Sep 2011- 12 months Sep 2011-
Net turnover, MSEK Feb 2013 Feb 2012 Feb 2013 Feb 2012 Aug 2012
Polarn O. Pyret 134,4 135,3 268,2 292,9 490,3 515,0
Department Stores 254,2 271,0 482,4 525,9 913,8 957,3
Brothers & Sisters 142,9 135,7 275,5 282,2 542,7 549,4
JC 170,9 212,2 345,0 413,7 710,2 778,9
Other -0,5 -0,2 -1,6 -7,1 -4,1 -9,6
Total 701,9 754,0 1 369,5 1 507,6 2 652,9 2 791,0
Operating result, MSEK
Polarn O. Pyret 4,8 11,0 15,6 33,2 15,2 32,8
Department Stores 16,8 16,4 35,5 29,9 64,0 58,4
Brothers & Sisters -9,0 -15,1 -14,8 -9,3 -249,6 -244,1
JC -289,7 -30,1 -310,3 -74,9 -346,0 -110,6
Other -10,3 -7,3 -14,3 -18,9 -35,2 -39,8
Total -287,4 -25,1 -288,3 -40,0 -551,6 -303,3
20
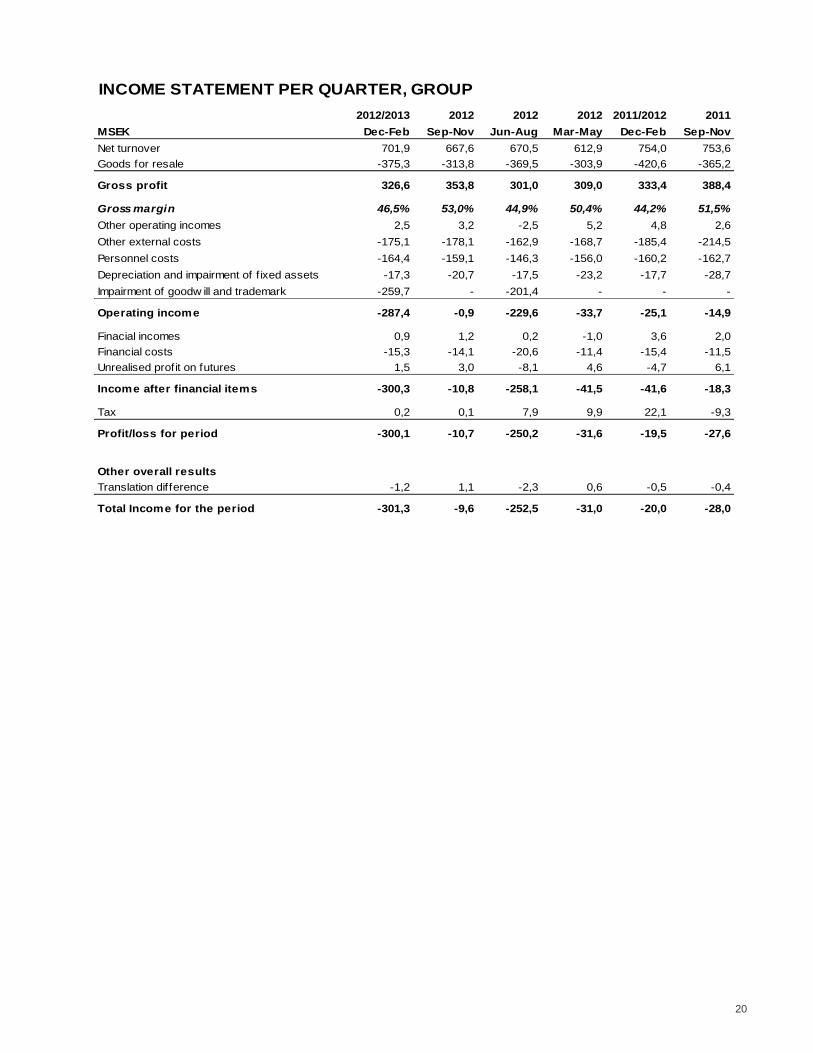
INCOME STATEMENT PER QUARTER, GROUP
2012/2013 2012 2012 2012 2011/2012 2011
MSEK Dec-Feb Sep-Nov Jun-Aug Mar-May Dec-Feb Sep-Nov
Net turnover 701,9 667,6 670,5 612,9 754,0 753,6
Goods for resale -375,3 -313,8 -369,5 -303,9 -420,6 -365,2
Gross profit 326,6 353,8 301,0 309,0 333,4 388,4
Gross margin 46,5% 53,0% 44,9% 50,4% 44,2% 51,5%
Other operating incomes 2,5 3,2 -2,5 5,2 4,8 2,6
Other external costs -175,1 -178,1 -162,9 -168,7 -185,4 -214,5
Personnel costs -164,4 -159,1 -146,3 -156,0 -160,2 -162,7
Depreciation and impairment of f ixed assets -17,3 -20,7 -17,5 -23,2 -17,7 -28,7
Impairment of goodw ill and trademark -259,7 - -201,4 - - -
Operating income -287,4 -0,9 -229,6 -33,7 -25,1 -14,9
Finacial incomes 0,9 1,2 0,2 -1,0 3,6 2,0
Financial costs -15,3 -14,1 -20,6 -11,4 -15,4 -11,5
Unrealised profit on futures 1,5 3,0 -8,1 4,6 -4,7 6,1
Income after financial items -300,3 -10,8 -258,1 -41,5 -41,6 -18,3
Tax 0,2 0,1 7,9 9,9 22,1 -9,3
Profit/loss for period -300,1 -10,7 -250,2 -31,6 -19,5 -27,6
Other overall results
Translation difference -1,2 1,1 -2,3 0,6 -0,5 -0,4
Total Income for the period -301,3 -9,6 -252,5 -31,0 -20,0 -28,0
21
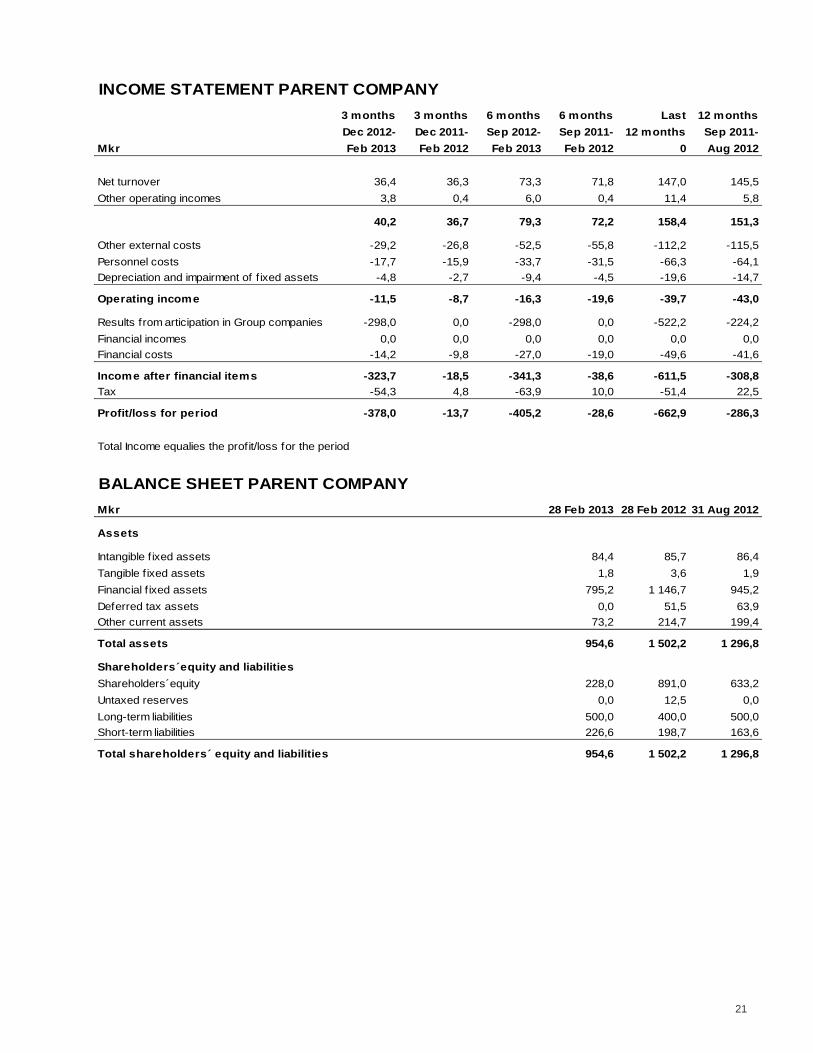
INCOME STATEMENT PARENT COMPANY
3 months 3 months 6 months 6 months Last 12 months
Dec 2012- Dec 2011- Sep 2012- Sep 2011- 12 months Sep 2011-
Mkr Feb 2013 Feb 2012 Feb 2013 Feb 2012 0 Aug 2012
Net turnover 36,4 36,3 73,3 71,8 147,0 145,5
Other operating incomes 3,8 0,4 6,0 0,4 11,4 5,8
40,2 36,7 79,3 72,2 158,4 151,3
Other external costs -29,2 -26,8 -52,5 -55,8 -112,2 -115,5
Personnel costs -17,7 -15,9 -33,7 -31,5 -66,3 -64,1
Depreciation and impairment of f ixed assets -4,8 -2,7 -9,4 -4,5 -19,6 -14,7
Operating income -11,5 -8,7 -16,3 -19,6 -39,7 -43,0
Results from articipation in Group companies -298,0 0,0 -298,0 0,0 -522,2 -224,2
Financial incomes 0,0 0,0 0,0 0,0 0,0 0,0
Financial costs -14,2 -9,8 -27,0 -19,0 -49,6 -41,6
Income after financial items -323,7 -18,5 -341,3 -38,6 -611,5 -308,8
Tax -54,3 4,8 -63,9 10,0 -51,4 22,5
Profit/loss for period -378,0 -13,7 -405,2 -28,6 -662,9 -286,3
Total Income equalies the profit/loss for the period
BALANCE SHEET PARENT COMPANY
Mkr 28 Feb 2013 28 Feb 2012 31 Aug 2012
Assets
Intangible f ixed assets 84,4 85,7 86,4
Tangible f ixed assets 1,8 3,6 1,9
Financial f ixed assets 795,2 1 146,7 945,2
Deferred tax assets 0,0 51,5 63,9
Other current assets 73,2 214,7 199,4
Total assets 954,6 1 502,2 1 296,8
Shareholders´equity and liabilities
Shareholders´equity 228,0 891,0 633,2
Untaxed reserves 0,0 12,5 0,0
Long-term liabilities 500,0 400,0 500,0
Short-term liabilities 226,6 198,7 163,6
Total shareholders´ equity and liabilities 954,6 1 502,2 1 296,8
22
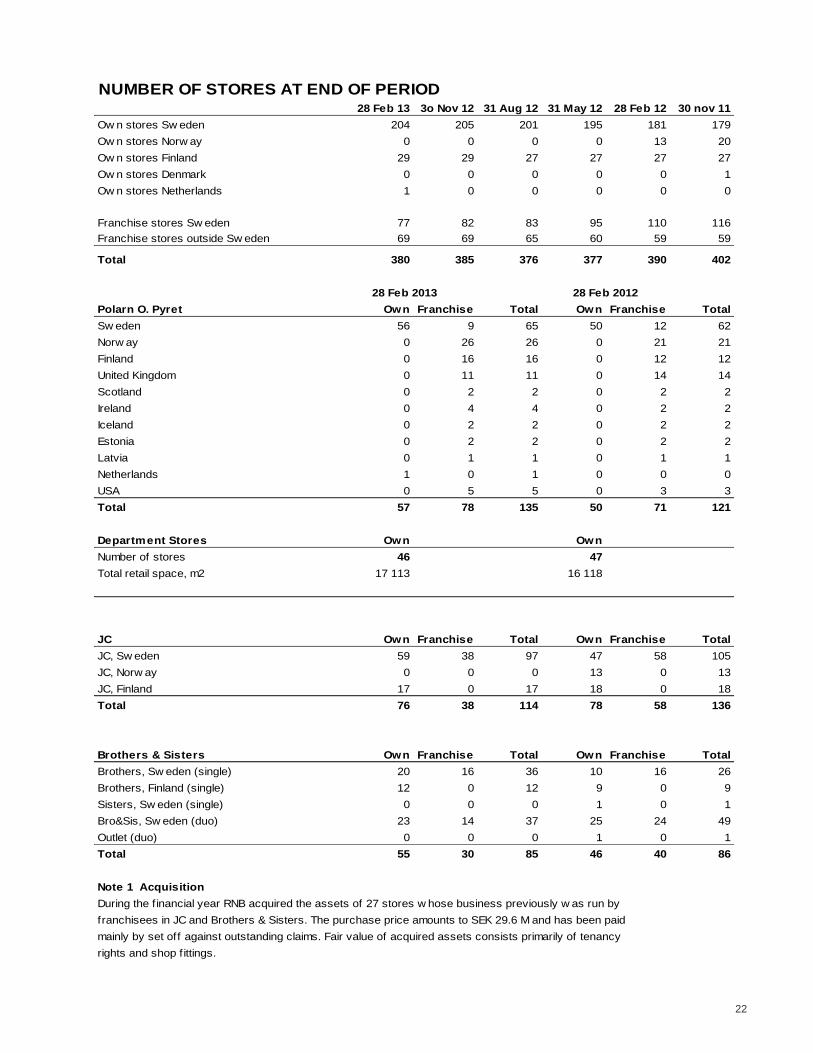
NUMBER OF STORES AT END OF PERIOD 28 Feb 13 3o Nov 12 31 Aug 12 31 May 12 28 Feb 12 30 nov 11
Ow n stores Sw eden 204 205 201 195 181 179
Ow n stores Norw ay 0 0 0 0 13 20
Ow n stores Finland 29 29 27 27 27 27
Ow n stores Denmark 0 0 0 0 0 1
Ow n stores Netherlands 1 0 0 0 0 0
Franchise stores Sw eden 77 82 83 95 110 116
Franchise stores outside Sw eden 69 69 65 60 59 59
Total 380 385 376 377 390 402
Polarn O. Pyret Own Franchise Total Own Franchise Total
Sw eden 56 9 65 50 12 62
Norw ay 0 26 26 0 21 21
Finland 0 16 16 0 12 12
United Kingdom 0 11 11 0 14 14
Scotland 0 2 2 0 2 2
Ireland 0 4 4 0 2 2
Iceland 0 2 2 0 2 2
Estonia 0 2 2 0 2 2
Latvia 0 1 1 0 1 1
Netherlands 1 0 1 0 0 0
USA 0 5 5 0 3 3
Total 57 78 135 50 71 121
Department Stores Own Own
Number of stores 46 47
Total retail space, m2 17 113 16 118
JC Own Franchise Total Own Franchise Total
JC, Sw eden 59 38 97 47 58 105
JC, Norw ay 0 0 0 13 0 13
JC, Finland 17 0 17 18 0 18
Total 76 38 114 78 58 136
Brothers & Sisters Own Franchise Total Own Franchise Total
Brothers, Sw eden (single) 20 16 36 10 16 26
Brothers, Finland (single) 12 0 12 9 0 9
Sisters, Sw eden (single) 0 0 0 1 0 1
Bro&Sis, Sw eden (duo) 23 14 37 25 24 49
Outlet (duo) 0 0 0 1 0 1
Total 55 30 85 46 40 86
Note 1 Acquisition
During the f inancial year RNB acquired the assets of 27 stores w hose business previously w as run by
franchisees in JC and Brothers & Sisters. The purchase price amounts to SEK 29.6 M and has been paid
mainly by set off against outstanding claims. Fair value of acquired assets consists primarily of tenancy
rights and shop f ittings.
28 Feb 2013 28 Feb 2012

23
P.O. Box 161 42, Regeringsgatan 29
S-103 23 Stockholm, Sweden
Phone +46-8-410 520 00. Fax +46-8-410 522 90
VAT 556495-4682
www.rnb.se
Postadress:
Box 161 42
103 23 Stockholm
Besöksadress:
Regeringsgatan 29, 9 tr
Stockholm
www.rnb.se