Embed Size (px)
Citation preview

Interim Report 2019-01-01 – 2019-09-30
Safeture AB (publ) 556776-4674

2
Contents
Summary of Interim Report Significant events during Q3 Message from the CEO: Magnus Hultman About Safeture AB Development in figures during Q3 2019 Other information GROUP Summary of income statement Summary of financial position Summary of cash-flow Summary of changes in equity PARENT COMPANY Summary of income statement Summary of financial position Summary of cash-flow Summary of changes in equity
3 4 5
6 8
10
11 13
13 14
15 16 16 17
3
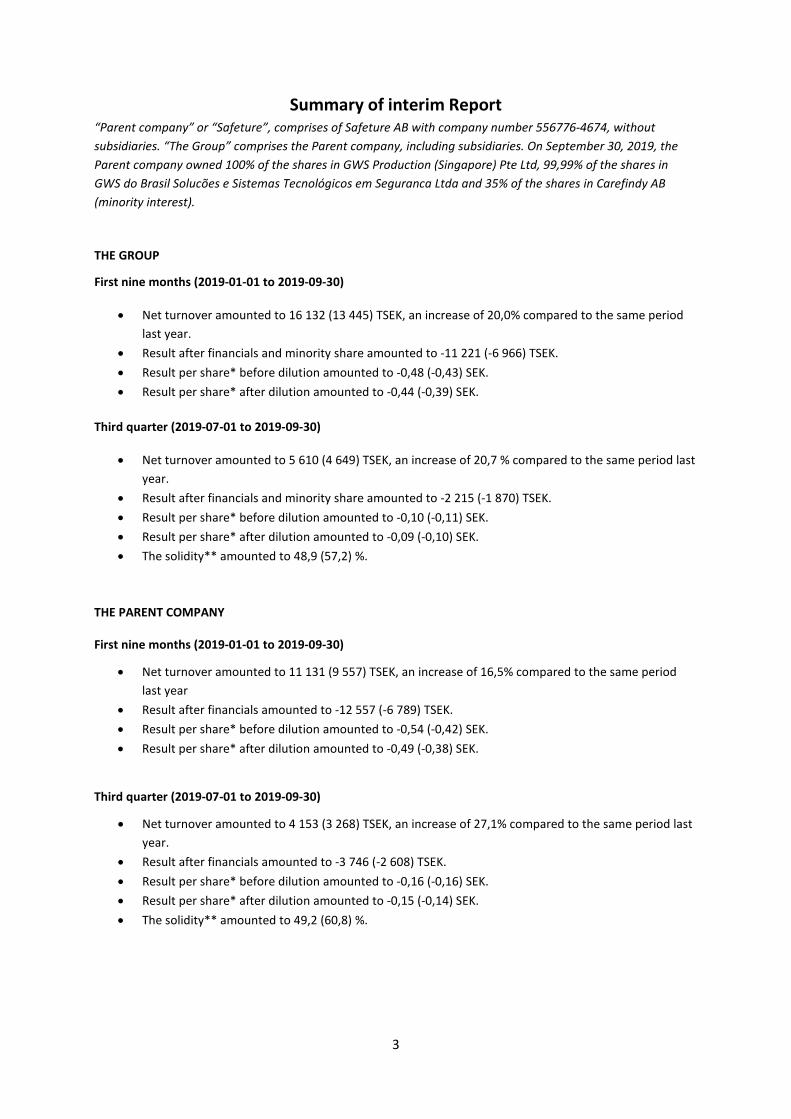
Summary of interim Report “Parent company” or “Safeture”, comprises of Safeture AB with company number 556776-4674, without subsidiaries. “The Group” comprises the Parent company, including subsidiaries. On September 30, 2019, the Parent company owned 100% of the shares in GWS Production (Singapore) Pte Ltd, 99,99% of the shares in GWS do Brasil Solucões e Sistemas Tecnológicos em Seguranca Ltda and 35% of the shares in Carefindy AB (minority interest).
THE GROUP
First nine months (2019-01-01 to 2019-09-30)
• Net turnover amounted to 16 132 (13 445) TSEK, an increase of 20,0% compared to the same period last year.
• Result after financials and minority share amounted to -11 221 (-6 966) TSEK. • Result per share* before dilution amounted to -0,48 (-0,43) SEK. • Result per share* after dilution amounted to -0,44 (-0,39) SEK.
Third quarter (2019-07-01 to 2019-09-30)
• Net turnover amounted to 5 610 (4 649) TSEK, an increase of 20,7 % compared to the same period last year.
• Result after financials and minority share amounted to -2 215 (-1 870) TSEK. • Result per share* before dilution amounted to -0,10 (-0,11) SEK. • Result per share* after dilution amounted to -0,09 (-0,10) SEK. • The solidity** amounted to 48,9 (57,2) %.
THE PARENT COMPANY
First nine months (2019-01-01 to 2019-09-30)
• Net turnover amounted to 11 131 (9 557) TSEK, an increase of 16,5% compared to the same period last year
• Result after financials amounted to -12 557 (-6 789) TSEK. • Result per share* before dilution amounted to -0,54 (-0,42) SEK. • Result per share* after dilution amounted to -0,49 (-0,38) SEK.
Third quarter (2019-07-01 to 2019-09-30)
• Net turnover amounted to 4 153 (3 268) TSEK, an increase of 27,1% compared to the same period last year.
• Result after financials amounted to -3 746 (-2 608) TSEK. • Result per share* before dilution amounted to -0,16 (-0,16) SEK. • Result per share* after dilution amounted to -0,15 (-0,14) SEK. • The solidity** amounted to 49,2 (60,8) %.

4
Amounts within brackets regard the corresponding period last year.
*Result per share: The result is divided by the average number of shares (after dilution includes average number of share options). Total number of shares on September 30, 2019: 23 193 737 (16 556 569) shares. Average number of shares for the third quarter 2019: 23 193 737 (16 556 569). Total number of shares in Safeture on December 31, 2018: 23 193 737 (15 945 407) shares. The Company has issued 40 000 share options (2015/2019), all signed for, which could be converted into the same number of shares from July 8th, 2019 to July 24th, 2019. It should be noted that these share options were not converted in July, 2019. The Company has also issued 670 000 share options (2016/2020), of which 670 000 has been signed for, which can be converted into the same number of shares in the Company during April 2020. The Company has furthermore issued 794 000 share options (2018/2021) which can be converted into the same amount of shares from December 13th, 2021 to December 17th, 2021. Finally the company has issued 1 070 880 share options (2019/2022) which can be converted into the same amount of shares from July 18th 2022 to July 29th 2022.
**Solidity: Equity divided by total assets.
Significant events during the third quarter, 2019.
• On July 17, an extraordinary shareholder meeting decided on a directed issue of share options to employees, key personnel and the board of directors. More information about the decision can be found in a press release from July 17 on the company´s web site
• Safeture and Fire Design Resiliens AB announce a cooperation in the area of risk- and crisis management.
• In July, the CHUBB travel safety solution, developed by Safeture, won the Stevie Silver award in Vienna. The jury appraised the application as “very informative, and a great tool for companies who wants to protect their employees when travelling”.
• On September 20, an extraordinary shareholder meeting decided to sell Travelogix Ltd, a UK-based travel software company. The transaction is part of the plan to direct future investments to the core enterprise offering. More information about the decision can be found in a press release from September 20 on the company’s web site.
• Safeture signs an agreement with Falck Global Assistance in Finland to develop a new medical focused version of the Safeture Pro app.
Significant events after the third quarter.
• On October 8, Adma Förvaltnings AB acquire additionally 1,2 million shares in Safeture AB. The investment entail that Adma Förvalnings AB controls 35,1% of the shares. A take-over offer of 10 SEK/share to the remainder of the share holders was announced on October 25 and is valid until November 25.

5
Message from the CEO Magnus Hultman After my first four months and completing our third quarter, I am strengthened in my conviction that Safeture is a tech company with a tremendous future. Our Saas (Software as a Service) open platform called Safeture is at the heart of employee security and safety, and companies are increasingly recognizing just how critical it is to protect their employees regardless of where they are. Companies invest a lot of money protecting their employees at the office – from surveillance cameras and security guards to access control and badges. But more and more employees are out of the office with customers, on a training course or working from home. Companies are starting to realize their responsibility for supporting and protecting their employees wherever they are and are looking at Safeture as a key partner in ensuring this. I’ve travelled around the world, meeting our different teams and talked with customers to better understand their needs and goals. I have also participated in the largest security expo, GSX in Chicago, and HR expo, Unleash in Paris. It is clear that we have a great scalable and customizable software platform that matches the need of a modern enterprise We are at the stage now where we have a clear path forward and the right product to truly accelerate growth. I want to highlight some achievements in Q3. We expanded our sales team and hired Simon Häggblom as regional sales manager for Sweden. Linda Canivé joined as our new CFO and we divested our majority stake in the U.K.-based travel software company Travelogix to focus on our Enterprise offering. It was also great to see the Chubb Travel Smart travel safety solution, completely developed by Safeture for the insurance giant Chubb, be recognized at the Stevie Awards as well as the Travel Weekly Magellan awards. After the quarter ended our largest owner, the entrepreneur Greg Dingizian, through his investment firm Adma Förvaltnings AB, increased his ownership and ultimately made a bid of 10 kronor in cash per share for the rest of Safeture. It’s reassuring that Greg is confident in our plans and trajectory. The Safeture board recommended long-term shareholders not to accept the offer, however adding that the offer is not unreasonable in a short-term financial perspective. The recommendation of Safeture’s board was underpinned by a conviction that companies’ responsibility for ensuring the safety of their employees is increasing globally and that Safeture, with its scalable SaaS platform, is well placed to capitalise from this trend. We have exiting times ahead of us so don’t miss out, I hope you continue to follow our journey.
Lund, November 2019 Magnus Hultman
CEO, Safeture AB

6
About Safeture AB Safeture offers a complete cloud-based IT platform designed to manage risk, safety and crises involving employees wherever they are. Safeture Enterprise cloud-based IT platform gives larger corporations the ability to effectively automate safety and security processes. Today’s employees are constantly on the move, and companies demand a flexible software solution that seamlessly integrates with their own internal systems. Modern companies’ operations are closely tied to the employees and mobile technology enables them to work everywhere; at home, at airports, at café’s or at suppliers. With globalization driving increased mobility, companies need new tools to safeguard both their employees and their operations. Safeture Enterprise creates a virtual security sphere around each employee wherever they are. The most common usage of the platform is Travel Risk Management for business travelers. The Safeture Enterprise platform has a vast number of functions and components that can be used off-the-shelf, such as mobile apps, travel tracking, flight updates, global real time alerts, e-learning, bulk messaging, country and medical information, all in the same tool. It is an open platform, which allows clients to adopt specific internal processes and integrate it with external suppliers, such as assistance providers or other software, including internal employment databases or intranets. The proven Safeture TRM (Travel Risk Management) software is a part of the Enterprise platform and is also available separately for smaller companies. The TRM software has been popular with many customers for years and is often a starting point for a new customer before they evolve to use other tools on the platform. History
The Company was founded in 2009, triggered by the experience of the global SARS epidemic, the Indian Ocean tsunami and the Mumbai terror attacks, where people could have been warned earlier and received more information. The operations are conducted by Safeture AB.
Overall goals
• To establish Safeture as a world leading platform for employee safety. • To establish Safeture as a first choice for demanding enterprise customers to handle their duty of care.
Vision & Mission
Our vision is to save lives and to prevent harm by making risk, safety and security information available to users at the right time, no matter where they are. We will achieve this by providing the best platform and content that enables implementation of risk, safety and security processes and distribution of reliable information to individuals and organizations.
Sales and Strategy
Safeture´s global sales strategy is to target large companies through direct sales and work through partners to reach other B2B and B2B2C customers. Suitable local and global partners are within security, insurance, response services and travel. We create attractive offers to end customers within personal and travelling security. The business model is SaaS, Software as a Service. Research and development
Research and development are prioritized areas within Safeture, and we operate in a market area that is still immature. The company invests continuously in research and development to maintain its technological lead. Thanks to a close cooperation with our customers we develop and adapt our products continuously. The cutting edge knowledge that we gather from the cooperation with our customers is used in our technical development to invent new solutions and keep our advantage in relation to our competitors.

7
Risks and uncertainties A number of risks may have an influence on the company´s business. No major changes in risk can be seen during 2019. A more detailed review of these risks can be found in the Financial Statements for 2018, available on the company´s web page. Organization/personal
The average number of employees in the parent company for the first nine months 2019 amounted to 28 (19). The increase refers to transfer of analytical personnel in Malaysia to be hired directly by the parent company and also additional personnel in sales. The corresponding figure for the Group amounted to 39 (29). The increase relates to that Travelogix has increased its R&D and sales department, additional employment of analytical personnel in Malaysia and additional sales personnel in the parent company.

8
Development in figures during third quarter, 2019. Amount within brackets corresponds to the same period last year. Turnover
Net turnover for the Group during Q3, 2019 amounted to 5 610 (4 649) TSEK, an increase of 20,72%, while the net turnover for the Parent company amounted to 4 153 (3 268) TSEK, an increase of 27,1%. Result
The result in Q3, 2019 for the Group amounted to -2 215 (-1 870) TSEK. The result for the Parent company amounted to -3 745 (-2 608) TSEK. The operating costs for Q3 incomparison to the same quarter last year are higher, as the Parent company has continued to invest in marketing and sales activities. In addition, as communicated earlier, the company has strengthened the management team with the recruitment of a new CEO and CFO. Finally, profit from the divestiment of Travelogix Ltd had a positive effect on the bottom-line, somewhat offsetting the effect of the higher operating investments.
Liquidity
Cash in bank for the Group, as of September 30, 2019 amounted to 11 403 (7 070) TSEK, while cash in bank for the Parent company as of September 30, 2019 amounted to 11 228 (5 852) TSEK. Q3 cash-flow for the Group and the Parent company amounted to -4 483 (-2 086) TSEK and -1 833 (-2 571) TSEK respectively. As revenues grow we expect to have greater seasonal cash flow fluctuations between the quarters. Investments
Q3 investments in intangible and tangible assets amounted to 495 (577) TSEK for the Group and were mainly capitalised development costs. Corresponding investments in the Parent company amounted to 476 (577) TSEK and were mainly capitalised development costs. Solidity
The solidity of the Group as of September 30, 2019 amounted to 48,9 (57,2) %, while the solidity for the Parent company amounted to 49,2 (60,8) %. Solidity is calculated as total equity to total assets. The share
There is only one class of shares in Safeture AB. The shares of the Company are listed on Nasdaq First North in Stockholm under the abbreviation, “SFTR”. As of September 30, 2019 the Company had issued 23 193 737 (16 556 569) shares. The average number of shares for Q3 2019 amounted to 23 193 737 (16 556 569) shares.

9
Share options
On June 17th, 2015, a general meeting was held and decided on a directed issue of 40 000 share options of series 2015/2019 directed to Sven Holmgren, Hans Skalin, Paul Degerlund, and Wolter Mannerfelt. The share options were issued at the price of 0,31 SEK per option. The share options give the holder a right to subscribe for 40 000 new shares in the company. The options may be exercised during the period July 8th, 2019 – July 24th, 2019. The subscription price for exercising the options amounts to 31,11 SEK per share. It should be noted that these share options were not converted in July, 2019. On May 25th, 2016, a general meeting was held and decided on a directed issue of 670 000 share options of series 2016/2020 to employees and key personnel, as well as to employees of Travelogix Ltd. The share options are issued at a price of 0,09 SEK per option. The subscription price for exercising the share options amount to 37,05 SEK per option. The share options may be exercised during the period April 15th, 2020 – April 29th, 2020. One (1) share option gives the right to subscribe for one (1) new share. On May 29th, 2018, a general meeting was held and decided on a directed issue of 800 000 share options of series 2018/2021 to employees and key personnel of the Safeture Group. 794 000 share options were subscribed. The share options were issued at the price of 0,07 SEK per option. The subscription price for exercising the share options amounts to 9,86 SEK per option. The share options may be exercised during the period December 13th, 2021 – December 17, 2021. One (1) share option gives the right to subscribe for one (1) new share. On July 17th, 2019, a general meeting was held and decided on a directed issue of 1 142 500 share options of series 2019/2022 to employees and key personnel of the Safeture Group. 1 070 880 share options were subscribed. The share options were issued at the price of 0,628 SEK per option. The subscription price for exercising the share options amounts to 9,86 SEK per option. The share options may be exercised during the period July 18th, 2022 – July 29, 2022. One (1) share option gives the right to subscribe for one (1) new share. Largest shareholders
The schedule below shows the ten largest shareholders, and the number of shares they own in Safeture AB, as at September 30, 2019.
1 Algora AB is owned to 100 % by the board member Lars Lidgren (private, related party and family). 2 Academic Medical Group AB is owned by Lars Lidgren, member of the board, 55.7 % through Algora AB and, 2.8 % is owned through Seagles Aktiebolag. Board member Sven Holmgren owns 1.97 % (through related party) and Andreas Rodman 9.45 % (private) in Academic Medical Group AB. 3 Academic Medical Group AB purchased in June 2015 the shares from its subsidiary AM e-Consulting AB.
Related party transactions
Semmy Rülf, chairman of the board of Safeture AB, has received 70 TSEK as remuneration for management services during the third quarter 2019.
SHAREHOLDER AMOUNT OF SHARES %
Adma Förvaltnings AB 6 900 000 29,75%Algora AB 2 845 104 12,27%Humle Småbolagsfond AB 1 241 773 5,35%Semmy Rülf 1 000 000 4,31%Emirates Advanced 960 374 4,14%Skandia försäkring 869 898 3,75%Andreas Rodman 577 500 2,49%Academic Medical Group AB 507 340 2,19%Olof Andersson Förvaltning AB 390 423 1,68%Joseph Aroyan 366 000 1,58%A1A Förvaltning AB 343 913 1,48%Others 7 191 412 31,01%
TOTAL 23 193 737 100%

10
Other information
General accounting principles The Interim Report has been established in accordance with Årsredovisningslagen (1995:1554) and BFNAR 2012:1, Årsredovisning och koncernredovisning (K3). General accounting principles applied is coherent with the accounting principles used when establishing the financial statements 2018. Going concern The board estimates that Safeture will have sufficient cash for continued operations and further growth going forward. Audit
The Interim Report has not been audited by the Company´s auditors.
Report dates
The company establish and publish a financial report every quarter. Upcoming reports are planned as per below:
• Q3 report 2019 2019-11-29 • Year end report 2019 2020-02-28 • Financial Statements 2019 2020-04-10 • Q1 report 2020 2020-05-21 • Annual general meeting for 2019 2020-05-28 • Q2 report 2020 2020-08-30
Certified Adviser
Erik Penser Bank AB is the Certified Adviser of Safeture.
Submission of Interim Report
Lund November, 2019 Safeture AB (publ) The board Semmy Rülf – Chairman of the Board Lisa Berg Rydsbo – Board Member Sven Holmgren – Board Member Sofia Kinberg – Board Member Lars Lidgren – Board Member Adam Schatz – Board Member Magnus Hultman – Managing Director For further information please contact CEO Magnus Hultman, +46 (0) 70 – 600 46 88, [email protected]

11
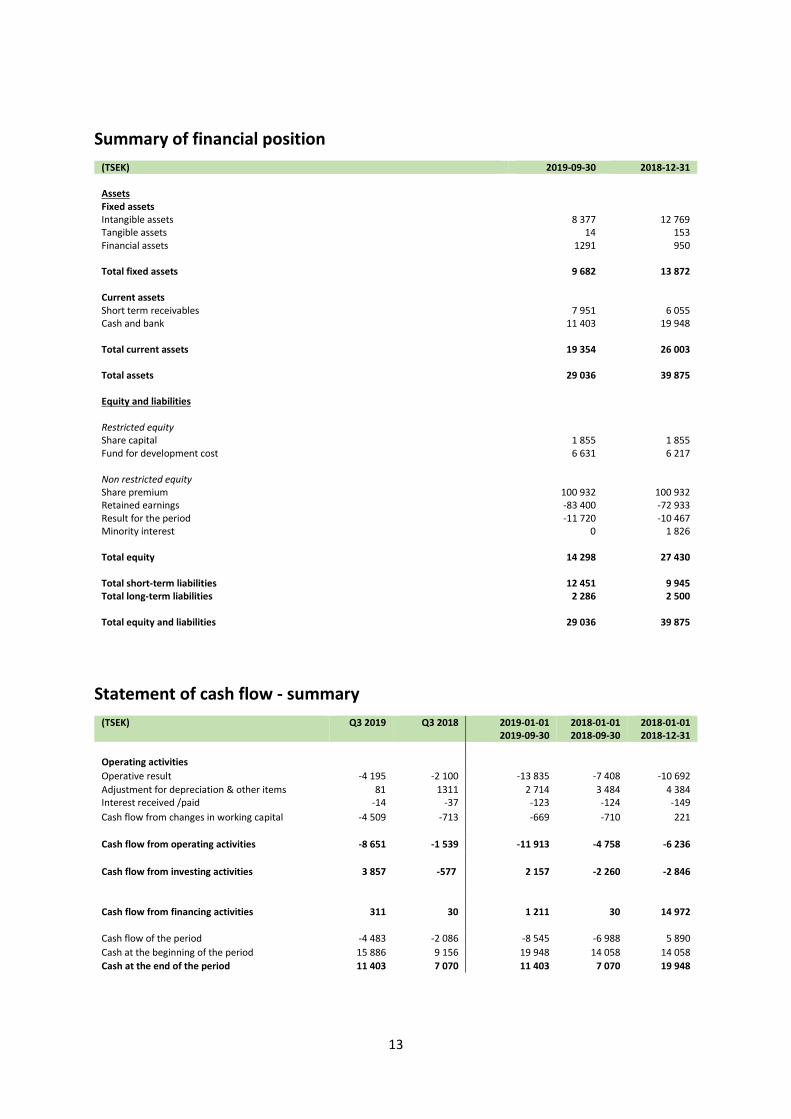
THE GROUP (The Group comprises the Parent company, including subsidiaries. At September 30, 2019, the Parent company owned 100% of the shares in GWS Production (Singapore) Pte Ltd, 99,99% of the shares in GWS do Brasil Solucões e Sistemas Tecnológicos em Seguranca Ltda and 35% of the shares in Carefindy AB (minority interest)).
Statement of income - summary (TSEK) Q3 2019 Q3 2018 2019-01-01
2019-09-30 2018-01-01 2018-09-30
2018-01-01 2018-12-31
Revenue Net turnover 5 610 4 649 16 132 13 445 18 947 Own work capitalised 475 577 1 992 2 260 3 122 Other income -1 44 6 85 77 Total revenue 6 084 5 270 18 130 15 790 22 146 Operating costs
-10 189 -6 546
-29 762
-20 201 -28 942
Depreciation -90 -824 -2 203 -2 997 -3 896 Operative result -4 195 -2 100 -13 835 -7 408 -10 692 Financials Finance net ***2109 -37 2014 -124 -149 Impairment - - - 0 *-150 Result after financials -2 086 -2 137 -11 821 -7 532 -10 991 Tax Result after tax
-9
-2 095
*467
-1 670
**511
-11 310
**429
-7 103
**456
-10 535
Minority share of the result -124 -200 85 137 68 Loss for the period -2 215 -1 870 -11 221 -6 966 -10 467
*Write-down of minority interest in Carefindy AB
**Of which 487 refer to a tax credit claim paid in cash in Travelogix Ltd
*** Of which 2136 refer to profit from sales of Travelogix Ltd.
Data per share Q3 2019 Q3 2018 2019-01-01
2019-09-30 2018-01-01 2018-09-30
2018-01-01 2018-12-31
Number of shares before dilution (at
period end)
23 193 737 16 556 569 23 193 737 16 556 569 23 193 737
Number of shares after dilution** (at
period end)
25 728 617 18 488 454 25 728 617 18 488 454 25 125 622
Average number of shares before dilution 23 193 737 16 556 569 23 193 737 16 155 918 17 601 951
Average number of shares after dilution**
25 213 177 18 488 454 *25 427 120 17 649 633 19 205 208
Number of shares at period end 23 193 737 16 556 569 23 193 737 16 556 569 23 193 737
Result per share before dilution
(calculated on average number of shares)
-0,10 -0,11 -0,48 -0,43 -0,59
Result per share after dilution**
(calculated on average number of shares)
-0,09 -0,10 -0,44 -0,39 -0,55

12
*427 885 share options fell due 29 March, 2019. No conversion was exercised. However, the share options are accounted for in the average number until 29 March, 2019. **Dilution take into account total number of outstanding share options.
13
Summary of financial position (TSEK) 2019-09-30 2018-12-31 Assets Fixed assets Intangible assets 8 377 12 769 Tangible assets 14 153 Financial assets 1291 950 Total fixed assets 9 682 13 872 Current assets Short term receivables 7 951 6 055 Cash and bank 11 403 19 948 Total current assets 19 354 26 003 Total assets 29 036 39 875 Equity and liabilities Restricted equity Share capital Fund for development cost
1 855 6 631
1 855 6 217
Non restricted equity Share premium 100 932 100 932 Retained earnings -83 400 -72 933 Result for the period -11 720 -10 467 Minority interest 0 1 826 Total equity 14 298 27 430 Total short-term liabilities 12 451 9 945 Total long-term liabilities
2 286 2 500
Total equity and liabilities 29 036 39 875
Statement of cash flow - summary (TSEK) Q3 2019 Q3 2018 2019-01-01
2019-09-30 2018-01-01 2018-09-30
2018-01-01 2018-12-31
Operating activities Operative result -4 195 -2 100 -13 835 -7 408 -10 692 Adjustment for depreciation & other items Interest received /paid
81 -14
1311 -37
2 714 -123
3 484 -124
4 384 -149
Cash flow from changes in working capital -4 509 -713 -669 -710 221 Cash flow from operating activities -8 651 -1 539 -11 913 -4 758 -6 236 Cash flow from investing activities 3 857 -577 2 157 -2 260 -2 846
Cash flow from financing activities 311 30 1 211 30 14 972 Cash flow of the period -4 483 -2 086 -8 545 -6 988 5 890 Cash at the beginning of the period 15 886 9 156 19 948 14 058 14 058 Cash at the end of the period 11 403 7 070 11 403 7 070 19 948
14
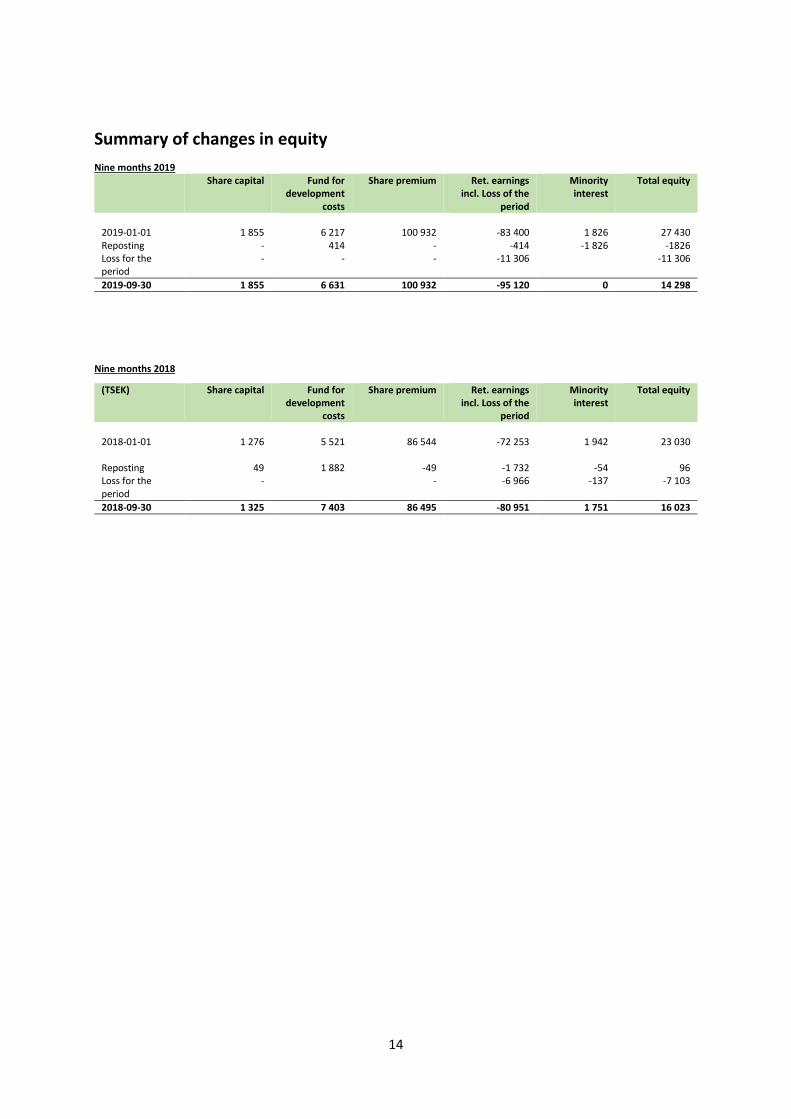
Summary of changes in equity Nine months 2019
Share capital Fund for development
costs
Share premium Ret. earnings incl. Loss of the
period
Minority interest
Total equity
2019-01-01 1 855 6 217 100 932 -83 400 1 826 27 430 Reposting - 414 - -414 -1 826 -1826 Loss for the period
- - - -11 306 -11 306
2019-09-30 1 855 6 631 100 932 -95 120 0 14 298
Nine months 2018
(TSEK) Share capital Fund for development
costs
Share premium Ret. earnings incl. Loss of the
period
Minority interest
Total equity
2018-01-01 1 276 5 521 86 544 -72 253 1 942 23 030 Reposting 49 1 882 -49 -1 732 -54 96 Loss for the period
- - -6 966 -137 -7 103
2018-09-30 1 325 7 403 86 495 -80 951 1 751 16 023
15
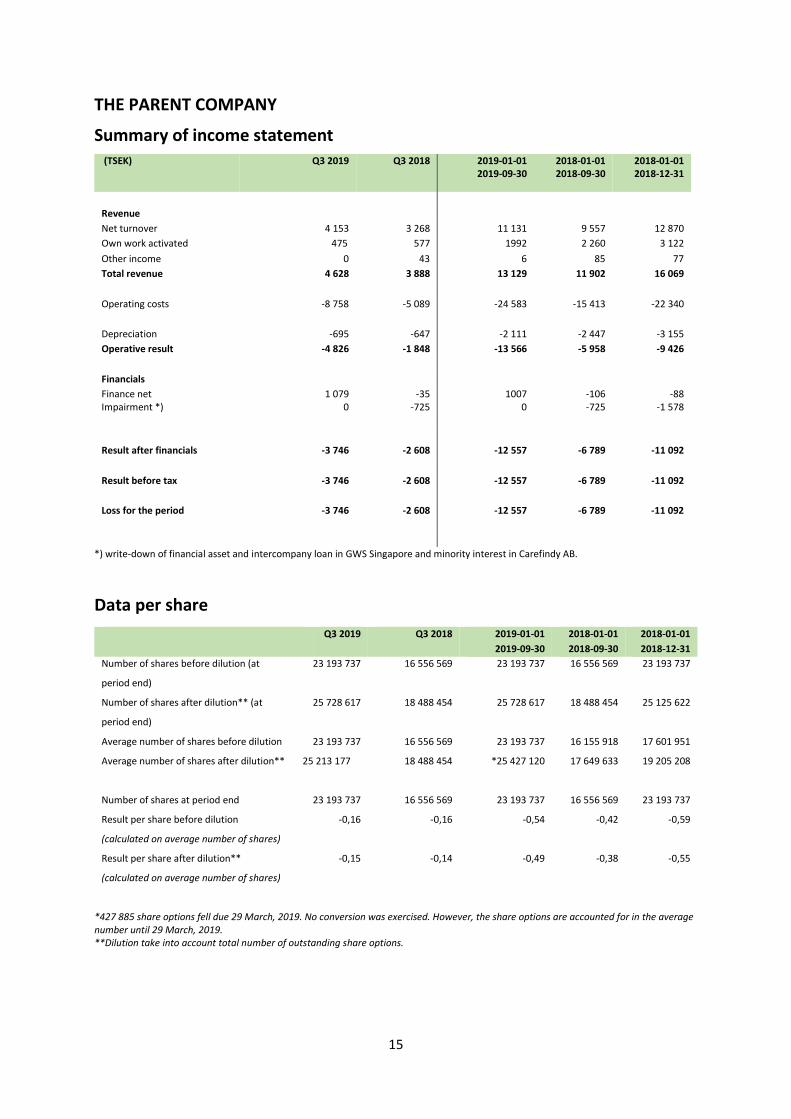
THE PARENT COMPANY
Summary of income statement (TSEK) Q3 2019 Q3 2018 2019-01-01
2019-09-30 2018-01-01 2018-09-30
2018-01-01 2018-12-31
Revenue Net turnover 4 153 3 268 11 131 9 557 12 870 Own work activated 475 577 1992 2 260 3 122 Other income 0 43 6 85 77 Total revenue 4 628 3 888 13 129 11 902 16 069 Operating costs
-8 758
-5 089
-24 583 -15 413 -22 340
Depreciation -695 -647 -2 111 -2 447 -3 155 Operative result -4 826 -1 848 -13 566 -5 958 -9 426 Financials Finance net Impairment *)
1 079 0
-35 -725
1007 0
-106 -725
-88 -1 578
Result after financials -3 746 -2 608 -12 557 -6 789 -11 092 Result before tax -3 746 -2 608 -12 557 -6 789 -11 092 Loss for the period -3 746 -2 608 -12 557 -6 789 -11 092
*) write-down of financial asset and intercompany loan in GWS Singapore and minority interest in Carefindy AB.
Data per share Q3 2019 Q3 2018 2019-01-01
2019-09-30 2018-01-01 2018-09-30
2018-01-01 2018-12-31
Number of shares before dilution (at
period end)
23 193 737 16 556 569 23 193 737 16 556 569 23 193 737
Number of shares after dilution** (at
period end)
25 728 617 18 488 454 25 728 617 18 488 454 25 125 622
Average number of shares before dilution 23 193 737 16 556 569 23 193 737 16 155 918 17 601 951
Average number of shares after dilution**
25 213 177 18 488 454 *25 427 120 17 649 633 19 205 208
Number of shares at period end 23 193 737 16 556 569 23 193 737 16 556 569 23 193 737
Result per share before dilution
(calculated on average number of shares)
-0,16 -0,16 -0,54 -0,42 -0,59
Result per share after dilution**
(calculated on average number of shares)
-0,15 -0,14 -0,49 -0,38 -0,55
*427 885 share options fell due 29 March, 2019. No conversion was exercised. However, the share options are accounted for in the average number until 29 March, 2019. **Dilution take into account total number of outstanding share options.

16
Summary of financial position (TSEK) 2019-09-30 2018-12-31 Assets Fixed assets Intangible assets 8 376 8 404 Tangible assets 5 32 Financial assets 1 379 5 375 Total fixed assets 9 760 13 811 Current assets Short term receivables 7 937 5 456 Cash and bank 11 228 17 477 Total current assets 19 165 22 933 Total assets 28 926 36 744 Equity and liabilities Restricted equity Share capital 1 855 1 855 Fund for development costs 6 631 6 217 Non restricted capital Share premium 100 932 100 932 Retained earnings -82 217 -71 126 Loss for the period -12 972 -11 092 Total equity 14 229 26 786 Total short-term liabilities 12 411 7 458
Total long-term liabilities 2 286 2 500 Total equity and liabilities 28 926 36 744
Summary of cash flow (TSEK) Q3 2019 Q3 2018 2019-01-01
2019-09-30 2018-01-01 2018-09-30
2018-01-01 2018-12-31
Operating activities Operative result -4 826 -2 573 -13 566 -6 683 -9 426 Adjustment for depreciation & other items Interest received /paid
695 -26
1 372 -35
2 111 -62
3 172 -106
2 328 -88
Cash flow from changes in working capital -1699 -792 1 961 -1 845 -778 Cash flow from operating activities -5 881 -2 028 -9 617 -5 462 -7 964 Cash flow from investing activities 3 737 -337 2 157 -2 020 -3 071
Cash flow from financing activities 311 30 1 211 30 14 972 Cash flow of the period -1 833 -2 571 -6 249 -7 688 3 937 Cash at the beginning of the period 13 061 8 423 17 477 13 540 13 540
Cash at the end of the period 11 228 5 852 11 228 5 852 17 477

17
Summary of changes in equity Nine months 2019
(TSEK) Share capital Fund for development
costs
Share premium Ret. earnings incl. Loss for the period
Total equity
2019-01-01 Reposting
1 855
-
6 217
414
100 932
-
-82 217
-414
26 786
- Loss for the period - - - -12 557 -12 557 2019-09-30 1 855 6 632 100 932 -95 189 14 230
. Nine months 2018
(TSEK) Share capital Fund for development
costs
Share premium Ret. earnings incl. Loss for the period
Total equity
2018-01-01 Reposting
1 276 -
49
5 521 -
1 882
86 544
-49
-70 430 -
-1 882
22 911
- Loss for the period - - - -6 789 - 6789 2018-09-30 1 325 7 403 86 495 -79 101 16 122
Safeture AB (publ.)
Ideon Gateway Scheelevägen 27
223 63 Lund
046 – 38 67 50 www.safeture.com