Embed Size (px)
Citation preview

Interim ReportFirst half of 2003

2 Overview5 Segment Reporting 5 Property and Casualty Insurance
14 Life and Health Insurance18 Banking20 Asset Management22 Outlook23 Consolidated Financial Statements
for the First Half of 200332 Notes to the Consolidated Financial Statements
Contents
A L L I A N Z G R O U P 1
To go directly to any chapter, simply click ➤➤ on the headline or the page number.

A L L I A N Z G R O U P 2
In all segments, we were able to make substantial progress in the operating business:
_ Total premium income from the insurance business increased 6.3 percent to 44.8 billion euros. Adjustedfor consolidation and exchange rate effects, the growth rate would even have come to 11.5 percent.
_ The combined ratio, which measures claims and expenses as a percentage of net premiums earned, improved 5.1 percentage points compared to the first half of 2002 and now stands at 97.1 percent.
_ In property and casualty insurance as well as in life and health insurance, we focused on profitablegrowth. Adjusted for exchange rate and consolidation effects, total premium income increased 18.2 percentin this segment. The expense ratio improved by 3.6 percentage points to 17.2 percent. Despite the pressurefrom the capital markets, we reported net income of 191 million euros in the first half of 2003.
_ In the banking segment, we were able to generate operating income of 3.7 billion euros in the first halfand thus succeeded in nearly stabilizing the income side of our banking business. On the cost side, we cut administrative expenses by 17.9 percent from the comparable prior-year figure. Loan loss provisionsdeclined from 1,068 million euros to 699 million euros. Overall, we thus achieved an almost balanced operating result of minus 21 million euros.
_ In the asset management segment, we increased net inflows to 18 billion euros, after adjustment for exchange-rate effects. At the same time, rigorous cost management brought down the cost/income ratiofrom 71.9 percent to 69.0 percent. Total operating income came to 320 million euros. After deduction of acquisition-related expenses, taxes and minority interest, we posted a less-than-expected loss of 130 million euros.
Due to the recovery on capital markets, write-downs on our investments were considerably lower in the second quarter than in thefirst three months. While first-quarter write-downs still amounted to 2.3 billion euros, they fell to 0.8 billion euros in the secondquarter. At the same time, gains of 1.1 billion euros were recorded on securities written down in earlier periods. This brought netwrite-downs in the first six months of the current year to 2.0 billion euros. Of this total, 0.9 billion euros were charged to profit.
We substantially reduced our stock exposure through direct sales as well as the use of derivatives. According to IFRS account-ing standards, changes in the market value of the derivatives used for such macro hedges are recognized as income, while the con-comitant changes of the market value of the underlying stocks are directly recognized as shareholders’ equity and do not affectprofit until they are realized in the capital market. Due to the recovery of the stock market, this different treatment of changes in mar-ket values produced a charge of 1.1 billion euros related to derivatives. To offset this charge, we partially realized the correspon-ding higher valuation reserves in shareholder's equity.
O V E R V I E W
In the second quarter of 2003, Allianz Group achieved net income of 622 million euros. The main contributing
factors were continued operating improvements and the recovery on capital markets. Taking into account the first-
quarter loss, this translates into net income of 102 million euros for the first six months of the current fiscal year.

F I R S T H A L F 2 0 0 3 Overview 3
Significantly aided by progress in the operating business, we were able to return to profitability after a loss of 0.5 billion eurosin the first quarter. After amortization of goodwill, taxes and minority interests, we posted net income of 102 million euros.
EarningsIn the first half of 2003, we achieved earnings of 446 million euros before taxes and amortization of goodwill. Compared to theprior-year period, amortization of goodwill went up slightly, from 567 million euros to 599 million euros. Tax income increased by332 million euros to 607 million euros. The taxes effectively paid increased marginally from 502 million euros to 520 million euros.But these were offset by deferred taxes of 1,127 million euros (after 777 million euros in the previous year).
After deduction of minority interests in earnings, which fell from 879 million euros to 352 million euros, we reported net incomeof 102 million euros. This translates into earnings per share of 0.33 euros.
Premium income from the insurance businessIn the insurance business, we were able to raise total premium income by 6.3 percent to 44.8 billion euros. An increase of 201 millioneuros was attributable to changes in the scope of consolidation, whereas exchange rate effects totaling 2.4 billion euros heavily depressed premium income in euro accounts. After adjustment for these effects, the growth rate was 11.5 percent.
Property and casualty insurance contributed 52.9percent to total premium income, while 47.1 per-cent came from the life and health segment, whichthereby increased its share of total premium in-come by 2.2 percentage points.
Revenues from investment-oriented life insur-ance products grew 23.0 percent to 11.1 billioneuros. In IFRS accounts, where only the risk andcost elements of gross premiums are recognized, aslight growth from 33.1 billion to 33.8 billion eu-ros was reported.
BankingNet revenues from banking, which comprise income from interest, commissions and trading, stabilized at the prior-year level of 3.7billion euros. The decline in the net interest and commission income as well as net fee and commission income induced by thedownturn in the capital markets and the difficult economic situation was compensated by higher trading income, particularly in thefirst quarter of this year. On the cost side, we clearly reduced administrative expenses by 659 million euros, or 17.9 percent, withrespect to the comparable prior-year period. Loan loss provisions declined from 1,068 million euros to 699 million euros. We werethus able to clearly reduce the operating loss from 951 million euros in the prior-year period to 21 million euros.
Asset ManagementAssets under management in the Allianz Group increased by 31 billion euros to 1,020 billion euros since the beginning of the year.In addition to 420 billion euros in Group investments, this includes investments from unit-linked life insurance amounting to 29billion euros. Third-party investments, which increased by 10 billion euros since the end of the year, reached 571 billion euros. Netinflows of 18 billion euros, as well as stock price gains of 32 billion euros, were to a great extent offset by the negative exchangerate effects from the conversion of portfolios to euro accounts, which amounted to 40 billion euros. At last year’s exchange rates,the result would have been an increase of 50 billion euros.
Total premium income by region (¤ 44.8 bn)
Total premium income by businesssegment (¤ 44.8 bn)
Property/casualtyLife/health
52.9 %47.1 %
GermanyRest of EuropaNorth/South AmericaAsia-Pacific/Africa
17.2 %
4.3 %
48.5 %
30.0 %

Shareholders’ equityOn June 30, 2003, the shareholders’ equity of the Allianz Group amounted to 27.4 billion euros. This figure takes into account18,632,649 treasury shares, which reduced shareholders’ equity by their acquisition cost of 4.4 billion euros. Compared to the endof 2002, equity was up 5.6 billion euros. This is mainly attributable to the capital increase launched in April. After deduction oftransactions costs, the 117 million new shares issued at a price of 38 euros increased our shareholder’s equity by a good 4.4 billioneuros.
Market capitalization and the Allianz shareOn June 30, 2003, the market capitalization of Allianz AG, adjusted for treasury shares, amounted to 26.5 billion euros. SinceMarch 31, 2003, the Allianz share has made substantial gains and registered a price increase of 78.9 percent. In comparison, theDow Jones Euro STOXX 50 gained only 18.8 percent during the period, while the DJ Euro STOXX Insurance was up 32.6 percent.Looking at the first six months of 2003, however, the Allianz share declined by a total of 10.4 percent.
EmployeesIn the first six months of the current year, the number of employees world-wide decreased by 2,986 to 178,665.
A L L I A N Z G R O U P 4
F I R S T H A L F 2 0 0 3 Property and Casualty Insurance 5
Adjusted for consolidation and exchange rate effects, premium in-come grew by 6.0 percent. This increase is essentially due to rate in-creases and particularly significant in view of the portfolio restruc-turings we carried out, especially in the U.S.A., where we effectivelysevered business relations that offered no prospects of profitability.
The claims ratio improved 3.2 percentage points to 71.4 percent. This is primarily attribut-able to our selective underwriting policy. In addition, we benefited from a decline in ele-mentary losses and the more favorable development of major claims.
The expense ratio also declined from 27.6 to 25.7 percent. In particular, this is due tocost reductions in Germany and the U.S.A. In other countries, for example France, Spainand Italy, we were able to practically stabilize costs while premium income climbed.
The combined ratio, which measures claims and expenses as a percentage of net pre-mium earned, was 97.1 percent in the first half of 2003. This is an essential step towardsachieving our target of 100 percent for the full year.
The turnaround programs we launched in France, the U.S.A., and in our industrial in-surance business made good progress. Allianz Global Risks, which comprises our world-wide business with international industrial customers, was able to achieve a combined ra-tio of 96.8 percent for the first half of 2003. At Fireman’s Fund, our efforts also resulted inan improved combined ratio of 100.3 percent. In the business lines retained, the combined
ratio even came down to 91.7 percent. The companies had therefore already surpassed their full-year targets by the end of the firsthalf. To sustain this positive trend throughout the second half of the year, further efforts will be required. Particularly at AGF inFrance, which posted a first-half combined ratio of 105.3 percent for its property and casualty business (that includes some of thehealth insurance business), we must vigorously pursue the programs we have launched.
Investment income came to 1.3 billion euros. Itwas depressed by write-offs on securities availablefor sale amounting to 1.0 billion euros, which weremainly made in the first quarter. In the secondquarter, capital losses and gains were almost evenlybalanced. The charges relating to our macro hedgeswere more than compensated by realized gains.
Earnings before taxes and amortization amount-ed to 924 million euros. Compared to the prior-yearperiod, amortization of goodwill increased from
177 to 193 million euros. Taxes produced income of 191 million euros. After deduction of minority interests amounting to 153 mil-lion euros, half-year net income came to 769 million euros, 742 million euros more than in the first quarter.
P R O P E R T Y A N D C A S U A LT Y I N S U R A N C E
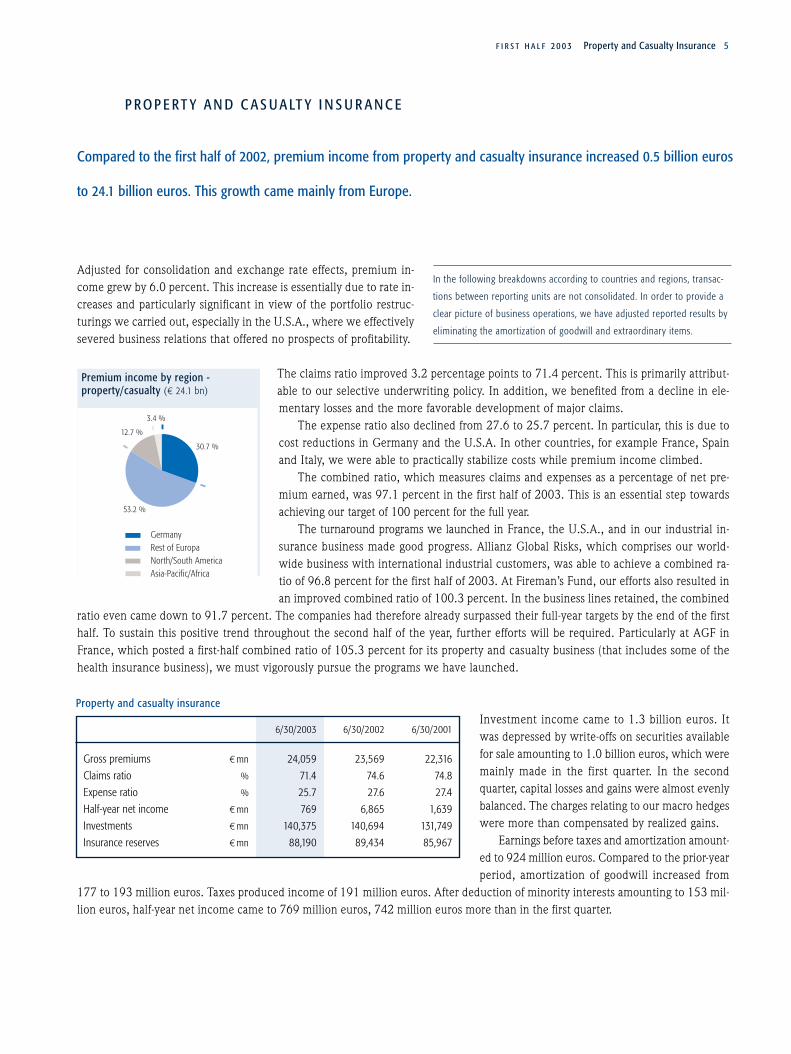
Compared to the first half of 2002, premium income from property and casualty insurance increased 0.5 billion euros
to 24.1 billion euros. This growth came mainly from Europe.
In the following breakdowns according to countries and regions, transac-
tions between reporting units are not consolidated. In order to provide a
clear picture of business operations, we have adjusted reported results by
eliminating the amortization of goodwill and extraordinary items.
Property and casualty insurance
6/30/2003 6/30/2002 6/30/2001
Gross premiums ¤mn 24,059 23,569 22,316
Claims ratio % 71.4 74.6 74.8
Expense ratio % 25.7 27.6 27.4
Half-year net income ¤mn 769 6,865 1,639
Investments ¤mn 140,375 140,694 131,749
Insurance reserves ¤mn 88,190 89,434 85,967
Premium income by region - property/casualty (¤ 24.1 bn)
GermanyRest of EuropaNorth/South AmericaAsia-Pacific/Africa
12.7 %
3.4 %
30.7 %
53.2 %

A L L I A N Z G R O U P 6
G E R M A N Y
Our German property and casualty insurance business, which is combined in the Allianz Sachgruppe Deutschland, upgraded its pre-mium income in the first half of 2003 by 4.0 percent to 6.3 billion euros. With an increase of 5.6 percent, the strongest premiumgrowth was generated by non-automobile insurance. Especially in dynamic property insurance, revenues were up 11.2 percent,aided by rate adjustments. Solid growth was once again posted by fire and property insurances (up 7 percent) and by liability in-surance (up 7.8 percent). Boosted by our increased share of the business contracted through an insurance service, automobile insurancegrew 2.2 percent. At the end of the first half, our long-term policy portfolio contained 42.0 million contracts, 2.2 percent less thanat the end of the prior-year period.
The claims ratio clearly improved to 64.4 (67.0)percent. The number of claims received declined7.2 percent to 2.0 million. This positive trend wasparticularly noticeable in automobile liability in-surance as well as in property and comprehensiveautomobile insurance, which were especially af-fected by the storm and hail disasters of last year.Despite a multitude of smaller storm and hail dam-ages, natural catastrophe claims remained belowthe high volume of last year. The major claims sit-uation also continued to develop positively.
Lower distribution costs and administrative expenses, particularly at headquarters, significantly reduced the expense ratio by 2.8 per-centage points to 26.3 percent.
Net investment income declined substantially from 1.5 to 0.3 billion euros. This can be largely attributed to the fact that the prior-year result was bolstered by realized capital gains from the disposal of shares of HypoVereinsbank and Mannesmann AG.
Earnings after taxes totaled 297 million euros.
Gross premium income from the reinsurance business of Allianz AG decreased 1.9 percent to 3.2 billion euros in the current halfyear, after adjustment for the premium income of Allianz Global Risks Rückversicherungs-AG and Allianz Marine & Aviation, whichis now reported separately. This decline is mainly attributable to the fact that Allianz Sachgruppe Deutschland substantially increasedits retention.
We were able to stabilize the claims ratio at 72.5percent.
The expense ratio, which is primarily determinedby commissions paid, was 27.8 percent.
Net investment income fell to 451 million euros.This is due to the fact that the prior-year result in-cluded substantial realized gains from the inter-company restructuring of our German sharehold-ings.
Total earnings after taxes amounted to 841 million euros.
Sachgruppe Deutschland
6/30/2003 6/30/2002 6/30/2001
Gross premiums ¤mn 6,309 6,067 6,082
Claims ratio % 64.4 67.0 67.9
Expense ratio % 26.3 29.1 27.2
Earnings after taxes ¤mn 297 967 359
Investments ¤mn 22,309 20,986 23,835
Excluding Allianz Marine & Aviation as of 2002.
Allianz AG
6/30/2003 6/30/2002 6/30/2001
Gross premiums ¤mn 3,223 3,969 3,126
Claims ratio % 72.5 72.4 75.4
Expense ratio % 27.8 29.7 26.9
Earnings after taxes ¤mn 841 7,191 1,510
Investments ¤mn 87,209 86,451 67,463
For 2002, these figures include Allianz Global Risks and Allianz Marine & Aviation. As of 2003, both units are reported
separately.

F I R S T H A L F 2 0 0 3 Property and Casualty Insurance 7
F R A N C E
In the current year, the business of Allianz Marine & Aviation France is combined with that of Allianz Marine & Aviation Germanyand reported separately. After adjustment of the prior-year figures for this effect, premium volume grew 12.3 percent to 3.0 billioneuros. This growth is essentially due to the fact that we were able to impose considerable rate increases. A significant part of thegrowth in revenue was attributable to automobile insurance, where we increased premiums in the private customer segment by 9to 15 percent. In commercial automobile insurance, we made rate adjustments of 15 to 30 percent. In addition to the positive de-velopment of revenues in automobile insurance, premium growth was fuelled by increases ranging from 10 to 40 percent in build-ing and household insurance and commercial property insurance.
The claims ratio improved to 81.7 percent. Whilemajor claims in the commercial lines drove up theclaims ratio in this segment, the private customersegment performed substantially better than lastyear. Particularly in automobile insurance, we sawthe loss frequency decline by about 10 percent. Inaddition, our selective underwriting policy as wellas portfolio restructurings in all segments improvedthe quality of our contract portfolio.
The expense ratio declined substantially to 23.6 percent. This is due to the savings we were able to achieve, particularly by cuttingIT and administrative costs.
Total earnings after taxes amounted to 140 million euros.
France
6/30/2003 6/30/2002 6/30/2001
Gross premiums ¤mn 2,988 2,975 2,643
Claims ratio % 81.7 83.6 81.9
Expense ratio % 23.6 25.6 27.6
Earnings after taxes ¤mn 140 470 333
Investments ¤mn 20,819 21,550 17,501
Excluding Allianz Marine & Aviation as of 2002.

A L L I A N Z G R O U P 8
I TA LY
In Italy, the RAS Group was able to increase its gross premium income by 1.9 percent to 1.8 billion euros, while Lloyd Adriaticoraised its premium income by 6.1 percent to 0.7 billion euros. Total premiums thus came to 2.5 billion euros. However, the growthrate of 3.1 percent did not match last year’s 7.9 percent. The slow-down is attributable to automobile liability insurance, where themarket permitted no rate increases. Significant premium growth was generated by accident insurance and comprehensive auto-mobile insurance. For our direct insurer, Genialloyd, the first half was marked by continuing dynamic growth, which boosted pre-mium income by 67.4 percent to 86.9 million euros. Approximately 40 percent of the total was generated by on-line sales.
The loss frequency once again improved on theprevious year, driving down the claims ratio 2.3 per-centage points to 73.2 percent.
The expense ratio fell 0.7 percentage points to 22.6percent as a result of our drive to improve the effi-ciency of administrative procedures.
Net investment income was lower than in the pre-vious year, when substantial gains were realizedfrom the sale of a real estate company.
Overall, earnings after taxes declined from 751 to 245 million euros.
S W I T Z E R L A N D
Our Swiss companies increased their gross premiums by 3.4 percent to 922 million euros in the first half of 2003. This growth cameprimarily from automobile insurance and, to a lesser extent, from property insurance.
The claims ratio remained nearly stable at 74.8 per-cent.
The expense ratio increased slightly to 24.7 per-cent, due to project costs that included improve-ments of the IT infrastructure.
Due to persistent weakness in the capital markets,net investment income amounted to 27 million eu-ros.
Overall, our Swiss companies were able to return to profitability and reported earnings after taxes of 3 million euros, following aloss of 14 million euros in the first half of 2002.
Italy
6/30/2003 6/30/2002 6/30/2001
Gross premiums ¤mn 2,452 2,379 2,204
Claims ratio % 73.2 75.5 78.2
Expense ratio % 22.6 23.3 23.2
Earnings after taxes ¤mn 245 751 169
Investments ¤mn 8,588 10,327 9,938
Allianz Suisse
6/30/2003 6/30/2002 6/30/2001
Gross premiums ¤mn 922 892 833
Claims ratio % 74.8 74.4 77.7
Expense ratio % 24.7 24.4 26.8
Earnings after taxes ¤mn 3 – 14 65
Investments ¤mn 3,134 3,565 4,200

F I R S T H A L F 2 0 0 3 Property and Casualty Insurance 9
G R E AT B R I TA I N
While gross premium income of our British subsidiary Allianz Cornhill increased 4.0 percent in local currency during the first halfof 2003, they fell by 5.7 percent to 1.3 billion in euro accounts. This moderate growth compared to the previous year reflects thedevelopment of the British automobile insurance market, which has already reached the peak of its cycle and permits no furtherprice increases.
The claims situation developed favorably in the firsthalf, and the claims ratio fell from 71.3 to 65.7 per-cent. In particular, this is attributable to automo-bile and property insurance, where active lossmanagement and a revision of all claims settlementprocesses in the company are beginning to pay off.
The expense ratio declined by additional 1.1 percentage points to 28.9 percent.
As a result of the positive development of its key indicators, but also because of on-target net investment income, Allianz Cornhillwas able to report earnings after taxes of 141 million euros – a clear improvement on the previous year.
S PA I N
Our company in Spain boosted its revenues by a solid 14.8 percent to 936 million euros. This growth came mainly from automo-bile insurance, which contributed approximately two-thirds of the total premium income. But the other lines of private customer,commercial and industrial insurance also registered substantial increases in premiums. At the same time, Allianz Seguros benefitedfrom the targeted promotion of their distribution activities and the corresponding gains in productivity.
An increase in the claims volume in automobile in-surance was reflected by a somewhat higher claimsratio of 77.9 (76.2) percent.
Systematic efforts to further streamline workflowsonce again brought down the expense ratio, from21.1 percent in the prior-year period to 18.5 per-cent in the first half of 2003.
Net investment income of 35 million euros was slightly below the prior-year result.
Total earnings after taxes declined slightly to 28 million euros.
Spain
6/30/2003 6/30/2002 6/30/2001
Gross premiums ¤mn 936 815 696
Claims ratio % 77.9 76.2 77.5
Expense ratio % 18.5 21.1 22.6
Earnings after taxes ¤mn 28 32 24
Investments ¤mn 1,738 1,485 1,565
Cornhill
6/30/2003 6/30/2002 6/30/2001
Gross premiums ¤mn 1,335 1,416 1,238
Claims ratio % 65.7 71.3 73.2
Expense ratio % 28.9 30.0 31.7
Earnings after taxes ¤mn 141 34 35
Investments ¤mn 2,935 2,802 2,522
A L L I A N Z G R O U P 10
C E N T R A L A N D E A S T E R N E U R O P E
In Central and Eastern Europe, we were able to benefit disproportionately from the growth of the insurance markets and boost ourgross premium income 42.9 percent to 0.9 billion euros.
In Hungary, gross premium income grew 12.9 percent to 297 million euros (in local currency, the increase was 17.4 percent). AllianzHungária continues to hold a market-leading position and was able to increase its market share by 2 percentage points to 45.4 per-cent in the first three months of the current year.
With a total of 87 million euros, gross premiums at Allianz Polska were up 29.7 percent (in local currency, the increase was 50.5percent) from the prior-year period. This strong performance is attributable to the growth of the fronting business in the industrialinsurance.
Our company in Prague increased its gross premium income by 12.7 percent to 134 million euros (in local currency, the increasewas 17.8 percent). The strongest growth came from automobile and industrial insurance.
In Slovakia, the merger of Allianz Bratislava and Allianz Slovenská poist’ovna was completed successfully. Since January of 2003,the new company has been operating under the name of Allianz Slovenská poist’ovna. Gross premium income amounted to 204 mil-lion euros in the first six months of the current year. The company has a market share of 59 percent.
N A F TA R E G I O N
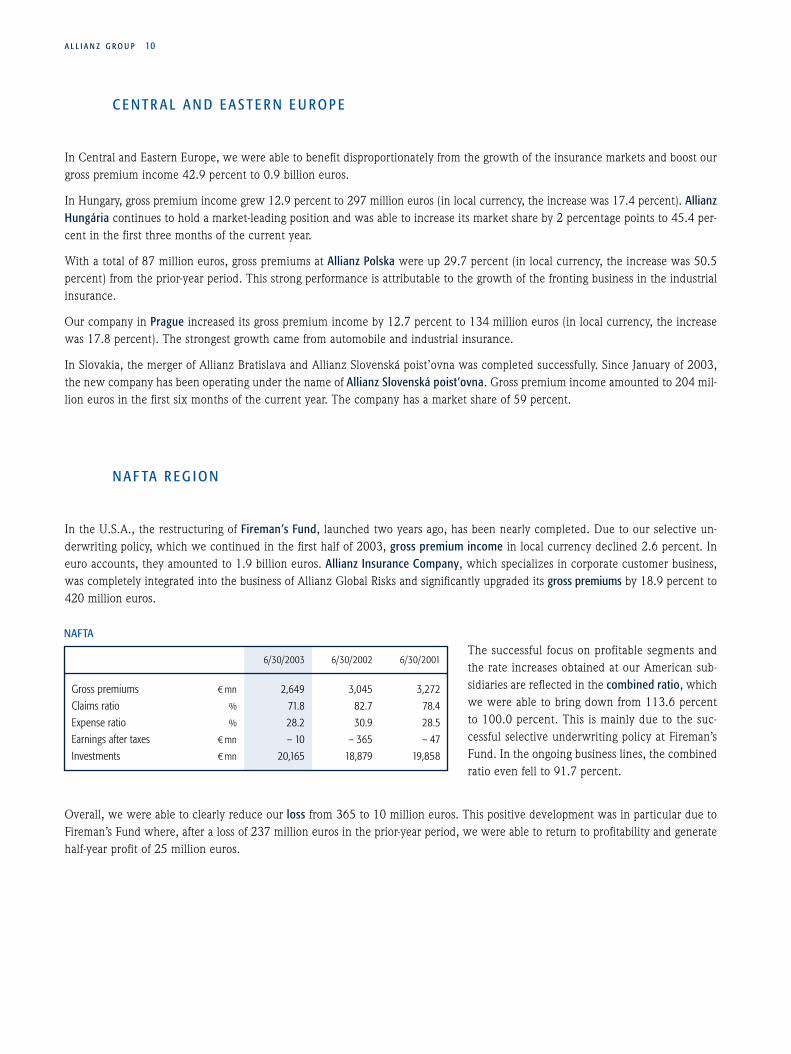
In the U.S.A., the restructuring of Fireman’s Fund, launched two years ago, has been nearly completed. Due to our selective un-derwriting policy, which we continued in the first half of 2003, gross premium income in local currency declined 2.6 percent. Ineuro accounts, they amounted to 1.9 billion euros. Allianz Insurance Company, which specializes in corporate customer business,was completely integrated into the business of Allianz Global Risks and significantly upgraded its gross premiums by 18.9 percent to420 million euros.
The successful focus on profitable segments andthe rate increases obtained at our American sub-sidiaries are reflected in the combined ratio, whichwe were able to bring down from 113.6 percentto 100.0 percent. This is mainly due to the suc-cessful selective underwriting policy at Fireman’sFund. In the ongoing business lines, the combinedratio even fell to 91.7 percent.
Overall, we were able to clearly reduce our loss from 365 to 10 million euros. This positive development was in particular due toFireman’s Fund where, after a loss of 237 million euros in the prior-year period, we were able to return to profitability and generatehalf-year profit of 25 million euros.
NAFTA
6/30/2003 6/30/2002 6/30/2001
Gross premiums ¤mn 2,649 3,045 3,272
Claims ratio % 71.8 82.7 78.4
Expense ratio % 28.2 30.9 28.5
Earnings after taxes ¤mn – 10 – 365 – 47
Investments ¤mn 20,165 18,879 19,858

F I R S T H A L F 2 0 0 3 Property and Casualty Insurance 11
S O U T H A M E R I C A
The economic situation in South America remained unstable in the first half of 2003. While Brazil showed signs of a recovery, de-velopments in Argentina and Venezuela remained uncertain.
Our companies in South America reported gross premium income of 308 million euros and earnings after taxes of 13 million euros.In April, we withdrew from our life insurance business in Chile, and in the future we will concentrate on the property and ca-
sualty insurance business in this region.
A S I A - PA C I F I C
Because of the Iraq conflict, the terrorist attacks and the SARS outbreak, the first two quarters of 2003 proved to be very difficultfor the Asia-Pacific region. Nonetheless, Asia and Australia were able to continue their economic growth. Our premium income wasup 3.5 percent to 763 million euros, mainly due to Allianz Australia, which contributed most of the growth and was able once againto increase its premium income, from 525 to 541 million euros. Since the operative integration of the business segments acquiredfrom HIH has now been completed, business is continuing on its positive course.
In China, Allianz was granted an operating license in mid-February and is now actively developing its business.
In South Korea, we decided to shut down our property insurance company, Allianz General Insurance Korea, Ltd.
In India, our joint venture Bajaj Allianz General Insurance continues to be the leading private property insurer.
Overall, we were able to bring the Asia-Pacific region back to profitability, and achieved earnings after taxes of 30 million euros, fol-lowing a loss of 31 million euros in the comparable prior-year period.
A L L I A N Z G LO B A L R I S K S R Ü C K V E R S I C H E R U N G S - A G
Allianz Global Risks, which has been in existence since January 1, 2002, pools our world-wide business with international indus-trial customers. For the first six months of the current year, it reported gross premium income of 857 million euros. The combinedratio in the first half of 2003 was 96.8 percent.
A part of this entity is Allianz Global Risks Rückversicherungs-AG. In the firsthalf of 2003, this company, which has assumed reinsurance for the interna-tional industrial insurance business of Allianz Group, had gross premium incomeof 787 million euros. This is an increase of 63.7 percent over the prior-yearperiod. The main contributors to this premium growth were fire and propertyinsurance. The positive development in these insurance lines is mainly attribut-able to our turnaround efforts. In technical insurance, particularly in Germany,Great Britain and the U.S.A., the hard insurance market enabled us to raisepremiums by an average of 25 percent.
The claims ratio was 70.9 percent. The marked decline of losses, combined with lower loss amounts – particularly in fire and prop-erty insurance – and the success of our nearly completed portfolio-restructuring measures, were able to compensate for the tornadolosses in the U.S.A.
Allianz Global Risks Rückversicherungs-AG
30.6.2003
Gross premiums ¤mn 787
Claims ratio % 70.9
Expense ratio % 30.8
Earnings after taxes ¤mn – 21
Investments ¤mn 1,039

A L L I A N Z G R O U P 12
The expense ratio in the first half of 2003 was 30.8 percent.
Overall, the company did not quite achieve profitability in the second year of its existence. Compared to the first year, we wereable to further optimize the purchase of our reinsurance capacities and thereby substantially reduce the cost of reinsurance ceded.Despite these improvements, we posted a loss of 21 million euros for the first half.
C R E D I T I N S U R A N C E
Our global credit insurance business is combined in the Allianz group company EULER HERMES S.A., which is headquartered inParis. EULER HERMES, the world’s largest insurer in this market segment, reported gross premium income of 831 million euros inthe first half of 2003. Despite declining demand due to slow economic growth, systematic rate adjustments enabled us to increasepremium income by 2.7 percent over the first six months of the previous years.
As a result of the restructuring of our portfolios anda declining number of major insolvencies, the claimsratio fell 20.7 percentage points to 58.5 percent.
The reduction of the expense ratio by 8.8 percent-age points to 30.4 percent is attributable to strictcost-cutting measures. In addition, the cost alloca-tion in the service business was harmonized in con-nection with the integration of Euler and Hermes.
Net investment income was heavily weighed down by write-downs on the equity portfolio.
Total eanings after taxes fell from 40 million euros to 33 million euros.
T R AV E L I N S U R A N C E A N D A S S I S TA N C E S E R V I C E S
Due to the war in Iraq, the SARS epidemic and the ongoing global recession, the international travel insurance market registered astrong decline. But, while the development of our business was clearly hampered by this situation, we were able to keep gross pre-mium income constant at 414 (412) million euros. Lower premiums from travel insurance, particularly in Germany, Switzerland,the Netherlands and Belgium, were compensated by the positive development of assistance services in countries such as France,Italy, Germany, Austria, Greece, Poland and Brazil.
Another factor that weighed heavily upon rev-enues in euro accounts was the weakness of theBritish pound and the U.S. dollar against the euro.Almost one quarter of our revenues came fromGreat Britain and the U.S.A.
The claims ratio improved 0.4 percentage points to62.2 percent.
Travel insurance and assistance services
6/30/2003 6/30/2002 6/30/2001
Gross premiums ¤mn 414 412 382
Claims ratio % 62.2 62.6 64.4
Expense ratio % 31.8 29.9 27.5
Earnings after taxes ¤mn 8 5 18
Investments ¤mn 480 449 418
Credit insurance
6/30/2003 6/30/2002 6/30/2001
Gross premiums ¤mn 831 809 877
Claims ratio % 58.5 79.2 70.0
Expense ratio % 30.4 39.2 41.3
Earnings after taxes ¤mn 33 40 74
Investments ¤mn 2,580 2,450 2,794

F I R S T H A L F 2 0 0 3 Property and Casualty Insurance 13
Inversely, the expense ratio increased 1.9 percentage points to 31.8 percent.
Together, travel insurance and assistance services generated earnings after taxes of 8 (5) million euros.
A L L I A N Z M A R I N E & AV I AT I O N
Allianz Marine & Aviation is our European specialist insurer for transportation, shipping and aviation risks. Under unified manage-ment and control, this company now includes Allianz Marine & Aviation Versicherungs-AG (formerly Allianz Globus MAT Ver-sicherungs-AG) and Allianz Marine & Aviation France, the former AGF MAT.
Premium income dropped 12 percent to 546 million euros in the first half of2003. This decline is attributable to the strict limitation of underwriting ac-tivities at Allianz Marine & Aviation France.
The claims ratio improved to 62.9 percent. This is the result of our rigorousportfolio reorganization, which eliminated claims-prone and unprofitable busi-ness. In addition, we were spared the major claims that have exerted extremedownward pressure on our claims ratio in past years.
The expense ratio of 21.2 percent is satisfactory.
Earnings after taxes amounted to 26 million euros.
Allianz Marine & Aviation
30.6.2003
Gross premiums ¤mn 546
Claims ratio % 62.9
Expense ratio % 21.2
Earnings after taxes ¤mn 26
Investments ¤mn 1,222

A L L I A N Z G R O U P 14
In euro accounts, total premium income grew 11.5 percent. In IFRS accounts, which recognize only the cost and risk elements as revenue from invest-
ment-oriented life insurance products, premium income increased 1.1 percent to 10.0 billioneuros. These results once again reflect the negative impact of exchange rate effects, parti-cularly in relation to the U.S. dollar. Settings aside consolidation and exchange rate effects,growth amounted to 3.4 percent.
Strict cost management and a clear focus on growth in more profitable areas pusheddown the expense ratio from 20.8 to 17.2 percent. Based on total revenues, it was reducedfrom 10.4 to 7.7 percent.
Investment income fell from 5.2 billion euros to 4.0 billion euros. In particular, this wasdue to the fact that, compared to the first half of 2002, the weakness of the capital marketsforced us to more than double write-downs on securities held for sale. In the first six monthsof 2003, they amounted to 1.7 billion euros, of which 1.3 billion euros were already re-quired in the first quarter. However, the effect of lower net investment income on our bot-tom line is to a great extent absorbed by lower profit participation payouts.
Earnings before taxes and amortization of goodwill came to 505 million euros in the first half of 2003. After amortization ofgoodwill of 87 million euros, taxes of 105 million euros and minority interests of 122 million euros, net income amounted to 191million euros.
L I F E A N D H E A LT H I N S U R A N C E
In life and health insurance, we were able to sustain our growth and to increase total premium income in the original
currencies by 18.2 percent to 21.1 billion euros. 52.4 percent of the premium income came from unit-linked life
insurance and other investment-oriented products. Disregarding exchange rate effects, we were able to boost sales of
these products by 34.8 percent.
Total premium income by region -life/health (¤ 21.1 bn)
GermanyRest of EuropaNorth/South AmericaAsia-Pacific/Africa
5.4 %
22.1 % 29.4 %
43.1 %
Life and health insurance
6/30/2003 6/30/2002 6/30/2001
Total revenues ¤mn 21,102 18,931 15,610
Gross premiums ¤mn 10,057 9,950 9,383
Expense ratio % 17.2 20.8 22.8
Half-year net income ¤mn 191 203 263
Investments ¤mn 230,729 214,897 212,815
Insurance reserves ¤mn 232,747 216,389 211,223

F I R S T H A L F 2 0 0 3 Life and Health Insurance 15
G E R M A N Y
The German life insurance market continued its growth in the first half of 2003. New business at Allianz Leben was up 23.0 per-cent during this period. On the one hand, this is attributable to the financial strength of Allianz Leben: when taking out a new lifeinsurance policy, customers increasingly scrutinize the provider’s financial strength, especially since the solidity of certain competitorshas become the subject of critical discussion. In addition, the growth of new business was also boosted by sales through the branchesof Dresdner Bank, where new business in terms of contract value was up 26.6 percent. At the same time, brokers have increasinglyopted for our products, because they are looking for a financially strong provider in the current market situation.
New business at Allianz Pensionskasse, which signed 110,000 of these contracts, developed with equal success.
Total premium income increased 6.0 percent to 4.8 billion euros in the first six months of the current year.
Due to the positive development of new corporatebusiness and new business from higher annual in-crements, acquisition costs were below average. Inconjunction with the simultaneous increase of pre-mium income, this resulted in a substantial reduc-tion of the expense ratio from 13.9 percent to 8.2percent.
In the investment area, Allianz Leben mainly restructured its equity portfolios in the first six months of fiscal 2003. Equity invest-ments were scaled down, mostly by selling stock portfolios hedged with futures, and the hedges were dissolved. To limit individ-ual risks, we purposefully reduced larger positions. Due to the substantial deterioration of the market situation, investment incomewas 1.8 billion euros less than in the first half of 2002.
As a result, we posted a loss of 31 million euros for the first six months of this year.
Allianz Private Krankenversicherung (formerly Vereinte Krankenversicherung) increased its premium income to 1.5 billion euros,3.6 percent more than in the first half of 2003. This growth was generated by both rate adjustments and new business.
The current discussion on health care policy con-tinues to disconcert potential customers, prevent-ing them from opting for full health insurance cov-erage. At the same time, members of the public arealready investing in supplementary insuranceplans, thus confirming their willingness to makeindividual health care provisions and the necessityfor doing so. In the past six months, supplemen-tary health insurance registered strong growth.
Our benefits and health management initiatives brought down the claims ratio from 72.2 percent to 71.6 percent.
We were able to stabilize the expense ratio at 9.9 percent.
Total earnings after taxes amounted to 31 million euros.
Allianz Lebensversicherungs-AG, Deutsche Lebensversicherungs-AG
6/30/2003 6/30/2002 6/30/2001
Total revenues ¤mn 4,766 4,498 4,199
Gross premiums ¤mn 4,550 4,414 4,199
Expense ratio % 8.2 13.9 17.2
Earnings after taxes ¤mn – 31 125 175
Investments ¤mn 111,403 107,186 110,341
Allianz Private Krankenversicherungs-AG
6/30/2003 6/30/2002 6/30/2001
Gross premiums ¤mn 1,477 1,425 1,335
Claims ratio % 71.6 72.2 74.3
Expense ratio % 9.9 9.9 10.4
Earnings after taxes ¤mn 31 31 14
Investments ¤mn 13,035 11,269 10,931

A L L I A N Z G R O U P 16
F R A N C E
Total premium income decreased 3.3 percent to 2.1 billion euros. This is due to the fact that life insurance sales through agents haddropped off sharply in the first quarter. Only part of this setback was made up for in the second quarter. On the other hand, pre-mium income from life insurance grew by 10.8 percent, which is attributable to rate adjustments in all segments. However, to coverthe rising health care costs in France, further rate adjustments will be required.
Nonetheless, we were able to lower the expenseratio by 1.6 percentage points to 48.2 percent,which is due to savings in administrative and ITcosts.
Net investment income benefited from the sale ofour stake in Crédit Lyonnais in connection withthe takeover offer by Crédit Agricole and rose to928 million euros.
Earnings after taxes increased to 181 million euros.
I TA LY
Our Italian companies were able to boost their total revenues by 26.2 percent to 4.9 billion euros. Once again, this growth wasmainly attributable to our bancassurance business, which generated additional premium income of 44.8 percent. This distributionchannel, which is mainly operated by our bancassurance joint ventures with UniCredito and Banca Antoniana Popolare Veneta, hasmore than 3,700 outlets in Italy. Investment-oriented products with guaranteed capital continue to generate a substantial share ofnew business.
We were able to reduce the expense ratio from28.9 to 28.1 percent.
Due to lower net investment income, which hadbeen bolstered by the sale of a real estate companyin the previous year, earnings after taxes fell to 122million euros.
France
6/30/2003 6/30/2002 6/30/2001
Total revenues ¤mn 2,071 2,141 2,063
Gross premiums ¤mn 743 758 721
Expense ratio % 48.2 49.8 46.4
Earnings after taxes ¤mn 181 7 102
Investments ¤mn 39,425 42,109 42,823
Italy
6/30/2003 6/30/2002 6/30/2001
Total revenues ¤mn 4,858 3,850 2,769
Gross premiums ¤mn 567 583 572
Expense ratio % 28.1 28.9 27.1
Earnings after taxes ¤mn 122 245 180
Investments ¤mn 18,812 15,660 15,076

F I R S T H A L F 2 0 0 3 Life and Health Insurance 17
S W I T Z E R L A N D
Total revenues of our Swiss companies increased 12.3 percent to 804 million euros. This increase of revenues is mainly due to thefact that premium income from collective life insurance is now recognized in the period in which it originates. This effect will balanceout over the full year. In addition, the growth is attributable to the positive development of new business with non-recurring pre-miums in consumer life insurance.
The expense ratio declined by 5.0 percentagepoints to 13.6 percent, mainly due to higher pre-mium income.
At the bottom line, we posted an after-tax loss of10 million euros for the first half of 2003.
U . S . A .
Our subsidiary Allianz Life operates our U.S. life insurance business. In the first half of the current year, total gross premium incomegrew by 47.8 percent to 4.6 billion euros in local currency. In euro accounts, growth came to 20.6 percent. This growth is mainlyattributable to strong sales of annuity and investment products through our distribution network, which was expanded consider-ably in the past years. We reacted to the substantial drop in interest rates in the second quarter and the resulting strong pressureon our margins by lowering profit participation, cutting commissions and halting the sale of certain products. Now that the guar-anteed minimum interest was lowered by Non Forfiture Law in most states, we will launch new products in August. This will en-able us to once again meet our profitability targets.
The expense ratio increased from 43.7 to 54.5 per-cent. In relation to total revenues, it decreasedfrom 5.7 percent to 5.0 percent.
Net investment income, which was heavily de-pressed by write-downs in the previous year, im-proved significantly.
Overall, we posted earnings after taxes of 84 mil-lion euros in the first half, which exceeded our ex-pectations.
Allianz Suisse
6/30/2003 6/30/2002 6/30/2001
Total revenues ¤mn 804 716 704
Gross premiums ¤mn 453 331 307
Expense ratio % 13.6 18.6 27.7
Earnings after taxes ¤mn – 10 – 35 3
Investments ¤mn 8,239 8,424 8,095
Allianz Life
6/30/2003 6/30/2002 6/30/2001
Total revenues ¤mn 4,619 3,831 2,274
Gross premiums ¤mn 549 717 748
Expense ratio % 54.5 43.7 48.6
Earnings after taxes ¤mn 84 – 16 23
Investments ¤mn 19,560 12,974 9,998

A L L I A N Z G R O U P 18
A S I A - PA C I F I C
In the Asia-Pacific region, we were able to raise our gross premium income to 1.1 billion euros, 6.4 percent more than in the pre-vious year. This increase is mainly due to improvements and efficiency gains in agency sales and direct distribution.
Two-thirds of premium income comes from Allianz Life Korea. In February of this year, we signed contracts for the creation ofan additional Korean joint venture with Hana Bank. The mission of the new company, Hana Life Insurance Co., Ltd, is to continuethe successful cooperation between Allianz and Hana Bank (Hana Allianz ITMC), which has been in existence since the end of2000, and to build a strong basis for the very promising bancassurance business, which will be authorized to a limited extent inKorea as of August 2003.
In China, our current joint venture partner, Dazhong, has announced its intention to sell its 49 percent interest in connection witha planned flotation. First discussions with potential new partners are under way.
B A N K I N G
Although the market situation of financial institutions has not yet shown any substantial improvements, we were
able to stabilize operating income in the first half of this year at nearly the same level as in the previous year. On the
cost side, we reduced administrative expenses by 17.9 percent. Overall, our banking business reported an operating
loss of 21 million euros.
In banking, we generated operating income of 3.7billion euros in the first half of 2003. The declineof net interest and current income as well as netfee and commission income was almost compen-sated by higher trading income.
The main reasons for the decline of net interestand current income from 1,979 to 1,362 millioneuros were the deconsolidation of Deutsche Hypin the second half of 2002 as well as the reductionof risk assets which we pursued vigorously.
Net fee and commission income was down 12.4percent on the prior-year period. This reflects thepersisting reluctance of our customers with respectto the capital markets.
Trading income, which developed very positively – particularly in the first quarter – more than doubled to 1,071 million euros.Nearly half of this growth was generated by very successful trading in interest products.
Our cost-cutting drive continued to produce substantial results. By swiftly and consistently implementing our cost cutting meas-ures we were able to lower administrative expenses by 659 million euros, or 17.9 percent, on the prior-year period.
Banking
6/30/2003 6/30/2002
Net interest and current income ¤mn 1,362 1,979
Net fee and commission income ¤mn 1,274 1,455
Trading income ¤mn 1,071 371
Operating income ¤mn 3,707 3,805
Administrative expenses ¤mn – 3,029 – 3,688
Loan loss provisions ¤mn – 699 – 1,068
Operating result ¤mn – 21 – 951
Other income/expenses ¤mn – 795 – 346Half-year net income ¤mn – 437 – 1,058
Operating cost/income ratio % 81.7 96.9
Loans and advances to customers and banks ¤bn 271 283
Liabilities to customers and banks ¤bn 334 294

F I R S T H A L F 2 0 0 3 Banking 19
Loan loss provisions declined from 1,068 million euros to 699 million euros.The overall result is an operating loss of 21 million euros. The balance of other income/expenses, which amounted to – 795
million euros (– 346 million euros in the previous year), essentially resulted from write-offs and restructuring expenses.After amortization of goodwill, taxes and minority interests, the banking business reported a loss of 437 million euros.
Private Customers & Business CustomersDespite the persisting difficulties in the market, we were able tostabilize our operating result in the “Private Customers & Busi-ness Customers” segment. In the first half of 2003, operating in-come amounted to 1,641 million euros. At the same time, wewere able to slightly reduce administrative expenses by 1.2 per-cent, which brought down the operating cost/income ratio from87.8 to 86.8 percent. Loan loss provisions rose to 214 millioneuros, 88 million euros more than in the prior-year period. Over-all, we managed to post an operating result of 3 million euros.However, after deduction of other income/expenses, the segmentreported a loss of 131 million euros for the first half of 2003, fol-lowing net income of 28 million euros in the previous year.
Corporates & MarketsIn “Corporates & Markets”, substantial trading income from in-terest products enabled us to boost operating income to 1,995million euros. On the cost side, the restructuring measures ap-plied to this activity produced palpable results, cutting adminis-trative expenses by a solid 24.8 percent to 1,347 million euros.This pushed the operating cost/income ratio down from 96.1percent to 67.5 percent. Loan loss provisions came to 536 mil-lion euros. Overall, we posted an operating result of 112 millioneuros. Taking into account other income/expenses, we were ableto substantially reduce the loss to 121 million euros compared tothe prior-year period.
Institutional Restructuring UnitAt the beginning of 2003, the Institutional Restructuring Unit (IRU) began its activities as a new unit of Dresdner Bank. With thetransfer of business activities to the IRU in the course of completion, we will include the IRU as a separate division after 2004. Un-til then, we will report the business development of this unit through news releases.
In the first half of 2003, the IRU generated operating income of 290 million euros. After deducting administrative expenses of212 million euros and the loan loss provisions accrued in this corporate unit, of 437 million euros, an operating loss is derived of359 million euros. Taking into account other income/expenses amounting to 226 million euros, the after-tax loss came to 473 mil-lion euros.
Private Customers & Business Customers
6/30/2003 6/30/2002
Operating income ¤mn 1,641 1,643
Administrative expenses ¤mn – 1,424 – 1,442
Loan loss provisions ¤mn – 214 – 126
Operating result ¤mn 3 75
Other income/expenses ¤mn – 107 12
Earnings after taxes ¤mn – 131 28
Operating cost/income ratio % 86.8 87.8
Corporates & Markets
6/30/2003 6/30/2002
Operating income ¤mn 1,995 1,866
Administrative expenses ¤mn – 1,347 – 1,792
Loan loss provisions ¤mn – 536 – 800
Operating result ¤mn 112 – 726
Other income/expenses ¤mn – 131 – 107
Earnings after taxes ¤mn – 121 – 738
Operating cost/income ratio % 67.5 96.1
A L L I A N Z G R O U P 20
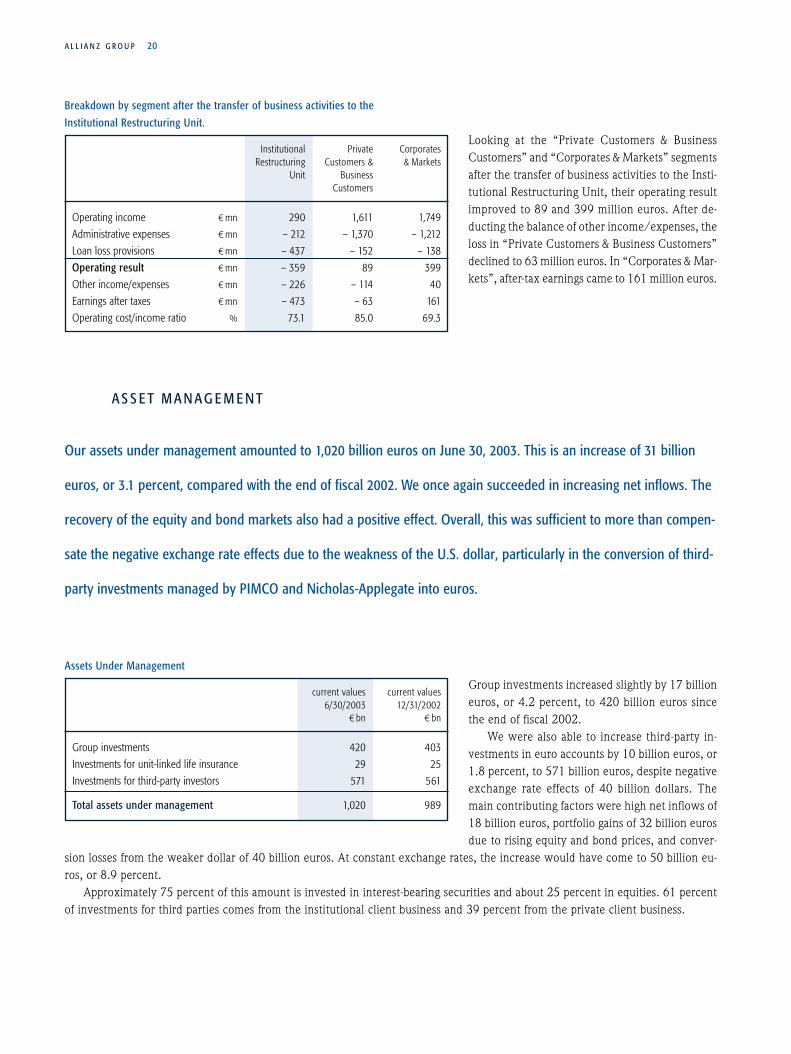
Looking at the “Private Customers & Business Customers” and “Corporates & Markets” segmentsafter the transfer of business activities to the Insti-tutional Restructuring Unit, their operating resultimproved to 89 and 399 million euros. After de-ducting the balance of other income/expenses, theloss in “Private Customers & Business Customers”declined to 63 million euros. In “Corporates & Mar-kets”, after-tax earnings came to 161 million euros.
A S S E T M A N A G E M E N T
Our assets under management amounted to 1,020 billion euros on June 30, 2003. This is an increase of 31 billion
euros, or 3.1 percent, compared with the end of fiscal 2002. We once again succeeded in increasing net inflows. The
recovery of the equity and bond markets also had a positive effect. Overall, this was sufficient to more than compen-
sate the negative exchange rate effects due to the weakness of the U.S. dollar, particularly in the conversion of third-
party investments managed by PIMCO and Nicholas-Applegate into euros.
Group investments increased slightly by 17 billioneuros, or 4.2 percent, to 420 billion euros sincethe end of fiscal 2002.
We were also able to increase third-party in-vestments in euro accounts by 10 billion euros, or1.8 percent, to 571 billion euros, despite negativeexchange rate effects of 40 billion dollars. Themain contributing factors were high net inflows of18 billion euros, portfolio gains of 32 billion eurosdue to rising equity and bond prices, and conver-
sion losses from the weaker dollar of 40 billion euros. At constant exchange rates, the increase would have come to 50 billion eu-ros, or 8.9 percent.
Approximately 75 percent of this amount is invested in interest-bearing securities and about 25 percent in equities. 61 percentof investments for third parties comes from the institutional client business and 39 percent from the private client business.
Assets Under Management
current values current values6/30/2003 12/31/2002
¤bn ¤bn
Group investments 420 403
Investments for unit-linked life insurance 29 25
Investments for third-party investors 571 561
Total assets under management 1,020 989
Breakdown by segment after the transfer of business activities to the
Institutional Restructuring Unit.
Institutional Private CorporatesRestructuring Customers & & Markets
Unit BusinessCustomers
Operating income ¤mn 290 1,611 1,749
Administrative expenses ¤mn – 212 – 1,370 – 1,212
Loan loss provisions ¤mn – 437 – 152 – 138
Operating result ¤mn – 359 89 399
Other income/expenses ¤mn – 226 – 114 40
Earnings after taxes ¤mn – 473 – 63 161
Operating cost/income ratio % 73.1 85.0 69.3

F I R S T H A L F 2 0 0 3 Asset Management 21
In the fixed-income business, we were able to sustain last year’s success in the first half of 2003. Our PIMCO Total Return Fundincreased its assets under management to 76 billion U.S. dollars and thus retained its position as the world’s leading actively managedinvestment fund. In institutional asset management in Germany, our subsidiary dbi, with managed assets of 65.5 billion euros, isthe unrivalled market leader in the area of special funds. With dit, we were able to gain a 12-percent market share of net inflowsin Germany through innovative products in the public funds area and intensified sales support.
The operating result amounted to 320 million euros, following 334 million euros in the corresponding prior-year period. At con-stant exchange rates, we would have surpassed the prior-year result by 378 million euros, or 13.3 percent. Stricter cost manage-ment enabled us to bring down the cost/income ratio from 71.9 percent to 69.0 percent. Acquisition-related expenses totaled 339million euros. They include amortization of goodwill of 182 million euros as well as write-offs of 72 million euros on capitalizedloyalty bonuses for the management of the PIMCO group, which are written off over a five-year period from the date of acquisition.An additional 85 million euros were retention payments to the management and employees of PIMCO and Nicholas-Applegate,which were also agreed upon at the time of acquisition of the fund management companies.
Taxes amounted to a charge of 6 million euros. Third party interests in earnings amounting to 105 million euros are mainlyattributable to Pacific Life, which still holds a minority interest in PIMCO. The asset management segment thus reported a lowerthan expected first-half loss of 130 million euros.
We signed a new agreement with Pacific Life, the biggest minority shareholder of PIMCO, on the acquisition of its remainingstake in PIMCO by Allianz. Since March 31, 2003, both sides now have the possibility of placing a put or call option of up to 250million U.S. dollars on this stake at the end of each quarter. At the end of the first and second quarters, Pacific Life exercised itsright to sell us tranches of 250 million U.S. dollars each.

A L L I A N Z G R O U P Outlook 22
O U T LO O K
In the property and casualty insurance business, we are very confident that we will be able to keep the combined ratio under 100percent for the entire year, provided that no further extraordinary losses occur.
In life and health insurance, we are striving to continue our growth. However, due to the unusually high premium volume inthe second half of 2002, particularly in the U.S.A., the growth rate for the full year will be somewhat lower than in the first half.
In banking, we expect a considerable improvement of our operating result. Whether we can reach the threshold of profitabilityin the current financial year, will to a great extent depend on the recovery of the economy, the situation in the capital markets andthe willingness of our customers to acquire corresponding investment products, which is conditioned by these factors. Our ongoingcost-cutting measures will be pursued relentlessly.
In asset management, we go on the assumption that our operating result will continue to improve.The progress of the economy and the persistent volatility in the capital markets will continue to be the decisive influence on
our future net investment income. To reduce the dependency of our net investment income on the stock market, we are substan-tially reducing our equity quota – a move we are supporting through short-term hedges.
Following the reduction of our stake in Munich Re through sales on the stock market from 22.4 percent to just under 20 per-cent in the first quarter, we will continue our withdrawal from the share capital of that company. An additional reduction by 3 per-centage points will be obtained by repaying a first tranche of about 50 percent of the MILES bond issued in January of 2001 aheadof schedule by releasing Munich Re shares.
Cautionary Note Regarding Forward-Looking Statements: Certain of the statements contained herein may be statements of future expectations and other forward-looking statements that are based on management’s current
views and assumptions and involve known and unknown risks and uncertainties that could cause actual results, performance or events to differ materially from
those expressed or implied in such statements. In addition to statements which are forward-looking by reason of context, the words ‘may, will, should, expects,
plans, intends, anticipates, believes, estimates, predicts, potential, or continue’ and similar expressions identify forward-looking statements. Actual results, per-
formance or events may differ materially from those in such statements due to, without limitation, (i) general economic conditions, including in particular economic
conditions in the Allianz Group’s core business and core markets, (ii) performance of financial markets, including emerging markets, (iii) the frequency and severity
of insured loss events, (iv) mortality and morbidity levels and trends, (v) persistency levels, (vi) the extent of credit defaults, (vii) interest rate levels, (viii) currency
exchange rates including the Euro-U.S. Dollar exchange rate, (ix) changing levels of competition, (x) changes in laws and regulations, including monetary conver-
gence and the European Monetary Union, (xi) changes in the policies of central banks and/or foreign governments, (xii) the impact of acquisitions, including re-
lated integration issues, (xiii) reorganization measures and (xiv) general competitive factors, in each case on a local, regional, national and/or global basis. Many of
these factors may be more likely to occur, or more pronounced, as a result of terrorist activities and their consequences.
The matters discussed herein may also involve risks and uncertainties described from time to time in Allianz AG’s filings with the U.S. Securities and Exchange
Commission. The company assumes no obligation to update any forward-looking statement.
No duty to update.

24 Consolidated Balance Sheet25 Consolidated Income Statement26 Statement of Changes in Shareholders’ Equity27 Cash Flow Statement28 Segment Reporting28 Consolidated balance sheet by business segments30 Consolidated income statement by business segments
Notes to the Consolidated Financial Statements32 1 Accounting Regulations32 Supplementary Information to the Consolidated Balance Sheet32 2 Intangible assets33 3 Investments33 4 Loans and advances to banks 34 5 Loans and advances to customers34 6 Amounts ceded to reinsurers from the insurance reserves34 7 Minority interests in shareholders’ equity and earnings34 8 Participation certificates and subordinated liabilities35 9 Insurance reserves35 10 Other accrued liabilities35 11 Other liabilities36 Supplementary Information to the Consolidated Income Statement36 12 Premiums earned (net)36 13 Interest and similar income37 14 Other income from investments37 15 Trading income37 16 Fee and commission income, and income resulting from
service activities38 17 Insurance benefits39 18 Interest and similar expenses39 19 Other expenses for investments39 20 Loan loss provisions40 21 Acquisition costs and administrative expenses40 22 Taxes41 Other Information41 23 Other information
Consolidated Financial Statements First Half of 2003
C O N S O L I D A T E D F I N A N C I A L S T A T E M E N T S 23To go directly to any chapter, simply click ➤➤on the headline or the page number.

A L L I A N Z G R O U P 24
Consolidated Balance Sheet as of June 30, 2003 and as of December 31, 2002
E Q U I T Y A N D L I A B I L I T I E S 6/30/2003 12/31/2002➤➤ Note ¤ mn ¤ mn
A. Shareholders’ equity 27,384 21,772
B. Minority interests in shareholders’ equity 7 6,552 8,165
C. Participation certificates and subordinated liabilities 8 12,720 14,174
D. Insurance reserves 9 314,640 305,763
E. Insurance reserves for life insurance where the investment risk is carried by policyholders 29,315 25,687
F. Liabilities to banks 177,614 137,332
G. Liabilities to customers 162,910 147,266
H. Certificated liabilities 61,872 78,750
I. Trading liabilities 70,904 53,520
J. Other accrued liabilities 10 12,248 13,069
K. Other liabilities 11 34,777 31,360
L. Deferred tax liabilities 12,509 12,188
M.Deferred income 3,115 3,010
Total equity and liabilities 926,560 852,056
A S S E T S 6/30/2003 12/31/2002➤➤ Note ¤ mn ¤ mn
A. Intangible assets 2 17,284 18,273
B. Investments in affiliated enterprises, joint ventures and associated enterprises 8,656 11,345
C. Investments 3 295,495 285,340
D. Investments held on account and at risk of life insurance policyholders 29,312 25,657
E. Loans and advances to banks 4 102,327 86,822
F. Loans and advances to customers 5 200,519 188,084
G. Trading assets 147,820 124,842
H. Cash and cash equivalents 30,820 21,008
I. Amounts ceded to reinsurers from the insurance reserves 6 26,969 28,420
J. Deferred tax assets 13,610 13,258
K. Other assets 53,748 49,007
Total assets 926,560 852,056
To read the notes, simply click ➤➤ on the number

C O N S O L I D A T E D F I N A N C I A L S T A T E M E N T S 25
Consolidated Income Statement for the Period from January 1 to June 30, 2003 and from January 1 to June 30, 2002
Consolidated Income Statement for the Period from April 1 to June 30, 2003 and from April 1 to June 30, 2002
1/1–6/30/2003 1/1–6/30/2002➤➤ Note ¤ mn ¤ mn
1. Premiums earned (net) 12 27,503 26,9052. Interest and similar income 13 11,866 14,6753. Income (net) from affiliated enterprises, joint ventures and associated enterprises – 232 3,2104. Other income from investments 14 5,749 4,1465. Trading income 15 34 4726. Fee and commission income, and income resulting from service activities 16 3,030 3,8967. Other income 1,892 1,616
Total income (1. to 7.) 49,842 54,9208. Insurance benefits (net) 17 – 24,147 – 25,2719. Interest and similar expenses 18 – 3,515 – 5,440
10. Other expenses for investments 19 – 6,803 – 4,87611. Loan loss provisions 20 – 703 – 1,08712. Acquisition costs and administrative expenses 21 – 10,847 – 12,20313. Amortization of goodwill – 599 – 56714. Other expenses – 3,381 – 3,297Total expenses (8. to 14.) – 49,995 – 52,74115. Earnings from ordinary activities before taxes – 153 2,17916. Taxes 22 607 27517. Minority interests in earnings 7 – 352 – 87918. Net income 102 1,575
¤ ¤
Earnings per share 23 0.33 5.69*)
Earnings per share after elimination of amortization of goodwill 23 2.26 7.74*)
Diluted earnings per share 23 0.33 5.69*)
*) Adjusted for subscription rights issued in April 2003
4/1–6/30/2003 4/1–6/30/2002¤ mn ¤ mn
1. Premiums earned (net) 13,715 13,1942. Interest and similar income 6,467 7,2343. Income (net) from affiliated enterprises, joint ventures and associated enterprises – 377 1,4424. Other income from investments 3,403 1,2075. Trading income – 924 3286. Fee and commission income, and income resulting from service activities 1,461 1,8847. Other income 681 956
Total income (1. to 7.) 24,426 26,2458. Insurance benefits (net) – 12 883 – 12,5659. Interest and similar expenses – 1,946 – 2,194
10. Other expenses for investments – 2,035 – 2,63811. Loan loss provisions – 345 – 75112. Acquisition costs and administrative expenses – 5,236 – 6,22013. Amortization of goodwill – 293 – 28314. Other expenses – 1,687 – 1,540Total expenses (8. to 14.) – 24,425 – 26,19115. Earnings from ordinary activities before taxes 1 5416. Taxes 853 15017. Minority interests in earnings – 232 – 56018. Net income 622 – 356
To read the notes, simply click ➤➤ on the number

A L L I A N Z G R O U P 26
Paid-in Revenue Unrealized Consolidated Shareholders’capital reserves gains and unappropriated equity
losses profit¤ mn ¤ mn ¤ mn ¤ mn ¤ mn
12/31/2001 14,769 8,209 8,276 410 31,664
Currency translation adjustments – 895 – 9 – 904
Changes in the group of consolidated companies 484 484
Treasury stock – 87 – 87
Unrealized investment gains and losses – 3,883 – 3,883
Net income 1,575 1,575
Reclassification of unappropriated profit 46 – 46 –
Shareholders’ dividend – 364 – 364
Miscellaneous 210 210
6/30/2002 14,769 9,542 4,384 – 28,695
12/31/2002 14,785 4,773 1,049 1,165 21,772
Currency translation adjustments – 840 – 53 – 893
Changes in the group of consolidated companies – 1,312 876 – 436
Capital paid-in 4,482 4,482
Treasury stock 1,530 1,530
Unrealized investment gains and losses 2,276 2,276
Net income 102 102
Reclassification of unappropriated profit 791 – 791 –
Shareholders’ dividend – 374 – 374
Miscellaneous – 1,075 – 1,075
6/30/2003 19,267 3,969 4,148 – 27,384
Statement of Changes in Shareholders’ Equity

C O N S O L I D A T E D F I N A N C I A L S T A T E M E N T S 27
1/1–6/30/2003 1/1–6/30/2002¤ mn ¤ mn
Net income 102 1,575Change in unearned premiums 2,543 2,430Change in aggregate policy reserves1) 6,614 2,029Change in reserves for loss and loss adjustment expenses 364 1,279Change in other insurance reserves2) – 1,196 – 64Change in deferred acquisition costs – 1,318 – 554Change in funds held by others under reinsurance business assumed – 41 1,140Change in funds held under reinsurance business ceded 196 – 287Change in accounts receivable/payable on reinsurance business – 22 244Change in trading securities3) – 5,882 17,023Change in loans and advances to banks and customers – 28,679 – 9,450Change in liabilities to banks and customers 56,033 – 8,825Change in certificated liabilities – 16,342 – 9,152Change in other receivables and liabilities 1,731 296Change in deferred tax assets/liabilities4) – 1,055 – 702Non-cash investment income/expenses 1,778 – 2,370Amortization of goodwill 599 567Other – 3,209 – 2,788
Net cash flow provided by (used in) operating activities 12,216 – 7,609
Change in securities available-for-sale – 5,066 5,139Change in securities held-to-maturity 2,393 247Change in real estate – 530 1,303Change in other investments – 695 1,575Change in cash and cash equivalents from the acquisition of consolidated affiliated companies – – 9,119Other 295 578
Net cash flow provided by (used in) investing activities – 3,603 – 277
Change in participation certificates and subordinated liabilities – 1,454 – 135Change in investments held on account and at risk of life insurance policyholders – 4,254 – 1,604Change in aggregate policy reserves for life insurance products according to SFAS 97 4,952 4,324Cash inflow from capital increases 4,482 –Dividend payouts – 632 – 409Other from shareholders’ equity and minority interests5) – 1,821 1,541
Net cash flow provided by financing activities 1,273 3,717
Effect of exchange rate changes on cash and cash equivalents – 74 – 87
Change in cash and cash equivalents 9,812 – 4,256
Cash and cash equivalents at beginning of period 21,008 21,240
Cash and cash equivalents at end of period 30,820 16,984
1) Without aggregate policy reserve for life insurance products in accordance with SFAS 97 3) Including trading liabilities2) Without change in the reserves for latent premium refunds from unrealized investment 4) Without change in deferred tax assets/liabilities from unrealized investment gains and losses
gains and losses 5) Without change in revenue reserves from unrealized investment gains and losses
Cash Flow Statement
The data for the cash flow statement was prepared in accordance with International Financial Reporting Standards (IFRS). The cash flow statement excludes effects of major changes in the scope of consolidation, in the first half of 2003, in particular the de-
consolidation of Pioneer Allianz Life Assurance Corporation, Metro Manila. The deconsolidation reduced the value of investments held (excluding funds held by others) by ¤24 (856 increase) mn while the total
of other assets and liabilities had a net increase of ¤24 (5,523) mn. Income taxes paid amounted to ¤1,462 (1,002) mn.

A L L I A N Z G R O U P 28
Consolidated Balance Sheet by Business Segments as of June 30, 2003 and as of December 31, 2002
A S S E T S Property/Casualty Life/Health
6/30/2003 12/31/2002 6/30/2003 12/31/2002¤ mn ¤ mn ¤ mn ¤ mn
A. Intangible assets 2,733 2,960 4,682 4,817
B. Investments in affiliated enterprises, joint ventures and associated enterprises 49,614 51,448 5,945 6,183
C. Investments 79,213 76,855 196,519 189,172
D. Investments held on account and at risk of life insurance policyholders – – 29,312 25,657
E. Loans and advances to banks 8,594 5,219 3,064 3,490
F. Loans and advances to customers 2,667 2,882 27,971 24,747
G. Trading assets 1,749 1,404 1,224 1,177
H. Cash and cash equivalents 2,205 2,880 1,067 2,267
I. Amounts ceded to reinsurers from the insurance reserves 16,322 17,188 16,867 17,623
J. Deferred tax assets 7,676 7,410 2,240 2,601
K. Other assets 23,261 21,482 18,760 17,320
Total assets 194,034 189,728 307,651 295,054
E Q U I T Y A N D L I A B I L I T I E S Property/Casualty Life/Health
6/30/2003 12/31/2002 6/30/2003 12/31/2002¤ mn ¤ mn ¤ mn ¤ mn
A. Participation certificates and subordinated liabilities 3,941 4,342 – –
B. Insurance reserves 88,190 87,557 232,747 224,673
C. Insurance reserves for life insurance where the investment risk is carried by policyholders – – 29,315 25,687
D. Liabilities to banks 5,161 5,166 3,538 1,708
E. Liabilities to customers – – – –
F. Certificated liabilities 17,071 19,031 248 263
G. Trading liabilities 1,431 544 1,083 825
H. Other accrued liabilities 5,536 5,626 625 850
I. Other liabilities 19,223 18,312 20,889 20,555
J. Deferred tax liabilities 7,491 7,356 2,759 2,551
K. Deferred income 99 104 359 354
Total equity and liabilities 148,143 148,038 291,563 277,466

C O N S O L I D A T E D F I N A N C I A L S T A T E M E N T S Segment Reporting 29
Banking Asset Management Consolidation Adjustments Group
6/30/2003 12/31/2002 6/30/2003 12/31/2002 6/30/2003 12/31/2002 6/30/2003 12/31/2002¤ mn ¤ mn ¤ mn ¤ mn ¤ mn ¤ mn ¤ mn ¤ mn
3,259 3,509 6,610 6,987 – – 17,284 18,273
3,366 4,349 18 20 – 50,287 – 50,655 8,656 11,345
29,605 28,965 676 993 – 10,518 – 10,645 295,495 285,340
– – – – – – 29,312 25,657
91,495 76,748 198 1,863 – 1,024 – 498 102,327 86,822
179,671 168,919 223 228 – 10,013 – 8,692 200,519 188,084
144,691 122,139 173 156 – 17 – 34 147,820 124,842
27,462 16,322 595 940 – 509 – 1,401 30,820 21,008
– – – – – 6,220 – 6,391 26,969 28,420
3,628 3,161 66 86 – – 13,610 13,258
15,721 15,416 3,481 3,672 – 7,475 – 8,883 53,748 49,007
498,898 439,528 12,040 14,945 – 86,063 – 87,199 926,560 852,056
Banking Asset Management Consolidation Adjustments Group
6/30/2003 12/31/2002 6/30/2003 12/31/2002 6/30/2003 12/31/2002 6/30/2003 12/31/2002¤ mn ¤ mn ¤ mn ¤ mn ¤ mn ¤ mn ¤ mn ¤ mn
8,787 9,846 – – – 8 – 14 12,720 14,174
– – – – – 6,297 – 6,467 314,640 305,763
– – – – – – 29,315 25,687
169,509 130,568 358 177 – 952 – 287 177,614 137,332
164,158 146,945 520 2,754 – 1,768 – 2,433 162,910 147,266
50,077 64,569 213 435 – 5,737 – 5,548 61,872 78,750
68,422 52,152 – – – 32 – 1 70,904 53,520
5,515 5,984 572 609 – – 12,248 13,069
6,933 5,468 1,265 1,239 – 13,533 – 14,214 34,777 31,360
2,194 2,220 65 61 – – 12,509 12,188
2,653 2,545 4 7 – – 3,115 3,010
478,248 420,297 2,997 5,282 – 28,327 – 28,964 892,624 822,119
Equity*) 33,936 29,937
Total equity and liabilities 926,560 852,056
*) Shareholders’ equity and minority interests

A L L I A N Z G R O U P 30
Consolidated income statement by business segments for the period from January 1 to June 30, 2003
and from January 1 to June 30, 2002
Property/Casualty Life/Health
1/1–6/30/2003 1/1–6/30/2002 1/1–6/30/2003 1/1–6/30/2002¤ mn ¤ mn ¤ mn ¤ mn
1. Premiums earned (net) 18,380 17,954 9,123 8,951
2. Interest and similar income 2,256 2,464 5,687 5,858
3. Income (net) from affiliated enterprises, joint ventures and associated enterprises 45 6,854 139 433
4. Other income from investments 2,680 1,939 2,649 2,076
5. Trading income – 1,196 49 138 57
6. Fee and commission income, and income from service activities 314 871 103 92
7. Other income 886 1,069 735 332
Total income (1. to 7.) 23,365 31,200 18,574 17,799
8. Insurance benefits (net) – 13,294 – 13,829 – 10,853 – 11,441
9. Interest and similar expenses – 796 – 729 – 131 – 255
10. Other expenses for investments – 1,834 – 1,380 – 4,380 – 2,870
11. Loan loss provisions – 3 – 14 – 1 – 5
12. Acquisition costs and administrative expenses – 4,946 – 5,249 – 1,822 – 2,109
13. Amortization of goodwill – 193 – 177 – 87 – 86
14. Other expenses – 1,568 – 2,146 – 882 – 624
Total expenses (8. to 14.) – 22,634 – 23,524 – 18,156 – 17,390
15. Earnings from ordinary activities before taxes 731 7,676 418 409
16. Taxes 191 – 17 – 105 – 80
17. Minority interests in earnings – 153 – 794 – 122 – 126
18. Net income 769 6,865 191 203

C O N S O L I D A T E D F I N A N C I A L S T A T E M E N T S Segment Reporting 31
Banking Asset Management Consolidation Adjustments Group
1/1–6/30/2003 1/1–6/30/2002 1/1–6/30/2003 1/1–6/30/2002 1/1–6/30/2003 1/1–6/30/2002 1/1–6/30/2003 1/1–6/30/2002¤ mn ¤ mn ¤ mn ¤ mn ¤ mn ¤ mn ¤ mn ¤ mn
– – – – – – 27,503 26,905
4,282 6,801 33 73 – 392 – 521 11,866 14,675
– 75 286 1 13 – 342 – 4,376 – 232 3,210
417 180 7 21 – 4 – 70 5,749 4,146
1,071 371 11 1 10 – 6 34 472
1,502 1,606 1,364 1,452 – 253 – 125 3,030 3,896
279 171 48 57 – 56 – 13 1,892 1,616
7,476 9,415 1,464 1,617 – 1,037 – 5,111 49,842 54,920
– – – – – – 1 – 24,147 – 25,271
– 2,921 – 4,892 – 16 – 54 349 490 – 3,515 – 5,440
– 603 – 622 – 2 – 5 16 1 – 6,803 – 4,876
– 699 – 1,068 – – – – – 703 – 1,087
– 3,258 – 3,840 – 1,047 – 1,109 226 104 – 10,847 – 12,203
– 137 – 104 – 182 – 200 – – – 599 – 567
– 813 – 290 – 236 – 300 118 63 – 3,381 – 3,297
– 8,431 – 10,816 – 1,483 – 1,668 709 657 – 49,995 – 52,741
– 955 – 1,401 – 19 – 51 – 328 – 4,454 – 153 2,179
527 339 – 6 27 – 6 607 275
– 9 4 – 105 – 120 37 157 – 352 – 879
– 437 – 1,058 – 130 – 144 – 291 – 4,291 102 1,575

A L L I A N Z G R O U P 32
1 Accounting regulations
In accordance with § 292 a of the German Commercial Code (HGB), the consolidated financial statements have been prepared in con-formity with International Financial Reporting Standards (IFRS). In establishing these consolidated financial statements, all standards cur-rently applicable to the interim report have been adhered to.
Since 2002, the designation IFRS applies to the overall framework of all standards approved by the International Accounting StandardsBoard. Already approved standards continue to be cited as International Accounting Standards (IAS).
IFRS does not provide specific guidance concerning the reporting of insurance transactions in financial statements. In such cases, asenvisioned in the IFRS Framework, the provisions embodied under accounting principles generally accepted in the United States of Amer-ica (U.S. GAAP) have been applied.
The interim report follows the same accounting and valuation principles as the most recent annual financial statements.The financial statements are presented in euros (¤).
S U P P L E M E N TA R Y I N F O R M AT I O N T O T H E C O N S O L I D AT E D B A L A N C E S H E E T
2 Intangible assets
Intangible assets comprise the following:
Changes in goodwill for the period under review were as follows:
Additions are mainly comprised of goodwill due to the increase in ownership interest in:
_ Riunione Adriatica di Sicurtà S. p. A. by 4.3 % to 55.4 %,
_ PIMCO Advisors L. P. by 5.0 % to 74.5 %
6/30/2003 12/31/2002¤ mn ¤ mn
Goodwill 13,193 13,786
Other intangible assets 4,091 4,487
Total 17,284 18,273
¤ mn
Gross amount capitalized 12/31/2002 17,262
Accumulated amortization 12/31/2002 – 3,476
Value stated as of 12/31/2002 13,786
Translation differences – 307
Value stated as of 1/1/2003 13,479
Additions 313
Amortization – 599
Value stated as of 6/30/2003 13,193
Accumulated amortization 6/30/2003 – 4,075
Gross amount capitalized 6/30/2003 17,268

3 Investments
Securities available-for-sale
Realized gains and losses on securitiesare principally determined by applyingthe average cost method.
4 Loans and advances to banks
N O T E S T O T H E C O N S O L I D A T E D F I N A N C I A L S T A T E M E N T S 33
Amortized Unrealized Unrealized Marktet cost gains losses values
6/30/2003 12/31/2002 6/30/2003 12/31/2002 6/30/2003 12/31/2002 6/30/2003 12/31/2002¤ mn ¤ mn ¤ mn ¤ mn ¤ mn ¤ mn ¤ mn ¤ mn
Equity securities 44,912 54,637 5,115 3,601 4,888 10,067 45,139 48,171
Government bonds 129,527 120,755 8,065 6,450 197 426 137,395 126,779
Corporate bonds 84,543 79,775 5,536 5,451 211 472 89,868 87,754
Other 5,485 6,061 359 253 13 21 5,831 6,293
Total 264,467 261,228 19,075 15,755 5,309 10,986 278,233 265,997
Realized gains Realized losses
1/1–6/30/2003 1/1–6/30/2002 1/1–6/30/2003 1/1–6/30/2002¤ mn ¤ mn ¤ mn ¤ mn
Equity securities 3,410 3,029 3,322 2,286
Government bonds 658 269 63 192
Corporate bonds 529 418 154 154
Other 16 25 3 25
Total 4,613 3,741 3,542 2,657
6/30/2003 12/31/2002¤ mn ¤ mn
Loans 4,666 5,213
Other advances 97,974 82,017
Loans and advances to banks 102,640 87,230
Less loan loss allowance 313 408
Loans and advances to banks after loan loss allowance 102,327 86,822
6/30/2003 12/31/2002¤ mn ¤ mn
Securities held-to-maturity 4,091 6,533
Securities available-for-sale 278,233 265,997
Real estate used by third parties 11,082 10,747
Funds held by others under reinsurance contracts assumed 2,089 2,063
Total 295,495 285,340

6/30/2003 12/31/2002¤ mn ¤ mn
Participation certificates 1,599 1,955
Subordinated liabilities 11,121 12,219
Total 12,720 14,174
A L L I A N Z G R O U P 34
5 Loans and advances to customers
6 Amounts ceded to reinsurers from the insurance reserves
7 Minority interests in shareholders’ equity and earnings
The primary subsidiaries included are the AGF Group, Paris, the RAS Group, Milan, and PIMCO Group, Delaware.
The minority interests in shareholders’ equity is comprised of:
8 Participation certificates and subordinated liabilities
6/30/2003 12/31/2002¤ mn ¤ mn
Loans and advances to customers 207,170 194,643
Less loan loss allowance 6,651 6,559
Loans and advances to customers after loan loss allowance 200,519 188,084
6/30/2003 12/31/2002¤ mn ¤ mn
Unearned premiums 1,805 1,507
Aggregate policy reserves 10,912 11,350
Reserve for loss and loss adjustment expenses 13,976 15,334
Other insurance reserves 226 179
Subtotal 26,919 28,370
Insurance reserves for life insurance where the investment risk is carried by policyholders 50 50
Total 26,969 28,420
6/30/2003 12/31/2002¤ mn ¤ mn
Other reservesUnrealized gains and losses 413 – 76
Share of earnings 352 688
Other equity components 5,787 7,553
Total 6,552 8,165

N O T E S T O T H E C O N S O L I D A T E D F I N A N C I A L S T A T E M E N T S 35
9 Insurance reserves
10 Other accrued liabilities
11 Other liabilities
6/30/2003 12/31/2002¤ mn ¤ mn
Unearned premiums 14,884 12,248
Aggregate policy reserves 214,812 210,109
Reserves for loss and loss adjustment expenses 64,008 65,961
Reserves for premium refunds 19,732 16,190
Premium deficiency reserves 390 385
Other insurance reserves 814 870
Total 314,640 305,763
6/30/2003 12/31/2002¤ mn ¤ mn
Reserves for pensions and similar obligations 5,684 5,715
Accrued taxes 1,620 1,775
Miscellaneous accrued liabilities 4,944 5,579
Total 12,248 13,069
6/30/2003 12/31/2002¤ mn ¤ mn
Funds held under reinsurance business ceded 8,655 8,562
Accounts payable on direct insurance business 7,581 7,972
Accounts payable on reinsurance business 2,013 2,257
Other liabilities 16,528 12,569
Total 34,777 31,360

A L L I A N Z G R O U P 36
S U P P L E M E N TA R Y I N F O R M AT I O N T O T H E C O N S O L I D AT E D I N C O M E S TAT E M E N T
12 Premiums earned (net)
13 Interest and similar income
Property/Casualty*) Life/Health*) Total
1/1–6/30/2003 1/1–6/30/2002 1/1–6/30/2003 1/1–6/30/2002 1/1–6/30/2003 1/1–6/30/2002¤ mn ¤ mn ¤ mn ¤ mn ¤ mn ¤ mn
Gross premiums written 23,706 23,209 10,048 9,939 33,754 33,148Premiums ceded in reinsurance – 3,122 – 3,299 – 510 – 614 – 3,632 – 3,913Change in unearned premiums (net) – 2,548 – 2,305 – 71 – 25 – 2,619 – 2,330
Premiums earned (net) 18,036 17,605 9,467 9,300 27,503 26,905
*) After eliminating intra-Group transactions between segments
1/1–6/30/2003 1/1–6/30/2002¤ mn ¤ mn
Income from
Securities held-to-maturity 197 248
Securities available-for-sale 6,556 6,924
Real estate used by third parties 498 533
Lending, money market transactions and loans 4,213 6,359
Leasing agreements 35 75
Other interest-bearing instruments 367 536
Total 11,866 14,675
Net interest margin from banking business*)
1/1–6/30/2003 1/1–6/30/2002¤ mn ¤ mn
Interest and current income 4,260 6,798
Interest expenses – 2,891 – 4,763
Net interest and current income 1,369 2,035
Less loan loss provisions 699 1,068
Net interest and current income after loan loss provisions 670 967
*) After eliminating intra-Group transactions between segments

N O T E S T O T H E C O N S O L I D A T E D F I N A N C I A L S T A T E M E N T S 37
14 Other income from investments
15 Trading income
Trading income includes expenses amounting to ¤1,112 (+110) mn from derivative financial instruments where hedge accounting according toIAS 39 is not applied. Derivative financial instruments embedded in exchangeable bonds did not have an impact on results for the reportingperiod. Options and forwards were used (macro hedges) to reduce exposure to equities. This resulted in a charge of ¤1,131 mn. Tradingincome also includes gains of ¤19 (– 73) mn from the use of other derivative financial instruments by insurance companies.
Trading income amounting to ¤34 (472) mn includes ¤1,071 (371) mn income from trading activities of the banking business*). This iscomprised as follows:
16 Fee and commission income, and income resulting from service activities
Of the total fee and commission income, and income resulting from service activities, ¤1,373 (1,521) mn are attributable to banking business*).
1/1–6/30/2003 1/1–6/30/2002¤ mn ¤ mn
Realized gains onSecurities held-to-maturity – –
Securities available-for-sale 4,613 3,741
Real estate used by third parties 89 243
Other investments 7 50
Subtotal 4,709 4,034
Income from revaluations ofSecurities held-to-maturity 18 –
Securities available-for-sale 1,006 106
Real estate used by third parties 8 2
Other investments 8 4
Subtotal 1,040 112
Total 5,749 4,146
1/1–6/30/2003 1/1–6/30/2002¤ mn ¤ mn
Trading in interest products 472 222
Trading in equity products 101 – 22
Foreign exchange/precious metals trading 186 218
Other trading activities 312 – 47
Total 1,071 371
*) After eliminating intra-Group transactions between segments
Net fee and commission income from banking business*)
1/1–6/30/2003 1/1–6/30/2002¤ mn ¤ mn
Fee and commission income 1,373 1,521
Fee and commission expenses – 214 – 146
Total 1,159 1,375
*) After eliminating intra-Group transactions between segments

A L L I A N Z G R O U P 38
Net fee and commission income from banking business is comprised of the following:
17 Insurance benefits
Insurance benefits in Property/Casualty*) include the following:
Insurance benefits in Life/Health*) include the following:
1/1–6/30/2003 1/1–6/30/2002¤ mn ¤ mn
Securities business 602 529
Lending business 10 6
Underwriting business (new issues) 55 62
Other 492 778
Net fee and commission income 1,159 1,375
Gross Ceded in reinsurance Net
1/1–6/30/2003 1/1–6/30/2002 1/1–6/30/2003 1/1–6/30/2002 1/1–6/30/2003 1/1–6/30/2002¤ mn ¤ mn ¤ mn ¤ mn ¤ mn ¤ mn
Benefits paid – 8,963 – 8,146 540 637 – 8,423 – 7,509
Change in reserves
Aggregate policy reserves – 2,839 – 2,754 10 – 129 – 2,829 – 2,883
Other – 122 – 143 – 65 114 – 187 – 29
Subtotal – 11,924 – 11,043 485 622 – 11,439 – 10,421
Expenses of premium refunds 186 – 1,383 11 1 197 – 1,382
Total – 11,738 – 12,426 496 623 – 11,242 – 11,803
*) After eliminating intra-Group transactions between segments
Gross Ceded in reinsurance Net
1/1–6/30/2003 1/1–6/30/2002 1/1–6/30/2003 1/1–6/30/2002 1/1–6/30/2003 1/1–6/30/2002¤ mn ¤ mn ¤ mn ¤ mn ¤ mn ¤ mn
Claims
Claims paid – 14,556 – 14,925 2,162 2,283 – 12,394 – 12,642
Change in reserves for loss and lossadjustment expenses 298 – 313 – 713 – 144 – 415 – 457
Subtotal – 14,258 – 15,238 1,449 2,139 – 12,809 – 13,099
Change in other reserves
Aggregate policy reserves – 126 – 196 32 16 – 94 – 180
Other 77 – 68 1 – 9 78 – 77
Subtotal – 49 – 264 33 7 – 16 – 257
Expenses of premium refunds – 73 – 128 – 7 16 – 80 – 112
Total – 14,380 – 15,630 1,475 2,162 – 12,905 – 13,468
*) After eliminating intra-Group transactions between segments
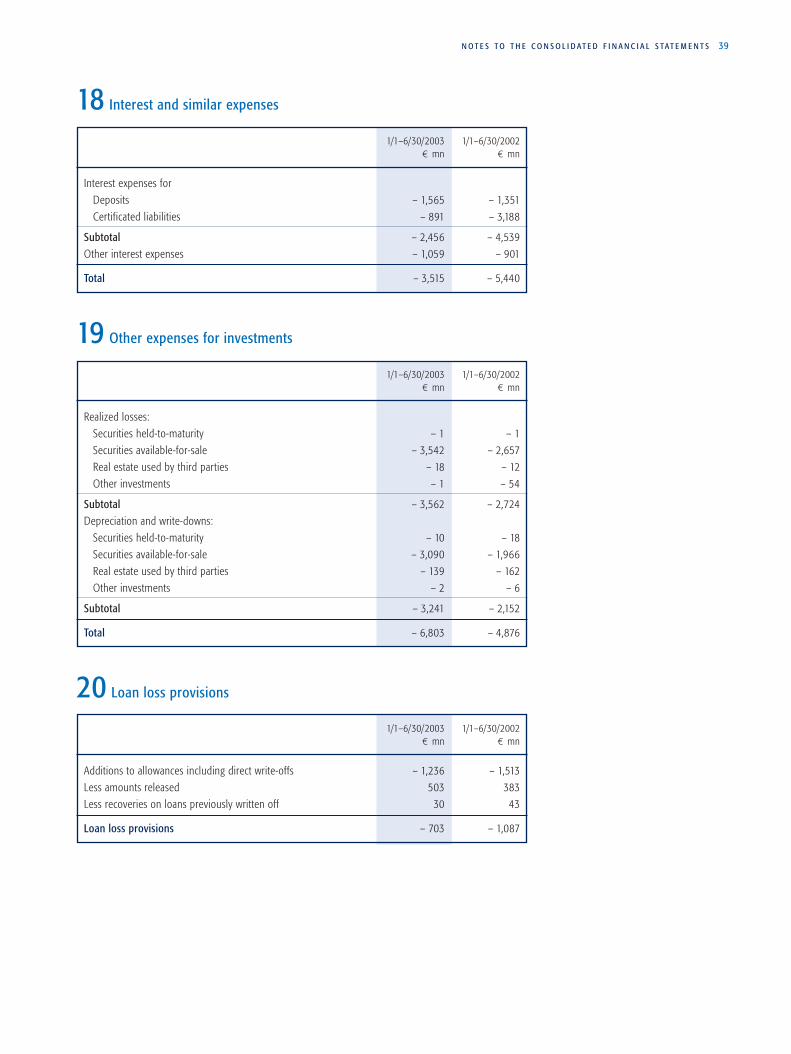
N O T E S T O T H E C O N S O L I D A T E D F I N A N C I A L S T A T E M E N T S 39
18 Interest and similar expenses
19 Other expenses for investments
20 Loan loss provisions
1/1–6/30/2003 1/1–6/30/2002¤ mn ¤ mn
Realized losses:
Securities held-to-maturity – 1 – 1
Securities available-for-sale – 3,542 – 2,657
Real estate used by third parties – 18 – 12
Other investments – 1 – 54
Subtotal – 3,562 – 2,724
Depreciation and write-downs:
Securities held-to-maturity – 10 – 18
Securities available-for-sale – 3,090 – 1,966
Real estate used by third parties – 139 – 162
Other investments – 2 – 6
Subtotal – 3,241 – 2,152
Total – 6,803 – 4,876
1/1–6/30/2003 1/1–6/30/2002¤ mn ¤ mn
Additions to allowances including direct write-offs – 1,236 – 1,513
Less amounts released 503 383
Less recoveries on loans previously written off 30 43
Loan loss provisions – 703 – 1,087
1/1–6/30/2003 1/1–6/30/2002¤ mn ¤ mn
Interest expenses for
Deposits – 1,565 – 1,351
Certificated liabilities – 891 – 3,188
Subtotal – 2,456 – 4,539
Other interest expenses – 1,059 – 901
Total – 3,515 – 5,440

A L L I A N Z G R O U P 40
21 Acquisition costs and administrative expenses
Acquisition costs and administrative expenses for the insurance segments include the personnel and operating expenses of the insurancebusiness allocated to the functional areas “Acquisition of insurance policies”, “Administration of insurance policies” and “Asset manage-ment”. Other personnel and operating expenses are reported under Insurance benefits (claims settlement expenses) and other expenses.
For the Banking business, all personnel and operating expenses are reported under “Acquisition costs and administrative expenses”.
22 Taxes
The tax charge shown in the income statement comprises the taxes actually charged to individual Group enterprises and changes in de-ferred tax assets and liabilities.
1/1–6/30/2003 1/1–6/30/2002¤ mn ¤ mn
Current taxes – 491 – 470
Deferred taxes 1,127 777
Subtotal 636 307
Other taxes – 29 – 32
Total 607 275
Property/Casualty*) Life/Health*)
1/1–6/30/2003 1/1–6/30/2002 1/1–6/30/2003 1/1–6/30/2002¤ mn ¤ mn ¤ mn ¤ mn
Acquisition costs
Payments – 3,410 – 3,443 – 1,865 – 1,830
Change in deferred acquisition costs 242 217 876 521
Subtotal – 3,168 – 3,226 – 989 – 1,309
Administrative expenses – 1,949 – 2,187 – 656 – 711
Underwriting costs (gross) – 5,117 – 5,413 – 1,645 – 2,020
Less commissions and profit-sharing received on reinsurance business ceded 419 507 56 116
Underwriting costs (net) – 4,698 – 4,906 – 1,589 – 1,904
Expenses for management of investment securities – 223 – 291 – 195 – 209
Total acquisition costs and administrative expenses – 4,921 – 5,197 – 1,784 – 2,113
Banking Business*) Asset Management*)
1/1–6/30/2003 1/1–6/30/2002 1/1–6/30/2003 1/1–6/30/2002¤ mn ¤ mn ¤ mn ¤ mn
Personnel expenses – 1,844 – 2,229 – 521 – 632
Operating expenses – 1,179 – 1,452 – 165 – 186
Fee and commission expenses – 214 – 146 – 219 – 248
Total acquisition costs and administrative expenses – 3,237 – 3,827 – 905 – 1,066
*) After eliminating intra-Group transactions between segments
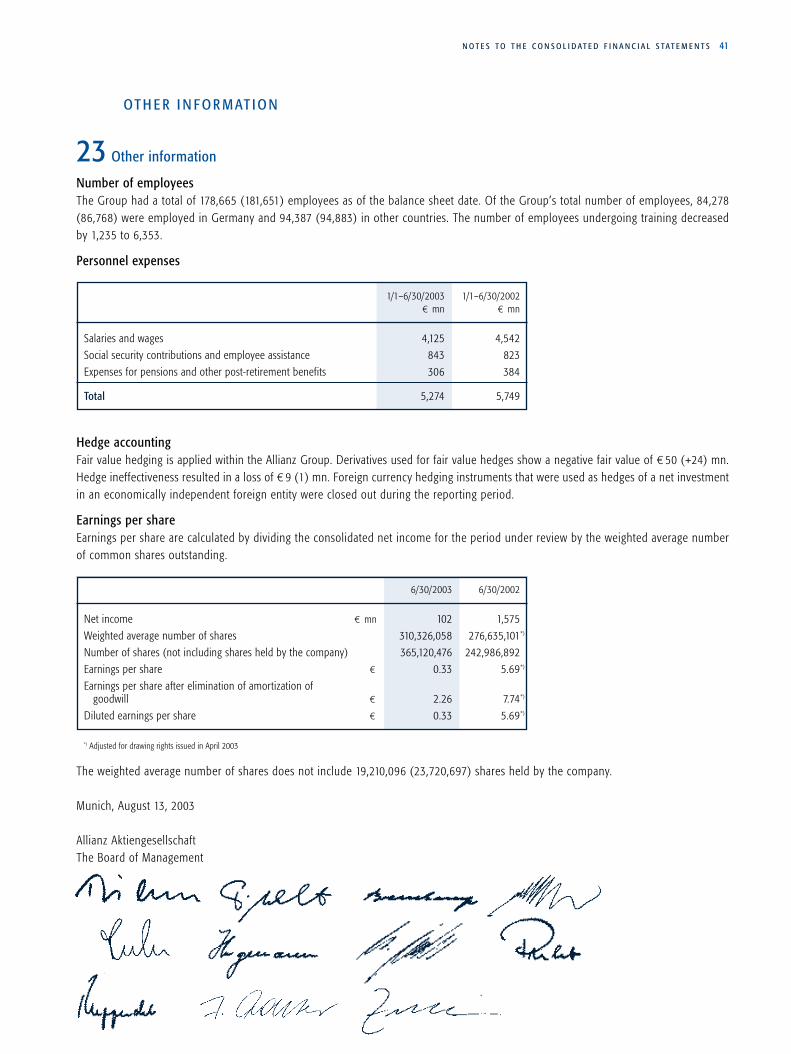
N O T E S T O T H E C O N S O L I D A T E D F I N A N C I A L S T A T E M E N T S 41
O T H E R I N F O R M AT I O N
23 Other information
Number of employeesThe Group had a total of 178,665 (181,651) employees as of the balance sheet date. Of the Group’s total number of employees, 84,278(86,768) were employed in Germany and 94,387 (94,883) in other countries. The number of employees undergoing training decreasedby 1,235 to 6,353.
Personnel expenses
Hedge accountingFair value hedging is applied within the Allianz Group. Derivatives used for fair value hedges show a negative fair value of ¤50 (+24) mn.Hedge ineffectiveness resulted in a loss of ¤9 (1) mn. Foreign currency hedging instruments that were used as hedges of a net investmentin an economically independent foreign entity were closed out during the reporting period.
Earnings per shareEarnings per share are calculated by dividing the consolidated net income for the period under review by the weighted average numberof common shares outstanding.
The weighted average number of shares does not include 19,210,096 (23,720,697) shares held by the company.
Munich, August 13, 2003
Allianz AktiengesellschaftThe Board of Management
1/1–6/30/2003 1/1–6/30/2002¤ mn ¤ mn
Salaries and wages 4,125 4,542
Social security contributions and employee assistance 843 823
Expenses for pensions and other post-retirement benefits 306 384
Total 5,274 5,749
6/30/2003 6/30/2002
Net income ¤ mn 102 1,575
Weighted average number of shares 310,326,058 276,635,101*)
Number of shares (not including shares held by the company) 365,120,476 242,986,892
Earnings per share ¤ 0.33 5.69*)
Earnings per share after elimination of amortization of goodwill ¤ 2.26 7.74*)
Diluted earnings per share ¤ 0.33 5.69*)
*) Adjusted for drawing rights issued in April 2003

Allianz AGKoeniginstrasse 2880802 MunichTelephone +49 89 38 00 00Telefax +49 89 34 99 41www.allianzgroup.com
UKZ
BE00
25Z0
(0/1
4) 8
.03