Embed Size (px)
Citation preview
1
Interim report Q3 2017 14 November 2017
2
Highlights
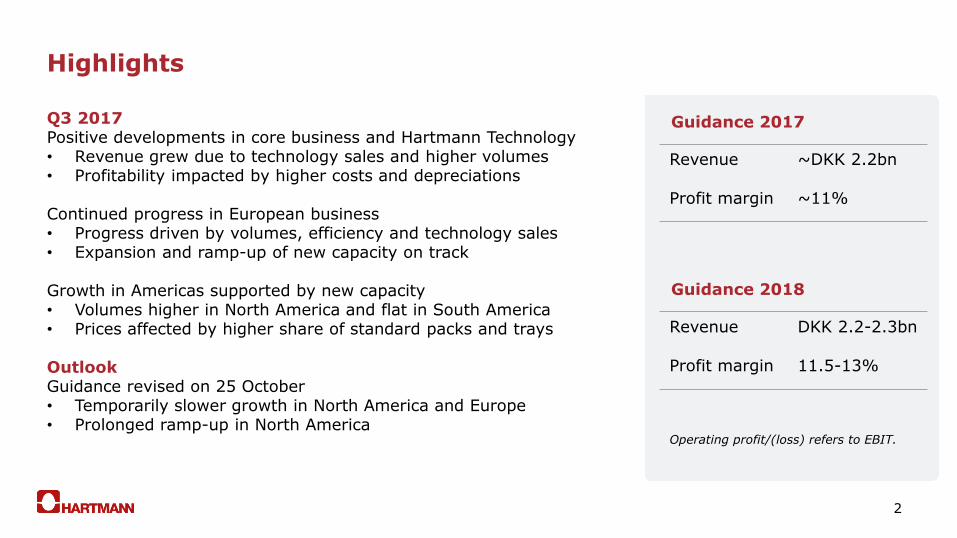
Q3 2017 Positive developments in core business and Hartmann Technology • Revenue grew due to technology sales and higher volumes • Profitability impacted by higher costs and depreciations
Continued progress in European business • Progress driven by volumes, efficiency and technology sales • Expansion and ramp-up of new capacity on track
Growth in Americas supported by new capacity • Volumes higher in North America and flat in South America • Prices affected by higher share of standard packs and trays Outlook Guidance revised on 25 October • Temporarily slower growth in North America and Europe • Prolonged ramp-up in North America
Guidance 2017
Revenue ~DKK 2.2bn
Profit margin ~11%
Operating profit/(loss) refers to EBIT.
Guidance 2018
Revenue DKK 2.2-2.3bn
Profit margin 11.5-13%
3
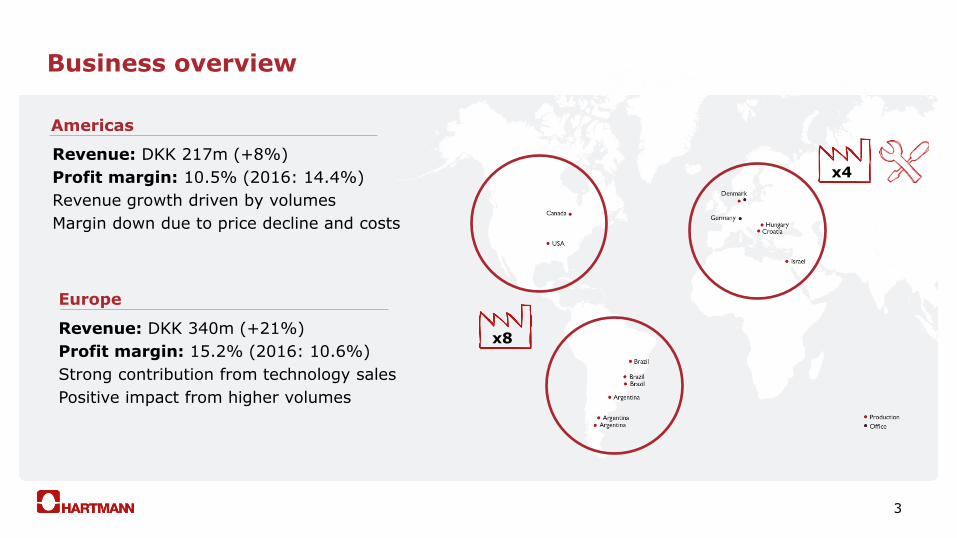
Business overview
x8
x4 Revenue: DKK 217m (+8%)
Profit margin: 10.5% (2016: 14.4%)
Revenue growth driven by volumes
Margin down due to price decline and costs
Americas
Europe
Revenue: DKK 340m (+21%)
Profit margin: 15.2% (2016: 10.6%)
Strong contribution from technology sales
Positive impact from higher volumes
4
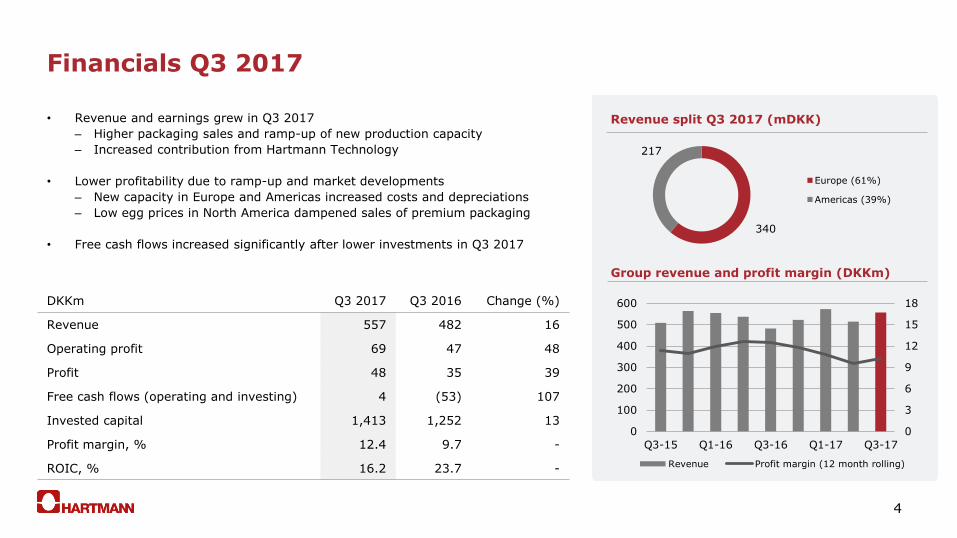
Financials Q3 2017
• Revenue and earnings grew in Q3 2017
– Higher packaging sales and ramp-up of new production capacity
– Increased contribution from Hartmann Technology
• Lower profitability due to ramp-up and market developments
– New capacity in Europe and Americas increased costs and depreciations
– Low egg prices in North America dampened sales of premium packaging
• Free cash flows increased significantly after lower investments in Q3 2017
Revenue split Q3 2017 (mDKK)
Group revenue and profit margin (DKKm)
DKKm Q3 2017 Q3 2016 Change (%)
Revenue 557 482 16
Operating profit 69 47 48
Profit 48 35 39
Free cash flows (operating and investing) 4 (53) 107
Invested capital 1,413 1,252 13
Profit margin, % 12.4 9.7 -
ROIC, % 16.2 23.7 -
340
217
Europe (61%)
Americas (39%)
0
3
6
9
12
15
18
0
100
200
300
400
500
600
Q3-15 Q1-16 Q3-16 Q1-17 Q3-17
Revenue Profit margin (12 month rolling)
5
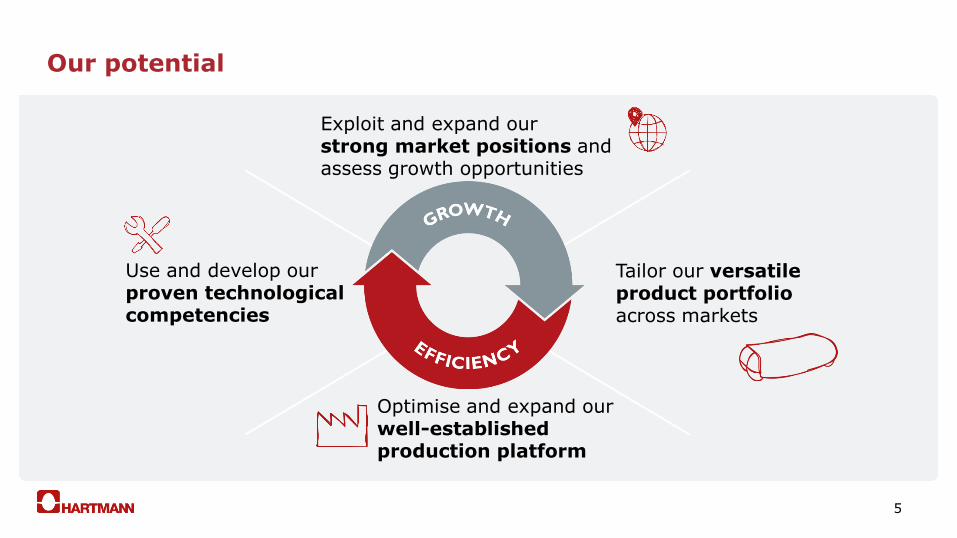
Our potential
Exploit and expand our strong market positions and assess growth opportunities
Optimise and expand our well-established production platform
Use and develop our proven technological competencies
Tailor our versatile product portfolio across markets
6
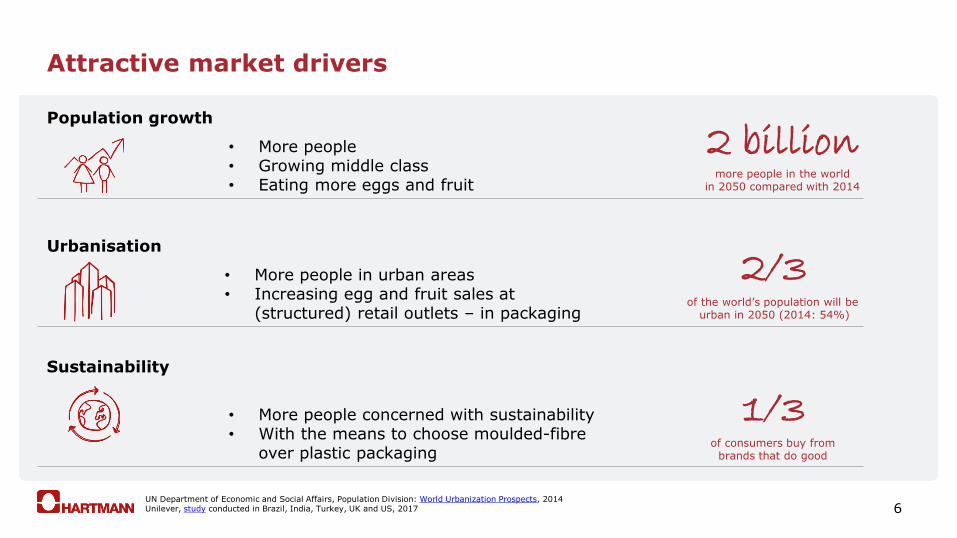
Attractive market drivers
Population growth
• More people • Growing middle class • Eating more eggs and fruit
Urbanisation
• More people in urban areas • Increasing egg and fruit sales at
(structured) retail outlets – in packaging
Sustainability
• More people concerned with sustainability • With the means to choose moulded-fibre
over plastic packaging
1/3 of consumers buy from
brands that do good
2/3 of the world’s population will be
urban in 2050 (2014: 54%)
2 billion more people in the world
in 2050 compared with 2014
UN Department of Economic and Social Affairs, Population Division: World Urbanization Prospects, 2014 Unilever, study conducted in Brazil, India, Turkey, UK and US, 2017
7
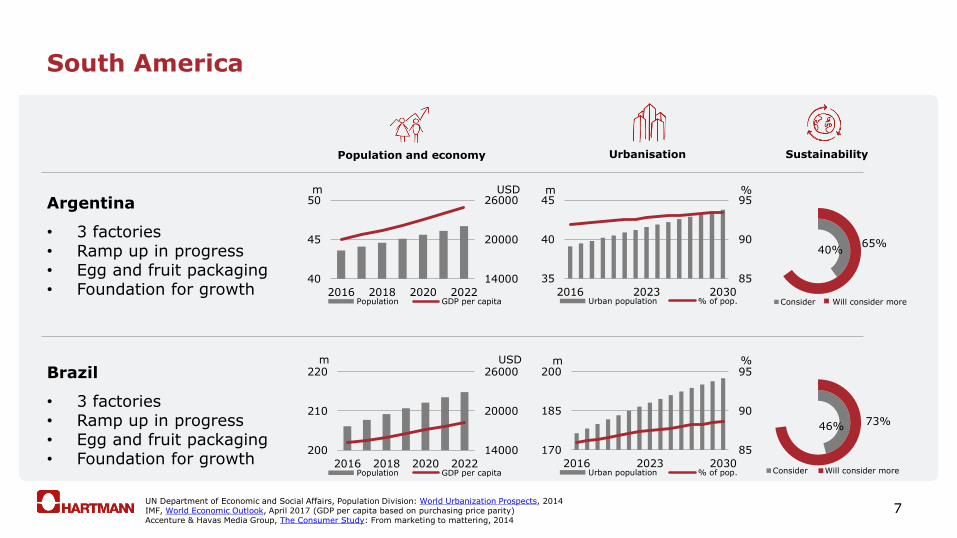
South America
Argentina
• 3 factories • Ramp up in progress • Egg and fruit packaging • Foundation for growth
40% 65%
Consider Will consider more
85
90
95
35
40
45
2016 2023 2030Urban population % of pop.
14000
20000
26000
40
45
50
2016 2018 2020 2022Population GDP per capita
Brazil
• 3 factories • Ramp up in progress • Egg and fruit packaging • Foundation for growth
46% 73%
Consider Will consider more
85
90
95
170
185
200
2016 2023 2030Urban population % of pop.
14000
20000
26000
200
210
220
2016 2018 2020 2022Population GDP per capita
Population and economy Urbanisation Sustainability
m
m
m
m %
% USD
USD
UN Department of Economic and Social Affairs, Population Division: World Urbanization Prospects, 2014 IMF, World Economic Outlook, April 2017 (GDP per capita based on purchasing price parity) Accenture & Havas Media Group, The Consumer Study: From marketing to mattering, 2014
8
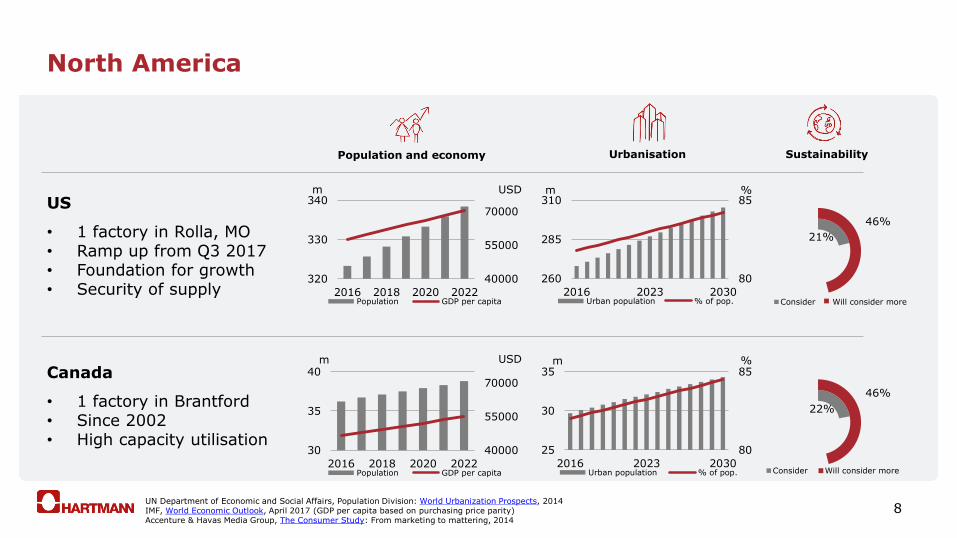
North America
US
• 1 factory in Rolla, MO • Ramp up from Q3 2017 • Foundation for growth • Security of supply
21%
46%
Consider Will consider more
80
85
260
285
310
2016 2023 2030Urban population % of pop.
40000
55000
70000
320
330
340
2016 2018 2020 2022Population GDP per capita
Canada
• 1 factory in Brantford • Since 2002 • High capacity utilisation
22%
46%
Consider Will consider more
80
85
25
30
35
2016 2023 2030Urban population % of pop.
40000
55000
70000
30
35
40
2016 2018 2020 2022Population GDP per capita
Population and economy Urbanisation Sustainability
m
m
m
m %
% USD
USD
UN Department of Economic and Social Affairs, Population Division: World Urbanization Prospects, 2014 IMF, World Economic Outlook, April 2017 (GDP per capita based on purchasing price parity) Accenture & Havas Media Group, The Consumer Study: From marketing to mattering, 2014
9
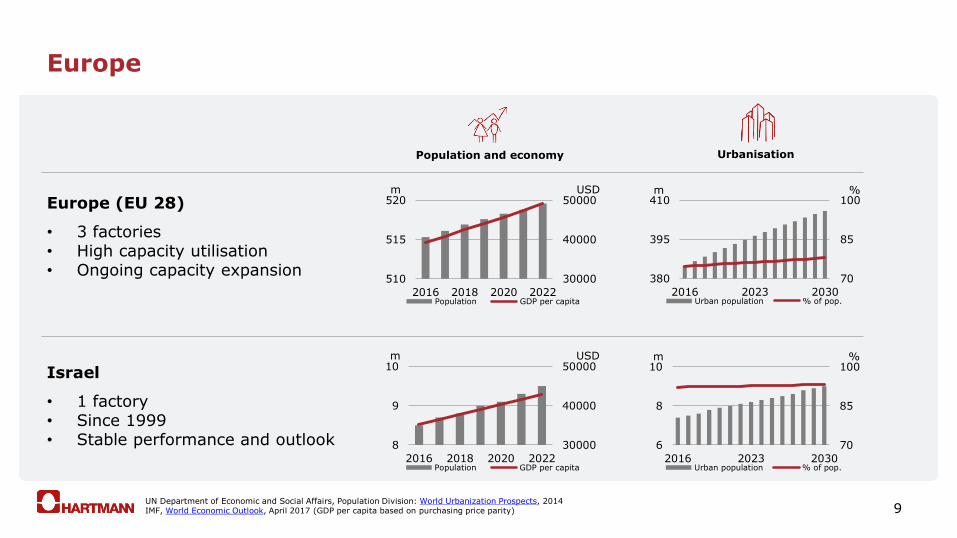
Europe
Europe (EU 28)
• 3 factories • High capacity utilisation • Ongoing capacity expansion
70
85
100
380
395
410
2016 2023 2030Urban population % of pop.
30000
40000
50000
510
515
520
2016 2018 2020 2022Population GDP per capita
Israel
• 1 factory • Since 1999 • Stable performance and outlook
Population and economy Urbanisation
m m % USD
UN Department of Economic and Social Affairs, Population Division: World Urbanization Prospects, 2014 IMF, World Economic Outlook, April 2017 (GDP per capita based on purchasing price parity)
30000
40000
50000
8
9
10
2016 2018 2020 2022Population GDP per capita
m USD
70
85
100
6
8
10
2016 2023 2030Urban population % of pop.
m %
10
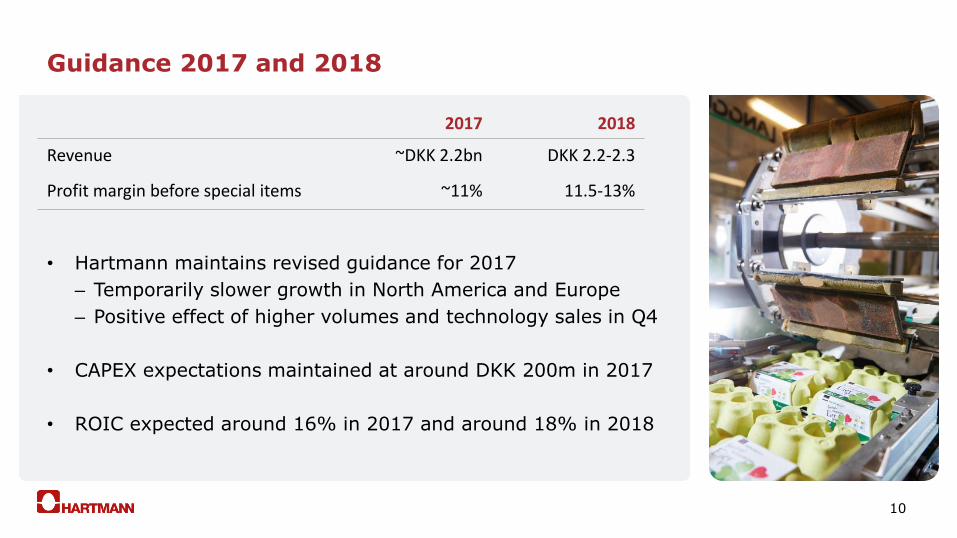
Guidance 2017 and 2018
2017 2018
Revenue ~DKK 2.2bn DKK 2.2-2.3
Profit margin before special items ~11% 11.5-13%
• Hartmann maintains revised guidance for 2017
– Temporarily slower growth in North America and Europe
– Positive effect of higher volumes and technology sales in Q4
• CAPEX expectations maintained at around DKK 200m in 2017
• ROIC expected around 16% in 2017 and around 18% in 2018
11
Q&A session
12
Contact information
Brødrene Hartmann A/S
Ørnegårdsvej 18
DK-2820 Gentofte
Tel. (+45) 45 97 00 00
Upcoming events
Annual report 2017 28 February 2018
Q1 report 2018 24 May 2018
Q2 report 2018 21 August 2018
Q3 report 2018 13 November 2018
Marianne Rørslev Bock, CFO
Ulrik Kolding Hartvig, CEO
13
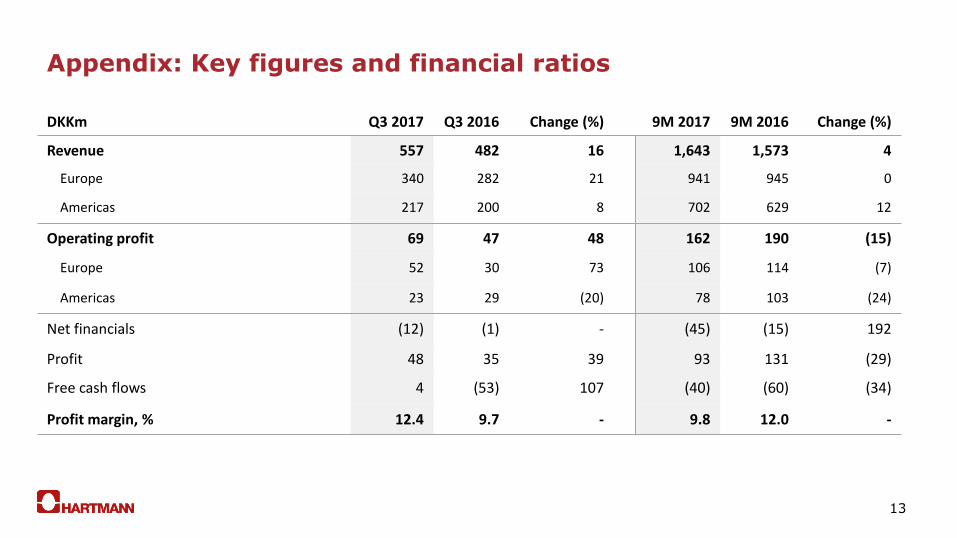
DKKm Q3 2017 Q3 2016 Change (%) 9M 2017 9M 2016 Change (%)
Revenue 557 482 16 1,643 1,573 4
Europe 340 282 21 941 945 0
Americas 217 200 8 702 629 12
Operating profit 69 47 48 162 190 (15)
Europe 52 30 73 106 114 (7)
Americas 23 29 (20) 78 103 (24)
Net financials (12) (1) - (45) (15) 192
Profit 48 35 39 93 131 (29)
Free cash flows 4 (53) 107 (40) (60) (34)
Profit margin, % 12.4 9.7 - 9.8 12.0 -
Appendix: Key figures and financial ratios
14
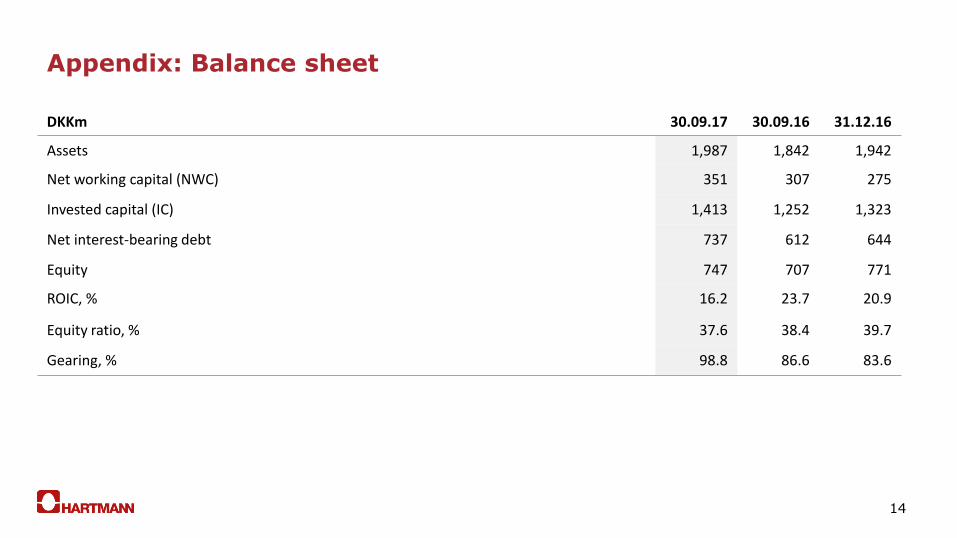
Appendix: Balance sheet
DKKm 30.09.17 30.09.16 31.12.16
Assets 1,987 1,842 1,942
Net working capital (NWC) 351 307 275
Invested capital (IC) 1,413 1,252 1,323
Net interest-bearing debt 737 612 644
Equity 747 707 771
ROIC, % 16.2 23.7 20.9
Equity ratio, % 37.6 38.4 39.7
Gearing, % 98.8 86.6 83.6
15
Forward-looking statements
Disclaimer
This presentation contains forward-looking statements reflecting management’s expectations of future events and must be viewed in the context of among other things the business environments and currency markets, which may cause actual results to deviate materially from those projected by Hartmann.