Embed Size (px)
Citation preview
Interim report Q1 2020
Tryg
A/S
· K
laus
dals
brov
ej 6
01, 2
750
Bal
leru
p, D
enm
ark
· CV
R n
o. 2
6460
212
Editor Investor Relations | Publication 21 April 2020 | Layout amo design | Proofreading Semantix A/S
TeleconferenceTryg is hosting a teleconference on 21 April 2020 at 10.00 CET. View the audio webcast at tryg.com. Financial analysts and investors may participate on tel. +44 (0) 333 300 9263 or +45 82 33 31 94, where questions can be asked. The teleconference will be held in English and can subsequently be viewed at tryg.com.
Contents
This report constitutes Tryg A/S’ consolidated financial statements and has not been audited. Unless otherwise indicated, all com-parisons are made to Q1 2020. Comparative figures for Q1 2019 are generally given in brackets.
Management’s review
3 Highlights
4 Income overview
5 Tryg’s results
8 Follow-up on strategic initiatives
10 Customer highlights
11 Private
12 Commercial
13 Corporate
14 Sweden
15 Investment activities
17 Solvency and dividend
18 Financial outlook
20 Financial calendar
Financial statements
22 Statement by the Supervisory Board
and the Executive Board
23 Financial highlights
24 Income statement
25 Statement of comprehensive income
26 Statement of financial position
27 Statement of changes in equity
29 Cash flow statement
30 Notes
37 Quarterly outline
Highlights
Customers
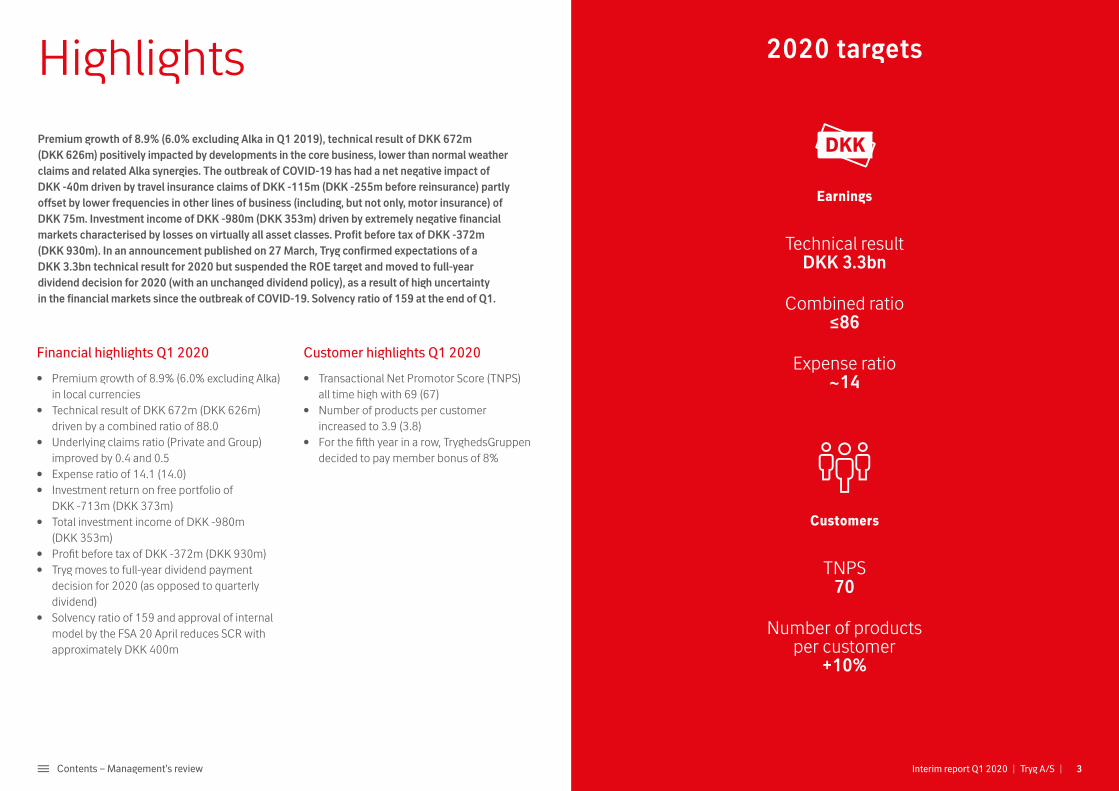
TNPS 70
Number of products per customer
+10%
DKK
Earnings
Technical result DKK 3.3bn
Combined ratio ≤86
Expense ratio ~14
2020 targets
3Contents – Management’s review Interim report Q1 2020 | Tryg A/S |
Premium growth of 8.9% (6.0% excluding Alka in Q1 2019), technical result of DKK 672m (DKK 626m) positively impacted by developments in the core business, lower than normal weather claims and related Alka synergies. The outbreak of COVID-19 has had a net negative impact of DKK -40m driven by travel insurance claims of DKK -115m (DKK -255m before reinsurance) partly offset by lower frequencies in other lines of business (including, but not only, motor insurance) of DKK 75m. Investment income of DKK -980m (DKK 353m) driven by extremely negative financial markets characterised by losses on virtually all asset classes. Profit before tax of DKK -372m (DKK 930m). In an announcement published on 27 March, Tryg confirmed expectations of a DKK 3.3bn technical result for 2020 but suspended the ROE target and moved to full-year dividend decision for 2020 (with an unchanged dividend policy), as a result of high uncertainty in the financial markets since the outbreak of COVID-19. Solvency ratio of 159 at the end of Q1.
Financial highlights Q1 2020
• Premium growth of 8.9% (6.0% excluding Alka) in local currencies
• Technical result of DKK 672m (DKK 626m) driven by a combined ratio of 88.0
• Underlying claims ratio (Private and Group) improved by 0.4 and 0.5
• Expense ratio of 14.1 (14.0)• Investment return on free portfolio of
DKK -713m (DKK 373m)• Total investment income of DKK -980m
(DKK 353m)• Profit before tax of DKK -372m (DKK 930m)• Tryg moves to full-year dividend payment
decision for 2020 (as opposed to quarterly dividend)
• Solvency ratio of 159 and approval of internal model by the FSA 20 April reduces SCR with approximately DKK 400m
Customer highlights Q1 2020
• Transactional Net Promotor Score (TNPS) all time high with 69 (67)
• Number of products per customer increased to 3.9 (3.8)
• For the fifth year in a row, TryghedsGruppen decided to pay member bonus of 8%
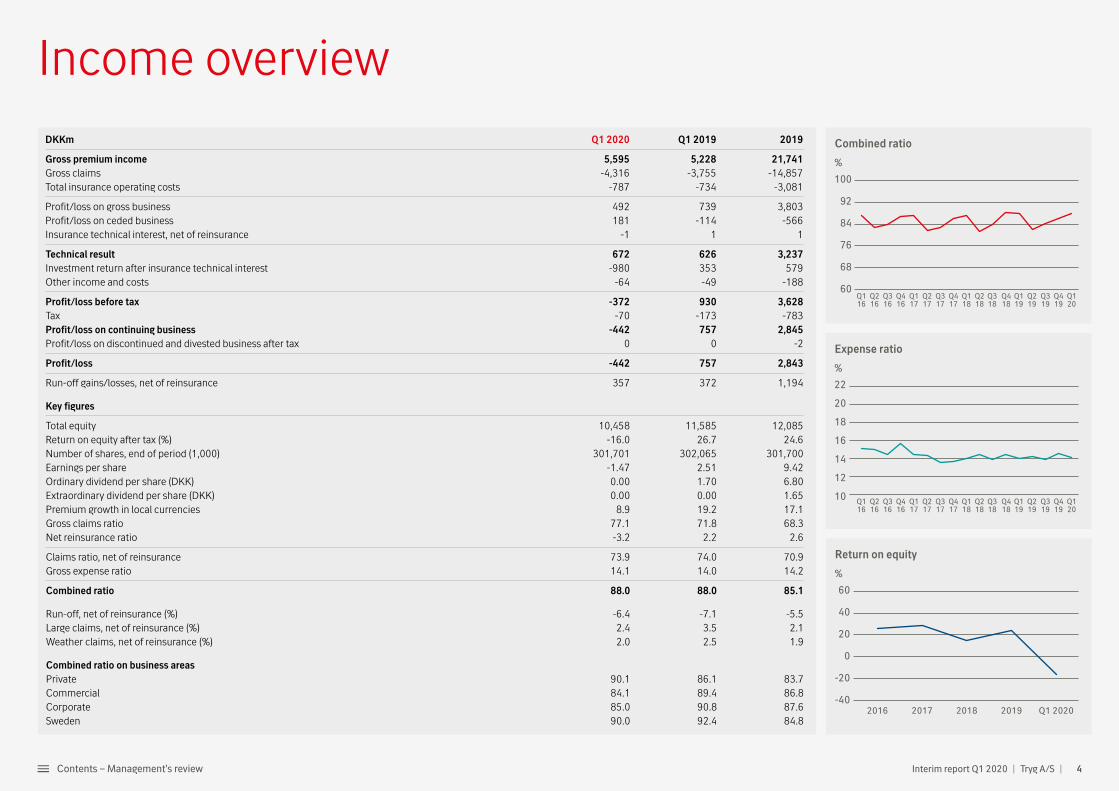
DKKm Q1 2020 Q1 2019 2019
Gross premium income 5,595 5,228 21,741Gross claims -4,316 -3,755 -14,857Total insurance operating costs -787 -734 -3,081
Profit/loss on gross business 492 739 3,803Profit/loss on ceded business 181 -114 -566Insurance technical interest, net of reinsurance -1 1 1
Technical result 672 626 3,237Investment return after insurance technical interest -980 353 579Other income and costs -64 -49 -188
Profit/loss before tax -372 930 3,628Tax -70 -173 -783Profit/loss on continuing business -442 757 2,845Profit/loss on discontinued and divested business after tax 0 0 -2
Profit/loss -442 757 2,843
Run-off gains/losses, net of reinsurance 357 372 1,194
Key figures
Total equity 10,458 11,585 12,085Return on equity after tax (%) -16.0 26.7 24.6Number of shares, end of period (1,000) 301,701 302,065 301,700Earnings per share -1.47 2.51 9.42Ordinary dividend per share (DKK) 0.00 1.70 6.80Extraordinary dividend per share (DKK) 0.00 0.00 1.65Premium growth in local currencies 8.9 19.2 17.1Gross claims ratio 77.1 71.8 68.3Net reinsurance ratio -3.2 2.2 2.6
Claims ratio, net of reinsurance 73.9 74.0 70.9Gross expense ratio 14.1 14.0 14.2
Combined ratio 88.0 88.0 85.1
Run-off, net of reinsurance (%) -6.4 -7.1 -5.5Large claims, net of reinsurance (%) 2.4 3.5 2.1Weather claims, net of reinsurance (%) 2.0 2.5 1.9
Combined ratio on business areas Private 90.1 86.1 83.7Commercial 84.1 89.4 86.8Corporate 85.0 90.8 87.6Sweden 90.0 92.4 84.8
Combined ratio
%
100
92
84
76
68
60Q419
Q120
Q118
Q417
Q317
Q217
Q117
Q416
Q316
Q216
Q116
Q318
Q218
Q119
Q418
Q219
Q319
Expense ratio
%
22
20
18
16
14
12
10 Q419
Q120
Q118
Q417
Q317
Q217
Q117
Q416
Q316
Q216
Q116
Q318
Q218
Q119
Q418
Q219
Q319
Return on equi�
%
60
40
20
0
-20
-402019201820172016 Q1 2020
Income overview
4Interim report Q1 2020 | Tryg A/S | Contents – Management’s review
adjusted for weather claims, large claims, run-offs, discount rate (to discount the claims provisions) and COVID-19 impact, was 0.4% better than in Q1 2019, confirming that under lying profitability con-tinues to improve. The Group’s underlying claims ratio improved by 0.5% compared to Q1 2019. New business is normally displaying a somewhat lower profitability than the “old” business, because of structural higher frequency and higher distribution costs, which is the reason why it is expected that the underlying claims ratio for Private is likely to show a slightly lower improvement going forward.
Tryg expects this to be offset by improvements in other parts of the business going forward, in particular the Corporate segment as a result of the actions taken there. In Corporate, Tryg is actively increasing prices and reducing exposure to unprofitable segments and expects an im - proved profitability in 2020 and onwards. Synergies from the Alka transaction amounted to DKK 42m (DKK 21m) of which DKK 15m stemmed from lower costs, DKK 17m from claims and DKK 10m from revenue initiatives.
The Transactional Net Promoter Score (TNPS) im-proved in the period from 67 in Q1 2019 to all time high 69 in Q1 2020, a positive development driven
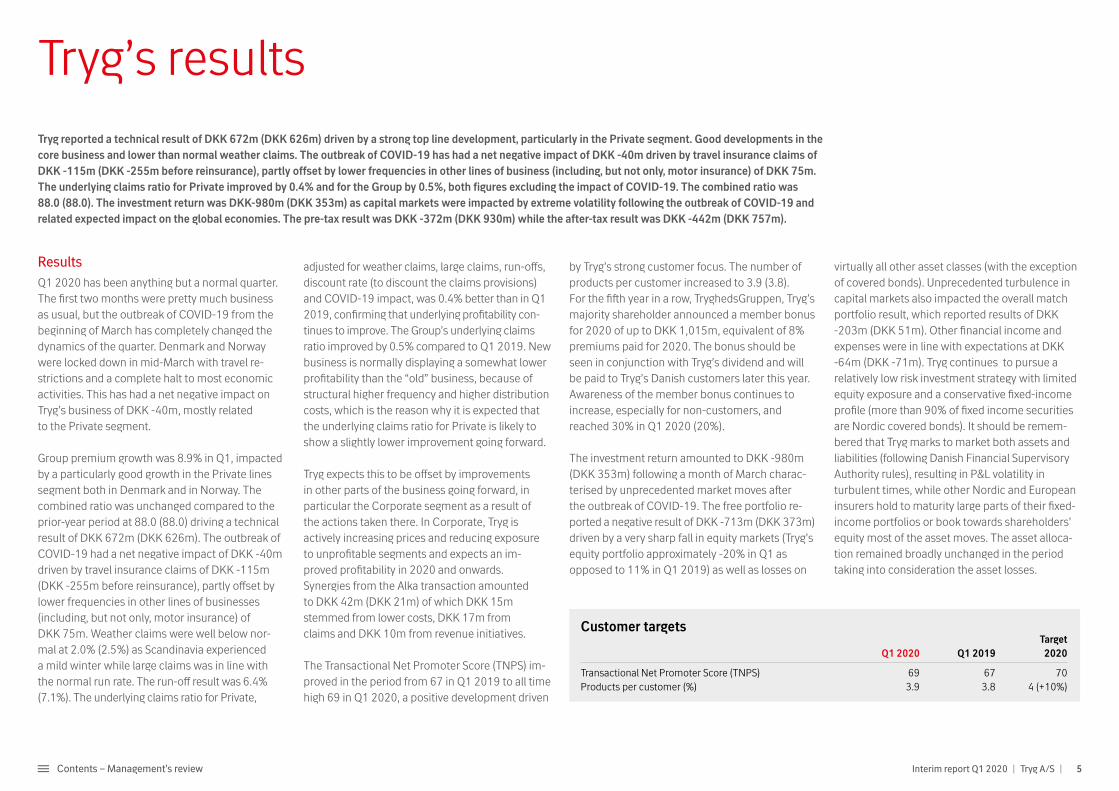
Tryg’s resultsTryg reported a technical result of DKK 672m (DKK 626m) driven by a strong top line development, particularly in the Private segment. Good developments in the core business and lower than normal weather claims. The outbreak of COVID-19 has had a net negative impact of DKK -40m driven by travel insurance claims of DKK -115m (DKK -255m before reinsurance), partly offset by lower frequencies in other lines of business (including, but not only, motor insurance) of DKK 75m. The underlying claims ratio for Private improved by 0.4% and for the Group by 0.5%, both figures excluding the impact of COVID-19. The combined ratio was 88.0 (88.0). The investment return was DKK-980m (DKK 353m) as capital markets were impacted by extreme volatility following the outbreak of COVID-19 and related expected impact on the global economies. The pre-tax result was DKK -372m (DKK 930m) while the after-tax result was DKK -442m (DKK 757m).
ResultsQ1 2020 has been anything but a normal quarter. The first two months were pretty much business as usual, but the outbreak of COVID-19 from the beginning of March has completely changed the dynamics of the quarter. Denmark and Norway were locked down in mid-March with travel re-strictions and a complete halt to most economic activities. This has had a net negative impact on Tryg’s business of DKK -40m, mostly related to the Private segment.
Group premium growth was 8.9% in Q1, impacted by a particularly good growth in the Private lines segment both in Denmark and in Norway. The combined ratio was unchanged compared to the prior-year period at 88.0 (88.0) driving a technical result of DKK 672m (DKK 626m). The outbreak of COVID-19 had a net negative impact of DKK -40m driven by travel insurance claims of DKK -115m (DKK -255m before reinsurance), partly offset by lower frequencies in other lines of businesses (including, but not only, motor insurance) of DKK 75m. Weather claims were well below nor-mal at 2.0% (2.5%) as Scandinavia experienced a mild winter while large claims was in line with the normal run rate. The run-off result was 6.4% (7.1%). The underlying claims ratio for Private,
Customer targets Target Q1 2020 Q1 2019 2020
Transactional Net Promoter Score (TNPS) 69 67 70Products per customer (%) 3.9 3.8 4 (+10%)
by Tryg’s strong customer focus. The number of products per customer increased to 3.9 (3.8). For the fifth year in a row, TryghedsGruppen, Tryg’s majority shareholder announced a member bonus for 2020 of up to DKK 1,015m, equivalent of 8% premiums paid for 2020. The bonus should be seen in conjunction with Tryg’s dividend and will be paid to Tryg’s Danish customers later this year. Awareness of the member bonus continues to increase, especially for non-customers, and reached 30% in Q1 2020 (20%).
The investment return amounted to DKK -980m (DKK 353m) following a month of March charac-terised by unprecedented market moves after the outbreak of COVID-19. The free portfolio re-ported a negative result of DKK -713m (DKK 373m) driven by a very sharp fall in equity markets (Tryg’s equity portfolio approximately -20% in Q1 as opposed to 11% in Q1 2019) as well as losses on
virtually all other asset classes (with the exception of covered bonds). Unprecedented turbulence in capital markets also impacted the overall match portfolio result, which reported results of DKK -203m (DKK 51m). Other financial income and expenses were in line with expectations at DKK -64m (DKK -71m). Tryg continues to pursue a relatively low risk investment strategy with limited equity exposure and a conservative fixed-income profile (more than 90% of fixed income securities are Nordic covered bonds). It should be remem-bered that Tryg marks to market both assets and liabilities (following Danish Financial Supervisory Authority rules), resulting in P&L volatility in turbulent times, while other Nordic and European insurers hold to maturity large parts of their fixed-income portfolios or book towards shareholders’ equity most of the asset moves. The asset alloca-tion remained broadly unchanged in the period taking into consideration the asset losses.
Interim report Q1 2020 | Tryg A/S | 5Contents – Management’s review
PremiumsGross premium income was DKK 5,595m (DKK 5,228m), corresponding to a growth of 8.9% in local currencies. The Private segment continued the trend from 2019 with a growth of 10.4%, helped by a much bigger portfolio in the beginning of 2020 compared to 2019 both in Denmark and in Norway. In Denmark growth was based on cross selling to existing customers, new customers from partner agreements like FDM and Danske Bank and contin-ued strong sales from our direct channels. Private Norway saw a continuation of strong sales from the partner agreements with OBOS and NITO, but also continued strong sale from the car channel Enter. Commercial showed an increase in premiums of 6.8% with a continued growth in Denmark of 3.9% and a more robust growth in Commercial Norway, partly due to acceptance of price hikes by larger commercial customers. The Corporate segments in-creased prices driving a growth of 4.9%, in Norway a top-line fall was observed following significant price hikes of approximately 12% for customers with renewal on 1 January 2020. Corporate Denmark saw high growth of 8.3% as a combination of good acceptance of price hikes of approximately 10% for customers up for renewal on 1 January. Growth in Tryg Garanti and a bigger portfolio in the beginning
of 2020 compared to 2019 should be highlighted when looking at the Corporate growth. Private Sweden had a growth of 4.9%, partly driven by price adjustments for motor insurance where profitability has been under pressure.
ClaimsThe claims ratio net of ceded business was 73.9 (74.0). The underlying claims ratio for Private, excluding large and weather claims, run-offs and discounting, was 73.9 (74.3), which was 0.4% better than the corresponding quarter in 2019. The Group’s underlying claims ratio improved to 75.5 (76.0). As mentioned previously, the outbreak of COVID-19 had a net negative impact of DKK -40m driven by travel insurance claims with gross claims of DKK 255m and net claims (after reinsurance) of DKK 115m. This was partly offset by lower frequen-cies in other lines of business (including, but not only, motor) of DKK 75m. In general, the biggest impact of the lower frequencies, coming from lower economic activity related to COVID-19, was reported in the Private segment, this impact has been excluded from the calculation of the underly-ing claims ratio. The current strong level of growth in the Private segment is likely to somewhat impact the underlying claims ratio, as the new business
does not initially have the same profitability as the old one. At the same time, profitability initiatives in the Corporate segment should help sustain the improvement in the Group's underlying claims ratio. Tryg continues to expect an improvement of the underlying claims ratio for FY 2020.
In Scandinavia, the weather has been relatively mild and better than a normal winter with sea-sonal storms that can be harsh at times. The winter was particularly mild in Denmark, but with a lot of rain and flooding in some areas. In Norway, the winter was broadly in line with the same period last year. Weather claims amounted to DKK 111m (DKK 131m), or 2.0% (2.5%) of the claims ratio. Large claims impacted the claims ratio negatively by 2.4% (3.5%), which is in line with the quarterly average expectation but below Q1 2019. Tryg’s assumptions for the full year are based on large claims (with no seasonality) of DKK 550m and weather claims (mostly in Q1 and Q4) of DKK 600m.
ExpensesThe expense ratio was 14.1 (14.0). At the capital markets day at the end of 2017, Tryg announced an expense ratio target for 2020 of around 14% as IT
investments and an increase in employee numbers (especially in the short term) are expected to be broadly offset by continuous efficiency improve-ments, driven primarily by lower distributions costs. Cost synergies of DKK 15m from the Alka transaction also improved the expense ratio, but at the same time the high premium growth in the Private business led to higher distribution costs.
Change to the Norwegian employees pension scheme Tryg agreed with the Norwegian employees to replace the defined benefit pension scheme (for employees with high seniority) with a market-based pension scheme in a life insurance company, having a total positive net impact of DKK 128m. Additionally, Tryg has decided to write down intan-gible assets related to software of DKK 107m and booked an extraordinary cost of DKK 20m related to COVID-19 to increase capacity for using IT systems and phones outside the offices to ensure that all employees could work from home. All the above figures have been booked in the technical result, approximately 2/3 of these against the op-erating expenses and 1/3 against the claims line.
Interim report Q1 2020 | Tryg A/S | 6Contents – Management’s review
Investment return Investment income was DKK -980m (DKK 353m). Q1 2020, and especially the month of March, will go down in history as one of the most difficult periods for capital markets ever experienced. The outbreak of COVID-19 has caused unprec-edented turmoil across virtually all asset classes, and hence the free portfolio posted a return of approximately -7% (3.5%), dragged down by a dra-matic fall in equity markets of approximately -20% (11%) as well as losses on nearly all fixed income asset classes. The free portfolio reported a result of DKK -713m (DKK 373m), while the match port-folio posted a result of DKK -203m (DKK 51m). Other financial income and expenses were DKK -64m (DKK -71m).
Profit before and after taxProfit before tax was DKK-372m (DKK 930m), while the profit after tax and discontinued activi-ties was DKK -442m (DKK 757m). The overall tax bill was DKK 70m (DKK 173m). It should be re-membered that capital gains on equities reduced the tax rate while the contrary happens in quarters of negative developments in equity markets.
Dividend and capitalAs mentioned in the stock exchange announce-ment published on 27 March, Tryg has decided to move to a full-year dividend decision for 2020 (as opposed to the quarterly dividend) following significantly increased uncertainty in the global economies and extreme developments in the capital markets since the outbreak of COVID-19. The solvency ratio was 159 at the end of Q1. Own funds were primarily impacted by the Q1 loss while the SCR primarily fell driven by a lower market risk capital charge driven by the sharp fall in equity markets.
Events after the Q1 2020 accounting periodTryg’s application for an updated partial internal model to the Danish FSA has been approved on April 20. The new model includes Tryg’s Swedish business which has led to an increased geo graphical diversification. Additionally, further improvements of the internal model have led to lower marginal capital requirement in particular for non-life risks. After the approval of the model, the SCR is approximately DKK 400m lower compared to the end of Q1. The solvency ratio, all else being equals, would therefore be 174%.
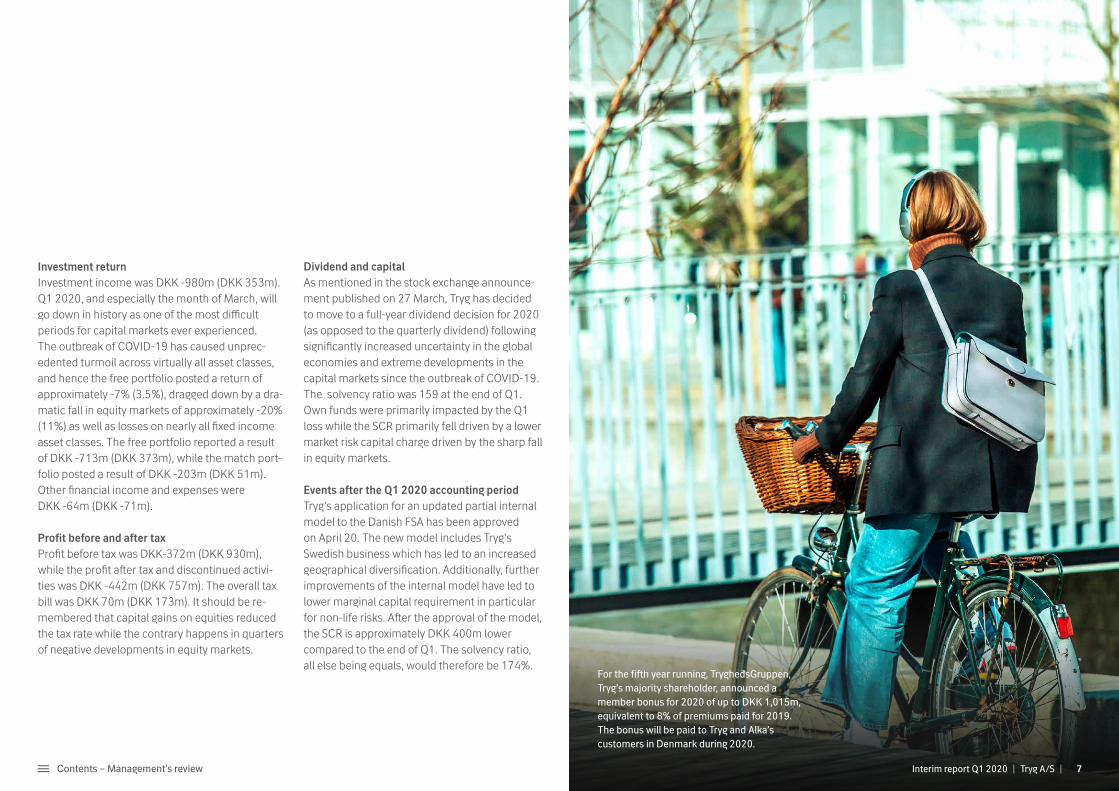
For the fifth year running, TryghedsGruppen, Tryg’s majority shareholder, announced a member bonus for 2020 of up to DKK 1,015m, equivalent to 8% of premiums paid for 2019. The bonus will be paid to Tryg and Alka’s customers in Denmark during 2020.
7Contents – Management’s review Interim report Q1 2020 | Tryg A/S |
Follow-up on strategic initiatives supporting the CMD targets for 2020
Tryg has defined four strategic initiatives for reaching its financial targets for 2020. In con-nection with the acquisition of Alka, the financial targets were updated and the CMD initiatives therefore include the Alka synergies.
Claims excellence Claims excellence continues to be an important driver for reaching the financial targets for 2020. The initiative focuses on bringing down claims costs by leveraging Tryg's procurement power to negotiate better supplier contracts, improving the claims process, and reducing the amount of fraud. Most of the benefits still come from car and house repairs, but Tryg also work with many other initiatives.
Across Tryg, there is a strong focus on improving the fraud detection capabilities. The result of this effort was fraud avoidance of more than DKK 20m in the first months of 2020.
In Denmark, the initiative “Tryg Tilbage” (Tryg Back to Work) has been expanded from workers' injury to personal liability. Tryg Tilbage ensures a per-sonal action plan developed by a multidisciplinary
team of experts, that focuses on fast recovery and hence fast transition for injured people to return to the labour market. This initiative is of particular importance for the individual who comes back to work and also benefits the company in which the person is employed.
In Norway, agreements have been made with eight independent law firms covering the entire country. The agreements ensure reduced claims costs, and that our customers have access to quality legal aid at competitive prices.
In Sweden, functional parts from damaged or defect vehicles are now sold to a third party to reduce the claims compensation. The initiative focuses on better sustainability in the claims pro-cess as well as on reducing the claims costs.
Digital empowerment of customers Tryg has a strong focus on digital empowerment of customers, underpinned by the fact that most customers prefer digital communication. The main driver for high satisfaction in digital solu-tions is speedy customer service.
In Q1 2020, 63% of the customer contacts were digital. With the digital solutions, the customer is offered a wide range of self-service possibilities, such as assessing which products and coverage the customer need, buying insurance products, making changes to products and reporting claims. In Q1 2020, more than 500.000 customers in Denmark logged in and used the digital self- service possibilities.
Claims reported online amounted to approxi-mately 50% of all claims reported, and 37% of these were processed fully automatically. A part of these fully automated claims was delivered via the new claims handling system.
Product & service innovation Tryg has a strong focus on developing and selling new products and services, and our pipeline of new products continues to remain strong.
In Q1 2020, “Tryg Bilpleje” (Tryg Car service) was launched in Denmark for private customers. For a monthly fee, the product offers access to light service car maintenance. This initiative also supports Tryg’s focus on claims prevention.
Approximately 700 customers bought this product within the first month.
Tryg has also developed a new service in co-operation with flyhjælp.dk – a third-party provider who handles the recourse process when flights are cancelled or delayed, ensuring that customers receive compensation quickly. The product is part of Tryg's insurance products offered via credit cards through Tryg's partnerships and has a potential customer base of approximately eight million people.
Distribution efficiency The initiative is aimed at making distribution in Tryg more efficient and relevant, with a targeted effect of DKK 150m by the end of 2020. The focus continues to be on optimisation of the channel mix to ensure the most optimal customer experi-ence, and at the same time ensuring distribution efficiency.
The use of agents is a major driver in this initia-tive across the different business units and will continue to be so throughout 2020.
Interim report Q1 2020 | Tryg A/S | 8Contents – Management’s review
Follow-up on Alka synergies
DKK
300
250
200
150
100
50
0
Targeted synergies 2021
Realised synergies FY 2019Realised synergies in Q1 2020
Total synergiesRevenueCostClaims
135
3962
31
132
300
9075
1722
1547 10
21
42
90
Another driver for improving the distribution efficiency is partnerships. Tryg has formed several new partnerships in the past years, which gradu-ally are beginning to have a positive impact on the distribution efficiency. The partnership with Dan-ske Bank has started very well, generating good leads for both Private and Commercial customers in Denmark and Norway. Also, the partner agree-ment with the Norwegian Society of Engineers and Technology (NITO) has generated very good leads, increasing sales and retention levels.
In Q1 2020, especially the Private segments in Denmark and Norway have improved the distribution efficiency, corresponding to an effect of approximately DKK 10m.
Alka synergiesIn connection with the acquisition of Alka, Tryg has communicated synergies of DKK 300m by the end of 2021. The realisation of synergies is developing as expected with total realised
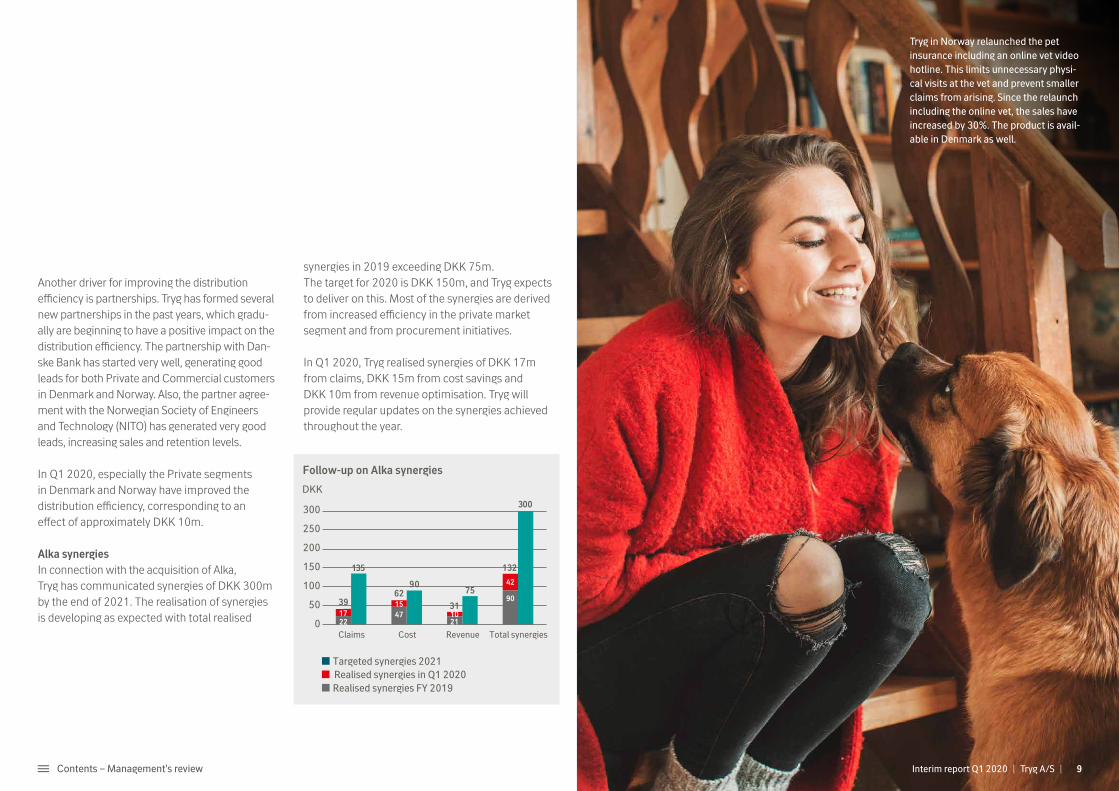
Tryg in Norway relaunched the pet insurance including an online vet video hotline. This limits unnecessary physi-cal visits at the vet and prevent smaller claims from arising. Since the relaunch including the online vet, the sales have increased by 30%. The product is avail-able in Denmark as well.
synergies in 2019 exceeding DKK 75m. The target for 2020 is DKK 150m, and Tryg expects to deliver on this. Most of the synergies are derived from increased efficiency in the private market segment and from procurement initiatives.
In Q1 2020, Tryg realised synergies of DKK 17m from claims, DKK 15m from cost savings and DKK 10m from revenue optimisation. Tryg will provide regular updates on the synergies achieved throughout the year.
9Contents – Management’s review Interim report Q1 2020 | Tryg A/S |

Customer highlights
Member bonusFor the fifth year running, Tryg’s majority share-holder, TryghedsGruppen, announced a member bonus of up to DKK 1,015m equivalent to 8% of premiums paid for 2019 to Tryg and Alka customers in Denmark. Awareness and under-standing of this model continue to increase, which is especially reflected by rentention rates improving in all areas in Q1 2020. The awareness of the member bonus increased among custom-ers from 69% in Q1 2019 to 70% in Q1 2020, and the awareness amongst non-customers increased significantly from 20% to 30%.
Customer targets for 2020As part of the 2020 strategy, Tryg maintains a strong focus on customer targets. The Trans-actional Net Promoter Score (TNPS) improved from 67 in Q1 2019 to 69 in Q1 2020. Also, the number of products per customer increased to 3.9 (3.8), which is a satisfactory development.
In Q1 2020, the amount of customer interactions increased significantly due to the outbreak of the COVID-19. Throughout this period, it has been a key priority for Tryg to maintain high customer satisfaction and it was therefore very satisfac-tory to see an increase in the overall TNPS score driven by the fact that Tryg has used insights and experience to ensure a historically high customer
service. In Sweden, new customer feedback and TNPS tools have been implemented in inbound, outbound and claims to improve the quality of customer feedback. This has resulted in a positive increase in TNPS in both sales and claims teams.
Tryg Bilpleje (Tryg car service) – new digitally driven prevention productIn Q1 2020, Tryg launched a new product called ’Bilpleje’ consisting of different light car services such as car wash, change of tires, and seasonal car check-up – all in one package. The product is 100% digitally which means that the product is purchased online and booking of different car services is also completed online.
This is an example of how Tryg is creating digital solutions for our customers with a view to sup-porting Tryg’s overall strategic initiatives to create innovative products and services and becoming more digital, which is increasingly important for customers.
Innovative partnershipsQ1 2020 was marked by a new innovative partner - ship with Arbejdernes Landsbank to further strength-en the distribution and customer service. The partnership between Arbejdernes Landsbank and Commercial Denmark took effect on 1 January 2020 and will offer insurance solutions primarily to SME.
10Contents – Management’s review Interim report Q1 2020 | Tryg A/S |
Private
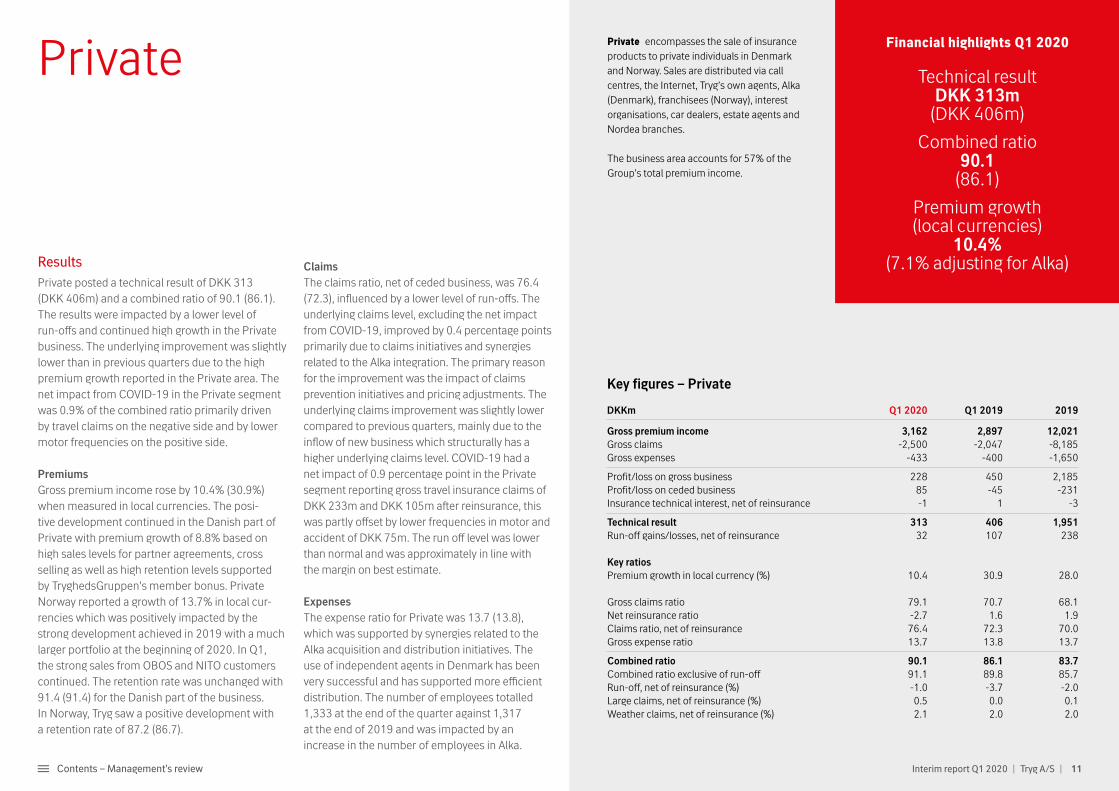
Results Private posted a technical result of DKK 313 (DKK 406m) and a combined ratio of 90.1 (86.1). The results were impacted by a lower level of run-offs and continued high growth in the Private business. The underlying improvement was slightly lower than in previous quarters due to the high premium growth reported in the Private area. The net impact from COVID-19 in the Private segment was 0.9% of the combined ratio primarily driven by travel claims on the negative side and by lower motor frequencies on the positive side.
Premiums Gross premium income rose by 10.4% (30.9%) when measured in local currencies. The posi-tive development continued in the Danish part of Private with premium growth of 8.8% based on high sales levels for partner agreements, cross selling as well as high retention levels supported by TryghedsGruppen’s member bonus. Private Norway reported a growth of 13.7% in local cur-rencies which was positively impacted by the strong development achieved in 2019 with a much larger portfolio at the beginning of 2020. In Q1, the strong sales from OBOS and NITO customers continued. The retention rate was unchanged with 91.4 (91.4) for the Danish part of the business. In Norway, Tryg saw a positive development with a retention rate of 87.2 (86.7).
Claims The claims ratio, net of ceded business, was 76.4 (72.3), influenced by a lower level of run-offs. The underlying claims level, excluding the net impact from COVID-19, improved by 0.4 percentage points primarily due to claims initiatives and synergies related to the Alka integration. The primary reason for the improvement was the impact of claims prevention initiatives and pricing adjustments. The underlying claims improvement was slightly lower compared to previous quarters, mainly due to the inflow of new business which structurally has a higher underlying claims level. COVID-19 had a net impact of 0.9 percentage point in the Private segment reporting gross travel insurance claims of DKK 233m and DKK 105m after reinsurance, this was partly offset by lower frequencies in motor and accident of DKK 75m. The run off level was lower than normal and was approximately in line with the margin on best estimate. ExpensesThe expense ratio for Private was 13.7 (13.8), which was supported by synergies related to the Alka acquisition and distribution initiatives. The use of independent agents in Denmark has been very successful and has supported more efficient distribution. The number of employees totalled 1,333 at the end of the quarter against 1,317 at the end of 2019 and was impacted by an increase in the number of employees in Alka.
Financial highlights Q1 2020
Technical resultDKK 313m
(DKK 406m)
Combined ratio90.1
(86.1)
Premium growth (local currencies)
10.4% (7.1% adjusting for Alka)
Key figures – Private
DKKm Q1 2020 Q1 2019 2019
Gross premium income 3,162 2,897 12,021Gross claims -2,500 -2,047 -8,185Gross expenses -433 -400 -1,650
Profit/loss on gross business 228 450 2,185Profit/loss on ceded business 85 -45 -231Insurance technical interest, net of reinsurance -1 1 -3
Technical result 313 406 1,951Run-off gains/losses, net of reinsurance 32 107 238
Key ratios Premium growth in local currency (%) 10.4 30.9 28.0
Gross claims ratio 79.1 70.7 68.1Net reinsurance ratio -2.7 1.6 1.9Claims ratio, net of reinsurance 76.4 72.3 70.0Gross expense ratio 13.7 13.8 13.7
Combined ratio 90.1 86.1 83.7Combined ratio exclusive of run-off 91.1 89.8 85.7Run-off, net of reinsurance (%) -1.0 -3.7 -2.0Large claims, net of reinsurance (%) 0.5 0.0 0.1Weather claims, net of reinsurance (%) 2.1 2.0 2.0
Private encompasses the sale of insurance products to private individuals in Denmark and Norway. Sales are distributed via call centres, the Internet, Tryg’s own agents, Alka (Denmark), franchisees (Norway), interest organisations, car dealers, estate agents and Nordea branches.
The business area accounts for 57% of the Group’s total premium income.
Interim report Q1 2020 | Tryg A/S | 11Contents – Management’s review
Commercial
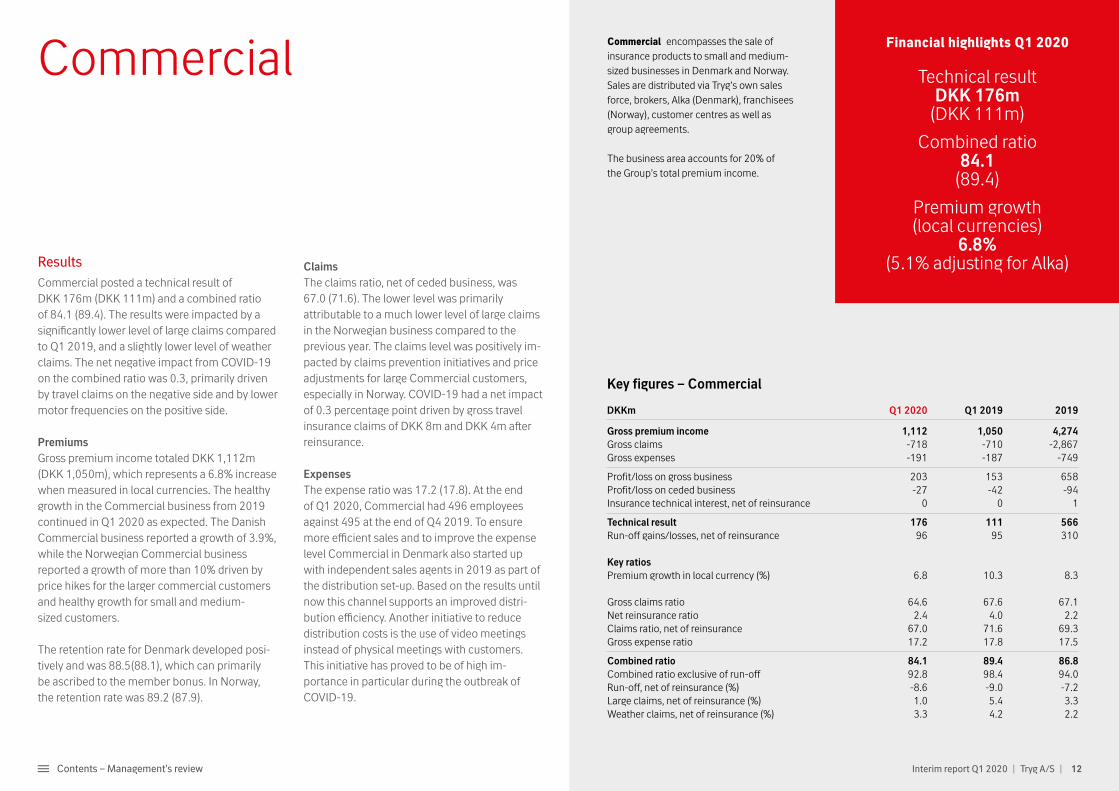
Results Commercial posted a technical result of DKK 176m (DKK 111m) and a combined ratio of 84.1 (89.4). The results were impacted by a significantly lower level of large claims compared to Q1 2019, and a slightly lower level of weather claims. The net negative impact from COVID-19 on the combined ratio was 0.3, primarily driven by travel claims on the negative side and by lower motor frequencies on the positive side.
Premiums Gross premium income totaled DKK 1,112m (DKK 1,050m), which represents a 6.8% increase when measured in local currencies. The healthy growth in the Commercial business from 2019 continued in Q1 2020 as expected. The Danish Commercial business reported a growth of 3.9%, while the Norwegian Commercial business reported a growth of more than 10% driven by price hikes for the larger commercial customers and healthy growth for small and medium- sized customers.
The retention rate for Denmark developed posi-tively and was 88.5(88.1), which can primarily be ascribed to the member bonus. In Norway, the retention rate was 89.2 (87.9).
Claims The claims ratio, net of ceded business, was 67.0 (71.6). The lower level was primarily attribut able to a much lower level of large claims in the Norwegian business compared to the previous year. The claims level was positively im-pacted by claims prevention initiatives and price adjustments for large Commercial customers, especially in Norway. COVID-19 had a net impact of 0.3 percentage point driven by gross travel insurance claims of DKK 8m and DKK 4m after reinsurance.
ExpensesThe expense ratio was 17.2 (17.8). At the end of Q1 2020, Commercial had 496 employees against 495 at the end of Q4 2019. To ensure more efficient sales and to improve the expense level Commercial in Denmark also started up with independent sales agents in 2019 as part of the distribution set-up. Based on the results until now this channel supports an improved distri-bution efficiency. Another initiative to reduce distribution costs is the use of video meetings instead of physical meetings with customers. This initiative has proved to be of high im-portance in particular during the outbreak of COVID-19.
Key figures – Commercial
DKKm Q1 2020 Q1 2019 2019
Gross premium income 1,112 1,050 4,274Gross claims -718 -710 -2,867Gross expenses -191 -187 -749
Profit/loss on gross business 203 153 658Profit/loss on ceded business -27 -42 -94Insurance technical interest, net of reinsurance 0 0 1
Technical result 176 111 566Run-off gains/losses, net of reinsurance 96 95 310
Key ratios Premium growth in local currency (%) 6.8 10.3 8.3
Gross claims ratio 64.6 67.6 67.1Net reinsurance ratio 2.4 4.0 2.2Claims ratio, net of reinsurance 67.0 71.6 69.3Gross expense ratio 17.2 17.8 17.5
Combined ratio 84.1 89.4 86.8Combined ratio exclusive of run-off 92.8 98.4 94.0Run-off, net of reinsurance (%) -8.6 -9.0 -7.2Large claims, net of reinsurance (%) 1.0 5.4 3.3Weather claims, net of reinsurance (%) 3.3 4.2 2.2
Commercial encompasses the sale of insurance products to small and medium-sized businesses in Denmark and Norway. Sales are distributed via Tryg’s own sales force, brokers, Alka (Denmark), franchisees (Norway), customer centres as well as group agreements.
The business area accounts for 20% of the Group’s total premium income.
Financial highlights Q1 2020
Technical resultDKK 176m
(DKK 111m)
Combined ratio84.1
(89.4)
Premium growth (local currencies)
6.8% (5.1% adjusting for Alka)
Interim report Q1 2020 | Tryg A/S | 12Contents – Management’s review
Corporate
Key figures – Corporate
DKKm Q1 2020 Q1 2019 2019
Gross premium income 968 966 3,979Gross claims -837 -734 -2,816Gross expenses -102 -93 -415
Profit/loss on gross business 28 139 748Profit/loss on ceded business 117 -50 -255Insurance technical interest, net of reinsurance 0 0 2
Technical result 145 89 496Run-off gains/losses, net of reinsurance 177 140 407
Key ratios Premium growth in local currency (%) 4.9 0.5 2.0
Gross claims ratio 86.5 76.0 70.8Net reinsurance ratio -12.1 5.2 6.4Claims ratio, net of reinsurance 74.4 81.2 77.2Gross expense ratio 10.6 9.6 10.4
Combined ratio 85.0 90.8 87.6Combined ratio exclusive of run-off 103.3 105.3 97.8Run-off, net of reinsurance (%) -18.3 -14.5 -10.2Large claims, net of reinsurance (%) 11.2 12.8 7.7Weather claims, net of reinsurance (%) 0.6 2.1 1.8
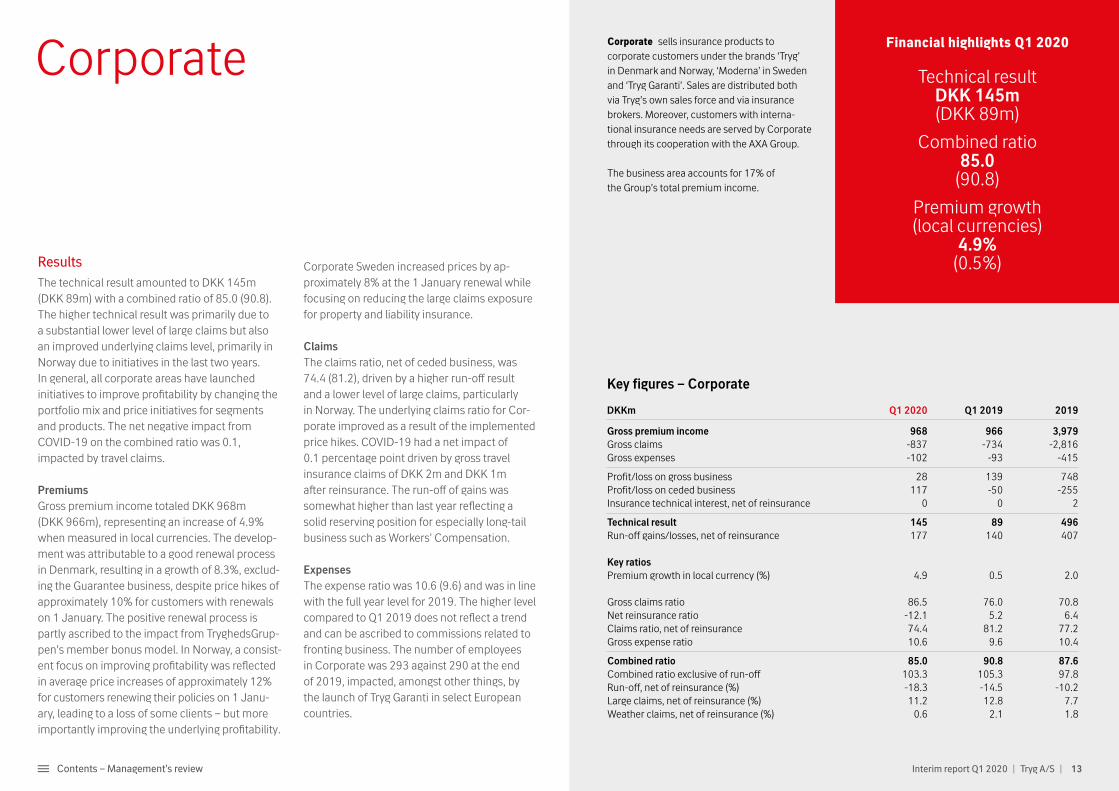
Corporate sells insurance products to corporate customers under the brands ‘Tryg’ in Denmark and Norway, ‘Moderna’ in Sweden and ‘Tryg Garanti’. Sales are distributed both via Tryg’s own sales force and via insurance brokers. Moreover, customers with interna-tional insurance needs are served by Corporate through its cooperation with the AXA Group.
The business area accounts for 17% of the Group’s total premium income.
Results The technical result amounted to DKK 145m (DKK 89m) with a combined ratio of 85.0 (90.8). The higher technical result was primarily due to a substantial lower level of large claims but also an improved underlying claims level, primarily in Norway due to initiatives in the last two years. In general, all corporate areas have launched initiatives to improve profitability by changing the port folio mix and price initiatives for segments and products. The net negative impact from COVID-19 on the combined ratio was 0.1, im pacted by travel claims.
Premiums Gross premium income totaled DKK 968m (DKK 966m), representing an increase of 4.9% when measured in local currencies. The develop-ment was attributable to a good renewal process in Denmark, resulting in a growth of 8.3%, exclud-ing the Guarantee business, despite price hikes of approximately 10% for customers with renewals on 1 January. The positive renewal process is partly ascribed to the impact from TryghedsGrup-pen’s member bonus model. In Norway, a consist-ent focus on improving profitability was reflected in average price increases of approximately 12% for customers renewing their policies on 1 Janu-ary, leading to a loss of some clients – but more importantly improving the under lying profitability.
Corporate Sweden increased prices by ap-proximately 8% at the 1 January renewal while focusing on reducing the large claims exposure for property and liability insurance.
Claims The claims ratio, net of ceded business, was 74.4 (81.2), driven by a higher run-off result and a lower level of large claims, particularly in Norway. The underlying claims ratio for Cor-porate improved as a result of the implemented price hikes. COVID-19 had a net impact of 0.1 percentage point driven by gross travel insurance claims of DKK 2m and DKK 1m after reinsurance. The run-off of gains was somewhat higher than last year reflecting a solid reserving position for especially long-tail business such as Workers' Compensation.
Expenses The expense ratio was 10.6 (9.6) and was in line with the full year level for 2019. The higher level compared to Q1 2019 does not reflect a trend and can be ascribed to commissions related to fronting business. The number of employees in Corporate was 293 against 290 at the end of 2019, impacted, amongst other things, by the launch of Tryg Garanti in select European countries.
Financial highlights Q1 2020
Technical resultDKK 145m(DKK 89m)
Combined ratio85.0
(90.8)
Premium growth (local currencies)
4.9% (0.5%)
Interim report Q1 2020 | Tryg A/S | 13Contents – Management’s review
Sweden
Key figures – Sweden
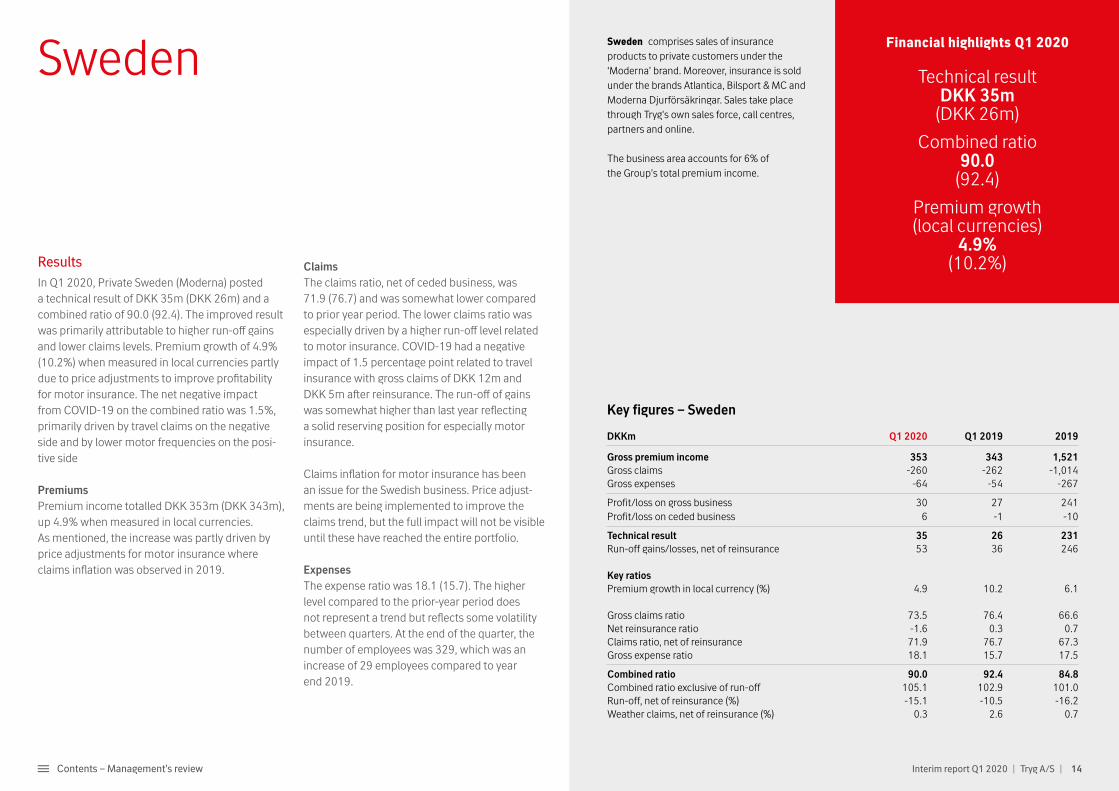
DKKm Q1 2020 Q1 2019 2019
Gross premium income 353 343 1,521Gross claims -260 -262 -1,014Gross expenses -64 -54 -267
Profit/loss on gross business 30 27 241Profit/loss on ceded business 6 -1 -10
Technical result 35 26 231Run-off gains/losses, net of reinsurance 53 36 246
Key ratios Premium growth in local currency (%) 4.9 10.2 6.1
Gross claims ratio 73.5 76.4 66.6Net reinsurance ratio -1.6 0.3 0.7Claims ratio, net of reinsurance 71.9 76.7 67.3Gross expense ratio 18.1 15.7 17.5
Combined ratio 90.0 92.4 84.8Combined ratio exclusive of run-off 105.1 102.9 101.0Run-off, net of reinsurance (%) -15.1 -10.5 -16.2Weather claims, net of reinsurance (%) 0.3 2.6 0.7
Sweden comprises sales of insurance products to private customers under the ‘Moderna’ brand. Moreover, insurance is sold under the brands Atlantica, Bilsport & MC and Moderna Djurförsäkringar. Sales take place through Tryg's own sales force, call centres, partners and online.
The business area accounts for 6% of the Group’s total premium income.
Results In Q1 2020, Private Sweden (Moderna) posted a technical result of DKK 35m (DKK 26m) and a combined ratio of 90.0 (92.4). The improved result was primarily attributable to higher run-off gains and lower claims levels. Premium growth of 4.9% (10.2%) when measured in local currencies partly due to price adjustments to improve profitability for motor insurance. The net negative impact from COVID-19 on the combined ratio was 1.5%, primarily driven by travel claims on the negative side and by lower motor frequencies on the posi-tive side
Premiums Premium income totalled DKK 353m (DKK 343m), up 4.9% when measured in local currencies. As mentioned, the increase was partly driven by price adjustments for motor insurance where claims inflation was observed in 2019.
Claims The claims ratio, net of ceded business, was 71.9 (76.7) and was somewhat lower compared to prior year period. The lower claims ratio was especially driven by a higher run-off level related to motor insurance. COVID-19 had a negative impact of 1.5 percentage point related to travel insurance with gross claims of DKK 12m and DKK 5m after reinsurance. The run-off of gains was somewhat higher than last year reflecting a solid reserving position for especially motor insurance.
Claims inflation for motor insurance has been an issue for the Swedish business. Price adjust-ments are being implemented to improve the claims trend, but the full impact will not be visible until these have reached the entire portfolio.
Expenses The expense ratio was 18.1 (15.7). The higher level compared to the prior-year period does not represent a trend but reflects some volatility between quarters. At the end of the quarter, the number of employees was 329, which was an increase of 29 employees compared to year end 2019.
Financial highlights Q1 2020
Technical resultDKK 35m
(DKK 26m)
Combined ratio90.0
(92.4)
Premium growth (local currencies)
4.9% (10.2%)
Interim report Q1 2020 | Tryg A/S | 14Contents – Management’s review
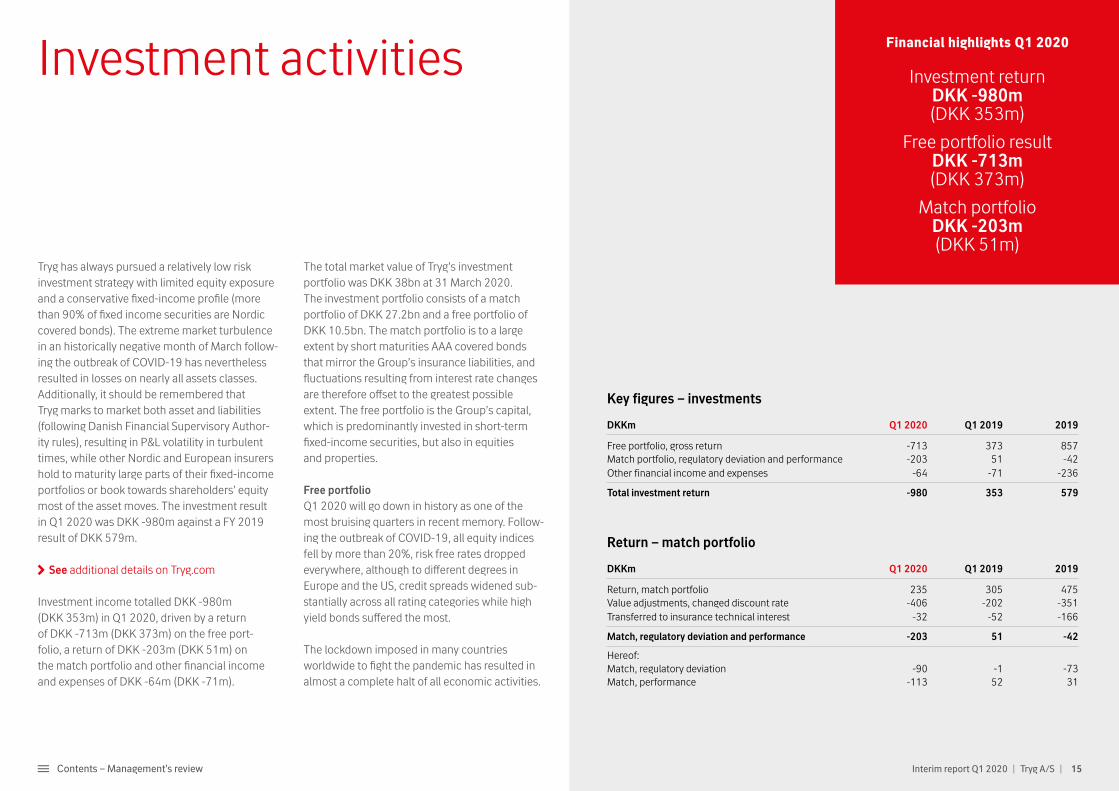
Investment activities Financial highlights Q1 2020
Investment return DKK -980m(DKK 353m)
Free portfolio result DKK -713m(DKK 373m)
Match portfolioDKK -203m(DKK 51m)
Key figures – investments
DKKm Q1 2020 Q1 2019 2019
Free portfolio, gross return -713 373 857Match portfolio, regulatory deviation and performance -203 51 -42Other financial income and expenses -64 -71 -236
Total investment return -980 353 579
Return – match portfolio
DKKm Q1 2020 Q1 2019 2019
Return, match portfolio 235 305 475Value adjustments, changed discount rate -406 -202 -351Transferred to insurance technical interest -32 -52 -166
Match, regulatory deviation and performance -203 51 -42
Hereof: Match, regulatory deviation -90 -1 -73Match, performance -113 52 31
Tryg has always pursued a relatively low risk investment strategy with limited equity exposure and a conservative fixed-income profile (more than 90% of fixed income securities are Nordic covered bonds). The extreme market turbulence in an historically negative month of March follow-ing the outbreak of COVID-19 has nevertheless resulted in losses on nearly all assets classes. Additionally, it should be remembered that Tryg marks to market both asset and liabilities (following Danish Financial Supervisory Author-ity rules), resulting in P&L volatility in turbulent times, while other Nordic and European insurers hold to maturity large parts of their fixed-income portfolios or book towards shareholders’ equity most of the asset moves. The investment result in Q1 2020 was DKK -980m against a FY 2019 result of DKK 579m.
See additional details on Tryg.com
Investment income totalled DKK -980m (DKK 353m) in Q1 2020, driven by a return of DKK -713m (DKK 373m) on the free port - folio, a return of DKK -203m (DKK 51m) on the match portfolio and other financial income and expenses of DKK -64m (DKK -71m).
The total market value of Tryg’s investment portfolio was DKK 38bn at 31 March 2020. The investment portfolio consists of a match portfolio of DKK 27.2bn and a free portfolio of DKK 10.5bn. The match portfolio is to a large extent by short maturities AAA covered bonds that mirror the Group’s insurance liabilities, and fluctuations resulting from interest rate changes are therefore offset to the greatest possible extent. The free portfolio is the Group’s capital, which is predominantly invested in short-term fixed-income securities, but also in equities and properties.
Free portfolio Q1 2020 will go down in history as one of the most bruising quarters in recent memory. Follow-ing the outbreak of COVID-19, all equity indices fell by more than 20%, risk free rates dropped everywhere, although to different degrees in Europe and the US, credit spreads widened sub-stantially across all rating categories while high yield bonds suffered the most.
The lockdown imposed in many countries worldwide to fight the pandemic has resulted in almost a complete halt of all economic activities.
Interim report Q1 2020 | Tryg A/S | 15Contents – Management’s review
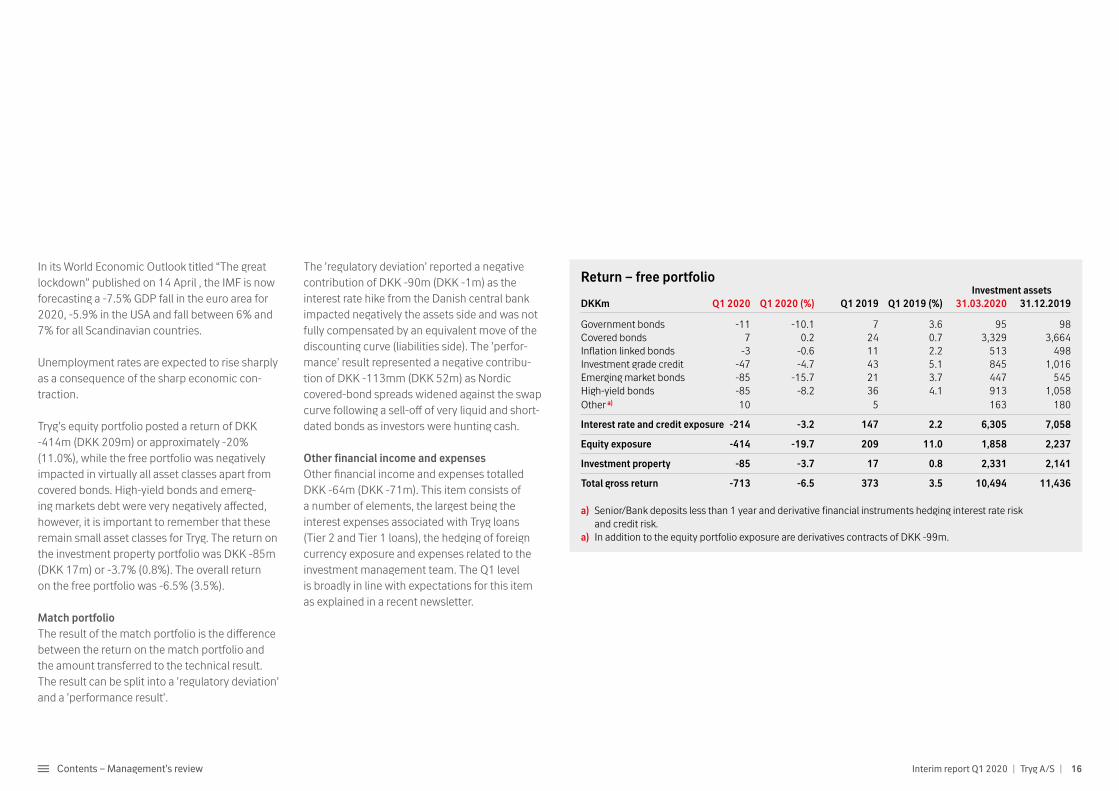
Return – free portfolio Investment assetsDKKm Q1 2020 Q1 2020 (%) Q1 2019 Q1 2019 (%) 31.03.2020 31.12.2019
Government bonds -11 -10.1 7 3.6 95 98Covered bonds 7 0.2 24 0.7 3,329 3,664Inflation linked bonds -3 -0.6 11 2.2 513 498Investment grade credit -47 -4.7 43 5.1 845 1,016Emerging market bonds -85 -15.7 21 3.7 447 545High-yield bonds -85 -8.2 36 4.1 913 1,058Other a) 10 5 163 180
Interest rate and credit exposure -214 -3.2 147 2.2 6,305 7,058
Equity exposure -414 -19.7 209 11.0 1,858 2,237
Investment property -85 -3.7 17 0.8 2,331 2,141
Total gross return -713 -6.5 373 3.5 10,494 11,436
a) Senior/Bank deposits less than 1 year and derivative financial instruments hedging interest rate risk and credit risk.
a) In addition to the equity portfolio exposure are derivatives contracts of DKK -99m.
In its World Economic Outlook titled “The great lockdown” published on 14 April , the IMF is now forecasting a -7.5% GDP fall in the euro area for 2020, -5.9% in the USA and fall between 6% and 7% for all Scandinavian countries.
Unemployment rates are expected to rise sharply as a consequence of the sharp economic con-traction.
Tryg’s equity portfolio posted a return of DKK -414m (DKK 209m) or approximately -20% (11.0%), while the free portfolio was negatively impacted in virtually all asset classes apart from covered bonds. High-yield bonds and emerg-ing markets debt were very negatively affected, however, it is important to remember that these remain small asset classes for Tryg. The return on the investment property portfolio was DKK -85m (DKK 17m) or -3.7% (0.8%). The overall return on the free portfolio was -6.5% (3.5%).
Match portfolio The result of the match portfolio is the difference between the return on the match portfolio and the amount transferred to the technical result. The result can be split into a ’regulatory deviation’ and a ’performance result’.
The ’regulatory deviation’ reported a negative contribution of DKK -90m (DKK -1m) as the interest rate hike from the Danish central bank impacted negatively the assets side and was not fully compensated by an equivalent move of the discounting curve (liabilities side). The ’perfor-mance’ result represented a negative contribu-tion of DKK -113mm (DKK 52m) as Nordic covered-bond spreads widened against the swap curve following a sell-off of very liquid and short-dated bonds as investors were hunting cash.
Other financial income and expenses Other financial income and expenses totalled DKK -64m (DKK -71m). This item consists of a number of elements, the largest being the interest expenses associated with Tryg loans (Tier 2 and Tier 1 loans), the hedging of foreign currency exposure and expenses related to the investment management team. The Q1 level is broadly in line with expectations for this item as explained in a recent newsletter.
Interim report Q1 2020 | Tryg A/S | 16Contents – Management’s review
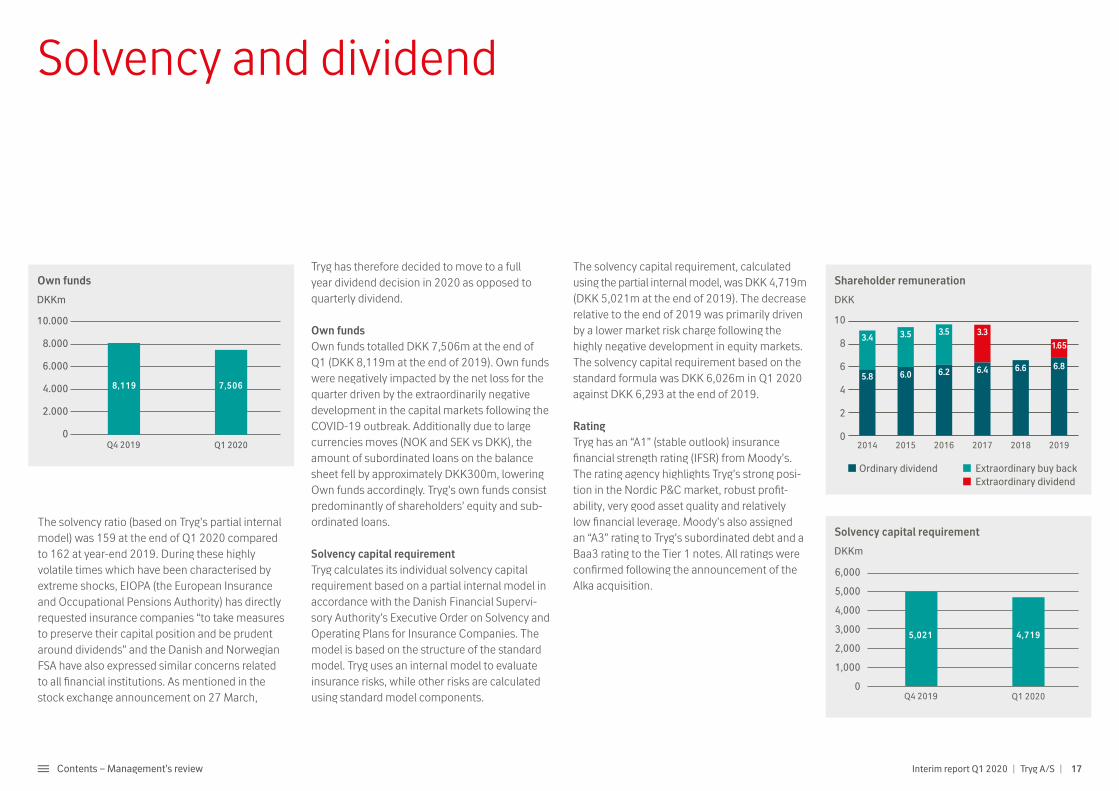
Solvency and dividend
The solvency ratio (based on Tryg’s partial internal model) was 159 at the end of Q1 2020 compared to 162 at year-end 2019. During these highly volatile times which have been characterised by extreme shocks, EIOPA (the European Insurance and Occupational Pensions Authority) has directly requested insurance companies “to take measures to preserve their capital position and be prudent around dividends” and the Danish and Norwegian FSA have also expressed similar concerns related to all financial institutions. As mentioned in the stock exchange announcement on 27 March,
Tryg has therefore decided to move to a full year dividend decision in 2020 as opposed to quarterly dividend.
Own funds Own funds totalled DKK 7,506m at the end of Q1 (DKK 8,119m at the end of 2019). Own funds were negatively impacted by the net loss for the quarter driven by the extraordinarily negative development in the capital markets following the COVID-19 outbreak. Additionally due to large currencies moves (NOK and SEK vs DKK), the amount of subordinated loans on the balance sheet fell by approximately DKK300m, lowering Own funds accordingly. Tryg’s own funds consist predominantly of shareholders’ equity and sub-ordinated loans.
Solvency capital requirementTryg calculates its individual solvency capital requirement based on a partial internal model in accordance with the Danish Financial Supervi-sory Authority’s Executive Order on Solvency and Operating Plans for Insurance Companies. The model is based on the structure of the standard model. Tryg uses an internal model to evaluate insurance risks, while other risks are calculated using standard model components.
The solvency capital requirement, calculated using the partial internal model, was DKK 4,719m (DKK 5,021m at the end of 2019). The decrease relative to the end of 2019 was primarily driven by a lower market risk charge following the highly negative development in equity markets. The solvency capital requirement based on the standard formula was DKK 6,026m in Q1 2020 against DKK 6,293 at the end of 2019.
RatingTryg has an “A1” (stable outlook) insurance financial strength rating (IFSR) from Moody’s. The rating agency highlights Tryg’s strong posi-tion in the Nordic P&C market, robust profit-ability, very good asset quality and relatively low financial leverage. Moody’s also assigned an “A3” rating to Tryg’s subordinated debt and a Baa3 rating to the Tier 1 notes. All ratings were confirmed following the announcement of the Alka acquisition.
Solvency capital requirement
DKKm
6,000
5,000
4,000
3,000
2,000
1,000
0Q4 2019 Q1 2020
5,021 4,719
Shareholder remuneration
DKK
10
8
6
4
2
0
Extraordinary buy backExtraordinary dividend
Ordinary dividend
2018 2019201720162014 2015
3.4 3.5
6.05.8 6.2 6.4 6.6
3.5 3.3
6.8
1.65
Own funds
DKKm
10.000
8.000
6.000
4.000
2.000
0Q4 2019 Q1 2020
7,5068,119
Interim report Q1 2020 | Tryg A/S | 17Contents – Management’s review
The outbreak of COVID-19 is likely to have seri-ous repercussions on the global economies and political developments. First, health authorities around the world are under immense pressure battling against something never experienced before. Second, governments are trying to push liquidity into society to partly offset a complete halt to the global economies and a likely sharp increase in unemployment levels. As mentioned previously the IMF in its very recently published “World Economic Outlook” has published some initial forecasts for the global economies follow-ing the outbreak of COVID-19. GDP is set to fall dramatically in all advanced economies including USA, euro area and Scandinavian economies. IMF is forecasting GDP falls between 6% and 8%, if these numbers prove to be correct it would be the biggest contraction for the world economies since The Great Depression in 1929.
Tryg’s underlying business has continued to perform in line with expectations even in these extremely difficult economic conditions. The travel insurance segment (DKK 886m premiums at end of 2019) has been impacted by many travel cancellations (resulting in very high claims costs in Q1) while Tryg Garanti (credit & surety busi-ness) is likely to see some impact from adverse macroeconomic developments. Other lines of business such as group life (death coverage for
employees) and business interruption are ex-pected to see some adverse developments. At the same time, a lower economic activity is improv-ing the performance of lines of businesses such as motor insurance (lower claims frequencies), accident insurance and contents insurance (lower level of burglaries). In general, Tryg’s reinsurance programme protects the business well in these turbulent periods.
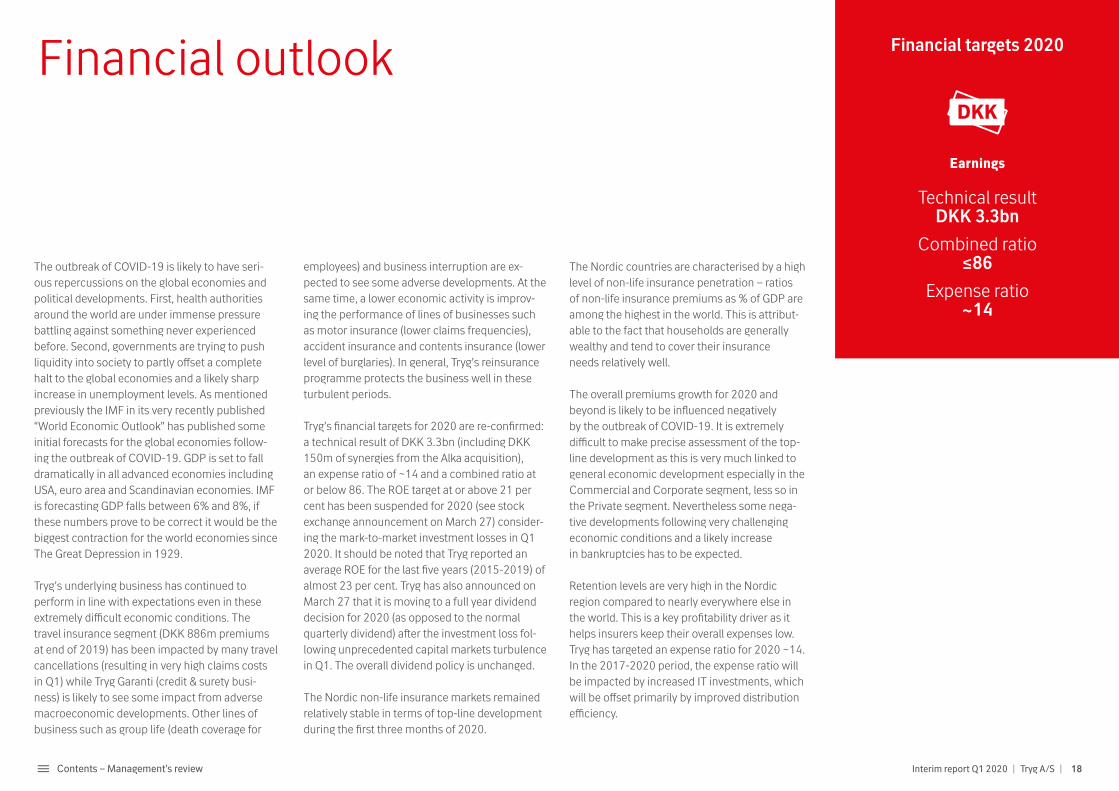
Tryg’s financial targets for 2020 are re-confirmed: a technical result of DKK 3.3bn (including DKK 150m of synergies from the Alka acquisition), an expense ratio of ~14 and a combined ratio at or below 86. The ROE target at or above 21 per cent has been suspended for 2020 (see stock exchange announcement on March 27) consider-ing the mark-to-market investment losses in Q1 2020. It should be noted that Tryg reported an average ROE for the last five years (2015-2019) of almost 23 per cent. Tryg has also announced on March 27 that it is moving to a full year dividend decision for 2020 (as opposed to the normal quarterly dividend) after the investment loss fol-lowing unprecedented capital markets turbulence in Q1. The overall dividend policy is unchanged.
The Nordic non-life insurance markets remained relatively stable in terms of top-line development during the first three months of 2020.
Financial outlook
The Nordic countries are characterised by a high level of non-life insurance penetration – ratios of non-life insurance premiums as % of GDP are among the highest in the world. This is attribut-able to the fact that households are generally wealthy and tend to cover their insurance needs relatively well.
The overall premiums growth for 2020 and beyond is likely to be influenced negatively by the outbreak of COVID-19. It is extremely difficult to make precise assessment of the top-line development as this is very much linked to general economic development especially in the Commercial and Corporate segment, less so in the Private segment. Nevertheless some nega-tive developments following very challenging economic conditions and a likely increase in bankruptcies has to be expected.
Retention levels are very high in the Nordic region compared to nearly everywhere else in the world. This is a key profitability driver as it helps insurers keep their overall expenses low. Tryg has targeted an expense ratio for 2020 ~14. In the 2017-2020 period, the expense ratio will be impacted by increased IT investments, which will be offset primarily by improved distribution efficiency.
DKK
Financial targets 2020
Earnings
Technical result DKK 3.3bn
Combined ratio ≤86
Expense ratio ~14
Interim report Q1 2020 | Tryg A/S | 18Contents – Management’s review
Tryg’s reserves position remains strong. At the CMD in November 2017, it was disclosed that run-off gains are expected to be between 3% and 5% in 2020. Tryg’s systematic claims reserving approach still includes a margin of approxi- mately 3% on best estimate.
In 2020, weather claims net of reinsurance and large claims are expected to total DKK 600m and DKK 550m, respectively.
The interest rate used to discount Tryg’s tech-nical provisions is historically low. An interest rate increase will have a positive effect on Tryg’s results. An interest rate increase of 1 percentage point will increase pre-tax results by around DKK 300m, and vice versa.
The investment portfolio is divided into a match portfolio corresponding to the technical provi-sions, and a free portfolio. The objective is for the return on the match portfolio to be approxi-mately zero as capital gains and losses on the assets side should be mirrored by corresponding developments on the liabilities side. The free portfolio is invested in different asset classes with a view to obtaining the best risk-adjusted return.
The return on bonds in the free portfolio (slightly above 60% of the free portfolio) will vary, but given the current interest rate levels, a very low return is expected. For shares, the expected nor-malized return is around 7% with the MSCI World Index as benchmark, while the expected return for property is around 5%. The investment return in the income statement also includes the cost of managing investments, the cost of currency hedges, interest expenses on subordinated loans and other minor items.
In the past few years, corporate tax rates have been lowered throughout Scandinavia. In Den-mark, the rate will remain at 22% in 2020, while it is 25% in Norway and 21% in Sweden. Capital gains and losses on equities are not taxed in Norway, which reduces the expected tax payable for an average year to 22-23%.
The current three-year strategy period ends in 2020, and Tryg will therefore host a new CMD towards the end of the year and launch an up-dated strategy and new financial targets.
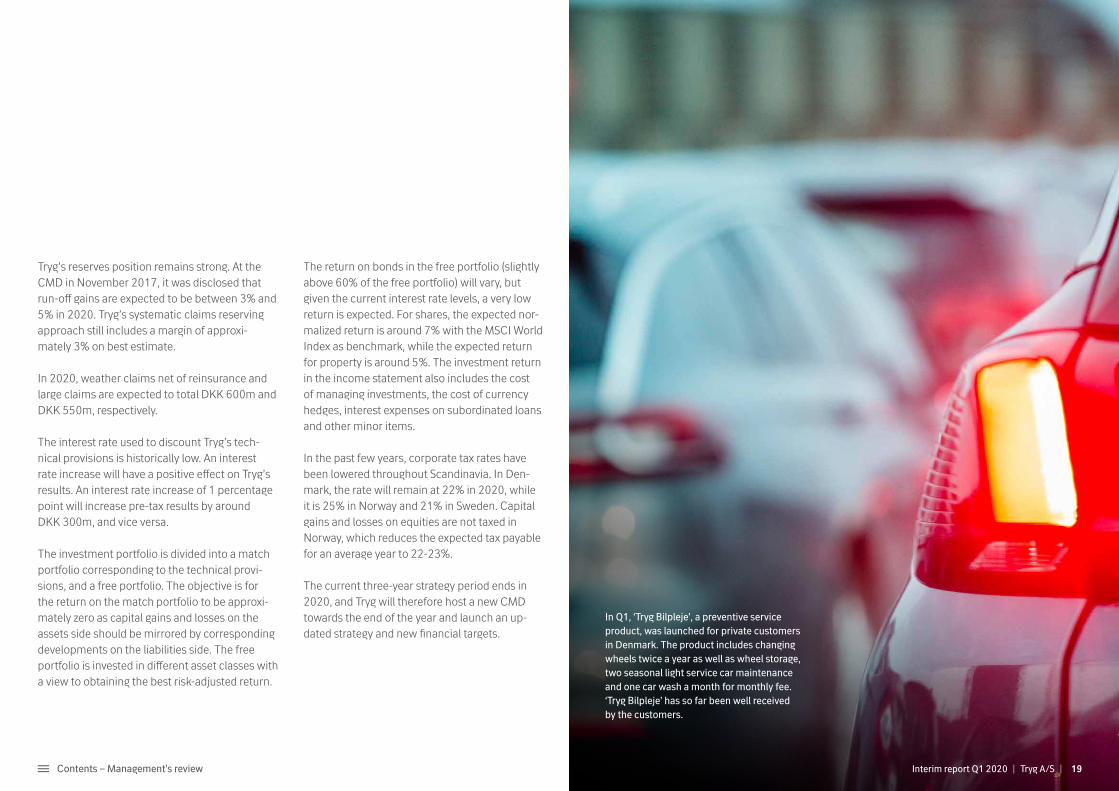
In Q1, ‘Tryg Bilpleje’, a preventive service product, was launched for private customers in Denmark. The product includes changing wheels twice a year as well as wheel storage, two seasonal light service car maintenance and one car wash a month for monthly fee. ‘Tryg Bilpleje’ has so far been well received by the customers.
19Contents – Management’s review Interim report Q1 2020 | Tryg A/S |

Financial calendar 202009 July 2020 Interim report Q2 and H109 Oct. 2020 Interim report Q1-Q3
Tryg A/SKlausdalsbrovej 6012750 Ballerup, Denmark+45 70 11 20 20CVR no. 26460212
Gianandrea RobertiInvestor Relations Officer+45 20 18 82 [email protected]
Peter BrondtInvestor Relations Manager+45 22 75 89 [email protected]
Contact
Tanja FrederiksenHead of Communications+45 51 95 77 [email protected]
Visit tryg.comand follow us attwitter.com/TrygIR
Interim report Q1 2020 | Tryg A/S | 20Contents – Management’s review
Financial statements
22 Statement by the Supervisory
Board and the Executive Board
23 Financial highlights
24 Income statement
25 Statement of comprehensive
income
Contents Financial statements Q1 2020
26 Statement of financial position
27 Statement of changes in equity
29 Cash flow statement
30 Notes
37 Quarterly outline
Tryg’s Group consolidated financial statements are prepared in accordance with IFRS.
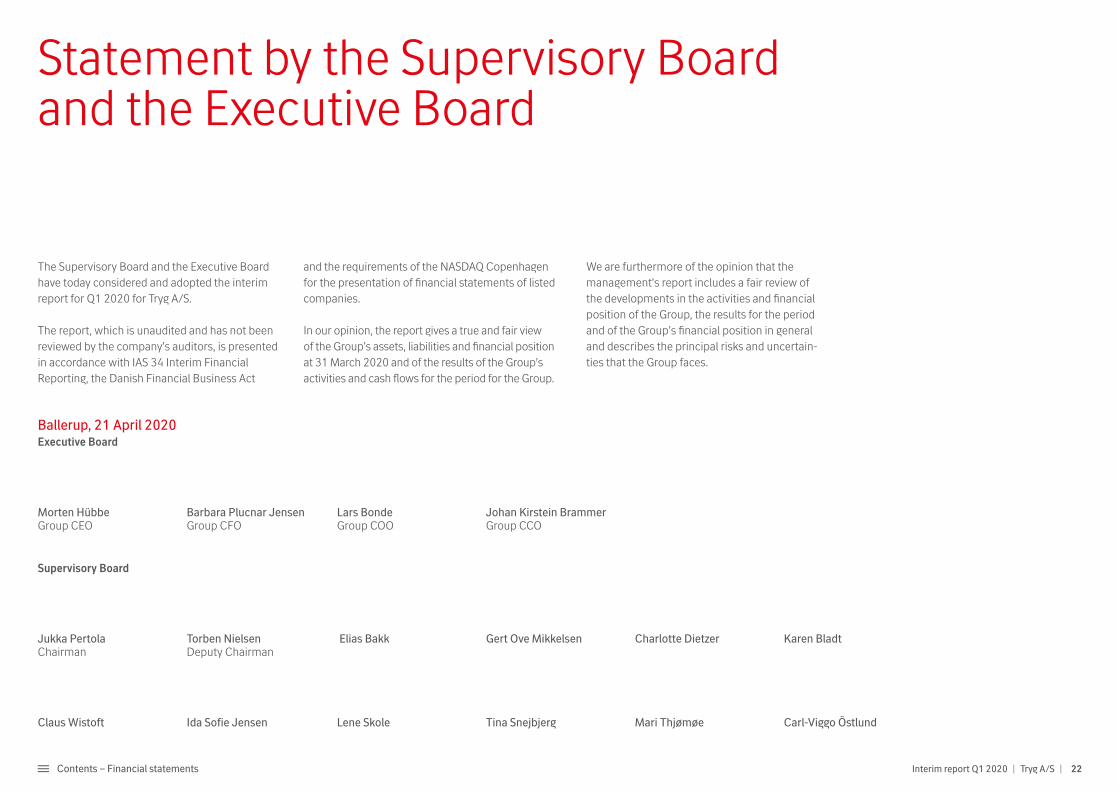
Ballerup, 21 April 2020Executive Board
Morten Hübbe Barbara Plucnar Jensen Lars Bonde Johan Kirstein BrammerGroup CEO Group CFO Group COO Group CCO
Supervisory Board
Jukka Pertola Torben Nielsen Elias Bakk Gert Ove Mikkelsen Charlotte Dietzer Karen Bladt Chairman Deputy Chairman
Claus Wistoft Ida Sofie Jensen Lene Skole Tina Snejbjerg Mari Thjømøe Carl-Viggo Östlund
The Supervisory Board and the Executive Board have today considered and adopted the interim report for Q1 2020 for Tryg A/S.
The report, which is unaudited and has not been reviewed by the company’s auditors, is presented in accordance with IAS 34 Interim Financial Reporting, the Danish Financial Business Act
and the requirements of the NASDAQ Copenhagen for the presentation of financial statements of listed companies.
In our opinion, the report gives a true and fair view of the Group’s assets, liabilities and financial position at 31 March 2020 and of the results of the Group’s activities and cash flows for the period for the Group.
We are furthermore of the opinion that the management’s report includes a fair review of the developments in the activities and financial position of the Group, the results for the period and of the Group’s financial position in general and describes the principal risks and uncertain-ties that the Group faces.
Statement by the Supervisory Board and the Executive Board
22Contents – Financial statements Interim report Q1 2020 | Tryg A/S |
23Contents – Financial statements Interim report Q1 2020 | Tryg A/S |
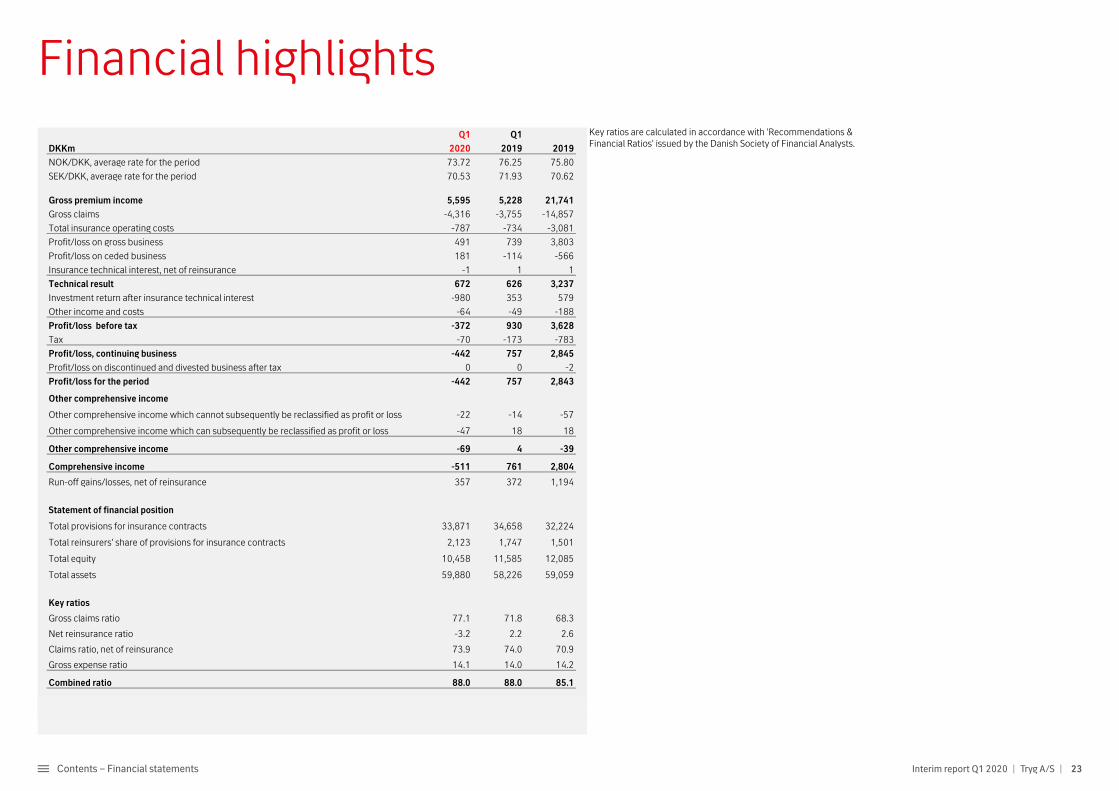
Financial highlightsQ1 Q1
DKKm 2020 2019 2019
NOK/DKK, average rate for the period 73.72 76.25 75.80
SEK/DKK, average rate for the period 70.53 71.93 70.62
Gross premium income 5,595 5,228 21,741
Gross claims -4,316 -3,755 -14,857
Total insurance operating costs -787 -734 -3,081
Profit/loss on gross business 491 739 3,803
Profit/loss on ceded business 181 -114 -566
Insurance technical interest, net of reinsurance -1 1 1
Technical result 672 626 3,237
Investment return after insurance technical interest -980 353 579
Other income and costs -64 -49 -188
Profit/loss before tax -372 930 3,628
Tax -70 -173 -783
Profit/loss, continuing business -442 757 2,845
Profit/loss on discontinued and divested business after tax 0 0 -2
Profit/loss for the period -442 757 2,843
Other comprehensive income
Other comprehensive income which cannot subsequently be reclassified as profit or loss -22 -14 -57
Other comprehensive income which can subsequently be reclassified as profit or loss -47 18 18
Other comprehensive income -69 4 -39
Comprehensive income -511 761 2,804
Run-off gains/losses, net of reinsurance 357 372 1,194
Statement of financial position
Total provisions for insurance contracts 33,871 34,658 32,224
Total reinsurers' share of provisions for insurance contracts 2,123 1,747 1,501
Total equity 10,458 11,585 12,085
Total assets 59,880 58,226 59,059
Key ratios
Gross claims ratio 77.1 71.8 68.3
Net reinsurance ratio -3.2 2.2 2.6
Claims ratio, net of reinsurance 73.9 74.0 70.9
Gross expense ratio 14.1 14.0 14.2
Combined ratio 88.0 88.0 85.1
Key ratios are calculated in accordance with 'Recommendations & Financial Ratios' issued by the Danish Society of Financial Analysts.
Financial highlights
24Contents – Financial statements Interim report Q1 2020 | Tryg A/S |
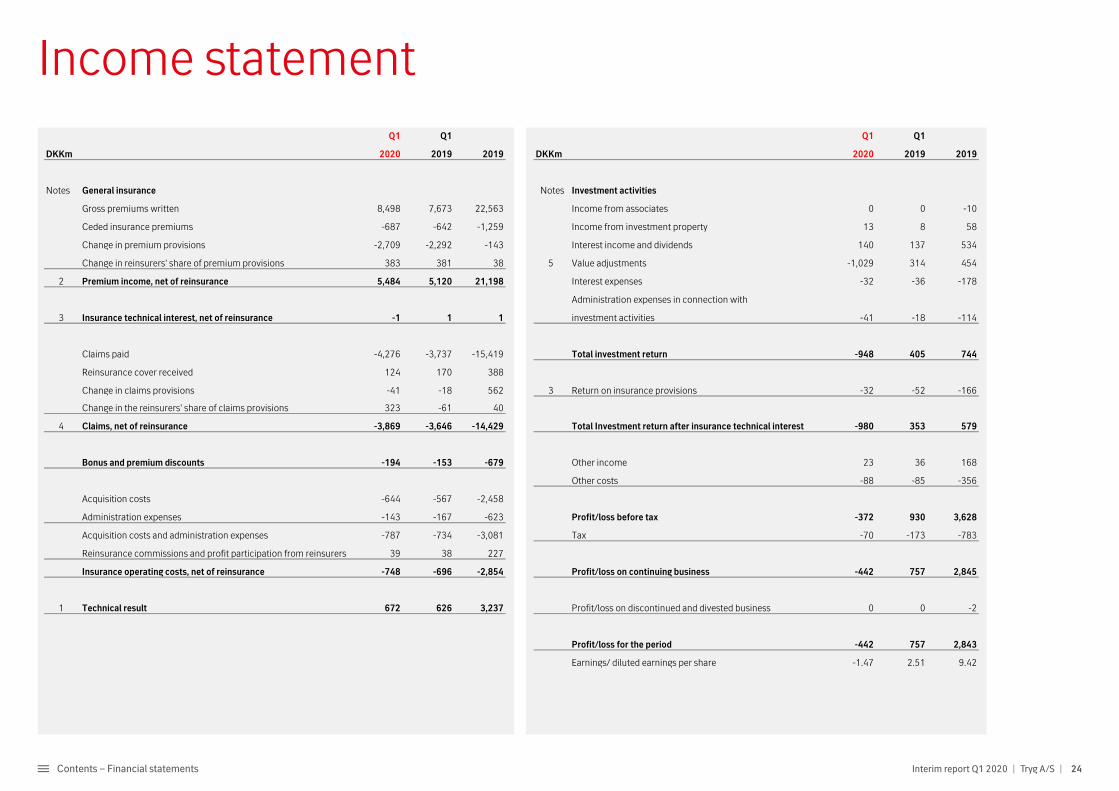
Income statement
Q1 Q1 Q1 Q1
DKKm 2020 2019 2019 DKKm 2020 2019 2019
Notes General insurance Notes Investment activities
Gross premiums written 8,498 7,673 22,563 Income from associates 0 0 -10
Ceded insurance premiums -687 -642 -1,259 Income from investment property 13 8 58
Change in premium provisions -2,709 -2,292 -143 Interest income and dividends 140 137 534
Change in reinsurers' share of premium provisions 383 381 38 5 Value adjustments -1,029 314 454
2 Premium income, net of reinsurance 5,484 5,120 21,198 Interest expenses -32 -36 -178
Administration expenses in connection with
3 Insurance technical interest, net of reinsurance -1 1 1 investment activities -41 -18 -114
Claims paid -4,276 -3,737 -15,419 Total investment return -948 405 744
Reinsurance cover received 124 170 388
Change in claims provisions -41 -18 562 3 Return on insurance provisions -32 -52 -166
Change in the reinsurers' share of claims provisions 323 -61 40
4 Claims, net of reinsurance -3,869 -3,646 -14,429 Total Investment return after insurance technical interest -980 353 579
Bonus and premium discounts -194 -153 -679 Other income 23 36 168
Other costs -88 -85 -356
Acquisition costs -644 -567 -2,458
Administration expenses -143 -167 -623 Profit/loss before tax -372 930 3,628
Acquisition costs and administration expenses -787 -734 -3,081 Tax -70 -173 -783
Reinsurance commissions and profit participation from reinsurers 39 38 227
Insurance operating costs, net of reinsurance -748 -696 -2,854 Profit/loss on continuing business -442 757 2,845
1 Technical result 672 626 3,237 Profit/loss on discontinued and divested business 0 0 -2
Profit/loss for the period -442 757 2,843
Earnings/ diluted earnings per share -1.47 2.51 9.42
Income statement
25Contents – Financial statements Interim report Q1 2020 | Tryg A/S |
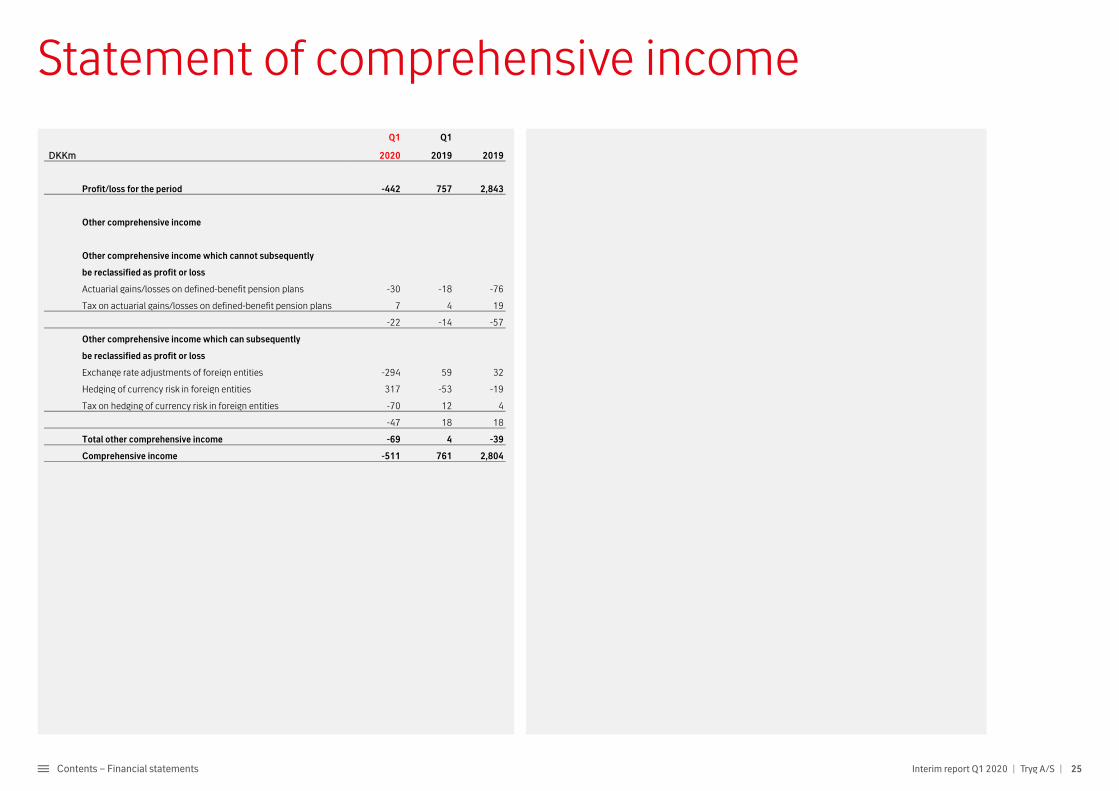
Statement of comprehensive income
Q1 Q1
DDKKKKmm 2020 2019 2019
Profit/loss for the period -442 757 2,843
Other comprehensive income
Other comprehensive income which cannot subsequently
be reclassified as profit or loss
Actuarial gains/losses on defined-benefit pension plans -30 -18 -76
Tax on actuarial gains/losses on defined-benefit pension plans 7 4 19
-22 -14 -57
Other comprehensive income which can subsequently
be reclassified as profit or loss
Exchange rate adjustments of foreign entities -294 59 32
Hedging of currency risk in foreign entities 317 -53 -19
Tax on hedging of currency risk in foreign entities -70 12 4
-47 18 18
Total other comprehensive income -69 4 -39
Comprehensive income -511 761 2,804
Statement of comprehensive income
26Contents – Financial statements Interim report Q1 2020 | Tryg A/S |
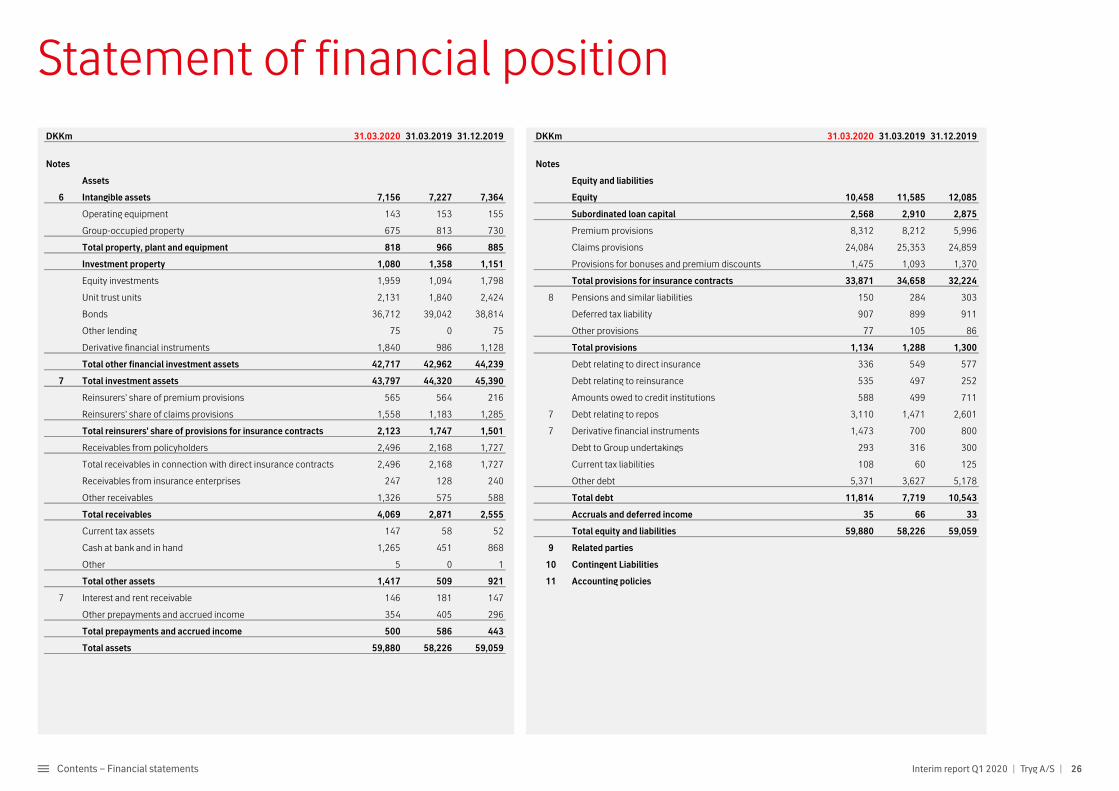
Statement of financial position
DKKm 31.03.2020 31.03.2019 31.12.2019 DKKm 31.03.2020 31.03.2019 31.12.2019
Notes Notes
Assets Equity and liabilities
6 Intangible assets 7,156 7,227 7,364 Equity 10,458 11,585 12,085
Operating equipment 143 153 155 Subordinated loan capital 2,568 2,910 2,875
Group-occupied property 675 813 730 Premium provisions 8,312 8,212 5,996
Total property, plant and equipment 818 966 885 Claims provisions 24,084 25,353 24,859
Investment property 1,080 1,358 1,151 Provisions for bonuses and premium discounts 1,475 1,093 1,370
Equity investments 1,959 1,094 1,798 Total provisions for insurance contracts 33,871 34,658 32,224
Unit trust units 2,131 1,840 2,424 8 Pensions and similar liabilities 150 284 303
Bonds 36,712 39,042 38,814 Deferred tax liability 907 899 911
Other lending 75 0 75 Other provisions 77 105 86
Derivative financial instruments 1,840 986 1,128 Total provisions 1,134 1,288 1,300
Total other financial investment assets 42,717 42,962 44,239 Debt relating to direct insurance 336 549 577
7 Total investment assets 43,797 44,320 45,390 Debt relating to reinsurance 535 497 252
Reinsurers' share of premium provisions 565 564 216 Amounts owed to credit institutions 588 499 711
Reinsurers' share of claims provisions 1,558 1,183 1,285 7 Debt relating to repos 3,110 1,471 2,601
Total reinsurers' share of provisions for insurance contracts 2,123 1,747 1,501 7 Derivative financial instruments 1,473 700 800
Receivables from policyholders 2,496 2,168 1,727 Debt to Group undertakings 293 316 300
Total receivables in connection with direct insurance contracts 2,496 2,168 1,727 Current tax liabilities 108 60 125
Receivables from insurance enterprises 247 128 240 Other debt 5,371 3,627 5,178
Other receivables 1,326 575 588 Total debt 11,814 7,719 10,543
Total receivables 4,069 2,871 2,555 Accruals and deferred income 35 66 33
Current tax assets 147 58 52 Total equity and liabilities 59,880 58,226 59,059
Cash at bank and in hand 1,265 451 868 9 Related parties
Other 5 0 1 10 Contingent Liabilities
Total other assets 1,417 509 921 11 Accounting policies
7 Interest and rent receivable 146 181 147
Other prepayments and accrued income 354 405 296
Total prepayments and accrued income 500 586 443
Total assets 59,880 58,226 59,059
Statement of financial position
27Contents – Financial statements Interim report Q1 2020 | Tryg A/S |
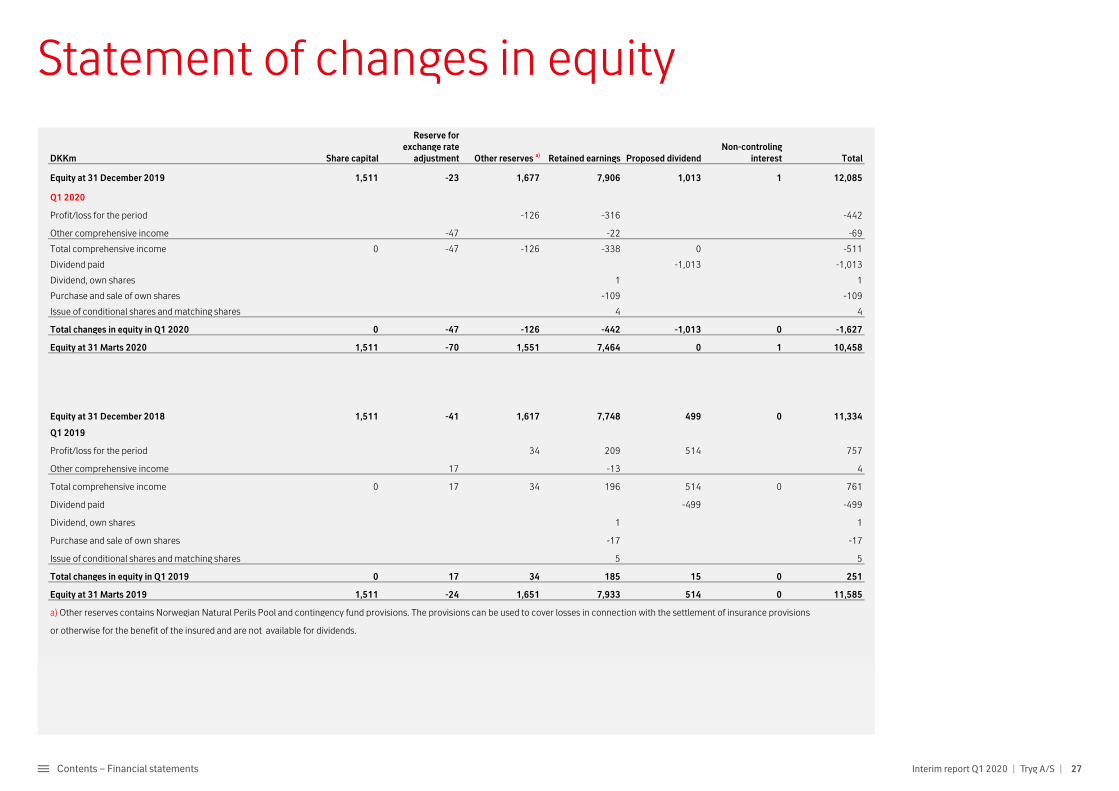
Statement of changes in equity
DKKm Share capital
Reserve for exchange rate
adjustment Other reserves a) Retained earnings Proposed dividendNon-controling
interest Total
Equity at 31 December 2019 1,511 -23 1,677 7,906 1,013 1 12,085
Q1 2020
Profit/loss for the period -126 -316 -442
Other comprehensive income -47 -22 -69
Total comprehensive income 0 -47 -126 -338 0 -511
Dividend paid -1,013 -1,013
Dividend, own shares 1 1
Purchase and sale of own shares -109 -109
Issue of conditional shares and matching shares 4 4
Total changes in equity in Q1 2020 0 -47 -126 -442 -1,013 0 -1,627
Equity at 31 Marts 2020 1,511 -70 1,551 7,464 0 1 10,458
Equity at 31 December 2018 1,511 -41 1,617 7,748 499 0 11,334
Q1 2019
Profit/loss for the period 34 209 514 757
Other comprehensive income 17 -13 4
Total comprehensive income 0 17 34 196 514 0 761
Dividend paid -499 -499
Dividend, own shares 1 1
Purchase and sale of own shares -17 -17
Issue of conditional shares and matching shares 5 5
Total changes in equity in Q1 2019 0 17 34 185 15 0 251
Equity at 31 Marts 2019 1,511 -24 1,651 7,933 514 0 11,585
a) Other reserves contains Norwegian Natural Perils Pool and contingency fund provisions. The provisions can be used to cover losses in connection with the settlement of insurance provisions
or otherwise for the benefit of the insured and are not available for dividends.
Statement of changes in equity
28Contents – Financial statements Interim report Q1 2020 | Tryg A/S |
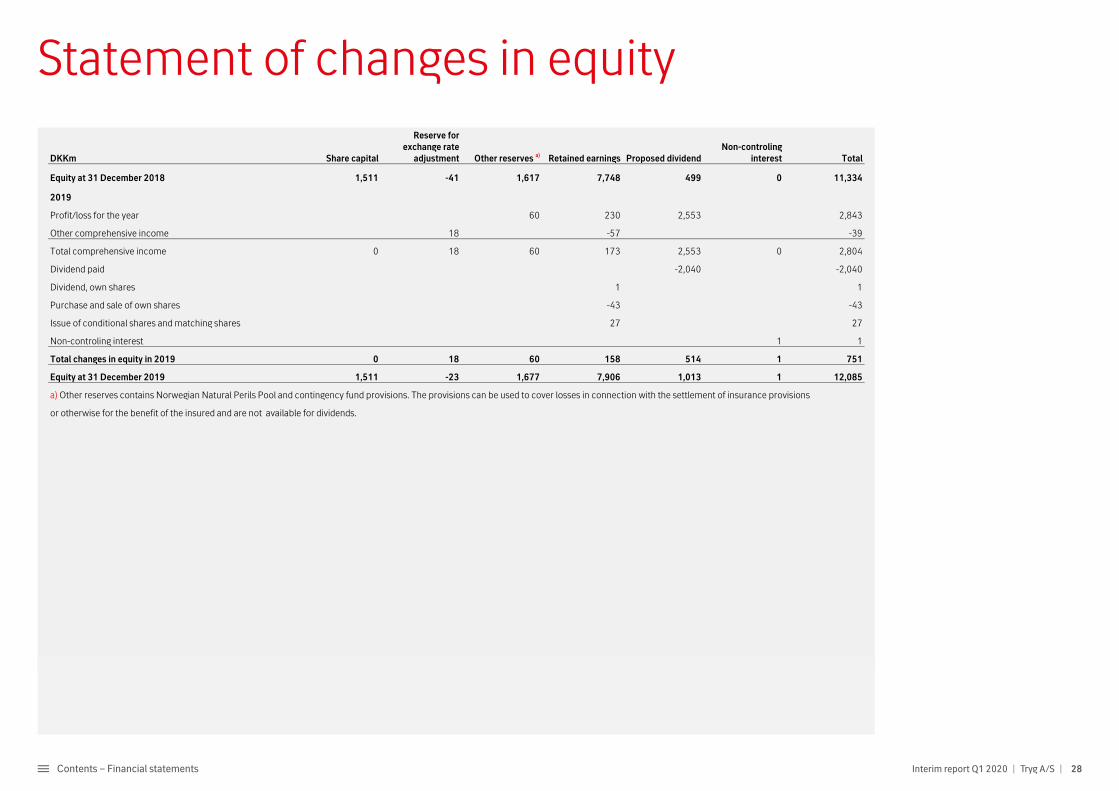
Statement of changes in equity
DKKm Share capital
Reserve for exchange rate
adjustment Other reserves a) Retained earnings Proposed dividendNon-controling
interest Total
Equity at 31 December 2018 1,511 -41 1,617 7,748 499 0 11,334
2019
Profit/loss for the year 60 230 2,553 2,843
Other comprehensive income 18 -57 -39
Total comprehensive income 0 18 60 173 2,553 0 2,804
Dividend paid -2,040 -2,040
Dividend, own shares 1 1
Purchase and sale of own shares -43 -43
Issue of conditional shares and matching shares 27 27
Non-controling interest 1 1
Total changes in equity in 2019 0 18 60 158 514 1 751
Equity at 31 December 2019 1,511 -23 1,677 7,906 1,013 1 12,085
a) Other reserves contains Norwegian Natural Perils Pool and contingency fund provisions. The provisions can be used to cover losses in connection with the settlement of insurance provisions
or otherwise for the benefit of the insured and are not available for dividends.
Statement of changes in equity
29Contents – Financial statements Interim report Q1 2020 | Tryg A/S |
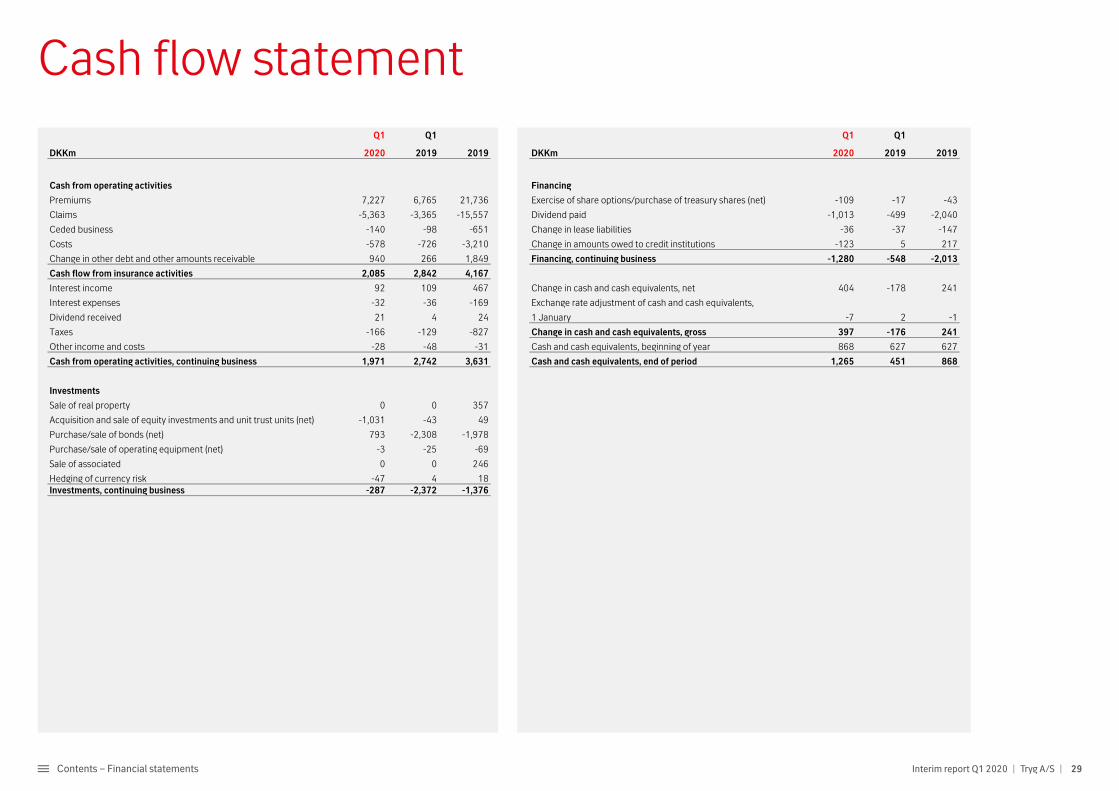
Cash flow statementQ1 Q1 Q1 Q1
DKKm 2020 2019 2019 DKKm 2020 2019 2019
Cash from operating activities Financing
Premiums 7,227 6,765 21,736 Exercise of share options/purchase of treasury shares (net) -109 -17 -43
Claims -5,363 -3,365 -15,557 Dividend paid -1,013 -499 -2,040
Ceded business -140 -98 -651 Change in lease liabilities -36 -37 -147
Costs -578 -726 -3,210 Change in amounts owed to credit institutions -123 5 217
Change in other debt and other amounts receivable 940 266 1,849 Financing, continuing business -1,280 -548 -2,013
Cash flow from insurance activities 2,085 2,842 4,167
Interest income 92 109 467 Change in cash and cash equivalents, net 404 -178 241
Interest expenses -32 -36 -169 Exchange rate adjustment of cash and cash equivalents,
Dividend received 21 4 24 1 January -7 2 -1
Taxes -166 -129 -827 Change in cash and cash equivalents, gross 397 -176 241
Other income and costs -28 -48 -31 Cash and cash equivalents, beginning of year 868 627 627
Cash from operating activities, continuing business 1,971 2,742 3,631 Cash and cash equivalents, end of period 1,265 451 868
Investments
Sale of real property 0 0 357
Acquisition and sale of equity investments and unit trust units (net) -1,031 -43 49
Purchase/sale of bonds (net) 793 -2,308 -1,978
Purchase/sale of operating equipment (net) -3 -25 -69
Sale of associated 0 0 246
Hedging of currency risk -47 4 18Investments, continuing business -287 -2,372 -1,376
Cash flow statement
Notes
30Contents – Financial statements Interim report Q1 2020 | Tryg A/S |
Notes
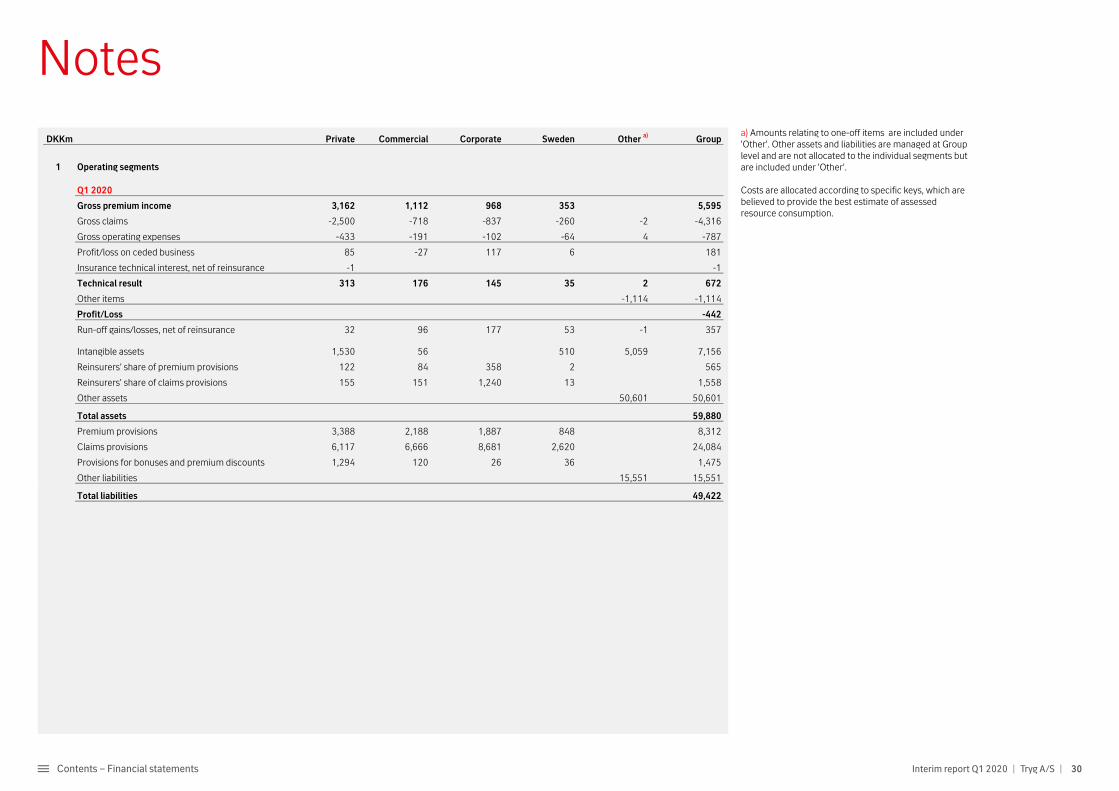
DKKm Private Commercial Corporate Sweden Other a) Group
1 Operating segments
Q1 2020
Gross premium income 3,162 1,112 968 353 5,595
Gross claims -2,500 -718 -837 -260 -2 -4,316
Gross operating expenses -433 -191 -102 -64 4 -787
Profit/loss on ceded business 85 -27 117 6 181
Insurance technical interest, net of reinsurance -1 -1
Technical result 313 176 145 35 2 672
Other items -1,114 -1,114
Profit/Loss -442
Run-off gains/losses, net of reinsurance 32 96 177 53 -1 357
Intangible assets 1,530 56 510 5,059 7,156
Reinsurers' share of premium provisions 122 84 358 2 565
Reinsurers' share of claims provisions 155 151 1,240 13 1,558
Other assets 50,601 50,601
Total assets 59,880
Premium provisions 3,388 2,188 1,887 848 8,312
Claims provisions 6,117 6,666 8,681 2,620 24,084
Provisions for bonuses and premium discounts 1,294 120 26 36 1,475
Other liabilities 15,551 15,551
Total liabilities 49,422 #
a) Amounts relating to one-off items are included under 'Other'. Other assets and liabilities are managed at Group level and are not allocated to the individual segments but are included under 'Other'.
Costs are allocated according to specific keys, which are believed to provide the best estimate of assessed resource consumption.

Notes
31Contents – Financial statements Interim report Q1 2020 | Tryg A/S |
Notes
DKKm Private Commercial Corporate Sweden Other a) Group
1 Operating segments
Q1 2019
Gross premium income 2,897 1,050 966 343 -28 5,228
Gross claims -2,047 -710 -734 -262 -2 -3,755
Gross operating expenses -400 -187 -93 -54 -734
Profit/loss on ceded business -45 -42 -50 -1 24 -114
Insurance technical interest, net of reinsurance 1 1
Technical result 406 111 89 26 -6 626
Other items 131 131
Profit/Loss 757
Run-off gains/losses, net of reinsurance 107 95 140 36 -6 372
Intangible assets 1,663 90 542 4,932 7,227
Reinsurers' share of premium provisions 123 76 361 4 564
Reinsurers' share of claims provisions 65 117 993 8 1,183
Other assets 49,252 49,252
Total assets 58,226
Premium provisions 3,184 2,229 1,911 888 8,212
Claims provisions 6,282 6,739 9,503 2,829 25,353
Provisions for bonuses and premium discounts 952 96 29 16 1,093
Other liabilities 11,983 11,983
Total liabilities 46,641 #
a) Amounts relating to eliminations and one-off items are included under 'Other'. Other assets and liabilities are managed at Group level and are not allocated to the individual segments but are included under 'Other'.
Costs are allocated according to specific keys, which are believed to provide the best estimate of assessed resource consumption.
Notes
32Contents – Financial statements Interim report Q1 2020 | Tryg A/S |
Notes
DKKm Private Commercial Corporate Sweden Other a) Group
1 Operating segments
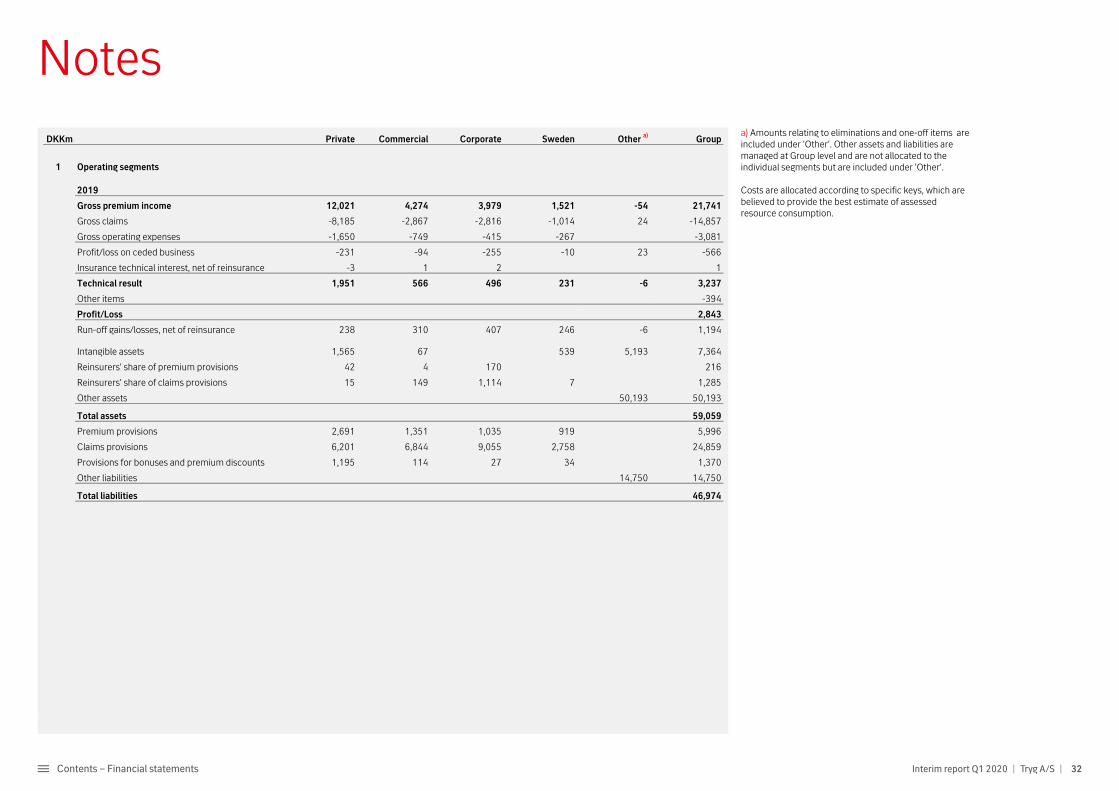
2019
Gross premium income 12,021 4,274 3,979 1,521 -54 21,741
Gross claims -8,185 -2,867 -2,816 -1,014 24 -14,857
Gross operating expenses -1,650 -749 -415 -267 -3,081
Profit/loss on ceded business -231 -94 -255 -10 23 -566
Insurance technical interest, net of reinsurance -3 1 2 1
Technical result 1,951 566 496 231 -6 3,237
Other items -394
Profit/Loss 2,843
Run-off gains/losses, net of reinsurance 238 310 407 246 -6 1,194
Intangible assets 1,565 67 539 5,193 7,364
Reinsurers' share of premium provisions 42 4 170 216
Reinsurers' share of claims provisions 15 149 1,114 7 1,285
Other assets 50,193 50,193
Total assets 59,059
Premium provisions 2,691 1,351 1,035 919 5,996
Claims provisions 6,201 6,844 9,055 2,758 24,859
Provisions for bonuses and premium discounts 1,195 114 27 34 1,370
Other liabilities 14,750 14,750
Total liabilities 46,974
#
a) Amounts relating to eliminations and one-off items are included under 'Other'. Other assets and liabilities are managed at Group level and are not allocated to the individual segments but are included under 'Other'.
Costs are allocated according to specific keys, which are believed to provide the best estimate of assessed resource consumption.
Notes
33Contents – Financial statements Interim report Q1 2020 | Tryg A/S |
Notes
Q1 Q1
DKKm 2020 2019 2019
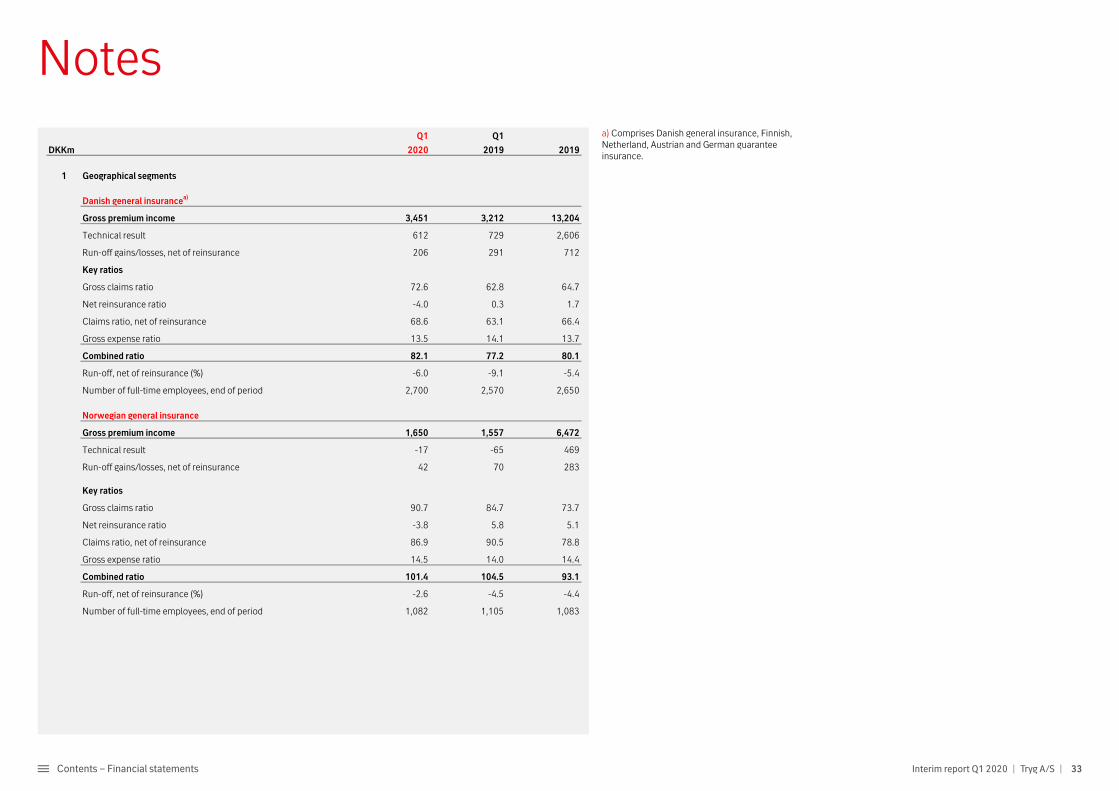
1 Geographical segments
Danish general insurancea)
Gross premium income 3,451 3,212 13,204
Technical result 612 729 2,606
Run-off gains/losses, net of reinsurance 206 291 712
Key ratios
Gross claims ratio 72.6 62.8 64.7
Net reinsurance ratio -4.0 0.3 1.7
Claims ratio, net of reinsurance 68.6 63.1 66.4
Gross expense ratio 13.5 14.1 13.7
Combined ratio 82.1 77.2 80.1
Run-off, net of reinsurance (%) -6.0 -9.1 -5.4
Number of full-time employees, end of period 2,700 2,570 2,650
Norwegian general insurance
Gross premium income 1,650 1,557 6,472
Technical result -17 -65 469
Run-off gains/losses, net of reinsurance 42 70 283
Key ratios
Gross claims ratio 90.7 84.7 73.7
Net reinsurance ratio -3.8 5.8 5.1
Claims ratio, net of reinsurance 86.9 90.5 78.8
Gross expense ratio 14.5 14.0 14.4
Combined ratio 101.4 104.5 93.1
Run-off, net of reinsurance (%) -2.6 -4.5 -4.4
Number of full-time employees, end of period 1,082 1,105 1,083
a) Comprises Danish general insurance, Finnish, Netherland, Austrian and German guarantee insurance.
Notes
34Contents – Financial statements Interim report Q1 2020 | Tryg A/S |
Notes
Q1 Q1
DKKm 2020 2019 2019
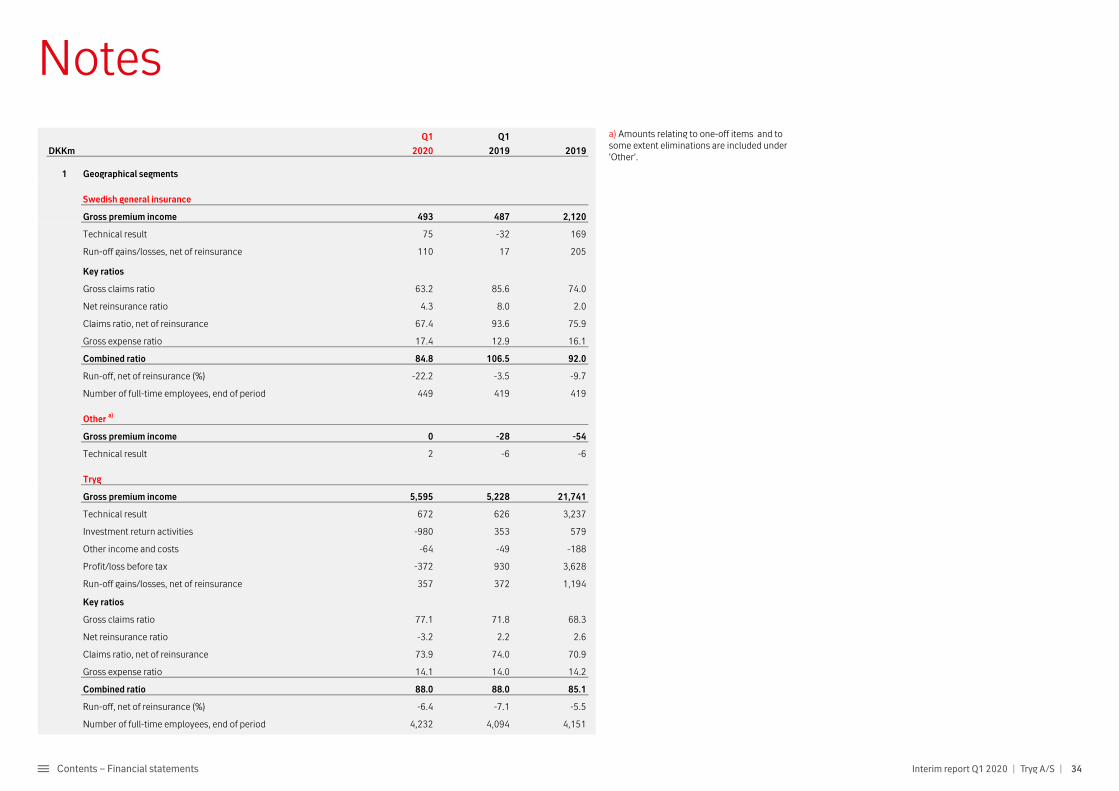
1 Geographical segments
Swedish general insurance
Gross premium income 493 487 2,120
Technical result 75 -32 169
Run-off gains/losses, net of reinsurance 110 17 205
Key ratios
Gross claims ratio 63.2 85.6 74.0
Net reinsurance ratio 4.3 8.0 2.0
Claims ratio, net of reinsurance 67.4 93.6 75.9
Gross expense ratio 17.4 12.9 16.1
Combined ratio 84.8 106.5 92.0
Run-off, net of reinsurance (%) -22.2 -3.5 -9.7
Number of full-time employees, end of period 449 419 419
Other a)
Gross premium income 0 -28 -54
Technical result 2 -6 -6
Tryg
Gross premium income 5,595 5,228 21,741
Technical result 672 626 3,237
Investment return activities -980 353 579
Other income and costs -64 -49 -188
Profit/loss before tax -372 930 3,628
Run-off gains/losses, net of reinsurance 357 372 1,194
Key ratios
Gross claims ratio 77.1 71.8 68.3
Net reinsurance ratio -3.2 2.2 2.6
Claims ratio, net of reinsurance 73.9 74.0 70.9
Gross expense ratio 14.1 14.0 14.2
Combined ratio 88.0 88.0 85.1
Run-off, net of reinsurance (%) -6.4 -7.1 -5.5
Number of full-time employees, end of period 4,232 4,094 4,151
a) Amounts relating to one-off items and to some extent eliminations are included under 'Other'.
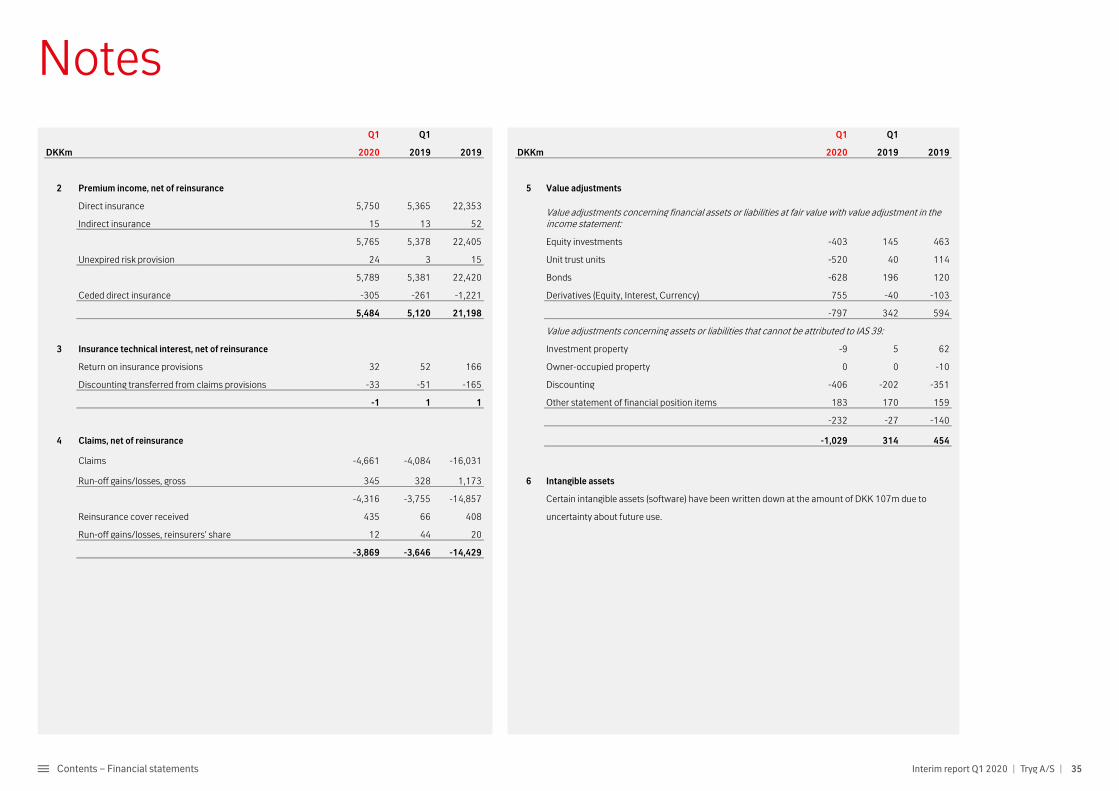
Notes
35Contents – Financial statements Interim report Q1 2020 | Tryg A/S |
Notes
Q1 Q1 Q1 Q1
DKKm 2020 2019 2019 DKKm 2020 2019 2019
2 Premium income, net of reinsurance 5 Value adjustments
Direct insurance 5,750 5,365 22,353
Indirect insurance 15 13 52
5,765 5,378 22,405 Equity investments -403 145 463
Unexpired risk provision 24 3 15 Unit trust units -520 40 114
5,789 5,381 22,420 Bonds -628 196 120
Ceded direct insurance -305 -261 -1,221 Derivatives (Equity, Interest, Currency) 755 -40 -103
5,484 5,120 21,198 -797 342 594
Value adjustments concerning assets or liabilities that cannot be attributed to IAS 39:
3 Insurance technical interest, net of reinsurance Investment property -9 5 62
Return on insurance provisions 32 52 166 Owner-occupied property 0 0 -10
Discounting transferred from claims provisions -33 -51 -165 Discounting -406 -202 -351
-1 1 1 Other statement of financial position items 183 170 159
-232 -27 -140
4 Claims, net of reinsurance -1,029 314 454
Claims -4,661 -4,084 -16,031
Run-off gains/losses, gross 345 328 1,173 6 Intangible assets
-4,316 -3,755 -14,857 Certain intangible assets (software) have been written down at the amount of DKK 107m due to
Reinsurance cover received 435 66 408 uncertainty about future use.
Run-off gains/losses, reinsurers' share 12 44 20
-3,869 -3,646 -14,429
Value adjustments concerning financial assets or liabilities at fair value with value adjustment in the income statement:
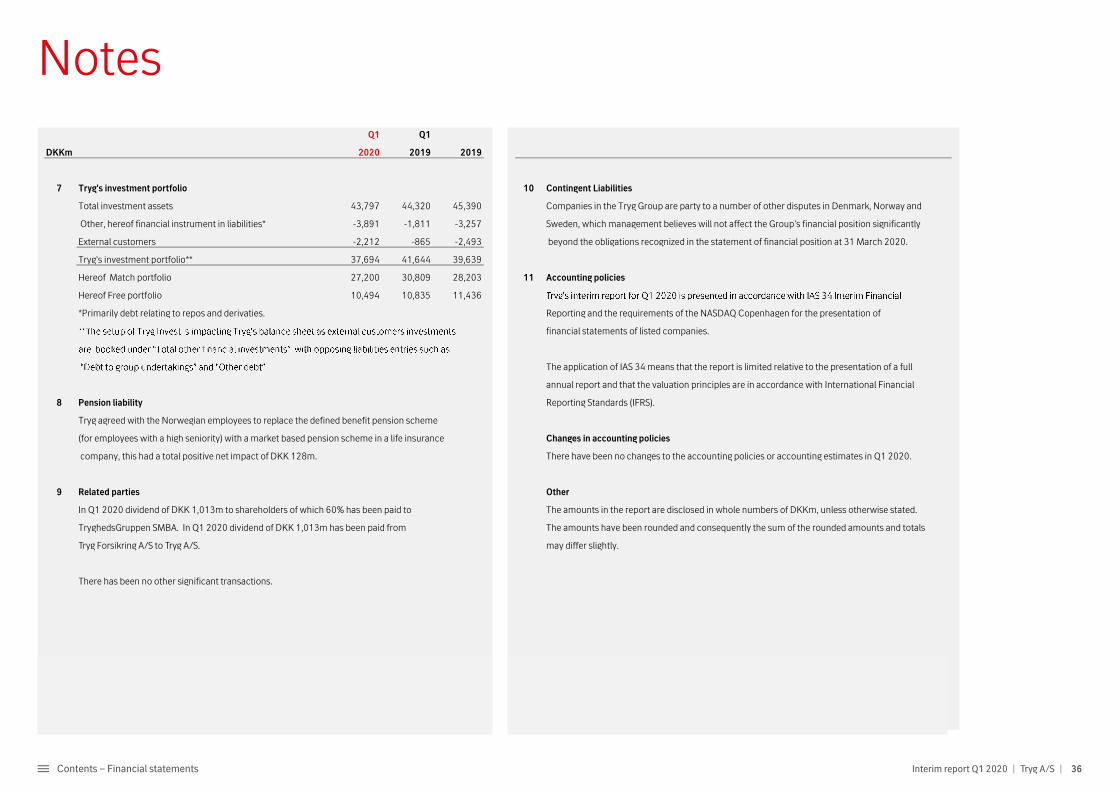
Notes
36Contents – Financial statements Interim report Q1 2020 | Tryg A/S |
Notes
Q1 Q1
DKKm 2020 2019 2019
7 Tryg's investment portfolio 10 Contingent Liabilities
Total investment assets 43,797 44,320 45,390
Other, hereof financial instrument in liabilities* -3,891 -1,811 -3,257
External customers -2,212 -865 -2,493
Tryg's investment portfolio** 37,694 41,644 39,639
Hereof Match portfolio 27,200 30,809 28,203 11 Accounting policies
Hereof Free portfolio 10,494 10,835 11,436
8 Pension liability
Changes in accounting policies
There have been no changes to the accounting policies or accounting estimates in Q1 2020.
9 Related parties Other
The amounts in the report are disclosed in whole numbers of DKKm, unless otherwise stated.
The amounts have been rounded and consequently the sum of the rounded amounts and totals
Companies in the Tryg Group are party to a number of other disputes in Denmark, Norway and
Tryg agreed with the Norwegian employees to replace the defined benefit pension scheme
Tryg Forsikring A/S to Tryg A/S.
There has been no other significant transactions.
Reporting Standards (IFRS).
may differ slightly.
Sweden, which management believes will not affect the Group's financial position significantly
annual report and that the valuation principles are in accordance with International Financial
Reporting and the requirements of the NASDAQ Copenhagen for the presentation of
The application of IAS 34 means that the report is limited relative to the presentation of a full
beyond the obligations recognized in the statement of financial position at 31 March 2020.
TryghedsGruppen SMBA. In Q1 2020 dividend of DKK 1,013m has been paid from
financial statements of listed companies.
company, this had a total positive net impact of DKK 128m.
(for employees with a high seniority) with a market based pension scheme in a life insurance
In Q1 2020 dividend of DKK 1,013m to shareholders of which 60% has been paid to
*Primarily debt relating to repos and derivaties.
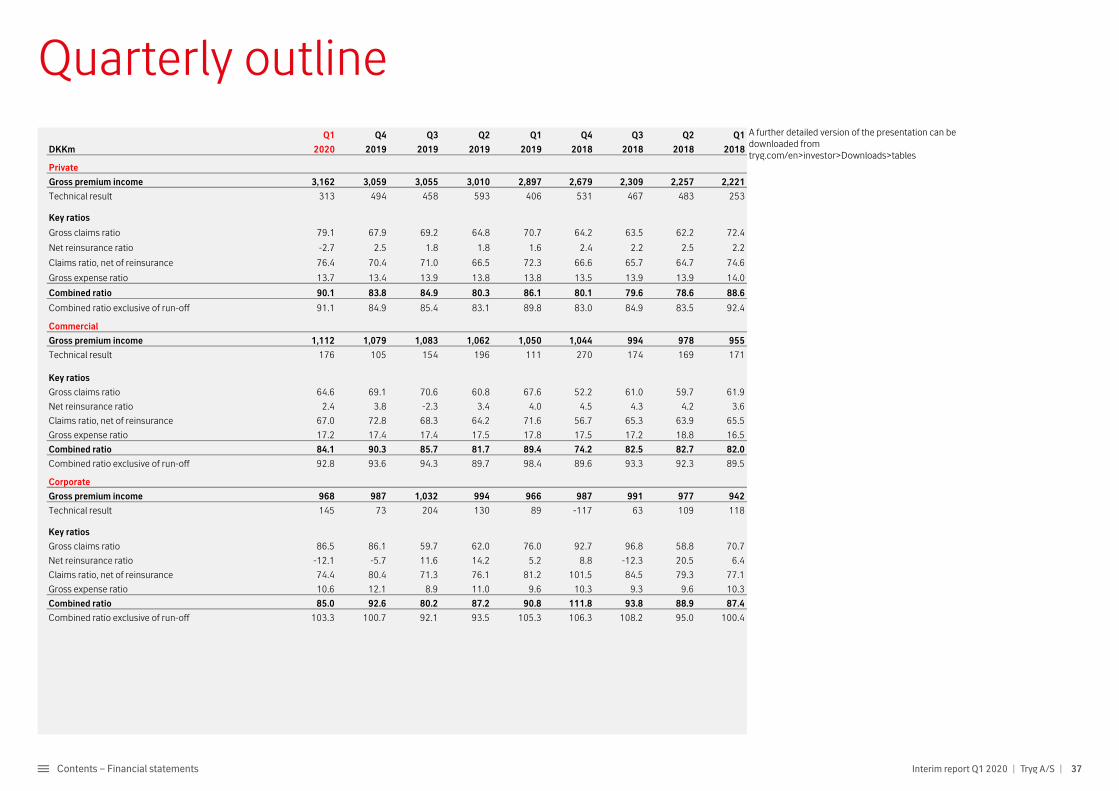
37Contents – Financial statements Interim report Q1 2020 | Tryg A/S |
Quarterly outlineQ1 Q4 Q3 Q2 Q1 Q4 Q3 Q2 Q1
DKKm 2020 2019 2019 2019 2019 2018 2018 2018 2018
Private
Gross premium income 3,162 3,059 3,055 3,010 2,897 2,679 2,309 2,257 2,221
Technical result 313 494 458 593 406 531 467 483 253
Key ratios
Gross claims ratio 79.1 67.9 69.2 64.8 70.7 64.2 63.5 62.2 72.4
Net reinsurance ratio -2.7 2.5 1.8 1.8 1.6 2.4 2.2 2.5 2.2
Claims ratio, net of reinsurance 76.4 70.4 71.0 66.5 72.3 66.6 65.7 64.7 74.6
Gross expense ratio 13.7 13.4 13.9 13.8 13.8 13.5 13.9 13.9 14.0
Combined ratio 90.1 83.8 84.9 80.3 86.1 80.1 79.6 78.6 88.6
Combined ratio exclusive of run-off 91.1 84.9 85.4 83.1 89.8 83.0 84.9 83.5 92.4
Commercial
Gross premium income 1,112 1,079 1,083 1,062 1,050 1,044 994 978 955
Technical result 176 105 154 196 111 270 174 169 171
Key ratios
Gross claims ratio 64.6 69.1 70.6 60.8 67.6 52.2 61.0 59.7 61.9
Net reinsurance ratio 2.4 3.8 -2.3 3.4 4.0 4.5 4.3 4.2 3.6
Claims ratio, net of reinsurance 67.0 72.8 68.3 64.2 71.6 56.7 65.3 63.9 65.5
Gross expense ratio 17.2 17.4 17.4 17.5 17.8 17.5 17.2 18.8 16.5
Combined ratio 84.1 90.3 85.7 81.7 89.4 74.2 82.5 82.7 82.0
Combined ratio exclusive of run-off 92.8 93.6 94.3 89.7 98.4 89.6 93.3 92.3 89.5
Corporate
Gross premium income 968 987 1,032 994 966 987 991 977 942
Technical result 145 73 204 130 89 -117 63 109 118
Key ratios
Gross claims ratio 86.5 86.1 59.7 62.0 76.0 92.7 96.8 58.8 70.7
Net reinsurance ratio -12.1 -5.7 11.6 14.2 5.2 8.8 -12.3 20.5 6.4
Claims ratio, net of reinsurance 74.4 80.4 71.3 76.1 81.2 101.5 84.5 79.3 77.1
Gross expense ratio 10.6 12.1 8.9 11.0 9.6 10.3 9.3 9.6 10.3
Combined ratio 85.0 92.6 80.2 87.2 90.8 111.8 93.8 88.9 87.4
Combined ratio exclusive of run-off 103.3 100.7 92.1 93.5 105.3 106.3 108.2 95.0 100.4
A further detailed version of the presentation can be downloaded from tryg.com/en>investor>Downloads>tables
Quarterly outline
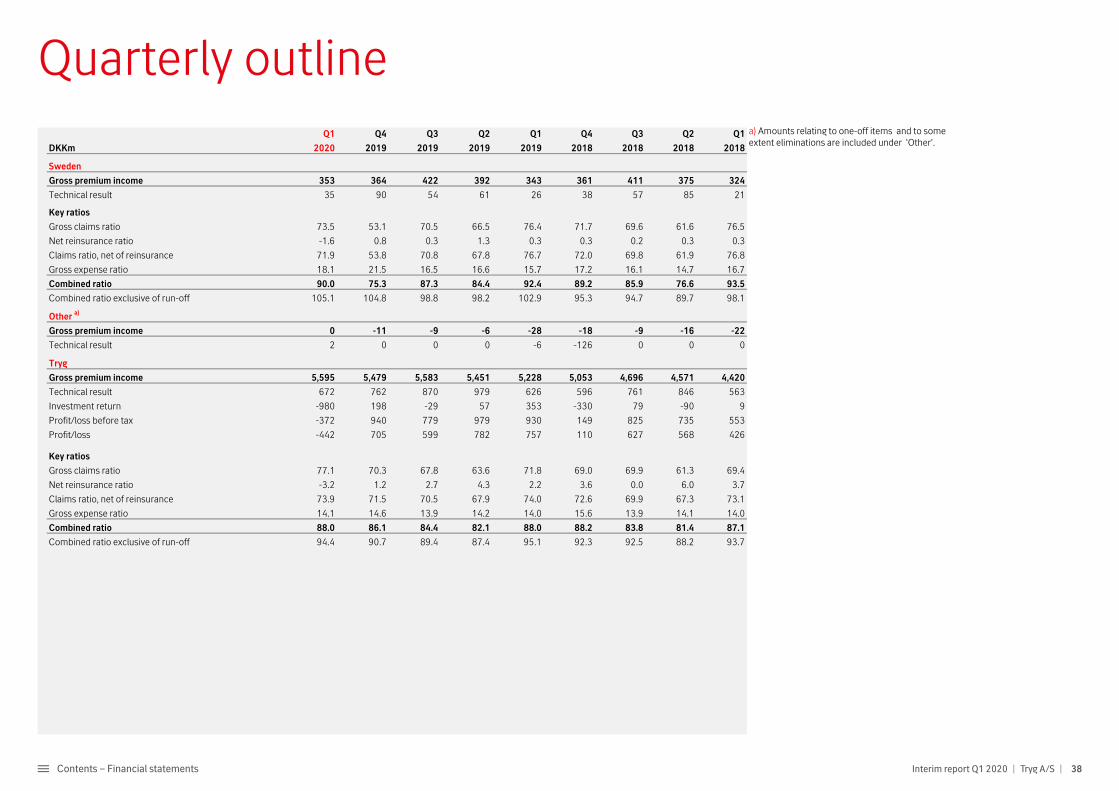
38Contents – Financial statements Interim report Q1 2020 | Tryg A/S |
Quarterly outline
Q1 Q4 Q3 Q2 Q1 Q4 Q3 Q2 Q1
DKKm 2020 2019 2019 2019 2019 2018 2018 2018 2018
Sweden
Gross premium income 353 364 422 392 343 361 411 375 324
Technical result 35 90 54 61 26 38 57 85 21
Key ratios
Gross claims ratio 73.5 53.1 70.5 66.5 76.4 71.7 69.6 61.6 76.5
Net reinsurance ratio -1.6 0.8 0.3 1.3 0.3 0.3 0.2 0.3 0.3
Claims ratio, net of reinsurance 71.9 53.8 70.8 67.8 76.7 72.0 69.8 61.9 76.8
Gross expense ratio 18.1 21.5 16.5 16.6 15.7 17.2 16.1 14.7 16.7
Combined ratio 90.0 75.3 87.3 84.4 92.4 89.2 85.9 76.6 93.5
Combined ratio exclusive of run-off 105.1 104.8 98.8 98.2 102.9 95.3 94.7 89.7 98.1
Other a)
Gross premium income 0 -11 -9 -6 -28 -18 -9 -16 -22
Technical result 2 0 0 0 -6 -126 0 0 0
Tryg
Gross premium income 5,595 5,479 5,583 5,451 5,228 5,053 4,696 4,571 4,420
Technical result 672 762 870 979 626 596 761 846 563
Investment return -980 198 -29 57 353 -330 79 -90 9
Profit/loss before tax -372 940 779 979 930 149 825 735 553
Profit/loss -442 705 599 782 757 110 627 568 426
Key ratios
Gross claims ratio 77.1 70.3 67.8 63.6 71.8 69.0 69.9 61.3 69.4
Net reinsurance ratio -3.2 1.2 2.7 4.3 2.2 3.6 0.0 6.0 3.7
Claims ratio, net of reinsurance 73.9 71.5 70.5 67.9 74.0 72.6 69.9 67.3 73.1
Gross expense ratio 14.1 14.6 13.9 14.2 14.0 15.6 13.9 14.1 14.0
Combined ratio 88.0 86.1 84.4 82.1 88.0 88.2 83.8 81.4 87.1
Combined ratio exclusive of run-off 94.4 90.7 89.4 87.4 95.1 92.3 92.5 88.2 93.7
a) Amounts relating to one-off items and to some extent eliminations are included under 'Other'.
Quarterly outline
39Contents – Management’s review Interim report Q1 2020 | Tryg A/S |
Disclaimer
Certain statements in this annual report are based on the beliefs of our management as well as assumptions made by and information currently available to management. Statements regarding Tryg’s future operating results, financial position, cash flows, business strategy, plans and future objectives other than statements of historical fact can generally be identified by the use of words such as ‘targets’, ‘believes’, ‘expects’, ‘aims’, ‘intends’, ‘plans’, ‘seeks’, ‘will’, ‘may’, ‘anticipates’, ‘would’, ‘could’, ‘continues’ or similar expressions. A number of different factors may cause the actual performance to deviate significantly from the forward-looking statements in this annual report, including but not limited to general economic de-velopments, changes in the competitive environ-ment, developments in the financial markets, extraordinary events such as natural disasters or terrorist attacks, changes in legislation or case law and reinsurance. Should one or more of these risks or uncertainties materialise, or should any under-
lying assumptions prove to be incorrect, Tryg’s actual financial condition or results of operations could materially differ from that described herein as anticipated, believed, estimated or expected. Tryg is not under any duty to update any of the forward-looking statements or to conform such statements to actual results, except as may be required by law.
Read more in the chapter Capital and risk management on pages 30-31, and in Note 1 on page 58 in the Annual report 2019, for a description of some of the factors which may affect the Group’s performance or the insur-ance industry.