Embed Size (px)
Citation preview

INTERIM REPORTJANUARY–SEPTEMBER 2017
Q3

INTERIM REPORT JANUARY–SEPTEMBER 2017: Continued growth in comparable net sales and comparable EBITA
Third quarter 2017 in brief:
- Net sales decreased by 3.8% to EUR 270.1 million (Q3 2016: 280.8)- Comparable net sales1) increased by 1.1%- Comparable2) EBITA increased by 17% to EUR 29.1 million (24.9)- EBITA increased to EUR 30.5 million (23.4)- Cash flow from operating activities before financial items and taxes amounted to EUR 24.8 million (40.3)- Earnings per share (EPS) were EUR 1.20 (0.52). Operative earnings per share3) totaled EUR 0.25 (0.15)
January–September 2017 in brief:
- Net sales decreased by 0.5% to EUR 866.3 million (Q1–Q3 2016: 870.5)- Comparable net sales1) increased by 2.2%- Comparable2) EBITA increased by 18% to EUR 83.5 million (70.8)- EBITA increased to EUR 82.7 million (68.6)- Cash flow from operating activities before financial items and taxes amounted to EUR 27.0 million (43.2)- Earnings per share (EPS) were EUR 2.59 (0.27). Operative earnings per share3) totaled EUR 0.59 (0.33)
Specified outlook for 2017:
Fiskars expects the Group’s net sales, excluding the net sales of businesses divested in 2016 (2016: EUR 1,180 million) and comparable EBITA (2016: EUR 107 million) to increase from the previous year. Should the weakening of the U.S. dollar continue during the remainder of the year, the net sales, excluding the net sales of businesses divested in 2016, may stay at the same level with the previous year, due to the translation exposure. Fiskars expects the comparable net sales to increase from the previous year.
Previous outlook for 2017:
Fiskars estimated in its half-year report of August 1, 2017 that the Group’s net sales, excluding the net sales of businesses divested in 2016 (2016: EUR 1,180 million) and comparable EBITA (2016: EUR 107 million) will increase from the previous year.
President and CEO, Fiskars, Jaana Tuominen:
”Fiskars Group increased its comparable net sales and comparable EBITA during the third quarter of 2017. The Scandinavian Living business was clearly the highlight of the quarter as it continued to perform strongly. I was also pleased to see the comparable net sales increase in the Functional business, with a significant year-on-year increase in the comparable EBITA.
The third quarter results demonstrated our positive business momentum, even if some challenges remain. Many of our brands grew their net sales and strengthened their position in the marketplace. The trading challenges especially in the U.S. continued to constrain the English & Crystal Living business. As the transformation of the retail sector continues, we have ongoing initiatives to help us compete in the rapidly changing business environment. Building on our mission to create a family of iconic lifestyle brands, we continued to develop our key international brands Fiskars, Gerber, Iittala, Royal Copenhagen, Waterford, and Wedgwood.
The Functional business progressed during the third quarter, supported by the garden and yard care as well as the school, office and craft categories and successful fall campaigns. In honor of the 50th anniversary of Fiskars’ orange-handled scissors, we held an exhibition at the Design Museum in Helsinki. With over a billion pairs sold world-wide, these scissors have made Fiskars the biggest scissors brand in the world. For the third year in a row, the Functional business achieved another sales record in the U.S. during the Back to School season, supported by the recognition from teachers as Fiskars won for kids scissors two Teachers’ Choice Awards.
Our team is ready to make progress during the important fourth quarter, which was very strong last year. I’m proud to be part of the Fiskars team and lead the company forward on its journey. We aspire to continue to grow profitably, supported by the strong position in our core markets, a family of great brands and plenty of opportunities to fulfil our promise of making the everyday extraordinary.”
Q3 2017 | 1
1) Using comparable exchange rates, excluding the divested Spring USA (September 2016) and the divested container gardening businessesin the U.S. (January 2016) and Europe (December 2016)
2) Items affecting comparability in EBITA include items such as restructuring costs, impairment or provisions charges and releases, integrationrelated costs, and gain and loss from the sale of businesses
3) Operative earnings per share do not include net changes in the fair value of the investment portfolio and dividends received
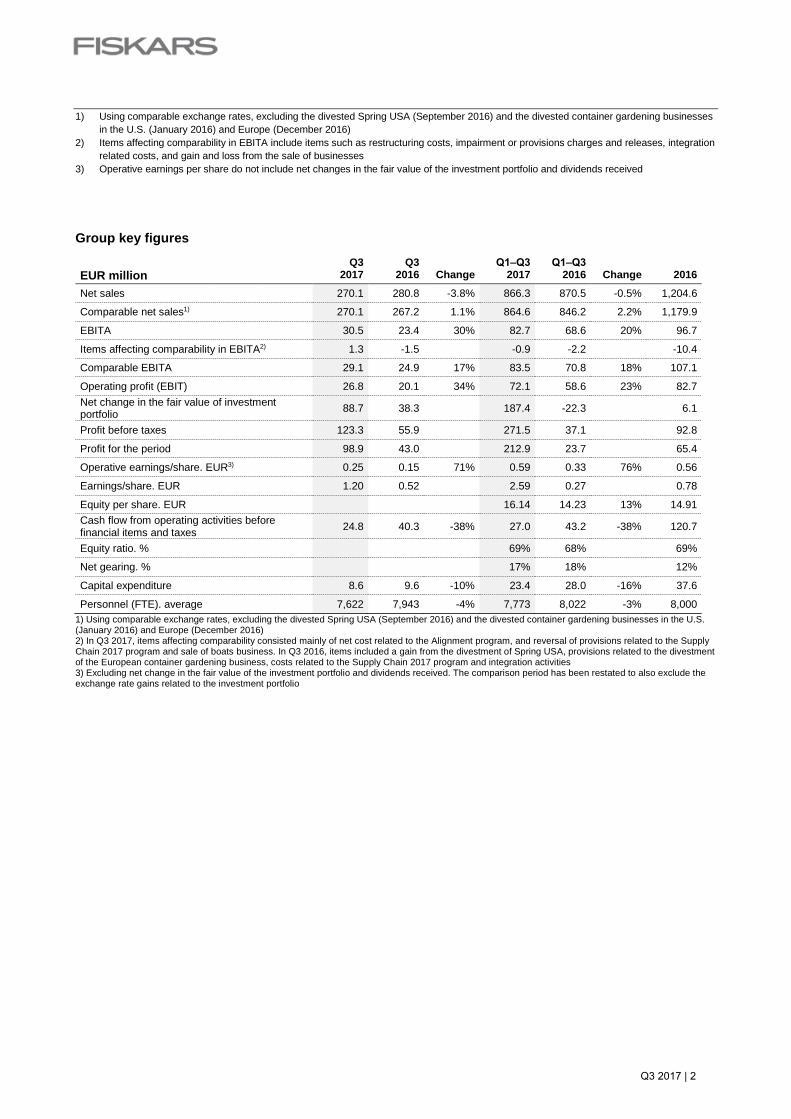
Group key figures
Q3 Q3 Q1‒Q3 Q1‒Q3
EUR million 2017 2016 Change 2017 2016 Change 2016
Net sales 270.1 280.8 -3.8% 866.3 870.5 -0.5% 1,204.6
Comparable net sales1) 270.1 267.2 1.1% 864.6 846.2 2.2% 1,179.9
EBITA 30.5 23.4 30% 82.7 68.6 20% 96.7
Items affecting comparability in EBITA2) 1.3 -1.5 -0.9 -2.2 -10.4
Comparable EBITA 29.1 24.9 17% 83.5 70.8 18% 107.1
Operating profit (EBIT) 26.8 20.1 34% 72.1 58.6 23% 82.7 Net change in the fair value of investment portfolio 88.7 38.3 187.4 -22.3 6.1
Profit before taxes 123.3 55.9 271.5 37.1 92.8
Profit for the period 98.9 43.0 212.9 23.7 65.4
Operative earnings/share. EUR3) 0.25 0.15 71% 0.59 0.33 76% 0.56
Earnings/share. EUR 1.20 0.52 2.59 0.27 0.78
Equity per share. EUR 16.14 14.23 13% 14.91 Cash flow from operating activities before financial items and taxes 24.8 40.3 -38% 27.0 43.2 -38% 120.7
Equity ratio. % 69% 68% 69%
Net gearing. % 17% 18% 12%
Capital expenditure 8.6 9.6 -10% 23.4 28.0 -16% 37.6
Personnel (FTE). average 7,622 7,943 -4% 7,773 8,022 -3% 8,000 1) Using comparable exchange rates, excluding the divested Spring USA (September 2016) and the divested container gardening businesses in the U.S. (January 2016) and Europe (December 2016)2) In Q3 2017, items affecting comparability consisted mainly of net cost related to the Alignment program, and reversal of provisions related to the Supply Chain 2017 program and sale of boats business. In Q3 2016, items included a gain from the divestment of Spring USA, provisions related to the divestment of the European container gardening business, costs related to the Supply Chain 2017 program and integration activities 3) Excluding net change in the fair value of the investment portfolio and dividends received. The comparison period has been restated to also exclude the exchange rate gains related to the investment portfolio
Q3 2017 | 2

INTERIM REPORT, JANUARY–SEPTEMBER 2017
GROUP PERFORMANCE
Q3 Q3
Comparable Q1‒Q3 Q1‒Q3
Comparable EUR million 2017 2016 Change change* 2017 2016 Change change* 2016
Net sales Group 270.1 280.8 -3.8% 1.1% 866.3 870.5 -0.5% 2.2% 1,204.6
Living 133.8 144.8 -7.6% -1.7% 386.1 398.7 -3.2% 0.4% 598.1
Functional 135.4 134.9 0.4% 4.2% 477.3 468.8 1.8% 3.7% 602.7
Other 0.9 1.1 -14.4% -14.4% 2.8 3.0 -6.6% -6.6% 3.8
Comparable EBITA Group 29.1 24.9 17% 83.5 70.8 18% 107.1
Living 17.9 16.9 6% 32.5 20.0 62% 59.4
Functional 13.6 9.8 40% 58.7 56.5 4% 57.1
Other -2.3 -1.8 -30% -7.6 -5.7 -33% -9.5 *Using comparable exchange rates, excluding the divested Spring USA (September 2016) and the divested container gardening businesses in the U.S. (January 2016) and Europe (December 2016)
Fiskars Group in Q3 2017
Fiskars Group’s consolidated net sales decreased by 3.8% to EUR 270.1 million (Q3 2016: 280.8, which included EUR 5.5 million from divested businesses). Comparable net sales increased by 1.1%, supported by an increase in the Functional segment. The comparable EBITA (excluding items affecting comparability) increased by 17% to EUR 29.1 million (24.9), supported by the performance of both the Living and Functional segments. Items affecting comparability in EBITA amounted to EUR -1.3 million (1.5) and were mainly related to the Alignment and the Supply Chain programs. Fiskars Group’s third quarter EBITA totaled EUR 30.5 million (23.4). Fiskars Group in January–September 2017
Fiskars Group’s consolidated net sales decreased by 0.5% to EUR 866.3 million (Q1–Q3 2016: 870.5). Comparable net sales increased by 2.2%, supported by an increase in both the Functional and Living segments. The comparable EBITA increased by 18% to EUR 83.5 million (70.8), supported by the performance of the Living and Functional segments during the first nine months of the year. Items affecting comparability in EBITA amounted to EUR 0.9 million (2.2) during January–September, and were mainly related to the Alignment and the Supply Chain programs. Fiskars Group’s EBITA totaled EUR 82.7 million (68.6) during the first nine months of the year.
OPERATING ENVIRONMENT IN Q3 2017
The world economy in general, and the economy in regions where Fiskars primarily operates, have continued to improve, with increasing retail and consumer confidence in many countries, including Finland. In the U.S., consumer confidence remained strong despite a slight decline in September, which was caused by hurricane damage in Texas and Florida. In the UK, the decreasing purchasing power and uncertainty around Brexit still weighted on consumer confidence. Economic data continued to show a modest improvement in Japan and some other Asian countries. In Australia, spending was affected by continuously subdued consumer confidence and weak wage increases, even though business conditions have improved. The transformation of the retail sector continues, as traditional brick and mortar channels declined with consumers moving to online channels. Department stores and the sporting goods sector are most notably affected by the change. This has continued to impact mainly the living category, as well as some outdoor categories. The transformation is seen in many markets, but is still most visible in the U.S. market.
Q3 2017 | 3

REPORTING SEGMENTS
This Q3 interim report reflects Fiskars’ organizational structure that features two Strategic Business Units (SBU): Living and Functional. As of January 1, 2017 Fiskars Group’s three primary reporting segments are Living, Functional, and Other. In addition, Fiskars reports net sales for three geographical areas: Europe, Americas, and Asia-Pacific. SBU Living offers premium and luxury products for tabletop, giftware and interior décor. It consists of the English & Crystal Living and Scandinavian Living businesses. English & Crystal Living business includes brands such as Waterford, Wedgwood, Royal Albert, and Royal Doulton. Scandinavian Living business includes brands such as Iittala, Royal Copenhagen, Rörstrand, and Arabia. SBU Functional provides tools for use in and around the house as well as outdoors. SBU Functional consists of Functional Americas, Functional EMEA and Outdoor businesses, and includes brands such as Fiskars, Gerber, and Gilmour. The Other segment contains the Group’s investment portfolio, the real estate unit, corporate headquarters and shared services. Living segment
Q3 Q3
Q1‒Q3 Q1‒Q3 EUR million 2017 2016 Change 2017 2016 Change 2016
Net sales* 133.8 144.8 -7.6% 386.1 398.7 -3.2% 598.1
Comparable EBITA 17.9 16.9 6% 32.5 20.0 62% 59.4
Capital expenditure 3.6 3.1 14% 7.2 9.9 -27% 14.9 *Using comparable exchange rates and excluding the net sales of the divested Spring USA (September 2016), net sales in the Living segment decreased by 1.7% in Q3 2017 and increased by 0.4 % in Q1–Q3 2017
Living segment in Q3 2017
Net sales in the Living segment decreased year-on-year and amounted to EUR 133.8 million (Q3 2016: 144.8). Comparable net sales decreased by 1.7%, impacted by the English & Crystal Living business. The net sales in the Scandinavian Living business, in particular in the Nordic countries, continued to increase during the third quarter. The increase was driven by the Finland 100th anniversary products from the Arabia and Iittala brands, customer campaigns, as well as the Royal Copenhagen, and Rörstrand brands. The increase was offset by the decrease in net sales in the English & Crystal Living business, impacted primarily by the challenges in the department store channels in the U.S and discontinuing business with select customers. Net sales grew among others in the hospitality and own e-commerce channels. Comparable EBITA for the Living segment increased by 6% and amounted to EUR 17.9 million (16.9), driven by the performance of the Scandinavian Living business, partly offset by the English & Crystal Living business. Living segment in January–September 2017
Net sales in the Living segment decreased by 3.2% to EUR 386.1 million (Q1–Q3 2016: 398.7) during the first nine months of the year. Comparable net sales increased by 0.4%, driven by the Scandinavian Living net sales, offset by the decrease in the English & Crystal Living business in the U.S. Comparable EBITA for the Living segment increased by 62% and totaled EUR 32.5 million (20.0) during the first nine months of the year, driven by the performance of the Scandinavian Living business. Marketing highlights in the Living segment
The modern classic and one of Iittala’ most beloved series, Taika tableware, celebrated its 10-year anniversary with a successful campaign and new product introductions. Rörstrand’s Swedish Grace Rose collection started collaboration with Pink Ribbon, a non-profit organization aimed to support breast cancer patients.
Q3 2017 | 4

Wedgwood participated for the first time in the British Ceramics Biennial. The objective of this festival is to showcase and celebrate ceramics from across the world as an important part of the culture. The partnership includes special exhibitions from world renowned artists and students.
Functional segment
Q3 Q3
Q1‒Q3 Q1‒Q3 EUR million 2017 2016 Change 2017 2016 Change 2016
Net sales* 135.4 134.9 0.4% 477.3 468.8 1.8% 602.7
Comparable EBITA 13.6 9.8 40% 58.7 56.5 4% 57.1
Capital expenditure 3.1 6.2 -50% 11.0 16.1 -32% 21.8 *Using comparable exchange rates and excluding the net sales of the divested container gardening businesses in the U.S (in January 2016) and Europe (in December 2016), net sales in the Functional segment increased by 4.2% in Q3 2017 and by 3.7% in Q1–Q3 2017
Functional segment in Q3 2017
Net sales in the Functional segment increased by 0.4% to EUR 135.4 million (Q3 2016: 134.9). Comparable net sales increased by 4.2%, supported by the fall campaigns in the U.S. and Europe, offsetting the decline in the Outdoor business. The net sales decreased in the Outdoor business due to the challenges in the sporting goods sector as well as the timing of orders shifting to the fourth quarter. The Functional segment broke another record during the Back to School season in the U.S, with several top-selling scissors. In addition, the net sales increased in the Functional EMEA due to the tidy up fall campaigns, which have become an important seasonal activity after the peak season in spring. Comparable EBITA for the Functional segment increased by 40% during the third quarter and amounted to EUR 13.6 million (9.8), driven by the Functional EMEA and Functional Americas businesses, offsetting the decline in the Outdoor business. Functional segment in January–September 2017
Net sales in the Functional segment increased by 1.8% to EUR 477.3 million (Q1–Q3 2016: 468.8) during the first nine months of the year. Comparable net sales increased by 3.7%, supported by the growth in Functional EMEA and Functional Americas businesses, offsetting the decline in the Outdoor business in the U.S. Comparable EBITA for the Functional segment increased by 4% and totaled EUR 58.7 million (56.5) during the first nine months of the year, driven by the Functional EMEA and Functional Americas businesses, offsetting the decline in the Outdoor business in the U.S. Marketing highlights in the Functional segment
Fiskars’ orange-handled scissors celebrate their 50th anniversary in 2017. With over a billion pairs sold world-wide, they have made Fiskars the biggest scissors brand in the world. In honor of the event, Fiskars invited artists and creative individuals from around the world to participate in the ‘Our Scissors’ exhibition with their inspired birthday greetings at the Design Museum in Helsinki. Gerber entered a new category as it introduced a new fishing collection for the adventurous angler, with sales starting in the U.S. in 2018. In addition, Gerber teamed up with Hobie Kayaks - an influential leader in the kayak fishing market. Learning® Magazine awarded Fiskars two 2018 Teachers' Choice Awards for the Classroom in the U.S. The Color Change Student Scissors and Color Change Pointed-Tip Kids Scissors were selected as the very best in classroom-tested, teacher-recommended products.
Q3 2017 | 5
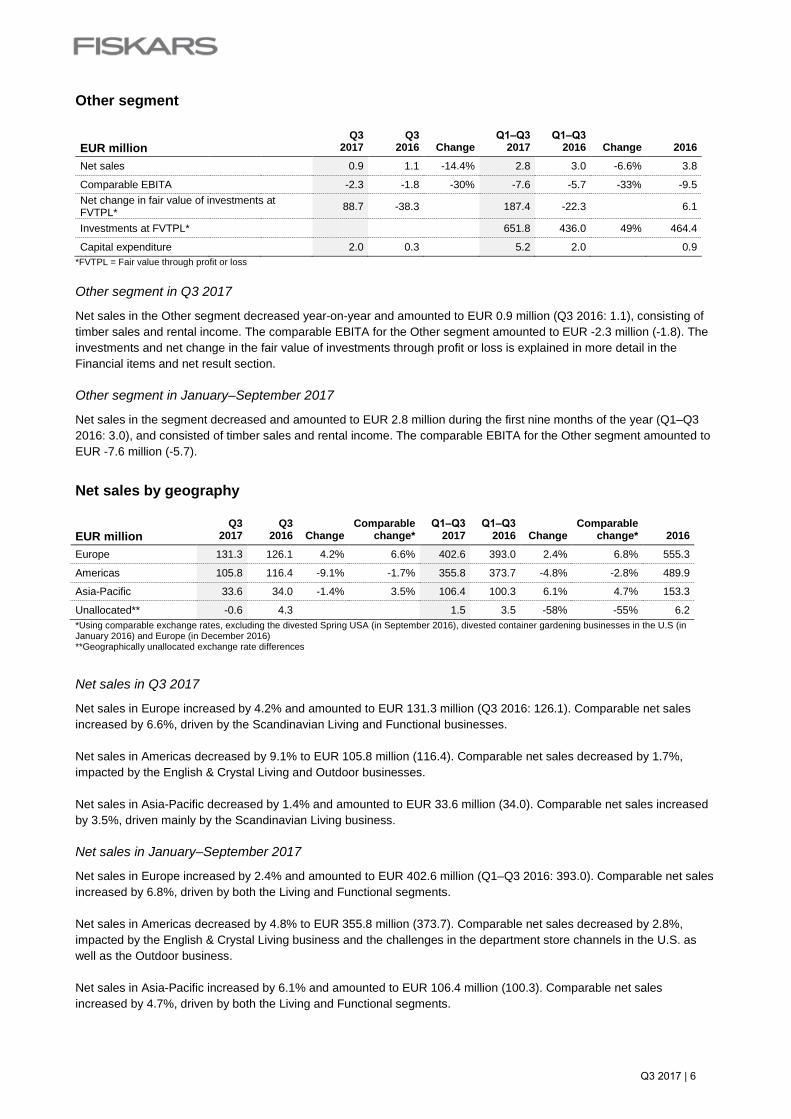
Other segment
Q3 Q3
Q1‒Q3 Q1‒Q3 EUR million 2017 2016 Change 2017 2016 Change 2016
Net sales 0.9 1.1 -14.4% 2.8 3.0 -6.6% 3.8
Comparable EBITA -2.3 -1.8 -30% -7.6 -5.7 -33% -9.5 Net change in fair value of investments at FVTPL* 88.7 -38.3 187.4 -22.3 6.1
Investments at FVTPL* 651.8 436.0 49% 464.4
Capital expenditure 2.0 0.3 5.2 2.0 0.9 *FVTPL = Fair value through profit or loss Other segment in Q3 2017
Net sales in the Other segment decreased year-on-year and amounted to EUR 0.9 million (Q3 2016: 1.1), consisting of timber sales and rental income. The comparable EBITA for the Other segment amounted to EUR -2.3 million (-1.8). The investments and net change in the fair value of investments through profit or loss is explained in more detail in the Financial items and net result section. Other segment in January–September 2017
Net sales in the segment decreased and amounted to EUR 2.8 million during the first nine months of the year (Q1–Q3 2016: 3.0), and consisted of timber sales and rental income. The comparable EBITA for the Other segment amounted to EUR -7.6 million (-5.7).
Net sales by geography
Q3 Q3
Comparable Q1‒Q3 Q1‒Q3
Comparable
EUR million 2017 2016 Change change* 2017 2016 Change change* 2016
Europe 131.3 126.1 4.2% 6.6% 402.6 393.0 2.4% 6.8% 555.3
Americas 105.8 116.4 -9.1% -1.7% 355.8 373.7 -4.8% -2.8% 489.9
Asia-Pacific 33.6 34.0 -1.4% 3.5% 106.4 100.3 6.1% 4.7% 153.3
Unallocated** -0.6 4.3 1.5 3.5 -58% -55% 6.2 *Using comparable exchange rates, excluding the divested Spring USA (in September 2016), divested container gardening businesses in the U.S (in January 2016) and Europe (in December 2016) **Geographically unallocated exchange rate differences
Net sales in Q3 2017
Net sales in Europe increased by 4.2% and amounted to EUR 131.3 million (Q3 2016: 126.1). Comparable net sales increased by 6.6%, driven by the Scandinavian Living and Functional businesses. Net sales in Americas decreased by 9.1% to EUR 105.8 million (116.4). Comparable net sales decreased by 1.7%, impacted by the English & Crystal Living and Outdoor businesses. Net sales in Asia-Pacific decreased by 1.4% and amounted to EUR 33.6 million (34.0). Comparable net sales increased by 3.5%, driven mainly by the Scandinavian Living business. Net sales in January–September 2017
Net sales in Europe increased by 2.4% and amounted to EUR 402.6 million (Q1–Q3 2016: 393.0). Comparable net sales increased by 6.8%, driven by both the Living and Functional segments. Net sales in Americas decreased by 4.8% to EUR 355.8 million (373.7). Comparable net sales decreased by 2.8%, impacted by the English & Crystal Living business and the challenges in the department store channels in the U.S. as well as the Outdoor business. Net sales in Asia-Pacific increased by 6.1% and amounted to EUR 106.4 million (100.3). Comparable net sales increased by 4.7%, driven by both the Living and Functional segments.
Q3 2017 | 6

Research and development
The Group’s research and development expenditure totaled EUR 3.7 million (Q3 2016: 3.9) in the third quarter of 2017, equivalent to 1.4% (1.4%) of net sales. During the first nine months of the year, research and development expenses totaled EUR 12.4 million (Q1–Q3 2016: 13.1), equivalent to 1.4% (1.5%) of net sales. Personnel
The average number of full-time equivalent employees (FTE) was 7,622 (Q3 2016: 7,943) in the third quarter. At the end of the quarter, the Group employed 8,073 (8,551) employees, of whom 1,201 (1,199) were in Finland. The year-on-year change was mainly related to the divestments, the Alignment program and unified definitions among retail and manufacturing personnel. Fiskars’ transformation process
With the vision to create a positive, lasting impact on the quality of life we live – making the everyday extraordinary, Fiskars is on a transformation journey to become an integrated consumer goods company with a family of iconic lifestyle brands. The company took steps during the third quarter of 2017 to move this process forward. Alignment program
In November 2016, Fiskars launched the Alignment program to proceed in the transformation. The program focuses on the structural changes in the organization, proposed headcount reductions, and the full integration of the English & Crystal Living business, acquired in 2015. The net headcount reduction was estimated to be 130 positions globally. The total costs of the program are approximately EUR 15 million in 2016–2017. They are recorded as items affecting comparability in EBITA, of which EUR 10.9 million had been recorded by the end of the third quarter of 2017. The targeted annual cost savings are approximately EUR 14 million, subject to the full implementation of the program. The targeted cost savings will be achieved gradually, starting in 2017 and with the full effect in 2018. Supply Chain 2017 program
During the third quarter of 2015, Fiskars announced a restructuring program to optimize its global supply chain network in Europe and Asia. The Supply Chain 2017 program aims to improve the competitiveness of Fiskars’ manufacturing operations and distribution network. The total costs of the program are approximately EUR 20 million between 2015 and 2017. They are reported as items affecting comparability in EBITA, of which EUR 10.4 million had been recorded by the end of the third quarter of 2017. The targeted annual cost savings are approximately EUR 8 million, subject to the full implementation of the program. The targeted cost savings will be achieved gradually, and the majority of the savings are expected to materialize in the Group’s results after the program has been completed. The program is expected to be completed by the end of 2017. Financial items and net result
Financial items and net result in Q3 2017 and January‒September 2017
Along with the rest of the Group’s active investments, the share ownership in the Wärtsilä Corporation is treated as financial asset at fair value through profit or loss, which increases the volatility of Fiskars’ net results. At the end of the third quarter of 2017, Fiskars owned 10,881,781 shares in Wärtsilä, representing 5.52% of Wärtsilä’s share capital. The net change in the fair value of investments through profit or loss, consisting of the company’s holdings in Wärtsilä, amounted to EUR 88.7 million (Q3 2016: 38.3) during the third quarter of 2017, and to EUR 187.4 million (Q1‒Q3 2016: -22.3) during the first nine months of the year. The closing share price of Wärtsilä was EUR 59.90 (40.07) at the end of the third quarter. Other financial income and expenses amounted to EUR 7.7 million (-2.3) in the third quarter of 2017, including EUR 7.1 million (0.0) in dividends received on Wärtsilä shares, and to EUR 11.7 million (1.7) in the first nine months of 2017, including EUR 14.1 million (13.1) in dividends received on Wärtsilä shares, EUR -0.7 million (-4.7) of foreign exchange differences and EUR -3.7 million (-5.4) in interest costs. Profit before taxes was EUR 123.3 million (55.9) in the third quarter of 2017. Income taxes for the third quarter were EUR -24.4 million (-12.9), the change from last year being mainly due to the change in the market value of the Wärtsilä holding. Earnings per share were EUR 1.20 (0.52). Operative earnings per share, excluding the net change in the fair
Q3 2017 | 7

value of the investment portfolio and dividends received were EUR 0.25 (0.15). The comparison period figure for operative earnings per share has been restated to also exclude the exchange rate gains related to the investment portfolio. Profit before taxes for the first nine months of the year was EUR 271.5 million (37.1). Income taxes in the first nine months of the year were EUR -58.6 million (-13.5), the change from last year being mainly due to the change in the market value of the Wärtsilä holding. Earnings per share were EUR 2.59 (0.27). Operative earnings per share, excluding the net change in the fair value of the investment portfolio and dividends received were EUR 0.59 (0.33).
Cash flow, balance sheet and financing
Cash flow, balance sheet and financing in Q3 2017 and January‒September 2017
The third-quarter cash flow from operating activities before financial items and taxes amounted to EUR 24.8 million (Q3 2016: 40.3). The decrease was primarily due to the high amount of trade receivables related to timing of sales. Cash flow from financial items and taxes amounted to EUR 0.9 million (-30.1). Cash flow from investing activities was EUR -3.4 million (8.5), including EUR 7.6 million of capital expenditure on fixed assets and EUR 7.1 million of dividends on Wärtsilä shares. Cash flow from financing activities was EUR -24.1 million (-41.3), including EUR 24.6 million of paid dividends. The comparison figure from Q3 2016 included EUR -39.6 million of changes in current debt. During the first nine months of the year, cash flow from operating activities before financial items and taxes amounted to EUR 27.0 million (Q1‒Q3 2016: 43.2). Cash flow from financial items and taxes amounted to EUR -15.3 million (-31.2). Cash flow from investing activities was EUR -8.8 million (88.6, including the positive cash flow of EUR 61.7 million from the sale of investments in short-term interest rate funds and EUR 25.8 million from the sale of non-current assets held for sale), including capital expenditure on fixed assets of EUR 24.0 million, positive cash flow from sale of property of EUR 2.7 million and received dividends of EUR 14.1 million. Cash flow from financing activities was EUR -7.9 million (-88.0) during the first nine months of the year 2017, including the positive cash flow of EUR 22.0 million from the money market investments, EUR 83.0 million (58.8) in payment of dividends and a EUR 53.0 million (-26.1) increase in current debt. Capital expenditure for the third quarter totaled EUR 7.6 million (9.6), mainly relating to expansions and IT solutions. Depreciation, amortization and impairment were EUR 9.2 million (9.1) in the third quarter. Capital expenditure for the first nine months of the year totaled EUR 24.0 million (28.0) and depreciation, amortization, and impairment were EUR 27.9 million (27.3). Fiskars’ working capital totaled EUR 252.5 million (242.0) at the end of September. The increase was primarily related to the high amount of trade receivables related to timing of sales. The equity ratio was 69% (68%) and net gearing was 17% (18%). Cash and cash equivalents at the end of the period totaled EUR 13.0 million (31.8). Net interest-bearing debt amounted to EUR 226.3 million (211.3). In addition, the shares in Wärtsilä were valued at EUR 651.8 million (436.0) at the end of the third quarter. Short-term borrowing totaled EUR 88.5 million (61.3) and long-term borrowing totaled EUR 151.9 million (183.1). Short-term borrowing mainly consisted of commercial papers. In addition, Fiskars had EUR 300.0 million (300.0) in unused, committed long-term credit facilities with Nordic banks. Changes in organization and management
On February 10, 2017 Fiskars appointed Sari Pohjonen, M.Sc. (Econ) as Chief Financial Officer of Fiskars Group and a member of the Executive Leadership Team. On February 15, 2017 Kari Kauniskangas, President and CEO of Fiskars Corporation, announced his resignation from the position. The Board of Directors appointed Teemu Kangas-Kärki, the deputy to the CEO and Fiskars’ Chief Operating Officer, as interim President and CEO. On March 31, 2017 Fiskars appointed Paul Tonnesen, MBA, B.Sc. (Marketing) as President, SBU Functional and a member of the Executive Leadership Team.
Q3 2017 | 8
On June 20, 2017 the Board of Directors of Fiskars Corporation appointed M.Sc. (Chem. Eng) Jaana Tuominen as President and CEO of Fiskars Corporation, and announced on August 10, 2017 that her starting date will be October 9, 2017. Shares and shareholders
Fiskars Corporation has one share series (FSKRS). All shares carry one vote and equal rights. The number of shares in the Corporation totals 81,905,242. Fiskars Corporation held 191,467 of its own shares at the end of the quarter. The share capital remained unchanged at EUR 77,510,200.
Fiskars shares are traded in the Large Cap segment of Nasdaq Helsinki. The volume weighted average share price during the third quarter was EUR 20.63 (Q3 2016: 17.41). At the end of September, the closing price was EUR 20.35 (EUR 17.53) per share and Fiskars had a market capitalization of EUR 1,662.9 million (1,433.6). The number of shares traded on Nasdaq Helsinki and in alternative market places from July to September was 2.4 million (0.5), which represents 2.9% (0.6%) of the total number of shares.
The total number of shareholders was 19,375 (18,548) at the end of September 2017. Flagging notifications
Fiskars did not receive notifications on changes in holdings under the Finnish Securities Markets Act. Risks and business uncertainties
Fiskars’ business, net sales, and financial performance may be affected by several uncertainties. Fiskars Group has detailed the overall business risks and risk management in its Annual Report and on the company’s website at www.fiskarsgroup.com/investors. Fiskars Group entities are subject to tax audits in several countries. It is possible that tax audits may lead to reassessment of taxes. In July 2016 Fiskars received a tax reassessment decision from the Finnish Large Taxpayers’ Office, which obliged the company to pay a total of EUR 28.3 million in additional tax, interest expenses and punitive tax increases as a result of a tax audit carried out in 2014. Fiskars and its external advisors consider the decision unfounded and did not recognize the related taxes and other costs in the income statement. Fiskars has appealed the decision to the Board of Adjustment in the Finnish Large Taxpayers' Office. Fiskars will continue the appeal process in court, if necessary, in which case the process may take years. The dispute concerns intra-group loans forgiven by the company in 2003 and their tax treatment in subsequent tax years. Fiskars operates globally with a considerable part of its business in the U.S. The U.S. dollar has weakened during the first nine months of the year, and should the weakening continue, the translation exposure may have a material impact on reported financial figures. Fiskars’ currency position is split between its transaction position and translation position, both of which are managed separately. The transaction position is explained in more detail in the table section under the heading Exchange rate sensitivity of the operations. Otherwise, no new or changed material risks and uncertainty factors have been identified during the quarter. Events after the reporting period
Jaana Tuominen (M.Sc., Chem. Eng) started as President and CEO of Fiskars Corporation on October 9, 2017. The appointment was announced on June 20, 2017.
Teemu Kangas-Kärki has acted as Interim President and CEO since February 2017. Teemu Kangas-Kärki resumed the role as Chief Operating Officer, member of the Executive Leadership team and Deputy to the CEO. Outlook for 2017 specified
Fiskars expects the Group’s net sales, excluding the net sales of businesses divested in 2016 (2016: EUR 1,180 million) and comparable EBITA (2016: EUR 107 million) to increase from the previous year. Should the weakening of the U.S. dollar continue during the remainder of the year, the net sales, excluding the net sales of businesses divested in 2016, may stay at the same level with the previous year, due to the translation exposure. Fiskars expects the comparable net sales to increase from the previous year.
Q3 2017 | 9
Previous outlook for 2017
Fiskars estimated in its half-year report of August 1, 2017 that the Group’s net sales, excluding the net sales of businesses divested in 2016 (2016: EUR 1,180 million) and comparable EBITA (2016: EUR 107 million) will increase from the previous year.
The comparable EBITA excludes restructuring costs, impairment charges, integration-related costs, and gain and loss from the sale of businesses. The fourth quarter is significant both in terms of net sales and profitability. Fiskars’ Other segment includes investments, which are treated as financial assets at fair value through profit or loss. This increases the volatility of Fiskars’ financial items and taxes in the profit and loss statement and thus the volatility of Fiskars’ net results and earnings per share.
Helsinki, Finland, October 30, 2017 FISKARS CORPORATION Board of Directors
Q3 2017 | 10

CONSOLIDATED INCOME STATEMENT
Q3 Q3 Q1‒Q3 Q1‒Q3 Q1‒Q4
EUR million 2017 2016 Change % 2017 2016 Change % 2016
Net sales 270.1 280.8 -4 866.3 870.5 0 1,204.6
Cost of goods sold -155.0 -168.0 -8 -493.5 -516.1 -4 -701.8
Gross profit 115.2 112.8 2 372.8 354.4 5 502.9
Other operating income 2.2 6.5 -66 5.3 15.8 -67 18.5
Sales and marketing expenses -65.1 -67.7 -4 -218.7 -214.5 2 -298.3
Administration expenses -21.5 -26.7 -19 -73.6 -81.8 -10 -115.0
Research and development costs -3.7 -3.9 -6 -12.4 -13.1 -5 -18.0
Other operating expenses -0.3 -0.9 -65 -1.3 -2.2 -41 -7.4
Operating profit (EBIT)* 26.8 20.1 34 72.1 58.6 23 82.7
Change in fair value of biological assets 0.1 -0.2 0.4 -0.9 -0.5
88.7 38.3 187.4 -22.3 6.1
Other financial income and expenses 7.7 -2.3 11.7 1.7 4.4
Profit before taxes 123.3 55.9 271.5 37.1 92.8
Income taxes -24.4 -12.9 -58.6 -13.5 -27.4
Profit for the period 98.9 43.0 212.9 23.7 65.4
Attributable to:
Equity holders of the parent company 98.7 42.6 212.4 22.5 64.1
Non-controlling interest 0.2 0.4 0.5 1.2 1.3
Earnings for equity holders of the parent company
per share, euro (basic and diluted) 1.20 0.52 2.59 0.27 0.78
*Comparable EBITA (detailed in notes) 29.1 24.9 17 83.5 70.8 18 107.1
CONSOLIDATED STATEMENT OF COMPREHENSIVE INCOME
Q3 Q3 Q1‒Q3 Q1‒Q3 Q1‒Q4
EUR million 2017 2016 2017 2016 2016
Profit for the period 98.9 43.0 212.9 23.7 65.4
Other comprehensive income for the period
Items that may be reclassified subsequently to profit or loss
Translation differences -6.6 3.1 -25.8 11.4 25.1
Cash flow hedges 0.1 0.2 0.5 -0.5 -0.3
Items that will not be reclassified to profit or loss
-0.0 -0.6 0.7 -0.2 -0.3
Other comprehensive income for the period net of tax total -6.5 2.6 -24.6 10.7 24.5
Total comprehensive income for the period 92.4 45.6 188.3 34.3 89.9
Attributable to:
Equity holders of the parent company 92.2 45.3 188.1 33.1 88.5
Non-controlling interest 0.2 0.4 0.2 1.2 1.4
Investments at fair value through profit or loss - net change in fair value
Defined benefit plan, actuarial gains (losses) net of tax
Q3 2017 | 11

CONSOLIDATED BALANCE SHEET
Sep 30 Sep 30 Dec 31
EUR million 2017 2016 Change % 2016
ASSETS
Non-current assets
Goodwill 222.7 226.4 -2 229.7
Other intangible assets 284.5 294.6 -3 296.3
Property, plant & equipment 152.3 158.4 -4 159.7
Biological assets 41.3 40.5 2 40.9
Investment property 5.3 4.7 13 4.9
Financial assets
Financial assets at fair value through profit or loss 21.4 15.7 36 20.4
Other investments 9.1 10.3 -12 9.7
Deferred tax assets 30.7 37.4 -18 30.2
Non-current assets total 767.3 788.1 -3 791.7
Current assets
Inventories 228.6 228.4 0 224.6
Trade and other receivables 212.7 189.9 12 203.6
Income tax receivables 34.5 31.9 8 35.9
Interest-bearing receivables 0.0 0.0 22.0
Investments at fair value through profit or loss 651.8 436.0 49 464.4
Cash and cash equivalents 13.0 31.8 -59 17.7
Current assets total 1,140.6 918.1 24 968.3
Non-current assets held for sale 2.3
Assets total 1,907.9 1,708.4 12 1,760.1
EQUITY AND LIABILITIES
Equity
Equity attributable to the equity holders of the parent company 1,318.7 1,163.9 13 1,218.1
Non-controlling interest 2.6 1.8 46 1.9
Equity total 1,321.3 1,165.7 13 1,220.1
Non-current liabilities
Interest-bearing liabilities 151.9 183.1 -17 182.4
Other liabilities 6.2 9.5 -35 9.9
Deferred tax liabilities 89.3 47.7 87 52.7
Pension liability 13.0 14.2 -9 14.1
Provisions 5.4 8.1 -34 7.1
Non-current liabilities total 265.8 262.6 1 266.2
Current liabilities
Interest-bearing liabilities 88.5 61.3 44 10.9
Trade and other payables 209.3 198.4 5 237.8
Income tax liabilities 14.0 9.8 42 8.6
Provisions 9.0 10.7 -15 16.6
Current liabilities total 320.8 280.2 15 273.8
Equity and liabilities total 1,907.9 1,708.4 12 1,760.1
Q3 2017 | 12
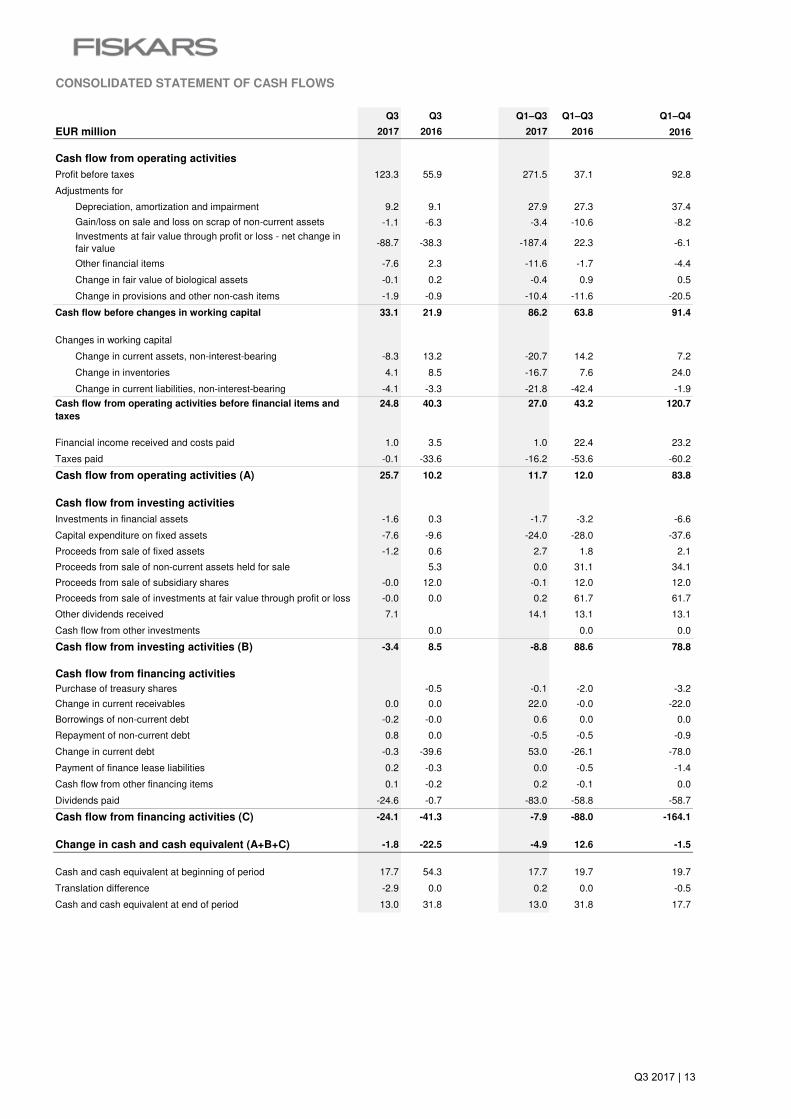
CONSOLIDATED STATEMENT OF CASH FLOWS
Q3 Q3 Q1‒Q3 Q1‒Q3 Q1‒Q4
EUR million 2017 2016 2017 2016 2016
Cash flow from operating activities
Profit before taxes 123.3 55.9 271.5 37.1 92.8
Adjustments for
Depreciation, amortization and impairment 9.2 9.1 27.9 27.3 37.4
-1.1 -6.3 -3.4 -10.6 -8.2
-88.7 -38.3 -187.4 22.3 -6.1
Other financial items -7.6 2.3 -11.6 -1.7 -4.4
Change in fair value of biological assets -0.1 0.2 -0.4 0.9 0.5
Change in provisions and other non-cash items -1.9 -0.9 -10.4 -11.6 -20.5
Cash flow before changes in working capital 33.1 21.9 86.2 63.8 91.4
Changes in working capital
Change in current assets, non-interest-bearing -8.3 13.2 -20.7 14.2 7.2
Change in inventories 4.1 8.5 -16.7 7.6 24.0
Change in current liabilities, non-interest-bearing -4.1 -3.3 -21.8 -42.4 -1.9
24.8 40.3 27.0 43.2 120.7
Financial income received and costs paid 1.0 3.5 1.0 22.4 23.2
Taxes paid -0.1 -33.6 -16.2 -53.6 -60.2
Cash flow from operating activities (A) 25.7 10.2 11.7 12.0 83.8
Cash flow from investing activities
Investments in financial assets -1.6 0.3 -1.7 -3.2 -6.6
Capital expenditure on fixed assets -7.6 -9.6 -24.0 -28.0 -37.6
Proceeds from sale of fixed assets -1.2 0.6 2.7 1.8 2.1
Proceeds from sale of non-current assets held for sale 5.3 0.0 31.1 34.1
Proceeds from sale of subsidiary shares -0.0 12.0 -0.1 12.0 12.0
Proceeds from sale of investments at fair value through profit or loss -0.0 0.0 0.2 61.7 61.7
Other dividends received 7.1 14.1 13.1 13.1
Cash flow from other investments 0.0 0.0 0.0
Cash flow from investing activities (B) -3.4 8.5 -8.8 88.6 78.8
Cash flow from financing activities
Purchase of treasury shares -0.5 -0.1 -2.0 -3.2
Change in current receivables 0.0 0.0 22.0 -0.0 -22.0
Borrowings of non-current debt -0.2 -0.0 0.6 0.0 0.0
Repayment of non-current debt 0.8 0.0 -0.5 -0.5 -0.9
Change in current debt -0.3 -39.6 53.0 -26.1 -78.0
Payment of finance lease liabilities 0.2 -0.3 0.0 -0.5 -1.4
Cash flow from other financing items 0.1 -0.2 0.2 -0.1 0.0
Dividends paid -24.6 -0.7 -83.0 -58.8 -58.7
Cash flow from financing activities (C) -24.1 -41.3 -7.9 -88.0 -164.1
Change in cash and cash equivalent (A+B+C) -1.8 -22.5 -4.9 12.6 -1.5
Cash and cash equivalent at beginning of period 17.7 54.3 17.7 19.7 19.7
Translation difference -2.9 0.0 0.2 0.0 -0.5
Cash and cash equivalent at end of period 13.0 31.8 13.0 31.8 17.7
Gain/loss on sale and loss on scrap of non-current assets
Investments at fair value through profit or loss - net change in fair value
Cash flow from operating activities before financial items and
taxes
Q3 2017 | 13

CONDENSED STATEMENT OF CHANGES IN CONSOLIDATED EQUITY
Attributable to the equity holders of the parent company
Cumul. Fair Actuarial Non-
Share Treasury transl. value gains and Retained controlling
EUR million capital shares diff. reserve losses earnings interest Total
Dec 31, 2015 77.5 7.3 -1.0 -4.3 1,111.2 3.3 1,194.0
Total comprehensive income for the period 11.4 -0.5 -0.2 22.5 1.2 34.3
Changes due to divestments 0.0 -0.6 -1.3 -1.9
Purchase of treasury shares -2.0 -2.0
Dividend distribution -57.3 -1.4 -58.8
Sep 30, 2016 77.5 -2.0 18.7 -1.5 -4.5 1,075.7 1.8 1,165.7
Total comprehensive income for the period 13.5 0.2 -0.1 41.6 0.2 55.5
Changes due to divestments 0.0 0.0 0.0
Purchase of treasury shares -1.1 -1.1
Dividend distribution -0.1 -0.1
Dec 31, 2016 77.5 -3.2 32.3 -1.2 -4.6 1,117.3 1.9 1,220.1
Total comprehensive income for the period -26.4 0.5 0.7 212.4 1.1 188.3
Purchase of treasury shares -0.1 -0.1
Dividend distribution* -86.6 -0.4 -87.0
Sep 30, 2017 77.5 -3.2 6.0 -0.7 -3.9 1,243.1 2.6 1,321.3
Q3 2017 | 14
NOTES TO THE FINANCIAL STATEMENT RELEASE
ACCOUNTING PRINCIPLES
IFRS 16 Leases. According to current Leases standard, IAS17, a lessee had to separate leases to finance lease agreements booked on balance sheet and operating lease agreements classified as off-balance sheet items. According to forthcoming standard IFRS16, all of the lessees lease agreements will be booked as fixed assets to balance sheet except short-term contracts under 12 months and immaterial contracts. The standard change transfers off-balance sheet commitments to balance sheet which results to increase of fixed assets and liabilities. The amount of commitments was EUR 98 million on 30th September 2017. Agreements treated as commitments however differ from the lease agreements determined by IFRS16 and thus the amount of agreements that will be booked on balance sheet can differ from these commitments.
Based on Fiskars’ industry and business model, it acts mostly as lessee in numerous contracts. Major part of the contracts that will be booked on balance sheet are consisting of the lease contracts of stores, offices and factories. Fiskars will launch more specified assessment of standard impacts during the fourth quarter, and expects that there will be a significant impact for both accounting principles and reported figures. This change will also impact on financial indicators based on balance sheet, such as gearing.
IFRS 9 Financial Instruments and subsequent amendments. Fiskars expects the standard to primarily cause changes in the accounting principles of financial items and evaluation of impairment according to new model. The forthcoming standard enables to book the change in fair value of investments at fair value either in income statement or in other comprehensive income. In addition, it has been observed that there may be moderate impacts on the bad debt provisions of trade receivables because of the expected credit loss model introduced by standard which in most companies can change the bad debt provisions. Fiskars has continued the impact assessment of standard during third quarter and will continue this during fourth quarter after which the standard implementation will be accomplished.
The preparation of the financial statements in accordance with IFRS requires management to make estimates and assumptions that affect the valuation of the reported assets and liabilities and other information, such as contingent liabilities and the recognition of income and expenses in the income statement. Although the estimates are based on the management’s best knowledge of current events and actions, actual results may differ from the estimates.
This unaudited interim report is prepared in accordance with IAS 34 (Interim Financial Reporting) using the same accounting policies and methods of computation as in the previous annual financial statements.
All figures in the accounts have been rounded and consequently the sum of individual figures can deviate from the presented sum figure.
The Group has implemented these new or amended IAS/IFRS standards and interpretations mandatory as of 1 January 2017:- Annual Improvements to IFRS standards
On 1 January 2018, the Group will adopt IFRS 15 and IFRS 9 and on 1 January 2019 the Group will adopt IFRS 16, providing these is approved by the EU by the planned date of adoption.
IFRS 15 Revenue from Contracts with Customers. The standard introduces a five-step model for recognizing revenue. Based on IFRS15 standard, revenues are allocated in an amount that reflects the consideration to which the entity expects to be entitled in exchange for those separately identified goods or services. Recognizing revenue occurs as time passes or at a given moment and the key criterion is the transfer of control.
Fiskars expects the standard to cause changes in the accounting principles with certain items, but material changes in reported figures are not expected as major revenue types will not be significantly affected. It has been observed that in some instances the standard affects timing of recognizing license and royalty income, services purchased from customers where distinct services are expected to be separately recognized as selling costs based on fair value of the service and service-type warranties in circumstances where extra warranties or long guarantee periods are provided by Fiskars.
Fiskars has been finalizing the impact evaluation of the standard and has started actions for standard implementation during third quarter. IFRS15 project will be accomplished during the rest of the year 2017 and no major changes in Fiskars’ financial reporting are expected.
Q3 2017 | 15

REPORTING SEGMENTS
Q3 Q3 Q1‒Q3 Q1‒Q3 Q1‒Q4
EUR million 2017 2016 Change % 2017 2016 Change % 2016
Net sales
Living 133.8 144.8 -8 386.1 398.7 -3 598.1
Functional 135.4 134.9 0 477.3 468.8 2 602.7
Other 0.9 1.1 -14 2.8 3.0 -7 3.8
Group total 270.1 280.8 -4 866.3 870.5 0 1,204.6
Q3 Q3 Q1‒Q3 Q1‒Q3 Q1‒Q4
EUR million 2017 2016 Change % 2017 2016 Change % 2016
Operating profit (EBIT)
Living 15.5 19.4 -20 25.7 16.3 57 49.0
Functional 13.0 2.8 55.4 45.5 22 40.3
Other -1.7 -2.1 -19 -9.0 -3.3 -6.7
Group total 26.8 20.1 34 72.1 58.6 23 82.7
Depreciation, amortization and impairment
Living 4.9 5.0 -2 15.1 15.4 -2 20.9
Functional 4.1 3.8 6 12.1 11.0 10 15.4
Other 0.3 0.3 -16 0.7 0.9 -24 1.2
Group total 9.2 9.1 1 27.9 27.3 2 37.4
Capital expenditure
Living 3.6 3.1 15 7.2 9.8 -27 14.9
Functional 3.1 6.2 -50 11.0 16.1 -32 21.8
Other 2.0 0.3 5.2 2.0 0.9
Group total 8.6 9.6 -10 23.4 28.0 -16 37.6
NET SALES BY GEOGRAPHYQ3 Q3 Q1‒Q3 Q1‒Q3 Q1‒Q4
EUR million 2017 2016 Change % 2017 2016 Change % 2016
Net sales
Europe 131.3 126.1 4 402.6 393.0 2 555.3
Americas 105.8 116.4 -9 355.8 373.7 -5 489.9
Asia-Pacific 33.6 34.0 -1 106.4 100.3 6 153.3
Unallocated -0.6 4.3 1.5 3.6 -59 6.2
Group total 270.1 280.8 -4 866.3 870.5 0 1,204.6
OPERATING PROFIT AND COMPARABLE EBITAQ3 Q3 Q1‒Q3 Q1‒Q3 Q1‒Q4
EUR million 2017 2016 Change % 2017 2016 Change % 2016
Operating profit (EBIT) 26.8 20.1 34 72.1 58.6 23 82.7
Amortization -3.7 -3.3 -10.6 -10.0 -14.0
EBITA 30.5 23.4 30 82.7 68.6 20 96.7
Items affecting comparability in EBITA
Sale of boats business -1.1 -1.1 -3.8 -3.8
Supply Chain 2017 program -0.7 1.1 -0.6 4.7 4.7
-2.1 -2.1
Sale of Spring USA -6.4 0.1 -6.4 -6.0
Ebertsankey related provisions and impairments 4.1 4.1 4.4
Alignment program 0.4 2.7 2.5 5.7 14.5
Other adjustments to operating profit 0.0 0.0 -1.4
Total items affecting comparability in EBITA -1.3 1.5 0.9 2.2 10.4
Comparable EBITA 29.1 24.9 17 83.5 70.8 18 107.1
Sale of container gardening business and related goodwill impairment
Q3 2017 | 16

INTANGIBLE AND TANGIBLE ASSETSSep 30 Sep 30 Dec 31
EUR million 2017 2016 2016
Intangible assets and goodwill
Book value, Jan 1 526.0 540.6 540.6
Currency translation adjustment -15.1 -8.7 -1.3
Additions 6.1 4.2 6.3
Divestments -5.3 -5.9
Amortization and impairment -9.6 -10.0 -13.9
Decreases and transfers -0.2 0.1 0.1
Book value at end of period 507.2 521.0 526.0
Investment commitments for intangible assets 2.1 0.2
Tangible assets and investment property
Book value, Jan 1 164.6 162.4 162.4
Currency translation adjustment -4.3 -4.4 -2.7
Divestments -0.1 -0.1
Additions 17.0 24.8 33.4
Depreciation and impairment -17.0 -17.3 -23.7
Decreases and transfers -2.7 -2.2 -4.6
Book value at end of period 157.6 163.1 164.6
Investment commitments for property, plant and equipment 12.9 5.8 7.4
NON-CURRENT ASSETS HELD FOR SALE
CONTINGENCIES AND PLEDGED ASSETS
Sep 30 Sep 30 Dec 31
EUR million 2017 2016 2016
As security for own commitments
Lease commitments 98.2 117.7 116.6
Guarantees 20.2 19.0 19.1
Other contingencies* 13.6 17.7 15.3
Contingencies and pledged assets total 131.9 154.4 151.0
Tax risks
*Other contingencies include a commitment of USD 15 million to invest in private equity funds.
There were no non-current assets held for sale at the end of September 2017 and December 2016. Non-current assets held for sale at the end of September 2016 amounting to EUR 2,3 million consisted of tangible assets and inventories related to the Ebertsankey pottery business.
Fiskars Group entities are subject to tax audits in several countries. It is possible that tax audits may lead to reassessment of taxes. In July 2016 Fiskars received a tax reassessment decision from the Finnish Large Taxpayers’ Office, which obliged the company to pay in total EUR 28.3 million in additional tax, interest expenses and punitive tax increases as a result of a tax audit carried out in 2014. Fiskars and its external advisors consider the decision unfounded and did not recognize the related taxes and other costs in the income statement. Fiskars has appealed the decision to the Board of Adjustment in the Finnish Large Taxpayers' Office. Fiskars will continue the appeal process in court, if necessary, in which case the process may take years. The dispute concerns intra-group loans forgiven by the company in 2003 and their tax treatment in subsequent tax years.
Q3 2017 | 17
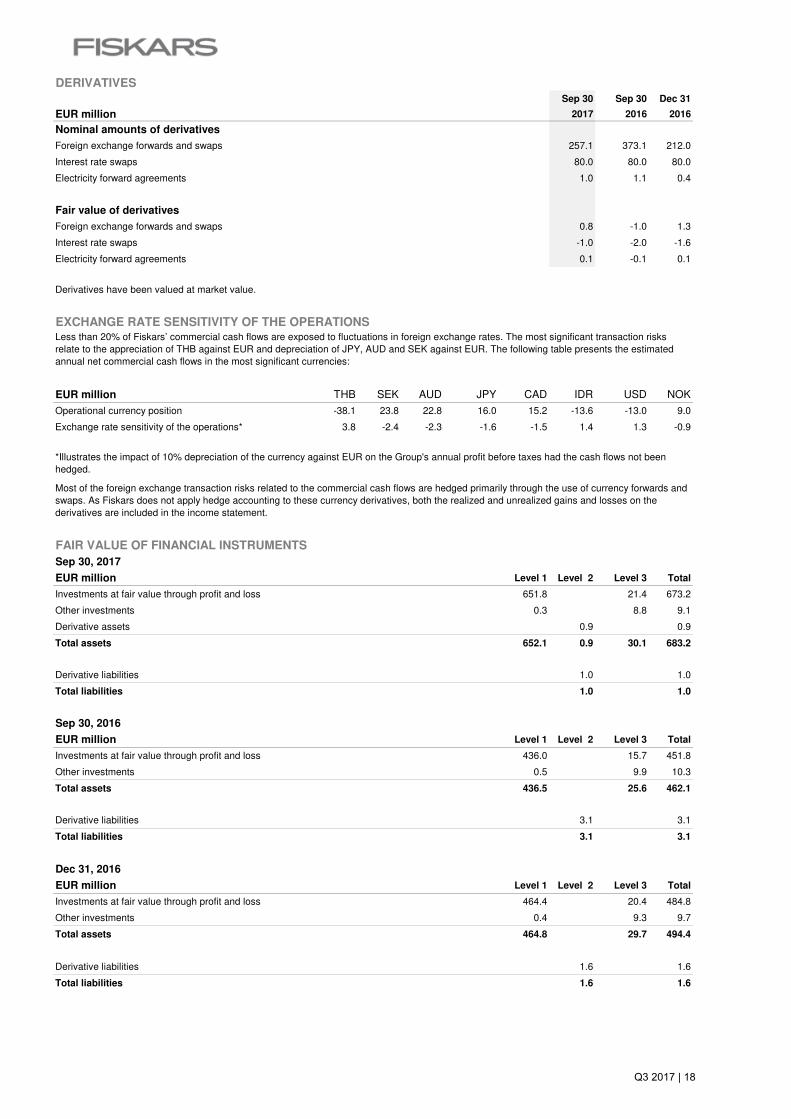
DERIVATIVES
Sep 30 Sep 30 Dec 31
EUR million 2017 2016 2016
Nominal amounts of derivatives
Foreign exchange forwards and swaps 257.1 373.1 212.0
Interest rate swaps 80.0 80.0 80.0
Electricity forward agreements 1.0 1.1 0.4
Fair value of derivatives
Foreign exchange forwards and swaps 0.8 -1.0 1.3
Interest rate swaps -1.0 -2.0 -1.6
Electricity forward agreements 0.1 -0.1 0.1
EXCHANGE RATE SENSITIVITY OF THE OPERATIONS
EUR million THB SEK AUD JPY CAD IDR USD NOK
Operational currency position -38.1 23.8 22.8 16.0 15.2 -13.6 -13.0 9.0
Exchange rate sensitivity of the operations* 3.8 -2.4 -2.3 -1.6 -1.5 1.4 1.3 -0.9
FAIR VALUE OF FINANCIAL INSTRUMENTS
Sep 30, 2017
EUR million Level 1 Level 2 Level 3 Total
Investments at fair value through profit and loss 651.8 21.4 673.2
Other investments 0.3 8.8 9.1
Derivative assets 0.9 0.9
Total assets 652.1 0.9 30.1 683.2
Derivative liabilities 1.0 1.0
Total liabilities 1.0 1.0
Sep 30, 2016
EUR million Level 1 Level 2 Level 3 Total
Investments at fair value through profit and loss 436.0 15.7 451.8
Other investments 0.5 9.9 10.3
Total assets 436.5 25.6 462.1
Derivative liabilities 3.1 3.1
Total liabilities 3.1 3.1
Dec 31, 2016
EUR million Level 1 Level 2 Level 3 Total
Investments at fair value through profit and loss 464.4 20.4 484.8
Other investments 0.4 9.3 9.7
Total assets 464.8 29.7 494.4
Derivative liabilities 1.6 1.6
Total liabilities 1.6 1.6
*Illustrates the impact of 10% depreciation of the currency against EUR on the Group's annual profit before taxes had the cash flows not been hedged.
Derivatives have been valued at market value.
Less than 20% of Fiskars’ commercial cash flows are exposed to fluctuations in foreign exchange rates. The most significant transaction risks relate to the appreciation of THB against EUR and depreciation of JPY, AUD and SEK against EUR. The following table presents the estimated annual net commercial cash flows in the most significant currencies:
Most of the foreign exchange transaction risks related to the commercial cash flows are hedged primarily through the use of currency forwards and swaps. As Fiskars does not apply hedge accounting to these currency derivatives, both the realized and unrealized gains and losses on the derivatives are included in the income statement.
Q3 2017 | 18

Fair value categories
Investments At fair value through profit or loss
EUR million Level 1 Level 3 Level 1 Level 3 Total
Book value, Dec 31, 2015 520.0 14.9 0.4 6.6 541.9
Additions 3.9 3.9
Decreases -61.7 -0.7 -62.4
Change in fair value -22.3 -2.4 0.1 3.3 -21.3
Book value, Sep 30, 2016 436.0 15.7 0.5 9.9 462.1
Additions 3.3 0.7 4.0
Decreases 0.0
Change in fair value 28.4 1.3 -0.1 29.6
Book value, Dec 31, 2016 464.4 20.4 0.4 9.3 494.4
Additions 0.1 0.1
Decreases 0.0 -1.1 -1.1
Change in fair value 187.4 0.9 -0.1 0.6 188.7
Book value, Sep 30, 2017 651.8 21.4 0.3 8.8 682.2
ACQUISITIONS AND DIVESTMENTS
Acquisitions and divestments in Q1-Q3 2017
Sale of the boats business in 2016
Sale of the container gardening business in the U.S. in 2016
Divestment of two businesses in September 2016
Fiskars sold its boats business to Yamaha Motor Europe N.V on 4 January 2016. The transaction included the sale of shares in Inha Works Ltd. as well as the sale of the Buster brand and related factory real estate in Ähtäri, Finland. In 2015, boats business net sales amounted to EUR 35 million.
Fiskars Brands, Inc. sold its container gardening business in the U.S. to Bloem, LLC on 22 January 2016. The transaction included the sale of the container gardening brand American Designer Pottery and related manufacturing and distribution facilities in Apopka, Florida, U.S. In 2015, container gardening net sales amounted to EUR 23 million.
In September 2016, Fiskars entered into an agreement to divest its European Ebertsankey container gardening business to Good(s) Factory BV, a member of the Elho Group, European market leader in synthetic pottery and related products. The divestment was completed in December 2016. In addition, Fiskars sold Spring USA, the U.S. based provider of foodservice equipment, to an affiliate of ShoreView Industries.
In the full year 2015, the net sales of Spring USA and Ebertsankey were in the aggregate EUR 26 million and operating profit EUR 3 million. The divestment of Spring USA generated a positive effect on cash flow during the third quarter of 2016. The divestments did not have a significant impact on Fiskars’ financial position or result during 2016.
Hierarchy level 1 includes financial assets that are publicly quoted in an active market. Level 2 includes financial assets and liabilities measured using directly observable market inputs. All interest-bearing debts and derivatives fall within this category. Level 3 includes financial assets and liabilities measured using non-market observable inputs. The asset classes in this category are unlisted equity investments and funds.
There were no acquisitions or divestments during Q1-Q3 2017.
The following acquisitions and divestments have an impact on the comparability of figures.
Investments at fair value through profit or loss comprise listed shares and unlisted funds. Listed shares have been recognized at their fair value based on quotation at the end of the reporting period (fair value hierarchy level 1). Level 1 investments consist mainly of 10,881,781 shares in Wärtsilä with a fair value of EUR 651.8 million. A 10% change in the Wärtsilä share price would have an impact of EUR 65.2 million in the results before taxes. The fair value of unlisted funds is based on the market value reported by the fund (level 3). Changes in the fair value are recognized in the income statement.
Other financial assets comprise listed and unlisted shares as well as non-current receivables. Listed shares have been recognized at their fair value based on quotation at the end of the reporting period (level 1). Unlisted shares and other investments are measured at the lower of cost and fair value (level 3).
Other
Q3 2017 | 19