Embed Size (px)
Citation preview
Interim Report #IP-Analvsis of Woodbury Waste Site Water Samples
Study Title Exygen Protocol PO002561 : Analysis of Peffluorobutanoic Acid (PFBA), Perfluoropentanoic Acid
(PFPeA), Peffluorohexanoic Acid (PFHxA), Perfluoroheptanoic Acid (PFHpA), Perfluorooctanoic Acid (PFOA), Peffluorononanoic Acid (PFNA), Pefluorodecanoic Acid (PFDA), Perfluoroundecanoic Acid
(PFUnA), Perfluorododecanoic Acid (PFDoA), Pertluorobutanesulfonate (PFBS), Perfluorohexanesulfonate (PFHS), and Perfluorooctanesulfonate (PFOS) in Water, Soil, and
Sediment Using LC/MS/MS for the 3M Cottage Grove Monitoring Program Phase 2
Data Requirement EPA TSCA Good Laboratory Practice Standards 40 CFR Part 792
Study Director Jaisimha Kesari P.E., DEE
Weston Solutions, Inc. 1400 Weston Way
West Chester, PA 19380 Phone: 6 1 0-70 1 -376 1
Author Susan Wolf
3M Environmental Laboratory
Interim Report Completion Date Date of signing
Performing Laboratory 3M Environmental Health and Safety Operations
Environmental Laboratory 3M Center, Bldg 260-0SN-17
Maplewd, MN 55144
Project Identification E06-0549
Total Number of Pages 109
Exygen Protocol PO002561 Interim Report # I 2 3M Project E06-0549
Analysis of Woodbury Waste Site Water Samples: Mid-April and Early June 2007
This page has been reserved for specific country requirements.
2 of 109

Exygen Protocol PO002561 Interim Report #12 3M Project E06-0549
Analysis of Woodbury Waste Site Water Samples: Mid-April and Early June 2007
GLP COMPLIANCE STATEMENT
Report Title: Interim Report 7712 Analysis of Woodbury Waste Site Water Samples: Study Title: Analysis of Perfluorobutanoic Acid (PFBA), Perfluoropentanoic Acid (PFPeA), Perfluorohexanoic Acid (PFHxA), Perfluoroheptanoic Acid (PFHpA), Perfluorooctanoic Acid (PFOA), Perfluorononanoic Acid (PFNA), Perfluorodecanoic Acid (PFDA), Perfluoroundecanoic Acid (PFUnA), Perfluorododecanoic Acid (PFDoA), Perfluorobutanesulfonate (PFBS), Perfluorohexanesulfonate (PFHS), and Perfluorooctanesulfonate (PFOS) in Water, Soil, and Sediment Using LC/MS/MS for the 3M Cottage Grove Monitoring Program Phase 2. Exygen Protocol P0002561.
This analytical phase was conducted in compliance with Toxic Substances Control Act (TSCA) Good Laboratory Practice (GLP) Standards, 40 CFR 792, with the exceptions listed below:
Exceptions to GLP compliance: None
a
I 213 107 Robert A. Paschke, Sponsor Representative Date
Jaisimha Kesari, P.E., DEE, Study Director I Pate
3 of 109

Exygen Protocol PO002561 Interim Report #I2 3M Project E06-0549
Analysis of Woodbury Waste Site Water Samples: Mid-April and Early June 2007
Inspection Dates
May 2,2007
QUALITY ASSURANCE STATEMENT
Date Reported to Phase
Lab Management Study Director
In-Phase August 8,2007 August 8,2007
Report Title: Interim Report #I2 Analysis of Woodbury Waste Site Soil Samples: Study Title: Analysis of Petfluorobutanoic Acid (PFBA), Perfluoropentanoic Acid (PFPeA), Petfluorohexanoic Acid (PFHxA), Petfluoroheptanoic Acid (PFHpA), Perfluorooctanoic Acid (PFOA), Perfluorononanoic Acid (PFNA), Perfluorodecanoic Acid (PFDA), Pertluoroundecanoic Acid (PFUnA), Perfluorododecanoic Acid (PFDoA), Pertluorobutanesulfonate (PFBS), Perfluorohexanesulfonate (PFHS), and Perfluorooctanesulfonate (PFOS) in Water, Soil, and Sediment Using LClMSlMS for the 3M Cottage Grove Monitoring Program Phase 2. Exygen Protocol P0002561.
August 30-31, September 3, 7-8, 2007 Data Audit September 25, September 25,2007 2o07
9-a6 Date
-m
4 of 109

Exygen Protocol PO002561 Interim Report # I 2 3M Project E06-0549
Analysis of Woodbury Waste Site Water Samples: Mid-April and Early June 2007
TABLE OF CONTENTS
GLP Compliance Statement ......................................... ..........................
Quality Assurance Statement .... ............................................
Table of Contents .......... 5
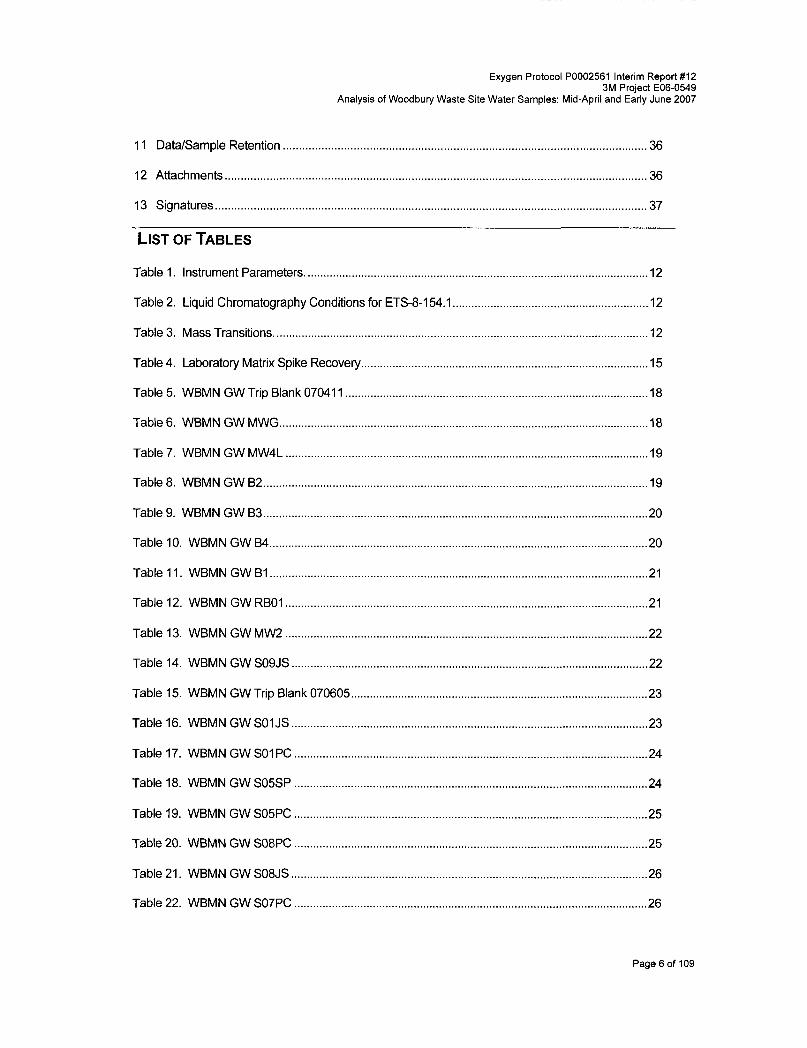
List of Tables ........................................................ ..................................................
3
.......... 4
................... ................................
......................... 8 Study Information .......... ...........................................................
Summary ............................................. ....................................... 9
Introduction ..................... .................................................................................... 9
Test 8, Control Substances .......................................
Reference Substances ..............................................
Method Summary .........................
7.2 Sample Collection. ........................ ......................................
......... I 1
......................... 13
..... ........................ 13 8.1 Calibration ..................................................................
8.2 Limit of Quantitation (LOQ) ............................ .................................... 13
.............................................
..........................................................
8.3 Continuing Calibration .. .................................................
.......................... 13 8.4 ....................................................................
8.5 Lab Control Spikes (LC ...................... 13
8.6 Analytical Method Un
Data Summary and Discussion .......................
10 Conclusion ..................................................................................................................................... 36
5 of 109
Exygen Protocol PO002561 Interim Report # I2 3M Project E06-0549
Analysis of Woodbury Waste Site Water Samples: Mid-April and Early June 2007
11 DatdSample Retention ................................................................................................................. 36
12 Attachments ................................................................................................................................... 36
13 Signatures ...................................................................................................................................... 37
LIST OF TABLES
Table 1. Instrument Parameters .......................................................................................... 12
Table 2. Liquid Chromatography Conditions for ETS-8-154.1 ..... ........... 12
Table 3. Mass Transitions.. ................................................................................................................ 12
Table 4. Laboratory Matrix Spike Recovery ..................................... . I5
Table 5. WBMN GW Trip Blank 07041 1 ................................................................................................ 18
Table 6. WBMN GW MWG ...............................................
Table 7. WBMN GW MW4L ................................................................................................................... 19
Table 8. WBMN GW 82 ....................................................................... ................................. 19
Table 9. WBMN GW B3 .......................................................................................................................... 20
Table IO. WBMN GW B4 ........................................... ....................... ..... 20
Table 11. WBMN GW B1 ........................................................................................................................ 21
Table 12. WBMN GW RBOI .................................
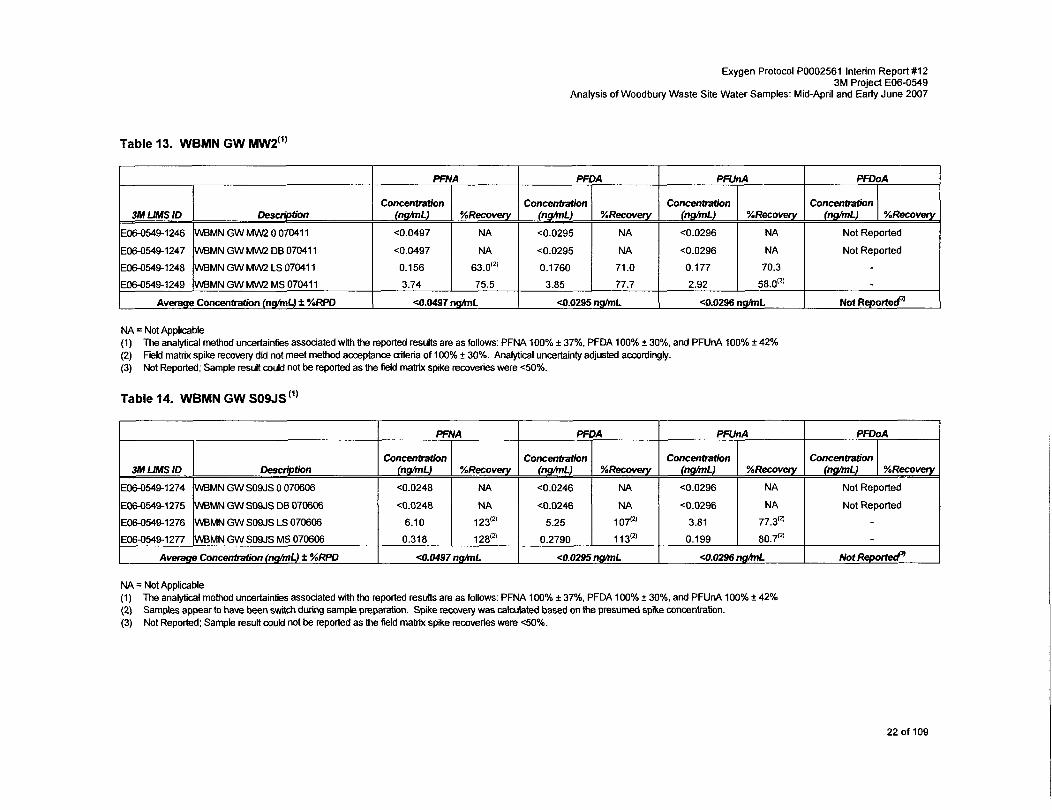
Table 13. WBMN GW MW2 ......................................
Table 14. WBMN GW SO9JS. .................................................................................................. 22
Table 15. WBMN GW Trip Blank 070605 ................................. .23
Table 16. WBMN GW SOIJS ............................................................................................... 23
Table 17. WBMN GW SO1 PC ............................ ......... ... 24
Table 18. WBMN GW SO5SP ............................................................................... 24
Table 19. WBMN GW SO5PC .. ..................................................................................... 25
Table 20. WBMN GW SO8PC ..... ................................................................................................ .25
Table 21. WBMN GW SO8JS .. ................................................................. .26
Table 22. WBMN GW SO7PC .................................................................. .26
...................................
............................
.......
Page 6 of 109

Exygen Protocol PO002561 Interim Report # I2 3M Project E06-0549
Analysis of Woodbury Waste Site Water Samples: Mid-April and Early June 2007
Table 23. WBMN GW SO7JS. ...................................................................................... 27
Table 24. WBMN GW SO6PC ................................................................................................................ 27
Table 25. WBMN GW SO6JS ................................................................................................................. 28
Table 26. WBMN GW SO2PC .................................... .............. ............. 28
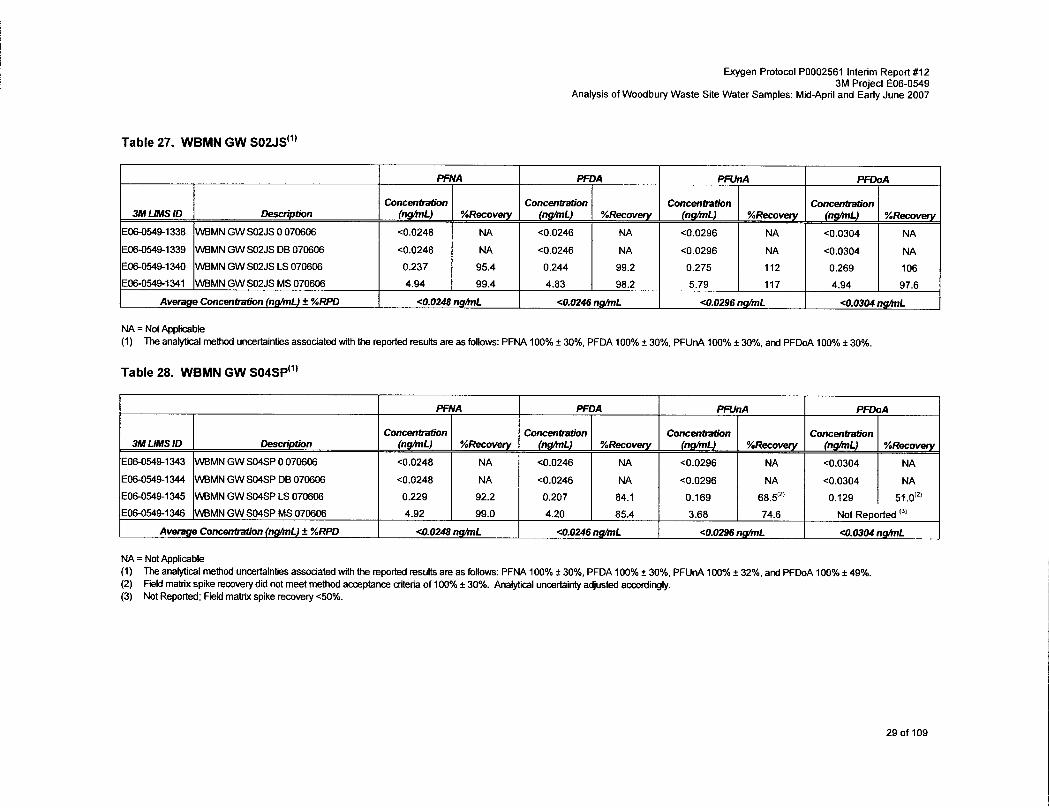
Table 27. WBMN GW SO2JS .... ............................................................................................. 29
Table 28. WBMN GW SO4SP ................................................................................................................ 29
Table 29. WBMN GW SO4PC ....... ............................................... ............ 30
Table 30. WBMN GW MWH ................................................................................................................... 30
Table 31. WBMN GW DRILL .............................. ............. ............. . . . . . . . ..31
Table 32. WBMN GW Trip Blank 070612 .............................................................................................. 31
Table 33. WBMN GW RBOI ...... .................................................................................................... 32
Table 34. WBMN GW S02DR ........................... ............ 32
Table 35. WBMN GW WR03 ......... .............................................................................................. 33
Table 36. WBMN GW SO3JS ............................................... .............. ............ 33
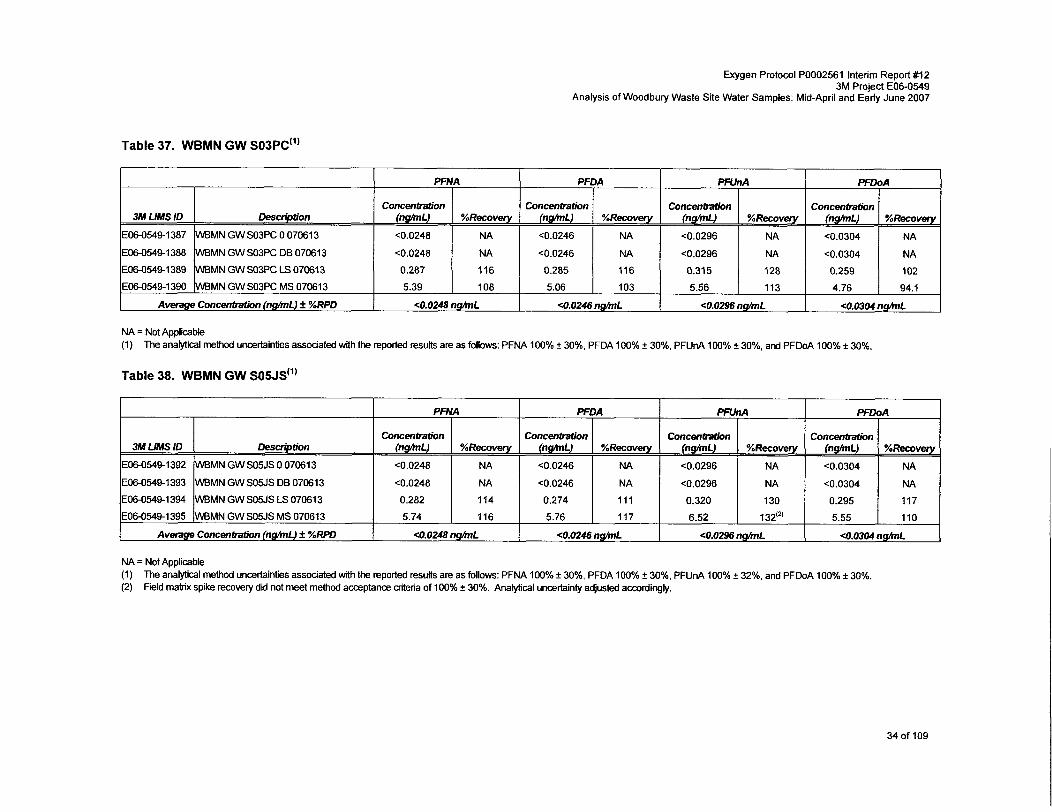
Table 37. WBMN GW SO3PC ... ..................................................................................................... 34
Table 38. WBMN GW SO5JS ......................... ....
Table 39. WBMN GW SO7SP ................................................................................................................ 35
. . . . . . . . .
Page 7 of 109

Exygen Protocol PO002561 Interim Report # I2 3M Project E06-0549
Analysis of Woodbury Waste Site Water Samples: Mid-April and Early June 2007
1 Study lnformation
Exygen Protocol # PO002561 Exygen Research, A Division of MPI Research, Inc. 3058 Research Drive State college, PA 16801 Phone: (814) 272-1039
Sponsor
3M Company
Sponsor Representative
Robert A. Paschke Manager, 3M Corporate Environmental Programs
St. Paul, MN 55144 Phone: (651) 778-5200
Study Director
Jaisimha Kesari, P.E., DEE Weston Solutions, Inc. West Chester, PA 19380 Phone: (610) 701-3761 Fax: (610) 701-7401 j. kesari@westonsolutions. com
Study Location
Bldg 42-02-E-27
Testing Facility
3M EHS Operations 3M Environmental Laboratory Building 260-5N-17 Maplewood, MN 55106
Study Personnel
William K. Reagen, Ph.D., Laboratory Manager Susan Wolf., Principal Investigator. ([email protected]); phone (651)-733-9851 Vallabha Tantry Zhuojing Liu
Study Dates
Study Initiation: 20-October-2006 Interim Analytical Initiation: 1 I-April 2007 Interim Analytical Completion: 28-July 2007 Interim Report Completion: Date of Interim Report Signing
Location of Archives
All original raw data and analytical report have been archived at the 3M Environmental Laboratory according to 40 CFR Part 792. The test substance and analytical reference standard reserve samples are archived at the 3M Environmental Laboratory according to 40 CFR Part 792
8 of 109

Exygen Protocol PO002561 interim Report #12 3M Project E06-0549
Analysis of Woodbury Waste Site Water Samples: Mid-April and Early June 2007
m
The 3M Environmental Laboratory received one hundred seventy-two samples including three sets of trip blanks from the Woodbury, MN waste disposal site. Forty-four bottles were received from Weston personnel on April 13,2007 along with chain of custody (3M C.O.C. # 09369,09370,09371,11748 and 11749), eighty-nine bottles were received from Weston personnel on June 8, 2007 along with chain ofcustody (3M C.O.C. #13521,13515,13518,13526,13520,13519,13516,13522, and 13525), and thirty-nine samples were received from Weston personnel on June 13, 2007 along with chain of custody (3M C.O.C. # I 3530,13529,13528,13532). Samples were prepared and analyzed for Pertluorobutanoate (PFBA), Pertluoropentanoate (PFPeA), Pertluorohexanoate (PFHA), Pertluoroheptanoate (PFHpA) Perfiuorooctanoate (PFOA), Perfluorononanoate (PFNA), Pertluorodecanoate (PFDA), Perfluoroundecanoate (PFUnA) and Pertluorododecanoate (PFDoA), and Perfluorobutane sulfonate (PFBS), Pertluorohexane sulfonate (PFHS) and Pertluorooctane sulfonate (PFOS) under 3M Environmental Laboratory project number E06-0549. This report contains results for PFNA, PFDA, PFUnA, and PFDoA. Results for PFBA, PFPeA, PFHA, PFHpA, PFOA, PFBS, PFHS, and PFOS can be found in interim report # I 1.
3 ln froduction
The objective of this study was to analyze collected water samples from the Woodbury waste site for the selected perfluorocarbon acid analytes in effort to aid identification of historical FC waste disposal locations at the site.
The 3M Environmental Laboratory prepared sample containers (500 mL polyethylene bottles) which were picked up by Weston Solutions personnel prior to field sampling. Sample containers for each sampling location included a field sample, field sample duplicate, low field spike (0.25 ng/mL), mid field spike (5 ng/mL), and high field spike (100 ng/mL). Each empty container was marked with a “fill to here” line to produce a final sample volume of 450 mL. Containers designated for field matrix samples were fortified with an appropriate matrix spike solution containing the analytes of interest, prior to being sent to the field for sample collection.
Samples were prepared and analyzed following method ETS-8-154.1 .O “Determination of Perfluorinated Acids, Alcohols, Amides, and Sulfonates in Water by Solid Phase Extraction and High Performance Liquid Chromatography/Mass Spectrometry”.
Section 9 summarizes the sample results using the analytical method(s) identified above. All results for quality control samples prepared and analyzed with the samples will be reported and discussed elsewhere in this report.
9 of 109

Exygen Protocol PO002561 Interim Report # I 2 3M Project E06-0549
Analysis of Woodbury Waste Site Water Samples: Mid-April and Early June 2007
Reference Substance
Chemical Name
Chemical Formula
Identifier
Source
4 Test&
PFNA PFDA
Perlluorononanoate Perfluorodecanoate
CaF&OO CgjF&OO-
Acid, CAS # 375-951 Acid, CAS # 335-76-2
Oakwood Products Oakwood Products, Inc.
There was no test substance or control substances for this analytical phase in the classic sense. The study was purely analytical in nature. All materials used for this are listed were reference materials as described herein .
Reference Substance
Chemical Name
5 Reference Substances
PFUnA PFDoA
Perfluoroundecanoate Perfluorododecanoate
Chemical Formula
Identifier
I Exoiration Date 1 10/28/2017 1 10/28/2007 I
C1oFz1COO- C11F23COO-
Acid. CAS # 4234-23-5 Acid. CAS # 307-551
I Storaae Conditions I Frozen I Frozen I
Physical Description
Purity
I ChemicalLotNumber I H7568 1 R l l K I
Solid white solid
96.4% 99.7%
I TCRNumber I TCR-618 I TCR-036, SD036 I I Physical Description I white crystals I white solid I I Purity I 98.0% I 98.0% I
I source I Oakwood Products. Inc. I Oakwood Products. Inc. I I Expiration Date I 10129l2007 1 1012812007 I I Storage Conditions I Frozen I Frozen I I ChemicalLotNumber 1 U I I N 1 R24K I I TCRNumber I TCR-619 I TCR-037, SD037 I
10 of 109

Exygen Protocol PO002561 Interim Report #12 3M Project E06-0549
Analysis of Woodbury Waste Site Water Samples: Mid-April and Early June 2007
The test system for this study is water samples from Woodbury, MN waste site collected in Mid-April and Early- June, 2007 by Weston Solutions, Inc. personnel. Samples for this study are “real world” samples, not dosed with a specific lot of test substance.
7.1 Methods
All samples were prepared and analyzed for PFNA, PFDA, PFUnA and PFDoA following the procedure defined in 3M Environmental Laboratory method ETS-8-154.1 “Determination of Perfluorinated Acids, Alcohols, Amides, and Sulfonates in Water by Solid Phase Extractions and High Performance Liquid Chromatography/Mass Spectrometry”.
7.2 Sample Collection
Samples were collected in 500 mL NalgeneTM (low-density polyethylene) bottles prepared at the 3M Environmental Laboratory. Sample bottles were returned to the laboratory at ambient conditions on April 13, June 8, and June 13,2007. Samples were stored refrigerated at the laboratory after receipt. A set of laboratory prepared Trip Blank and Trip Blank field matrix spikes were sent with each set of collection bottles
7.3 Sample Preparation
All samples, calibration standards, and associated quality control samples were extracted using a modified procedure of ETS-8-154.1. Briefly, 40 mL of sample were loaded onto a pre-conditioned Waters C18 solid phase extraction (SPE) cartridge (Sep-Pak, 1 .O g, 6 cc) using a vacuum manifold. The loaded SPE cartridges were then eluted with 5 mL of methanol. This extraction procedure concentrates the samples by a factor of eight. (Initial volume = 40 mL, final volume = 5 mL). Lab control spikes extracted in the same manner cross-validate all the method modifications/deviations from ETS-8-154.1. See Section 3.5 for additional information.
Modifications from ETS-8-154.1 that were used for this analysis: Samples were not extracted in duplicate as samples were collected in duplicate in the field. Extraction columns were not rinsed with 40% methanol after sample loading. After loading the sample onto the column, and just prior to eluting the column with methanol, vacuum was applied for approximately 5 minutes to remove as much sample as possible.
7.4 Analysis
All samples and quality control samples were analyzed for the target analytes listed previously using high performance liquid chromatography/ tandem mass spectrometry (HPLC/MS/MS). Detailed instrument parameters, the liquid chromatography gradient program, and the specific mass transitions analyzed are described in the raw data hard copies placed in the final data packet, and are briefly described below.
Page 11 of 109

Exygen Protocol PO002561 Interim Report #12 3M Project E06-0549
Analysis of Woodbury Waste Site Water Samples: Mid-April and Early June 2007
Mass Transition QVQ3
Analyte
Table 1. Instrument Parameters.
Dwell Time Msec
Table 2. Liquid Chromatography Conditions for ETS-8-154.1.
Table 3. Mass Transitions.
12 of 109

Exygen Protocol PO002561 Interim Report #I2 3M Project E06-0549
Analysis of Woodbury Waste Site Water Samples: Mid-April and Early June 2007
8.1 Calibration
Calibration standards were prepared by spiking known amounts of stock solutions containing the analytes of interest into 40 mL of laboratory water. Each spiked water standard was then extracted in the same manner as the collected samples. A total of eleven spiked standards ranging from 0.025 ng/mL to 10 ng/mL (nominal) were prepared. A quadratic, l /x weighted, calibration curve was used to fit the data for each analyte. The data were not forced through zero during the fitting process. Calculating the standard concentration using the peak area counts and the resultant calibration curve confirmed accuracy of each curve point.
Each curve point was quantitated using the overall calibration curve and reviewed for accuracy. Method calibration accuracy requirements of 100+25% (1 00*30% for the lowest curve point) were met. The correlation coefficients (r) were greater than 0.995.
8.2 Limit of Quantitation (LOQ)
The LOQ for this analysis is the lowest non-zero calibration standard in the curve that meets linearity and accuracy requirements for which the area counts are at least twice those of the appropriate blanks.
The nominal LOQ for analytes by analysis date are as follows: 6/26/07 - 0.03 ng/mL for PFDA, PFUnA, and PFDoA, 0.05 ng/mL for PFNA 7/25/07 - 0.025 ng/mL for PFNA, and PFDA, 0.03 ng/mL for PFUnA and PFDoA
8.3 Continuing Calibration
During the course of each analytical sequence, continuing calibration verification samples (CCVs) were analyzed to confirm that the instrument response and the initial calibration curve were still in control. All CCVs met method criteria of 100% f 25%.
8.4 Blanks
Two types of blanks were prepared and analyzed with the samples: method blanks and fieldhip blanks. Each blank result is reviewed and used to evaluate method performance to determine the LOQ for each analyte
8.5 Lab Control Spikes (LCSs)
Low and mid-level lab control spikes were prepared and analyzed in triplicate with each preparation set. LCSs were prepared by spiking known amounts of the analytes into laboratory water to produce the desired concentration. The spiked water samples were then prepared and analyzed in the same manner as the samples. Analysis of triplicate LCSs at the two specified levels cross-validates the analytical method as used here for any modifications/deviations from method ETS-8-154.1. In those instances where LCS did not meet method acceptance criteria, data have been flagged as such and all LCS were used in the determination of analytical uncertainty.
The following calculations were used to generate data in Table 5 for laboratory control spikes.
Calculated Concentration Spike Concentration
LCS Percent Recovery =
Page 13 of 109

Exygen Protocol PO002561 Interim Report # I 2 3M Project E06-0549
Analysis of Woodbury Waste Site Water Samples: Mid-April and Early June 2007
standard deviation LCS replicates oo% LCS% RSD = average LCS recovery
14 of 109

Exygen Protocol PO002561 Interim Report #12 3M Project E06-0549
Analysis of Woodbury Waste Site Water Samples: Mid-April and Early June 2007
PFNA
Spiked Calculated
(ng/mL) (ng/mL) %Recovery Concentration Concentration
0.199 0.163 81.9
0.199 0.165 83.0
0.199 0.182 91.4
4.97 5.09 102
4.97 5.11 103
4.97 4.79 96.4
93.0% f 9.8 %
Table 4. Laboratory Matrix Spike Recovery
PFDA PFUnA PFDoA
Spiked Calculated Spiked Calculated Spiked Calculated
(ng/mL) (ng/mL) %Recovery (ng/mL) (ng/mL) %Recovery (ng/mL) (ng/mL) %Recovery Concentration Concentration Concentration Concentration Concentration Concentration
0.197 0.199 101 0.202 0.191 94.6 0.197 0.203 103
0.197 0.195 99.1 0.202 0.201 99.4 0.197 0.197 100
0.197 0.208 105 0.202 0.203 100 0.197 0.217 110
4.92 5.62 114 5.06 5.40 107 4.93 5.44 110
4.92 5.50 112 5.06 5.56 110 4.93 5.50 112
4.92 5.34 109 5.06 5.49 108 4.93 5.40 109
103% f 5.9% 107% f 4.4% 107% f 5.6%
6/22/07 Sample Preparation
Lab ID
LCS-070622-1
LCS-070622-2
LCS-070622-3
LCS-0706224
LCS-070622-5
LCS-070622-6
Average f %RSD
%Recovery
103
109
112
95.7
97.8
94.9
PFUnA PFDoA
Spiked Calculated Spiked Calculated
(ng/mL) (ng/mL) %Recovery (ng/mL) (ng/mL) %Recovery Concentration Concentration Concentration Concentration
0.197 0.182 92.5 0.202 0.174 85.9
0.197 0.168 85.2 0.202 0.177 87.6
0.197 0.186 94.6 0.202 0.190 94.2
4.93 4.34 88.1 5.06 4.390 86.8
4.93 4.35 88.2 5.06 3.930 77.6
4.93 3.92 79.4 5.06 3.510 69.4'"
7/19/07 Sample
LCS-070719-1
LCS-070719-2
LCS-070719-3
LCS-070719-4
LCS-070719-5
LCS-0707196
0.199
0.199
0.199
4.97
4.97
4.97
0.214 108 0.197 0.203
0.229 115 0.197 0.214
0.242 121 0.197 0.221
5.06 102 4.92 4.71
5.37 108 4.92 4.81
5.01 101 4.92 4.67
I ~
IAverage f %RSD I 109% f 7.0 % 83.6% f 10% 102% f 7.0% 88.0% f 6.1%
Page 15 of 109

Exygen Protocol PO002561 Interim Report #12 3M Project E06-0549
Analysis of Woodbury Waste Site Water Samples: Mid-April and Early June 2007
7/24/07 Sample Preparation PFNA PFDA PFlJnA PFDoA
Spiked Calculated Spiked Calculated Spiked Calculated Spiked, Calculated
(ndmL) (nghL) %Recovery (nglfnL) (ng/mL) %Recovery ( nghL) (nghL) %Recovery ( n g h u (nghL) %Recovy Concentration Concentraiion Concenttation Concentration Concenbation ConcenMon Concentration Concentation
Lab ID
LCS-070724-1 0.199 0.207 104 0.197 0.2 101 0.197 0.236 120 0.202 0.227 112
LCS-070724-2 0.199 0.200 100 0.197 0.186 94.2 0.197 0.227 115 0.202 0.211 104
LCS-070724-3 0.199 0.200 100 0.197 0.199 101 0.197 0.21 3 108 0.202 0.183 90.8
LCS-0707244 4.97 4.56 91 .a 4.92 4.39 89.1 4.93 5.1 1 104 5.06 5.1 1 101
LCS-070724-5 4.97 4.70 94.7 4.92 4.36 88.7 4.93 5.73 116 5.06 5.58 110
LCS-070724-6 4.97 4.60 92.5 4.92 4.24 86.2 4.93 5.63 114 5.06 5.45 108 ,Average f %RSD 97.2% f 5.0 % 93.4% f 6.9% 113% 2 5.1% 104% f 7.4%
16 of 109

Exygen Protocol PO002561 Interim Report #12 3M Project E06-0549
Analysis of Woodbury Waste Site Water Samples: Mid-April and Early June 2007
8.6 Analytical Method Uncertainty The analytical uncertainty was determined based on historical QC data that is used to evaluate method accuracy and precision. The method uncertainty is calculated following ETS-12-012.2. The analybcal uncertainty was determined by the statistical evaluation of the recoveries for the individual analytes recovery determined for laboratory matrix spiked samples. The standard deviation was calculated for the set of recovery results (in %). The expanded uncertainty is calculated by multiplying the standard deviation by factor of 2, which correspond with a confidence level of 95%. A minimum of twenty data points is needed to determine method uncertainty by this method.
There were an insufficient number of laboratory control samples for PFNA, PFDA, PFUnA, and PFDoA, field matrix spike recoveries were used to determine analytical uncertainty. Sampling locations with field matrix spikes meeting the acceptance criteria of 100% f 30% were assigned an analytical uncertainty o f f 30%.
9 Data Summary and Discussion
The tables below summarize the sample results and field matrix spike recoveries for the sampling locations as well as the Trip Blanks. Results and average values are rounded to three significant figures according to EPA rounding rules. Because of rounding, values may vary slightly from those listed in the raw data. Field matrix spikes recoveries meeting the method acceptance criteria o f f 30%, demonstrate that the method(s) were appropriate for the given matrix and their respective quantitative ranges. In those instances where field matrix spike recoveries did not meet method acceptance criteria, the analytical uncertainty has been adjusted accordingly and the data footnoted. Blanks were sufficiently devoid of analyte to determine concentrations of analytes to the LLOQs specified in section 8.2.
17 of 109

Exygen Protocol PO002561 Interim Report #12 3M Project €06-0549
Analysis of Woodbury Waste Site Water Samples: Mid-April and Early June 2007
3M UMS ID Description
E06-0549-1207 WBMN GW TRIP 0 07041 1
E06-0549-1208 WBMN GW TRIP LS 07041 1
E06-0549-1209 WBMN GW TRIP MS 07041 1
Table 5. WBMN GW Trip Blank 070411
PFNA
Concenb.ation (nghL) %Recovery
C0.0497 NA
0.21 7 87.7
5.20 105
PFDA
Concenlration (nghL) %Recovery
~0.0295 NA 0.253 102
5.62 113
Table 6. WBMN GW MWG”’
PFUnA PFDoA
Concentration Concentration (nglmL) %ReCOVery (ngImL) %Recovery
0.0397 NA C0.0304 NA
0.270 91.5 0.1 74 70.7
5.97 118 5.03 102
3M UMS ID
E06-0549-1211
E06-05441212
E06-05441213
E0645441214
PFNA
Concanlation
C0.0248
C0.0248
0.234
cO.0248 n g h L
Description
WBMN GW MWG 0 070411
WBMN GW MWG DB 07041 1
WBMN GW MWG LS 07041 1
WBMN GW MWG MS 07041 1
PFDA PFUnA
Concentration Concentdon
~0.0296
C0.0246 ~0.0296
C0.0246
0.187 75.4 0.186 73.9
4.21 84.9 4.00 79.4
~0.0246 n ~0.0296 n
PFDoA
C0.0304
~0.0304
0.171 69.5‘’’
cO.0304 nghL
NA = Not Applicable (1) The analytcal method uncertainties assodated with the reported results are as follows: PFNA 100% k 30%, PFDA 100% k 30%. PFUnA 100% k 30%, and PFDoA 100% f 30%. (2) Field maMx spike recovery did not meet method acceptance criteria of 100% f 30%. Analytical uncertainly adjusted accordingly.
18 of 109

Exygen Protocol PO002561 Interim Report # I2 3M Project E06-0549
Analysis of Woodbury Waste Site Water Samples: Mid-April and Early June 2007
3M UMS ID Description
E0605491216 WBMN GW MW4L 0 07041 1
E0605491217 WBMN GW MW4L DB 070411
E06-0549-1218 WBMN GW MVWL LS 07041 1
E0645491219 WBMN GW MVWL MS 07041 1
Average Concenb;ltion (ngh l ) f %RPD
Table 7. WBMN GW MW4L"'
PFNA PFDA PFUnA PFDoA
Concentration Concentration Concentration Concentration (nghnL) %Recovery (nghL) %Recovery (nghL) %Recovery (nghL) %Recovery
<0.0497 NA <0.0295 NA 0.0472 NA <0.0304 NA
<0.0497 NA C0.0295 NA 0.0329 NA c0.0304 NA
0.207 83.6 0.247 99.6 0.247 82.2 0.128 52.0l3]
4.79 96.7 5.19 105 4.66 91.8 3.29 , 66.813)
a.0497 nghL <0.0295nghL 0.0401 n g h b 36%'*' ~0.0304 nghL
3M UMS ID Deswtion
E0645491221 WBMN GW 82 0 07041 1
E06-05441222 WBMN GW 82 DB 07041 1
E0645491223 WBMN GW 82 LS 07041 1
E06-05441224 WBMN GW 82 MS 07041 1
Average Concentration ( n g h 4 f %RPD
NA = Not Applicable (I) The analyhl method urwertainties assodated with the reported results are as foliows: PFNA 100% f 30%, PFDA 100% f 30%, PFUnA 100% f 30%, and PFDoA 100% f 48%. (2) The Relative Percent Difference between the Sample/Sample Duplicate did not meet ETS-8-154 method acceptance criteria of 5 20%. (3) Field matrix spike recovely did not meet method acceptance criteria of 100% f 30%. Analytical uncertainty adjusted accordingly.
W N A PFDA PFUnA PFDoA
Concentration ConcenbaLion Concentration Concentralro ' n (nghnL) %Recovery (nghL) %Recovery (nghL) %Recovery (nghL) %Recovery
<0.0497 NA <0.0295 NA <0.0296 NA Not Reported
NA Not Reported <0.0497 NA c0.0295 NA ~0.0296
0.168 67.9"' 0.1 87 75.4 0.166 65.9"'
4.06 82.0 4.28 86.3 3.49 69.3
4.0296 ngAnL Not Repotted a.0497 nghL ~0.0295 nghL
Table 8. WBMN GW B2"'
NA = Not Applicable (1) The analytical method uncertainties assodated with the reported results are as follows: PFNA 100% f 32%, PFDA 100% f 30%. and PFUn4 100% f 34%. (2) Field mabix spike recovery did not meet method acceptance criteria of 100% f 30%. Analytical uncertainty adjusted accordingly. (3) Not Reported; Sample result could not be reported as the field matrix spike recoveries were 4 0 % .
19 of 109

Exygen Protocol PO002561 Interim Report #12 3M Project €06-0549
Analysis of Woodbury Waste Site Water Samples: Mid-April and Early June 2007
3M UMS ID Descrfption
€06-05491226 WBMN GW 83 0 07041 1
E06-0549-1227 WBMN GW 83 DB 07041 1
E06-0549-1228 WBMN GW 83 LS 07041 1
Average Concenbation (nghnL) 2 %RPD
Table 9. WBMN GW 63'"
PFNA PFDA PFUnA PFDoA
Concentration Concentraiion Concentration Concenbation (nghnL) %Recovery (nghL) %Recovery (nghnL) %Recovery (ns/mL) %Recovery
c0.0497 NA c0.0295 NA ~0.0296 NA
NA ~0.0497 NA ~0.0295 NA
Not Reported
Not Reported <0.0296
~ _ _ _ _ _ _ _ _ _ _ _ _ _ _ _ ~ 0.205 82.8 0.224 90.4 0.152 60.4'"
~0.0296 nghnL Not Reported c0.0497 n m L c0.0295 nghL
3M UMS ID hcription
E06-05441231 WBMN GW 84 0 07041 1
E06-0549-1232 WBMN GW 84 DB 07041 1
E06-0549-1233 WBMN GW 84 LS 07041 1
Concentration (nghnL) f %RPD Average
PFNA PFDA
Concentration Concentration (nghL) %Recovery (nghnL) %Recovery
c0.0497 NA ~0.0295 NA
~0.0497 NA c0.0295 NA
0.206 83.2 0.231 93.2
c0.0497 nghnL ~0.0295 n g h L
PFUnA
Concenbation
c0.0296
PFDoA
Concenbation (nghnL)
Not Reported @'
%Recovery
(1) The analytical method uncertainties associated with the reported results are as follows: PFNA 100% f 32%, PFDA 100% f 30%, and PFUnA 100% f 33% (2) Field matrix spike recovery did not meet method acceptance criteria of 100% f 30%. Analytical uncertainty adjusted accordingly. (3) Not Reported; Sample result could not be reported as the field matrbc spike recoveries were 4 0 % .
20 of 109
Exygen Protocol PO002561 Interim Report #12 3M Project €06-0549
Analysis of Woodbury Waste Site Water Samples: Mid-April and Early June 2007
3M LlMS ID Des-tion
E06-0549-1236 WBMN GW B1 0 07041 1
EO6-0549-1 237 WBMN GW B1 DB 07041 1
E06-0549-1238 ,WBMN GW B1 LS 07041 1
Average Concenlratbn (nghnL) f %RPD
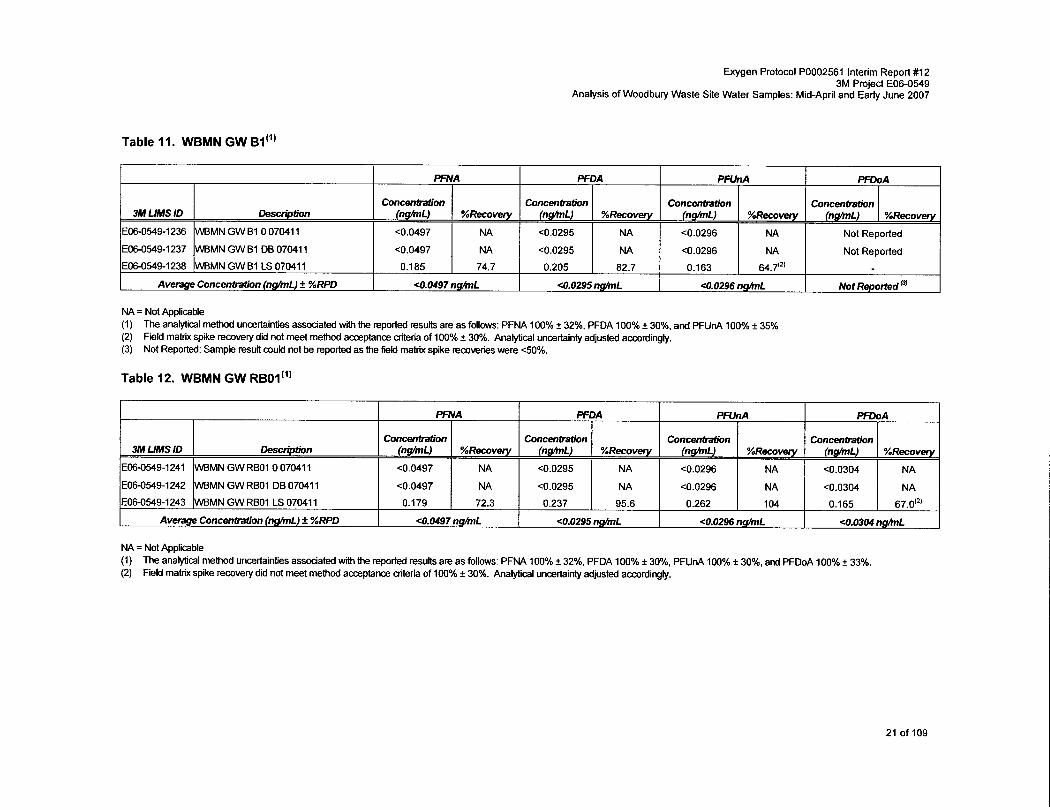
Table 11. WBMN GW BI'"
PFNA PFDA PFUnA PFDOA
Concentration Concentration Concentration Concentration (ng/mL) %Recovery (nghnL) %Recovery (n@nL) %Recovery (ng/mL) %Recovery
c0.0497 NA c0.0295 NA ~0.0296 NA Not Reported
Not Reported c0.0497 NA c0.0295 NA NA c0.0296
0.185 74.7 0.205 , 82.7 0.163 64.7'"
4.0497 nghL e0.0295 nghL e0.0296 nghL Not Reported ''
3M LlMS ID Description
€06-0549-1241 WBMN GW RBOl 0 07041 1
E06-0549-1242 WBMN GW RBOl DB 07041 1
E06-0549-1243 WBMN GW RBOl LS 070411
Average Concentratton (ng/mL) f %RPD
NA = Not Applicable (1) The anaiy4ical method uncertainties associated with the reported results are as follows: PFNA 100% f 32%, PFDA 100% f 30%, and PFUnA 100% f 35% (2) FeM matrix spike recovery did not meet method acceptance aiteria of 100% f 30%. Analytical uncertainly adjusted accordingly. (3) Not Reported; Sample resull could not be reported as the field matrix spike recoveries were 40%.
PFNA PFDA PFlJnA PFDOA
Concentation Concentration Concenttation Concenbation (nghnL) %Recovery (nghn4 %Recovery (nghnl) %Recovery (ng/mL) %Recovery
~0.0497 NA c0.0295 NA c0.0296 NA c0.0304 NA
~0.0497 NA ~0.0295 NA NA c0.0304 NA c0.0296
0.179 72.3 0.237 95.6 0.262 104 0.165 67.0'21
4.0497 n g h L e0.0295 nghnL e0.0296 n g h L 4.0304 nghL
Table 12. WBMN GW RBO1'l)
NA = Not Applicable (1) The analytical method uncertainties assodated with the reported results are as follows: PFNA 100% f 32%, PFDA 100% f 30%, PFUnA 100% f 30%, and PFDoA 100% f 33%. (2) Field matrix spike recovery did not meet method acceptance aiteria of 100% f 30%. Analytical uncertainty adjusted accordingly.
21 of 109
Exygen Protocol PO002561 Interim Report #12 3M Project E06-0549
Analysis of Woodbury Waste Site Water Samples: Mid-April and Early June 2007
3M UMS ID Description
€06-0549-1246 WBMN GW MW2 0 07041 1
E0645441247 WBMN GW MW2 DB 07041 1
E0645441248 WBMN GW MWZ LS 07041 1
E0645441249 WBMN GW MW2 MS 07041 1
Avetage Combat ion (nghnl) +- %RfO
Table 13. WBMN GW MW2‘”
PFNA PFDA PFfJnA PFDoA
Concentration Concentration Concentration Concentration (nghnL) %Recovery (nghnL) %Recovery (nghnL) %Recovery (nghnL) %Recovery
C0.0497 NA ~0.0295 NA ~0.0296 NA Not Reported
<0.0497 NA <0.0295 NA c0.0296 NA Not Reported
0.156 63.0”’ 0.1760 71 .O 0.177 70.3
3.74 75.5 3.85 77.7 2.92 58.0‘*’
a 0 4 9 7 ng/inL ~0.0295 nghL c0.0296 nglmL Not R e p o d ’
3M UMS ID Description
E0645441274 WBMN GW SO9JS 0 070606
€0645491275 WBMN GW SOSJS D6 070606
E0645441276 WBMN GW SO9JS LS 070606
E0645441277 WBMN GW SO9JS MS 070606
Average Concenm-on (nghnL) f %RPD
NA = Not Applicable (1) The analytical method uncertainties associated with the reported results are as follows: PFNA 100% f 37%. PFDA 100% f 30%, and PFUnA 100% f 42% (2) Field matrix spike recovery did not meet method acceptance aiteria of 100% f 30%. Analytical uncertainty adjusted accordingly. (3) Not Reported; Sample result could not be reported as the kld matrix spike recoveries were 4 0 % .
PFNA PFDA PFUnA PFDoA
Concentration Concentdon Concentration Concentdon (ng/mL) %Recovery (nghnL) %Recovery (ng/mL) %Recovery (nghnL) %Recovety
C0.0248 NA C0.0246 NA ~0.0296 NA Not Reported
C0.0248 NA C0.0246 NA g0.0296 NA Not Reported
6.10 123‘” 5.25 107”) 3.81 77.3”’
0.318 . 128‘21 0.2790 1 13‘2’ 0.199 80.7”’
~0.0497 nghnL c0.0295 nghnL c0.0296 nghnL Not R e p o d ’
Table 14. WBMN GW SOSJS‘‘’
NA = Not Applicable (1) The analytical method uncertainties associated with the reported results are as follows: PFNA 100% f 37%, PFDA 100% f 30%, and PFUnA 100% f 42% (2) Samples appear to have been switch during sample preparatiin. Spike recovery was calculated based on the presumed spike concentration. (3) Not Reported; Sample result could not be reported as the field matrix spike recoveries were 4 0 % .
22 of 109

Exygen Protocol PO002561 Interim Report #12 3M Project E06-0549
Analysis of Woodbury Waste Site Water Samples: Mid-April and Early June 2007
3M UMS ID Des-tion
E0645441279 WBMN GW TRIP 0 070605
E0645441280 WBMN GWTRIP LS 070605
E0645441281 WBMN GWTRIP MS 070605
Table 15. WBMN GW Trip Blank 070605
PFNA PFDA PFUnA PFDoA
Concenbation Concentration Concentration Concentation (nghL) %Recovery (nghL) %Recovery (nghL) %Recovery (nghL1 %ReCOVt?f)f
c0.0248 NA c0.0246 NA c0.0296 NA C0.0304 NA
0.297 120 0.271 110 0.185 75.0 0.123 48.6'"
3.84 , 77.3 , 5.43 110 4.63 93.9 3.98 78.7
PFUnA
Table 16. WBMN GW SOIJS"'
PFNA
Concenbation 3M UMS ID Description (nghL) %Recovery
PFDoA
NA = Not Applicable
Concenbation
c0.0248
c0.0248
0.198
3.77 75.9
c0.0248 nghl .
PFDA
c0.0246
c0.0246
0.282
5.28
~0.0246 nghL
Conc-n
<0.0296
0.226 91.7
c0.0295 n!
(1) The analytical method uncertainties associated with the reported results are as follows: PFNA 100% f 30%, PFDA 100% f 30%, PFUnA 100% 2 30%, and PFDoA 100% t 30%.
23 of 109

Exygen Protocol PO002561 Interim Report #12 3M Project E06-0549
Analysis of Woodbury Waste Site Water Samples: Mid-April and Early June 2007
3M UMS ID
E0605441288
E0645491289
E06-0549-1290
E06-05491291
Table 17. WBMN GW SOIPC'"
Concentration Description (ng/mL)
c0.0248 WBMN GW SO1 PC 0 070606
WBMN GW SOlPC DB 070606 ~0.0248
WBMN GW SO1 PC LS 070606
WBMN GW SO1 PC MS 070606
0.226
4.59
I I PF
Average Concenttation (nghnL) f %RPD a.0248 nghnL
9
%Recovery
NA
NA
91 .o 92.4
PF
ConcenM*on (nghnL)
c0.0246
c0.0246
0.334
6.51
<0.0296
c0.0296
136"' 0.251
132'*'
c0.0304
<0.0304
0.216
104 4.45
85.4
87.9
C0.0246 n g h L <0.0296 ng/mL cO.0304 nghL
(1) The analytical method uncertainties assodated with the reported results are as follows: PFNA 100% f 3056, PFDA 100% f 36%. PFUnA 100% f 30%. and PFDoA 100% f 30%. (2) Field matrix spike recovery did not meet method acceptance criteria of 100% f 30%. Anawcal uncertainly adjusted accordingly.
Table 18. WBMN GW S05SP"'
Concentration Concenbation
PFO
Concentmtjon (nghnL)
~0.0296
~0.0296
0.308
5.12
1
%Recovery
NA
NA
125
104
~0.0296 nghnL
PFn
Concentration (nghL)
<0.0304
<0.0304
0.21 10
3.81
A
%Recovery
NA
NA
83.4
75.3
cO.0304 nghL
NA = Not Applicable (1) The analytical method uncertainties assodated with the reported results are as follows: PFNA 100% f 30%, PFDA 100% f 41%. PFUnA 100% f 30%, and PFDoA 100% f 30%. (2) Field matrix spike recovery did not meet method acceptance criteria of 100% f 30%. Analytical uncertainly adjusted accordingly.
24 of 109

Exygen Protocol PO002561 Interim Report #12 3M Project E06-0549
Analysis of Woodbury Waste Site Water Samples: Mid-April and Early June 2007
3M UMS ID
E06-0549-1298
E0645441299
E06-0549-1300
E06-0549-1301
Table 19. WBMN GW SO5PC"'
Concentration Description (ng/mL) %Recovery
WBMN GW SO5PC 0 070606 c0.0248 NA
WBMN GW SO5PC DB 070606 c0.0248 NA
WBMN GW SO5PC LS 070606 0.223 89.8
WBMN GW SO5PC MS 070605 4.23 85.1
PFNA
Average Concentration (ng/mL) f %RPD q0.0248 n g h L
~0.0246 c0.0296
40.0296 c0.0246
0.336 137'2' 0.267 108
6.15 125 5.26
~0.0246 n
Concentration
PFDoA 1
3M LlMS ID Description
E06-0549-1303 WBMN GW SO8PC 0 070606
E06-0549-1304 WBMN GW SO8PC DB 070606
E06-0549-1305 WBMN GW SO8PC LS 070606
E06-0549-1306 WBMN GW SO8PC MS 070606
Average Concentration (ngtnl) t %RPD
PFNA PFDA PFUnA PFDoA
Concenbation Concenbation Concentration Concentration (nghL) %Recovery (ng/mL) %Recovery (nghL) %Recovery (nghnL) %Recovery
c0.0248 NA ~0.0246 NA 40.0296 NA c0.0304 NA
cO.0248 NA ~0.0246 NA 40.0296 NA c0.0304 NA 0.216 87.0 0.329 1 3412' 0.246 99.8 0.224 88.5
4.52 91 .o 4.40 89.4 4.90 99.4 4.05 80.0
CO.0248 nghL 4.0246 ng/mL e0.0296 nghL <0.0304 nghL
NA = Not Applicable (1) (2)
The analytical method uncertainties associated with the reported results are as follows: PFNA 100% f 30%, PFDA 100% f 37016, PFUnA 100% f 30%. and PFDoA 100% f 30%. Field matrix spike recovery did not meet method acceptance criteria of 100% f 30%. Analytical uncertainly adjusted accordingly.
Table 20. WBMN GW S08PC"'
NA = Not Applicable (1) The analytical method uncertainties associated with the reported results are as follows: PFNA 100% f 30%, PFDA 100% f 34%, PFUnA 100% f 30%. and PFDoA 100% f 30%. (2) Field matrix spike recovery did not meet method acceptance criteria of 100% f 30%. Analytical uncertainty adjusted accordingly.
25 of 109

Exygen Protocol PO002561 Interim Report #12 3M Project E06-0549
Analysis of Woodbury Waste Site Water Samples: Mid-April and Early June 2007
3M LlMS ID Description
E0645491308 WBMN GW SO8JS 0 070606
E0645491309 WBMN GW SO8JS DB 070606
E0645441310 WBMN GWSO8JS LS 070606
EO645441311 WBMN GW SOWS MS 070606
Average Concentration (ng/mL) f %RPD
Table 21. WBMN GW SO8JS
~~
PFNA PFDA PFUnA PFDoA
Concentration Concentration Concentration Concentration (nghL) %Recovery (ng/mL) %Recovery (nghL) %Recovery (nghL) %Recovery
<0.0248 NA c0.0246 NA <0.0296 NA c0.0304 NA
<0.0248 NA <0.0246 NA <0.0296 NA e0.0304 NA
0.234 94.2 0.221 89.8 0.223 90.4 0.164 64.8'"
4.32 87.0 4.27 86.8 4.48 90.9 3.55 70.2
~0.0248 nghL e0.0246 nghL e0.0296 nghnL a.0304 nghL
PFNA
Table 22. WBMN GW SO7PC"'
PFDA PFUnA PFDoA
3M UMS ID
E0645441313
E0645441314
E0645491315
E0645441316
Concentration Concentration Concenlration Concentration Description (nghL) %Recovery (nghL) %Recovery (nghL) %Recovery (nghL) %Recovery
WBMN GWS07PC 0 070606 <0.0248 NA c0.0246 NA <0.0296 NA <0.0304 NA
WBMN GWSO7PC DB 070606 <0.0248 NA c0.0246 NA <0.0296 NA C0.0304 NA
WBMN GW SO7PC LS 070606 0.243 97.8 0.254 103 0.258 105 0.216 85.4
WBMN GW SO7PC MS 070606 4.60 92.6 4.31 87.6 4.69 95.1 3.90 77.1
26 of 109
Average Concentration (nghL) f %RPD e0.0248 nghL e0.0246 nghL ~0.0296 n g h L <0.0304 n g h L

Exygen Protocol PO002561 Interim Report #12 3M Project E06-0519
Analysis of Woodbuty Waste Site Water Samples: Mid-April and Early June 2007
PFNA
Concanbation (ng/mL) %Recovery
c0.0248 NA
c0.0248 NA 0.248 99.8
4.49 90.4
<0.0248 nghL
Table 23. WBMN GW S07JS"'
PFDA PFUnA PFDoA
Concenlraiion Concentmtion Concentration f ~ g h L ) %Recovery (nghL) %Recovery (nghL) %Recovery
~0.0246 NA -=0.0296 NA C0.0304 NA
<0.0246 NA c0.0296 NA c0.0304 NA
0.241 98.0 0.254 103 0.188 74.3
3.88 78.9 4.27 86.6 2.80 55.3i2'
<0.0246 nghL c0.0296 nghL 4.0304 nghL
3M UMS ID
E0645441318
E0645441319
E0645441320
E06-05441321
Description
WBMN GWS07JS 0 070606
WBMN GWS07JS DB 070606
WBMN GW SO7JS LS 070606
WBMN GW SO7JS MS 070606
NA = Not Applicable (1) The analytical method uncertainties associated with the reported results are as follows: PFNA 100% 2 30%, PFDA 100% f 30%, PFUnA 100% 2 30%. and PFDoA 100% f 45%. (2) Field matrix spike recovety did not meet method acceptance aiteria of 100% f 30%. Analytical uncertainty adjusted accordingly.
3M UMS ID
E0645441323
E0645441324
E0645441325
E0645491326
Table 24. WBMN GW SOGPC'')
I I I I
Concentration Description (nghL)
c0.0248
c0.0248
0.237
4.51
WBMN GW S06PC 0 070606
WBMN GW SOGPC DB 070606
WBMN GW S06PC DB 070606
WBMN GW S06PC MS 070606
I I PF
Concenlation (nghL) %Recovery
4 Pf
Average Concenbation (nghL) f %RpD 4.0248 n g h L
Concentration
~0.0246
95.4 0.216
<0.0246 nghL ~0.0296 n g h L
c0.0296
~0.0296
87.8 0.188
83.1 3.84 I
9
%Recovery
NA
NA
76.3
77.9
27 of 109

Exygen Protocol PO002561 Interim Report #12 3M Project E06-0549
Analysis of Woodbuly Waste Site Water Samples: Mid-April and Early June 2007
3M LlMS ID Description
E0645441328 WBMN GW S06JS 0 070606
EO645441329 WBMN GW S06JS DB 070606
E06-05441330 WBMN GW S W S LS 070606
E06-05441331 WBMN GW S W S MS 070606
Average Concentrmon (nghnL) f %RPD
Table 25. WBMN GW S06JS"'
PFNA PFDA PFUnA PFDoA
Concentration Concentration Concenttation Concentration (nghL) %Recovery (nghnL) %Recovery (nghL) %Recovery (nghL) %Recovery
<0.0248 NA <0.0246 NA ~0.0296 NA <0.0304 NA
<0.0248 NA ~0.0246 NA e0.0296 NA <0.0304 NA
0.257 104 0.260 106 0.273 111 0.203 80.2
4.99 100 4.56 92.7 5.02 102 3.59 70.9
a.0248 nghL c0.0246 n g h L ~0.0296 nghL cO.0304 nghL
3M UMS ID
EO645441333
EO645441 334
€06-0549-1 335
E06-0549-1336
Table 26. WBMN GW SO2PC"'
Description
WBMN GW SO2PC 0 070606
WBMN GW SOZPC DB 070606
WBMN GW SOPPC LS 070606
WBMN GW SO2PC MS 070606
PFNA
Concentration
<0.0248
<0.0248
0.237
4.46
c0.0248 nghL
PFDA PWnA
Concentration Concentration %ReCO
<0.0246
<0.0246 <0.0296
0.242 98.4 0.282 114
4.43 90.0 5.15 104
<0.0246 n ~0.0296 n
PFDOA
Concentration
<0.0304
C0.0304
0.228
4.09 80.8
cO.0304 nghL
NA = Not Applicable (1) The analytical method uncertainties assodated with the reported results are as follows: PFNA 100% f 3056, PFDA 100% f 30%, PFUnA 100% f 30%, and PFDoA 100% f 30%.
28 of 109
Exygen Protocol PO002561 Interim Report #12 3M Project E06-0549
Analysis of Woodbury Waste Site Water Samples: Mid-April and Early June 2007
3M UMS ID
E06-0549-1338
E06-0549-1339
E06-0549-1340
E0645441341
Table 27. WBMN GW S02JS'11
Description
WBMN GW SOZJS 0 070606
WBMN GW SOZJS DB 070606
WBMN GW SOZJS LS 070606
WBMN GW SOZJS MS 070606
3M LlMS ID Description
E06-0549-1343 WBMN GW S W P 0 070606
E0645491344 WBMN GW SWSP DB 070606
E0645491345 WBMN GW S W P LS 070606
E06-0549-1346 WBMN GW SWSP MS 070606
Average Concentratfon (nghL) f %RPD
PFNA
c0.0248
<0.0248
0.237
4.94
~0.0248 n g h L
PFNA PFDA PFUnA PFDoA
Concenbation Concentration Concentration Concentration (nghL) %Recovery (nghL) %Recovery (nghL) %Recovery fnghL) %RerOVery
<0.0248 NA c0.0246 NA <0.0296 NA <0.0304 NA
~0.0248 NA ~0.0246 NA ~0.0296 NA <0.0304 NA
0.229 92.2 0.207 84.1 0.169 68.5"' 0.129 51 .O@'
4.92 99.0 4.20 85.4 3.68 74.6 Not Reported '3'
cO.0248 nghL cO.0246 n g h L <0.0296 n g h L cO.0304 nghL
ff
Concentration fnghL)
c0.0246
<0.0246
0.244
4.83
PFUnA
c0.0296
~0.0296
0.275
98.2 5.79
c0.0246 nghL ~0.0296 n g h L
<0.0304
<0.0304
0.269 106
4.94 97.6
<0.0304 n
NA = Not Applicable (1) The analyhcal method uncertainties associated with the reported results are as follows: PFNA 100% f 30%, PFDA 100% f 30%, PFUnA 100% f 30%, and PFDoA 100% f 30%.
Table 28. WBMN GW SO4SP")
NA = Not Applicable (1) The analytrcal method uncertainties assodated with the reported results are as follows: PFNA 100% f 30%, PFDA 100% f 30%. PFUnA 100% f 32%, and PFDoA 100% 2 49%. (2) Field matrix spike recovery did not meet method acceptance criteria of 100% f 30%. Analytical uncertainly adjusted accordingly. (3) Not Reported; Field matrix spike recovery ~ 5 0 % .
29 of 109

Exygen Protocol PO002561 Interim Report #12 3M Project E06-0549
Analysis of Woodbury Waste Site Water Samples: Mid-April and Early June 2007
3M UMS ID
E06-0549-1348
€06-05441349
€06-0549-1350
E06-0549-1351
Table 29. WBMN GW S04PC?'
Description
WBMN GW SWPC 0 070606
WBMN GW SWPC DB 070606
WBMN GW SWPC LS 070606
WBMN GW SWPC MS 070606
I I PFI
Average Concenbation (nghnL) ?r %RPD c0.0248 n g h L
Concentration
e0.0248
<0.0248
0.252
c0.0246 n g h L
%Recovery
NA
NA
101
97.4
<0.0296 nghnL
3M UMS ID
E06-0549-1353
E06-0549-1354
E06-0549-1355
E06-0549-1356
~0.0246
<0.0246
0.250
4.74 96.3
Des+tion
WBMN GW MWH 0 070607
WBMN GW MWH DB 070607
WBMN GW MWH LS 070607
WBMN GW MWH MS 070607
PFL
Concentration
<0.0296
fnghnL)
<0.0296
0.266
5.42
Concentration
4
%ReCOVery
NA
NA
108
110
PFO
Concentration fnrnL) <0.0304
<0.0304
0.238
3.75
A
%Recovery
NA
NA
94.1
74.1
cO.0304 n g h L
(1) The analytical method uncertainties assodated with the reported results are as follows: PFNA 100% f 30%, PFDA 100% f 30%, PFUnA 100% f 30%, and PFDoA 100% f 30%.
Table 30. WBMN GW MWH'"
PFNA I
~0.0248 nghnL
PFDA PFUnA
Concenttation Concentration
<0.0246 <0.0296
<0.0246 <0.0296
0.172 69.9 0.142 57.6"'
4.19 85.2 3.69 74.8
e0.0246 n 4.0296 n
PFDOA
GiGxZZ Not Reported
Not Reported
Not R e p o d
NA = Not Applicable (1) The analytical method uncertainties associated with the reported results are as follows: PFNA 100% f 30%, PFDA 100% ? 30%, and PFUnA 100% f 42% (2) Field matrix spike recovery did not meet method acceptance criteria of 100% f 30%. Analytical uncertainly adjusted accordingly. (3) Not Reported; Sample result could not be reported as the field matrix spike recoveries were 4 0 %
30 of 109

Exygen Protocol PO002561 Interim Report #12 3M Project E06-0549
Analysis of Woodbury Waste Site Water Samples: Mid-April and Early June 2007
IA
Table 31. WBMN GW DRILL"'
I I
PFDA PFUnA PFDoA
3M UMS ID
~06-0544135a
~06-05441359
~06-0549-1360
~ 0 6 - 0 ~ - 1 3 6 1
ConcenM.or Description ( n m u
~0.0248
c0.0248
WBMN GW DRIU 1 o 070608
WBMN GW DRILL 1 DB 070608
WBMN GW DRILL 1 LS 070608
WBMN GW DRIU 1 MS 070608
0.225
4.65
1 I I I I
NA = Not Applicable (1) Field matrix spike recovery did not meet method acceptance criteria of 100% t 30%. Analytical uncertainty adjusted accordingly.
%Recovery
NA
NA
90.6
93.6
31 of 109
Concentration Concenttation Concentration ( n M W %Recovery (ns/mL) %Recowry (n@L) %Recovery
Not Reported c0.0246 NA ~0.0296 NA
C0.0246 NA C0.0296 NA Not Reported
0.217 88.2 0.193 78.3
4.47 90.9 4.31 87.4 I 1
Average Concentration (nghL) f %RPD cO.0248 nghL ~0.0246 n@L cO.0296 nghL Not Reported
Description
E0645441363 WBMN GWTRIP 0 070612
E0645441364 WBMN GWTRIP LS 070612
EO645441365 WBMN GWTRIP MS 070612
3M UMS ID
PFNA PFDA PFUnA PFDoA
Concentration Concentration Concenttation Concentration (nghL) %Recovery (ngh l ) %Recovery (nghL) %Recovery (nghL) %Recovq
~0.0248 NA ~0.0246 NA C0.0296 NA c0.0304 NA
0.241 97.0 0.229 93.1 0.222 90.0 0.129 51 .O"'
4.76 95.8 4.58 93.1 5.42 110 4.52 89.3

Exygen Protocol PO002561 Interim Report #12 3M Project €06-0549
Analysis of Woodbury Waste Site Water Samples: Mid-April and Early June 2007
Concentration (nghL)
<0.0304
<0.0304
4.21
0.175
Table 33. WBMN GW RBOI"'
%Recovery
NA
NA
83.2"'
69.212,3'
PFNA I I I
3M UMS ID
€06-05441367
E0605441368
€06-05491369
E0645441370
Concentration Description (nghL) %Recovery
WBMN GW RBOl 0 070613 <0.0248 NA
WBMN GW RBOl DB 070613 <0.0248 NA
WBMN GW RBOl LS 070613 4.89 98.4'2'
WBMN GW RBOl MS 070613 0.246 99.0
PFUnA
c0.0296
<0.0296
11 1'2'
Average Concentration (ngh l ) f %RPD C0.0248 n g h L
NA = Not Applicable (1) The analytical method uncertainties associated with the reported results are as follows: PFNA 100% f 30%, PFDA 100% f 30%, PFUnA 100% f 30%, and PFDoA 100% f 31%. (2) Samples appear to have been switch during sample preparation. Spike recovery was calculated based on the presumed spike concentration. (3) Field matrix spike recovery did not meet method acceptance criteria of 100% f 30%. Analytical uncertainty adjusted accordingly.
Table 34. WBMN GW S02DR"'
I I I
PFNA PF
Concentration Concenlration 3M LlMS ID Description %Recovery
NA
NA 113
95.7
(nghL) %Recovery fnghL)
E06-05441372
E0605441373
E0645441374
E0605441375
PFL
Concentration fnghL)
<0.0296
<0.0296
0.281
5.75
WBMN GW S02DR 0 060612 <0.0248 NA e0.0246
WBMN GWS02DR DB 070612 <0.0248 NA <0.0246
WBMN GW SO2DR LS 070612 0.259 104 0.277
WBMN GW SO2DR MS 070612 4.87 98.0 4.71
<0.0304
<0.0304
0.239
5.07
Average Concentration (nghL) f %RPD <0.0304 nghL ~0.0296 n g h L ~0.0248 nghL ~0.0246 nghL
(1) The analytical method uncertainties associated with the reported results are as follows: PFNA 100% f 30%, PFDA 100% f 30%, PFUnA 100% f 30%, and PFDoA 100% f 30%.
32 of 109

Exygen Protocol PO002561 Interim Report #12 3M Project E06-0549
Analysis of Woodbury Waste Site Water Samples: Mid-April and Early June 2007
3M LlMS ID Description
E06-0549-1377 WBMN GW WR3 0 070612
E06-0549-1378 WBMN GW WR3 DB 070612
E06-0549-1379 WBMN GWWR3 LS 070612
E06-0549-1380 WBMN GWWR3 MS 070612
Table 35. WBMN GW WR03")
PFI
Concentration (nghL)
<0.0248
<0.0248
0.234
4.84
9
%Recovery
NA
NA 80.9
85.0
I
%Recovery
NA
NA
94.2
97.4
PFUnA PFDoA
Concentration Concentration (nghL) %Recovery (nghL) %Recovery
Not Reported
Not Reported
~0.0296 NA
<0.0296 NA
0.158 64.1'"
3.88 78.7
Average Concentration (nghL) f %RPD
PF
cO.0248 nghL
Concentration f n W L )
<0.0246
<0.0246
0.199
4.18
cO.0246 nghL a.0296 n g h L Not Reported @'
3M UMS ID Description
E06-0549-1382 WBMN GW SO3JS 0 070612
E06-0549-1383 WBMN GW SO3JS DB 070612
E0645491384 WBMN GW SO3JS LS 070612
E06-0549-1385 WBMN GW SO3JS MS 070612
Average Concentration (nghL) f %RPD
. . (1) The analytical method uncertainties associated with the reported results are as follows: PFNA 100% f 30%, PFDA 100% ? 30%, and PFUnA 100% f 36% (2) FeM mabix spike recovery did not meet method acceptance criteria of 100% 2 30%. Analytical uncertainty adjusted accordingly. (3) Not Reported; Sample result could not be reported as the field matrix spike recoveries were <50%.
PFNA
Conceniration (nghL) %Recovery
<0.0248 NA
<0.0248 NA
0.273 110
5.16 104
cO.0248 nghL
Table 36. WBMN GW S03JS'"
PFUnA
<0.0246
<0.0246 <0.0296
0.276 0.289
4.84
PFDOA
<0.0304
<0.0304
0.230
3.78 74.7
co.0304 n g h L
NA = Not Applicable (1) The analytical method uncertainties associated with the reported results are as follows: PFNA 100% f 30%, PFDA 100% f 30%, PFUnA 100% f 30%, and PFDoA 100% f 30%.
33 of 109
Exygen Protocol PO002561 Interim Report # l2 3M Project €06-0549
Analysis of Woodbury Waste Site Water Samples: Mid-April and Early June 2007
3M UMS ID Description
E0645491387 WBMN GWS03PC 0 070613
E06-0549-1388 WBMN GW SO3PC DB 070613
E06-0549-1389 W M N GW SO3PC LS 070613
E06-0549-1390 WBMN GWSO3PC MS 070613
Average Concentration (nghnL) f %RPD
Table 37. WBMN GW S03PC‘1’
PFNA PFDA PFUnA PFDoA
Concentration Concentration Concentration Concenbation (nghL) %Recovery (nghnL) %Recovery fnghnL) %Recovery (nghL) %Recovery
~0.0248 NA <0.0246 NA <0.0296 NA c0.0304 NA
<0.0248 NA c0.0246 NA ~0.0296 NA <0.0304 NA
0.287 116 0.285 116 0.315 128 0.259 102
5.39 108 5.06 103 5.56 113 4.76 94.1
<0.0248 n g h L <0.0246 nghL <0.0296 n g h L <0.0304 nghL
PFNA
NA = Not Applicable (1) The analytical method uncertainties associated with the reported results are as follows: PFNA 100% f 30%, PFDA 100% f 30%, PFUnA 100% f 30%, and PFDoA 100% f 30%.
PFDA PFUnA PFDoA
3M UMS ID
€06-05491392
E06-0549-1393
E06-0549-1394
E0645441395
Concentratron Concentration Description (nghL) %Recovery (nghL) %Recovery
WBMN GWS05JS 0 070613 <0.0248 NA c0.0246 NA WBMN GW SO5JS DB 070613 c0.0248 NA <0.0246 NA
WBMN GW SO5JS LS 070613 0.282 114 0.274 111
WBMN GW SO5JS MS 070613 5.74 116 5.76 117
Average Concentration (nghnL) f %RPD
NA = Not Applicable (1) The analytical method uncertainties associated with the reported results are as follows: PFNA 100% f 30%, PFDA 100% f 30%. PFUnA 100% f 32%, and PFDoA 100% f 30%. (2) Field ma* spike recovery did not meet method acceptance aitelia of 100% f 30%. Analytical uncertainly adjusted accordingly.
e0.0248 n@nL <0.0246 n g h L
34 of 109
Concentration (nghnL)
<0.0296
~0.0296
0.320
6.52
Concentration %Recovery (nghL) %Recovery
NA c0.0304 NA
NA <0.0304 NA
130 0.295 117
1 3212’ 5.55 110
<0.0296 n g h L 4.0304 nghL

Exygen Protocol PO002561 Interim Report #12 3M Project €06-0549
Analysis of Woodbury Waste Site Water Samples: Mid-April and Early June 2007
3M UMS ID Description
Table 39. WBMN GW S07SP'"
PFNA
Concentration (nghL) %Recovery
E06-0549-1397
E06-0549-1398
E0645441399
E06-0549-1400
c0.0248
c0.0248
0.261
5.22 105
c0.0248 nghL
WBMN GWS07SP 0 070613
WBMN GWS07SP DB 070613
WBMN GWS07SP LS 070613
WBMN GWS07SP MS 070613
PFDA PFUnA
Concentration Concentration
c0.0246 c0.0296
c0.0246 ~0.0296
0.265 0.255
4.97 5.39
cO.0246 nghL c0.0296 nghL
PFDA PFUnA 1
cO.0304 n g h L
Concentration Concentration
c0.0246 c0.0296
c0.0246 ~0.0296
0.265 0.255
4.97 5.39
PFO
Concentration (nghL)
c0.0304
4.0304
0.21 1
4.06
83.4
80.2
(1) The analytical method uncertainties associated with the reported results are as follows: PFNA 100% ?r 30%, PFDA 100% -r 30%, PFUnA 100% 30%, and PFDoA 100% ?: 30%.
35 of 109

Exygen Protocol PO002561 Interim Report # I 2 3M Project E06-0549
Analysis of Woodbury Waste Site Water Samples: Mid-April and Early June 2007
70 Conclusion
Laboratory control spikes and field matrix spikes were used to determine the analytical method accuracy and precision for all analytes. Analysis was successfully completed following 3M Environmental Laboratory methods described herein.
All remaining samples and associated project data (hardcopy and electronic) will be archived according to 3M Environmental Laboratory standard operating procedures.
12 Attachments
Attachment A: Analytical Methods Attachment B: Representative Chromatograms and Calibration Curves Attachment C: Protocol PO002561 Amendments Attachment D: Method Deviations
36 of 109

Exygen Protocol PO002561 Interim Report #12 3M Project E06-0549
Analysis of Woodbury Waste Site Water Samples: Mid-April and Early June 2007
73
h
Report Approval:
Susan Wolf. 3M Principal Analytical Date
Date William K. Reagen, Ph.D., 3M Environmental Laboratory Technical Manager
Robert A. F#schke, Sponsor Representative Date
- Jaisimha Kesari, Study Director
37 of 109

Exygen Protocol PO002561 Interim Report #12 3M Project E06-0549
Analysis of Woodbuty Waste Site Water Samples: Mid-April and Early June 2007
ATTACHMENT A: SAMPLE CHROMATOGRAMS AND CALIBRATION CURVES
38 Of 109

Exygen Protocol PO002561 Interim Report # I 2 3M Project E06-0549
Analysis of Woodbury Waste Site Water Samples: Mid-April and Early June 2007
'Ginger A G O 1 3 3 0 5 0 9
"*,,,,.,,,," ,14111 n.3,mL I 0 <4: ,,l,.,
A,, , Dlrs ~ , 2 5 , , , , , , , *, , Tin. I I I , / PM
Printing D a t e : Tuesday. A u g u s t 21, 2001 P a g e 1 of 16
39 of 109

'Ginger A G O 1 3 3 0 5 0 9 Exygen Protocol PO002561 Interim Report # I 2 3M Project E06-0549
Analysis of Woodbury Waste Site Water Samples: Mid-April and Early June 2007
P r i n t i n g D a t e : Tuesday, A u g u ~ t 2 1 , 2 0 0 1 Page 2 of 16
40 of 109

'Ginger A G O 1 3 3 0 5 0 9 Exygen Protocol PO002561 Interim Report #12 3M Project E06-0549
Analysis of Woodbuty Waste Site Water Samples: Mid-April and Early June 2007
Printing Date: Tuesday. August 21, 2 0 0 7 Page 3 of 16
41 of 109

'Ginger A G O 1 3 3 0 5 0 9 Exygen Protocol PO002561 Interim Report #12 3M Project E06-0549
Analysis of Woodbury Waste Site Water Samples: Mid-April and Early June 2007
P r i n t i n g Date: T u e s d a y , A u g u s t 21, 2 0 0 1 Page 4 of 16
42 of 109

‘Ginger A G O 1 3 3 0 5 0 9 Exygen Protocol PO002561 Interim Report # I 2 3M Project E06-0549
Analysis of Woodbury Waste Site Water Samples: Mid-April and Early June 2007
P r i n t i n g D a t e : Tuesday, A u g u s t 2 1 , 2 0 0 1 Page 5 of 16

Exygen Protocol PO002561 Interim Report # I 2 3M Project E06-0549
Analysis of Woodbury Waste Site Water Samples: Mid-April and Early June 2007
'Glnger A G O 1 3 3 0 5 0 9
I
Page 6 of 16 Printing Date: Tuesday, August 2 1 , 2007
44 of 109

'Ginger AGO1330509 Exygen Protocol PO002561 Interim Report #12
3M Project E06-0549 Analysis of Woodbury Waste Site Water Samples: Mid-April and Early June 2007
c. - I 15 16
Prlnting Date: Tuesday, A u g u s t 2 1 , 2007 Page I of 16
45 of 109

'Ginger A G O 1 3 3 0 5 0 9 Exygen Protocol PO002561 Interim Report # I 2 3M Project E06-0549
Analysis of Woodbury Waste Site Water Samples: Mid-April and Early June 2007
Printing Date: Tuesday, A u g u s t 2 1 , 2 0 0 1 P a g e 8 of 16
46 of 109
'Ginger EGO1330509 Exygen Protocol PO002561 Interim Report # I2 3M Project E06-0549
Analysis of Woodbury Waste Site Water Samples: Mid-April and Early June 2007
Printing pate: Tuesday, A u g u s t 21 , 2 0 0 7 Page 9 of 1 6
47 of 109

! ,
'Ginger A G O 1 3 3 0 5 0 9 Exygen Protocol PO002561 Interim Report # I2 3M Project E06-0549
Analysis of Woodbuty Waste Site Water Samples: Mid-April and Early June 2007
Pcintlng Date: Tuesday. August 21, 2001 Page 10 of 1 6
48 of 109

'Ginger AGO1330509 Exygen Protocol PO002561 Interim Report # I 2 3M Project E06-0549
Analysis of Woodbury Waste Site Water Samples: Mid-April and Early June 2007
P r i n t i n g D a t e : Tuesday , A u g u s t 2 1 , 2001 Page 1 1 of 16
49 of 109

' G i n g e r A G O 1 3 3 0 5 0 9 Exygen Protocol PO002561 Interim Report #I2 3M Project E06-0549
Analysis of Woodbury Waste Site Water Samples: Mid-April and Early June 2007
P r i n t i n g
~ ~~
D a t e : A u g u s t 2 1 ,

'Ginger AGO1330509 Exygen Protocol PO002561 Interim Report #12 3M Project E06-0549
Analysis of Woodbury Waste Site Water Samples: Mid-April and Early June 2007
!
P r i n t i n g D a t e : Tuesday, A u g u s t 2 1 , 2001 P a g e 1 3 of 1 6
51 of 109

' G i n g e r A G 0 1 3 3 0 5 0 9 Exygen Protocol PO002561 Interim Report #12 3M Project E06-0549
Analysis of Woodbury Waste Site Water Samples: Mid-April and Early June 2007
m
(M
!
I 150
P a g e I4 of 1 6 P r l n t l n g D a t e : Tuesday, A u g u s t 21, 2 0 0 1
52 Of 109

'Ginger A G O 1 3 3 0 5 0 9 Exygen Protocol PO002561 Interim Report #12 3M Project E06-0549
Analysis of Woodbury Waste Site Water Samples: Mid-April and Early June 2007
P r i n t i n g D a t e : Tuesday. august 21. 2 0 0 7 Page 15 of 16
53 of 109

txygen rroiocoi ruuuL3o-i inIerim Kepon v-I L 3M Project E06-0549
Analysis of Woodbury Waste Site Water Samples: Mid-April and Early June 2007
Page 16 of 16 P r i n t i n g Date: Tuesday, A u g u s t 2 1 , 2007
54 of 109

Exygen Protocol PO002561 lntenm Report # I2 3M Project E06-0549
Analysis of Woodbury Waste Site Water Samples MidApril and Early June 2007 ~ _ - ~ - - - -
g070725b rdb (PFNA) “Quadratic” Regression (“1 I x” weighting) y = -1 25e+005 xA2 + 5.56e+006 x + 9.32e+004 (r = 0 9995)
4.4e7
4.2e7
4.0e7
3.8e7
3.6e7
3.4e7
3.2e7
3.0e7
2.8e7
2.6e7
2.4e7
2.2e7
2.0e7
1 .8e7
1.6e7
1.4e7
1.2e7
1 .Oe7
8.0e6
6.0e6
4.0e6
2.0e6
0.0
0
,/’
/ /”” /’
/’ ,/,’
,,”
/” @’ /
,/’
/ , - - ’ , f ’ ” I ’ --7 ,--- -- - , . , , , , - . , , , . - ~ T-7-T--. . . , , , . , , ~, , , ,
0.0 0.5 1.0 I 5 2.0 2.5 3.0 3.5 4 0 4.5 5.0 5.5 6.0 6.5 7.0 7.5 8.0 8.5 9.0 9.5 10.0 Concentration, n g h L - - __. -~ - __- -________- _ _ --___ _- -
55 of 109

Exygen Protocol PO002561 lntenm Report #12 3M Project E06-0549
Analysis of Woodbury Waste Site Water Samples MidApril and Early June 2007 - _ _ - -~ ~ ~- ~~ ___ - - - ~- ~
g070725b rdb (PFDoA) “Quadratic” Regression (“1 I x” weighting) y = -6.95e+004 x”2 + 3.62e+006 x + 89e+004 (r = 0.9988)
3.0e7 -
, 2.8e7 -
,/’ ,/
2.6e7 ,’ /’
2.4e7 ,//’ ,
__I____________
2.2e7 1 ,’ , /’
,/’
/’ 2.0e7 - /”
1 .Be7 - /’ ,/”
1.6e7 ~ / ’ 0 /’ ,
/’ 1.4e7 I 1
1.2e7 1 i
i
/’ , /’ 1.0e7 i
1 8.0e6
~
6.0e6
4.0e6
0 ’
/’ ,/I’
/’
--- ------- . , , . , , . , , , , T---T-T---r---- , . , . . , , , , , , , , , , , , 1 , ,
..’ 2.0e6 1 y’ 0.0 I--- . ____--. ~i ._ - _ ~ _ , , , , , , , , , , , , , . ,
0.0 0.5 1.0 1.5 2.0 2.5 3.0 3.5 4.0 4.5 5.0 5.5 6.0 6.5 7.0 7.5 8.0 8.5 9.0 9.5 10.0 Concentration, nglmL _ _ _ ~ - - . -. . _ _ _ _ ~ ~ - .~~ ~ __. . ~ ~
56 of 109

Exygen Protocol PO002561 lntenm Report #I2 Analysis of Woodbury Waste .%e Water Samples MidApril 3M and Project Early June E06-0549 2007
- -~ _ _ - ~ -~ g070725b.rdb (PFDA) "Quadratic" RegGssion ("1 I x" weighting) y = -1.57e+005 xA2 + 5.21e+006 x + 9.79ec004 (r = 0 9968)
3.8e7 i e
57 of 109

Exygen Protocol PO002561 Interim Report #12 3M Project E06-0549
Analysis of Woodbuly Waste Sde Water Samples Mid-April and Early June 2007 _ ~ _ _ ~ - _ _ _ _ _ ~ _~ r g070725b rdb (PFUnA) “Quadratic“ Regression (“1 I x” weighting) y = -1.98e+005 xA2 + 7 22e+006 x + 1.61e+005 (r = 0.9983)
5.4e7 0
4.5e7
4.0e7
3.5e7
3.0e7
2.5e7
2.0e7
1 Se7
1 .Oe7
5.0e6
0.0
1 ,
, 5.0e7 - /*’
_,* ,/-’
,
0
r--7-----rr--- I , , , , , , , , , , , , , , , , , , , , , , ~ -T-----’ , , , , , - . . , , , . , . , _ , , , -- .- -- T_-~-_ ---. ---- , , . . , , , . , ,
0.0 0.5 1.0 1.5 2.0 2.5 3.0 3.5 4.0 4.5 5.0 5.5 6.0 6.5 7.0 7.5 8.0 8.5 9.0 9.5
- ~~ ~- ~ ~ . . -. ~~~~~~~ Concentration, ngImL
~~ ~~~
58 of 109
Exygen Protocol PO002561 Interim Report #12 3M Project E06-0549
Analysis of Woodbury Waste Site Water Samples: Mid-April and Early June 2007
ATTACHMENT B: EXTRACTION AND ANALYTICAL METHODS
59 O f 109

Exygen Protocol PO002561 Interim Report # I 2 3M Project E06-0549
Analysis of Woodbury Waste Site Water Samples: Mid-April and Early June 2007
3M Environmental Laboratory Method
Determination of Perfluorinated Acids, Alcohols, Amides, and Sulfonates In Water By Solid Phase Extraction and High Performance Liquid
Chromatcigraphy/Mass Spectrometry
Method Number: ETS-8-954.7
Adoption Date: 28 Apr 2000
Revkion Date: 5 May, 2003
Effective Date: 5 May, 2003
Approved By:
OJ/Os/a3 William K. Reagen Date Manager
ETS-6-154.1 Page 1 of 17 Determination of Perfluorinated Compounds in Water Using SPE and LCIMS.
60 of 109

Exygen Protocol PO002561 Interim Report #I2 3M Project E06-0549
Analysis of Woodbury Waste Site Water Samples: Mid-April and Early June 2007
1 Scope and Application
This method was validated for the collection, extraction, and analytical procedure for the detennination of Peffluorooctane sulfonate (PFOS), Perfluorooctane sulfonylamide (FOSA), and Perfluorooctanoate (PFOA) in groundwater, surface water, and drinking water samples. This method may also be applied to the determination of other peffluorinated acids, alcohols, amides, and sulfonates in similar matrices, as long as the defined QC elements are satisfied and with the understanding that the method is not validated for compounds outside the scope of the original protocol
This method is based in part on the report "Method of Analysis for the Determination of Perfluorooctane sulfonate (PFOS), Peffluorooctane sulfonylamide (PFOSA), and Perfluorooctanoate (POAA) in Water" (see Section 17), as developed and validated by Exygen Research (formerly Centre Analytical Laboratories, Inc.).
2 Method Summary
Water samples are collected from a site of interest and shipped cold to an analytical facility. Peffluorinated acids, alcohols, amides, and sulfonates are extracted from 40mL water samples using C18 solid phase extraction (SPE) cartridges. The compounds are eluted from the C18 cartridge, using methanol. Separation, identification, and measurement are accomplished by high- performance liquid chromatography/ tandem mass spectrometry (HPLCNSIMS) analysis. High- performance liquid chromatographyhnass spectrometry (HPLCNS) may be used if the defined QC elements are satisfied.
The concentration of each identified component is measured by comparing the MS response of the quantitation ion produced by that compound to the MS response of the quantitation ion produced by the same compound in an extracted calibration standard (external standard).
3 Definitions
3.1 Analytical Sample
3.2 Calibration Standard
A portion of an extracted Laboratory Sample prepared for analysis.
A solution prepared from the Working Standard (WS) and extracted according to this method. The calibration standard solutions are used to calibrate the instrument response with respect to analyte concentration.
3.3 Duplicate Sample (DS) A DS is a separate aliquot of a sample, taken in the analytical laboratory that is extracted and analyzed separately with identical procedures. Analysis of DSs compared to that of the first aliquot give a measure of the precision associated with laboratory procedures, but not with sample collection, preservation, or storage procedures.
3.4 Field Blank Control Sample (FB) ASTM Type I water placed in a sample container in the laboratory and treated as a sample in all respects, including exposure to sampling site conditions, storage, preservation and all analytical procedures. The purpose of the FB is to determine if test substances or other interferences are present in the field environment.
ETS-8-154.1 Page 2 of 17 Determination of Perfluorinated Compounds in Water Using SPE and LCIMS.
61 of 109

Exygen Protocol PO002561 Interim Report #12 3M Project E06-0549
Analysis of Woodbury Waste Site Water Samples: Mid-April and Early June 2007
3.5 Field Duplicate (FD)
A sample collected in duplicate at the same time as the sample and placed under identical circumstances and treated exactly the same throughout field and laboratory procedures. Analysis of FD compared to that of the first sample gives a measure of the precision associated with sample collection, preservation and storage, as well as with laboratory procedures.
3.6 Field Matrix Spike (FMS) A sample collected in duplicate to which known quantities of the target analytes are added in the field at the time of sample collection. Alternatively, the known quantity of target analytes may be added to the sample bottle in the laboratory before the bottles are sent to the field. A known, specific volume of sample must be added to sample container without rinsing. This may be accomplished by making a “fill to this level” line on the outside of the sample container. The FMS should be spiked at approximately 50-150% of the expected analyte concentration in the sample. If the expected range of analyte concentrations is unknown, a low and a high spike may be prepared to increase the likelihood that a spike at an appropriate range is made. The FMS is analyzed to ascertain if any matrix effects, interferences, or stability issues may complicate the interpretation of the sample analysis.
3.7 Field Spike Control Sample (FSCS) An aliquot of ASTM Type I water to which known quantities of the target analytes are added in the field at the time of sample collection (at an appropriate concentration to be determined by the project lead) or in the laboratory prior to the shipment of the collection bottles. The FSCS is extracted and analyzed exactly like a sample to determine whether a loss of analyte could be attributed to sample storage and/or shipment. A low and high FSCS may be appropriate when expected sample concentrations are not known.
3.8 Laboratory Control Sample (LCS) An aliquot of ASTM Type I water to which known quantities of the target analytes are added in the laboratory. Two levels are included, one at the LLOQ (approx. 25 pg/mL), the other at a concentration of approx. 100-250 pg/mL or another concentration to be determined by the project lead. The LCS is extracted and analyzed exactly like a laboratory sample to determine whether the methodology is in control, and whether the laboratory is capable of making accurate measurements at the required method detection limit and higher.
3.9 Laboratory Sample A portion of a sample received from the field for testing.
3.10 Limit of Detection (LOD) The LOD is the lowest concentration of an analyte that can be measured and reported with 99% confidence that the analyte concentration is greater than zero. If required, the LOD may be determined in several ways, including signal-to-noise ratio and statistical calculations.
3.1 1 Limit of Quantitation (LOQ) The LOQ for a dataset is the lowest concentration (LLOQ) or highest concentration (ULOQ) that can be reliably achieved within the specified limits of precision and accuracy during routine operating conditions.
Note: For many analytes, the LLOQ analyte concentration is selected as the lowest non-zero standard in the calibration curve to simplify data reporting. Sample LLOQs are matrix-dependent.
3.12 Matrix Spike (MS)
ETS-8154.1 Page 3 of 17 Determination of Perfluorinated Compounds in Water Using SPE and LCIMS.
62 of 109

Exygen Protocol PO002561 Interim Report #I2 3M Project E06-0549
Analysis of Woodbury Waste Site Water Samples: Mid-April and Early June 2007
A matrix spike is an aliquot of a sample, to which known quantities of target analytes are added in the laboratory. The MS is extracted and analyzed exactly like a laboratory sample to determine whether the sample matrix contributes bias to the analytical results. The background concentrations of the analytes in the sample matrix must be determined in a separate aliquot and the measured values in the MS corrected for background Concentrations.
3.13 Method Blank An aliquot of ASTM Type I water that is treated exactly like a laboratory sample including exposure to all glassware, equipment, solvents, and reagents that are used with other laboratory samples. The method blank is used to determine if test substances or other interferences are present in the laboratory environment, the reagents, or the apparatus.
3.14 Method Detection Limit (MDL) Determination A MDL is the statistically calculated minimum amount of an analyte that can be measured with 99% confidence that the reported value is greater than zero. One of several processes that may be used to establish a LOD value is found in 40 CFR Part 136 Appendix B.
3.15 Sample A sample is a small portion collected from a larger quantity of material intended to represent the original source material.
3.16 Spiking Stock Standard (SSS) A solution prepared from stock standards used to prepare the working standard.
3.17 Stock Standard (SS) A concentrated solution of a single analyte prepared in the laboratory with an assayed reference compound.
3.18 Working Standard (WS) A solution of several analytes prepared in the laboratory from SSs and diluted as needed to prepare calibration standards and other required analyte solutions.
4 Warnings and Cautions
4.1
4.2
5
Health and Safety The acute and chronic toxicity of the standards for this method have not been precisely determined; however, each should be treated as a potential health hazard.
Unknown samples may contain high concentrations of volatile toxic compounds. Sample containers should be opened in a hood and handled with gloves to prevent exposure.
The laboratory is responsible for maintaining a safe work environment and a current awareness of local regulations regarding the handling of the chemicals used in this method. A reference file of material safety data sheets (MSDS) should be available to all personnel involved in these analyses.
Cautions None
Interferences
ETS-8-154.1 Page 4 of 17 Determination of Perfluorinated Compounds in Water Using SPE and LCIMS.
63 of 109

Exygen Protocol PO002561 Interim Report #12 3M Project E06-0549
Analysis of Woodbury Waste Site Water Samples: Mid-April and Early June 2007
During extraction and analysis, major potential contaminant sources are reagents and solid phase extraction devices.
All materials used in the analyses shall be demonstrated to be free from interferences under conditions of analysis by running method blanks.
Parts and supplies that contain Teflon@ should be avoided due to the possibility of interference and/or contamination. These may include, but are not limited to: wash bottles, Teflon" lined caps, autovial caps, HPLC parts, etc.
The use of disposable micropipettes or pipettes to aliquot standard solutions is recommended to make calibration standards and matrix spikes.
6 Instrumentation, Supplies, and Materials
6.1
6.2
7
Note: Brand names, suppliers, and part numbers are for illustrative purposes only. Equivalent performance may be achieved using apparatus and materials other than those specified here, but demonstration of equivalent performance that meets the requirements of this method is the responsibility of the laboratory performing the analysis.
Instrumentation Balance, analytical (display at least 0.0001 g), Mettler
HPLClMSlMS or HPLClMS system, as described in Section 10.
Supplies and Materials. Sample collection bottles-LDPE (e.g., NalgeneTM) narrow-mouth bottles with screw cap. Note: Do not use Teflon bottles or Teflon lined caps.
Coolers for sample shipment.
Ice for sample shipment.
Vacuum pump, Buchi.
Visiprep vacuum manifold, Supelco.
Sep Pak Vac 6cc ( lg) tC18 cartridges (part # WAT 036795),Waters.
50mL disposable polypropylene centrifuge tubes, WVR.
15mL disposable polypropylene centrifuge tubes, WVR.
Disposable micropipettes (50-100pL, 100-200pL), Drummond.
Class A pipettes and volumetric flasks, various.
Hypercarb dropin guard column (4mm) (part # 844017400), Keystone.
Stand-alone drop-in guard cartridge holder, Keystone.
125mL LDPE narrow-mouth bottles, Nalgene.
2mL clear HPLC vial kit (cat # 5181-3400), AgilenVHewlett Packard.
Standard lab equipment (graduated cylinders, disposable tubes, etc.), various.
Reaaents and Standards - Note: Suppliers and catalog numbers are for illustrative purposes only. Equivalent performance may be achieved using chemicals obtained from other suppliers. Do not use a lesser grade of chemical than those listed.
ETS-8-154.1 Page 5 of 17 Determination of Perfluorinated Compounds in Water Using SPE and LCIMS.
64 of 109

Exygen Protocol PO002561 Interim Report #12 3M Project E06-0549
Analysis of Woodbury Waste Site Water Samples: Mid-April and Early June 2007
7.1 Chemicals Methanol (MeOH), HPLC grade, JT Baker, Catalog No. JT9093-2.
Ammonium Acetate, Reagent grade, Sigma-Aldrich, Catalog No. A-7330.
ASTM Type I Water, prepared in-house.
Sodium Thiosulfate, Reagent grade, JT Baker.
7.2 Standards Potassium perfluorooctane sulfonate
Peffluorooctane sulfonylamide
Ammonium perfluorooctanoate
Others as required.
7.3 Reagent Preparation 250mg/mL sodium thiosulfate solution - Dissolve 259 of sodium thiosulfate in 100mL reagent water.
40% methanol wash solution -Measure 400mL methanol and adjust volume to 1 .OL with reagent water.
1 OOmM ammonium acetate solution (Analysis)-Weigh 7.719 of ammonium acetate and dissolve in 1.OL of reagent water. Dilute the 100mM solution by a factor of 50 to make the 2mM ammonium acetate solution used for mobile phase A.
Note: Alternative volumes may be prepared as long as the ratios of the solvent to solute ratios are maintained.
7.4 Spiking Stock Standard (SSS) Preparation The following standard preparation procedure serves as an example and may be changed to suit the needs of a particular study. For example, VL volumes may be spiked into volumetric flasks when diluting stock solutions to appropriate levels.
100pglmL each PFOS, PFOSA, and POAA SSSs-Weigh out 10mg of analytical standard (corrected for percent salt and purity-Le., 10 mg C8F17S03K purity 90% = 8.35mg C8F17S03-) and dilute to 100mL with methanol in a 100mL volumetric flask. Transfer to a 125mL LDPE bottle or other suitable container. Prepare a separate solution for each analyte. Solutions may be stored in a refrigerator at 4"*2"C for a maximum period of 6 months from the date of preparation.
1pglmL mixed SSS-Add l.OmL each of the 100pglmL SSSs (from 7.4.1) to a 100mL volumetric flask and bring up to volume with methanol.
0.1pglmL mixed SSS-Add 10.0mL of the I.Opg/mL-mixed solution (from 7.4.2) to a 100mL volumetric flask and bring up to volume with methanol.
0.01pglmL mixed SSS-Add 10.0mL of the O.lpg/mL-mixed solution (from 7.4.3) to a 100mL volumetric flask and bring up to volume with methanol.
Storage Conditions4tore all SSSs in a refrigerator at 4"*2"C for a maximum period of 6 months from the date of preparation.
7.5 Calibration Standards The following standard preparation procedure serves as an example and may be changed to suit the needs of a particular study, provided the concentrations are calculated correctly.
ETS-8-154.1 Page 6 of 17 Determination of Perfluorinated Compounds in Water Using SPE and LCIMS.
65 of 109

Exygen Protocol PO002561 Interim Report # I 2 3M Project E06-0549
Analysis of Woodbury Waste Site Water Samples: Mid-April and Early June 2007
100pglmL each PFOS, PFOSA, and POAA stock standard solutions-Weigh out 10mg of analytical standard (corrected for percent salt and purity) and dilute to 100mL with methanol in a 100mL volumetric flask. Transfer to a 125mL LDPE boffle or other suitable container. Prepare a separate solution for each analyte. Store solutions in a refrigerator at 4Ok2"C for a maximum period of 6 months from the date of preparation.
Ipg/mL Working Standard-Add l.OmL each of the 100pg/mL SS solutions (from 7.5.1) to a 100mL volumetric flask and bring up to volume with methanol.
O.lpg/mL Working Standard -Add 10.0mL of the 1 .Opg/mL mixed solution (from 7.5.2) to a 100mL volumetric flask and bring up to volume with methanol.
0.01pglmL Working Standard -Add 10.0mL of the 0.1pglmL mixed solution (from 7.5.3) to a 100mL volumetric flask and bring up to volume with methanol.
Storage ConditionsStore all WSs in a refrigerator at 4"G'C for a maximum period of 6 months from the date of preparation.
Calibration Standard-Prepare calibration solutions in ASTM Type I using the following table as a guideline:
0.0 0.01 0 0.010
0.010 0.10 0.10 0.10 0.10 1 .o 1 .o 1 .o
0 100 200 400 100
200 300 400 100 400 1000
40 40 40 40 40 40 40 40
40 40 40
0 25 50 100 250 500 750 1000
2500 10000 25000
The standards are processed through the extraction procedure (Section 1 I), identical to the laboratory samples. The concentration of the calibration standard in the final extract is equal to 8X the initial concentration, due to the concentration of the standard during the extraction process.
Storage ConditionsStore all extracted calibration standards in 15mL polypropylene tubes at 4"G°C, for a maximum period of two weeks from the date of preparation
8 Sample Collection and Handling
Note: Sampling equipment, including automatic samplers, must be free of Teflon tubing, gaskets, and other parts that may leach interfering analytes into the water sample. Automatic samplers that composite samples over time should use refrigerated polypropylene sample containers if possible. Sample bottles should not be rinsed before sample collection.
Labeling: Each sample bottle must display information regarding the collection of that sample, the individual collecting the sample, and any matrix spike that has been added to the sample.
ETS-8-154.1 Page 7 of 17 Determination of Perfluorinated Compounds in Water Using SPE and LCIMS.
66 of 109

Exygen Protocol PO002561 Interim Report #12 3M Project E06-0549
Analysis of Woodbury Waste Site Water Samples: Mid-April and Early June 2007
This includes the volume and concentration of any spiking solution added and the volume and identification of any preservatives added in the field.
Spiking: The spiking scheme will be clearly outlined in the sampling plan, including whether the samples will be spiked in the field or in the laboratory prior to the shipment of the bottles to the site. If spiking is to be performed in the field, materials and specific instructions will be included in the sampling kit. Be sure to clearly label each bottle with spiking information if applicable.
Tap Water: Open the tap and allow the system to flush until the water temperature (15910°C) has stabilized (usually about two minutes). Adjust the flow to about 500mUmin and collect samples from the flowing stream.
Ground Water: Purge the well of standing water using a pump or a bailer. Collect the sample directly from the pump or from the bailer.
Surface Water: When sampling from an open body of water, fill the sample container with water from a representative area.
Sample Dechlorination: All samples should be iced or refrigerated at 4"QC and kept in the dark from the time of collection until extraction. Residual chlorine should be eliminated by adding 200pL of a 250mg/mL sodium thiosulfate solution to each tapwater sample and associated FB and FSCS (which may be placed in each bottle before leaving for the sampling site or done in the field.).
Holding Time (HT): Results of the timektorage study of all target analytes showed that the three compounds are stable for 14 days in water samples when the samples are dechlorinated and stored as described in the previous section (see also references in section 17). Therefore, laboratory samples must be extracted within 14 days and the extracts analyzed within 30 days of sample collection. If the HT exceeds 14 days, great care is used when evaluating field spikes to avoid misrepresentation of the sample concentration.
8.1 Field Blanks Process a Field Blank Control Sample (FB) along with each sample set (samples collected from the same general sample site at approximately the same time). At the laboratory, prior to sample collection, fill a sample container with ASTM Type I water, seal, and ship the FB to the sampling site along with the empty sample containers. Return the FB to the laboratory with the filled sample bottles.
When sodium thiosulfate is added to samples, use the same procedure to preserve the FB.
8.2 Field Duplicates Collect a Field Duplicate (FD) for every ten (IO) samples collected or per each sampling set, if less than 10 samples are collected.
Separate FDs must be collected for each type of water sample (ground, tap, etc.) collected.
Collect the FD immediately after the sample
Preserve, store and ship FD using the same procedures as used for the samples.
8.3 Field Spike Control Sample (FSCS) A Field Spike Control Sample (FSCS) must be prepared for each sample shipment. If multiple coolers are used to ship a set of samples, each cooler must contain a FSCS.
At the laboratory, fill a sample container with 100mL of ASTM Type I water. Seal and ship to the sampling site along with the empty sample containers and FBs. Samples may either be spiked in the field or in the laboratory prior to shipment. The method employed should be consistent throughout the study. If the samples are to be spiked in the field, be sure to send appropriate supplies and instructions for the field personnel to follow.
ETS-8-154.1 Page 8 of 17 Determination of Perfluorinated Compounds in Water Using SPE and LCIMS.
67 of 109

Exygen Protocol PO002561 Interim Report #12 3M Project E06-0549
Analysis of Woodbury Waste Site Water Samples: Mid-April and Early June 2007
Seal and gently invert the FSCS to mix. Store and ship the FSCS using the same procedures as used for the samples
Provide information on sample collection, preservation, shipment and storage. List applicable holding times. Include sample stability and extract storage requirements. Reference the method used for sample preparation, if applicable.
8.4 Field Matrix Spike (FMS) A Field Matrix Spike (FMS) must be prepared for each sampling location. One unspiked sample from the same location must accompany the FMS to determine endogenous levels in the sample. The samples should be clearly identifiable as being from the same location.
Samples may either be spiked in the field or in the laboratory prior to shipment. The method employed should be consistent throughout the study. If the samples are to be spiked in the field, be sure to send appropriate supplies and instructions for the field personnel to follow.
9 Quality Control and Data Quality Objectives
Analytical results of the FB, FMS, FD, and FSCS should be evaluated at the conclusion of the study to help interpret the quality of sample data. Analytical results for these controVduplicate samples must be reported with the sample data.
9.1 Solvent Blanks Solvent blanks are analyzed with each sample set to determine contamination or carryover. Aliquots of methanol represent the solvent used for the standard curve and the sample extraction. Solvent blanks should have area counts that are less than 50% of the area count of the lowest calibration standard.
Solvent blanks should be analyzed prior to and following each calibration curve, each set of system suitability samples, and after no more than 10 unknown sample extracts. If instrument carryover is a problem consecutive solvent blanks may be necessary. In this case the area counts of the solvent blanks should return to 4 0 % of the lowest calibration standard prior to the injection of further standards or samples.
9.2 Method Blanks A method blank consists of an aliquot of ASTM Type I water, equal in volume to the samples, and extracted in the same manner as the samples. At least two method blanks should be prepared and analyzed each day that extractions are performed for a particular study or project. When analyzed the area counts of these samples must be less than 50% of the area count of the lowest calibration standard.
9.3 Sample Replicates All samples, including field spikes, trip blanks, etc., should be extracted at least in duplicate, and in triplicate if difficulties were encountered in the sampling and/or holding conditions of the samples. The relative percent difference (RPD) of duplicate samples or relative standard deviation (RSD) should be less than 15% for the precision of sample preparation and analysis to be considered in control.
9.4 Matrix Spike Matrix spikes are prepared for each sample type and analyzed to determine the matrix effect on the recovery efficiency. Matrix spike recoveries should fall within f 25% of expected values. If the matrix spikes fail, evaluate the lab control spikes. If the LCS are within acceptance crieria there may be matrix issues in the samples. Discuss these in the final report.
ETS-8-154.1 Page 9 of 17 Determination of Perfluorinated Compounds in Water Using SPE and LCIMS.
68 of 109

Exygen Protocol PO002561 Interim Report #12 3M Project E06-0549
Analysis of Woodbury Waste Site Water Samples: Mid-April and Early June 2007
Matrix spike duplicates are prepared periodically to measure the precision associated with the analysis.
Analyze a matrix spike and matrix spike duplicate (if prepared) in the same run as the original sample.
Matrix spike and matrix spike duplicate concentrations should fall in the mid-range of the initial calibration curve or should be prepared at 1.5-5 times the endogenous concentration of the analyte. Spike concentrations should fall in the low-range of the initial calibration curve if extremely low-levels are expected. Generally two or more levels are prepared, one in the low range of the curve and one in the mid-range. This avoids the need to pre-screen unknown samples prior to preparation.
9.5 Laboratory Control Spike Lab control spikes are prepared for each study to ensure recovery of the target analytes. These should be prepared at a minimum of 2 levels and in duplicate or triplicate. Recovery of these samples should be within * 25% of expected values, and the RPD (or RSD) be S 15%. If recoveries fall outside these limits the samples should be addressed in the final report.
10 Calibration and Standardization
10.1 Instrument Setup Note: In this example, a MicroMass UltimaTM Liquid Chromatography Tandem Mass Spectrometer (LC/MS/MS) is used. Other brands of LC/MS/MSs as well as single quadrupole mass spectrometers (LC/MS) may be used as long as the method criteria are met. Brand names, suppliers, part numbers, and models are for illustrative purposes only. Equivalent performance may be achieved using apparatus and materials other than those specified here, but demonstration of equivalent performance that meets the requirements of this method is the responsibility of the laboratory. The operator must optimize and document the equipment and settings used.
Establish the LC/MS/MS system and operating conditions equivalent to the following:
Mass Spec: Micromass Ultima (Micromass)
Interface: Electrospray (Micromass)
Mode: Electrospray Negative, Multiple Response Monitoring (MRM)
Harvard infusion pump (Harvard Instruments), for tuning
Computer: COMPAQ Professional Workstation AP200
Software: Windows NT, MassLynx 3.3
HPLC: Hewlett Packard (HP) Series 1100
HP Quaternary Pump
HP Vacuum Degasser
HP Autosampler
HP Column Oven
Note: A 4 x 10mm Hypercarb dropin guard cartridge (Keystone, part# 844017400) may be attached on-line after the purge valve and before the sample injector port to trap any residue contaminants that may be in the mobile phase and/or HPLC system.
HPLC Column: Genesis C8 (Jones Chromatography), 2.lmm x 50mm, 4pn
ETS-8-154.1 Page 10 of 17 Determination of Perfluorinated Compounds in Water Using SPE and LCIMS.
69 of 109

Exygen Protocol PO002561 Interim Report #I2 3M Project E06-0549
Analysis of Woodbury Waste Site Water Samples: Mid-April and Early June 2007
Column Temperature: 35°C
Injection Volume: 15pL
Mobile Phase (A): 2mM Ammonium Acetate in ASTM Type I water (See 7.3.1)
Mobile Phase (B): Methanol
I 0.0 60 40 0.3
0.4 60 40 0.3 1 .o 10 90 0.3 7.0 10 90 0.3 7.5 0 100 0.3 9.0 0 100 0.4 9.5 60 40 0.4 13.5 60 40 0.4
I 14.0 60 40 0.3 Note: Other HPLC gradients may be used as long as the me bod criteria are
met.
It may be necessary to adjust the HPLC gradient in order to optimize instrument performance. Columns with different dimensions (e.g. 2.lmm x 30mm) and columns from different manufacturers (Keystone Betasil C18 etc.) may be used.
PFOA 41 3 169 5.0 PFOS 499 99 5.2 FOSA 498 78 5.8
Other product ions may be chosen at the discretion of the analyst, although m/z 99 is suggested for PFOS. Use of the suggested primary ion is recommended. Retention times may vary slightly, on a day-to-day basis, depending on the batch of mobile phase etc. Drift in retention times is acceptable within an analytical run, as long as the drift continues through the entire analysis and the standards are interspersed throughout the analytical run.
10.2 Tune File Parameters The following values are provided as an example. Actual values may vary from instrument to instrument. Also, these values may be changed from time to time in order to optimize for greatest sensitivity.
ETS-8-154.1 Page 11 of 17 Determination of Perfluorinated Compounds in Water Using SPE and LCIMS.
70 of 109

Exygen Protocol PO002561 Interim Report #12 3M Project E06-0549
Analysis of Woodbury Waste Site Water Samples: Mid-April and Early June 2007
Capillary 2.6-3.5 kV Hexapole 1 0.5V
Hexapole 2 0.8V
Desolvation Temp. 250400°C
Aperture 1 0.2v
Source Block Temp. 100-1 50°C
LM Res 1 12.5-15.OV HM Res 1 12.5-15.OV IEnergy 1 0.7V Entrance -2v
Exit 1 v LM Res 2 11 .ov HM Res 2 11.ov IEnergy 2 1 .ov Multiplier 650V
Cone Gas 150Llhr Desolvation 700Uhr
1 Gas Cell 3.0e-3mbar I
ETS-8-154.1 Page 12 of 17 Determination of Perfluorinated Compounds in Water Using SPE and LCIMS.
71 of 109

Exygen Protocol PO002561 Interim Report #12 3M Project E06-0549
Analysis of Woodbury Waste Site Water Samples: Mid-April and Early June 2007
10.3 Calibration Curve Analyze the standard curves prior to each set of samples. The validated method specifies that the standard curve should be plotted using a linear fit, wei hted I /x or unweighted. However, the standard curve may also be plotted by quadratic fit (y = a 9 + bx + c), weighted l /x or unweighted, using suitable software. The calibration curves may include but should not be forced through zero. The mathematical method used to calculate the calibration curve should be applied consistently throughout a study. Any change should be thoroughly documented in the raw data.
If the calibration curve does not meet acceptance criteria perform routine maintenance or prepare a new standard curve (if necessary) and reanalyze.
For purposes of accuracy when quantitating low levels of analyte, it may be necessary to use the low end of the calibration curve rather than the full range. For example, when attempting to quantitate approximately 50 pg/mL of analyte, generate a calibration curve consisting of the standards from 25 pgImL to 1000 pgImL rather than the full range of the curve (25 pgImL to 25000 pg/mL). This will reduce inaccuracy attributed to linear regression weighting of high concentration standards.
High and/or low points may be excluded from the calibration curves to provide a better fit over the linear range appropriate to the data or because they did not meet the pre-determined acceptance criteria. Low-level curve points should also be excluded if their area counts are not at least twice that of the method and/or solvent blanks. Any curve point may be rejected due to a bad injection or failing to meet accuracy requirements of k 25% (and k 30% for the LLOQ). Justification for exclusion of calibration curve points will be noted in the raw data. A minimum of 6 points will be used to construct the calibration curve.
10.4 Continuing Calibration Verification (CCV) Continuing calibration verifications (CCV) are analyzed to verify the accuracy of the calibration curve. Analyze a mid-range calibration standard, one of the same standards used to construct the calibration curve, at a minimum after every tenth sample, not including solvent blanks, with a minimum of one per sample set. Calibration verification injections must be within S5% to be considered acceptable. The calibration curve and the last passing CCV will then bracket acceptable samples. Multiple CCV levels may be used.
10.5 System Suitability A minimum of three system suitability samples will be injected at the beginning and end of each analytical run. Typically these samples are run prior to the calibration curve. The system suitability injections must have area counts with an RSD of 35% and a retention time RSD of 12% when evaluated independently.
11 Procedures
11.1 Extraction Scheme Allow samples to equilibrate to room temperature. Thoroughly mix samples by gently inverting the sample bottle.
Measure 40mL of sample into 50mL polypropylene centrifuge tubes (Spike the Matrix spikes as required*, replace lid and mix well).
Note: * Samples may need to be prescreened to determine an appropriate matrix spike level (typically 50-150% of sample concentration). Alternatively the samples could be spiked at more than one level, allowing for the inappropriate spike level to be eliminated.
ETS-8-154.1 Page 13 of 17 Determination of Perfluorinated Compounds in Water Using SPE and LCIMS.
72 of 109

Exygen Protocol PO002561 Interim Report #12 3M Project E06-0549
Analysis of Woodbuty Waste Site Water Samples: Mid-April and Early June 2007
Condition the C18 SPE cartridges (lg, 6mL) by passing approximately 10mL methanol followed by approximately 50mL ASTM Type I water (flow rate approximately 2 dropkec). Do not let column run dry.
Note: For the following steps, maintain a -Idrop/sec flow rate. Do not allow the column to run dry at any time.
Load the analytical sample onto the C18 SPE cartridge. Discard eluate.
Ten mL of the 40% methanol in water wash mixture is passed through the C18 SPE cartridge to rinse away potential interferences and then discarded. This step must be omitted if perfluorinated compounds with chain lengths less than C8 are targeted since these will be lost during this wash step.
Elute with exactly 5mL of 100% methanol. Collect eluate into graduated 15mL polypropylene centrifuge tubes. This is the target elution fraction (final volume approximately 4.5 mL as not all of the solvent will leave the SPE column. This will not affect the calculations in any way since the curve is also extracted).
Analyze a portion of the target elution fraction eluent using negative electrospray HPLCIMSIMS or HPLCIMS.
Note: Samples are concentrated by a factor of eight during the extraction; Initial Vol = 40mL 3 Final Vol. = 5mL.
Samples are stable at room temperature for at least 24 hours. Analytical samples may be stored in a refrigerator at 4"KZ'C until analysis.
Standardization of C18 SPE columns-If poor recoveries are observed, it may be necessary to standardize the C18 SPE columns in the following manner before analyzing samples.
Use a standard with an analyte concentration between 1000 and 4000 pg/mL. Repeat the extraction scheme from the beginning up through the eluting with -5mL 100% methanol.
After the eluting with -5mL 100% methanol step, collect an additional post-elution fraction by eluting with an additional 5mL of 100% methanol.
Analyze both fractions by HPLC/MS/MS or HPLC/MS. If the target fraction contains a minimum of 85% of the respective analytes, it may be considered acceptable.
If the wash contains significant standard (>15%), either the wash volume or percentage of MeOH should be decreased.
If the post-elution fraction contains significant standard (>I 5%), the target elution volume should be increased.
11.2 Sample Analysis Set up analysis sample queue.
Inject the same volume (between 5-25pL) of each standard, analytical sample and blank into the instrument.
All samples with a concentration > ULOQ must be diluted and reanalyzed. If dilution of the final extract fails to produce acceptable results (e.g. poor MS recoveries) dilute the original sample and re-extract.
12 Data Analvsis and Calculations
Calculate the analytical sample (extract) concentration from the standard curve using the following equation:
ETS-8-154.1 Page 14 of 17 Determination of Perfluorinated Compounds in Water Using SPE and LC/MS.
73 of 109

Exygen Protocol PO002561 Interim Report #12 3M Project E06-0549
Analysis of Woodbury Waste Site Water Samples: Mid-April and Early June 2007
Extract Concentration, pg/mL = {Peak area -intercept)
(slope)
Calculate the percent recovery of the FSCS using the following equation:
FSCS % rec. = {FSCS conc.. pq/mL) x 100
(Conc. added, pg/mL)
Calculate the percent recovery of the MSs using the following equation:
MS % rec. = (MS conc., pg/mL - Sample conc., pg/mL) x 100 (Conc. added, pg/mL)
13 Method Performance
Note: Any method performance parameters that are not achieved must be considered in the evaluation of the data. Nonconformance to any specified parameters must be described and discussed in any reporting of the data.
If criteria listed in this method performance section are not met, maintenance may be performed on the system and samples reanalyzed, or other actions taken as determined by the analyst. Document all actions in the raw data.
If data are to be reported when performance criteria have not been met, the data must be footnoted on tables and discussed in the text of the report.
13.1 System Suitability A minimum of three system suitability samples will be injected at the beginning and end of each analytical run. Typically these samples are run prior to the calibration curve. The system suitability injections must have area counts with an RSD of 55% and a retention time RSD of 52% when evaluated independently.
13.2 Quantitation Calibration Curve: The coefficient of determination (8) value for the calibration curve must be greater than or equal to 0.990. Each point in the curve must be within 53% of the theoretical concentration with the exception of the LLOQ, which may be within f30%. Demonstration of Specificity: Specificity is demonstrated by chromatographic retention time (within 3% of standard) and the mass spectral response of unique ions.
13.3 Sensitivity Solvent Blanks and Method Blanks: Solvent and method blank area counts must be < 50% that of the lowest standard used in the calibration curve.
Limits of Quantitation (LOQ): The lower LOQ (LLOQ) is the lowest non-zero active standard in the calibration curve; the peak area of the LLOQ must be at least 2X that of the extraction blank. By definition, the measured value of the LLOQ must be within 30% of the theoretical value.
ETS-8-154.1 Page 15 of 17 Determination of Perfluorinated Compounds in Water Using SPE and LCIMS.
74 of 109

Exygen Protocol PO002561 Interim Report #12 3M Project E06-0549
Analysis of Woodbury Waste Site Water Samples: Mid-April and Early June 2007
13.4 Accuracy
CCV Performance: Calibration verification injections must be within Q5% to be considered acceptable. The calibration curve and the last passing CCV will then bracket acceptable samples. Multiple CCV levels may be used.
Matrix Spikes: Matrix spike percent recoveries must be within k 25% of the spiked concentration. If matrix effects are suspected, evaluate the LCS results to determine if a matrix effects are present and if the method is in control based on compliant LCS results. Discuss all results in the analytical report.
13.5 Precision Reproducibility: Reproducibility of the method is defined by the results of duplicate or triplicate analysis of samples. A RPD or RSD of 5 15% will be considered acceptable.
System Suitability: The system suitability injections must have area counts with an RSD of 55% and a retention time RSD of 52% when evaluated independently.
14 Pollution Prevention and Waste Management
Sample extract waste and flammable solvent is discarded in high BTU containers, and glass pipette waste is discarded in broken glass containers located in the laboratory.
15 Records
Each data package generated for a study must have the following information included: study or project number, acquisition method, integration method, sample name, extraction date, dilution factor (if applicable), and analyst.
Print the tune page, sample list, and acquisition method to include in the appropriate study folder. Copy these pages and tape into the instrument run log.
Plot the calibration curves as described in this method, then print these graphs and store in the study folder.
Print data integration summary, integration method, and chromatograms and store in the study folder.
Summarize data using suitable software and store in the study folder.
16 Attachments
None.
17 References
“Method of Analysis for the Determination of Peffluorooctane sulfonate (PFOS), Peffluorooctane sulfonylamide (PFOSA), and Perfluorooctanoate (POAA) in Water, E. Wickremesinhe and J. Flaherty, Study Number 023-002, Centre Analytical Laboratories, Inc., State College, Pennsylvania, January 2000.
Validation report for the “Method of Analysis for the Determination of Perfluorooctane sulfonate (PFOS), Peffluorooctane sulfonylamide (PFOSA), and Perfluorooctanoate (POAA) in Water”, E. Wickremesinhe and J. Flaherty, Study Number 023-002, Centre Analytical Laboratories, Inc., State College, Pennsylvania.
ETS-8-154.1 Page 16 of 17 Determination of Perfluorinated Compounds in Water Using SPE and LCIMS.
75 of 109

Exygen Protocol PO002561 Interim Repolt #I2 3M Project E06-0549
Analysis of Woodbury Waste Site Water Samples: Mid-April and Early June 2007
18 Affected Documents
None.
19 Revisions
Revision Revision Number Revision Number Date
1 Updated to the new format. Changed Title. 7 Section I : States the validation of 3 analytes, removes reference to EPA document that's no longer applicable. Section 2: Provided for the extraction of more than the 3 validated analytes, allows the use of a LC/MS system, not only the LS/MS/MS previously mentioned. Section 3: Revised definitions for field matrix spike, field control spike, LLOQ, method blank, and MDL. Section 5: Reworded the interferences, added recommendation to use disposable pipettes. Section 6: Recategorized and pared down. Section 7: Changed storage time to 6 months. Added more calibration points to the table. Section 8:Added statement addressing labeling requirements and spiking procedures. Expanded section 8.8. Section 9: New Section Section 10: Changed some of the parameters in the tables. Allowed for use of different instrumentation. Added information from section 12 of previous version, extensively revised. Section 1 I (section 9 in previous version): Clarification of wash step, stated exact volume of eluate is 5 mL, revised standardization process, removed requirement to use LC/MS/MS. Section 12 (section 13 in previous version: no changes Section 13 (section 14 in previous version): Extensively rewritten. Section 14 (section 15 in previous version): no changes Section 15 (section 16 in previous version): Minor changes to recording requirements. Section 16 (section 17 in previous version): Removed attachment. Section 17 (section 18 in previous version): Removed reference to EPA document that no longer applied to this SOP. Section 18: New section.
ETS-8-154.1 Page 17 of 17 Determination of Perfluorinated Compounds in Water Using SPE and LCIMS.
76 of 109

Exygen Protocol PO002561 Interim Report #12 3M Project E06-0549
Analysis of Woodbuly Waste Site Water Samples: Mid-April and Early June 2007
Method
Method of Analysis for the Determination of Perfluorinated Compounds in Water by LC/MS/MS; Direct Injection Analysis
Method Number: ETS-8-044.0
Adoption Date: Upon Signing
Effective Date: 0 y/g lo 7
Approved By:
-- - ..e
William K. Reagen, Laboratory Manager Date
ETS-8-044.0 Page 1 of 11 Method of Analysis for the Determination of Perfluorinated Compounds in Water by LC/MS/MS; DF$?;/,og
Injection Analysis
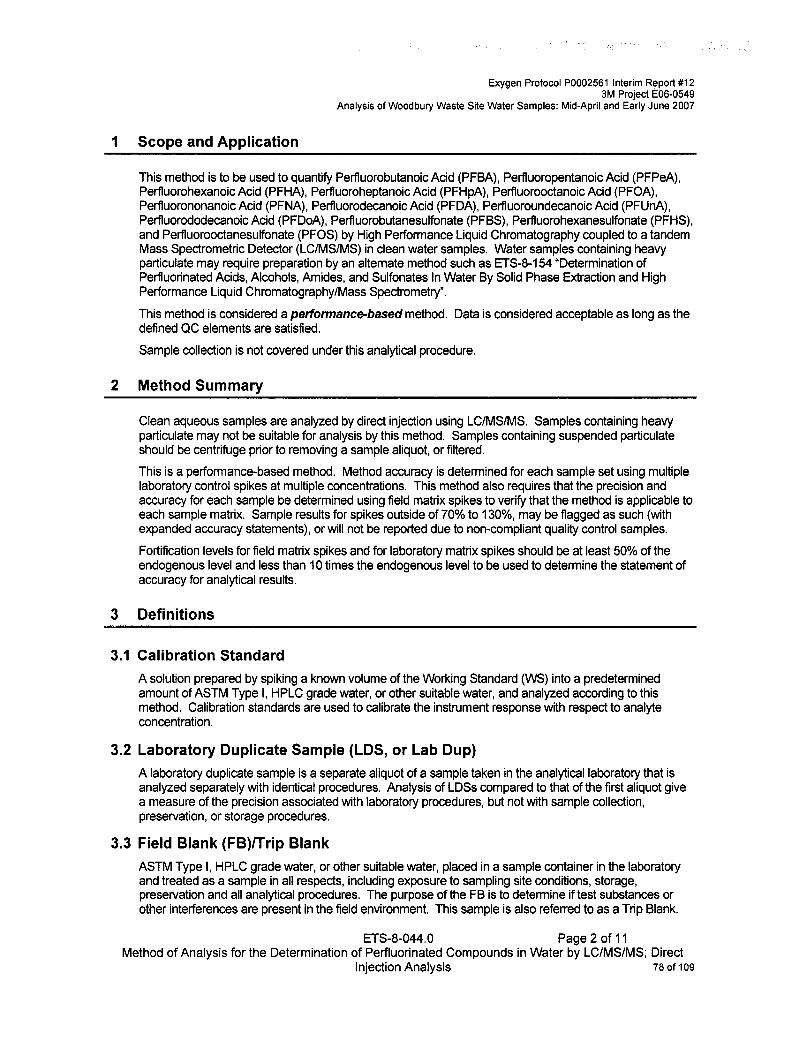
Exygen Protocol PO002561 Interim Report #12 3M Project E06-0549
Analysis of Woodbury Waste Site Water Samples: Mid-April and Early June 2007
1 Scope and Application
2
This method is to be used to quantify Perfluorobutanoic Acid (PFBA), Perfluoropentanoic Acid (PFPeA), Pertluorohexanoic Acid (PFHA), Perfluoroheptanoic Acid (PFHpA), Perfluorooctanoic Acid (PFOA), Perfluorononanoic Acid (PFNA), Perfluorodecanoic Acid (PFDA), Perfluoroundecanoic Acid (PFUnA), Perfluorododecanoic Acid (PFDoA), Perfluorobutanesulfonate (PFBS), Perfluorohexanesulfonate (PFHS), and Perfluorooctanesulfonate (PFOS) by High Performance Liquid Chromatography coupled to a tandem Mass Spectrometric Detector (LC/MS/MS) in clean water samples. Water samples containing heavy particulate may require preparation by an alternate method such as ETS-8-154 “Determination of Perfluorinated Acids, Alcohols, Amides, and Sulfonates In Water By Solid Phase Extraction and High Performance Liquid ChromatographyIMass Spectrometry”.
This method is considered a performancebased method. Data is considered acceptable as long as the defined QC elements are satisfied.
Sample collection is not covered under this analytical procedure.
Method Summary
3
Clean aqueous samples are analyzed by direct injection using LCIMSIMS. Samples containing heavy particulate may not be suitable for analysis by this method. Samples containing suspended particulate should be centrifuge prior to removing a sample aliquot, or filtered.
This is a performance-based method. Method accuracy is determined for each sample set using multiple laboratory control spikes at multiple concentrations. This method also requires that the precision and accuracy for each sample be determined using field matrix spikes to verify that the method is applicable to each sample matrix. Sample results for spikes outside of 70% to 130%, may be flagged as such (with expanded accuracy statements), or will not be reported due to non-compliant quality control samples.
Fortification levels for field matrix spikes and for laboratory matrix spikes should be at least 50% of the endogenous level and less than 10 times the endogenous level to be used to determine the statement of accuracy for analytical results.
Definitions
3.1 Calibration Standard A solution prepared by spiking a known volume of the Working Standard (WS) into a predetermined amount of ASTM Type I, HPLC grade water, or other suitable water, and analyzed according to this method. Calibration standards are used to calibrate the instrument response with respect to analyte concentration.
3.2 Laboratory Duplicate Sample (LDS, or Lab Dup) A laboratory duplicate sample is a separate aliquot of a sample taken in the analytical laboratory that is analyzed separately with identical procedures. Analysis of LDSs compared to that of the first aliquot give a measure of the precision associated with laboratory procedures, but not with sample collection, preservation, or storage procedures.
3.3 Field Blank (FB)/Trip Blank ASTM Type I, HPLC grade water, or other suitable water, placed in a sample container in the laboratory and treated as a sample in all respects, including exposure to sampling site conditions, storage, preservation and all analytical procedures. The purpose of the FB is to determine if test substances or other interferences are present in the field environment. This sample is also referred to as a Trip Blank.
ETS-8-044.0 Page 2 of 11 Method of Analysis for the Determination of Perfluorinated Compounds in Water by LCIMSIMS; Direct
Injection Analysis 78 of 109

Exygen Protocol PO002561 Interim Report #12 3M Project E06-0549
Analysis of Woodbury Waste Site Water Samples: Mid-April and Early June 2007
3.4 Field Duplicate Sample (FDS, Field Dup) A sample collected in duplicate at the same time from the same location as the sample. The FDS is handled under identical circumstances and treated exactly the same throughout field and laboratory procedures. Analysis of the FDS compared to that of the first sample gives a measure of the precision associated with sample collection, preservation and storage, as well as with laboratory procedures.
3.5 Field Matrix Spike (FMS) A sample to which known quantities of the target analytes are added to the sample bottle in the laboratory before the bottles are sent to the field for collection of aqueous samples. A known, specific volume of sample must be added to the sample container without rinsing. This may be accomplished by making a “fill to this level” line on the outside of the sample container. The FMS should be spiked between approximately 50% and 10 times the expected analyte concentration in the sample. If the expected range of analyte concentrations is unknown, multiple spikes at varying levels may be prepared to increase the likelihood that a spike at an appropriate level is made. The FMS is analyzed to ascertain if any matrix effects, interferences, or stability issues may complicate the interpretation of the sample analysis.
3.6 Trip Blank Spike (Field Spike Control Sample, FSCS) An aliquot of ASTM Type I , HPLC grade water, or other suitable water, to which known quantities of the target analytes are added in the laboratory prior to the shipment of the collection bottles. The FSCS is extracted and analyzed exactly like a study sample to help determine if the method is in control and whether a loss of analyte could be attributed to holding time, sample storage and/or shipment issues. A low and high FSCS are appropriate when expected sample concentrations are not known or may vary. At least one separate, un-spiked sample must be taken at the same time and place as each FMS.
3.7 Laboratory Control Sample (LCS) An aliquot of control matrix to which known quantities of the target analytes are added in the laboratory at the time of sample extraction. At least two levels are included, one generally at the low end of the calibration curve and one near the mid to upper range of the curve. The LCSs are extracted and analyzed exactly like a laboratory sample to determine whether the method is in control. LCSs should be prepared each day samples are extracted.
3.8 Laboratory Matrix Spike (LMS) A laboratory matrix spike is an aliquot of a sample to which known quantities of target analytes are added in the laboratory. The LMS is analyzed exactly like a laboratory sample to determine whether the sample matrix contributes bias to the analytical results. The endogenous concentrations of the analytes in the sample matrix must be determined in a separate aliquot and the measured values in the LMS corrected for these concentrations. LMSs are optional for analysis of aqueous samples.
3.9 Laboratory Sample
3.10 Limit of Quantitation (LOQ)
A portion or aliquot of a sample received from the field for testing.
The lower limit of quantitation (LLOQ) for a dataset is the lowest concentration that can be reliably quantitated within the specified limits of precision and accuracy during routine operating conditions. To simplify data reporting, the LLOQ is generally selected as the lowest non-zero standard in the calibration curve that meets method criteria. Sample LLOQs are matrix-dependent.
The upper limit of quantitation (ULOQ) for a dataset is the highest concentration that can be reliably quantitated within the specified limits of precision and accuracy during routine operating conditions. The highest standard in the calibration curve that meets method criteria is defined as the ULOQ.
ETS-8-044.0 Page 3 of 11 Method of Analysis for the Determination of Perfluorinated Compounds in Water by LC/MS/MS; Direct
Injection Analysis 79 of 109

Exygen Protocol PO002561 Interim Report #12 3M Project E06-0549
Analysis of Woodbury Waste Site Water Samples: Mid-April and Early June 2007
3.11 Method Blank An aliquot of control matrix that is treated exactly like a laboratory sample including exposure to all glassware, equipment, solvents, and reagents that are used with other laboratory samples. The method blank is used to determine if test substances or other interferences are present in the laboratory environment, the reagents, or the apparatus.
3.12 Sample A sample is an aliquot removed from a larger quantity of material intended to represent the original source material.
3.1 3 Stock Standard Solution (SSS) A concentrated solution of a single-analyte prepared in the laboratory with an assayed reference compound.
3.14 Surrogate A compound similar in chemical composition and behavior to the target analyte(s), but is not normally found in the sample(s). A surrogate compound is typically a target analyte with at least one atom containing an isotopically-labeled substitution. If used, surrogate(s) are added to all samples and quality control samples. Surrogate@) are added to quantitatively evaluate the entire analytical procedure including sample collection, preparation, and analysis. Inclusion of a surrogate analyte is an optional quality control measure and is NOT required.
3.15 Working Standard (WS) A solution of several analytes prepared in the laboratory from SSSs and diluted as needed to prepare calibration standards and other required analyte solutions.
4 Warnings and Cautions
4.1 Health and Safety The acute and chronic toxicity of the standards for this method have not been precisely determined; however, each should be treated as a potential health hazard. The analyst should wear gloves, a lab coat, and safety glasses to prevent exposure to chemicals that might be present.
The laboratory is responsible for maintaining a safe work environment and a current awareness of local regulations regarding the handling of the chemicals used in this method. A reference file of material safety data sheets (MSDS) should be available to all personnel involved in these analyses.
4.2 Cautions The analyst must be familiar with the laboratory equipment and potential hazards including, but not limited to, the use of solvents, pressurized gas and solvent lines, high voltage, and vacuum systems. Refer to the appropriate equipment procedure or operator manual for additional information and cautions.
5 Interferences
During sample preparation and analysis, major potential contaminant sources are reagents and glassware. All materials used in the analyses shall be demonstrated to be free from interferences under conditions of analysis by running method blanks.
ETS-8-044.0 Page 4 of 11 Method of Analysis for the Determination of Perfluorinated Compounds in Water by LCIMSIMS; Direct
Injection Analysis 80 of 109

Exygen Protocol PO002561 Interim Report #I2 3M Project E06-0549
Analysis of Woodbuty Waste Site Water Samples: Mid-April and Early June 2007
Parts and supplies that contain Teflon@ should be avoided or minimized due to the possibility of interference and/or contamination. These may include, but are not limited to: wash bottles, Teflon@ lined caps, autovial caps, HPLC parts, etc.
The use of disposable micropipettes or pipettes to aliquot standard solutions is recommended to make calibration standards and matrix spikes.
6 Instrumentation, Supplies, and Equipment
6.1 Instrumentation and Equipment A high performance liquid chromatograph capable of pumping up to two solvents and equipped with a variable volume injector capable of injecting 5-100 pL connected to a tandem Mass Spectrometer (LC/MS/MS). I
Analytical balance capable of reading to 0.0001 g
A device to collect raw data for peak integration and quantitation
15-mL and 50-mL disposable polypropylene centrifuge tubes.
Gas tight syringes, 25pL, 50pL, IOOpL, 250pL, 500pL, 1OOOpL.
1 mL plastic HPLC autovial.
Disposable pipettes, polypropylene or glass as appropriate
Centrifuge capable of spinning 15-mL and 50-mL polypropylene tubes at 3000 rpm.
6.2 Chromatographic System Guard Column: Prism RP, 4.6 mm x 50 mm, 5 pm
Analytical Column: Betasil C18,4.6 mm x 100 mm, 5 pm
Temperature: 10°C
Mobile Phase (A): 2 mM Ammonium Acetate in Water
Mobile Phase (B): Methanol
Gradient Program:
Injection Volume: 100 pL,
Quantitation: Peak Area - quadratic curve fit, I l x weighted.
Run Time: - 17 minutes.
The previous information is intended as a guide; alternate conditions and equipment may be used provided that data quality objectives are met.
ETS-8-044.0 Page 5 of 11 Method of Analysis for the Determination of Perfluorinated Compounds in Water by LCIMSIMS; Direct
Injection Analysis 81 of 109

Exygen Protocol PO002561 Interim Report #12 3M Project E06-0549
Analysis of Woodbuty Waste Site Water Samples: Mid-April and Early June 2007
6.3 MSlMS System
6.3.1 Mode: Eledrospray Negative ion, MRM mode, monitoring the following transitions:
Multiple transitions for monitoring the analytes is an option, as summing multiple transitions may pi quantitation of isomers that more closely matches NMR data and may have the added benefit of increased sensitivity. The use of one daughter ion is acceptable if method sensitivity is achieved, provided that retention time criteria are met to assure adequate specificity.
-ovide
The previous infonation is intended as a guide, alternate instruments and equipment may be used.
7 Reagents and Standards
7.1
7.2
Chemicals Water - Milli-Q, HPLC grade, or other suitably appropriate sources
Methanol - HPLC grade
Ammonium Acetate - A.C.S. Reagent Grade
Standards Perfluorobutanoic Acid (PFBA - C4 acid); Oakwood Products, Inc
Perfluoropentanoic Acid (PFPeA - C5 acid, also known as NFPA, nonafluoropentanoic acid); Alfa Aesar
Perfluorohexanoic Acid (PFHA - C6 acid); Oakwood Products, Inc
Perfluoroheptanoic Acid (PFHpA - C7 acid, also known as TDHA, tridecafluoroheptanoic acid); Oakwood
Perfluorooctanoic Acid (PFOA - C8 acid); 3M
Perfluorononanoic Acid (PFNA - C9 acid); Oakwood Products, Inc
Perfluorodecanoic Acid (PFDA - C10 acid); Oakwood Products, Inc
Perfluoroundecanoic Acid (PFUnA - C11 acid); Oakwood Products, Inc
Perfluorododecanoic Acid (PFDoA - C12 acid); Oakwood Products, Inc
Perfluorobutanesulfonate (PFBS - C4 sulfonate); 3M
Perfluorohexanesulfonate (PFHS - C6 sulfonate); 3M
Perfluorooctanesulfonate (PFOS - C8 sulfonate); 3M
Products, Inc
ETS-8-044.0 Paae 6 of 11 ~~~
Method of Analysis for the Determination of Perfluorinated Compounds in Water by LC'jNISIMS; Direct Injection Analysis 82 of 109

Exygen Protocol PO002561 Interim Report #12 3M Project E06-0549
Analysis of Woodbury Waste Site Water Samples: Mid-April and Early June 2007
The previous information is intended as a guide. Reagents and standards from alternate sources may be used.
7.3 Reagent Preparation 2 mM Ammonium acetate solution (Analysis)-Weigh 0.3 g of Ammonium acetate and dissolve in 2.0 L of reagent water.
Note: Alternative volumes may be prepared as long as the ratios of the solvent to solute ratios are maintained.
7.4 Stock Standard Solution (SSS) and Working Standard Solution Preparation The following standard preparation procedure serves as an example. Weighed amounts and final volumes may be changed to suit the needs of a particular study. For example, pL volumes may be spiked into volumetric flasks when diluting stock solutions to appropriate levels.
100 VglmL target analyte SSSs-Weigh out 10 mg of analytical standard (corrected forpercent salt and purity) and dilute to 1 OOmL with methanol or other suitable solvent, in a 100mL volumetric flask. Transfer to a 125mL LDPE bottle or other suitable container. Prepare a separate solution for each analyte. Expiration dates and storage conditions of stock solutions should be assigned in accordance with laboratory standard operating procedure. An example of purity and salt correction is given below for PFOS.
molecular weight of anion moclecular weight of salt
salt correction factor =
499 538
PFOS (Kf)salt correction factor = - = 0.9275
10 mg C8FI7SOjKt with purity 90% = 8.35mg C8Fl7S03 (1 0 mg*0.90*0.9275=8.35 mg)
5 VglmL (5000 nglmL) mixed working standard-Add 0.5mL each of the 1 OOpg/mL SSSs to a 1 OmL volumetric flask and bring up to volume with solvent.
250 nglmL mixed working standard-Add 1.25mL of the 5 pg/mL -mixed working standard solution to a 25mL volumetric flask and bring up to volume with solvent.
125 nglmL mixed standard-Add 625pL of the 5 pglmL-mixed working standard solution to a 25mL volumetric flask and bring up to volume with solvent.
Storage Conditions-Store all SSSs and working standards in accordance with laboratory standard operating procedure or in a refrigerator at 4Oi2'C for a maximum period of 6 months from the date of preparation.
ETS-8-044.0 Page 7 of 11 Method of Analysis for the Determination of Perfluorinated Compounds in Water by LC/MS/MS; Direct Injection
Analysis 83 of 109

Exygen Protocol PO002561 Interim Report #12 3M Project E06-0549
Analysis of Woodbury Waste Site Water Samples: Mid-April and Early June 2007
Concentration of WS, ng/mL
7.5 Calibration Standards Using the working standards described above, prepare calibration solutions in ASTM Type I water, HPLC water, or other suitable water, using the following table as a guideline. Note: Volumes of water and working standards may be adjusted to meet the data quality objectives addressed in the general project outline. Calibration levels other than those listed below can be prepared as needed.
Volume of WS, pL
125
125
250
250
250
250
5000
5000
125 r -10 20 50 0.050
30 50 0.075
20 50 0.100
50 50 0.250
100 50 0.500
200 50 1 .oo 25 50 2.50
50 50 5.00
Final Volume of Final Concentration of
other suitable wated or other suitable water
I 125 I 15 I 50 I 0.0375 I
I 5000 I 100 I 50 I 10.0 I
8 Sample Handling
8.1 Water Sample Preparation This method is applicable to clean water samples. Samples containing heavy particulate may not be suitable for analysis by this method. Samples containing suspended particulate should be centrifuge prior to removing a sample aliquot, or filtered.
Thoroughly mix sample before removing an aliquot and placing in a labeled plastic autovial. Plastic is
Dilute sample, if necessary, with ASTM Type I , HPLC water, or other suitable water.
Prepare method QC samples and multiple method blanks and aliquot into labeled plastic autovials.
Prepare at least five method blanks.
preferred over the use of glass autovials, to prevent the possibly of fluorochemical sticking to the glass.
9 Sample Analysis - LClMSlMS
Analyze the standard curve prior to each set of samples. The standard curve may be plotted using a linear fit, weighted l / x or unweighted, or by quadratic fit (y = a? + bx + c), weighted l /x or unweighted, using suitable software. The calibration curves may include but should not be forced through zero. The mathematical method used to calculate the calibration curve should be applied consistently throughout a study. Any change should be thoroughly documented in the raw data.
High and/or low points may be excluded from the calibration curves to provide a better fit over the range appropriate to the data or because they did not meet the predetermined acceptance criteria. Low-level curve points should also be excluded if their area counts are not at least twice that of the method and/or solvent blanks. The coefficient of determination (P) value for the calibration curve must be greater than or equal to 0.990. Each point in the curve must be within Q5% of the theoretical concentration with the exception of the LLOQ, which may
ETS-8-044.0 Page 8 of 11 Method of Analysis for the Determination of Perfluorinated Compounds in Water by LCIMSIMS; Direct Injection
Analysis 84 of 109

Exygen Protocol PO002561 Interim Report #12 3M Project E06-0549
Analysis of Woodbury Waste Site Water Samples: Mid-April and Early June 2007
be within +30%. Justification for exclusion of calibration curve points will be noted in the raw data. A minimum of 6 points will be used to construct the calibration curve.
If the calibration curve does not meet acceptance criteria, perform routine maintenance or prepare a new standard curve (if necessary) and reanalyze.
Continuing calibration verifications (CCV) are analyzed to verify the accuracy of the calibration curve. Analyze a mid-range calibration standard, one of the same standards used to construct the calibration curve, at a minimum after every tenth sample, not including solvent blanks, with a minimum of one per sample set. Calibration verification injections must be within k25% to be considered acceptable. The calibration curve and the last passing CCV will then bracket acceptable samples. Multiple CCV levels may be used.
Samples containing analytes that are quantitated above the concentration of the highest standard in the curve should be further diluted and reanalyzed.
10 Quality Control
10.1 Data Quality Objectives This method and required quality control samples is designed to generate data accurate to &30% with a targeted LOQ of 0.025 ng/mL. Any deviations from the quality control measures spelled out below will be documented in the raw data and footnoted in the final report.
10.2 Method Blanks Method blanks must be prepared with each analysis batch. At least five method blanks must be prepared. Method blanks may be injected multiple times, but no more than 3 injections should be removed from a single method blank. At a minimum, method blanks are analyzed prior to instrument calibration, prior to the analysis of CCV samples, and at the end of the analytical run.
The mean area count for each analyte in the method blanks must be less than 50% of the area count of the LOQ standard. The standard deviation of the area counts of these method blanks should be calculated and reported. If the mean area counts of the method blanks exceed 50% of the LOQ standard, then the LOQ must be raised to the first standard level in the curve that meets criteria, or alternatively, the method blanks must be evaluated statistically to determine outliers, or technical justification to eliminate one or more results should be made.
10.3 Sample Replicates Samples duplicates are collected in the field. The relative percent difference, RPD, should be reported. RPD results greater than 20% will be flagged in the report, but will not be excluded from reporting. The requirement for replicates excludes field blanks.
10.4 Surrogate Spikes
10.5 Lab Control Sample
Surrogate spikes are not required but may be used on project specific requirements.
Triplicate lab control spikes at a minimum of two different concentrations are to be prepared with each preparation batch. Low lab control spikes should be prepared at concentrations in the range of five to ten times higher than the targeted LOQ and high lab control spikes should be prepared at concentrations near the mid-point of the curve. The relative standard deviation of the control spikes evaluated independently at each concentration level must be less than or equal to 20% and the average recovery must be 80-120%. If the above criteria are not met, the entire set of samples should be re-injected or re-prepared as appropriate.
ETS-8-044.0 Page 9 of 11 Method of Analysis for the Determination of Perfluorinated Compounds in Water by LCIMSIMS; Direct Injection
Analysis 85 of 109

Exygen Protocol PO002561 Interim Report #12 3M Project E06-0549
Analysis of Woodbury Waste Site Water Samples: Mid-April and Early June 2007
10.6 Field Matrix Spikes I Lab Matrix Spikes Recoveries of field matrix spikes and laboratory matrix spikes are anticipated to be between 70% and 130% of the fortified levels. Sample results for spikes outside of 70% to 130%, may be flagged as such (with expanded accuracy statements), or will not be reported due to non-compliant quality control samples.
The targeted fortification levels should be at least 50% of the endogenous level and less than 10 times the endogenous level to be used without justification to determine the statement of accuracy for analytical results.
The average of the sample and the field duplicate should be used to calculate the recovery.
11 Data Analysis and Calculations
Use the following equation to calculate the amount of analyte found (in ng/mL, based on peak area) using the standard curve (linear regression parameters) generated by an appropriate sofhware program:
x DF (Peak Area - Intercept)
Slope Analyte found (ng/mL) =
DF = factor by which the final volume was diluted, if necessary,
For samples fortified with known amounts of analyte prior to extraction, use the following equation to calculate the percent recovery.
Recovery = x 100 Total analyte found (ng/mL) - Average analyte found in sample (ng/mL) Analyte added (ng/mL)
12 Method Performance
Any method performance parameters that are not achieved must be considered in the evaluation of the data. Nonconformance to any specified parameters must be described and discussed if the Technical Manager (non- GLP study) or Study Director (GLP study) chooses to report the data.
If criteria listed in this method performance section are not met, maintenance may be performed on the system and samples reanalyzed, or other actions taken as appropriate. Document all actions in the raw data.
If data are to be reported when performance criteria have not been met, the data must be footnoted on tables and discussed in the text of the report.
12.1 System Suitability System Suitability standards are not a required component of this method. If required by protocol or by the technical manager, a minimum of three system suitability samples are injected at the beginning of each analytical run prior to the calibration curve. Typically these samples are at a concentration near the mid level of the calibration curve and are repeated injections from one autosampler vial. The system suitability injections must have area counts with an RSD of S5% and a retention time RSD of 52% to be compliant.
12.2 Quantitation Calibration Curve: The coefficient of determination (?) value for the calibration curve must be greater than or equal to 0.990. Each point in the curve must be within Q5% of the theoretical concentration with the exception of the LLOQ, which may be within +30%. CCV Performance: The calibration standards that are interspersed throughout the analytical sequence are evaluated as continuing calibration verifications in addition to being part of the calibration curve. The accuracy of each curve point must be within 25% of the theoretical value (within 30% for lowest curve point). Samples that are bracketed by CCVs not meeting these criteria must be reanalyzed.
ETS-8-044.0 Page 10 of 11 Method of Analysis for the Determination of Perfluorinated Compounds in Water by LCIMSIMS; Direct Injection
Analysis 86 of 109

Exygen Protocol PO002561 Interim Report #12 3M Project E06-0549
Analysis of Woodbury Waste Site Water Samples: Mid-April and Early June 2007
Demonstration of Specificity: Specificity is demonstrated by chromatographic retention time (within 4% of standard) and the mass spectral response of unique ions.
12.3 Sensitivity The targeted limit of quantitation for all analytes is 0.025 ng/mL. The LOQ for any specific analyte may vary depending on the evaluation of appropriate blanks and the accuracy of the low-level calibration curve points. Refer to Section 10 for additional details.
12.4 Accuracy This method and required quality control samples are designed to generate data that are accurate to +/-30%. Section 10 contains additional information regarding the required accuracy of laboratory control spikes, field matrix spikes and laboratory matrix spikes.
12.5 Precision Samples should be collected in duplicate in the field. The relative percent difference, RPD, should be reported. RPD results greater than 20% will be flagged in the report, but will not be excluded from reporting. The requirement for replicates excludes field blanks or rinse blanks.
Section 10 contains additional information regarding the required precision of laboratory control spikes.
13 Pollution Prevention and Waste Management
Waste generated when performing this method will be disposed of appropriately. The original samples will be archived at the 3M Environmental Laboratory in accordance with internal procedures.
14 Records
Each data package generated for a study must include all supporting information for reconstruction of the data. Information for the data package must include, but is not limited to the following items: study or project number, sample and standard prep sheetshecords, instrument run log (instrument batch records, instrument acquisition method, summary pages), instrument results files, chromatograms, calibration curves, and data calculations.
15 Affected Documents
None.
16 Revisions
Revision Number Summary of Chanses
ETS-8-044.0 Page 11 of 11 Method of Analysis for the Determination of Perfluorinated Compounds in Water by LCIMSIMS; Direct Injection
Analysis 87 of 109

Exygen Protocol PO002561 Interim Report #12 3M Project E06-0549
Analysis of Woodbury Waste Site Water Samples: Mid-April and Early June 2007
ATTACHMENT C: PROTOCOL AMENDMENTS
88 of 109

Exygen & & % h 8 ~ 8 ! @ 6 @ @ 1 2 Analysis of Woodbury Waste Site Water Samples: Mid-April and Early June 2007
34Wieh-
Study Title
“Analysis of Perfluorobutanoic Acid (PFBA), Perfluoropentanoic Acid (PFPeA), Perfluorohexanoic Acid (PFHxA), Perfluoroheptanoic Acid (PFMpA), Perfluorooctanoic Acid
(PFOA), Perfluorononanoic Acid (PFNA), Perfluorodecanoic Acid (PFDA), Perfluoroundecanoic Acid (PFUnA), Perfluorododecanoic Acid (PFDoA), Perfluorobutanesulfonate (PFBS), Perfluorohexanesul fonate (PFMS), and
Perfluorooctanesulfonate (PFOS) in Water, Soil, and Sediment Using LC/MS/MS for the 3M Cottage Grove Monitoring Program Phase 2”.
PROTOCOL AMENDMENT NO. 9
Amendment Date: April 13,2007
Performing Laboratory 3M Environmental, Health, and Safety Operations
3M Environmental Laboratory Building 260-5N-I7
Maplewood, MN 55144-1000
Laboratory Project Identification E06-0549
Page 1 of3 89 of 109

Exygen Protoc&kf~6&%??&%@?i?56f 3M P r o m d H € ? n t 9
Analysis of Woodbury Waste Site Water Samples: Mid-April and Early June 2007
This amendment modifies the following portion of PFOtOCOl:
“Analysis of Perfluorobutanoic Acid (PFBA), Perfluoropentanoic Acid (PFPeA), Perfluorohexanoic Acid (PFEIxA), Perfluoroheptanoic Acid (PFHpA), Perfluoroocranoic Acid
(PFOA), Perfluorononanoic Acid (PFNA), Perfluorodccanoic Acid (PFDA), Perfluoroundecanoic Acid (PFUnA), Perfluorododecanoic Acid (PFDoA), Perfluorobu~ancsulfo~a~~ (PFBS),
Perfluorohexanesulfonate (PFHS), and Perfluorooctanesulfonate (PFOS) in Water, Soil, and Sediment Using LC/MS/MS for the 3M Cottage Grove Monitoring Program Phase 2”.
PROTOCOL READS:
Performine Laboratory: Exygen Research 3058 Research Drive State College, PA 16801 Phone: (814) 272-1039
AMEND TO READ:
Per Forming Laborator ics: Exygen Research 3058 Research Drive State College, PA 16801 Phone: (814) 272-1039
3M Environmental, Health, and Safety Operations 3 M Environmental Laboratory Building 260-5N- 1 7 Maplewood, MN 55144-1000
Reason:
Addition of 3M Environmental Laboratory as a testing facility allows samples to be sent ?o the 3M Environmental Laboratory for analysis. The initial sample analysis is outtincd in two attached General Project Outlines (GPOs). The first GPO is authored by Susan Wolf and is six pages long with the Subject Line “Analysis of fluorochemicals in groundwater for the 3M Cottage Grove Monitoring Program Phase 2; Exygen Study Number PO00256 I”. It is dated April 13, 2007. The GPO authored by Clestun Lange i s six pages with the Subject Line “Analysis of Fiuorochemicais in Soils (Woodbury Disposal Site) for the 3M Cottage Grove Monitoring Program Phase 2; Exygen Study Number P000256I”. It is dated April 13,2007.
Page 2 of 3 90 of 109

Exygen ~ r o t o & ~ ~ t t 1 8 i i W & W 8 5 6 1 3M P r o H M M n t 9
Analysis of Woodbuty Waste Site Water Samples: Mid-April and Early June 2007
Amendment Approval
4/13/0 Robert A. Paschke, Sponsor Representative Date
Cleston C. Lange, Principal Investigator Date
Jaisimha Kesari P.E., DEE, Study Director Bate
Page 3 of 3 91 of 109

Exygen Protocol PO002561 Interim Report #12 3M Project E064549
Analysis of Woodbury Waste Site Water Samples: Mid-April and Early June 2007
Environmental Health & Safety Operations, Environmental Laboratory
cneraf Project Outline
TO Robert A. Paschke, 3M EHS Opns
From: Susan Wolf, 3M EHS Opns; Environmental lab cc: Jaisimha Kesari; Weston Solutions
William Reagen, 3M EHS Opns; Environmental Lab Kent Lindstrom; 3M EHS Opns; Environmental Lab
Date: April 13,2007 Subject: Analysis of fluorochemicals in groundwater for the 3M Cottage Grove Monitoring Program Phase 2; Exygen study Number PO002561
1 General Project Information
Study Director
Contacts
Lab Request Number
Six Qlglt Department Number
Project SchedutelTest Dates
Jaislmha Kesari Weston Solutlons 1400 Weston Way West Chester, PA 19380 61 0-701 -3761 4. K=afl@We&z3&I&wa
Sponsor Reprearentxtlve Robert A. Paschke Manager, 3M Corporate 3M EHS Operations
g w a s c h k e @ ~ , ~ ~ ~ , ; , g ~
3M Laboratory Management Wllliarn Reagen Laboratow Manaaer
42-2E-27 651-778-5200
3M EHS Opns; Environmental Laboratory
wkreaqenbrnmm.com
Plinclpal Analytical Investigator Susan WoH
260-5N-17 651 -739-9739
3M EHS Opns, Environmental Laboratory 260-5N- 17 651 733-9851 m m r n r n corn
E064549
53071 1
Wednesday April 11,2007
92 of 109

Exygen Protocol PO002561 Interim Report #12 3M Project E064549
Analysis of Woodbury Waste Site Water Samples: Mid-April and Early June 2007
Target Analyie Pefluorobutanoic Acid
Perfluoropentanoic Acid
2
On Wednesday April 11,2007, Weston Wutiokts is planning to collect groundwater samples from ten sites in Woodbury, MN. The analysis will be performed according to study protocol: "Analysis of Perfluorobutanoic Acid (PFBA), Perfluoropentanoic Add (PFPeA), Perfluorohexanoic Acid (PFHxA), PerRuomheptanoic Acid (PFHpA), Perfluomctanoic Acid (PFOA) PeRuoronananoic Acid (PFNA), Perfluorodecanoic Add (PFDA), Pefluoroundecanoic Acid (PFUnA), Perfluorododmnoic Acid (PFDoA), Perfluorobutanesuffonate (PFBS), Perftuorohexanesulfonate (PFHS), and Perfluorooda~sulfonate (PFOS) in Water, Soil, and Sediment Using LClMSrrmS for the 3M Cottage Grove Monitoring Program Phase 2". The study has been assigned Exygen Study Protocol Number P0002561. The EHS Operations Environmental Laboratory will analyze the water samples under GLP study E%-0549.
Background Information and Project Objective(s) -1
Acmnym PFBA
PFPeA
3 Project Schedule
Sample collection bottles will be prepared by 3M Environmental Laboratory personnel for sampling on or around April 9,2007.
Perfluorooctanesutfonate
4 Test Parameters
PFOS
The targeted limit of quantitation will be 0.025ng/mL (ppb) for all compounds of interest. Table 1 lists the target analytes for this sampling event:
Table 1. Target Anatytes
I Perfluorohexanoic Add 1 PFHxAorPFH4 I I Perfluoroheptanoic Acid j P F H ~ A or TDHA I
1 PFOA 1 I Perfluorooctanoic Acid
Pertluorononanoic Acid
Psrtluorodecanoic Add
Peffluoroundecanoic Acid
Pertluomdodecanoic Acid PFDoA
I Pemuorobutanesulfonate I PFBS I 1 Pefiuorohexanesulfonate 1 PFHS I
A total of ten sampling sites have been identified. For each sampling location, a total of five sample bottles wit1 be collected (sample, sample duplicate, low-level field matrix spike, mid-level matrix spike, and high-level matrix spike). 'The "fill to here" line on each 500 m t Nalgena bottle will be 450 mL. Table 2 lists the low ievd, mid- level, and high level field matrix spikes for each location. A trip blank consisting of reagent-grade water, a low- level tnp blank spike, mid-level trip blanks spike, and a high-level trip blank spike will be prepared at the 3M Environmental Laboratory and included with the other bottles that will be picked up by Weston Solutions prior to sample collection. A total of 54 sample bottles will be prepared. As the sampling W o n descriptions are not
93 of 109
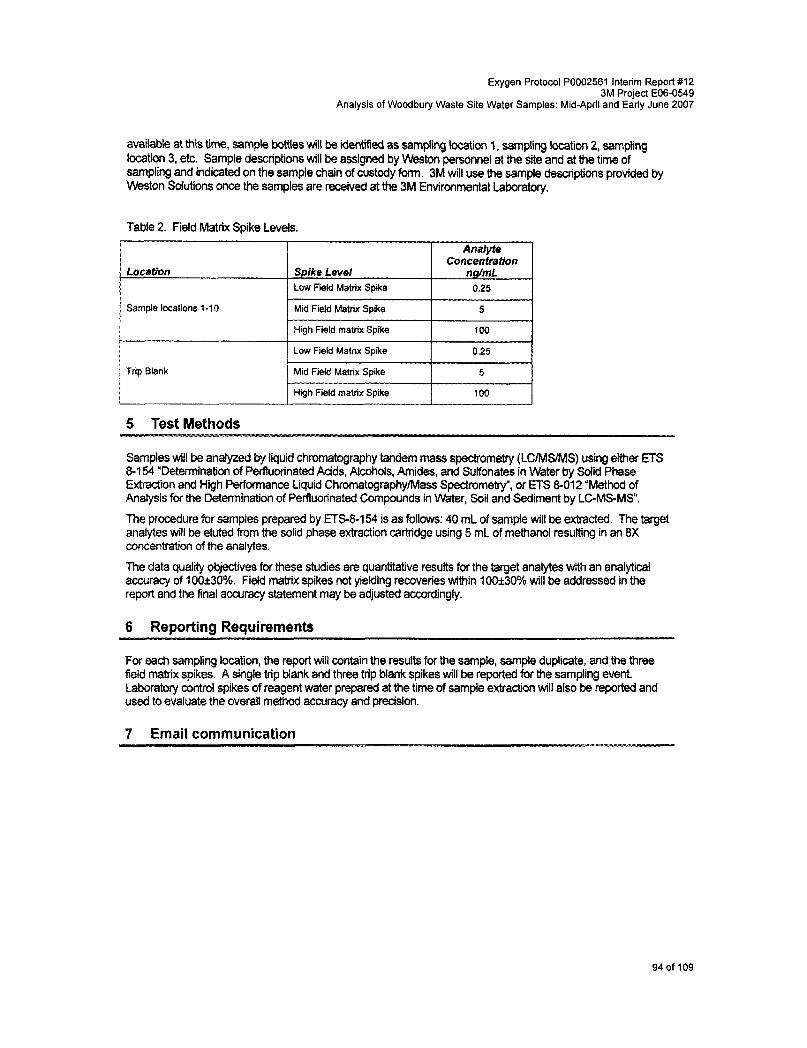
Exygen Protocol PO002561 Interim Report #12 3M Project E06-0549
Analysis of Woodbury Waste Site Water Samples: Mid-April and Early June 2007
Hqh Field matrix Spike
Low Field Matrix Spike
available at this time, sample bottles will be identified as wnpiing location 1, sampling location 2, sampling location 3, etc. Sample descriptions will be assigned by Weston personnel et the site and at the time of sampling and indited on the sample chain of custody form. 3M will use the sample descriptions provided by Weston Wutions once the samples are received at the 3M Environmental Laboratory.
100
0.25
Table 2. Field Matrix Spike Levels.
Location
Sample locations 1-10
Trip Blank
5 Test Methods
Analyte Cancentation
Low Field Matrix Spike
Mid Field Matrix Spike I 5 1
1 5 I Mid Field Matrix Spike
I 100 I High Field matrix Spike
Samples will be analyzed by liquid chromatography tandem mas spectrometry (LCMSlAnS) using efther ETS 8-1 54 "Determination of PerRuMinated Acids, Alcohols, Amides, and Sulfonates in Water by Sdid Phase Extraction and High Performance Liquid Chromatographyhlass Spectrometr)r, or ETS 8-01 2 "Method of Analysis for the Determination of Perfluorinated Compounds in Water, Soil and Sediment by LC-MSMS.
The procedure for samples prepared by I3S-8-154 is as follows: 40 mL of sample will be extracted. The target analytes will be eluted from the solid phase extraction cartridge using 5 mL of methanol resufting in an 8X concentration of the analytes. The data quality objectives for these studies are quantitative results for the target analytes with an analybcal accuracy of 1 OOk30%. Fldd matrix spikes not yielding recoveries within 100&30% will be addressed in the report and the final accuracy statement may be adjusted accordingly.
6 Reoortina Reauirements
For each sampliflZr location, the report will contain the results for the sample, sample duplicate, and the three field matrix spikes, A single trip blank and three trip blank spikes will be reported for the sampling event. Laboratory control spikes of reagent water prepared at the time of sample extraction will also be reported and used to evaluate the overail method accuracy and precision.
7 Email communication
94 of 109

Exygen Protocol PO002561 interim Report # I 2 3M Project E064549
Analysis of Woodbury Waste Site Water Samples: Mid-April and Early June 2007
Kent R. To Susan T. Woif/US-Corporate/3M/US@3~Corporate LindstromluS-Corporete MMN Cleson Len~/US-Corporate/3MAlS@3M-Cotporate s CC William K. Reagen/US-Corporatel3M/US@3M-Corporate 04/04/2007 16:38 bcc
Subject Fw: Bottles for Woodbury Sampling commencing Week of 419107
Everyone,
Please see the schedule far sampling outlined by Weston below. Thanks.
Kent R. Lindstrom Senior Research Chemist 3M Environmental, Health, and Safety Operations Building 260-5N-17 Maplewood, MN 55144-1000
Tel: 65 I - 733-9882 [email protected] FAX: 651-733-4687
CONFIDENTIAL
This communication is intended only for the addressee(s) named above. It contains confidential information. Unauthorized use, disclosure, dissemination or copying of this communication, or any part thereof, is strictly prohibited. If the reader of this message is not the intended recipient please notify us immediately by telephone or electronic mail and delete or destroy this message and all copies thereof, including attachments.
--- Forwarded by Kent R. Lindstrom/US-Ccrpora~e/3M/US on 04/04/2007 0437 PM I--- Wmer, Gary" <G.Witmer@WestonSoluons TO "Kent Lindstrom" <[email protected]> .cam* 04/04/2007 04:20 PM
CC "Frinak, Timothy R." [email protected]> "Kesari, Jai" <J.Kesari~WestonSolutions.c0m> "Young, Charles T." <[email protected]>
419107 Subject RE: Bottles for Woodbury Sampling commencing Week of
Kent:
Regarding the question of schedule for sample collection at Woodbury.
Groundwater sample collection will begin Monday afternoon (9th) or Tuesday morning (10th) and will be comp!eted Friday (1 3th) or Monday (1 6th).
Soil sampling will be performed on Thursday (12th) and will be a one day event.
From: Young, Charles T.
95 of 109

Exygen Protocol PO002561 Interim Report #I2 3M Project E06-0549
Analysis of Woodbury Waste Site Water Samples: Mid-April and Eady June 2007
Sent: Wednesday, April 04,2007 1k43 AM to: Kent Lindstrom
Cc: Subject:
Wihner, Gary; Frinak, Timothy R.; Kesari, Jai Battles for Woodbury Sampling commencing Week of 4/9/07
Kent:
Please review the attached spreadsheet (also embedded in the email below) regarding bottles and spiking fevefs for the sampling that will commence next week at the Woodbury site. Based on my review and discussions with Gary Witmer, it appears that low, middle and high field spike levels of 0.25’5 and 100 ng/mL (ppb), respectively, are appropriate for the groundwater samples, The expectation is that concentrations wit1 not exceed those previously encountered in Woodbury groundwater.
Charlie
From: Witmer, Gary
Sent: Wednesday, April 04,2007 10:40 AM TO; Young, Chades T. Subject: Woodbun/ Sampling
File: FC Concentration Renges.xls >> Charlie, Attached is the summaty of FC concentrations detected in Woodbury groundwater. We are planning on beginning sampling at the site on Monday March 9th. Both groundwater and soil samples will be collected as detailed in the attachment and below.
3M Labs will be analyzing the sampies and providing the bottles. Can you coordinate with Kent L. to establish the spike levels, etc and inform him of our schedule.
Thank You!
Woodbury, MN Detected FC Concentrations Ranges
Groundwater (PPb, uglL)
Analvte LOW HIGH PFBA 0.474 5.15
PFPeA 0.0515 13.5 PFHA 0.082 10.5
PFOA 0.153 19 PFNA ND ND PFDA MD NO PFUnA ND ND PFDoA ND ND PFBS 0.207 22.5 PFHS 1.03 65.4 PFOS 0.0385 9.6
PFHpA 0.0621 1.45
fnciudes groundwefef samples collected in 2005 and 2006
No Data for this area. Soil - NE Disposal Area
96 Of 109

Exygen Protocol PO002561 Interim Report # I 2 3M Project E064549
Analysis of Woodbury Waste Site Water Samples: Mid-April and Early June 2007
PLANNED SAMPLING Media # TvDe
Groundwater 10 Primary 10 High Spike
10 Middle Spike 10 LowSpike 1 Duplicate
1 RinseBtank II_ 1 TripBlank TOTAL 43
Soil 28 Primary 2 Duplicate
2 Rinse Blank 2 Trip Blank
TOTAL 34-
Gary Witmer Project Manager Weston Solutions, tnc. 1400 Weston Way West Chester, PA 19380 01 0-70 1 -3 1 4 I
CONFIDENTIALITY: This e-mail and attachments may contain information which is confidential and proprietary. Disclosure or use of any such information without the written permission af Weston Solutions, Inc. is strictly prohibited. If you received this e-mail in error, please notify the sender by return e-mail and delete this e-mail from your system. Thank You.
97 of 109

Exygen Protocol PO002561 Interim Report #12 3M Project E06-0549
Analysis of Woodbury Waste Site Water Samples: Mid-April and Early June 2007
Environmental Health & Safety Operations, Environmental Laboratory
General Project Outline
To. Robert A Paschke, 3M EHS Opns
From: Cleston Lange, 3M EHS Opns; Environmental Lab
cc: Jaisimha Kesari; Weston Solutions
Wiliam Reagen, 3M EHS Opns; Environmental Lab Kent Lindstrom; 3M EHS Opns; Environmental Lab
Cliffton Jacoby, 3M EWS Opns: Environmental Lab
Analysis of Fluorochem’mis in Soils (Woodbury Dispusal Site) for the 3M Cottage Grove Monitoring
Date: April 13,2007
Subject: Program Phase 2; Exygen Study Number PO002561
1 Generat Project Information
Study Director
Contacts
Lab Request Number
Six Digit Department Number
Project ScheduleRest Dates
Jaislmha Kesari Weston Solutions 1400 Weston Way West Chester, PA 19380
W - W e s t o n S o l u t i o w g g 610-701-3761
Sponsor Representative Robeit A. Paschke Manager, 3M Corporate 3M EHS Operations
3M Laboratory Management William Reegen Laboratory Manager 3M EHS Opns; Environmental Laboratory
Principal Analytical investigator Cleston Lange 3M EHS Opns, Environmental Laboratory
clamreOmmm,cwn
42-2527 65i-m-5200
260-5N-17 651-733-9739
260-5N-17 651 733-9860
E06-0549
53071 1
Thursday April 12,2007
98 of 109

Exygen Protocol PO002561 Interim Report #12 3M Project E06-0549
Analysis of Woodbury Waste Site Water Samples: Mid-April and Early June 2007
2
On April 12, 2007, Weston Solutions is planning to collect soils from the Woodbury, MN waste disposal site. The 3M EHS Operations Laboratory (3M Environmental Lab) will receive and analyze the soil samples and accompanying control samples. Analyses will be conducted under the GLP requirements of €PA TSCA Good Laboratory Practice Standards 40 CFR 792, The analytes measured will be pefluorobutanoate (PFBA; C4), perfluoropentanoate (PFPeA; C5), pefiuorohexanoate (PFHA; C6), perfluoroheptanoate (PFHpA; C7), perfluorooctanoate (PFOA; CB), perfluorononanoate (PFNA, C9), pefluorodecanoate (PFDA; C?O), pefiuoroundecanoate (PFUnA; C1 1) and perfluorododecanoate (PFDoA; C12), and petfiuorobutanesulfonate (PFBS), perfluorohexanesulfonate (PFHS) and perfluorooctanesulfonate (PFOS).
Background Information and Project Objective@)
Up to twenty-eight soil samples and six control samples (blanks, instrument rinses, etc.) are expected Once received, all samples will be stored refrigerated until sample preparation for analysis by 3M Environmental Laboratory Methods as defined below. Preparation and analysis of the received soil samples and control samples will be performed in two phases. Sample preparation for both phases will be performed by extraction of sub-samples from each with acetonitri1e:water (80:20) followed with 1 hour of sonication and then centrifugation to clarify extracts. The initial phase (Phase-I) analysis will be performed by isocratic LCiMSlMS method ETS-8-42.0 to assess those soil samples with "high-level" of perfluorocarbon analyte(s) concentration ( 20.250 pgig). Recovery of a surrogate ('%I ,2-PFOA) will be used to assess analyte recoveries for Phase-1. The second phase (Phase-2) will be conducted to confirm soil samples with "low-level" perfluorocarbon analyte concentrations (e.g. those with all perfluorocarbon analytes at below 0.25 pglq level). Phase-2 will be conducted by re-extractron of the low- level samples with incluston of a duplicate preparation that is fortified (matrix spiked) with nominally 0.050 pg/g of each target analyte. Matrix spike recovery values will be used to assess the accuracy of phase-2 results.
Phase ? results that will be reported are those that range from greater than or equal to 0.25 pg/g and Phase 2 resufts will be reported for those samples with concentrations less than 0.25 pg/g.
3 Project Schedule
Sampie collection bottles will be provided by 3M Environmental Laboratory personnel for sampling on or around April 12,2007 and will need to be picked up by Weston Personnel prior to soil sampling.
I_
99 of 109

Exygen Protocol PO002561 Interim Report # I 2 3M Project E064549
Analysis of Woodbury Waste Site Water Samples: Mid-April and Early June 2007
Target Analfle Acronym Perfluorobutanoic Acid PFBA
Perfiuoropentanoic Acid PFPeA
7
4 Test Parameters
The lowest targeted limit of quantitation (LLOQ), for phase2 as described k>etow, will be nominally 1 .O n@g (ppb) for all compounds of interest. Table-1 lists the target analytes for this sampling event
Perfluorohsxanoic Acid PFHA or PFHxA
Perfluoroheptanoic Acid
Perfluorooctanoic Acid
PFHpA
PFOA
I I Perfluorododecanoic Acid I PFDoA
Perfluorononanoic Acid
Perfluorodecanoic Acid
Pemuoroundecanoic Acid
PFNA
PFOA
PFUnA
Per Weston communications, a total of twentyeight (28) primary samples are expected. For each sample, a total of one 500 mL Nalgene @sample bottle will be provided for pnmary sample collections. Additionally, two (2) bottles will be provided for “Duplicates” sample collections; two (2) bottles will be provided for instrument rinses “Rinse Blanks” and two (2) more bottles provided as “Trip Blanks” per request of Weston Solutions personnel. Each Trip blank will contain approximately 25 grams of a soif that is pre-detemined to be devoid of target analytes (below the reportable LLOQ). The”Rinse Blanks” will be expected to be water rinses and will be prepared as similar to soil samples and analyzed against soil matrix calibration curves and reported as such. A total of 34 sample bottles will be provided. For the collected primary field samples, each sample bottle will receive enough soil to be half-full with soil during collection at the site and left wiut haff the bottle volume as headspace. This will allow each to be homogenized briefly by vigorous shaking in the laboratory prior to removal of subsamples by laboratory personnel during processing for analysis.
As the sampling location descriptions are not available at this time, sample bottles will be identified as assigned by Weston personnel at the site and at the time of sampling and indicated on the sample chain of custody form. 3M wilt use the sample descriptions provided by Weston Solutions once the samples are received at the 3M Environmental Laboratory.
Perfluorobutanesulfonate
Perfluorohexanesulfonate
Perfluorooctanesulfonata
5 Test Methods
PFBS
PFWS
PFOS
The soils sample analysts will be performed in two phases. The initial phase of analysis (Phase-1) will be performed to differentiate soil samples with endogenous “high-level” fluorocarbon analyte fevels. The second phase (Phase-2) will be performed to quantitatively verify soil samples with ”low-level” perfluorocarbon analyte levels. The 3M Environmental Laboratory Methods ETS-842.0 will be followed for Phase-1. The Phase-2 will be conducted by combined Methods ETS-8-12.1 for sample extract preparation and ETS-8-1 .O for analysis of those prepared extracts.
100 of 109

Exygen Protocol PO002561 Interim Report #12 3M Project E06-0549
Analysis of Woodbury Waste Site Water Samples: MidApril and Early June 2007
The initial phase of analysis (Phase-1) will be performed to differentiate soil samples with endogenous levels of targeted FC analyte(s) in a range of approximately 0.25 pg/g to 250 pg/g level using 3M Environmental Laboratory Method 8-42.0. All concentrations reported will be based on native soil weight, not dried weight (Le. will not account for percent moisture in soils). Phase-I analysis will be performed on extracted samples via a rapid screen LClMSlMS analysis. Samples with 250 pg/g or greater will be reported as 2250 pg/g.
The second phase (Phase-2) will be performed to quantify sod samples with all analytes at, or less than, the range 0.0010 pg/g to 0.25 pg/g and using 3M Environmental Laboratory Method ETS-8-12.1 for sample extraction and LC/MS/MS analysis by ETS-8-1 .O. Phase-2 analysis will include a duplicate re- preparation of those samples determined at below 0.25 &g/g in phase-I analysis, with the duplicate fortified with target analytes for recovery determinations. The re-preparation and analysis in phase-:! will inctude one of each soil sample fortified with target FC analytes at a nominal concentration 0.050 pglg (matrix spiked sample). Results of matrix spikes will be used to evaluate analyte(s) recovery for each sample. Detailed method information will be provided with the final data. All soil weights and sample preparation information will be recorded on appropriate sample preparation forms. All analytical results, including detailed method parameters, chromatograms, and data spreadsheets will be printed and retained with the final archived study file with the final report.
In addition to the sample preparation requirements defined below in phase-1 and phase-2 below, additional matrix spikes and duplicate samples may be prepared as needed to evaluate data accuracy.
Phase 1 Anafysis: The 3M method ETS-8-12.1 will be followed for sample preparation. Each sample will be measured to 1 mL volume (approximately 1 to 1.5 gram of soil, depending on soii type) and placed in a 50 mL conical polypropylene centrifuge tube on a balance capable of measuring minimally to 0.01 g. Additionally, every fifth (5th) soil sample will be measured out in similar fashion to 1 mL, weighed, and extracted in duplicate and results from the duplicate samples analysis results used to evaluate sample preparation variability (measured as RPD of the duplicative analytical results). Each soil sample will receive 1.0 ,ug of isotopic bi-labeled 13Cz-l,2-PFOA (C6F1313CF23C02-), delivered as 100 UL of a 10 pg/mL stock solution prepared in an organic solvent. After surrogate analyte addition, samples will be extracted by addition of 8 mL of an 80:20 acetonitri1e:water solution, thoroughly mixed, centrifuged and then aliquoted for LC/MS/MS analysis (per method ETS-8-12.1). The extraction solution may optionally contain an additional non-fluorinated internal standard (trimethylsilytpropane sulfonate; TMS-PS) at I pglmL in the extraction solvent for additional evaluation of extraction and analysis procedures. In order to facilitate analysis of anticipated high-concentration samples, phase-I analysis will be performed by a rapid and accurate isocratic LC/MS/MS analysis with a nominal quantitative range of 0.25 to 250 pg/g. Appropriate solvent blank(s) may be injected between each sample to ensure removal of residual instrument contamination (carry over), as needed.
Phase 2 Anaiysis: Samples measured with all analytes at less than 0 25 pg/g in Phase-I will be re- prepared in duplicate for phase-2, same as in phase-I, except that the duplrcate sample will be additionally fortified with 0.050 pg of each targeted FC analyte and surrogate (13C-1,2-PFOA) will not be added to phase-;! preparations Each sample will be extracted with 8 mL of an 80:20 acetonitri1e:water solution, thoroughly mixed, centrifuged and then aliquoted for LCIMSIMS analysis (per preparation method described in ETS-8-12.1). The phase-2 LCIMSIMS analysis will be performed according to the LC/MS/MS conditions described in method ETS-8-1.0. Soil matrix calibration standards and blanks will not contain surrogate addition in phase-2 preparations. Detailed method information will be provided with the final data. Samples re-prepared and analyzed in phase2 will be reported and the original phase 1 resutts for those samples will not be reported.
Calibration and Calibration Verification. Soil matrix calibration standards will be prepared utilizing approximately 1 m l of a pre-evaluated soil (verified sufficiently clean of target analytes). Soils will be measured consistently for each standard using a disposable 1 mL sampling spoon (resulting in approximately 1 .O to 1.5 g of soil per standard depending on soil density). Hence, each standard will contain a consistent quantity of soil (1 mL), weights will be recorded for each, and then each will be
101 of 109

Exygen Protocol PO002561 Interim Report # I2 3M Project E06-0549
Analysis of Woodbury Waste Site Water Samples: MidApril and Early June 2007
spiked with known quantities of target analytes and surrogate anatyte and then solvent extracted per method ETS-8-12.1. Calibration standard sets with a quantitative range of 0.010 to 250 pg per standard (nominally 0.0010 to 250 pg/g for a 1 .O gram standard soil) will be prepared. A set of calibration standards wilt include 12-1 5 prepared soil matrix calibration standards (nominal soil concentration range 0.0010 to 250 ng/g), triplicate prepared soil blanks (soil plus surrogate, no target analytes) and minimally a triplicate preparation of soil double blanks (no surrogate and no target analytes). The standards that range from 0.25 to 250 pg (0. 25, 0.50, 1.0, 2.5, 5.0, 10, 25, 100 and 250) will be used for phase-1 analysis. The 0.0010 to 0.25 pg standards (0.0010, 0.0025, 0.0050,0.010, 0.025, 0.10, and 0.25) will be used for phase-2 analysis. A mid-level calibration standard will be re-injected every 15 unknown samples in a run and used as continuing calibration verification (CCV).
Uuailty ControllAecsptance Criteria: The surrogate (I3C-1 ,2-PFOA) analyte recovery (fortified at 1 .O pglsample) will be used to evaluate recovery of perfluorinated target analytes in Phase-I . Samples with surrogate recoveries outside of 100% +/- 30% but within 100% +/- 60% are reportable. Matrix spike recoveries for the added known quantities of target analytes will be used to evaluate recovery of native analyte from soil samples in phase-2 Samples with matrix spike recoveries outside of 100% +/- 30% but within 100% +/- 60% are reportable. Results are flagged if outside of 100% +/- 30% as having an expanded uncertainty of 100% +/- 60%. Samples with spike recoveries outside of 100% +/- 60% will be reported as "NR" (not reported due to QC failure).
Percent recovery of back-calculated standards should be 100 2 30 Oh (2 35% at LLOQ) of theoretical and any standards included in constructed calibration curves that are outside of those criteria will be noted in the final report. The lowest calibration standard may be dropped from curves in the event that the analyte response is not twice the analyte response in appropriate blanks. In that event, LLOQs will be revised to the next highest standard that meets that criterion of being twice the response of the blank. Calibration standards within a range should not be excluded without proper documentation of a valid reason for doing so (e.g. known preparation errors or consistent failing of a standard that is suggestive of an isolated problem). All calibration curves should contain at least six calibration points. Regression may be linear or quadratic, non-zero origin, and may be either non-weighted or weighted l / x or 1 1 ~ ~ 2 , as needed
CCV results should be within 200 5 30% of theoretical for acceptance of the results. Partial acceptance of runs is allowed if data sets are flanked by passing CCVs
All data that are reported and that give spike recovery or surrogate recovery data that show accuracy outside of 100 +30%, or flanked by CCV with results outside of 100 2 30%, will be flagged and/or footnoted in ?he final report data tables
6 Reporting Requirements
The report will contain the results for each sample within a single rcsults table. Phase I results that will be reported are those that range from greater than or equal to 0.25 pg/g and Phase 2 results will be reported for those samples with concentrations less than 0.25 pg/g.
7 Supplemental Safety Information . . .
All applicable safety protocols must be followed while on-site during sample collection and in the laboratory during sample processing and analysis. Potential for HF-laden tarskludges mixed with soils is possible. Exercise caution and perform all activities in proper ventilated chemical hoods with HF treatment kits readily accessible.
102 of 109

Exygen Protocol PO002561 Interim Report # I 2 3M Project E06-0549
Analysis of Woodbuly Waste Site Water Samples: Mid-April and Early June 2007
8 Correspondence
Meeting to discuss analytical plan was on February 22, 2007 and included the following 3M Environmental Lab personnel: William Reagen, Cleston Lange, Cliff Jacoby and Kent Lindstrorn. Additional correspondence from Kent Lindstrom, William Reagen and Weston Personnel as e-mails, etc. will be included in the final study file.
103 of 109

Exygen Protocol PO002561 Interim Report # I 2 549 007 Analysis of Woodbury Waste Site Water &g%:!?v&
Study Title
"Analysis of Perfluorobutanoic Acid CPFRR), Perfiuoropamoic Acid (PFPeA),
PRUYWCX. AMENDMENT NO. 12
Amendment Date: Aqusf 6 2007
Laburatuty Project ldenfincstiorr €06-0549
Page ! of-5
104 of 109
Exygen Protocol PO002561 interim Report #12
Analysis of Woodbury Waste Site Water
. , _ . _ _ . _ . . . ... . I . . . . . ... ,. ...... . ~ ~ . . ~
Page 2 o f 4
105 Of 109

Exygen Protocol PO002561 Interim Report # I 2
Analysis of Woodbury Waste Site Water S a m p l k w f i
&?O?OCOL READS:
Analytical Procedure Summary
References: ETS-8-12.0 Mettrod of Analysis for the Determination of Perfluorobutanolc Add (PFBA), Perffuoropentanoic Acid (PFPeA), PeAuurohexanoic Acid (PFHA), Pefluoroheptanoic Acid (PFHpA), PerFIoarooctaroic Acid (PFOA), Perffuoranonancric Acid (PFNA), Perfluorodecanoic Acid (PFDA). Pefiuoroundecanok Acid (PFUnA), PerRuoroddecanoc Acid (PFDoA), Perflwmbutanesuffonafonate (PFBS), Perfhrohexanesulfonate (PFHS), and P&uorooctanesulfonate (PFOS) in Water, Soil and Sediment by tC/#iSlMS
Analytical PIOcedure Summary
References: ETS-8-22: Method of Analysis for the Determination of Perfluorobutanoic Acid (PFBA). Perfluoropentanok Acid (PFPeA), Pefluwfiexanoic Acid (PFHA), Perfluoroheptanoic Acid (PFHpA), Perfioomodanolc Acid (PFOA), Petftuorononanoic Acid (PFNA), Pertluorcdecanoie Add (PFDA), Perffwmundecanoic Actd ( P F U d ) , PeAuoradadecanoic Acid (PFOoA). Perflwxobutanesulfonate JPFBS), PeAuorohexanesulfonate (PFHS). and Peiftuamactanesutfonate (PFOS) in Water, Soit and Sedment by LCIMSIMS
ETS-8154: Determination of Perfhorinared Acids, Ncohois, Amides, 2nd Sulfonates in Waterty Sokd h7gh Performaim Li Ghromat~raphy/Mass Sp
ETS-8644: Method of Arafysrs for the Getemination of Perfluorinated Compounds in Water by LCIMSIMS; Direct Injection Analysis
Reason:
Reason 1 : These additional 3M Environmental Laboratory methods allow sampbs to be analyzed by an appropriate method. ETS8-044 was signed on 4/13/07, just after the Amendment #9 was signed altowing for the addition of the 3M Environmental Laboratory as a testing Facility. Reason 2: The protocol states that the number and types of samples collect& wig vary depending on avaifablty in tbe field anb also that addditional sarnpbs may be collected at rhe discretion of the study director. Interim and final reparts will document the results for alf samples cotleded and the methods used to generate the dab.
Page 3 o f 4
106of 109

Exygen Protocol PO002561 Interim Report # I 2 3M Project E06-0549
Analysis of Woodbury Waste Site Water Samples: Mid-April and Early June 2007 Exysan protocd moo2561
A.mendment 12
? .
-.. *-
I . .I .
107 of 109

Exygen Protocol PO002561 Interim Report #I2 3M Project E06-0549
Analysis of Woodbury Waste Site Water Samples: Mid-April and Early June 2007
ATTACHMENT D: METHOD DEVIATIONS
108 of 109

ffs-4-08.4 Page ,I of 1 Attachment A: Record of Nonconfcrrmance \ Deviatton fonn
Document&ion of Deviations and control of Nmco-nforming Testing
109 of 109