Embed Size (px)
Citation preview
Interim Report
1 April 2013 – 30 June 2013
2 Interim Report 1 April – 30 June 2013
Contents
Summary of second quarter results .......................................................................................................................... 3
Key figures and ratios ............................................................................................................................................... 4
Operating environment ............................................................................................................................................. 5
Financial results ......................................................................................................................................................10
Consolidated statement of comprehensive income ................................................................................................20
Consolidated statement of changes in equity .........................................................................................................23
Notes to the financial statements ...........................................................................................................................24
1 Accounting policies .................................................................................................................................... 24
2 Segment reporting ..................................................................................................................................... 25
3 Seasonality of operating profit ................................................................................................................... 26
4 Property, plant and equipment .................................................................................................................. 27
5 Derivative financial instruments................................................................................................................. 27
6 Share capital.............................................................................................................................................. 28
7 Earnings per share .................................................................................................................................... 28
8 Nominal value and amortised cost of borrowings ..................................................................................... 28
9 Cash from operating activities ................................................................................................................... 29
10 Contingent liabilities ................................................................................................................................ 29
11 Related party transactions ....................................................................................................................... 30
12 Disposal of subsidiary ............................................................................................................................. 30
Summary.................................................................................................................................................................31
3 Interim Report 1 April – 30 June 2013
Summary of second quarter results
Dear reader
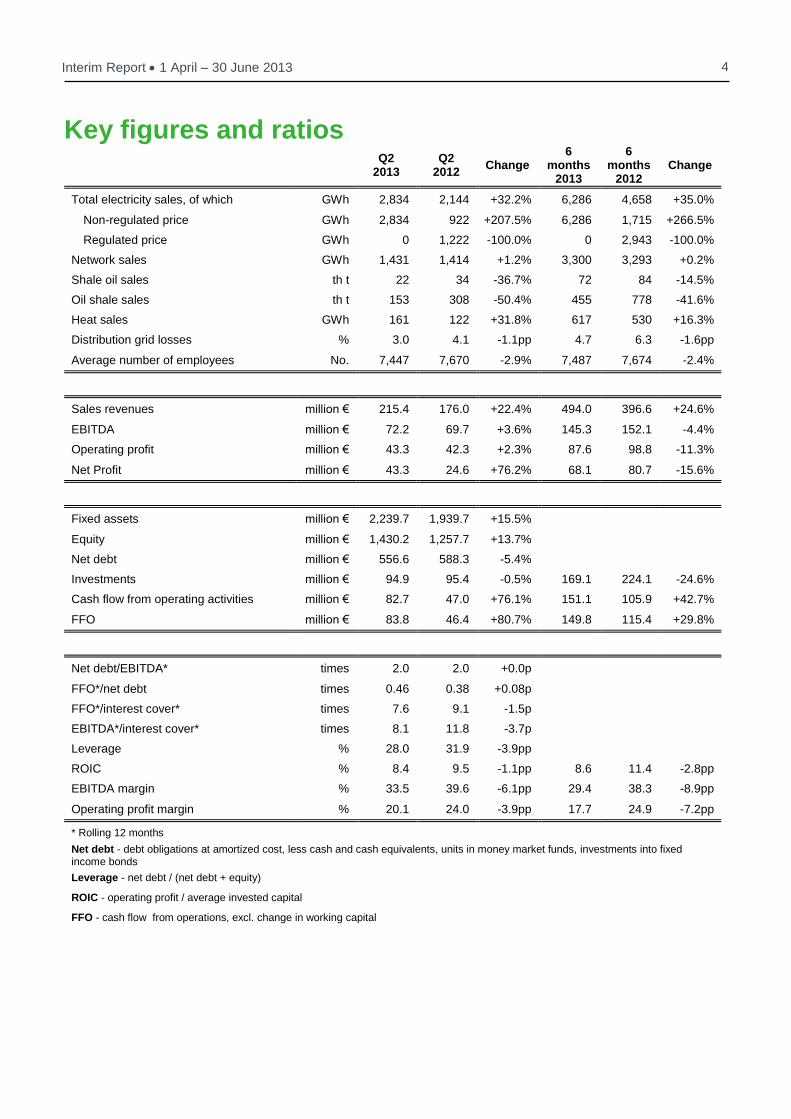
We completed the second quarter with solid results. The sales revenue for the quarter increased 22% from the same quarter last year and amounted to 215 million euros. The Group earned 72.2 million euros of EBITDA, which is 3.6% more than last year. Q2 financial results were positively influenced by significant growth in electricity sales and average sales price, while the sales price and volume of shale oil decreased in the second quarter. Success in electricity sales has enabled us to offset the delay in commissioning the new Enefit280 oil plant. Our operating cash-flow amounted to 83 million euros, which is 76% increase compared to the second quarter last year.
The highlight of the quarter was undoubtedly the completion of the waste-to-energy unit in Iru Power Plant that will generate both heat and electricity from mixed municipal waste. Estonia’s first waste-to-energy unit successfully completed grid tests and will be receiving a subsidy for efficient co-generation of energy. Thanks to the completion of the waste-to-energy plant, large-scale disposal of mixed municipal waste in landfills in Estonia has come to an end – this will have a positive impact both on the environment and on consumers who will be paying less for waste handling as well as heat supply.
In the second quarter, successful grid tests were completed by our two new wind parks in Narva and Paldiski. This means that both wind parks now comply with grid code and will receive renewable energy subsidy. It also marks the final completion of the wind farms.
In the second quarter we also received good news regarding our foreign development projects. In Frankfurt, Eesti Energia´s subsidiary Enefit Outotec Technology commissioned a pilot plant that enables to test oil production from oil shale of different origin. In the near future, the plant will be conducting tests with the oil shale of Utah and Jordan. The pilot plant will significantly increase our capacity to supply clients worldwide with Enefit technology. The Jordan Ministry of Environment approved the environmental impact assessment of the Jordan electricity project that was the next important step in the oil shale power plant construction project.
Hot commissioning of the new generation Enefit280 oil plant is still ongoing. In June, another start up was carried out which showed that while the oil production process is functioning, additional work is required with some equipment before the plant can be commissioned in full.
Despite the delay in commissioning the new oil plant we have not changed our outlook for 2013 due to the higher than planned electricity generation. As previously, we expect growth in both sales revenues and EBITDA. It is also encouraging that in June Standard & Poor’s confirmed our credit rating at the current level BBB+ with a stable outlook.
CEO and Chairman of the Management Board of Eesti Energia Sandor Liive
4 Interim Report 1 April – 30 June 2013
Key figures and ratios
Q2 2013
Q2 2012
Change 6
months 2013
6 months
2012 Change
Total electricity sales, of which GWh 2,834 2,144 +32.2% 6,286 4,658 +35.0%
Non-regulated price GWh 2,834 922 +207.5% 6,286 1,715 +266.5%
Regulated price GWh 0 1,222 -100.0% 0 2,943 -100.0%
Network sales GWh 1,431 1,414 +1.2% 3,300 3,293 +0.2%
Shale oil sales th t 22 34 -36.7% 72 84 -14.5%
Oil shale sales th t 153 308 -50.4% 455 778 -41.6%
Heat sales GWh 161 122 +31.8% 617 530 +16.3%
Distribution grid losses % 3.0 4.1 -1.1pp 4.7 6.3 -1.6pp
Average number of employees No. 7,447 7,670 -2.9% 7,487 7,674 -2.4%
Sales revenues million € 215.4 176.0 +22.4% 494.0 396.6 +24.6%
EBITDA million € 72.2 69.7 +3.6% 145.3 152.1 -4.4%
Operating profit million € 43.3 42.3 +2.3% 87.6 98.8 -11.3%
Net Profit million € 43.3 24.6 +76.2% 68.1 80.7 -15.6%
Fixed assets million € 2,239.7 1,939.7 +15.5%
Equity million € 1,430.2 1,257.7 +13.7%
Net debt million € 556.6 588.3 -5.4%
Investments million € 94.9 95.4 -0.5% 169.1 224.1 -24.6%
Cash flow from operating activities million € 82.7 47.0 +76.1% 151.1 105.9 +42.7%
FFO million € 83.8 46.4 +80.7% 149.8 115.4 +29.8%
Net debt/EBITDA* times 2.0 2.0 +0.0p
FFO*/net debt times 0.46 0.38 +0.08p
FFO*/interest cover* times 7.6 9.1 -1.5p
EBITDA*/interest cover* times 8.1 11.8 -3.7p
Leverage % 28.0 31.9 -3.9pp
ROIC % 8.4 9.5 -1.1pp 8.6 11.4 -2.8pp
EBITDA margin % 33.5 39.6 -6.1pp 29.4 38.3 -8.9pp
Operating profit margin % 20.1 24.0 -3.9pp 17.7 24.9 -7.2pp
* Rolling 12 months
Net debt - debt obligations at amortized cost, less cash and cash equivalents, units in money market funds, investments into fixed income bonds
Leverage - net debt / (net debt + equity)
ROIC - operating profit / average invested capital
FFO - cash flow from operations, excl. change in working capital
5 Interim Report 1 April – 30 June 2013
Operating environment
In Q2 2013, energy prices were affected by expectations of the outlook for the global economy and the possible intervention by the European Union in the CO2 emission allowances market. In addition, energy prices were influenced by seasonal factors such as air temperature, precipitation and summer maintenance works in power stations and networks.
The IMF changed its outlook for the global economic growth in 2013 to even more conservative compared to the April 2013 outlook. In its July 2013 outlook
1, the IMF downgraded its global economic growth forecast by 0.2
percentage points and reduced the GDP growth forecast for the euro area by 0.2 percentage points. The more negative outlook by the IMF is based on the view that the slowdown in the growth of emerging economies will last longer than expected and that euro area will remain in a recession for a longer period than expected previously.
The IMF estimates that the global economy expanded by 3.1% in 2012 and forecasts global economic growth to be also 3.1% in 2013. Similarly, the IMF expects the economy in the euro area countries to contract by 0.6% (after contracting by an estimated 0.6% in 2012). The Estonian economy will expand by 3.0% in 2013 (3.2% in 2012), according to the IMF forecast.
The outlook for the euro area economy worsened during Q2 2013 which the IMF mainly attributed to weak consumer demand and lack of consumer confidence. The weakness of the public sector coupled with their limited financial opportunities has made the economic crisis more severe than previously expected. The slow pace of economic reforms in more problematic euro area member states remains a concern. At the same time, the need for setting up a banking union has not lost its importance as it would offer better protection in case of possible problems in euro area banks. During Q2 2013, the euro area surprised with some positive economic indicators, including the highest purchasing managers’ index (PMI) over the last 16 months in June and the biggest leap in the industrial volume index over the last 20 months in March. However, the overall economic situation did not improve and the unemployment level remained at 12% in both April and May. Due to the weak recovery of euro area economy, the European Central Bank kept interest rates low and announced at the beginning of Q2 2013 that it is determined to maintain similar measures also in the near future.
The US economy showed signs of improvement in Q2 2013. Although unemployment at the end of the quarter remained at the same level as in March (7.5%), long-term unemployment decreased in all months during the quarter and consumer confidence increased. At the same time, markets are increasingly insecure about continuation of the US Federal Reserve’s monetary policy measures due to the expectation that if the country’s economy strengthens, restrictions would be imposed on purchasing bonds.
1 Macroeconomic data are based on IMF estimates. Source: IMF July WEO Update (Growing Pains).
6 Interim Report 1 April – 30 June 2013
Oil Prices Min
2 Max Average
price Change
compared to Q2 2012
Brent crude oil (€/bbl)
75.2 86.4 79.0 -6.6%
Fuel oil (1% sulphur content) (€/tonne)
431.7 475.8 453.2 -12.4%
Fuel oil 1% crack spread (€/bbl)
-9.4 -5.3 -6.9 117.1%
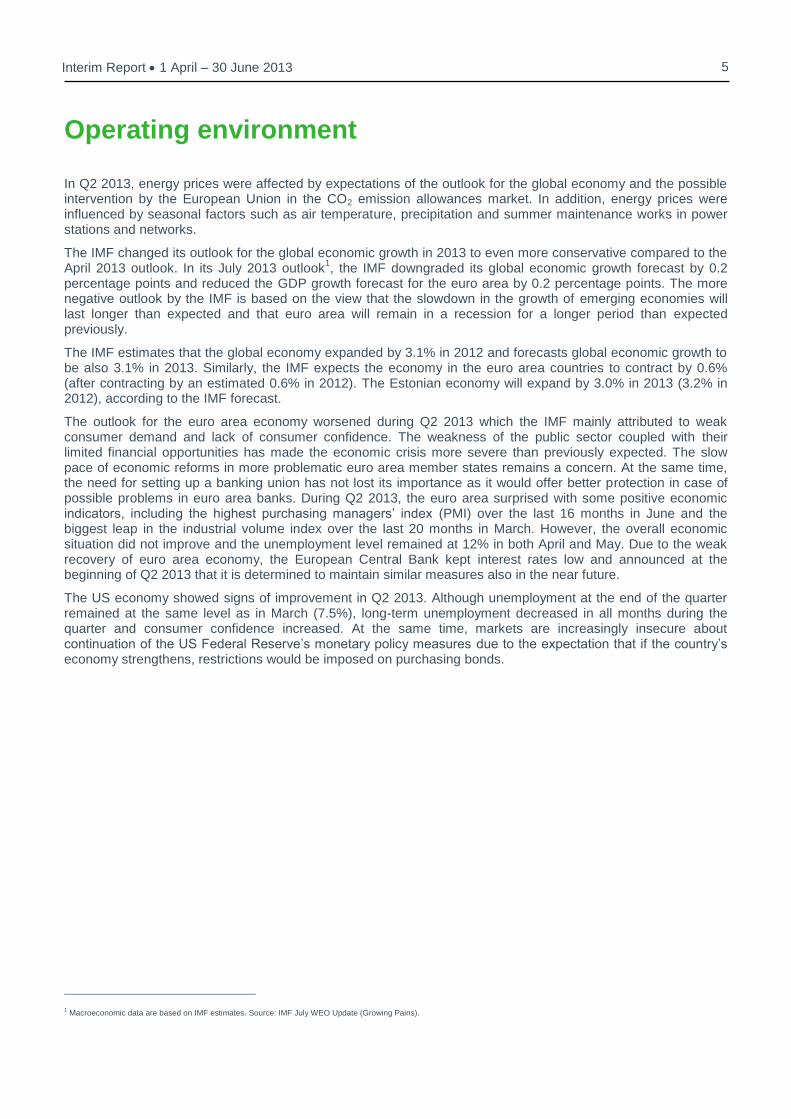
Brent crude oil price traded on average 6.6% lower in comparison with Q2 2012 (-5.6 €/bbl). During Q2 2013, the price decreased from 85.6 €/bbl to 78.8 €/bbl by the end of the quarter.
In Q2 2013, oil prices were mainly influenced by weaker-than-expected results of the largest oil consumers US and China. As for China, the markets have increasingly taken the view that China’s rapid economic growth is beginning to slow down. Demand was also negatively influenced by the economic crisis in the euro area that is characterised by a persistently high unemployment rate. At the start of the quarter, oil supply was influenced by high level of reserves in the US that were partly attributable to the expected growth in vehicle traffic in summer months.
The price of fuel oil (1% sulphur content) decreased by 12.4% (-64.4 €/tonne) in comparison with Q2 2012, while during Q2 2013, the price of fuel oil decreased from 474.8 €/tonne to 447.3 €/tonne. Crack spread (describing the price difference between crude oil and fuel oil extracted from it) increased in Q2 2013 as compared to the same period last year. As compared to Q1 2013, the price spread traded tighter. Since both the prices of Brent crude oil and fuel oil decreased during Q2 2013, the crack spread was reduced mainly by increased demand from Asia for European fuel oil as compared to Q1 2013. Transportation of fuel oil from Europe to Asia was related to the high consumption of fuel oil by local public utilities.
2 Minimum and maximum daily closing prices. In case of electricity, minimum and maximum daily average prices are shown.
7 Interim Report 1 April – 30 June 2013
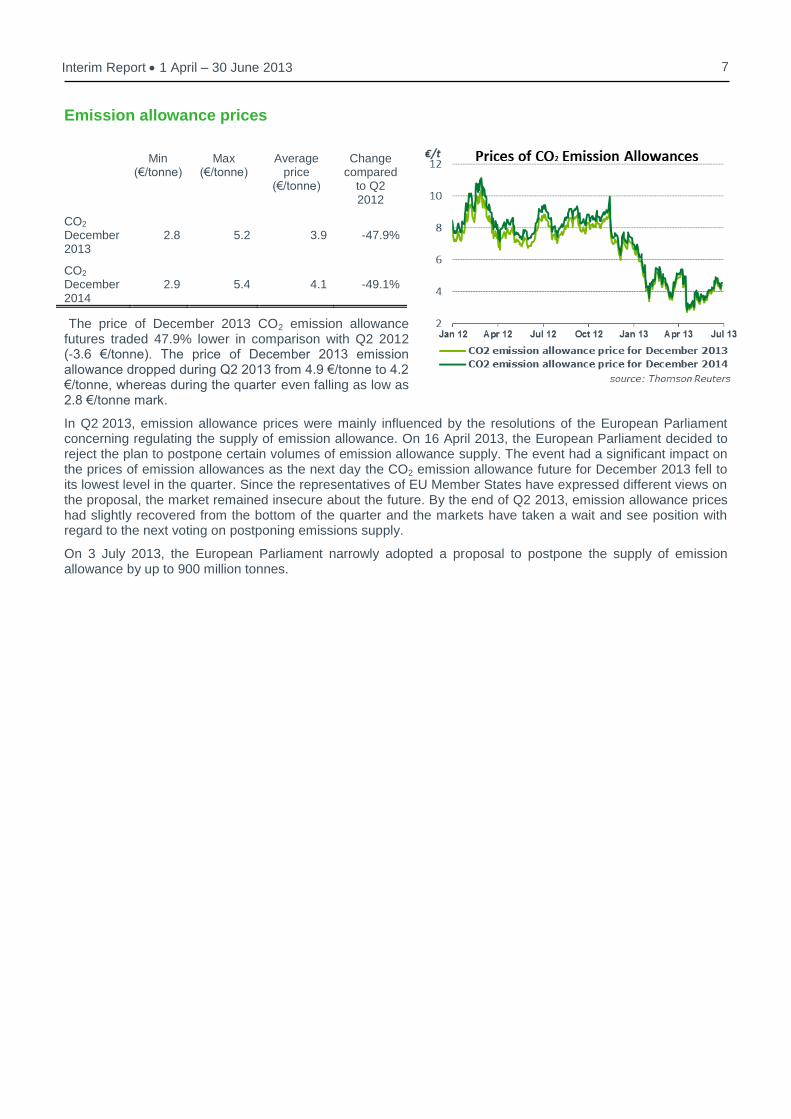
Emission allowance prices
The price of December 2013 CO2 emission allowance futures traded 47.9% lower in comparison with Q2 2012 (-3.6 €/tonne). The price of December 2013 emission allowance dropped during Q2 2013 from 4.9 €/tonne to 4.2 €/tonne, whereas during the quarter even falling as low as 2.8 €/tonne mark.
In Q2 2013, emission allowance prices were mainly influenced by the resolutions of the European Parliament concerning regulating the supply of emission allowance. On 16 April 2013, the European Parliament decided to reject the plan to postpone certain volumes of emission allowance supply. The event had a significant impact on the prices of emission allowances as the next day the CO2 emission allowance future for December 2013 fell to its lowest level in the quarter. Since the representatives of EU Member States have expressed different views on the proposal, the market remained insecure about the future. By the end of Q2 2013, emission allowance prices had slightly recovered from the bottom of the quarter and the markets have taken a wait and see position with regard to the next voting on postponing emissions supply.
On 3 July 2013, the European Parliament narrowly adopted a proposal to postpone the supply of emission allowance by up to 900 million tonnes.
Min (€/tonne)
Max (€/tonne)
Average price
(€/tonne)
Change compared
to Q2 2012
CO2 December 2013
2.8 5.2 3.9 -47.9%
CO2 December 2014
2.9 5.4 4.1 -49.1%
8 Interim Report 1 April – 30 June 2013
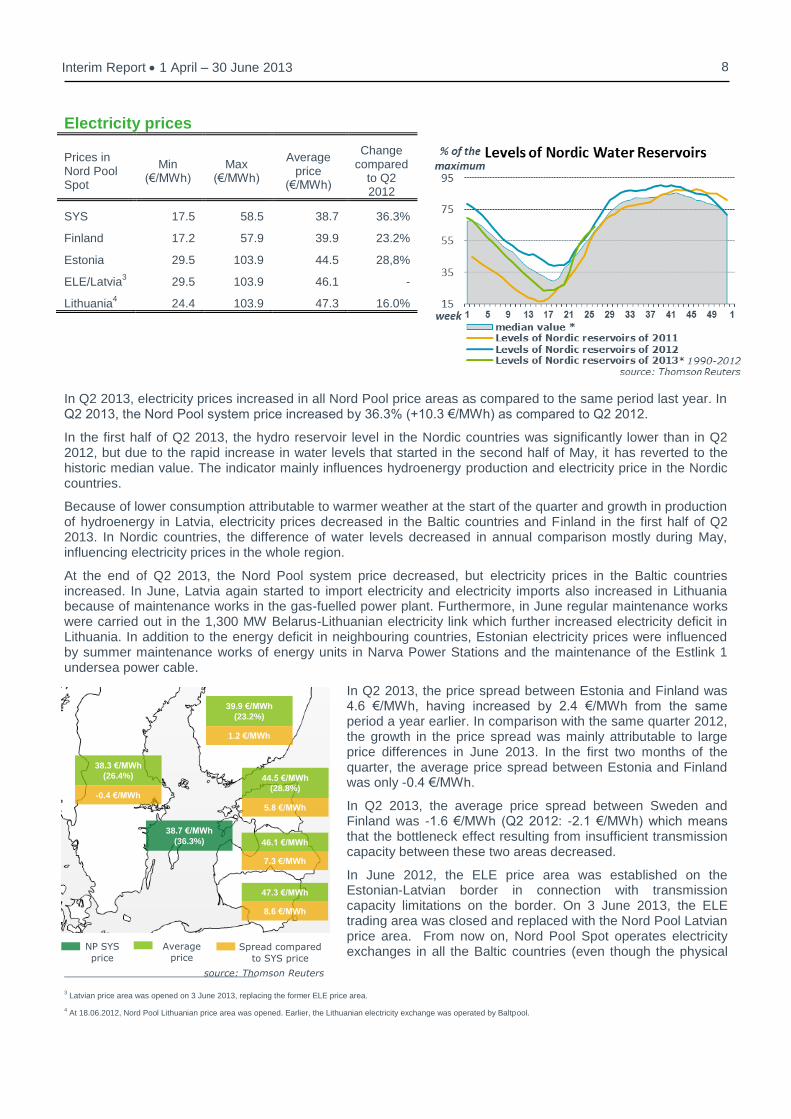
Electricity prices
In Q2 2013, electricity prices increased in all Nord Pool price areas as compared to the same period last year. In Q2 2013, the Nord Pool system price increased by 36.3% (+10.3 €/MWh) as compared to Q2 2012.
In the first half of Q2 2013, the hydro reservoir level in the Nordic countries was significantly lower than in Q2 2012, but due to the rapid increase in water levels that started in the second half of May, it has reverted to the historic median value. The indicator mainly influences hydroenergy production and electricity price in the Nordic countries.
Because of lower consumption attributable to warmer weather at the start of the quarter and growth in production of hydroenergy in Latvia, electricity prices decreased in the Baltic countries and Finland in the first half of Q2 2013. In Nordic countries, the difference of water levels decreased in annual comparison mostly during May, influencing electricity prices in the whole region.
At the end of Q2 2013, the Nord Pool system price decreased, but electricity prices in the Baltic countries increased. In June, Latvia again started to import electricity and electricity imports also increased in Lithuania because of maintenance works in the gas-fuelled power plant. Furthermore, in June regular maintenance works were carried out in the 1,300 MW Belarus-Lithuanian electricity link which further increased electricity deficit in Lithuania. In addition to the energy deficit in neighbouring countries, Estonian electricity prices were influenced by summer maintenance works of energy units in Narva Power Stations and the maintenance of the Estlink 1 undersea power cable.
In Q2 2013, the price spread between Estonia and Finland was 4.6 €/MWh, having increased by 2.4 €/MWh from the same period a year earlier. In comparison with the same quarter 2012, the growth in the price spread was mainly attributable to large price differences in June 2013. In the first two months of the quarter, the average price spread between Estonia and Finland was only -0.4 €/MWh.
In Q2 2013, the average price spread between Sweden and Finland was -1.6 €/MWh (Q2 2012: -2.1 €/MWh) which means that the bottleneck effect resulting from insufficient transmission capacity between these two areas decreased.
In June 2012, the ELE price area was established on the Estonian-Latvian border in connection with transmission capacity limitations on the border. On 3 June 2013, the ELE trading area was closed and replaced with the Nord Pool Latvian price area. From now on, Nord Pool Spot operates electricity exchanges in all the Baltic countries (even though the physical
3 Latvian price area was opened on 3 June 2013, replacing the former ELE price area.
4 At 18.06.2012, Nord Pool Lithuanian price area was opened. Earlier, the Lithuanian electricity exchange was operated by Baltpool.
Prices in Nord Pool Spot
Min (€/MWh)
Max (€/MWh)
Average price
(€/MWh)
Change compared
to Q2 2012
SYS 17.5 58.5 38.7 36.3%
Finland 17.2 57.9 39.9 23.2%
Estonia 29.5 103.9 44.5 28,8%
ELE/Latvia3 29.5 103.9 46.1 -
Lithuania4 24.4 103.9 47.3 16.0%
39.9 €/MWh
(23.2%)
source: Thomson Reuters
1.2 €/MWh
44.5 €/MWh
(28.8%)
5.8 €/MWh
38.3 €/MWh
(26.4%)
-0.4 €/MWh
38.7 €/MWh
(36.3%)
NP SYS
price Average
price Spread compared
to SYS price
46.1 €/MWh
47.3 €/MWh
8.6 €/MWh
7.3 €/MWh
9 Interim Report 1 April – 30 June 2013
bottleneck still remains between Estonia and Latvia). Unlike in the system used in the ELE area, from 3 June the transmission capacities are distributed fully by the so-called implicit auction or energy auction. Earlier, 20% of the transmission capacity was allocated in a separate power auction. Average price spread between Estonia and ELE/Latvia was -1.5 €/MWh in Q2 2013.
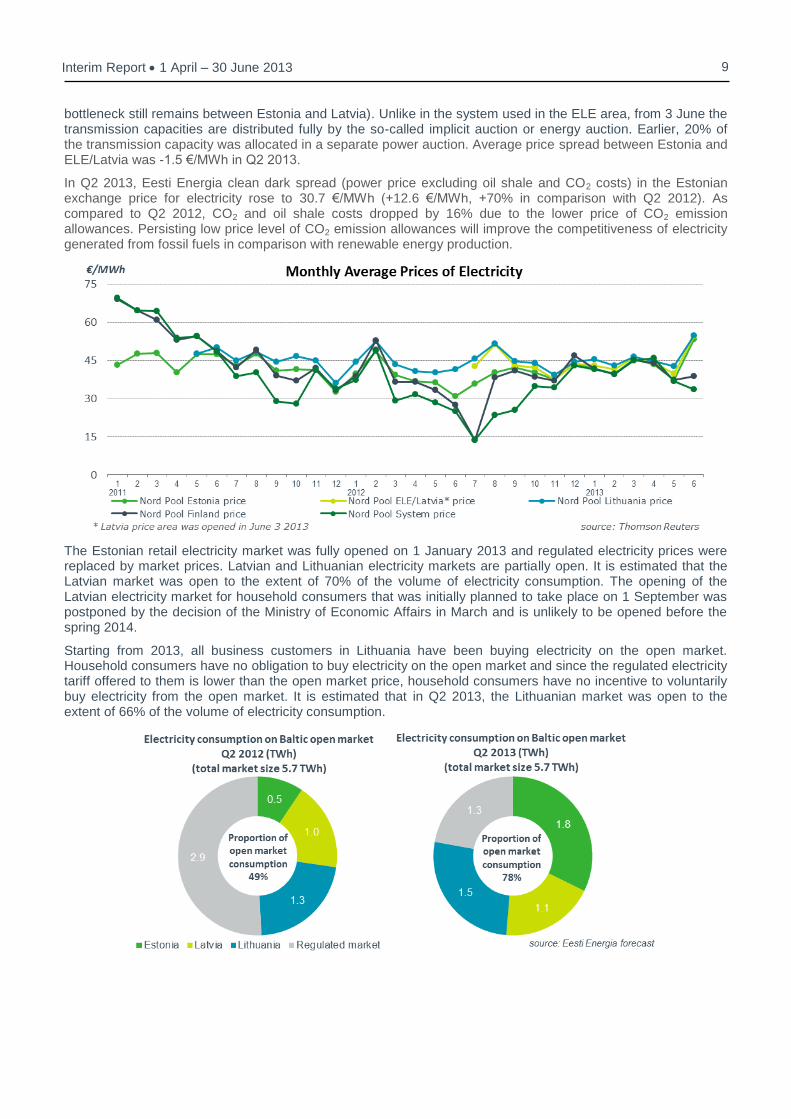
In Q2 2013, Eesti Energia clean dark spread (power price excluding oil shale and CO2 costs) in the Estonian exchange price for electricity rose to 30.7 €/MWh (+12.6 €/MWh, +70% in comparison with Q2 2012). As compared to Q2 2012, CO2 and oil shale costs dropped by 16% due to the lower price of CO2 emission allowances. Persisting low price level of CO2 emission allowances will improve the competitiveness of electricity generated from fossil fuels in comparison with renewable energy production.
The Estonian retail electricity market was fully opened on 1 January 2013 and regulated electricity prices were replaced by market prices. Latvian and Lithuanian electricity markets are partially open. It is estimated that the Latvian market was open to the extent of 70% of the volume of electricity consumption. The opening of the Latvian electricity market for household consumers that was initially planned to take place on 1 September was postponed by the decision of the Ministry of Economic Affairs in March and is unlikely to be opened before the spring 2014.
Starting from 2013, all business customers in Lithuania have been buying electricity on the open market. Household consumers have no obligation to buy electricity on the open market and since the regulated electricity tariff offered to them is lower than the open market price, household consumers have no incentive to voluntarily buy electricity from the open market. It is estimated that in Q2 2013, the Lithuanian market was open to the extent of 66% of the volume of electricity consumption.
10 Interim Report 1 April – 30 June 2013
Financial results
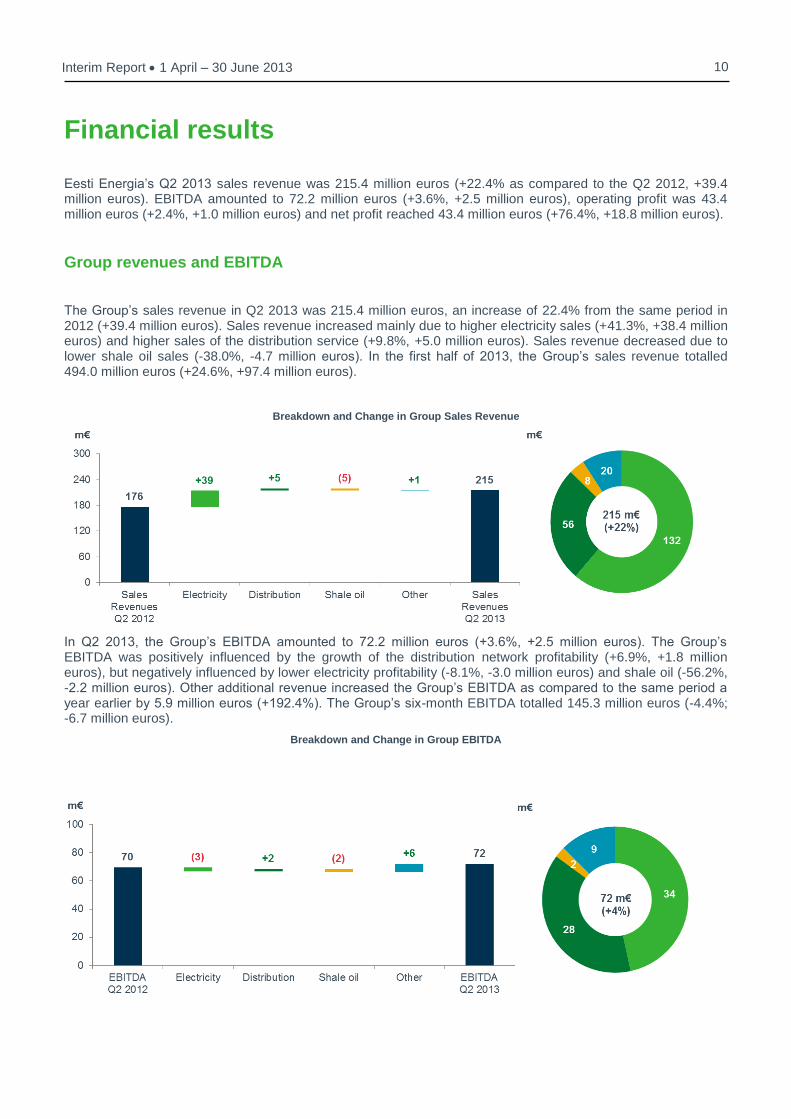
Eesti Energia’s Q2 2013 sales revenue was 215.4 million euros (+22.4% as compared to the Q2 2012, +39.4 million euros). EBITDA amounted to 72.2 million euros (+3.6%, +2.5 million euros), operating profit was 43.4 million euros (+2.4%, +1.0 million euros) and net profit reached 43.4 million euros (+76.4%, +18.8 million euros).
Group revenues and EBITDA
The Group’s sales revenue in Q2 2013 was 215.4 million euros, an increase of 22.4% from the same period in 2012 (+39.4 million euros). Sales revenue increased mainly due to higher electricity sales (+41.3%, +38.4 million euros) and higher sales of the distribution service (+9.8%, +5.0 million euros). Sales revenue decreased due to lower shale oil sales (-38.0%, -4.7 million euros). In the first half of 2013, the Group’s sales revenue totalled 494.0 million euros (+24.6%, +97.4 million euros).
Breakdown and Change in Group Sales Revenue
In Q2 2013, the Group’s EBITDA amounted to 72.2 million euros (+3.6%, +2.5 million euros). The Group’s EBITDA was positively influenced by the growth of the distribution network profitability (+6.9%, +1.8 million euros), but negatively influenced by lower electricity profitability (-8.1%, -3.0 million euros) and shale oil (-56.2%, -2.2 million euros). Other additional revenue increased the Group’s EBITDA as compared to the same period a year earlier by 5.9 million euros (+192.4%). The Group’s six-month EBITDA totalled 145.3 million euros (-4.4%; -6.7 million euros).
Breakdown and Change in Group EBITDA
11 Interim Report 1 April – 30 June 2013
Electricity
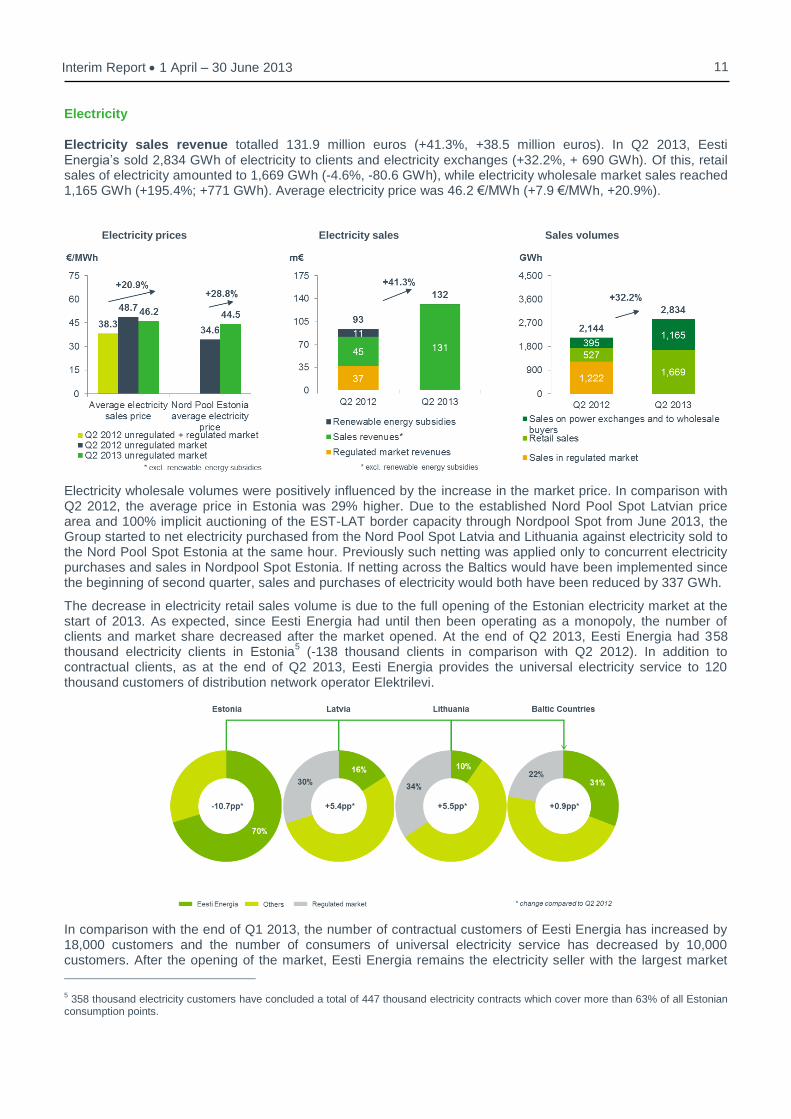
Electricity sales revenue totalled 131.9 million euros (+41.3%, +38.5 million euros). In Q2 2013, Eesti Energia’s sold 2,834 GWh of electricity to clients and electricity exchanges (+32.2%, + 690 GWh). Of this, retail sales of electricity amounted to 1,669 GWh (-4.6%, -80.6 GWh), while electricity wholesale market sales reached 1,165 GWh (+195.4%; +771 GWh). Average electricity price was 46.2 €/MWh (+7.9 €/MWh, +20.9%).
Electricity prices Electricity sales Sales volumes
Electricity wholesale volumes were positively influenced by the increase in the market price. In comparison with Q2 2012, the average price in Estonia was 29% higher. Due to the established Nord Pool Spot Latvian price area and 100% implicit auctioning of the EST-LAT border capacity through Nordpool Spot from June 2013, the Group started to net electricity purchased from the Nord Pool Spot Latvia and Lithuania against electricity sold to the Nord Pool Spot Estonia at the same hour. Previously such netting was applied only to concurrent electricity purchases and sales in Nordpool Spot Estonia. If netting across the Baltics would have been implemented since the beginning of second quarter, sales and purchases of electricity would both have been reduced by 337 GWh.
The decrease in electricity retail sales volume is due to the full opening of the Estonian electricity market at the start of 2013. As expected, since Eesti Energia had until then been operating as a monopoly, the number of clients and market share decreased after the market opened. At the end of Q2 2013, Eesti Energia had 358 thousand electricity clients in Estonia
5 (-138 thousand clients in comparison with Q2 2012). In addition to
contractual clients, as at the end of Q2 2013, Eesti Energia provides the universal electricity service to 120 thousand customers of distribution network operator Elektrilevi.
In comparison with the end of Q1 2013, the number of contractual customers of Eesti Energia has increased by 18,000 customers and the number of consumers of universal electricity service has decreased by 10,000 customers. After the opening of the market, Eesti Energia remains the electricity seller with the largest market
5 358 thousand electricity customers have concluded a total of 447 thousand electricity contracts which cover more than 63% of all Estonian
consumption points.
12 Interim Report 1 April – 30 June 2013
share in Estonia. In Q2 2013, the market share of Eesti Energia in Estonia by electricity consumption of clients was 70%
6.
In Latvia and Lithuania, retail sales of Eesti Energia increased as compared to the same period a year earlier. In Latvia and Lithuania where Eesti Energia operates under the trademark of Enefit, the number of new clients increased remarkably. By the end of Q2 2013, Eesti Energia had 1,587 open market clients in Latvia (+753 clients from the end of Q2 2012) and 881 clients in Lithuania (+617 clients).
In Q2 2013, we generated a total of 2,416 GWh of electricity7 (+17.9%, +366 GWh). Volumes of electricity
produced from oil shale grew due to higher electricity and lower CO2 market prices. Electricity generated from renewable sources totalled 47 GWh (-78%, -166 GWh). Generation of electricity from renewable sources decreased mainly as the Group stopped using biomass in Narva power plants. According to the draft amendments to the Electricity Market Act, Narva Power Stations will not receive renewable energy subsidies for burning biofuel in the coming years. Renewable energy subsidies received by Eesti Energia totalled 0.8 million euros (-93%, -10.5 million euros). The majority of energy generated from renewable sources came from wind parks (41 GWh, +133%, +23 GWh). Growth in the latter is attributable to new wind parks in Narva and Paldiski that started to receive renewable energy subsidy after completing the network tests in June 2013.
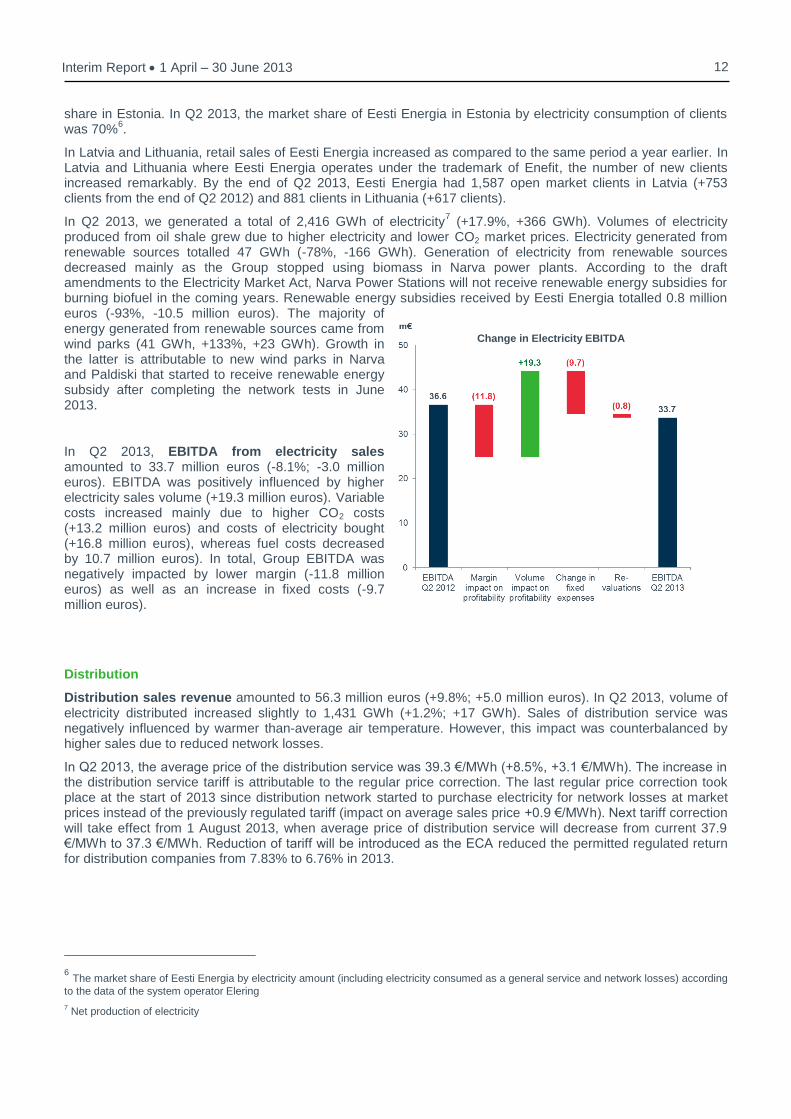
In Q2 2013, EBITDA from electricity sales amounted to 33.7 million euros (-8.1%; -3.0 million euros). EBITDA was positively influenced by higher electricity sales volume (+19.3 million euros). Variable costs increased mainly due to higher CO2 costs (+13.2 million euros) and costs of electricity bought (+16.8 million euros), whereas fuel costs decreased by 10.7 million euros). In total, Group EBITDA was negatively impacted by lower margin (-11.8 million euros) as well as an increase in fixed costs (-9.7 million euros).
Distribution
Distribution sales revenue amounted to 56.3 million euros (+9.8%; +5.0 million euros). In Q2 2013, volume of electricity distributed increased slightly to 1,431 GWh (+1.2%; +17 GWh). Sales of distribution service was negatively influenced by warmer than-average air temperature. However, this impact was counterbalanced by higher sales due to reduced network losses.
In Q2 2013, the average price of the distribution service was 39.3 €/MWh (+8.5%, +3.1 €/MWh). The increase in the distribution service tariff is attributable to the regular price correction. The last regular price correction took place at the start of 2013 since distribution network started to purchase electricity for network losses at market prices instead of the previously regulated tariff (impact on average sales price +0.9 €/MWh). Next tariff correction will take effect from 1 August 2013, when average price of distribution service will decrease from current 37.9 €/MWh to 37.3 €/MWh. Reduction of tariff will be introduced as the ECA reduced the permitted regulated return for distribution companies from 7.83% to 6.76% in 2013.
6 The market share of Eesti Energia by electricity amount (including electricity consumed as a general service and network losses) according
to the data of the system operator Elering 7 Net production of electricity
Change in Electricity EBITDA

13 Interim Report 1 April – 30 June 2013
Distribution prices Sales revenue from electricity distribution Sales volumes
In Q2 2013, distribution network losses amounted to 47 GWh or 3.0%, having decreased by 17 GWh (-1 percentage point) from the same period of 2012. In comparison with the previous year, distribution network reliability has improved. The average duration of unplanned interruptions was 38 minutes (43 minutes in 2012) and average duration of planned interruptions 23 minutes (22 minutes in 2012).
In Q2 2013, EBITDA from sales of distribution service totalled 27.8 million euros (+6.9%; +1.8 million euros). Distribution service EBITDA was positively influenced by margin growth (+1.2 million euros), increase in volume (+0.4 million euros) and lower fixed costs (+0.2 million euros).
Shale Oil
The sales revenue from the sales of shale oil totalled 7.7 million euros (-38.0%; -4.7 million euros). In Q2 2013, Eesti Energia sold 21.6 thousand tonnes of shale oil (-36.7%, 12.4 thousand tonnes).
Shale oil prices Sales of shale oil Sales volumes
In Q2 2013, the average sales price of shale oil was 355.7 €/tonne (-2.1%, -7.8 €/tonne). As compared to 2012, the average price decreased significantly less than the global market price of heavy fuel oil, a reference product.
Change in Distribution Service EBITDA
Change in Distribution Service EBITDA
14 Interim Report 1 April – 30 June 2013
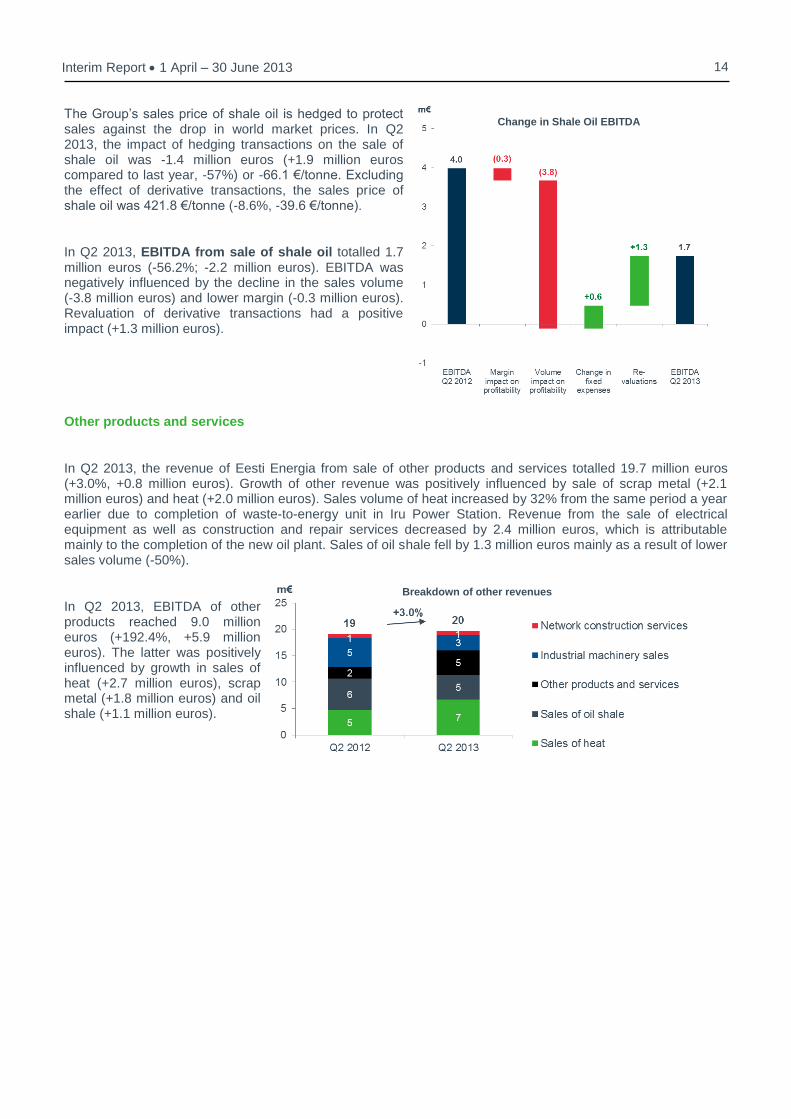
The Group’s sales price of shale oil is hedged to protect sales against the drop in world market prices. In Q2 2013, the impact of hedging transactions on the sale of shale oil was -1.4 million euros (+1.9 million euros compared to last year, -57%) or -66.1 €/tonne. Excluding the effect of derivative transactions, the sales price of shale oil was 421.8 €/tonne (-8.6%, -39.6 €/tonne).
In Q2 2013, EBITDA from sale of shale oil totalled 1.7 million euros (-56.2%; -2.2 million euros). EBITDA was negatively influenced by the decline in the sales volume (-3.8 million euros) and lower margin (-0.3 million euros). Revaluation of derivative transactions had a positive impact (+1.3 million euros).
Other products and services
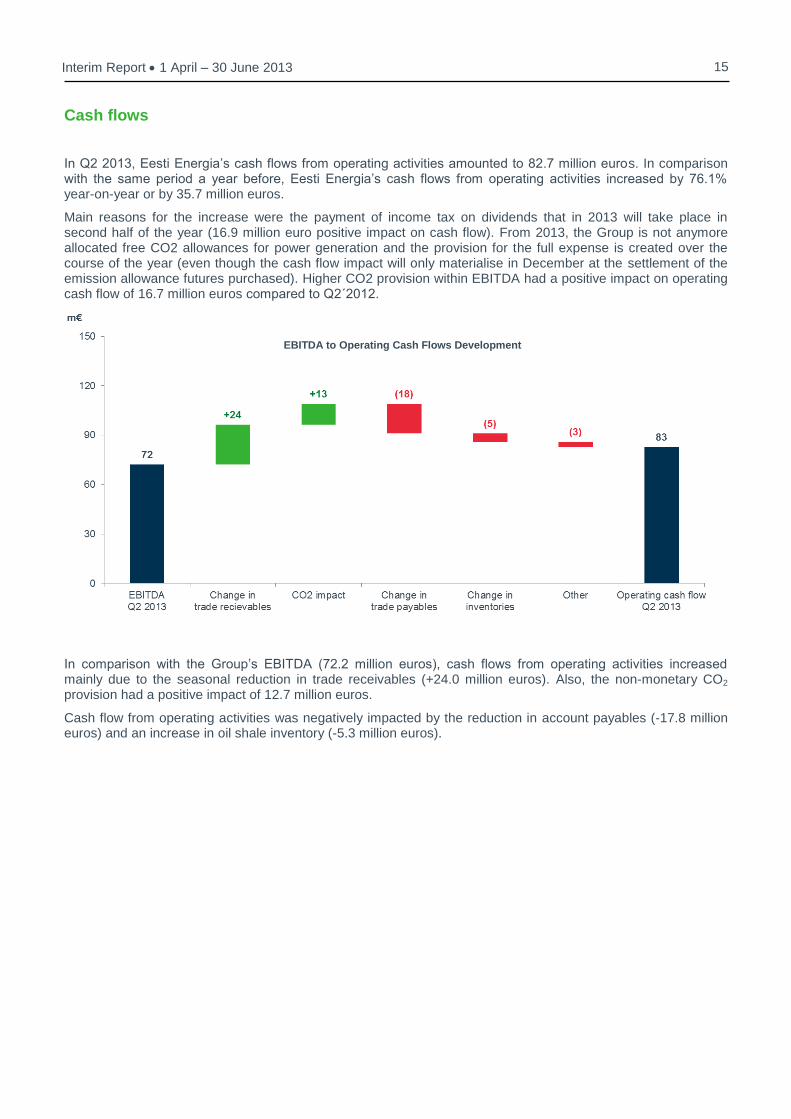
In Q2 2013, the revenue of Eesti Energia from sale of other products and services totalled 19.7 million euros (+3.0%, +0.8 million euros). Growth of other revenue was positively influenced by sale of scrap metal (+2.1 million euros) and heat (+2.0 million euros). Sales volume of heat increased by 32% from the same period a year earlier due to completion of waste-to-energy unit in Iru Power Station. Revenue from the sale of electrical equipment as well as construction and repair services decreased by 2.4 million euros, which is attributable mainly to the completion of the new oil plant. Sales of oil shale fell by 1.3 million euros mainly as a result of lower sales volume (-50%).
In Q2 2013, EBITDA of other products reached 9.0 million euros (+192.4%, +5.9 million euros). The latter was positively influenced by growth in sales of heat (+2.7 million euros), scrap metal (+1.8 million euros) and oil shale (+1.1 million euros).
Change in Shale Oil EBITDA
Breakdown of other revenues
15 Interim Report 1 April – 30 June 2013
Cash flows
In Q2 2013, Eesti Energia’s cash flows from operating activities amounted to 82.7 million euros. In comparison with the same period a year before, Eesti Energia’s cash flows from operating activities increased by 76.1% year-on-year or by 35.7 million euros.
Main reasons for the increase were the payment of income tax on dividends that in 2013 will take place in second half of the year (16.9 million euro positive impact on cash flow). From 2013, the Group is not anymore allocated free CO2 allowances for power generation and the provision for the full expense is created over the course of the year (even though the cash flow impact will only materialise in December at the settlement of the emission allowance futures purchased). Higher CO2 provision within EBITDA had a positive impact on operating cash flow of 16.7 million euros compared to Q2´2012.
In comparison with the Group’s EBITDA (72.2 million euros), cash flows from operating activities increased mainly due to the seasonal reduction in trade receivables (+24.0 million euros). Also, the non-monetary CO2 provision had a positive impact of 12.7 million euros.
Cash flow from operating activities was negatively impacted by the reduction in account payables (-17.8 million euros) and an increase in oil shale inventory (-5.3 million euros).
EBITDA to Operating Cash Flows Development
16 Interim Report 1 April – 30 June 2013
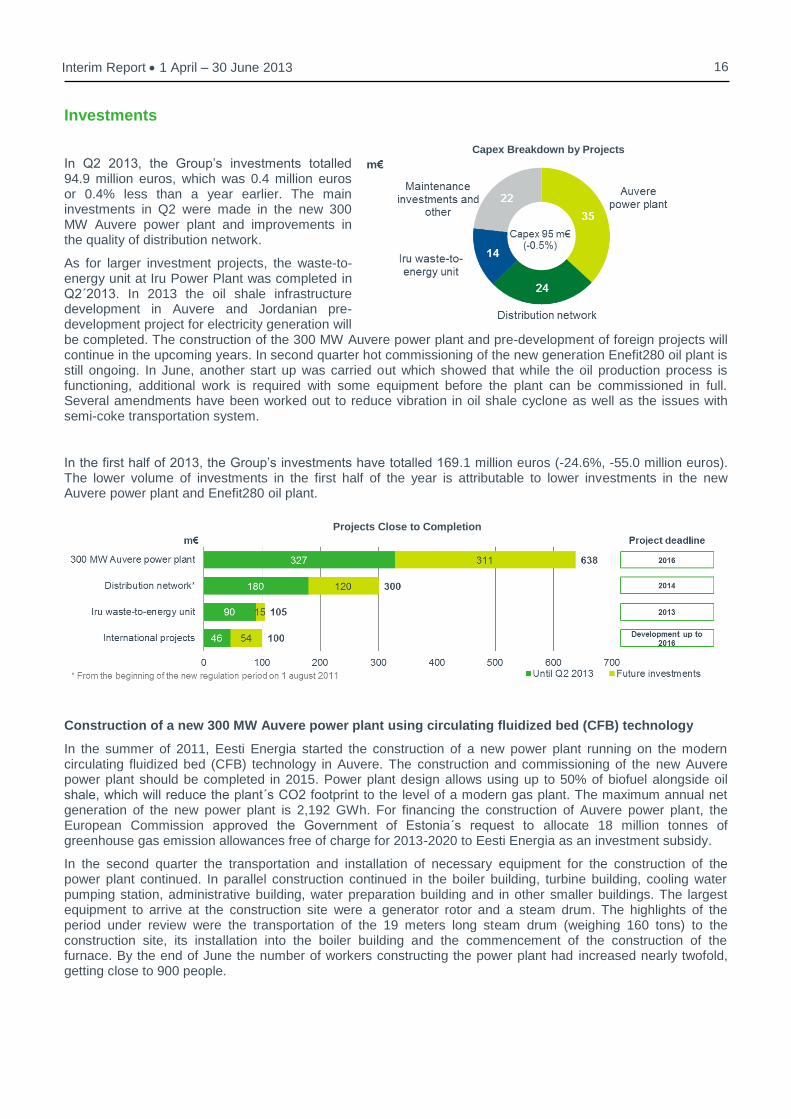
Investments
In Q2 2013, the Group’s investments totalled 94.9 million euros, which was 0.4 million euros or 0.4% less than a year earlier. The main investments in Q2 were made in the new 300 MW Auvere power plant and improvements in the quality of distribution network.
As for larger investment projects, the waste-to-energy unit at Iru Power Plant was completed in Q2´2013. In 2013 the oil shale infrastructure development in Auvere and Jordanian pre-development project for electricity generation will be completed. The construction of the 300 MW Auvere power plant and pre-development of foreign projects will continue in the upcoming years. In second quarter hot commissioning of the new generation Enefit280 oil plant is still ongoing. In June, another start up was carried out which showed that while the oil production process is functioning, additional work is required with some equipment before the plant can be commissioned in full. Several amendments have been worked out to reduce vibration in oil shale cyclone as well as the issues with semi-coke transportation system.
In the first half of 2013, the Group’s investments have totalled 169.1 million euros (-24.6%, -55.0 million euros). The lower volume of investments in the first half of the year is attributable to lower investments in the new Auvere power plant and Enefit280 oil plant.
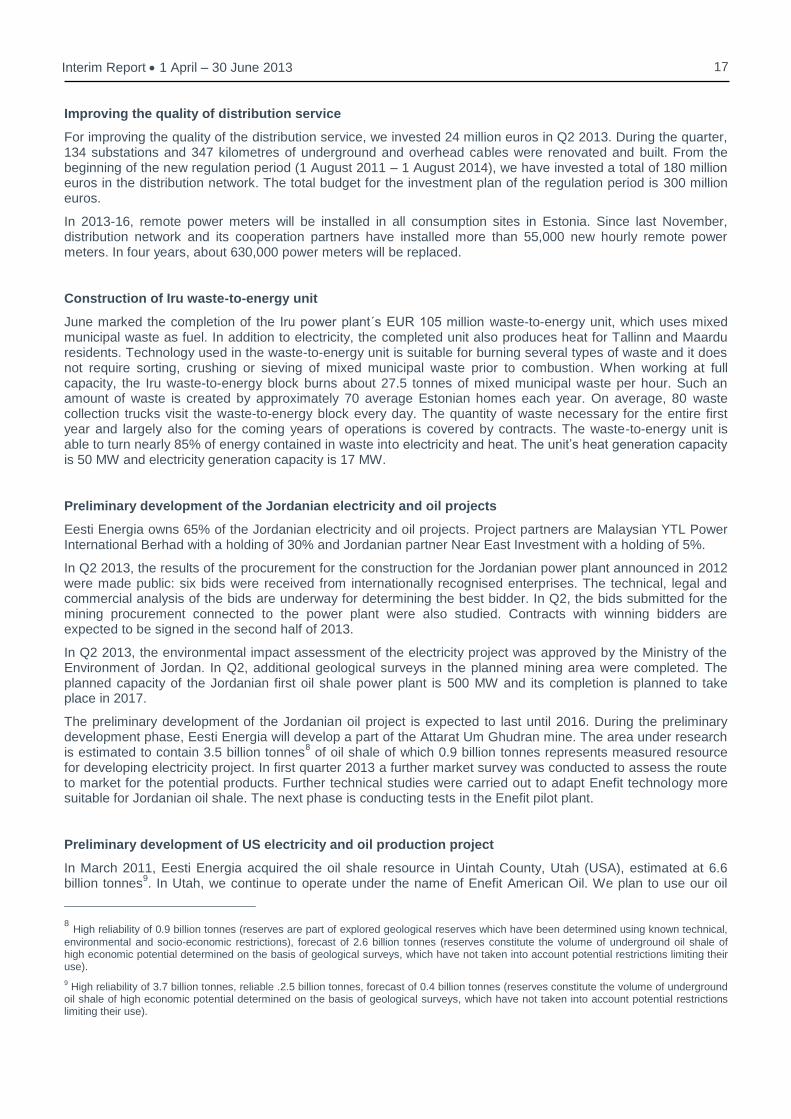
Construction of a new 300 MW Auvere power plant using circulating fluidized bed (CFB) technology
In the summer of 2011, Eesti Energia started the construction of a new power plant running on the modern circulating fluidized bed (CFB) technology in Auvere. The construction and commissioning of the new Auvere power plant should be completed in 2015. Power plant design allows using up to 50% of biofuel alongside oil shale, which will reduce the plant´s CO2 footprint to the level of a modern gas plant. The maximum annual net generation of the new power plant is 2,192 GWh. For financing the construction of Auvere power plant, the European Commission approved the Government of Estonia´s request to allocate 18 million tonnes of greenhouse gas emission allowances free of charge for 2013-2020 to Eesti Energia as an investment subsidy.
In the second quarter the transportation and installation of necessary equipment for the construction of the power plant continued. In parallel construction continued in the boiler building, turbine building, cooling water pumping station, administrative building, water preparation building and in other smaller buildings. The largest equipment to arrive at the construction site were a generator rotor and a steam drum. The highlights of the period under review were the transportation of the 19 meters long steam drum (weighing 160 tons) to the construction site, its installation into the boiler building and the commencement of the construction of the furnace. By the end of June the number of workers constructing the power plant had increased nearly twofold, getting close to 900 people.
Projects Close to Completion
Capex Breakdown by Projects
17 Interim Report 1 April – 30 June 2013
Improving the quality of distribution service
For improving the quality of the distribution service, we invested 24 million euros in Q2 2013. During the quarter, 134 substations and 347 kilometres of underground and overhead cables were renovated and built. From the beginning of the new regulation period (1 August 2011 – 1 August 2014), we have invested a total of 180 million euros in the distribution network. The total budget for the investment plan of the regulation period is 300 million euros.
In 2013-16, remote power meters will be installed in all consumption sites in Estonia. Since last November, distribution network and its cooperation partners have installed more than 55,000 new hourly remote power meters. In four years, about 630,000 power meters will be replaced.
Construction of Iru waste-to-energy unit
June marked the completion of the Iru power plant´s EUR 105 million waste-to-energy unit, which uses mixed municipal waste as fuel. In addition to electricity, the completed unit also produces heat for Tallinn and Maardu residents. Technology used in the waste-to-energy unit is suitable for burning several types of waste and it does not require sorting, crushing or sieving of mixed municipal waste prior to combustion. When working at full capacity, the Iru waste-to-energy block burns about 27.5 tonnes of mixed municipal waste per hour. Such an amount of waste is created by approximately 70 average Estonian homes each year. On average, 80 waste collection trucks visit the waste-to-energy block every day. The quantity of waste necessary for the entire first year and largely also for the coming years of operations is covered by contracts. The waste-to-energy unit is able to turn nearly 85% of energy contained in waste into electricity and heat. The unit’s heat generation capacity is 50 MW and electricity generation capacity is 17 MW.
Preliminary development of the Jordanian electricity and oil projects
Eesti Energia owns 65% of the Jordanian electricity and oil projects. Project partners are Malaysian YTL Power International Berhad with a holding of 30% and Jordanian partner Near East Investment with a holding of 5%.
In Q2 2013, the results of the procurement for the construction for the Jordanian power plant announced in 2012 were made public: six bids were received from internationally recognised enterprises. The technical, legal and commercial analysis of the bids are underway for determining the best bidder. In Q2, the bids submitted for the mining procurement connected to the power plant were also studied. Contracts with winning bidders are expected to be signed in the second half of 2013.
In Q2 2013, the environmental impact assessment of the electricity project was approved by the Ministry of the Environment of Jordan. In Q2, additional geological surveys in the planned mining area were completed. The planned capacity of the Jordanian first oil shale power plant is 500 MW and its completion is planned to take place in 2017.
The preliminary development of the Jordanian oil project is expected to last until 2016. During the preliminary development phase, Eesti Energia will develop a part of the Attarat Um Ghudran mine. The area under research is estimated to contain 3.5 billion tonnes
8 of oil shale of which 0.9 billion tonnes represents measured resource
for developing electricity project. In first quarter 2013 a further market survey was conducted to assess the route to market for the potential products. Further technical studies were carried out to adapt Enefit technology more suitable for Jordanian oil shale. The next phase is conducting tests in the Enefit pilot plant.
Preliminary development of US electricity and oil production project
In March 2011, Eesti Energia acquired the oil shale resource in Uintah County, Utah (USA), estimated at 6.6 billion tonnes
9. In Utah, we continue to operate under the name of Enefit American Oil. We plan to use our oil
8 High reliability of 0.9 billion tonnes (reserves are part of explored geological reserves which have been determined using known technical,
environmental and socio-economic restrictions), forecast of 2.6 billion tonnes (reserves constitute the volume of underground oil shale of high economic potential determined on the basis of geological surveys, which have not taken into account potential restrictions limiting their use). 9 High reliability of 3.7 billion tonnes, reliable .2.5 billion tonnes, forecast of 0.4 billion tonnes (reserves constitute the volume of underground
oil shale of high economic potential determined on the basis of geological surveys, which have not taken into account potential restrictions limiting their use).
18 Interim Report 1 April – 30 June 2013
shale resources in Utah as a base to develop a liquid fuel industry with a capacity of 50,000 barrels of shale oil per day.
The Bureau of Land Management (BLM) Environmental Impact Statement (EIS) process is ongoing, and public scoping meetings were completed in July in Salt Lake City and Vernal, Utah. Although the first phase of our project is being developed on Enefit's private property, utilities (water, power, natural gas) and an oil pipeline must cross federal land, which requires an EIS analysis and coordination with several authorities. In addition, a prefeasibility engineering and cost study covering the entire project (including mining, retorting, upgrading, offsites and utilities, etc) to a +/-30% cost accuracy is ongoing with Fluor and expected to be completed by the end of the summer.
Financing
Eesti Energia’s credit ratings are at the investment grade level that allows the Group to access debt capital markets if needed. As at 30 June 2013, Eesti Energia’s credit rating was BBB+ with a stable outlook from Standard & Poor’s and Baa1 with a negative rating outlook from Moody’s.
Eesti Energia’s capital expenditure program drives the need for raising additional capital as well as the creation of a sufficient liquidity buffer. As at 30 June, the Group’s balance of liquid assets was 176.3 million euros (including deposits with maturities of more than three months and liquid financial assets).
As at the end of Q2 2013, Eesti Energia’s total borrowings in nominal value amounted to 744.2 million euros (unchanged from the end of Q1 2013). The borrowings amounted to 732.9 million euros (+0.05%, +0.4 million euros), using the amortised cost method. The significant borrowings of the Group included:
• Eurobonds listed on the London Stock Exchange in the nominal value of 600 million euros.
• Loans received from the European Investment Bank accounted for 144.2 million euros of borrowings in nominal value.
The Group’s undrawn loans amounted to 395 million euros at the end of Q2 2013:
• In December 2011, we signed a loan agreement for 95 million euros with the European Investment Bank with the deadline for drawing in December 2013.
• Liquidity loan contracts signed with regional banks totalled 300 million euros that had not been drawn by the end of Q2.
As at 30 June, the weighted average interest rate of the Group’s borrowings was 4.12%, which was unchanged from the end of first quarter 2013. The weighted average rate of borrowings with fixed interest rates was 4.16% and that for borrowings with floating interest rates was 0.79% (including the base rate). Borrowings with fixed interest rate made up 99% of the total Group’s debt as at the end of the Q2. All borrowings are denominated in euros.
As at 30 June 2013, the equity of Eesti Energia amounted to 1,430 million euros. 100% of the shares of Eesti Energia are owned by the Republic of Estonia.
As at 30 June, the Group’s net debt was 556 million euros. Level of net debt decreased by 14 million euros over the course of the second quarter, bringing the ratio of EBITDA to net debt to 2.0 (2.1 at the end of Q1 2013).. The financial leverage reached 39% at the end of Q2, a decline of 3 percentage points as compared to the previous quarter. According to its loan agreements, Eesti Energia is bound to comply with certain financial covenants. As at the end of Q2, the Group complied with these financial covenants.
19 Interim Report 1 April – 30 June 2013
Outlook for 2013
Eesti Energia Group’s performance in the first half of the year indicated the revenue increase by 24.6% to 494 million euros compared to the same period last year. At the same time the group earned 145.3 million euros of EBITDA, which is 4.4% less than in the first 6 months of 2012. Last year’s results were supported by the sale of Televõrgu AS in the first quarter of 2012.
Group revenues and EBITDA for 2013 are expected to increase compared to FY2012. While expected oil production from Enefit280 has been reduced due to delays, Group electricity generation and sales volumes are expected to increase by more than previously envisaged.
Eesti Energia has sold forward 4.2 TWh of power for the second half of 2013 (at the average price of 44.6 €/MWh) and has also hedged 66 thousand tonnes of shale oil production (at the average price of 465 €/ton). Group´s CO2 emissions exposure for the whole 2013 has been hedged via forward purchases for 12.2 million tonnes (at the average price of 8.4 €/ton).
20 Interim Report 1 April – 30 June 2013
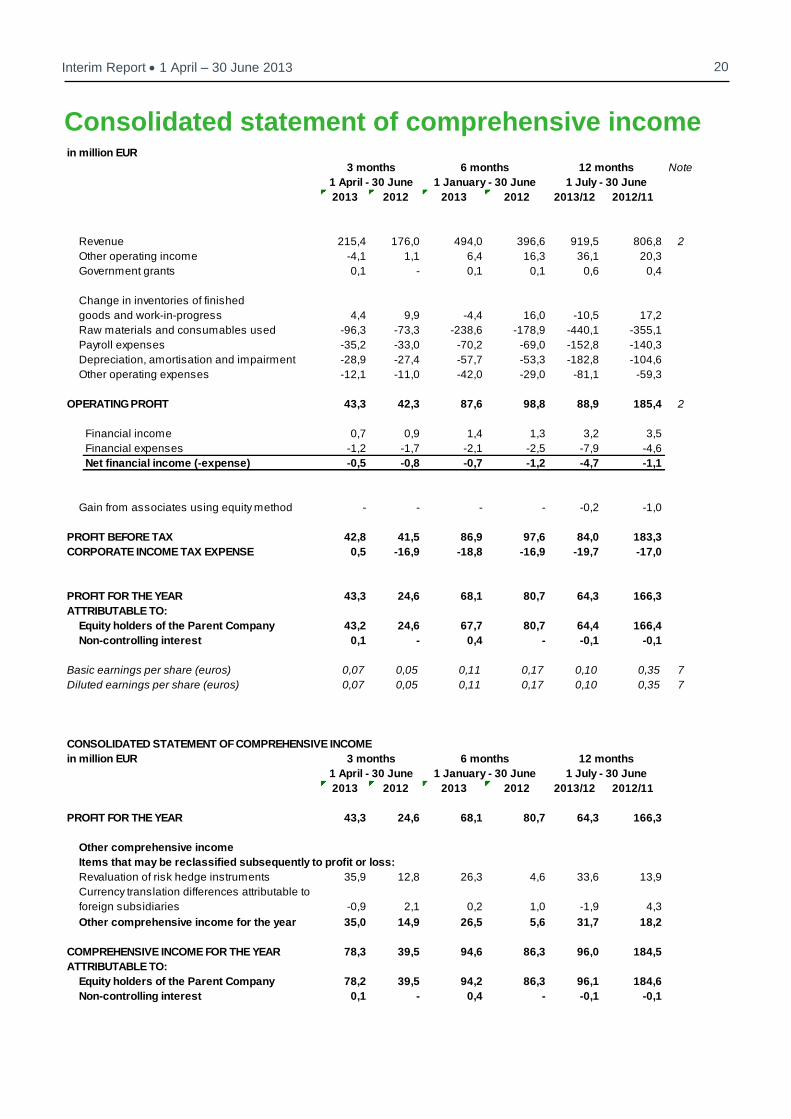
Consolidated statement of comprehensive income
in million EUR
Note
2013 2012 2013 2012 2013/12 2012/11
Revenue 215,4 176,0 494,0 396,6 919,5 806,8 2
Other operating income -4,1 1,1 6,4 16,3 36,1 20,3
Government grants 0,1 - 0,1 0,1 0,6 0,4
Change in inventories of finished
goods and work-in-progress 4,4 9,9 -4,4 16,0 -10,5 17,2
Raw materials and consumables used -96,3 -73,3 -238,6 -178,9 -440,1 -355,1
Payroll expenses -35,2 -33,0 -70,2 -69,0 -152,8 -140,3
Depreciation, amortisation and impairment -28,9 -27,4 -57,7 -53,3 -182,8 -104,6
Other operating expenses -12,1 -11,0 -42,0 -29,0 -81,1 -59,3
OPERATING PROFIT 43,3 42,3 87,6 98,8 88,9 185,4 2
Financial income 0,7 0,9 1,4 1,3 3,2 3,5
Financial expenses -1,2 -1,7 -2,1 -2,5 -7,9 -4,6
Net financial income (-expense) -0,5 -0,8 -0,7 -1,2 -4,7 -1,1
Gain from associates using equity method - - - - -0,2 -1,0
PROFIT BEFORE TAX 42,8 41,5 86,9 97,6 84,0 183,3
CORPORATE INCOME TAX EXPENSE 0,5 -16,9 -18,8 -16,9 -19,7 -17,0
PROFIT FOR THE YEAR 43,3 24,6 68,1 80,7 64,3 166,3
ATTRIBUTABLE TO:
Equity holders of the Parent Company 43,2 24,6 67,7 80,7 64,4 166,4
Non-controlling interest 0,1 - 0,4 - -0,1 -0,1
Basic earnings per share (euros) 0,07 0,05 0,11 0,17 0,10 0,35 7
Diluted earnings per share (euros) 0,07 0,05 0,11 0,17 0,10 0,35 7
CONSOLIDATED STATEMENT OF COMPREHENSIVE INCOME
in million EUR
2013 2012 2013 2012 2013/12 2012/11
PROFIT FOR THE YEAR 43,3 24,6 68,1 80,7 64,3 166,3
Other comprehensive income
Items that may be reclassified subsequently to profit or loss:
Revaluation of risk hedge instruments 35,9 12,8 26,3 4,6 33,6 13,9
Currency translation differences attributable to
foreign subsidiaries -0,9 2,1 0,2 1,0 -1,9 4,3
Other comprehensive income for the year 35,0 14,9 26,5 5,6 31,7 18,2
COMPREHENSIVE INCOME FOR THE YEAR 78,3 39,5 94,6 86,3 96,0 184,5
ATTRIBUTABLE TO:
Equity holders of the Parent Company 78,2 39,5 94,2 86,3 96,1 184,6
Non-controlling interest 0,1 - 0,4 - -0,1 -0,1
12 months3 months
1 July - 30 June1 April - 30 June
1 July - 30 June
12 months3 months
1 April - 30 June
6 months
1 January - 30 June
6 months
1 January - 30 June
21 Interim Report 1 April – 30 June 2013
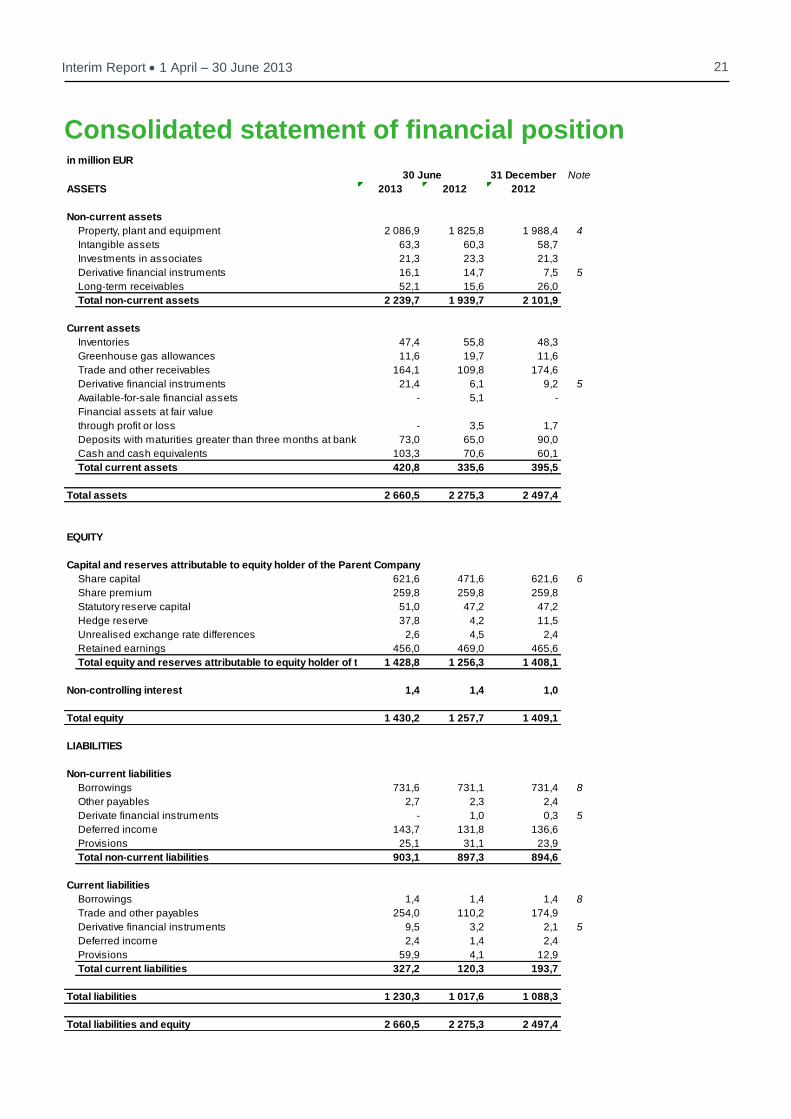
Consolidated statement of financial position
in million EUR
31 December Note
ASSETS 2013 2012 2012
Non-current assets
Property, plant and equipment 2 086,9 1 825,8 1 988,4 4
Intangible assets 63,3 60,3 58,7
Investments in associates 21,3 23,3 21,3
Derivative financial instruments 16,1 14,7 7,5 5
Long-term receivables 52,1 15,6 26,0
Total non-current assets 2 239,7 1 939,7 2 101,9
Current assets
Inventories 47,4 55,8 48,3
Greenhouse gas allowances 11,6 19,7 11,6
Trade and other receivables 164,1 109,8 174,6
Derivative financial instruments 21,4 6,1 9,2 5
Available-for-sale financial assets - 5,1 -
Financial assets at fair value
through profit or loss - 3,5 1,7
Deposits with maturities greater than three months at banks 73,0 65,0 90,0
Cash and cash equivalents 103,3 70,6 60,1
Total current assets 420,8 335,6 395,5
Total assets 2 660,5 2 275,3 2 497,4
EQUITY
Capital and reserves attributable to equity holder of the Parent Company
Share capital 621,6 471,6 621,6 6
Share premium 259,8 259,8 259,8
Statutory reserve capital 51,0 47,2 47,2
Hedge reserve 37,8 4,2 11,5
Unrealised exchange rate differences 2,6 4,5 2,4
Retained earnings 456,0 469,0 465,6
Total equity and reserves attributable to equity holder of the Parent Company1 428,8 1 256,3 1 408,1
Non-controlling interest 1,4 1,4 1,0
Total equity 1 430,2 1 257,7 1 409,1
LIABILITIES
Non-current liabilities
Borrowings 731,6 731,1 731,4 8
Other payables 2,7 2,3 2,4
Derivate financial instruments - 1,0 0,3 5
Deferred income 143,7 131,8 136,6
Provisions 25,1 31,1 23,9
Total non-current liabilities 903,1 897,3 894,6
Current liabilities
Borrowings 1,4 1,4 1,4 8
Trade and other payables 254,0 110,2 174,9
Derivative financial instruments 9,5 3,2 2,1 5
Deferred income 2,4 1,4 2,4
Provisions 59,9 4,1 12,9
Total current liabilities 327,2 120,3 193,7
Total liabilities 1 230,3 1 017,6 1 088,3
Total liabilities and equity 2 660,5 2 275,3 2 497,4
30 June
22 Interim Report 1 April – 30 June 2013
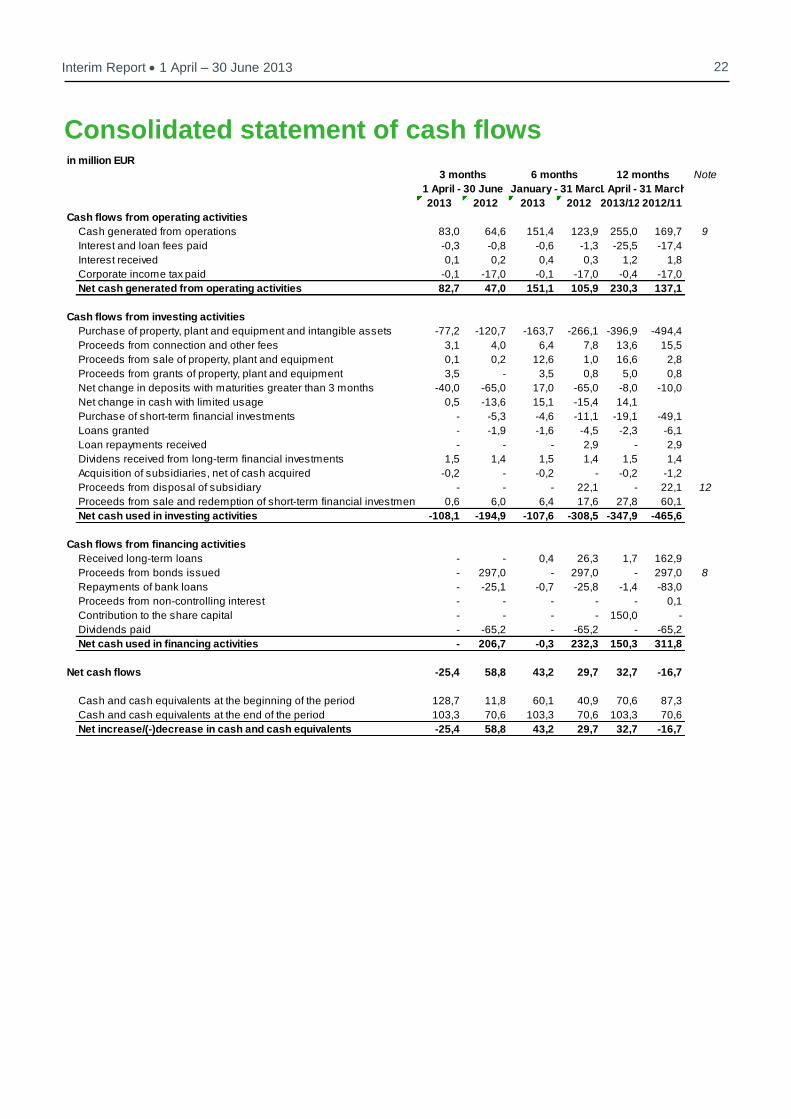
Consolidated statement of cash flows
in million EUR
Note
2013 2012 2013 2012 2013/12 2012/11
Cash flows from operating activities
Cash generated from operations 83,0 64,6 151,4 123,9 255,0 169,7 9
Interest and loan fees paid -0,3 -0,8 -0,6 -1,3 -25,5 -17,4
Interest received 0,1 0,2 0,4 0,3 1,2 1,8
Corporate income tax paid -0,1 -17,0 -0,1 -17,0 -0,4 -17,0
Net cash generated from operating activities 82,7 47,0 151,1 105,9 230,3 137,1
Cash flows from investing activities
Purchase of property, plant and equipment and intangible assets -77,2 -120,7 -163,7 -266,1 -396,9 -494,4
Proceeds from connection and other fees 3,1 4,0 6,4 7,8 13,6 15,5
Proceeds from sale of property, plant and equipment 0,1 0,2 12,6 1,0 16,6 2,8
Proceeds from grants of property, plant and equipment 3,5 - 3,5 0,8 5,0 0,8
Net change in deposits with maturities greater than 3 months -40,0 -65,0 17,0 -65,0 -8,0 -10,0
Net change in cash with limited usage 0,5 -13,6 15,1 -15,4 14,1
Purchase of short-term financial investments - -5,3 -4,6 -11,1 -19,1 -49,1
Loans granted - -1,9 -1,6 -4,5 -2,3 -6,1
Loan repayments received - - - 2,9 - 2,9
Dividens received from long-term financial investments 1,5 1,4 1,5 1,4 1,5 1,4
Acquisition of subsidiaries, net of cash acquired -0,2 - -0,2 - -0,2 -1,2
Proceeds from disposal of subsidiary - - - 22,1 - 22,1 12
Proceeds from sale and redemption of short-term financial investments 0,6 6,0 6,4 17,6 27,8 60,1
Net cash used in investing activities -108,1 -194,9 -107,6 -308,5 -347,9 -465,6
Cash flows from financing activities
Received long-term loans - - 0,4 26,3 1,7 162,9
Proceeds from bonds issued - 297,0 - 297,0 - 297,0 8
Repayments of bank loans - -25,1 -0,7 -25,8 -1,4 -83,0
Proceeds from non-controlling interest - - - - - 0,1
Contribution to the share capital - - - - 150,0 -
Dividends paid - -65,2 - -65,2 - -65,2
Net cash used in financing activities - 206,7 -0,3 232,3 150,3 311,8
Net cash flows -25,4 58,8 43,2 29,7 32,7 -16,7
Cash and cash equivalents at the beginning of the period 128,7 11,8 60,1 40,9 70,6 87,3
Cash and cash equivalents at the end of the period 103,3 70,6 103,3 70,6 103,3 70,6
Net increase/(-)decrease in cash and cash equivalents -25,4 58,8 43,2 29,7 32,7 -16,7
6 months
1 January - 31 March
12 months
1 April - 31 March
3 months
1 April - 30 June
23 Interim Report 1 April – 30 June 2013
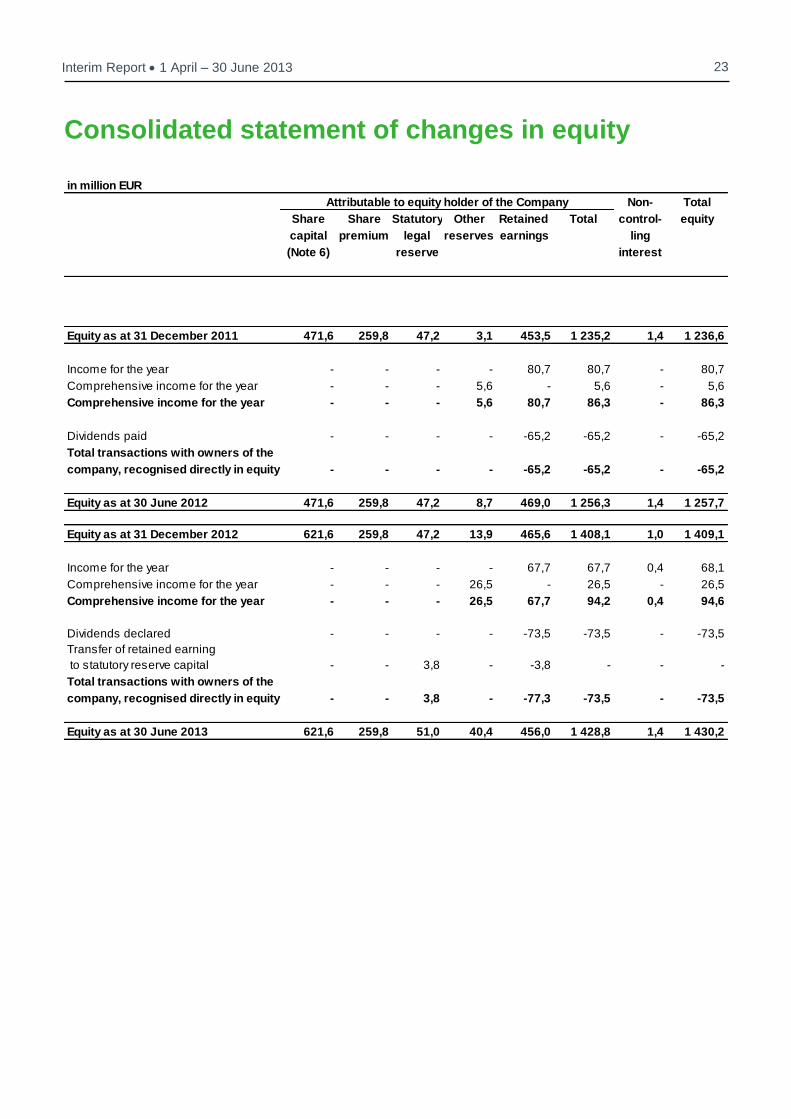
Consolidated statement of changes in equity
in million EUR
Non- Total
Share Share Statutory Other Retained Total control- equity
capital premium legal reserves earnings ling
(Note 6) reserve interest
Equity as at 31 December 2011 471,6 259,8 47,2 3,1 453,5 1 235,2 1,4 1 236,6
Income for the year - - - - 80,7 80,7 - 80,7
Comprehensive income for the year - - - 5,6 - 5,6 - 5,6
Comprehensive income for the year - - - 5,6 80,7 86,3 - 86,3
Dividends paid - - - - -65,2 -65,2 - -65,2
Total transactions with owners of the
company, recognised directly in equity - - - - -65,2 -65,2 - -65,2
Equity as at 30 June 2012 471,6 259,8 47,2 8,7 469,0 1 256,3 1,4 1 257,7
Equity as at 31 December 2012 621,6 259,8 47,2 13,9 465,6 1 408,1 1,0 1 409,1
Income for the year - - - - 67,7 67,7 0,4 68,1
Comprehensive income for the year - - - 26,5 - 26,5 - 26,5
Comprehensive income for the year - - - 26,5 67,7 94,2 0,4 94,6
Dividends declared - - - - -73,5 -73,5 - -73,5
Transfer of retained earning
to statutory reserve capital - - 3,8 - -3,8 - - -
Total transactions with owners of the
company, recognised directly in equity - - 3,8 - -77,3 -73,5 - -73,5
Equity as at 30 June 2013 621,6 259,8 51,0 40,4 456,0 1 428,8 1,4 1 430,2
Attributable to equity holder of the Company

Notes to the financial statements 1 Accounting policies
This consolidated interim report has been prepared in accordance with International Financial Reporting
Standards (IFRS) and International Financial Reporting Interpretations Committee (IFRIC) interpretations as adopted by
the European Union. These consolidated interim condensed financial statements are prepared in accordance with IAS 34
"Interim Financial Reporting".
Accounting policies and presentation of financial statements applied to this interim report were identical
to those used in financial statements for the financial year that ended on 31 December 2012, except segment reporting
and presentation of the statement of comprehensive income. Presentation of the statement of comprehensive income has
been changed according to amendment of International Financial Reporting Standards IAS 1 - Presentation of Items of Other
Comprehensive Income, that became mandatory for the Group from 1 January 2013. The amendment does not have any
impact on measurement of transactions and balances. Changes of presentation of segment reporting are described in Note 2.
Other new International Financial Reporting Standards adopted, amendments to and International Financial Reporting
Interpretations Committee interpretations that became mandatory for the Group from 1 January 2013 did not have any impact
to the Group's accounting policies and financial statements.
According to the Management Board the Interim Report prepared for the period 1 January 2013 - 30 June 2013 presents
a true and fair view of the financial position, the cash flows and the results of operations of Eesti Energia AS and
its subsidiaries (Group).
The information contained in the Interim Financial Statements has not been audited.
25 Interim Report 1 April – 30 June 2013
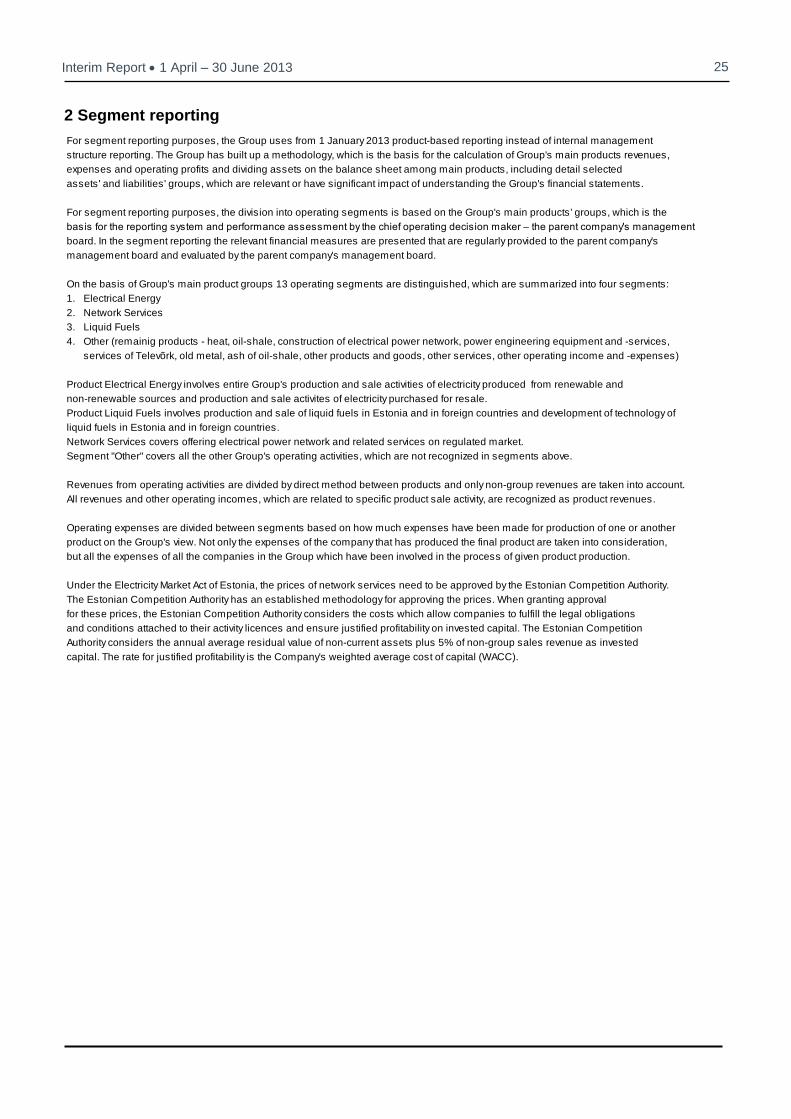
2 Segment reporting
For segment reporting purposes, the Group uses from 1 January 2013 product-based reporting instead of internal management
structure reporting. The Group has built up a methodology, which is the basis for the calculation of Group's main products revenues,
expenses and operating profits and dividing assets on the balance sheet among main products, including detail selected
assets' and liabilities' groups, which are relevant or have significant impact of understanding the Group's financial statements.
For segment reporting purposes, the division into operating segments is based on the Group's main products' groups, which is the
basis for the reporting system and performance assessment by the chief operating decision maker – the parent company's management
board. In the segment reporting the relevant financial measures are presented that are regularly provided to the parent company's
management board and evaluated by the parent company's management board.
On the basis of Group's main product groups 13 operating segments are distinguished, which are summarized into four segments:
1. Electrical Energy
2. Network Services
3. Liquid Fuels
4. Other (remainig products - heat, oil-shale, construction of electrical power network, power engineering equipment and -services,
services of Televõrk, old metal, ash of oil-shale, other products and goods, other services, other operating income and -expenses)
Product Electrical Energy involves entire Group's production and sale activities of electricity produced from renewable and
non-renewable sources and production and sale activites of electricity purchased for resale.
Product Liquid Fuels involves production and sale of liquid fuels in Estonia and in foreign countries and development of technology of
liquid fuels in Estonia and in foreign countries.
Network Services covers offering electrical power network and related services on regulated market.
Segment "Other" covers all the other Group's operating activities, which are not recognized in segments above.
Revenues from operating activities are divided by direct method between products and only non-group revenues are taken into account.
All revenues and other operating incomes, which are related to specific product sale activity, are recognized as product revenues.
Operating expenses are divided between segments based on how much expenses have been made for production of one or another
product on the Group's view. Not only the expenses of the company that has produced the final product are taken into consideration,
but all the expenses of all the companies in the Group which have been involved in the process of given product production.
Under the Electricity Market Act of Estonia, the prices of network services need to be approved by the Estonian Competition Authority.
The Estonian Competition Authority has an established methodology for approving the prices. When granting approval
for these prices, the Estonian Competition Authority considers the costs which allow companies to fulfill the legal obligations
and conditions attached to their activity licences and ensure justified profitability on invested capital. The Estonian Competition
Authority considers the annual average residual value of non-current assets plus 5% of non-group sales revenue as invested
capital. The rate for justified profitability is the Company's weighted average cost of capital (WACC).
26 Interim Report 1 April – 30 June 2013
3 Seasonality of operating profit
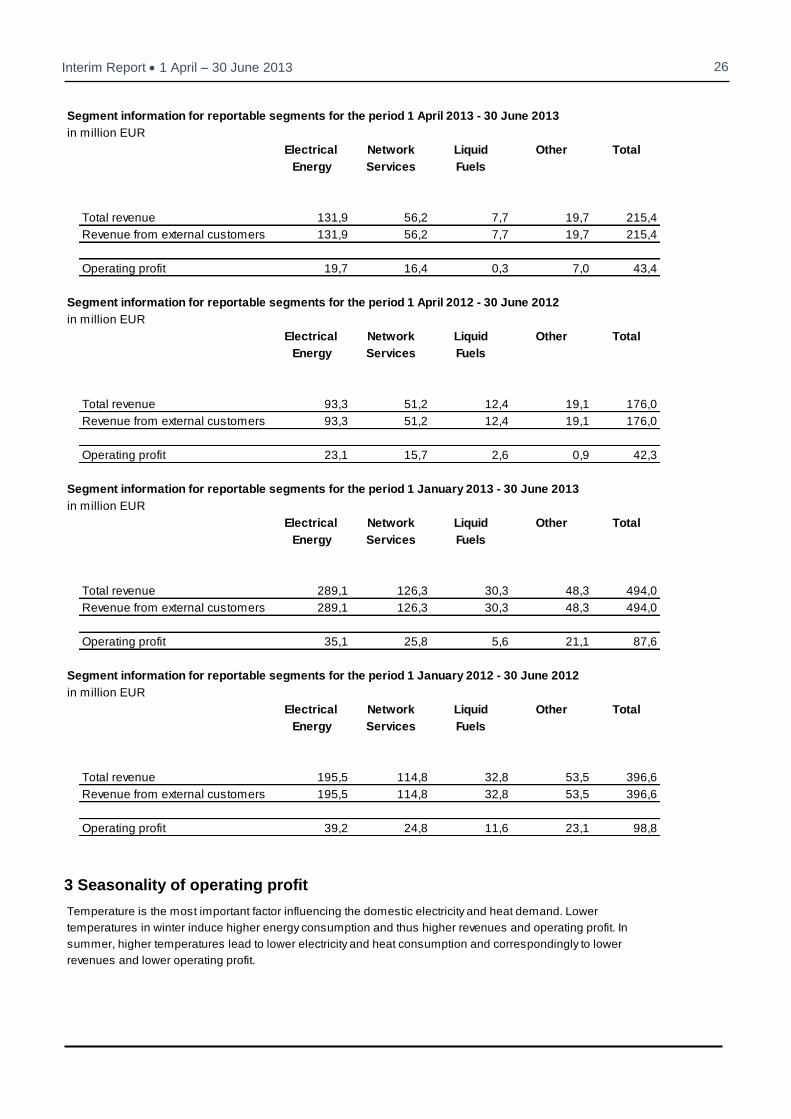
Segment information for reportable segments for the period 1 April 2013 - 30 June 2013
in million EUR
Electrical Network Liquid Other Total
Energy Services Fuels
Total revenue 131,9 56,2 7,7 19,7 215,4
Revenue from external customers 131,9 56,2 7,7 19,7 215,4
Operating profit 19,7 16,4 0,3 7,0 43,4
Segment information for reportable segments for the period 1 April 2012 - 30 June 2012
in million EUR
Electrical Network Liquid Other Total
Energy Services Fuels
Total revenue 93,3 51,2 12,4 19,1 176,0
Revenue from external customers 93,3 51,2 12,4 19,1 176,0
Operating profit 23,1 15,7 2,6 0,9 42,3
Segment information for reportable segments for the period 1 January 2013 - 30 June 2013
in million EUR
Electrical Network Liquid Other Total
Energy Services Fuels
Total revenue 289,1 126,3 30,3 48,3 494,0
Revenue from external customers 289,1 126,3 30,3 48,3 494,0
Operating profit 35,1 25,8 5,6 21,1 87,6
Segment information for reportable segments for the period 1 January 2012 - 30 June 2012
in million EUR
Electrical Network Liquid Other Total
Energy Services Fuels
Total revenue 195,5 114,8 32,8 53,5 396,6
Revenue from external customers 195,5 114,8 32,8 53,5 396,6
Operating profit 39,2 24,8 11,6 23,1 98,8
Temperature is the most important factor influencing the domestic electricity and heat demand. Lower
temperatures in winter induce higher energy consumption and thus higher revenues and operating profit. In
summer, higher temperatures lead to lower electricity and heat consumption and correspondingly to lower
revenues and lower operating profit.
27 Interim Report 1 April – 30 June 2013
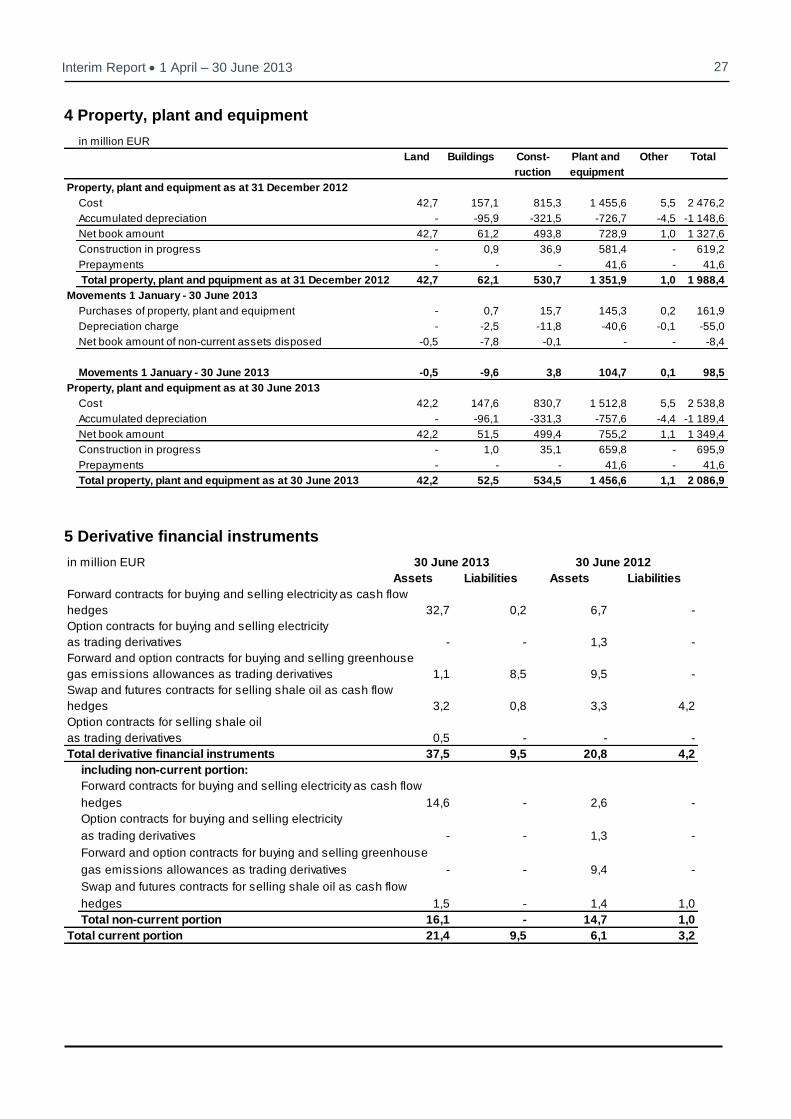
4 Property, plant and equipment
5 Derivative financial instruments
in million EUR
Land Buildings Const- Plant and Other Total
ruction equipment
Property, plant and equipment as at 31 December 2012
Cost 42,7 157,1 815,3 1 455,6 5,5 2 476,2
Accumulated depreciation - -95,9 -321,5 -726,7 -4,5 -1 148,6
Net book amount 42,7 61,2 493,8 728,9 1,0 1 327,6
Construction in progress - 0,9 36,9 581,4 - 619,2
Prepayments - - - 41,6 - 41,6
Total property, plant and pquipment as at 31 December 2012 42,7 62,1 530,7 1 351,9 1,0 1 988,4
Movements 1 January - 30 June 2013
Purchases of property, plant and equipment - 0,7 15,7 145,3 0,2 161,9
Depreciation charge - -2,5 -11,8 -40,6 -0,1 -55,0
Net book amount of non-current assets disposed -0,5 -7,8 -0,1 - - -8,4
Movements 1 January - 30 June 2013 -0,5 -9,6 3,8 104,7 0,1 98,5
Property, plant and equipment as at 30 June 2013
Cost 42,2 147,6 830,7 1 512,8 5,5 2 538,8
Accumulated depreciation - -96,1 -331,3 -757,6 -4,4 -1 189,4
Net book amount 42,2 51,5 499,4 755,2 1,1 1 349,4
Construction in progress - 1,0 35,1 659,8 - 695,9
Prepayments - - - 41,6 - 41,6
Total property, plant and equipment as at 30 June 2013 42,2 52,5 534,5 1 456,6 1,1 2 086,9
in million EUR
Assets Liabilities Assets Liabilities
Forward contracts for buying and selling electricity as cash flow
hedges 32,7 0,2 6,7 -
Option contracts for buying and selling electricity
as trading derivatives - - 1,3 -
Forward and option contracts for buying and selling greenhouse
gas emissions allowances as trading derivatives 1,1 8,5 9,5 -
Swap and futures contracts for selling shale oil as cash flow
hedges 3,2 0,8 3,3 4,2
Option contracts for selling shale oil
as trading derivatives 0,5 - - -
Total derivative financial instruments 37,5 9,5 20,8 4,2
including non-current portion:
Forward contracts for buying and selling electricity as cash flow
hedges 14,6 - 2,6 -
Option contracts for buying and selling electricity
as trading derivatives - - 1,3 -
Forward and option contracts for buying and selling greenhouse
gas emissions allowances as trading derivatives - - 9,4 -
Swap and futures contracts for selling shale oil as cash flow
hedges 1,5 - 1,4 1,0
Total non-current portion 16,1 - 14,7 1,0
Total current portion 21,4 9,5 6,1 3,2
30 June 2013 30 June 2012
28 Interim Report 1 April – 30 June 2013
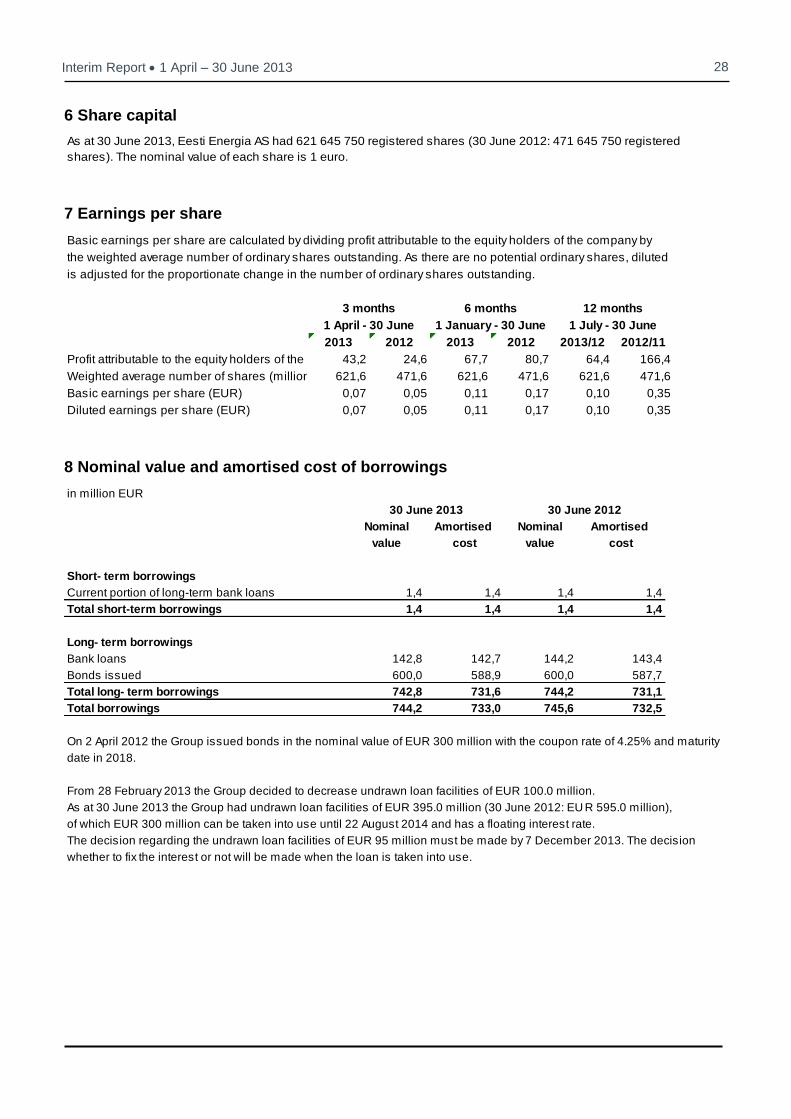
6 Share capital
7 Earnings per share
8 Nominal value and amortised cost of borrowings
As at 30 June 2013, Eesti Energia AS had 621 645 750 registered shares (30 June 2012: 471 645 750 registered
shares). The nominal value of each share is 1 euro.
Basic earnings per share are calculated by dividing profit attributable to the equity holders of the company by
the weighted average number of ordinary shares outstanding. As there are no potential ordinary shares, diluted
is adjusted for the proportionate change in the number of ordinary shares outstanding.
2013 2012 2013 2012 2013/12 2012/11
Profit attributable to the equity holders of the company (million EUR)43,2 24,6 67,7 80,7 64,4 166,4
Weighted average number of shares (million) 621,6 471,6 621,6 471,6 621,6 471,6
Basic earnings per share (EUR) 0,07 0,05 0,11 0,17 0,10 0,35
Diluted earnings per share (EUR) 0,07 0,05 0,11 0,17 0,10 0,35
12 months
1 July - 30 June
3 months
1 April - 30 June
6 months
1 January - 30 June
in million EUR
Nominal Amortised Nominal Amortised
value cost value cost
Short- term borrowings
Current portion of long-term bank loans 1,4 1,4 1,4 1,4
Total short-term borrowings 1,4 1,4 1,4 1,4
Long- term borrowings
Bank loans 142,8 142,7 144,2 143,4
Bonds issued 600,0 588,9 600,0 587,7
Total long- term borrowings 742,8 731,6 744,2 731,1
Total borrowings 744,2 733,0 745,6 732,5
On 2 April 2012 the Group issued bonds in the nominal value of EUR 300 million with the coupon rate of 4.25% and maturity
date in 2018.
From 28 February 2013 the Group decided to decrease undrawn loan facilities of EUR 100.0 million.
As at 30 June 2013 the Group had undrawn loan facilities of EUR 395.0 million (30 June 2012: EU R 595.0 million),
of which EUR 300 million can be taken into use until 22 August 2014 and has a floating interest rate.
The decision regarding the undrawn loan facilities of EUR 95 million must be made by 7 December 2013. The decision
whether to fix the interest or not will be made when the loan is taken into use.
30 June 2013 30 June 2012
29 Interim Report 1 April – 30 June 2013
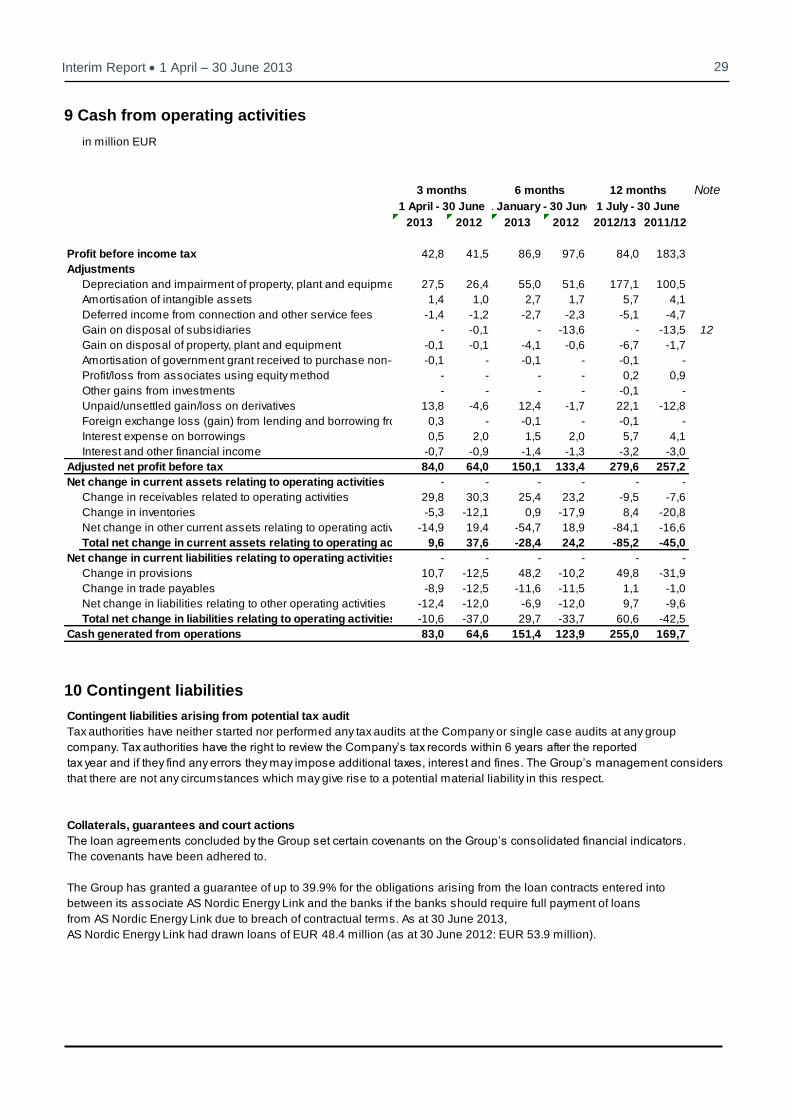
9 Cash from operating activities
10 Contingent liabilities
in million EUR
Note
2013 2012 2013 2012 2012/13 2011/12
Profit before income tax 42,8 41,5 86,9 97,6 84,0 183,3
Adjustments
Depreciation and impairment of property, plant and equipment 27,5 26,4 55,0 51,6 177,1 100,5
Amortisation of intangible assets 1,4 1,0 2,7 1,7 5,7 4,1
Deferred income from connection and other service fees -1,4 -1,2 -2,7 -2,3 -5,1 -4,7
Gain on disposal of subsidiaries - -0,1 - -13,6 - -13,5 12
Gain on disposal of property, plant and equipment -0,1 -0,1 -4,1 -0,6 -6,7 -1,7
Amortisation of government grant received to purchase non-current assets -0,1 - -0,1 - -0,1 -
Profit/loss from associates using equity method - - - - 0,2 0,9
Other gains from investments - - - - -0,1 -
Unpaid/unsettled gain/loss on derivatives 13,8 -4,6 12,4 -1,7 22,1 -12,8
Foreign exchange loss (gain) from lending and borrowing from foreign currency0,3 - -0,1 - -0,1 -
Interest expense on borrowings 0,5 2,0 1,5 2,0 5,7 4,1
Interest and other financial income -0,7 -0,9 -1,4 -1,3 -3,2 -3,0
Adjusted net profit before tax 84,0 64,0 150,1 133,4 279,6 257,2
Net change in current assets relating to operating activities - - - - - -
Change in receivables related to operating activities 29,8 30,3 25,4 23,2 -9,5 -7,6
Change in inventories -5,3 -12,1 0,9 -17,9 8,4 -20,8
Net change in other current assets relating to operating activities -14,9 19,4 -54,7 18,9 -84,1 -16,6
Total net change in current assets relating to operating activities9,6 37,6 -28,4 24,2 -85,2 -45,0
Net change in current liabilities relating to operating activities - - - - - -
Change in provisions 10,7 -12,5 48,2 -10,2 49,8 -31,9
Change in trade payables -8,9 -12,5 -11,6 -11,5 1,1 -1,0
Net change in liabilities relating to other operating activities -12,4 -12,0 -6,9 -12,0 9,7 -9,6
Total net change in liabilities relating to operating activities -10,6 -37,0 29,7 -33,7 60,6 -42,5
Cash generated from operations 83,0 64,6 151,4 123,9 255,0 169,7
1 April - 30 June 1 January - 30 June 1 July - 30 June
3 months 6 months 12 months
Contingent liabilities arising from potential tax audit
Tax authorities have neither started nor performed any tax audits at the Company or single case audits at any group
company. Tax authorities have the right to review the Company’s tax records within 6 years after the reported
tax year and if they find any errors they may impose additional taxes, interest and fines. The Group’s management considers
that there are not any circumstances which may give rise to a potential material liability in this respect.
Collaterals, guarantees and court actions
The loan agreements concluded by the Group set certain covenants on the Group’s consolidated financial indicators.
The covenants have been adhered to.
The Group has granted a guarantee of up to 39.9% for the obligations arising from the loan contracts entered into
between its associate AS Nordic Energy Link and the banks if the banks should require full payment of loans
from AS Nordic Energy Link due to breach of contractual terms. As at 30 June 2013,
AS Nordic Energy Link had drawn loans of EUR 48.4 million (as at 30 June 2012: EUR 53.9 million).
30 Interim Report 1 April – 30 June 2013
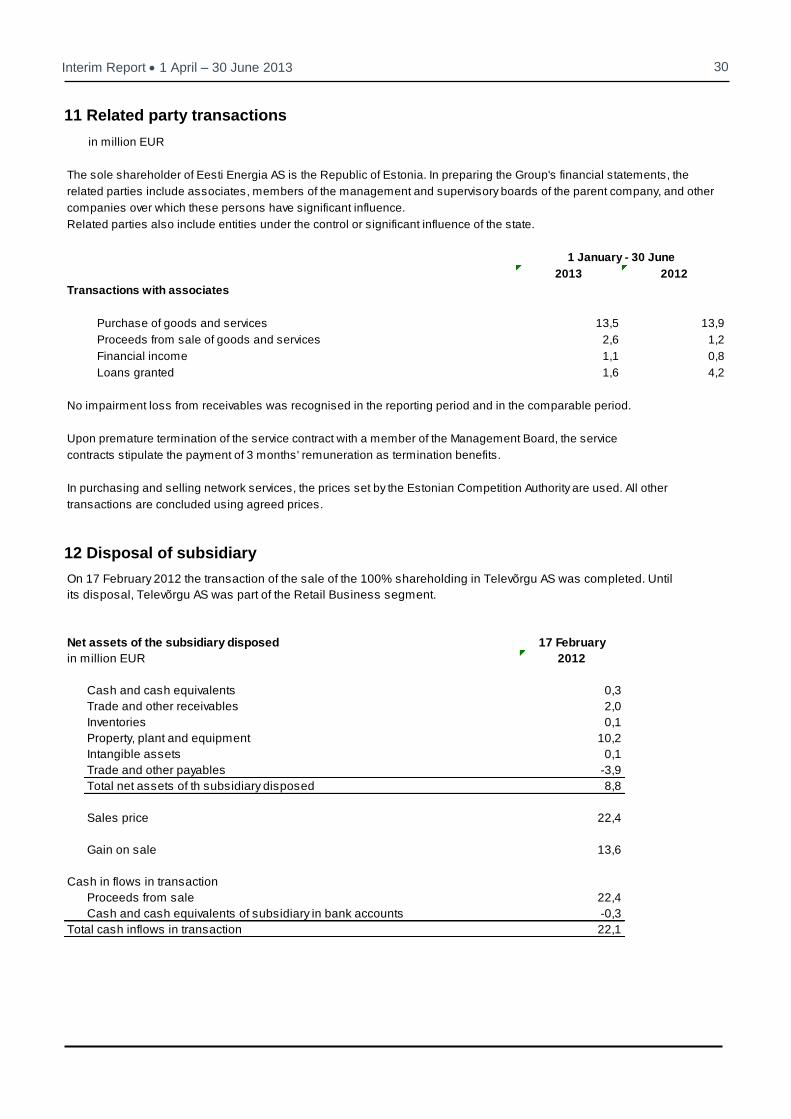
11 Related party transactions
12 Disposal of subsidiary
in million EUR
The sole shareholder of Eesti Energia AS is the Republic of Estonia. In preparing the Group's financial statements, the
related parties include associates, members of the management and supervisory boards of the parent company, and other
companies over which these persons have significant influence.
Related parties also include entities under the control or significant influence of the state.
2013 2012
Transactions with associates
Purchase of goods and services 13,5 13,9
Proceeds from sale of goods and services 2,6 1,2
Financial income 1,1 0,8
Loans granted 1,6 4,2
No impairment loss from receivables was recognised in the reporting period and in the comparable period.
Upon premature termination of the service contract with a member of the Management Board, the service
contracts stipulate the payment of 3 months' remuneration as termination benefits.
In purchasing and selling network services, the prices set by the Estonian Competition Authority are used. All other
transactions are concluded using agreed prices.
1 January - 30 June
On 17 February 2012 the transaction of the sale of the 100% shareholding in Televõrgu AS was completed. Until
its disposal, Televõrgu AS was part of the Retail Business segment.
Net assets of the subsidiary disposed 17 February
in million EUR 2012
Cash and cash equivalents 0,3
Trade and other receivables 2,0
Inventories 0,1
Property, plant and equipment 10,2
Intangible assets 0,1
Trade and other payables -3,9
Total net assets of th subsidiary disposed 8,8
Sales price 22,4
Gain on sale 13,6
Cash in flows in transaction
Proceeds from sale 22,4
Cash and cash equivalents of subsidiary in bank accounts -0,3
Total cash inflows in transaction 22,1
31 Interim Report 1 April – 30 June 2013
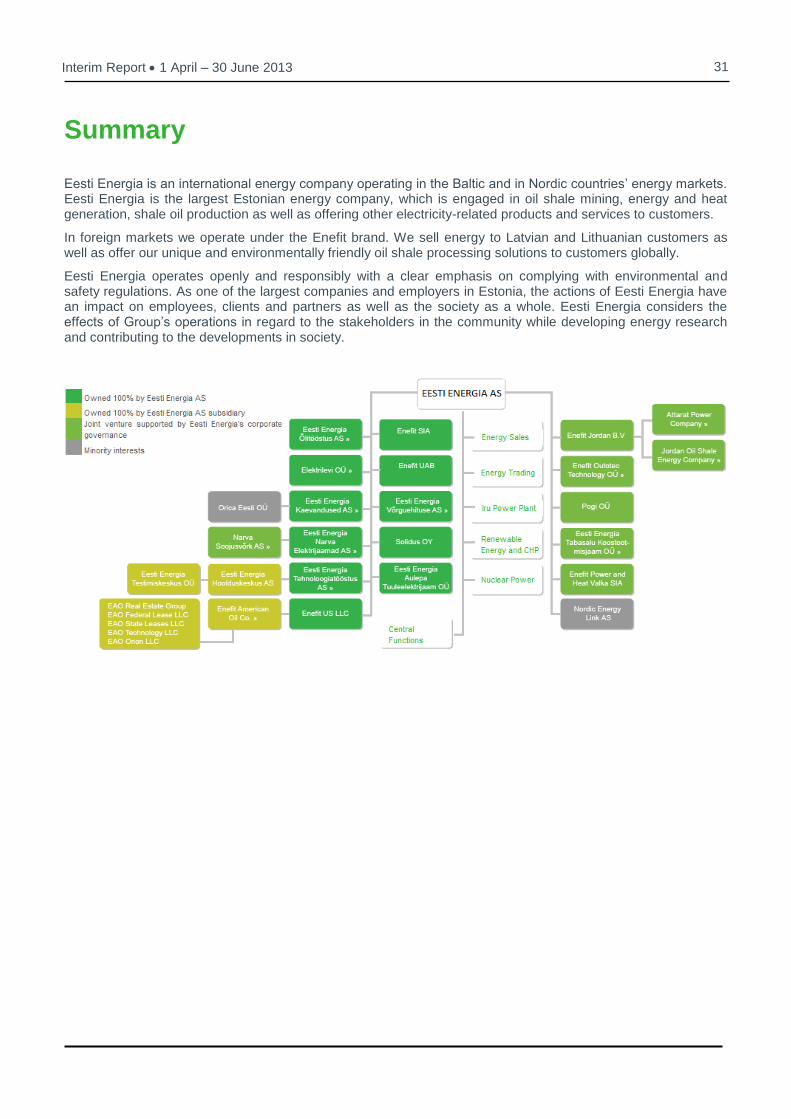
Summary
Eesti Energia is an international energy company operating in the Baltic and in Nordic countries’ energy markets. Eesti Energia is the largest Estonian energy company, which is engaged in oil shale mining, energy and heat generation, shale oil production as well as offering other electricity-related products and services to customers.
In foreign markets we operate under the Enefit brand. We sell energy to Latvian and Lithuanian customers as well as offer our unique and environmentally friendly oil shale processing solutions to customers globally.
Eesti Energia operates openly and responsibly with a clear emphasis on complying with environmental and safety regulations. As one of the largest companies and employers in Estonia, the actions of Eesti Energia have an impact on employees, clients and partners as well as the society as a whole. Eesti Energia considers the effects of Group’s operations in regard to the stakeholders in the community while developing energy research and contributing to the developments in society.
![ChallengeofRetinoblastomainMexicoin2020:Perspectives … · 2020. 3. 25. · Rb, including India, with a survival rate of 75.2–92% and Taiwanwith80.9%[3,4].InMexico,mortalityratesrangefrom](https://img.pdfslide.us/doc/110x75/609e50e7cd8ac65af25e81b1/challengeofretinoblastomainmexicoin2020perspectives-2020-3-25-rb-including.jpg)


![ResearchArticle ...vadodaradentalcare.com/MIcroimplants.pdf · TADs for orthodontic purposes [6–13]. According to these studies, the success rates have varied long between 75.2%](https://img.pdfslide.us/doc/110x75/5ed41d9298a08a5bd804d4f5/researcharticle-tads-for-orthodontic-purposes-6a13-according-to-these-studies.jpg)