Embed Size (px)
Citation preview

Interim Report 2nd Quarter 2013

2
Interim Report 2nd Quarter 2013
Quarterly highlights
• Project phase 1-4 completed
• Production build-up in progress.
• Second steam generator start-up.
• Production test of appraisal well 463 gives evidence of a promising future development area.
Crudecorp ASA is an independent and international E&P company engaged in the acquisition, development and operation of oil and natural gas properties. Currently, the Company owns a 90% interest in the Chico Martinez oilfield in California, and is in the process of developing the reservoir located in the Etchegoin sands of this field for production. The Company’s goal is to significantly increase recovery and to raise production rates of old, abandoned resources, through the use of the EOR techniques.
Quarterly financial highlights (Mill USD, unaudited)
* Provision of calculated reversal of previous loss on MTM (market to market) value on the Oil swap agreement related to the Credit Suisse facility.
** From Q4 12 the Company implemented a unit of production (UOP) depreciation profile on the field. This is in accordance with earlier communicated change in depreciation profile in accordance with
the increase in production. The UOP are based on the definition of 1P reserve estimate.
Health, safety and the environment No HSE incidents were reported in connection with operations
conducted by Crudecorp during the second quarter.
Management report • Sales volume was 41,130 bbls in Q2 2013, (26,803 bbls in Q1
2013).
• Production in Q2 2013 (40,768 bbls) showed an increase from Q1 2013 (26,235), mainly as a result of increased steam injection and production from additional wells. Steam injection averaged 6,551 BSPD in Q2 2013, versus 3,424 BSPD in Q1 2013.
• On 1 May, the second steam generator was put into service, effectively doubling the steam capacity of the Chico Martinez project. The Company was also allowed to use a higher steam injection pressure gradient from the same date, increasing to 1.1 psi/ft from 0.5 psi/ft. As a result, there was a noticeable increase in production in June with an average of 691 BOPD (versus 448 BOPD for the quarter).
• By end of Q2, all 44 production wells and all 27 steam injection wells had been hooked up. Some of the steam injection wells have not been operational long enough to initiate a continuous steam drive. It is estimated that approximately 50-55% of the wells are under continuous steam drive at the end of Q2.
• Steam capacity utilisation was around 77-78% in April and May. The utilisation reflects disruptions during commissioning of the second steam generator. In June, the utilisation has been above 90%, only disrupted by steam shut-ins to change to larger pump units on production wells.
• The Company are continuing environmental surveys and other work to progress the permitting process for a deeper Monterey well as well as for constructing a pipeline for water supply into the field.
Post 30.6.2013
• The Company drilled an appraisal well (well 463) late 2012, which encountered oil in a younger Etchegoin deposit on the East side of the current development. This well has been production tested and analysed. The well is believed to prove up a new area of reservoir with good oil saturation and good reservoir quality. The extent of this reservoir is still uncertain. In the first cyclic steam production test, the well showed a much higher productivity than the field average, returning a steam to oil ratio of 1.5-1.8. This is significantly better than the field average of SOR = 6-8.
• In July the Company drilled a new appraisal well (well 452) in an adjacent fault block to well 463, north east to the main field development. The well encountered several oil sands, of approximately 100 feet combined thickness. The well 452 has similar geological characteristics as well 463, but has not yet been production tested.
• The well 452 was drilled to 2,800 feet, and also encountered oil containing sands at a depth of 2,150 feet. This discovery provides proof of concept for a basal Etchegoin sand in the area. The presence and extent of such a reservoir will be developed in future studies.
Future plans and strategy• The Company has now hooked up all production and
injection wells, installed a second steam generator and utilised a higher steam injection gradient. The initial field
Q2-13 Q2-12 H1-13 H1-12
Oil sale (bbls) 41,130 4,450 67,933 8,743Revenues 2.946 0.328 4.959 0.662Operating costs -2.746 -1.695 -4.696 -2.652Other income/expenses* 3.465 0 3.102 0Depreciation** -0.961 -0.447 -1.620 -0.940Operating profit 2.704 -1.814 1.745 -2.930Net financial items 0.186 -2.673 0.342 0.140Taxes -1.382 0 -0.998 0Net profit (-loss) 1.508 0.859 1.089 -2.790Net cash from operating activities
-5.052 -2.170 -4.935 -2.968
Capital expenditure 2,013 4,904 6,853 10,452Cash position (as per 30.06)
7,338 1,043 7,338 1,043
Book equity (as per 30.06)
40,381 33,491 40,381 33,491
3
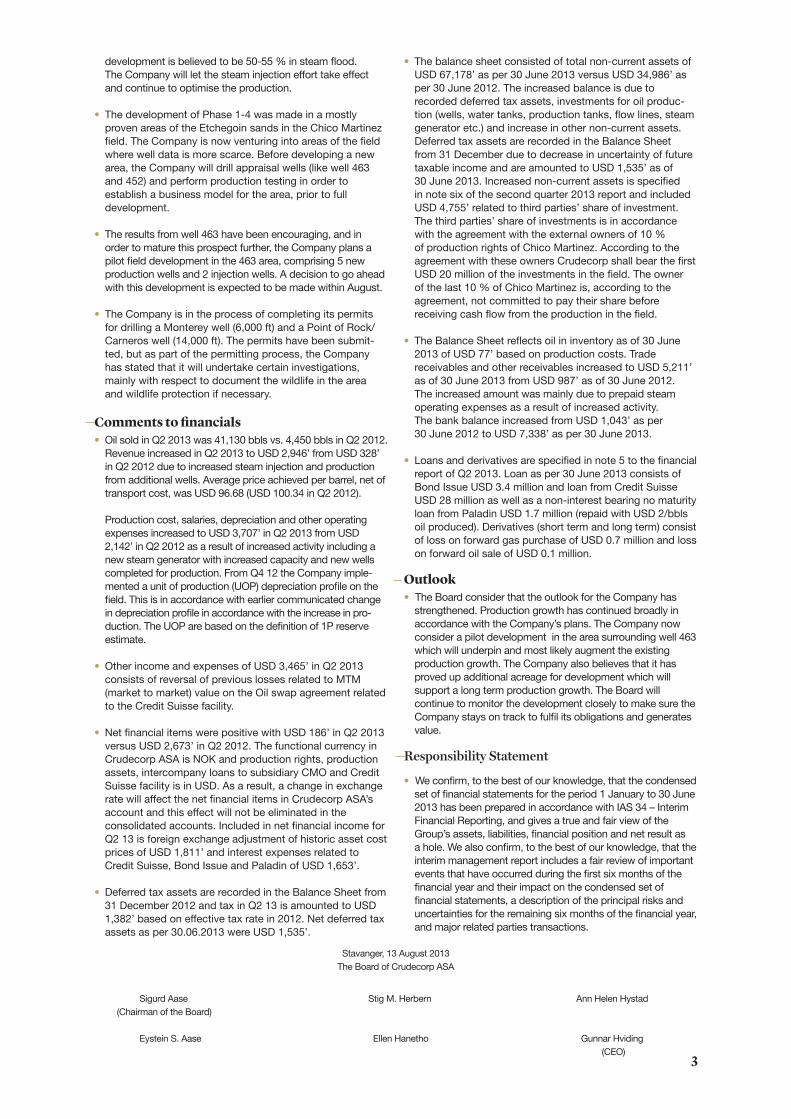
development is believed to be 50-55 % in steam flood. The Company will let the steam injection effort take effect and continue to optimise the production.
• The development of Phase 1-4 was made in a mostly proven areas of the Etchegoin sands in the Chico Martinez field. The Company is now venturing into areas of the field where well data is more scarce. Before developing a new area, the Company will drill appraisal wells (like well 463 and 452) and perform production testing in order to establish a business model for the area, prior to full development.
• The results from well 463 have been encouraging, and in order to mature this prospect further, the Company plans a pilot field development in the 463 area, comprising 5 new production wells and 2 injection wells. A decision to go ahead with this development is expected to be made within August.
• The Company is in the process of completing its permits for drilling a Monterey well (6,000 ft) and a Point of Rock/Carneros well (14,000 ft). The permits have been submit-ted, but as part of the permitting process, the Company has stated that it will undertake certain investigations, mainly with respect to document the wildlife in the area and wildlife protection if necessary.
Comments to financials• Oil sold in Q2 2013 was 41,130 bbls vs. 4,450 bbls in Q2 2012.
Revenue increased in Q2 2013 to USD 2,946’ from USD 328’ in Q2 2012 due to increased steam injection and production from additional wells. Average price achieved per barrel, net of transport cost, was USD 96.68 (USD 100.34 in Q2 2012).
Production cost, salaries, depreciation and other operating expenses increased to USD 3,707’ in Q2 2013 from USD 2,142’ in Q2 2012 as a result of increased activity including a new steam generator with increased capacity and new wells completed for production. From Q4 12 the Company imple- mented a unit of production (UOP) depreciation profile on the field. This is in accordance with earlier communicated change in depreciation profile in accordance with the increase in pro-
duction. The UOP are based on the definition of 1P reserve estimate.
• Other income and expenses of USD 3,465’ in Q2 2013 consists of reversal of previous losses related to MTM (market to market) value on the Oil swap agreement related to the Credit Suisse facility.
• Net financial items were positive with USD 186’ in Q2 2013 versus USD 2,673’ in Q2 2012. The functional currency in Crudecorp ASA is NOK and production rights, production assets, intercompany loans to subsidiary CMO and Credit Suisse facility is in USD. As a result, a change in exchange rate will affect the net financial items in Crudecorp ASA’s account and this effect will not be eliminated in the consolidated accounts. Included in net financial income for Q2 13 is foreign exchange adjustment of historic asset cost prices of USD 1,811’ and interest expenses related to Credit Suisse, Bond Issue and Paladin of USD 1,653’.
• Deferred tax assets are recorded in the Balance Sheet from 31 December 2012 and tax in Q2 13 is amounted to USD 1,382’ based on effective tax rate in 2012. Net deferred tax assets as per 30.06.2013 were USD 1,535’.
• The balance sheet consisted of total non-current assets of USD 67,178’ as per 30 June 2013 versus USD 34,986’ as per 30 June 2012. The increased balance is due to recorded deferred tax assets, investments for oil produc-tion (wells, water tanks, production tanks, flow lines, steam generator etc.) and increase in other non-current assets. Deferred tax assets are recorded in the Balance Sheet from 31 December due to decrease in uncertainty of future taxable income and are amounted to USD 1,535’ as of 30 June 2013. Increased non-current assets is specified in note six of the second quarter 2013 report and included USD 4,755’ related to third parties’ share of investment. The third parties’ share of investments is in accordance with the agreement with the external owners of 10 % of production rights of Chico Martinez. According to the agreement with these owners Crudecorp shall bear the first USD 20 million of the investments in the field. The owner of the last 10 % of Chico Martinez is, according to the agreement, not committed to pay their share before receiving cash flow from the production in the field.
• The Balance Sheet reflects oil in inventory as of 30 June 2013 of USD 77’ based on production costs. Trade receivables and other receivables increased to USD 5,211’ as of 30 June 2013 from USD 987’ as of 30 June 2012. The increased amount was mainly due to prepaid steam operating expenses as a result of increased activity. The bank balance increased from USD 1,043’ as per 30 June 2012 to USD 7,338’ as per 30 June 2013.
• Loans and derivatives are specified in note 5 to the financial report of Q2 2013. Loan as per 30 June 2013 consists of Bond Issue USD 3.4 million and loan from Credit Suisse USD 28 million as well as a non-interest bearing no maturity loan from Paladin USD 1.7 million (repaid with USD 2/bbls oil produced). Derivatives (short term and long term) consist of loss on forward gas purchase of USD 0.7 million and loss on forward oil sale of USD 0.1 million.
Outlook • The Board consider that the outlook for the Company has
strengthened. Production growth has continued broadly in accordance with the Company’s plans. The Company now consider a pilot development in the area surrounding well 463 which will underpin and most likely augment the existing production growth. The Company also believes that it has proved up additional acreage for development which will support a long term production growth. The Board will continue to monitor the development closely to make sure the Company stays on track to fulfil its obligations and generates value.
Responsibility Statement
• We confirm, to the best of our knowledge, that the condensed set of financial statements for the period 1 January to 30 June 2013 has been prepared in accordance with IAS 34 – Interim Financial Reporting, and gives a true and fair view of the Group’s assets, liabilities, financial position and net result as a hole. We also confirm, to the best of our knowledge, that the interim management report includes a fair review of important events that have occurred during the first six months of the financial year and their impact on the condensed set of financial statements, a description of the principal risks and uncertainties for the remaining six months of the financial year, and major related parties transactions.
Stavanger, 13 August 2013The Board of Crudecorp ASA
Sigurd Aase Stig M. Herbern Ann Helen Hystad (Chairman of the Board)
Eystein S. Aase Ellen Hanetho Gunnar Hviding (CEO)

4
Condensed Consolidated Income StatementCrudecorp ASA
(Unaudited figures in USD)
Note Q2 13 Q2 12 H1 13 H1 12 2012 Revenues 2 946 056 327 925 4 959 465 644 970 2 015 715 Other operating income 0 - - 17 276 17 179 Production costs -1 706 218 -387 628 -2 916 846 -726 700 -2 027 664 Salaries -577 435 -246 938 -995 274 -595 531 -1 537 367 Depreciation 2 -960 831 -447 009 -1 620 342 -940 084 -1 889 253 Other operating expenses -462 263 -1 060 054 -784 043 -1 330 336 -1 881 755 Other income and expenses 5 3 464 877 0 3 102 060 0 -3 798 231
Operating profit 2 704 186 -1 813 704 1 745 020 -2 930 405 -9 101 376
Net financial items 7 186 294 2 673 232 341 871 139 857 -3 404 862
Profit before tax 2 890 480 859 528 2 086 891 -2 790 548 -12 506 238 Taxes -1 382 056 0 -997 827 0 2 730 173
Net profit/(loss) 1 508 424 859 528 1 089 064 -2 790 548 -9 776 065
Consolidated Statement of Comprehensive IncomeCrudecorp ASA
(Unaudited figures in USD)
Note Q2 13 Q2 12 H1 13 H1 12 2012 Net profit 1 508 424 859 528 1 089 064 -2 790 548 -9 776 065 Comprehensive income items Translation differences -295 007 -222 199 -2 063 953 41 424 3 069 299
Other comprehensive income, net after tax
-295 007 -222 199 -2 063 953 41 424 3 069 299
Total comprehensive income 1 213 417 637 329 -974 889 -2 749 124 -6 706 766
Net profit allocated The shareholders of the parent 1 508 424 859 528 1 089 064 -2 790 548 -9 776 065 Total comprehensive income allocated The shareholders of the parent 1 213 417 637 329 -974 889 -2 749 124 -6 706 766
Earnings per. share is calculated by dividing net profit attributable to equity shareholders of the weighted average number of ordinary shares outstanding during the period.
Q2 13 Q2 12 H1 13 H1 12 2012 Profit attributable to equity shareholders 1 508 424 859 528 1 089 064 -2 790 548 -9 776 065
Weighted average number of ordinary shares outstanding (in thousands)
103 724 91 152 98 724 91 152 91 152
Earnings per share 0,01 0,01 0,01 -0,03 -0,11
Diluted earnings per share 0,01 0,01 0,01 -0,03 -0,11

5
Consolidated Balance SheetCrudecorp ASA
(Unaudited figures in USD)
Note 30.06.13 30.06.12 31.12.12ASSETSNon-current assetsDeferred tax assets 1 534 879 0 2 742 688Fixed Assets 2 53 270 232 25 847 723 48 526 364Working Interest Chico Martinez 3 7 354 510 7 632 396 8 186 562Other non-current assets 6 5 018 816 1 505 621 4 298 295
Total non-current assets 67 178 437 34 985 740 63 753 909
Current AssetsInventories 77 387 0 187 041Client Receivables and other receivables 5 210 555 986 709 1 978 179Cash and cash equivalents 7 338 057 1 042 741 10 875 771
Total current assets 12 625 999 2 029 450 13 040 991
Total assets 79 804 436 37 015 190 76 794 900
Note 30.06.13 30.06.12 31.12.12EQUITYEquity attributable to parent company shareholdersShare capital 4 344 146 304 687 335 491Share premium 4 53 471 107 40 427 247 44 354 860Retained Earnings -13 434 036 -7 241 136 -12 459 147
Total shareholders' equity 40 381 217 33 490 798 32 231 204
LIABILITIESLong Term LiabilitiesLoan 5 33 193 605 1 813 219 34 965 476Derivatives 5 597 915 0 3 117 184Decommissioning and Abandonment 5 718 509 0 718 509
Total long term liabilities 34 510 029 1 813 219 38 801 169
Short Term deptTrade and other payables 5 4 711 054 1 711 173 4 983 230Derivatives 5 202 136 0 779 296
Total short term dept 4 913 190 1 711 173 5 762 526
Total liabilites 39 423 219 3 524 392 44 563 695
Total equity and liabilities 79 804 436 37 015 190 76 794 900
Note 1 to 8 forms an integral part of the group accounts.

6
Consolidated Cash FlowCrudecorp ASA
(Unaudited figures in USD)
Note 30.06.13 30.06.12 31.12.12 Cash flow from operating activities Cash flow from operations -3 275 835 -2 947 687 -881 564 Interest paid -1 658 773 -20 358 -160 038 Taxes paid - - -12 514
Net cash from operating activites -4 934 608 -2 968 045 -1 054 116
Cash flow from investing activitiesPurchase of tangible fixed assets -6 852 947 -10 452 257 -33 058 475 Loans to third parties -658 201 -1 244 796 -4 035 000
Net cash flow from investing activities -7 511 148 -11 697 053 -37 093 475
Cash flow from financing activities Issue of ordinary shares 11 536 303 - 2 697 792 Bond Issue - - 3 772 636 Credit Suisse facility -1 400 000 - 29 470 200
Net cash from financing activities 10 136 303 - 35 940 628
Net change in cash, cash equivalents and bank overdrafts -2 309 453 -14 665 098 -2 206 963 Cash, cash equivalents and bank overdrafts as of 1 January 10 875 711 14 757 305 14 757 306 Exchange rate gain-/loss on cash, cash equivalents and bank overdrafts
-1 228 201 950 534 -1 674 632
Cash, cash equivalents and bank overdrafts at end of period 7 338 057 1 042 741 10 875 711
7
Changes in Group EquityCrudecorp ASA
(Unaudited figures in USD)
Note Share Capital
Share Premium
Retained Earnings
Total Equity
Equity 31 December 2011 304 209 40 431 789 -4 492 012 36 243 986
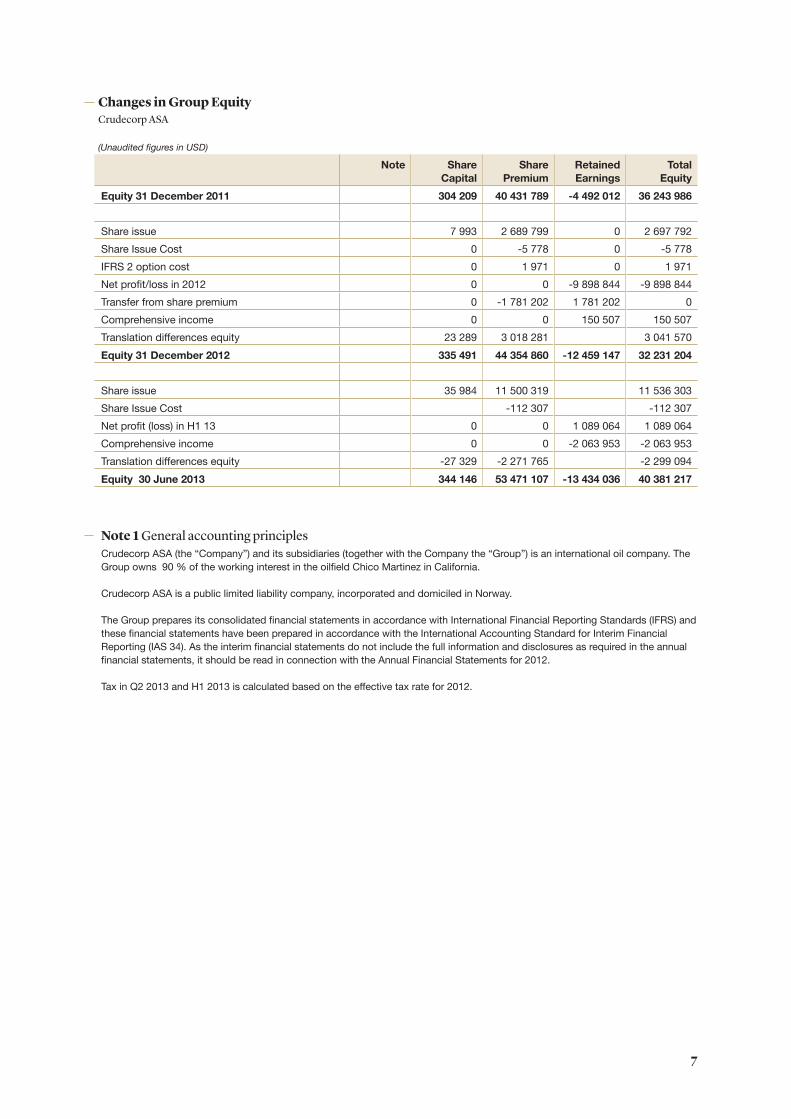
Share issue 7 993 2 689 799 0 2 697 792 Share Issue Cost 0 -5 778 0 -5 778 IFRS 2 option cost 0 1 971 0 1 971 Net profit/loss in 2012 0 0 -9 898 844 -9 898 844 Transfer from share premium 0 -1 781 202 1 781 202 0 Comprehensive income 0 0 150 507 150 507 Translation differences equity 23 289 3 018 281 3 041 570 Equity 31 December 2012 335 491 44 354 860 -12 459 147 32 231 204
Share issue 35 984 11 500 319 11 536 303 Share Issue Cost -112 307 -112 307 Net profit (loss) in H1 13 0 0 1 089 064 1 089 064 Comprehensive income 0 0 -2 063 953 -2 063 953 Translation differences equity -27 329 -2 271 765 -2 299 094 Equity 30 June 2013 344 146 53 471 107 -13 434 036 40 381 217
Note 1 General accounting principles Crudecorp ASA (the “Company”) and its subsidiaries (together with the Company the “Group”) is an international oil company. The Group owns 90 % of the working interest in the oilfield Chico Martinez in California.
Crudecorp ASA is a public limited liability company, incorporated and domiciled in Norway.
The Group prepares its consolidated financial statements in accordance with International Financial Reporting Standards (IFRS) and these financial statements have been prepared in accordance with the International Accounting Standard for Interim Financial Reporting (IAS 34). As the interim financial statements do not include the full information and disclosures as required in the annual financial statements, it should be read in connection with the Annual Financial Statements for 2012.
Tax in Q2 2013 and H1 2013 is calculated based on the effective tax rate for 2012.

8
Note 2 Fixed Assets
30.06.13 30.06.12 31.12.12 Carrying value as of beginning of period 48 526 364 15 559 364 15 559 364 Conversion differences (Translation) 0 0 0 Additions 6 194 745 11 228 444 32 745 532 Capitalization of interest - - 1 335 227 Decommissioning and Abandonment - - 718 509 Retirement 0 0 0 Depreciation -1 450 877 -940 084 -1 832 267 Carrying value as of end of period 53 270 232 25 847 723 48 526 364
As of end of period Acquisition Cost 56 164 317 27 733 974 49 969 571 Capitalization of interest 1 335 227 - 1 335 227 Accumulated depreciation -4 229 312 -1 886 251 -2 778 434
Carrying value as of end of period 53 270 232 25 847 723 48 526 364
Reserves and production (not audited) Estimated total P90 reserves as of 31.12.12 is 2.75 million boe (net Crudecorp). Total production in H1 2013 was 67,003 boe.
Note 3 Oil field production rights
30.06.13 30.06.12 31.12.12 Carrying Value as of beginning of period 8 186 562 7 464 281 7 464 281 Depreciation of period -192 775 -56 986 Conversion differences (Translation) -639 278 64 499 593 705 Additions interest - 103 617 185 562
Carrying value as of end of period 7 354 510 7 632 396 8 186 562
As of end of period Acquisition Cost 7 604 270 7 924 936 8 243 548 Cumulative depreciation and amortization -249 761 - -56 986
Carrying value as of end of period 7 354 510 7 924 936 8 186 562

9
Note 4 Share capital and share premium
Number of shares
(1,000s)
Share capital (NOK)
Share capital (USD)
Share premium
(USD)
Total (USD)
Total as of 31 December 2011 91 152 1 823 034 304 209 40 431 789 40 735 998 Conversion differences (Translation) 478 -4 542 -4 064 Total as of 30 June 2012 91 152 1 823 034 304 687 40 427 247 40 731 934
Share issue November 2012* 2 222 44 444 7 993 2 689 799 2 697 792 Share issue cost 0 0 0 -5 778 -5 778 IFRS 2 option cost 0 0 0 1 971 1 971 Transferred to uncovered losses 0 0 0 -1 781 202 -1 781 202 Conversion differences (Translation) 0 0 22 811 3 022 823 3 045 634 Total as of 31 December 2012 93 374 1 867 478 335 491 44 354 860 44 690 351
Share issue January 2013 350 7 000 1 228 413 151 414 379 Share issue cost April 2013 10 000 200 000 34 756 11 087 168 11 121 924 Share issue cost -112 307 -112 307 Conversion differences (Translation) -27 329 -2 271 765 -2 299 094 Total as of 30 June 2013 103 724 2 074 478 344 146 53 471 107 53 815 253
Note 5 Loans and Derivatives
30.06.13 30.06.12 31.12.12 Long-term debt Loan from Paladin 1 722 648 1 813 219 1 819 595 Bond Issue 3 400 757 - 3 675 682 Credit Suisse 28 070 200 - 29 470 200 Derivatives 597 915 - 3 117 184 Decommissioning and Abandonment 718 509 - 718 509 Total long-term debt 34 510 029 1 813 219 38 801 169
Short-term debt Trade and other payables 4 711 054 1 711 173 4 983 230 Derivatives 202 136 - 779 296 Total short-term debt 4 913 190 1 711 173 5 762 526
Nominal value30.06.13 30.06.12 31.12.12
Loan from Paladin 1 837 962 1 958 179 1 934 909
Bond Issue 3 483 800 - 3 772 636 Credit Suisse 30 000 000 - 30 000 000 Total 35 321 762 1 958 179 35 707 545
Other income and expensesQ2 13 Q2 12 H1 13 H1 12 2012
Other income and expensesProfit/loss on MTM value on oil and gas contract Credit Suisse
3 464 877 0 3 102 060 - -3 798 231
Total 3 464 877 0 3 102 060 0 -3 798 231
* Share issue November 2012 was registered on 4 January 2013

10
30 June 2013 Level 1 Level 2 Level 3 TotalAssetsFinancial derivatives - - - .LiabilitiesFinancial derivatives - 800 051 - 800 051
2012 Level 1 Level 2 Level 3 TotalAssetsFinancial derivatives - - - .LiabilitiesFinancial derivatives - 3 896 480 - 3 896 480
The carrying value of the Bond Issue is in NOK. Remaining Group’s loan is in USD.
The loan from Paladin has a nominal interest rate 0% and a repayment schedule that is in step with production with installments of $2 per barrel produced in the Chico Martinez field.
The Company has in July 2012 successfully completed a bond issue of NOK 21 million. The bond issue has a nominal interest rate of 3 month NIBOR + 12,5 %. Maturity date of the bond issue is 17 July 2017. The bond issue is unsecured and subordi-nated to the Credit Suisse facility. The Bond Issue agreement includes a call option and Crudecorp may redeem parts of the Bond Issue or the entire Bond Issue as stated in the agreement between Crudecorp ASA and Norsk Tillitsmann (on behalf of the Bondholders).
Book value of Bond Issue is USD 3.4 million and consists of principal reduced by costs and transaction fee and added with the period’s amortization of costs/transaction fee. Accrued interest related to Bond Issue is USD 0.1 million as per 30 June. Interest is to be paid every third month.
The Company has in July 2012 signed a USD 30 million crude oil prepaid swap facility with Credit Suisse. The Prepay Facility also involves a cash-settled forward swap over 986,000 barrels of crude oil spread across March 2013 - December 2016 and priced in reference to ICE Brent.
Book value of Credit Suisse facility was USD 28.1 million and consists of principal reduced by costs and transaction fee. Accrued interest/margin cost on oil swap related to Credit Suisse facility is USD 3.4 million as per 30 June and is mainly booked as capitalization on fixed assets. Repayment of principal and interests/margin cost on oil swap started in April 2013. Oil sale will be treated as income as before, without any changes.The loan will be accounted for as a fixed interest loan using amortized cost method. The fixed interest will be the margin inherent in the Oil swap agreement. The sale of oil will be recognized at market price, and the change in fair value (MTM) in the Oil swap agreement will be recognized as other gain and losses in the financial statement (operating section, above EBITDA). Crudecorp treats the arrangement as one contract and then bifurcate the embedded derivative for MTM (Market to Market), leaving the host instrument for as fixed interest loan, accounted as amortized cost, where the fixed interest is the margin (incl. funding cost) of USD 15,71 on each bbl. The rest of the oils swap (MTM value) is accounted for as fair value through profit and loss on the line other gains and losses. MTM (Market to Market) value will be calculated each quarter.
As per 30 June 2013 the total loss on the oil contract is amounted to USD 0.1 million. As per 31 March 2013 the total loss was 4.2 million resulting in a income related to the oil contract for Q2 13 of USD 4.1 million. This gain is presented as other income/expenses in the Condensed Consolidated Income Statement and included in derivatives in the balance sheet. Gas purchase agreement will be treated at amortized cost, as the purchase is accounted for as own use under IAS 39 definitions. MTM (Market to Market) value is to be calculated each quarter.
As per 30 June 2013 there was a total loss on the gas contract amounted to USD 674’. As per 31 March 2013 the total loss was 23’ and the loss for Q2 is USD 651’. This loss is presented as other income/expenses in the Condensed Consolidated Income Statement and included in derivatives in the balance sheet.
The table below anlyses financial instruments carried at fair value, by valuation method. The different levels have been defined as follows:Level 1: Quoted prices (unadjusted) in active markrets for identical assets or liabilitiesLevel 2: Inputs other than quotes prices included within Level 1 that are observable for the assets or liability, either directly (that is, as prices) or indirectly (that is, derived prom prices)Level 3: inputs for the assets or liability that are not based on observable market data (that is, unobseervable inputs)
11
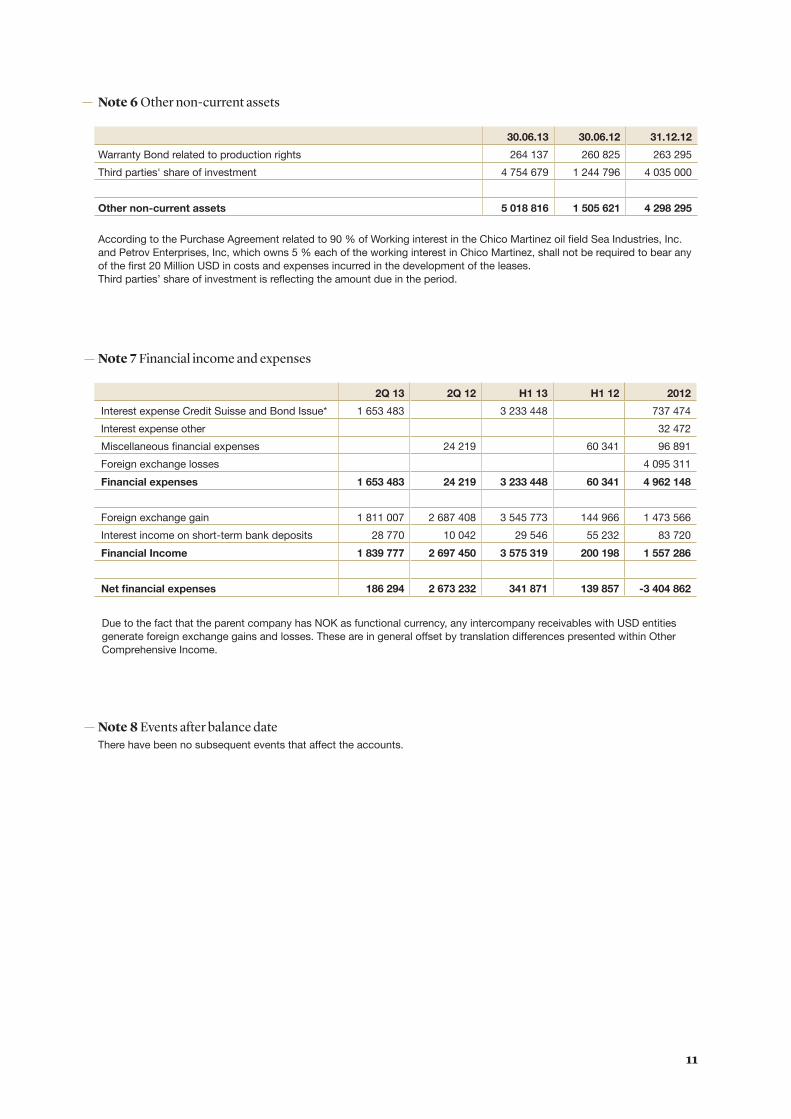
Note 6 Other non-current assets
30.06.13 30.06.12 31.12.12Warranty Bond related to production rights 264 137 260 825 263 295 Third parties' share of investment 4 754 679 1 244 796 4 035 000
Other non-current assets 5 018 816 1 505 621 4 298 295
According to the Purchase Agreement related to 90 % of Working interest in the Chico Martinez oil field Sea Industries, Inc. and Petrov Enterprises, Inc, which owns 5 % each of the working interest in Chico Martinez, shall not be required to bear any of the first 20 Million USD in costs and expenses incurred in the development of the leases. Third parties’ share of investment is reflecting the amount due in the period.
Note 7 Financial income and expenses
2Q 13 2Q 12 H1 13 H1 12 2012 Interest expense Credit Suisse and Bond Issue* 1 653 483 3 233 448 737 474 Interest expense other 32 472 Miscellaneous financial expenses 24 219 60 341 96 891 Foreign exchange losses 4 095 311 Financial expenses 1 653 483 24 219 3 233 448 60 341 4 962 148
Foreign exchange gain 1 811 007 2 687 408 3 545 773 144 966 1 473 566 Interest income on short-term bank deposits 28 770 10 042 29 546 55 232 83 720 Financial Income 1 839 777 2 697 450 3 575 319 200 198 1 557 286
Net financial expenses 186 294 2 673 232 341 871 139 857 -3 404 862
Note 8 Events after balance dateThere have been no subsequent events that affect the accounts.
Due to the fact that the parent company has NOK as functional currency, any intercompany receivables with USD entities generate foreign exchange gains and losses. These are in general offset by translation differences presented within Other Comprehensive Income.

www.crudecorp.com