Embed Size (px)
Citation preview
ITE Group plc Interim Report 2017
I
INTERIM REPORT 2017
ITE Group plc
Introduction
Our vision is “to create the world’s leading portfolio of content-driven, must-attend events delivering an outstanding experience and ROI for our customers.”
“ I’m pleased to report that the Group has arrested its recent decline and posted like-for-like growth after three years of difficult trading. The first half performance reflects a more stable market in Moscow which is encouraging, but mixed market conditions remain in some of our other regions. We have completed a thorough review of the entire business and have concluded that there are significant organic opportunities in ITE’s existing core portfolio that have yet to be realised.
Therefore, I am delighted to announce today the evolution of our strategy and a £20 million Transformation and Growth Programme that will deliver a stronger, more scalable platform to drive organic growth with an emphasis on retention, content and customer service. By putting our exhibitors and visitors at the heart of everything we do, we plan to drive sustainable growth and shareholder value.”Mark Shashoua, CEO of ITE Group plc
CONTENTS
01 Financial highlights and strategy update02 Interim Management Report 08 Condensed Consolidated Income Statement 09 Condensed Consolidated Statement
of Comprehensive Income10 Condensed Consolidated Statement of Changes in Equity13 Condensed Consolidated Statement of Financial Position15 Condensed Consolidated Cash Flow Statement16 Net Debt Reconciliation17 Notes to the Interim Financial Statements29 Responsibility Statement 30 Independent Review Report to ITE Group plc 31 Directors and Professional Advisers 32 Financial Calendar
ITE Group plc Interim Report 2017
01
Financial highlights Strategy update
1 Headline pre-tax profit is defined as profit before tax and adjusting items which include amortisation of acquired intangibles, impairment of goodwill, intangible assets and investments, profits or losses arising on disposal of Group undertakings, restructuring costs, transaction and integration costs on completed and pending acquisitions and disposals, tax on income from associates and joint ventures, gains or losses on the revaluation of deferred/contingent consideration and on equity option liabilities over non-controlling interests, and imputed interest charges on discounted equity option liabilities – see note 3 to the condensed consolidated financial statements for details.
2 Headline diluted earnings per share is calculated using profit attributable to shareholders before adjusting items – see notes 3 and 6 to the condensed consolidated financial statements for details.
3 Where used, like-for-like or underlying measures are stated on a constant currency basis adjusted to exclude acquisitions impacting results for the first time, event timing differences, biennial events and net finance costs.
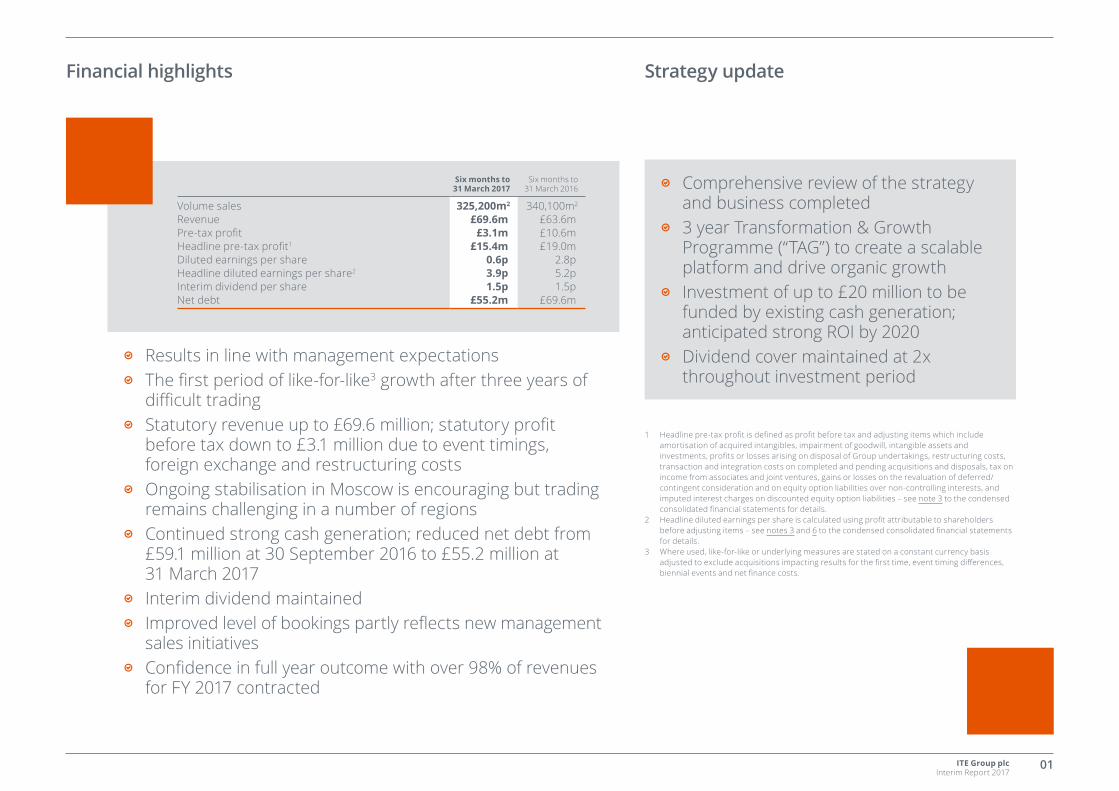
e Results in line with management expectations e The first period of like-for-like3 growth after three years of
difficult trading e Statutory revenue up to £69.6 million; statutory profit
before tax down to £3.1 million due to event timings, foreign exchange and restructuring costs
e Ongoing stabilisation in Moscow is encouraging but trading remains challenging in a number of regions
e Continued strong cash generation; reduced net debt from £59.1 million at 30 September 2016 to £55.2 million at 31 March 2017
e Interim dividend maintained e Improved level of bookings partly reflects new management
sales initiatives e Confidence in full year outcome with over 98% of revenues
for FY 2017 contracted
e Comprehensive review of the strategy and business completed
e 3 year Transformation & Growth Programme (“TAG”) to create a scalable platform and drive organic growth
e Investment of up to £20 million to be funded by existing cash generation; anticipated strong ROI by 2020
e Dividend cover maintained at 2x throughout investment period
Six months to 31 March 2017
Six months to 31 March 2016
Volume sales 325,200m2 340,100m2
Revenue £69.6m £63.6mPre-tax profit £3.1m £10.6mHeadline pre-tax profit1 £15.4m £19.0mDiluted earnings per share 0.6p 2.8pHeadline diluted earnings per share2 3.9p 5.2pInterim dividend per share 1.5p 1.5pNet debt £55.2m £69.6m
ITE Group plc Interim Report 2017
02
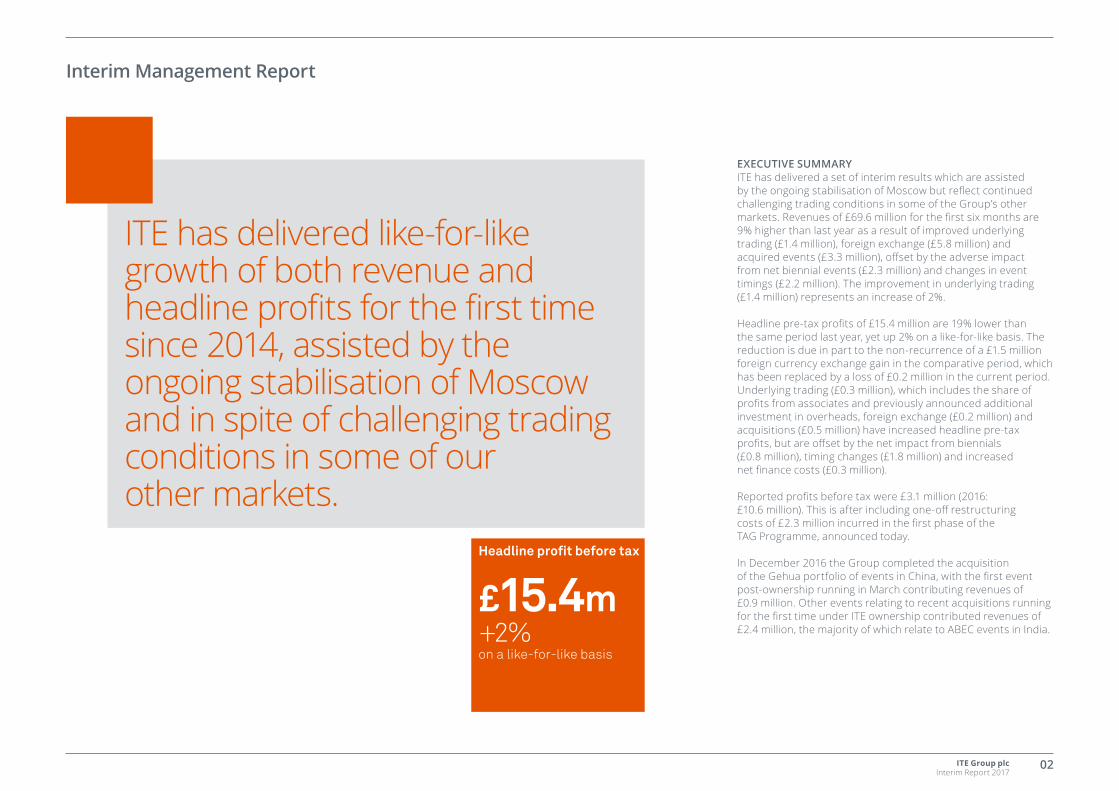
EXECUTIVE SUMMARYITE has delivered a set of interim results which are assisted by the ongoing stabilisation of Moscow but reflect continued challenging trading conditions in some of the Group’s other markets. Revenues of £69.6 million for the first six months are 9% higher than last year as a result of improved underlying trading (£1.4 million), foreign exchange (£5.8 million) and acquired events (£3.3 million), offset by the adverse impact from net biennial events (£2.3 million) and changes in event timings (£2.2 million). The improvement in underlying trading (£1.4 million) represents an increase of 2%.
Headline pre-tax profits of £15.4 million are 19% lower than the same period last year, yet up 2% on a like-for-like basis. The reduction is due in part to the non-recurrence of a £1.5 million foreign currency exchange gain in the comparative period, which has been replaced by a loss of £0.2 million in the current period. Underlying trading (£0.3 million), which includes the share of profits from associates and previously announced additional investment in overheads, foreign exchange (£0.2 million) and acquisitions (£0.5 million) have increased headline pre-tax profits, but are offset by the net impact from biennials (£0.8 million), timing changes (£1.8 million) and increased net finance costs (£0.3 million).
Reported profits before tax were £3.1 million (2016: £10.6 million). This is after including one-off restructuring costs of £2.3 million incurred in the first phase of the TAG Programme, announced today.
In December 2016 the Group completed the acquisition of the Gehua portfolio of events in China, with the first event post-ownership running in March contributing revenues of £0.9 million. Other events relating to recent acquisitions running for the first time under ITE ownership contributed revenues of £2.4 million, the majority of which relate to ABEC events in India.
Interim Management Report
Headline profit before tax
£15.4m+2%on a like-for-like basis
ITE has delivered like-for-like growth of both revenue and headline profits for the first time since 2014, assisted by the ongoing stabilisation of Moscow and in spite of challenging trading conditions in some of our other markets.
ITE Group plc Interim Report 2017
03
The ongoing stabilisation of the trading environment in Moscow has enhanced performance in this significant part of our business, but this stabilisation has not yet spread to the remaining regions of Russia, nor to Kazakhstan or Azerbaijan, which continue to be impacted by the difficult trading environment we have experienced since the fall in oil prices. In Moscow like-for-like volumes over the first half were 5% higher than this time last year, although for Russia overall growth was just 1% and in Kazakhstan volumes were 25% lower and in Azerbaijan 42% lower.
In other regions, the Group has seen demonetisation in India, which has created uncertainty for many in the country, resulting in cancellations and postponements of a number of our smaller events. The continued uncertainty in Turkey has resulted in a number of cancellations by international exhibitors, although the improvement in relations with Russia resulted in the return of some Turkish exhibitors to our Russian exhibitions.
STRATEGIC REVIEWA detailed diagnostic of the current portfolio and its growth potential has been undertaken as part of the Group’s strategy review. Alongside this, a comprehensive review of key business areas was conducted including sales and marketing, content, show operations and support functions.
In recent years the Group pursued an acquisition-led strategy in order to diversify away from Russia and Central Asia which worked well when market conditions were buoyant, but as has been well documented, trading performance has deteriorated as macro-economic conditions have become more challenging. To execute its diversification strategy and in order to protect margins, investment was held back across the portfolio.
During the review process, management time has been spent on understanding where ITE’s strengths lie and how the business needs to evolve. The events industry has changed and continues to evolve faster than ever and that change is largely driven by the different demands of our customers (exhibitors and visitors). More than ever, there is a constant need for Return on Investment and Return on Time which are critical key metrics for our customers and also a need for new and engaging customer experience. Therefore running market leading events is absolutely paramount.
Following a thorough strategy and business review, the Group believes the future is to move decisively from being a decentralised, geographically structured business to one that is product-led with strong regional platforms.
Our vision is “to create the world’s leading portfolio of content-driven, must-attend events delivering an outstanding experience and ROI for our customers.” By putting exhibitors and visitors at the heart of everything we do, we plan to drive sustainable growth for our shareholders.
The Group’s focus on a product-led strategy will see ITE focus on events that are market leading or have a clear path to become number one in their sector. To create a best in class events business, the Group will invest in its people, systems and products in order to build a high quality portfolio and sustainable model for the long-term.
The Group’s focus on a product-led strategy will see ITE focus on events that are market leading or have a clear path to become number one in their sector.
Interim Management Report continued
ITE Group plc Interim Report 2017
04
Interim Management Report continued
The Transformation & Growth Programme (“TAG”) In order to drive the transition, ITE has initiated the TAG Programme which will see it invest up to £20 million over the next three years, creating a stronger, more scalable platform. The TAG Programme comprises of three pillars of strategic activity to drive revenue and accelerate growth as follows:
1) Create a Scalable Platform The TAG Programme will introduce transformational levers and investment will be spread across five areas to: – Implement best practice across the business – Build and maintain ‘fit for purpose’ IT infrastructure and
systems – Invest in show operations – Drive a performance culture – Build capability and talent
As part of creating a scalable platform, the Group will change its operating model and transition from a model organised and managed by geography to a more centralised one that supports a product-led business. As part of TAG the Group will develop an ‘ITE way’ creating a blueprint to run events that is consistent globally.
2) Manage the PortfolioThe Group is implementing a more rigorous approach to allocation of capital. ITE currently runs 269 events and moving forward the Group will focus its capital resource on events that are market leading, or have the potential to be, delivering greater return on the Group’s investment and time.
Following the review, the Group has deliberately segmented its business into Core and Non-Core, enabling management to increase its focus on products that present the greatest opportunities whilst reducing distraction from smaller shows.
The Core shows are of strategic importance to our future and include the Group’s largest shows, those with the greatest potential for growth and a number of smaller but strategically important shows. The Core shows currently represent 85% of revenue and 85% of profit. The Non-Core shows consist of smaller shows with less potential for growth.
As part of the Group’s strategy, its top priority will be to apply a full suite of transformational levers to its Core events which present the best long-term growth opportunities and to realise their full potential. This will include investing in content to drive great customer experience, retention and pricing.
The Group will continue to pro-actively review its portfolio on an ongoing basis.
3) Product-led AcquisitionsThe Group will look to make selective product-led acquisitions to accelerate growth in line with strict M&A criteria. Each opportunity will be carefully reviewed but will not be limited to any particular geography or vertical as the Group aims to run the best shows in the best industries anywhere in the world.
TAG returns and fundingThe Group has committed to investing up to £20 million over a three year period on the TAG Programme. This one-off cost will be split approximately one third in the current financial year, 2017, approximately 40% to 50% in 2018, and the remainder in 2019. This investment will cover both capital and operating expenditure. It is the intention to report one-off expenditure directly associated with the TAG Programme as an adjusting item, which will not affect headline results.
We anticipate a positive return on investment within three years and cash payback within four years.
Whilst we expect to continue to grow revenues, both headline PBT and EPS will be impacted in the current financial year – followed by anticipated flat or low growth in 2018 and anticipated double digit growth into 2019. This is due to the ongoing costs of running the new processes introduced across the programme, which will be reported within headline results.
The programme is designed to deliver mid-term sustainable high single digit revenue growth and high 20’s operating margins.
We plan to fund the programme from cash generated by our operations. Throughout the duration of the programme, the Group expects to maintain its net debt to EBITDA within a target range of 1.5 to 2 times.
2017-2020 DividendITE intends to maintain its dividend cover of two times earnings throughout its planned investment period. The Board has announced an interim dividend this year of 1.5p (2016: 1.5p).
More detail will be provided at the Group’s analyst presentation today and a recording of the event will be published in the investor relations section of ITE’s website.
OUTLOOK Whilst we have seen a recent recovery in Moscow, market forecasts predict a much lower rate of growth than in the past. Trading conditions in other regions in which the Group operates continue to be challenging. Group revenues booked for 2017 are £136 million (at current exchange rates) representing circa 98% of market expectations for the full year. On a like-for-like basis these revenues are circa 5% ahead of this time last year, with trading volumes circa 2% lower. This improvement partly reflects earlier bookings following investment in the new initiatives introduced by management. With this good visibility on current year bookings the Board remains confident in the full year outcome and in the Group’s future prospects as it embarks on the next stage of its development.
ITE Group plc Interim Report 2017
05
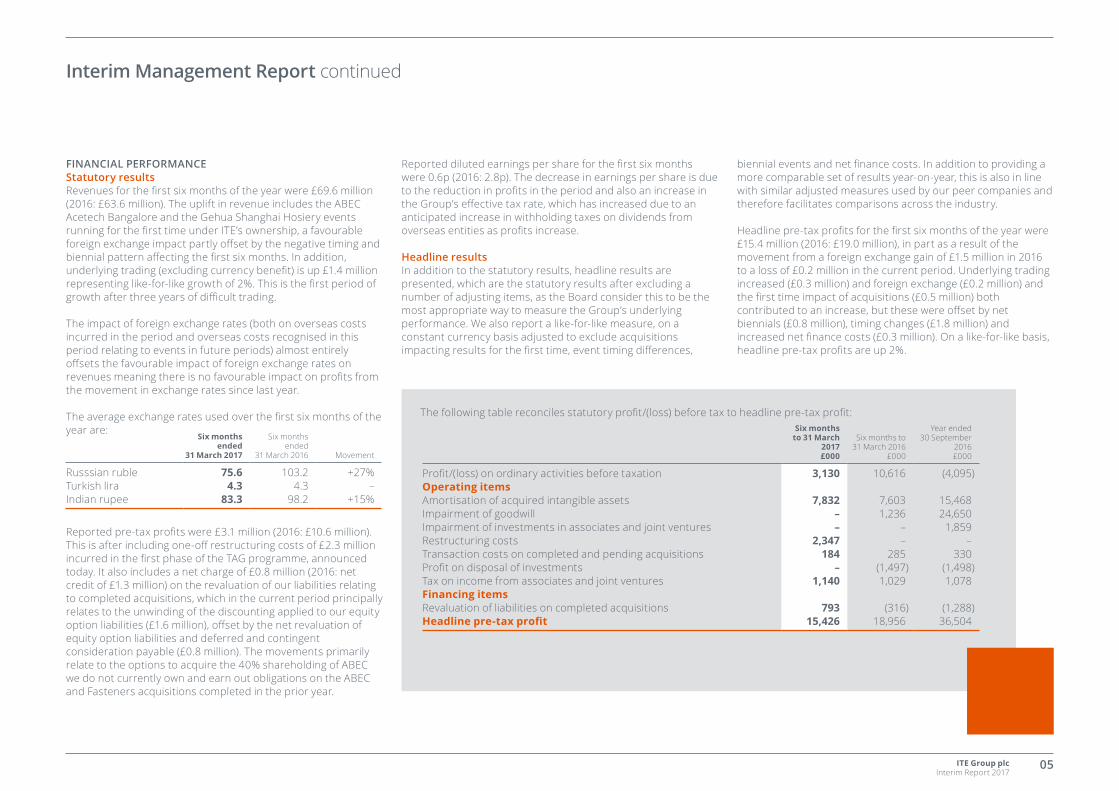
The following table reconciles statutory profit/(loss) before tax to headline pre-tax profit:Six months
to 31 March 2017£000
Six months to 31 March 2016
£000
Year ended30 September
2016£000
Profit/(loss) on ordinary activities before taxation 3,130 10,616 (4,095)Operating itemsAmortisation of acquired intangible assets 7,832 7,603 15,468Impairment of goodwill – 1,236 24,650Impairment of investments in associates and joint ventures – – 1,859Restructuring costs 2,347 – –Transaction costs on completed and pending acquisitions 184 285 330Profit on disposal of investments – (1,497) (1,498)Tax on income from associates and joint ventures 1,140 1,029 1,078Financing itemsRevaluation of liabilities on completed acquisitions 793 (316) (1,288)Headline pre-tax profit 15,426 18,956 36,504
Interim Management Report continued
FINANCIAL PERFORMANCEStatutory resultsRevenues for the first six months of the year were £69.6 million (2016: £63.6 million). The uplift in revenue includes the ABEC Acetech Bangalore and the Gehua Shanghai Hosiery events running for the first time under ITE’s ownership, a favourable foreign exchange impact partly offset by the negative timing and biennial pattern affecting the first six months. In addition, underlying trading (excluding currency benefit) is up £1.4 million representing like-for-like growth of 2%. This is the first period of growth after three years of difficult trading.
The impact of foreign exchange rates (both on overseas costs incurred in the period and overseas costs recognised in this period relating to events in future periods) almost entirely offsets the favourable impact of foreign exchange rates on revenues meaning there is no favourable impact on profits from the movement in exchange rates since last year.
The average exchange rates used over the first six months of the year are:
Six months ended
31 March 2017
Six months ended
31 March 2016 Movement
Russsian ruble 75.6 103.2 +27%Turkish lira 4.3 4.3 –Indian rupee 83.3 98.2 +15%
Reported pre-tax profits were £3.1 million (2016: £10.6 million). This is after including one-off restructuring costs of £2.3 million incurred in the first phase of the TAG programme, announced today. It also includes a net charge of £0.8 million (2016: net credit of £1.3 million) on the revaluation of our liabilities relating to completed acquisitions, which in the current period principally relates to the unwinding of the discounting applied to our equity option liabilities (£1.6 million), offset by the net revaluation of equity option liabilities and deferred and contingent consideration payable (£0.8 million). The movements primarily relate to the options to acquire the 40% shareholding of ABEC we do not currently own and earn out obligations on the ABEC and Fasteners acquisitions completed in the prior year.
Reported diluted earnings per share for the first six months were 0.6p (2016: 2.8p). The decrease in earnings per share is due to the reduction in profits in the period and also an increase in the Group’s effective tax rate, which has increased due to an anticipated increase in withholding taxes on dividends from overseas entities as profits increase.
Headline resultsIn addition to the statutory results, headline results are presented, which are the statutory results after excluding a number of adjusting items, as the Board consider this to be the most appropriate way to measure the Group’s underlying performance. We also report a like-for-like measure, on a constant currency basis adjusted to exclude acquisitions impacting results for the first time, event timing differences,
biennial events and net finance costs. In addition to providing a more comparable set of results year-on-year, this is also in line with similar adjusted measures used by our peer companies and therefore facilitates comparisons across the industry.
Headline pre-tax profits for the first six months of the year were £15.4 million (2016: £19.0 million), in part as a result of the movement from a foreign exchange gain of £1.5 million in 2016 to a loss of £0.2 million in the current period. Underlying trading increased (£0.3 million) and foreign exchange (£0.2 million) and the first time impact of acquisitions (£0.5 million) both contributed to an increase, but these were offset by net biennials (£0.8 million), timing changes (£1.8 million) and increased net finance costs (£0.3 million). On a like-for-like basis, headline pre-tax profits are up 2%.
ITE Group plc Interim Report 2017
06
Interim Management Report continued
Headline diluted earnings per share for the first six months were 3.9p (2016: 5.2p), reflecting the reduced headline earnings in the period and the increase in the Group’s effective tax rate, as detailed above.
The headline results are presented after excluding adjusting items consistent with those excluded in the year end annual report, but after also excluding restructuring costs. These are principally costs associated with designing and implementing the Group’s TAG Programme, announced with the interim results today. The costs incurred to date relate to the design and diagnostic phase of the transformation programme, and further costs are expected during the remainder of the current financial year and across the subsequent two years as we move into the implementation and deployment phase.
The restructuring costs have been presented separately in order to report what the Board consider to be the most appropriate measure of underlying performance of the Group and to provide additional information to users of the interim report on the scale and progress of the Group’s transformation programme.
Amortisation of acquired intangible assets relates to the amortisation charge in respect of intangible assets acquired through business combinations. Restructuring costs are the costs incurred in designing and implementing the Group’s new strategy. Transaction costs on completed and pending acquisitions relates principally to costs incurred on the Gehua acquisition completed in December 2016. Tax on income from associates and joint ventures is an adjustment to ensure consistency with pre-tax operating profits.
Revaluation of liabilities on completed acquisitions include the losses from the revaluation of our equity options over non-controlling interests in our subsidiaries (charge of £0.5 million), principally in relation to ABEC, revaluations of deferred and contingent consideration (credit of £1.3 million), principally in relation to Fasteners, and the imputed interest charge on the unwinding of the discounting on the Group’s equity option liabilities (charge of £1.6 million).
Cash flowsThe Group’s cash flow generated from operations over the first six months has improved to £21.8 million (2016: £18.0 million), and during the period £5.9 million has been applied to fund acquisitions and £5.4 million to dividends, resulting in the Group’s net debt standing at £55.2 million at 31 March 2017 (2016: £69.6 million). Consistent with the comparative period, cash conversion for the first half was over 100%. During the period the Group negotiated a relaxation of our leverage covenant with our banks for the final three quarters of the current financial year, ending 30 September 2017.
TRADING HIGHLIGHTS AND REVIEW OF OPERATIONSDuring the period the Group organised 122 events (2016: 134 events) which generated actual revenue growth of 9%. Like-for-like revenues were 2% higher than for the same period last year.
Actual volume sales for the period were 325,200 sqm (2016: 340,100 sqm), reflecting the weaker biennial pattern, timing changes and weaker trading in Central Asia, Turkey and India, partially offset by the stabilisation of trading conditions in Moscow. Volume sales were 5% lower on a like-for-like basis in comparison to the same period last year.
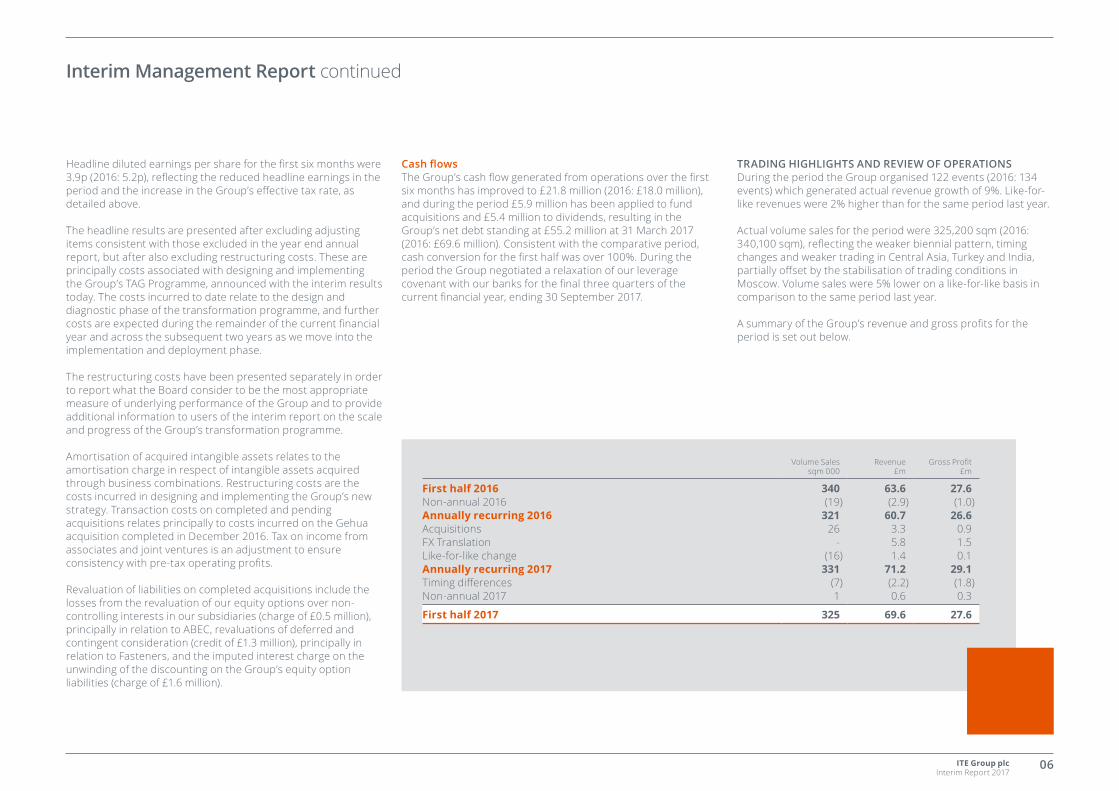
A summary of the Group’s revenue and gross profits for the period is set out below.
Volume Salessqm 000
Revenue£m
Gross Profit£m
First half 2016 340 63.6 27.6Non-annual 2016 (19) (2.9) (1.0)Annually recurring 2016 321 60.7 26.6Acquisitions 26 3.3 0.9FX Translation - 5.8 1.5Like-for-like change (16) 1.4 0.1Annually recurring 2017 331 71.2 29.1Timing differences (7) (2.2) (1.8)Non-annual 2017 1 0.6 0.3
First half 2017 325 69.6 27.6
ITE Group plc Interim Report 2017
07
Interim Management Report continued
RUSSIAThe economic situation in Moscow has continued to stabilise although the regional offices continue to experience tough trading conditions. Like-for-like volume sales in Moscow were 5% higher than the comparative period and across Russia were 1% higher than the comparative period.
Moscow’s largest event in the first half was the Moscow International Travel & Tourism (MITT) event, which increased volume sales to 13,700 sqm (2016: 11,700 sqm) reflecting the return of Turkish exhibitors and an increase in other international and domestic stands.
CENTRAL ASIA Trading in Central Asia remains challenging with like-for-like volume sales for the first six months 22% lower than for the comparative period.
The largest part of the Group’s business in the region is Kazakhstan, which reported a 25% decrease in like-for-like volume sales. The largest event in the region is the Kazakhstan International Oil & Gas Exhibition (KIOGE), held in October 2016, which was smaller than this time last year at 3,700 sqm (2016: 5,800 sqm), reflecting the continued impact of the oil price and local currency devaluation on the region.
EASTERN & SOUTHERN EUROPEIn Turkey, the Group has seen a reduction of 18% in like-for-like volumes due to the impact of regional unrest on the local economy resulting in a reduction in international interest in the region. The largest event taking place in the first half was the travel event EMITT, which achieved volumes of 23,300 sqm (2016: 26,700 sqm) against a worsening backdrop facing the Turkish tourist industry.
Ukraine grew like-for-like volumes by 37% but still represents less than 5% of Group profits.
ASIALike-for-like volume sales for the first six months in Asia were 6% lower than for the comparative period.
The Group’s large construction events in India were held before demonetisation occurred in November, but some of our smaller Indian events have subsequently been affected, with a small number of cancellations and postponements. Acetech Mumbai is the largest construction event in India and remained wall-bound in its venue, although Acetech Delhi saw volumes decrease by 7% to 19,000 sqm from 20,400 sqm.
REST OF THE WORLDAfrica Oil Week ran in October 2016 and, as expected, was adversely affected by the difficult trading conditions affecting the oil industry. There was still excellent representation from all usual participating companies, although many companies sent fewer delegates with a resulting impact on revenues of over 20%. The Breakbulk Americas event ran in September 2016 (and will run again in October 2017) and so does not – and will not
– feature in the 2017 results. Trading has held firm for the mid-market focused fashion event, MODA, held at the NEC in Birmingham and volumes were slightly down on prior year, selling 14,400 sqm (2016: 15,000 sqm).
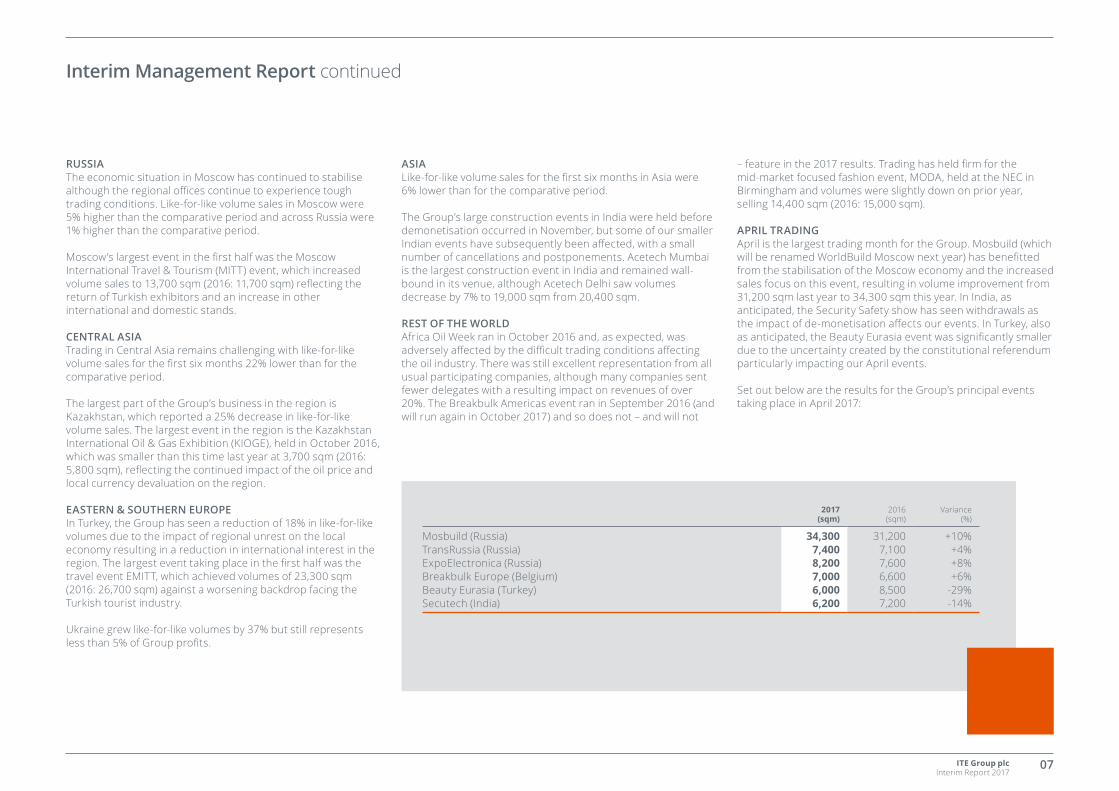
APRIL TRADINGApril is the largest trading month for the Group. Mosbuild (which will be renamed WorldBuild Moscow next year) has benefitted from the stabilisation of the Moscow economy and the increased sales focus on this event, resulting in volume improvement from 31,200 sqm last year to 34,300 sqm this year. In India, as anticipated, the Security Safety show has seen withdrawals as the impact of de-monetisation affects our events. In Turkey, also as anticipated, the Beauty Eurasia event was significantly smaller due to the uncertainty created by the constitutional referendum particularly impacting our April events.
Set out below are the results for the Group’s principal events taking place in April 2017:
2017(sqm)
2016(sqm)
Variance (%)
Mosbuild (Russia) 34,300 31,200 +10%TransRussia (Russia) 7,400 7,100 +4%ExpoElectronica (Russia) 8,200 7,600 +8%Breakbulk Europe (Belgium) 7,000 6,600 +6%Beauty Eurasia (Turkey) 6,000 8,500 -29%Secutech (India) 6,200 7,200 -14%
ITE Group plc Interim Report 2017
08
Six months to 31 March 2017 Unaudited
Six months to 31 March 2016 Unaudited
Year ended 30 September 2016 Audited
NotesHeadline
£000
Adjusting items (note 3)
£000
Statutory
£000Headline
£000
Adjusting items (note 3)
£000Statutory
£000Headline
£000
Adjusting items (note 3)
£000Statutory
£000
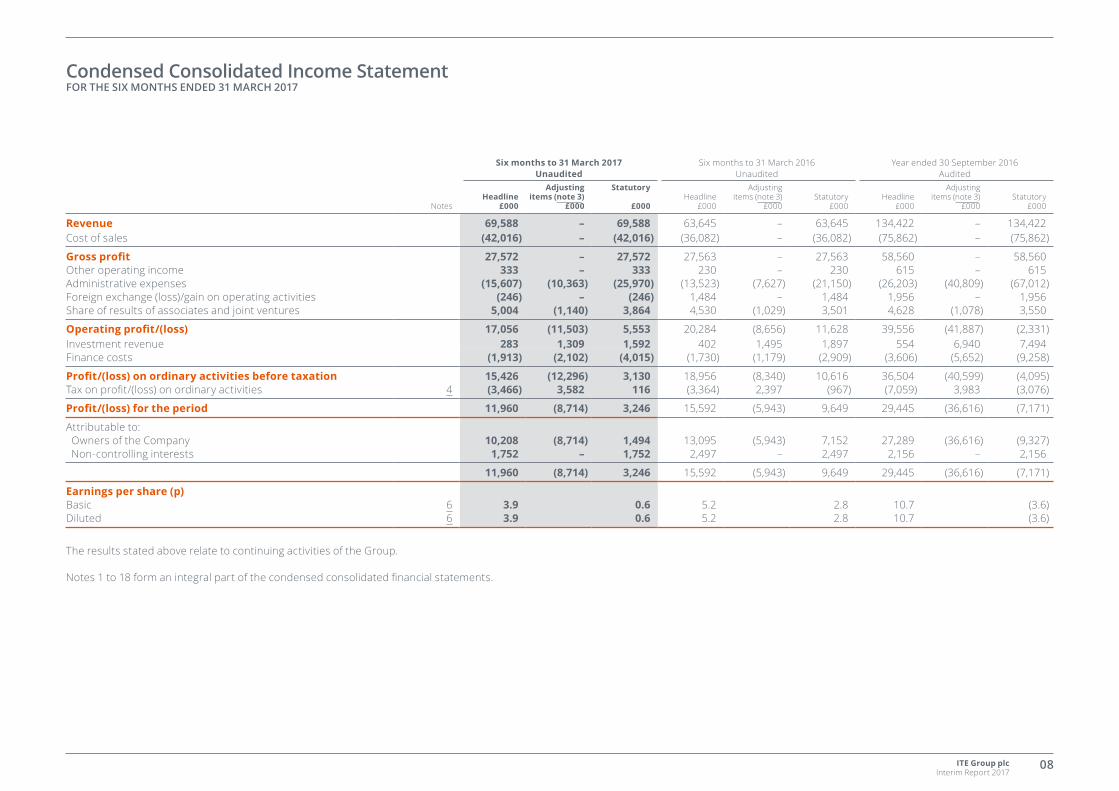
Revenue 69,588 – 69,588 63,645 – 63,645 134,422 – 134,422Cost of sales (42,016) – (42,016) (36,082) – (36,082) (75,862) – (75,862)
Gross profit 27,572 – 27,572 27,563 – 27,563 58,560 – 58,560Other operating income 333 – 333 230 – 230 615 – 615Administrative expenses (15,607) (10,363) (25,970) (13,523) (7,627) (21,150) (26,203) (40,809) (67,012)Foreign exchange (loss)/gain on operating activities (246) – (246) 1,484 – 1,484 1,956 – 1,956Share of results of associates and joint ventures 5,004 (1,140) 3,864 4,530 (1,029) 3,501 4,628 (1,078) 3,550
Operating profit/(loss) 17,056 (11,503) 5,553 20,284 (8,656) 11,628 39,556 (41,887) (2,331)Investment revenue 283 1,309 1,592 402 1,495 1,897 554 6,940 7,494Finance costs (1,913) (2,102) (4,015) (1,730) (1,179) (2,909) (3,606) (5,652) (9,258)
Profit/(loss) on ordinary activities before taxation 15,426 (12,296) 3,130 18,956 (8,340) 10,616 36,504 (40,599) (4,095)Tax on profit/(loss) on ordinary activities 4 (3,466) 3,582 116 (3,364) 2,397 (967) (7,059) 3,983 (3,076)
Profit/(loss) for the period 11,960 (8,714) 3,246 15,592 (5,943) 9,649 29,445 (36,616) (7,171)
Attributable to: Owners of the Company 10,208 (8,714) 1,494 13,095 (5,943) 7,152 27,289 (36,616) (9,327) Non-controlling interests 1,752 – 1,752 2,497 – 2,497 2,156 – 2,156
11,960 (8,714) 3,246 15,592 (5,943) 9,649 29,445 (36,616) (7,171)
Earnings per share (p)Basic 6 3.9 0.6 5.2 2.8 10.7 (3.6)Diluted 6 3.9 0.6 5.2 2.8 10.7 (3.6)
The results stated above relate to continuing activities of the Group.
Notes 1 to 18 form an integral part of the condensed consolidated financial statements.
Condensed Consolidated Income Statement FOR THE SIX MONTHS ENDED 31 MARCH 2017
ITE Group plc Interim Report 2017
09
Six months to 31 March 2017
Unaudited£000
Six months to 31 March 2016
Unaudited£000
Year ended 30 September
2016Audited
£000
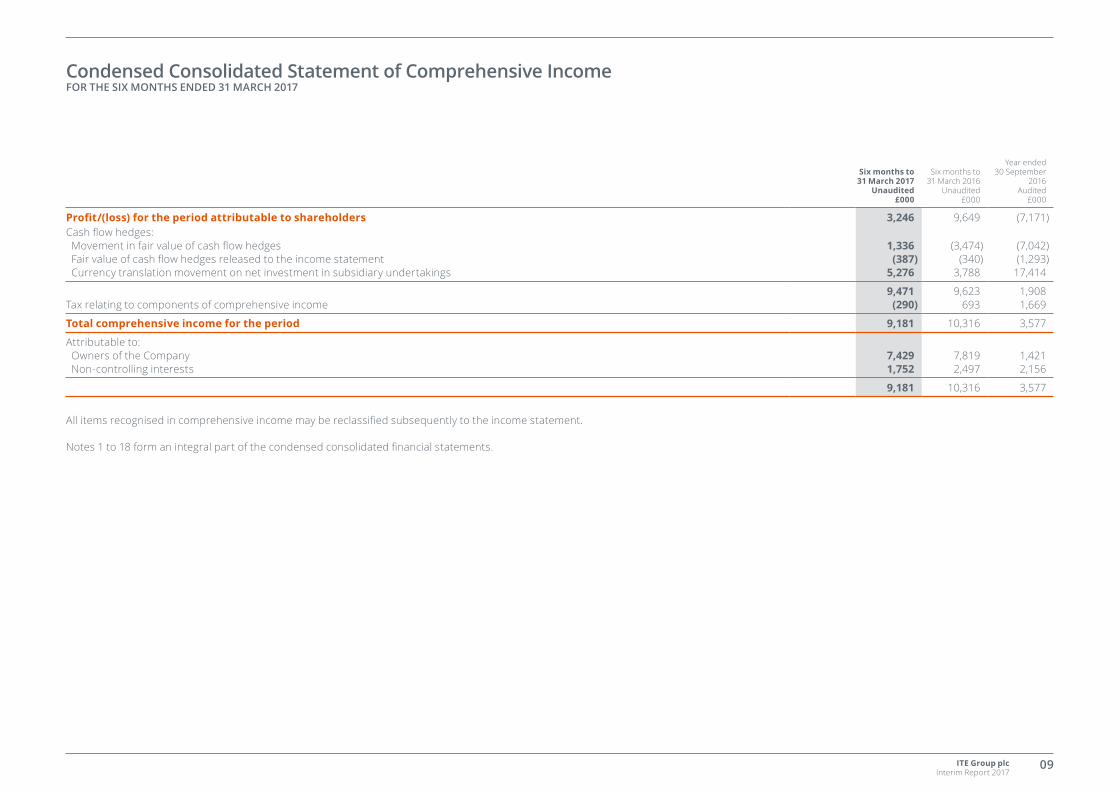
Profit/(loss) for the period attributable to shareholders 3,246 9,649 (7,171)Cash flow hedges: Movement in fair value of cash flow hedges 1,336 (3,474) (7,042) Fair value of cash flow hedges released to the income statement (387) (340) (1,293) Currency translation movement on net investment in subsidiary undertakings 5,276 3,788 17,414
9,471 9,623 1,908Tax relating to components of comprehensive income (290) 693 1,669
Total comprehensive income for the period 9,181 10,316 3,577
Attributable to: Owners of the Company 7,429 7,819 1,421 Non-controlling interests 1,752 2,497 2,156
9,181 10,316 3,577
All items recognised in comprehensive income may be reclassified subsequently to the income statement.
Notes 1 to 18 form an integral part of the condensed consolidated financial statements.
Condensed Consolidated Statement of Comprehensive Income FOR THE SIX MONTHS ENDED 31 MARCH 2017
ITE Group plc Interim Report 2017
10
ShareCapital
£000
SharePremiumAccount
£000
MergerReserve
£000
CapitalRedemption
Reserve £000
ESOTReserve
£000
RetainedEarnings
£000
PutOption
Reserve £000
Translation Reserve
£000
HedgeReserve
£000Total £000
NonControlling
interests£000
TotalEquity
£000
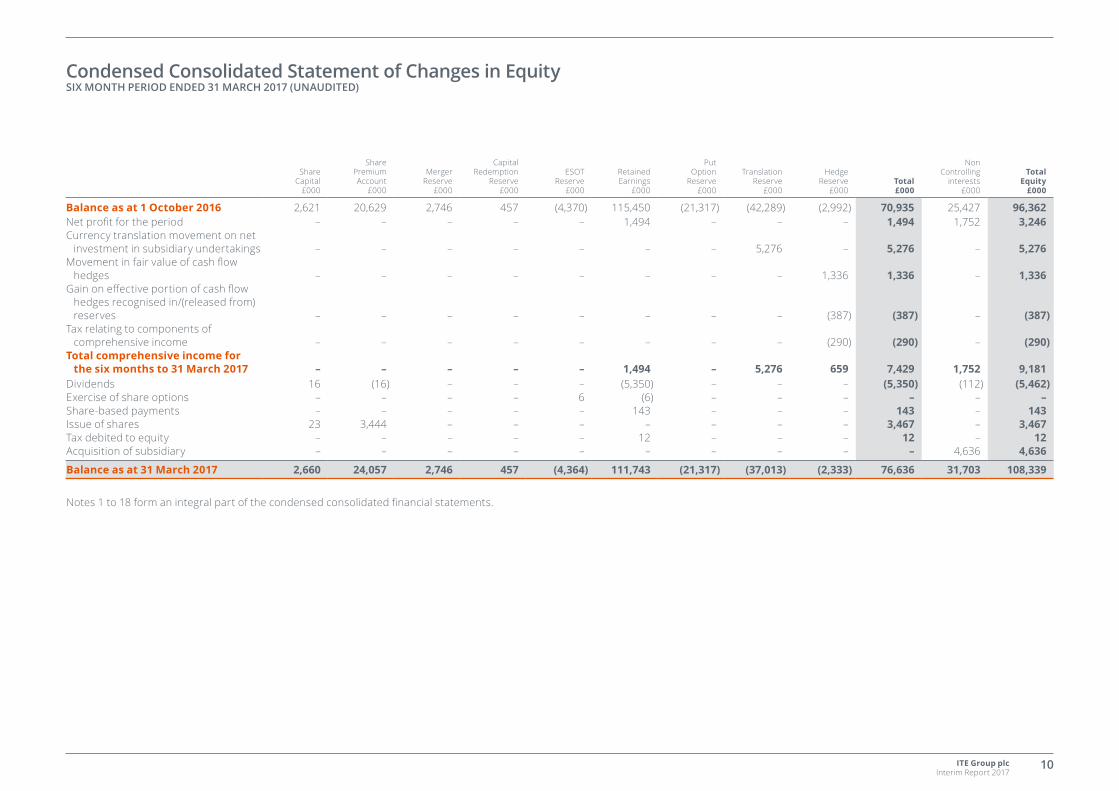
Balance as at 1 October 2016 2,621 20,629 2,746 457 (4,370) 115,450 (21,317) (42,289) (2,992) 70,935 25,427 96,362Net profit for the period – – – – – 1,494 – – – 1,494 1,752 3,246Currency translation movement on net
investment in subsidiary undertakings – – – – – – – 5,276 – 5,276 – 5,276Movement in fair value of cash flow
hedges – – – – – – – – 1,336 1,336 – 1,336Gain on effective portion of cash flow
hedges recognised in/(released from) reserves – – – – – – – – (387) (387) – (387)
Tax relating to components of comprehensive income – – – – – – – – (290) (290) – (290)
Total comprehensive income for the six months to 31 March 2017 – – – – – 1,494 – 5,276 659 7,429 1,752 9,181
Dividends 16 (16) – – – (5,350) – – – (5,350) (112) (5,462)Exercise of share options – – – – 6 (6) – – – – – –Share-based payments – – – – – 143 – – – 143 – 143Issue of shares 23 3,444 – – – – – – – 3,467 – 3,467Tax debited to equity – – – – – 12 – – – 12 – 12Acquisition of subsidiary – – – – – – – – – – 4,636 4,636
Balance as at 31 March 2017 2,660 24,057 2,746 457 (4,364) 111,743 (21,317) (37,013) (2,333) 76,636 31,703 108,339
Notes 1 to 18 form an integral part of the condensed consolidated financial statements.
Condensed Consolidated Statement of Changes in Equity SIX MONTH PERIOD ENDED 31 MARCH 2017 (UNAUDITED)
ITE Group plc Interim Report 2017
11
ShareCapital
£000
SharePremiumAccount
£000
MergerReserve
£000
CapitalRedemption
Reserve £000
ESOTReserve
£000
RetainedEarnings
£000
PutOption
Reserve £000
Translation Reserve
£000
HedgeReserve
£000Total £000
NonControlling
interests£000
TotalEquity
£000
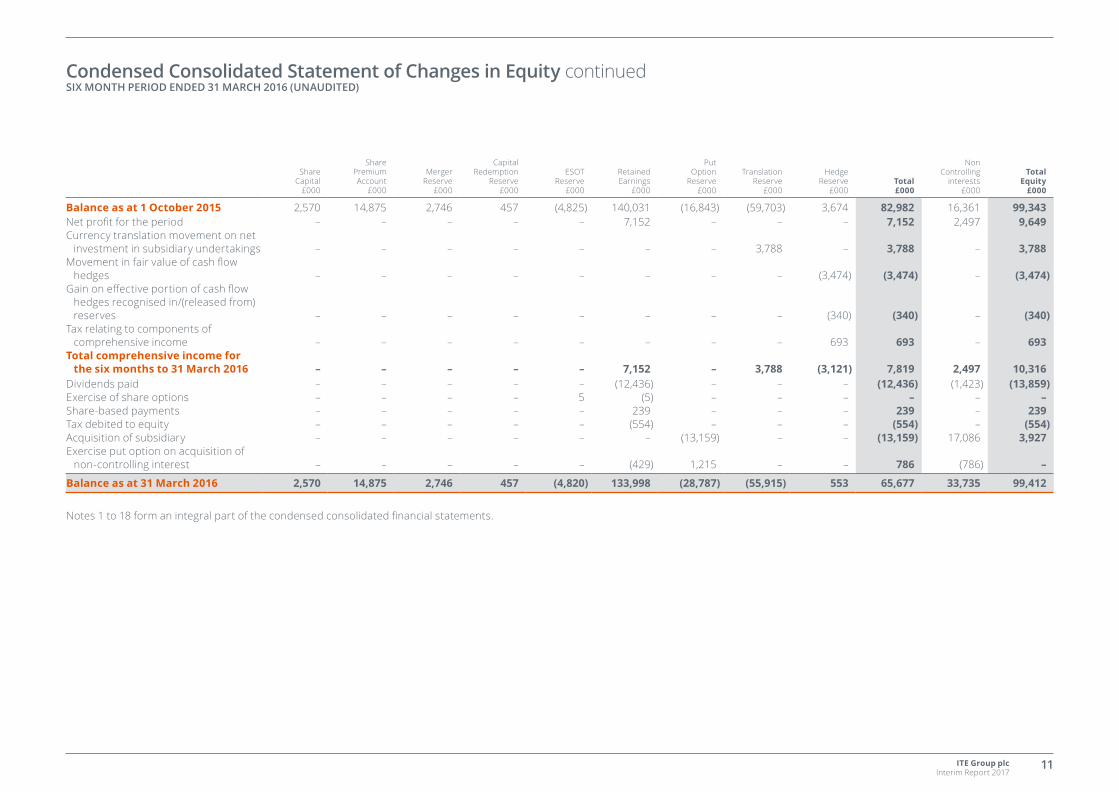
Balance as at 1 October 2015 2,570 14,875 2,746 457 (4,825) 140,031 (16,843) (59,703) 3,674 82,982 16,361 99,343Net profit for the period – – – – – 7,152 – – – 7,152 2,497 9,649Currency translation movement on net
investment in subsidiary undertakings – – – – – – – 3,788 – 3,788 – 3,788Movement in fair value of cash flow
hedges – – – – – – – – (3,474) (3,474) – (3,474)Gain on effective portion of cash flow
hedges recognised in/(released from) reserves – – – – – – – – (340) (340) – (340)
Tax relating to components of comprehensive income – – – – – – – – 693 693 – 693
Total comprehensive income for the six months to 31 March 2016 – – – – – 7,152 – 3,788 (3,121) 7,819 2,497 10,316
Dividends paid – – – – – (12,436) – – – (12,436) (1,423) (13,859)Exercise of share options – – – – 5 (5) – – – – – –Share-based payments – – – – – 239 – – – 239 – 239Tax debited to equity – – – – – (554) – – – (554) – (554)Acquisition of subsidiary – – – – – – (13,159) – – (13,159) 17,086 3,927Exercise put option on acquisition of
non-controlling interest – – – – – (429) 1,215 – – 786 (786) –
Balance as at 31 March 2016 2,570 14,875 2,746 457 (4,820) 133,998 (28,787) (55,915) 553 65,677 33,735 99,412
Notes 1 to 18 form an integral part of the condensed consolidated financial statements.
Condensed Consolidated Statement of Changes in Equity continuedSIX MONTH PERIOD ENDED 31 MARCH 2016 (UNAUDITED)
ITE Group plc Interim Report 2017
12
ShareCapital
£000
SharePremiumAccount
£000
MergerReserve
£000
CapitalRedemption
Reserve £000
ESOTReserve
£000
RetainedEarnings
£000
PutOption
Reserve £000
Translation Reserve
£000
HedgeReserve
£000Total £000
NonControlling
interests£000
TotalEquity
£000
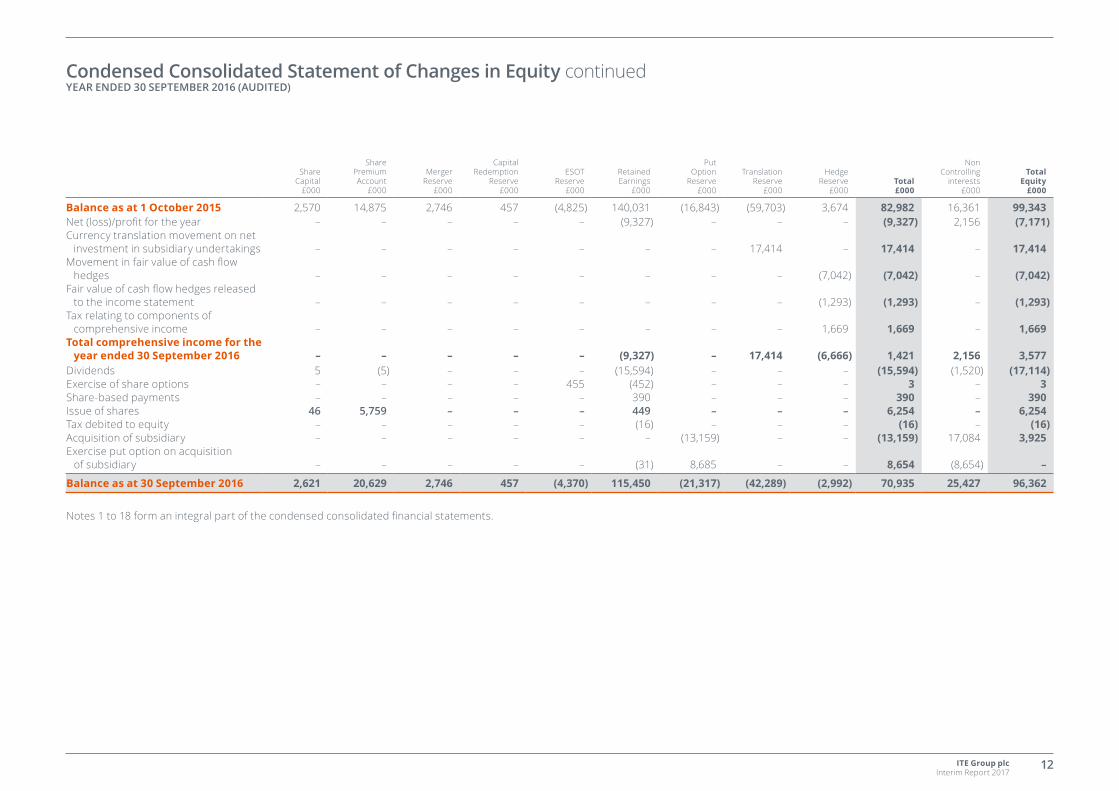
Balance as at 1 October 2015 2,570 14,875 2,746 457 (4,825) 140,031 (16,843) (59,703) 3,674 82,982 16,361 99,343Net (loss)/profit for the year – – – – – (9,327) – – – (9,327) 2,156 (7,171)Currency translation movement on net
investment in subsidiary undertakings – – – – – – – 17,414 – 17,414 – 17,414Movement in fair value of cash flow
hedges – – – – – – – – (7,042) (7,042) – (7,042)Fair value of cash flow hedges released
to the income statement – – – – – – – – (1,293) (1,293) – (1,293)Tax relating to components of
comprehensive income – – – – – – – – 1,669 1,669 – 1,669Total comprehensive income for the
year ended 30 September 2016 – – – – – (9,327) – 17,414 (6,666) 1,421 2,156 3,577Dividends 5 (5) – – – (15,594) – – – (15,594) (1,520) (17,114)Exercise of share options – – – – 455 (452) – – – 3 – 3Share-based payments – – – – – 390 – – – 390 – 390Issue of shares 46 5,759 – – – 449 – – – 6,254 – 6,254Tax debited to equity – – – – – (16) – – – (16) – (16)Acquisition of subsidiary – – – – – – (13,159) – – (13,159) 17,084 3,925Exercise put option on acquisition
of subsidiary – – – – – (31) 8,685 – – 8,654 (8,654) –
Balance as at 30 September 2016 2,621 20,629 2,746 457 (4,370) 115,450 (21,317) (42,289) (2,992) 70,935 25,427 96,362
Notes 1 to 18 form an integral part of the condensed consolidated financial statements.
Condensed Consolidated Statement of Changes in Equity continuedYEAR ENDED 30 SEPTEMBER 2016 (AUDITED)
ITE Group plc Interim Report 2017
13
Notes
31 March2017
Unaudited£000
31 March2016
Unaudited£000
30 September2016
Unaudited£000
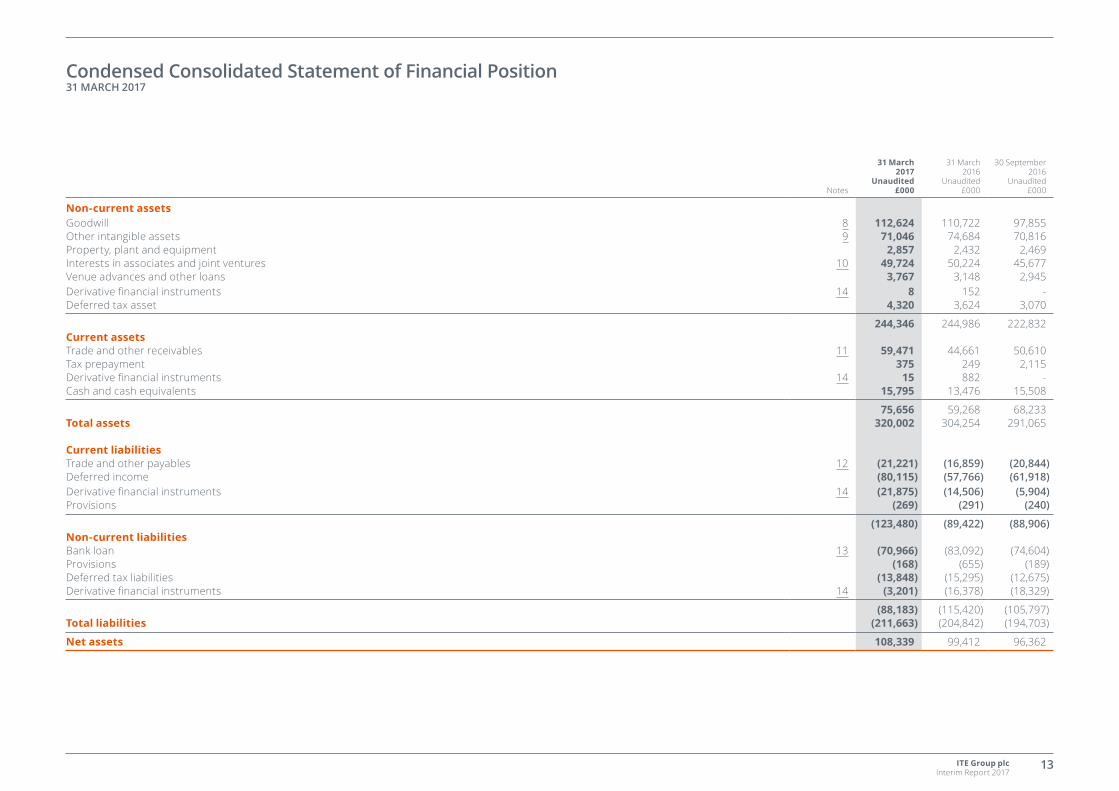
Non-current assetsGoodwill 8 112,624 110,722 97,855Other intangible assets 9 71,046 74,684 70,816Property, plant and equipment 2,857 2,432 2,469Interests in associates and joint ventures 10 49,724 50,224 45,677Venue advances and other loans 3,767 3,148 2,945Derivative financial instruments 14 8 152 -Deferred tax asset 4,320 3,624 3,070
244,346 244,986 222,832Current assetsTrade and other receivables 11 59,471 44,661 50,610Tax prepayment 375 249 2,115Derivative financial instruments 14 15 882 -Cash and cash equivalents 15,795 13,476 15,508
75,656 59,268 68,233Total assets 320,002 304,254 291,065
Current liabilitiesTrade and other payables 12 (21,221) (16,859) (20,844)Deferred income (80,115) (57,766) (61,918)Derivative financial instruments 14 (21,875) (14,506) (5,904)Provisions (269) (291) (240)
(123,480) (89,422) (88,906)Non-current liabilitiesBank loan 13 (70,966) (83,092) (74,604)Provisions (168) (655) (189)Deferred tax liabilities (13,848) (15,295) (12,675)Derivative financial instruments 14 (3,201) (16,378) (18,329)
(88,183) (115,420) (105,797)Total liabilities (211,663) (204,842) (194,703)
Net assets 108,339 99,412 96,362
Condensed Consolidated Statement of Financial Position 31 MARCH 2017
ITE Group plc Interim Report 2017
14
Notes
31 March2017
Unaudited£000
31 March2016
Unaudited£000
30 September2016
Unaudited£000
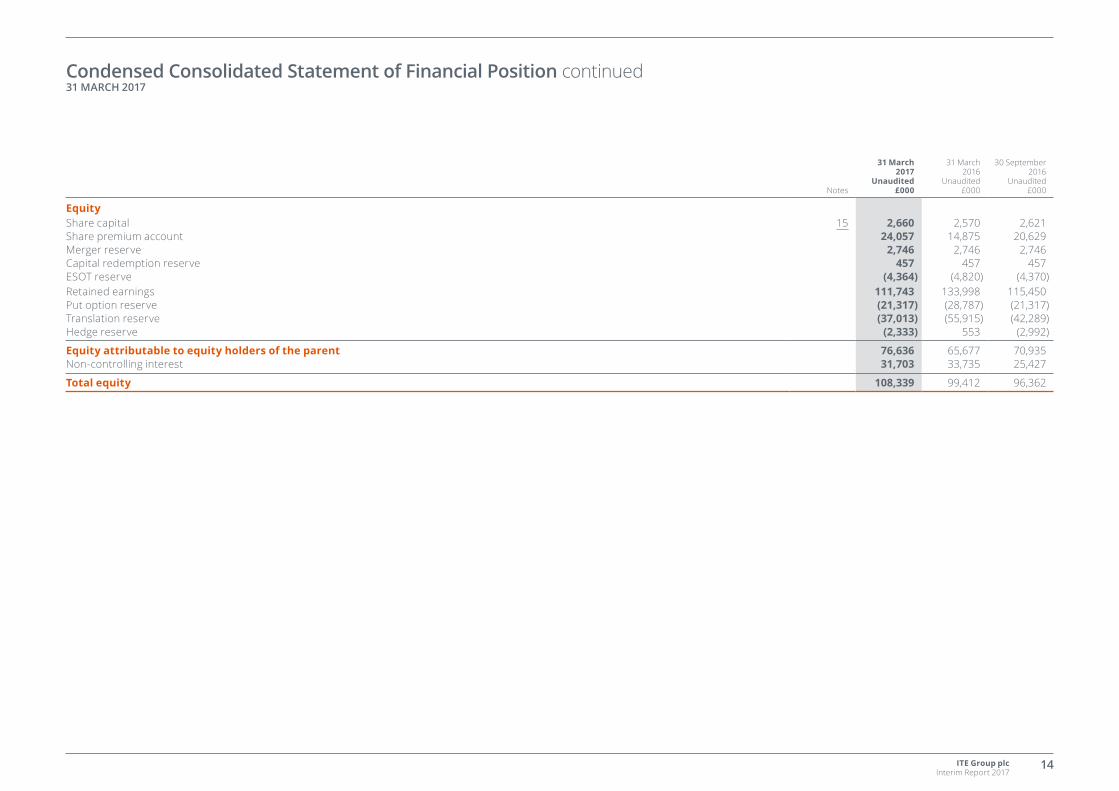
EquityShare capital 15 2,660 2,570 2,621Share premium account 24,057 14,875 20,629Merger reserve 2,746 2,746 2,746Capital redemption reserve 457 457 457ESOT reserve (4,364) (4,820) (4,370)Retained earnings 111,743 133,998 115,450Put option reserve (21,317) (28,787) (21,317)Translation reserve (37,013) (55,915) (42,289)Hedge reserve (2,333) 553 (2,992)
Equity attributable to equity holders of the parent 76,636 65,677 70,935Non-controlling interest 31,703 33,735 25,427
Total equity 108,339 99,412 96,362
Condensed Consolidated Statement of Financial Position continued 31 MARCH 2017
ITE Group plc Interim Report 2017
15
Notes
Six monthsto 31 March
2017Unaudited
£000
Six monthsto 31 March
2016Unaudited
£000
Year ended30 September
2016Audited
£000
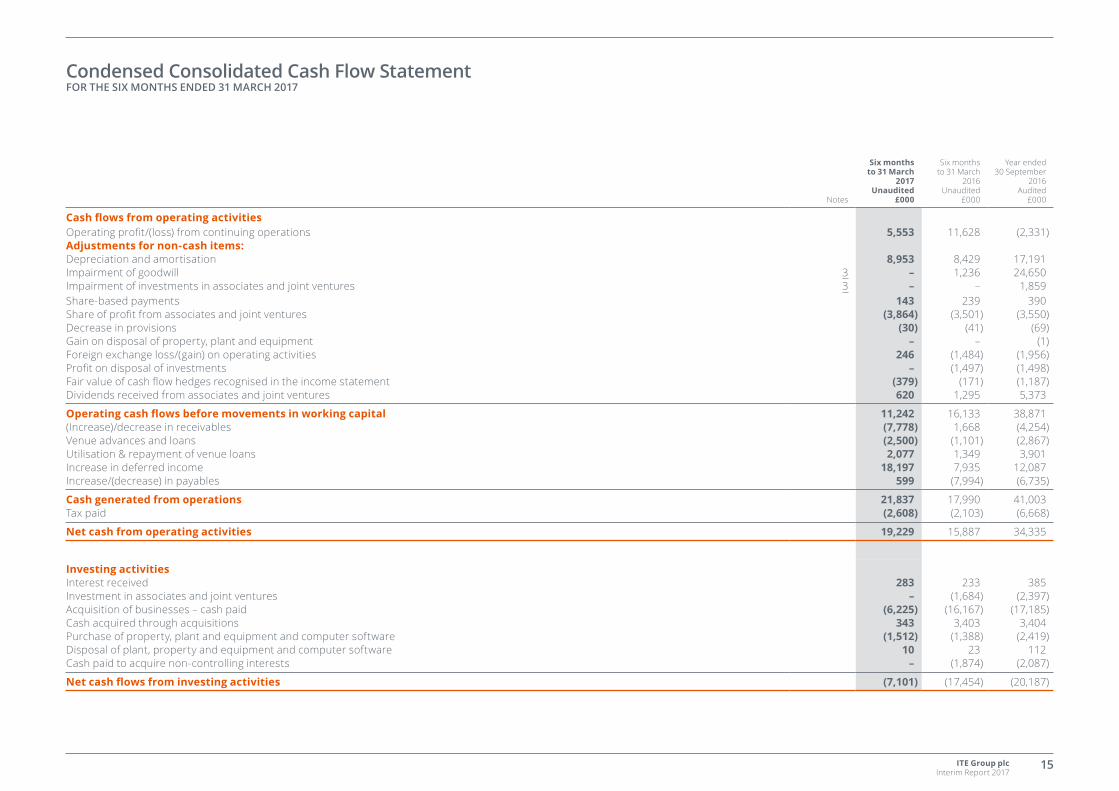
Cash flows from operating activitiesOperating profit/(loss) from continuing operations 5,553 11,628 (2,331)Adjustments for non-cash items:Depreciation and amortisation 8,953 8,429 17,191Impairment of goodwill 3 – 1,236 24,650Impairment of investments in associates and joint ventures 3 – – 1,859Share-based payments 143 239 390Share of profit from associates and joint ventures (3,864) (3,501) (3,550)Decrease in provisions (30) (41) (69)Gain on disposal of property, plant and equipment – – (1)Foreign exchange loss/(gain) on operating activities 246 (1,484) (1,956)Profit on disposal of investments – (1,497) (1,498)Fair value of cash flow hedges recognised in the income statement (379) (171) (1,187)Dividends received from associates and joint ventures 620 1,295 5,373
Operating cash flows before movements in working capital 11,242 16,133 38,871(Increase)/decrease in receivables (7,778) 1,668 (4,254)Venue advances and loans (2,500) (1,101) (2,867)Utilisation & repayment of venue loans 2,077 1,349 3,901Increase in deferred income 18,197 7,935 12,087Increase/(decrease) in payables 599 (7,994) (6,735)
Cash generated from operations 21,837 17,990 41,003Tax paid (2,608) (2,103) (6,668)
Net cash from operating activities 19,229 15,887 34,335
Investing activitiesInterest received 283 233 385Investment in associates and joint ventures – (1,684) (2,397)Acquisition of businesses – cash paid (6,225) (16,167) (17,185)Cash acquired through acquisitions 343 3,403 3,404Purchase of property, plant and equipment and computer software (1,512) (1,388) (2,419)Disposal of plant, property and equipment and computer software 10 23 112Cash paid to acquire non-controlling interests – (1,874) (2,087)
Net cash flows from investing activities (7,101) (17,454) (20,187)
Condensed Consolidated Cash Flow Statement FOR THE SIX MONTHS ENDED 31 MARCH 2017
ITE Group plc Interim Report 2017
16
Six monthsto 31 March
2017Unaudited
£000
Six monthsto 31 March
2016Unaudited
£000
Year ended30 September
2016Audited
£000
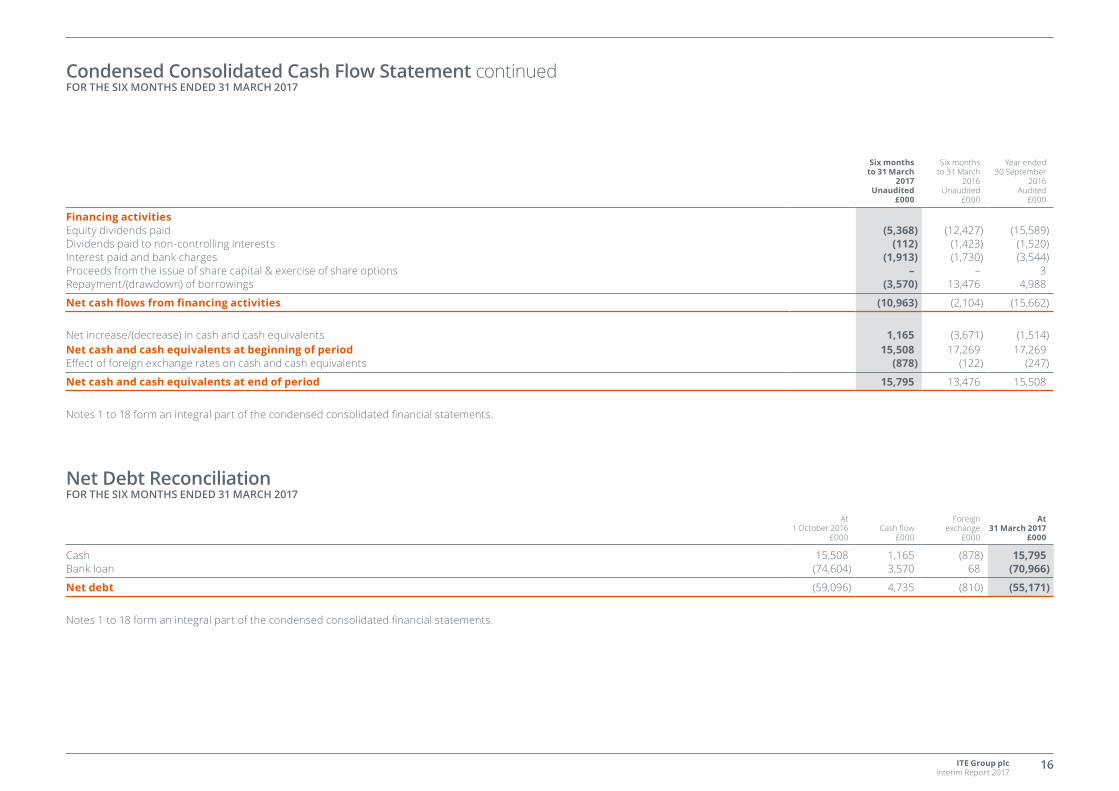
Financing activitiesEquity dividends paid (5,368) (12,427) (15,589)Dividends paid to non-controlling interests (112) (1,423) (1,520)Interest paid and bank charges (1,913) (1,730) (3,544)Proceeds from the issue of share capital & exercise of share options – – 3Repayment/(drawdown) of borrowings (3,570) 13,476 4,988
Net cash flows from financing activities (10,963) (2,104) (15,662)
Net increase/(decrease) in cash and cash equivalents 1,165 (3,671) (1,514)Net cash and cash equivalents at beginning of period 15,508 17,269 17,269Effect of foreign exchange rates on cash and cash equivalents (878) (122) (247)
Net cash and cash equivalents at end of period 15,795 13,476 15,508
Notes 1 to 18 form an integral part of the condensed consolidated financial statements.
At 1 October 2016
£000Cash flow
£000
Foreign exchange
£000
At 31 March 2017
£000
Cash 15,508 1,165 (878) 15,795Bank loan (74,604) 3,570 68 (70,966)
Net debt (59,096) 4,735 (810) (55,171)
Notes 1 to 18 form an integral part of the condensed consolidated financial statements.
Condensed Consolidated Cash Flow Statement continued FOR THE SIX MONTHS ENDED 31 MARCH 2017
Net Debt Reconciliation FOR THE SIX MONTHS ENDED 31 MARCH 2017
ITE Group plc Interim Report 2017
17
1. GENERAL INFORMATION AND BASIS OF PREPARATIONThe information for the year ended 30 September 2016 does not constitute statutory accounts as defined in section 434 of the Companies Act 2006. A copy of the statutory accounts for that year has been delivered to the Registrar of Companies. The auditor reported on those accounts: their report was unqualified, did not draw attention to any matters by way of emphasis and did not contain a statement under section 498(2) or (3) of the Companies Act 2006.
The annual financial statements of ITE Group plc are prepared in accordance with IFRS as adopted by the European Union. The condensed set of financial statements included in this half-yearly financial report has been prepared in accordance with International Accounting Standard 34 ‘Interim Financial Reporting’, as adopted by the European Union.
Accounting policiesThe interim financial statements have been prepared on the basis of the accounting policies and methods of computation applicable for the year ended 30 September 2016. These accounting policies are consistent with those applied in the preparation of the accounts for the year ended 30 September 2016 except as described below.
No new standards, amendments to standards and interpretations have been adopted and applied in the period.
At the date of authorisation of these financial statements, the following standards and interpretations which have not been applied in these financial statements were in issue but not yet effective (and in some cases had not yet been adopted by the EU): – Amendments to IAS 7 Statement of cash flows – Amendments to IFRS 2 Share-based payments – Clarifications to IFRS 15 Revenue from contracts with customers – IFRS 9 Financial instruments – IFRS 15 Revenue from contracts with customers – Amendments to IAS 12 Income taxes – IFRS 16 Leases
The Directors anticipate that the adoption of these standards and interpretations in future periods will have no material impact on the financial statements of the Group, with the exception of the adoption of IFRS 16 Leases, which will replace the current leasing standard, IAS 17 Leases.
IFRS 16 requires all leases to be treated in a consistent way to the current rules on finance leases. This will result in all leases being disclosed in the Statement of Financial Position, with the exception of short-term leases, where, for lease terms of less than 12 months, an election can be made to account for the expense in line with the payment terms.
This is expected to have a significant impact on both the Group’s Statement of Financial Position, as there will be an increase in lease assets and financial liabilities recognised, and the Group’s Income Statement, through a changing of the expense profile and the financial statement lines in which the expenses are recognised. The adoption of IFRS 16 will increase the expense charged at the beginning of our lease contracts, due to the straight-line operating lease expense charge being replaced by the finance cost approach, which, by its nature is front-loaded. Currently, our operating lease rentals are recognised within administrative expenses, but under IFRS 16, these will be classified as finance costs and therefore operating profit is expected to increase on adoption. The financial impact of the changes have yet to be quantified by management.
2. SEGMENTAL INFORMATIONIFRS 8 introduced the term Chief Operating Decision Maker (CODM). The Executive Management Team is considered to be the CODM and consists of the Chief Executive Officer, Chief Financial Officer, Strategy Director, HR Director, Marketing Director, Company Secretary, and the Regional Managing Director for each of our key regions.
ITE’s reportable segments are strategic business units that are based in different geographic locations and managed separately. The products and services offered by each business unit are identical across the Group.
ITE Group evaluates performance on the basis of headline profit or loss from operations before tax.
Notes to the Interim Financial Statements
ITE Group plc Interim Report 2017
18
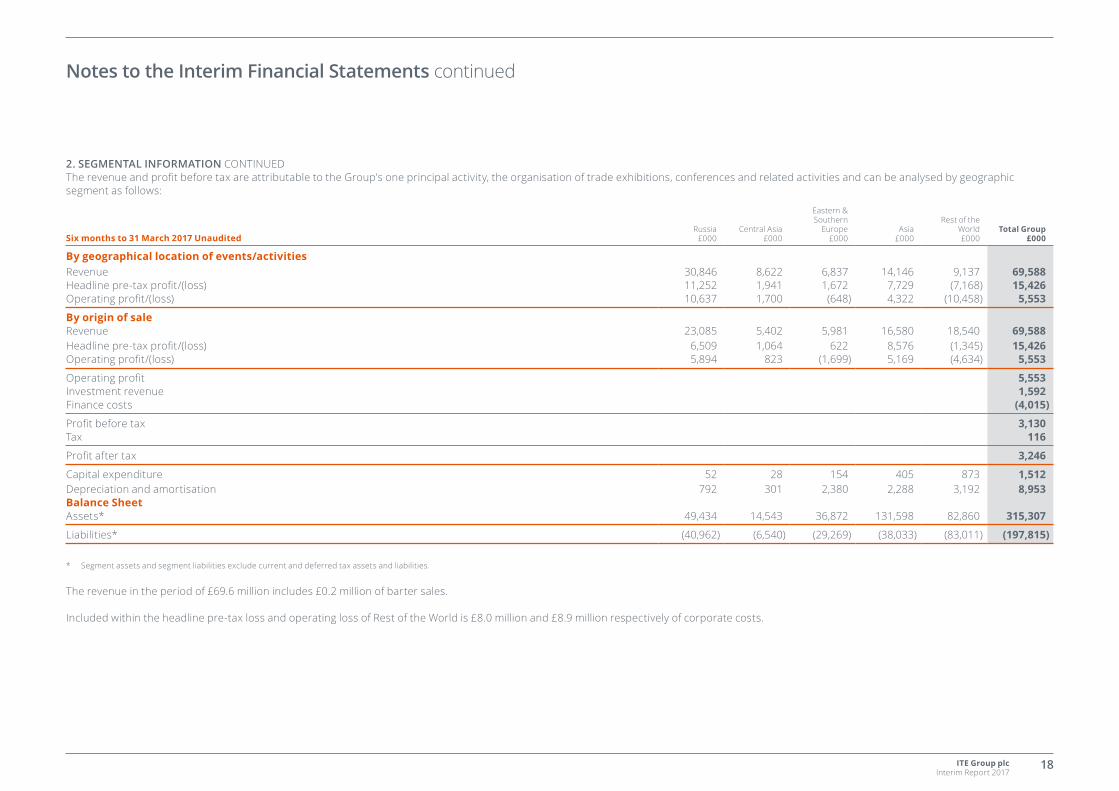
2. SEGMENTAL INFORMATION CONTINUEDThe revenue and profit before tax are attributable to the Group’s one principal activity, the organisation of trade exhibitions, conferences and related activities and can be analysed by geographic segment as follows:
Six months to 31 March 2017 UnauditedRussia
£000Central Asia
£000
Eastern & Southern
Europe£000
Asia£000
Rest of the World£000
Total Group£000
By geographical location of events/activities Revenue 30,846 8,622 6,837 14,146 9,137 69,588Headline pre-tax profit/(loss) 11,252 1,941 1,672 7,729 (7,168) 15,426Operating profit/(loss) 10,637 1,700 (648) 4,322 (10,458) 5,553
By origin of saleRevenue 23,085 5,402 5,981 16,580 18,540 69,588Headline pre-tax profit/(loss) 6,509 1,064 622 8,576 (1,345) 15,426Operating profit/(loss) 5,894 823 (1,699) 5,169 (4,634) 5,553
Operating profit 5,553Investment revenue 1,592Finance costs (4,015)
Profit before tax 3,130Tax 116
Profit after tax 3,246
Capital expenditure 52 28 154 405 873 1,512Depreciation and amortisation 792 301 2,380 2,288 3,192 8,953Balance SheetAssets* 49,434 14,543 36,872 131,598 82,860 315,307
Liabilities* (40,962) (6,540) (29,269) (38,033) (83,011) (197,815)
* Segment assets and segment liabilities exclude current and deferred tax assets and liabilities.
The revenue in the period of £69.6 million includes £0.2 million of barter sales.
Included within the headline pre-tax loss and operating loss of Rest of the World is £8.0 million and £8.9 million respectively of corporate costs.
Notes to the Interim Financial Statements continued
ITE Group plc Interim Report 2017
19
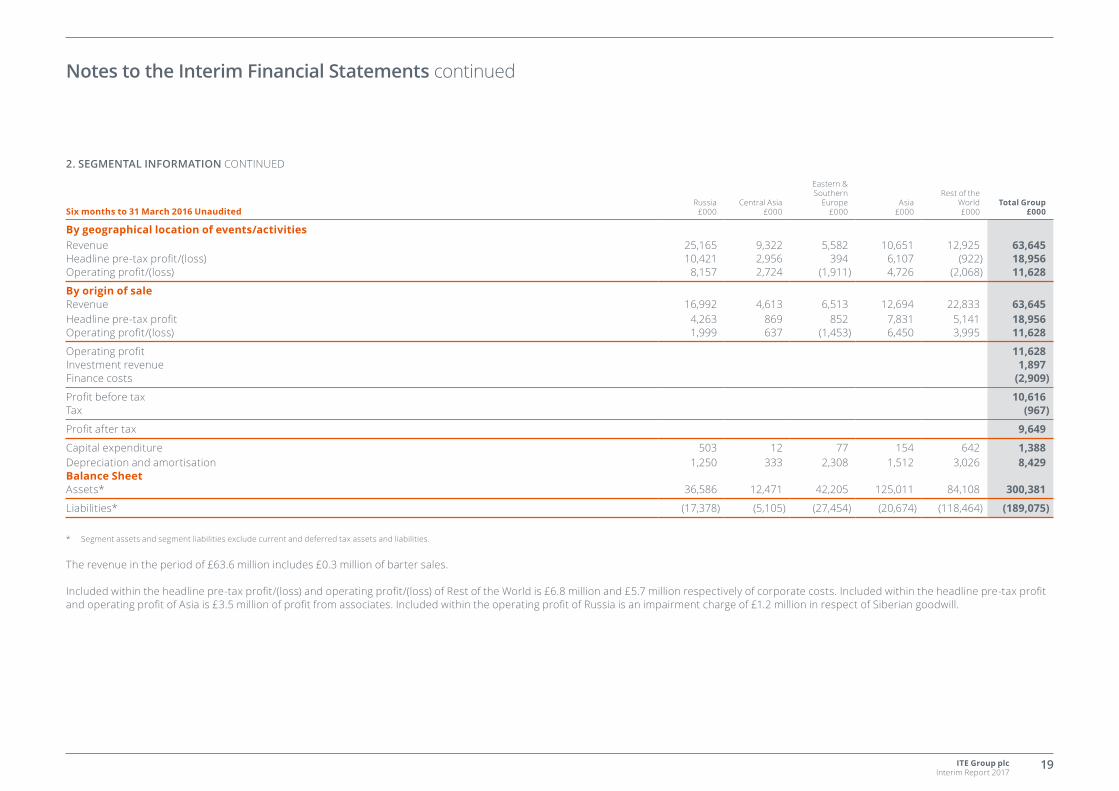
2. SEGMENTAL INFORMATION CONTINUED
Six months to 31 March 2016 UnauditedRussia
£000Central Asia
£000
Eastern & Southern
Europe£000
Asia£000
Rest of the World£000
Total Group£000
By geographical location of events/activities Revenue 25,165 9,322 5,582 10,651 12,925 63,645Headline pre-tax profit/(loss) 10,421 2,956 394 6,107 (922) 18,956Operating profit/(loss) 8,157 2,724 (1,911) 4,726 (2,068) 11,628
By origin of saleRevenue 16,992 4,613 6,513 12,694 22,833 63,645Headline pre-tax profit 4,263 869 852 7,831 5,141 18,956Operating profit/(loss) 1,999 637 (1,453) 6,450 3,995 11,628
Operating profit 11,628Investment revenue 1,897Finance costs (2,909)
Profit before tax 10,616Tax (967)
Profit after tax 9,649
Capital expenditure 503 12 77 154 642 1,388Depreciation and amortisation 1,250 333 2,308 1,512 3,026 8,429Balance SheetAssets* 36,586 12,471 42,205 125,011 84,108 300,381
Liabilities* (17,378) (5,105) (27,454) (20,674) (118,464) (189,075)
* Segment assets and segment liabilities exclude current and deferred tax assets and liabilities.
The revenue in the period of £63.6 million includes £0.3 million of barter sales.
Included within the headline pre-tax profit/(loss) and operating profit/(loss) of Rest of the World is £6.8 million and £5.7 million respectively of corporate costs. Included within the headline pre-tax profit and operating profit of Asia is £3.5 million of profit from associates. Included within the operating profit of Russia is an impairment charge of £1.2 million in respect of Siberian goodwill.
Notes to the Interim Financial Statements continued
ITE Group plc Interim Report 2017
20
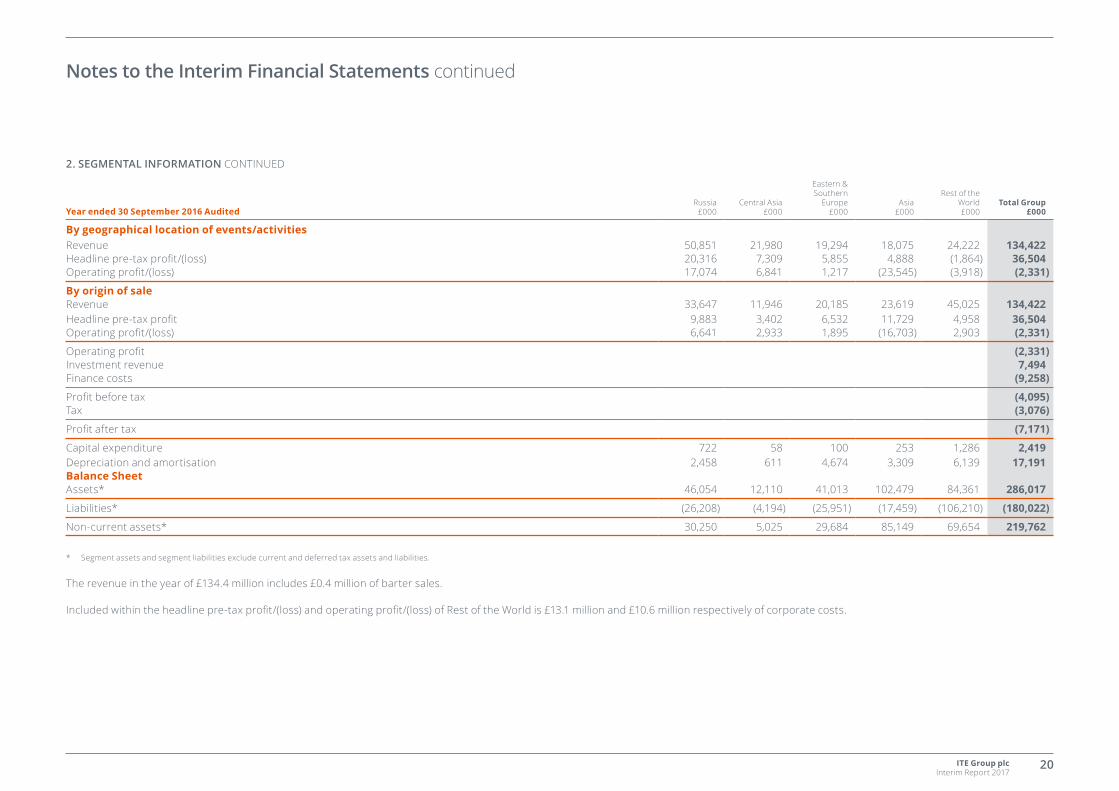
2. SEGMENTAL INFORMATION CONTINUED
Year ended 30 September 2016 AuditedRussia
£000Central Asia
£000
Eastern & Southern
Europe£000
Asia£000
Rest of the World£000
Total Group£000
By geographical location of events/activities Revenue 50,851 21,980 19,294 18,075 24,222 134,422Headline pre-tax profit/(loss) 20,316 7,309 5,855 4,888 (1,864) 36,504Operating profit/(loss) 17,074 6,841 1,217 (23,545) (3,918) (2,331)
By origin of saleRevenue 33,647 11,946 20,185 23,619 45,025 134,422Headline pre-tax profit 9,883 3,402 6,532 11,729 4,958 36,504Operating profit/(loss) 6,641 2,933 1,895 (16,703) 2,903 (2,331)
Operating profit (2,331)Investment revenue 7,494Finance costs (9,258)
Profit before tax (4,095)Tax (3,076)
Profit after tax (7,171)
Capital expenditure 722 58 100 253 1,286 2,419Depreciation and amortisation 2,458 611 4,674 3,309 6,139 17,191Balance SheetAssets* 46,054 12,110 41,013 102,479 84,361 286,017
Liabilities* (26,208) (4,194) (25,951) (17,459) (106,210) (180,022)
Non-current assets* 30,250 5,025 29,684 85,149 69,654 219,762
* Segment assets and segment liabilities exclude current and deferred tax assets and liabilities.
The revenue in the year of £134.4 million includes £0.4 million of barter sales.
Included within the headline pre-tax profit/(loss) and operating profit/(loss) of Rest of the World is £13.1 million and £10.6 million respectively of corporate costs.
Notes to the Interim Financial Statements continued
ITE Group plc Interim Report 2017
21
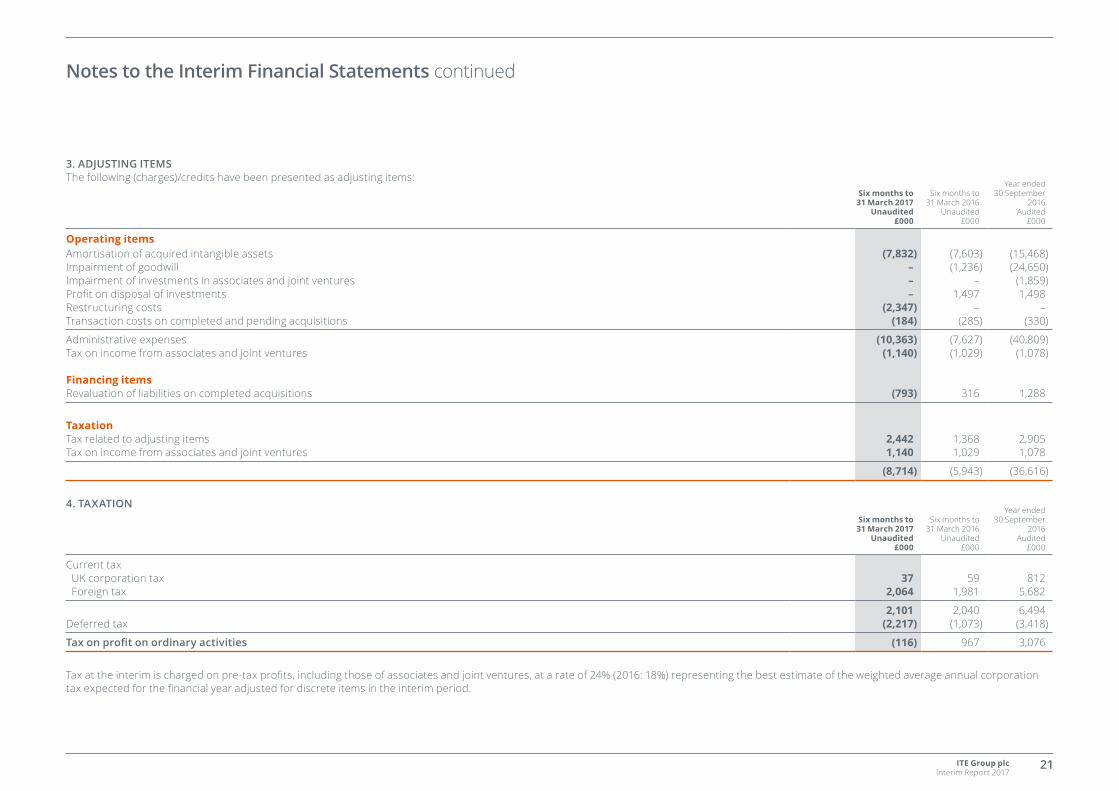
3. ADJUSTING ITEMSThe following (charges)/credits have been presented as adjusting items:
Six months to 31 March 2017
Unaudited£000
Six months to 31 March 2016
Unaudited£000
Year ended 30 September
2016Audited
£000
Operating itemsAmortisation of acquired intangible assets (7,832) (7,603) (15,468)Impairment of goodwill – (1,236) (24,650)Impairment of investments in associates and joint ventures – – (1,859)Profit on disposal of investments – 1,497 1,498Restructuring costs (2,347) – –Transaction costs on completed and pending acquisitions (184) (285) (330)
Administrative expenses (10,363) (7,627) (40,809)Tax on income from associates and joint ventures (1,140) (1,029) (1,078)
Financing itemsRevaluation of liabilities on completed acquisitions (793) 316 1,288
TaxationTax related to adjusting items 2,442 1,368 2,905Tax on income from associates and joint ventures 1,140 1,029 1,078
(8,714) (5,943) (36,616)
4. TAXATIONSix months to
31 March 2017Unaudited
£000
Six months to 31 March 2016
Unaudited£000
Year ended 30 September
2016Audited
£000
Current tax UK corporation tax 37 59 812 Foreign tax 2,064 1,981 5,682
2,101 2,040 6,494Deferred tax (2,217) (1,073) (3,418)
Tax on profit on ordinary activities (116) 967 3,076
Tax at the interim is charged on pre-tax profits, including those of associates and joint ventures, at a rate of 24% (2016: 18%) representing the best estimate of the weighted average annual corporation tax expected for the financial year adjusted for discrete items in the interim period.
Notes to the Interim Financial Statements continued
ITE Group plc Interim Report 2017
22
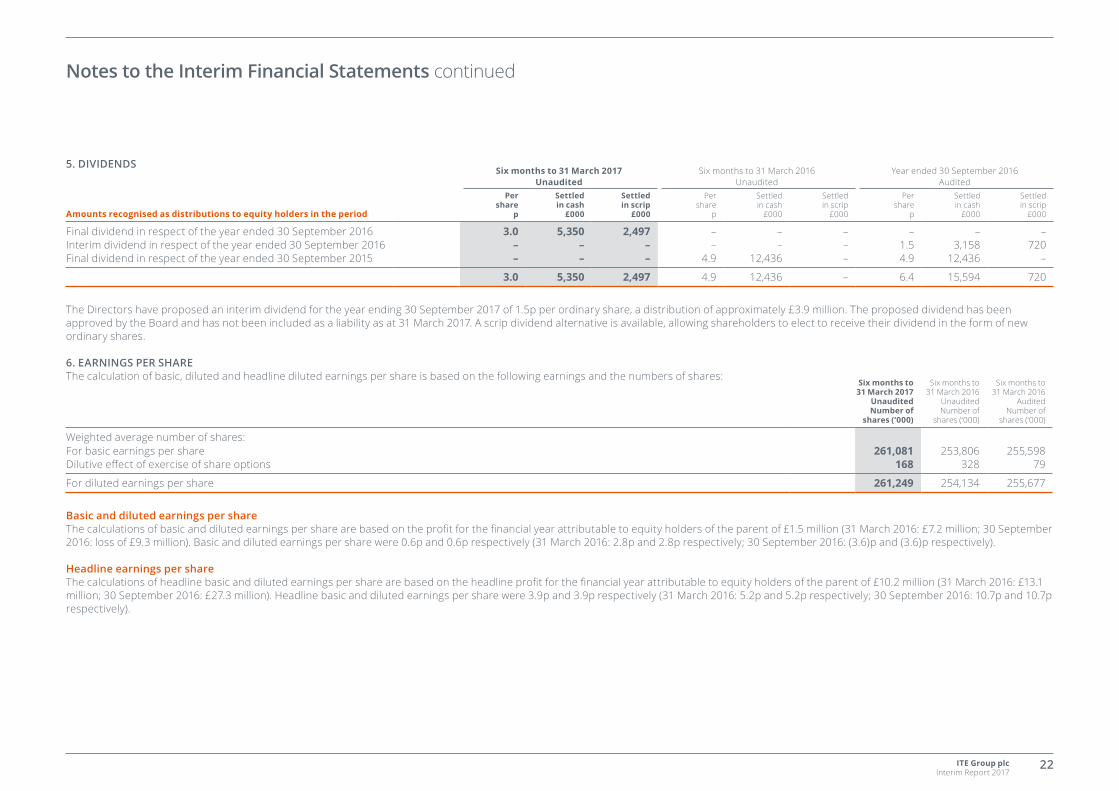
5. DIVIDENDSSix months to 31 March 2017
UnauditedSix months to 31 March 2016
UnauditedYear ended 30 September 2016
Audited
Amounts recognised as distributions to equity holders in the period
Pershare
p
Settled in cash
£000
Settled in scrip
£000
Pershare
p
Settled in cash
£000
Settled in scrip
£000
Pershare
p
Settled in cash
£000
Settled in scrip
£000
Final dividend in respect of the year ended 30 September 2016 3.0 5,350 2,497 – – – – – –Interim dividend in respect of the year ended 30 September 2016 – – – – – – 1.5 3,158 720Final dividend in respect of the year ended 30 September 2015 – – – 4.9 12,436 – 4.9 12,436 –
3.0 5,350 2,497 4.9 12,436 – 6.4 15,594 720
The Directors have proposed an interim dividend for the year ending 30 September 2017 of 1.5p per ordinary share, a distribution of approximately £3.9 million. The proposed dividend has been approved by the Board and has not been included as a liability as at 31 March 2017. A scrip dividend alternative is available, allowing shareholders to elect to receive their dividend in the form of new ordinary shares.
6. EARNINGS PER SHAREThe calculation of basic, diluted and headline diluted earnings per share is based on the following earnings and the numbers of shares:
Six months to 31 March 2017
UnauditedNumber of
shares (‘000)
Six months to 31 March 2016
UnauditedNumber of
shares (‘000)
Six months to 31 March 2016
AuditedNumber of
shares (‘000)
Weighted average number of shares:For basic earnings per share 261,081 253,806 255,598Dilutive effect of exercise of share options 168 328 79
For diluted earnings per share 261,249 254,134 255,677
Basic and diluted earnings per shareThe calculations of basic and diluted earnings per share are based on the profit for the financial year attributable to equity holders of the parent of £1.5 million (31 March 2016: £7.2 million; 30 September 2016: loss of £9.3 million). Basic and diluted earnings per share were 0.6p and 0.6p respectively (31 March 2016: 2.8p and 2.8p respectively; 30 September 2016: (3.6)p and (3.6)p respectively).
Headline earnings per shareThe calculations of headline basic and diluted earnings per share are based on the headline profit for the financial year attributable to equity holders of the parent of £10.2 million (31 March 2016: £13.1 million; 30 September 2016: £27.3 million). Headline basic and diluted earnings per share were 3.9p and 3.9p respectively (31 March 2016: 5.2p and 5.2p respectively; 30 September 2016: 10.7p and 10.7p respectively).
Notes to the Interim Financial Statements continued
ITE Group plc Interim Report 2017
23
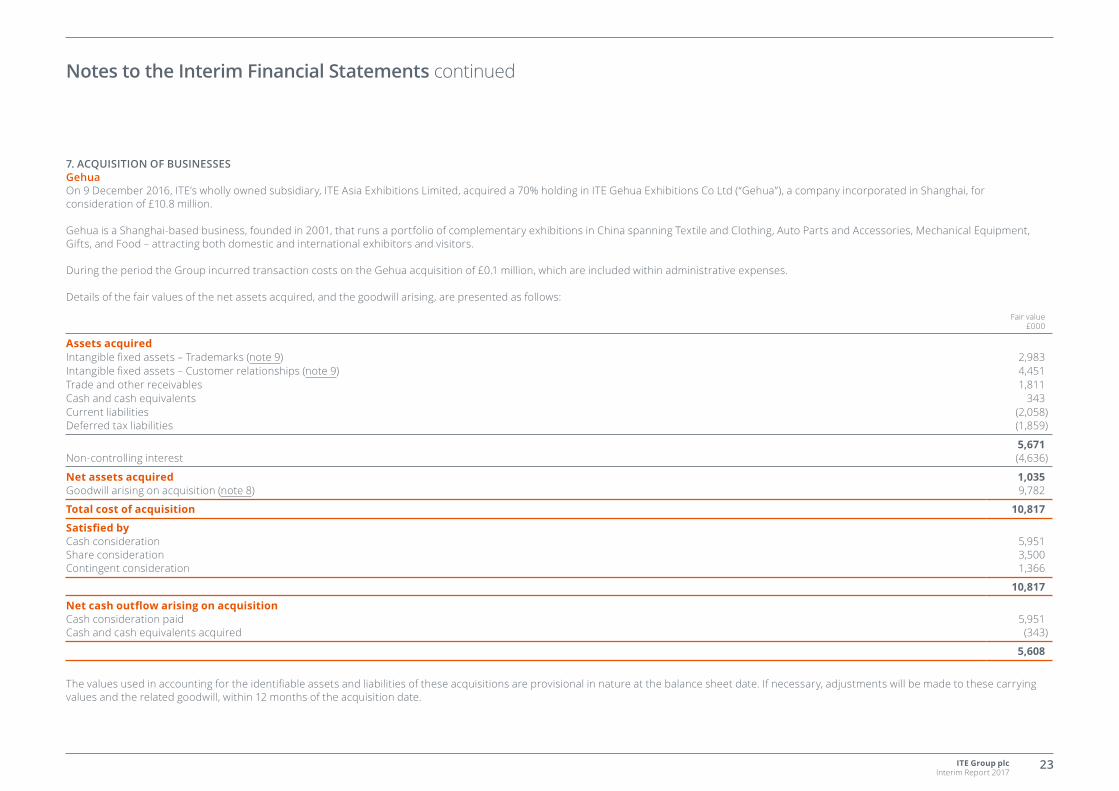
7. ACQUISITION OF BUSINESSESGehuaOn 9 December 2016, ITE’s wholly owned subsidiary, ITE Asia Exhibitions Limited, acquired a 70% holding in ITE Gehua Exhibitions Co Ltd (“Gehua”), a company incorporated in Shanghai, for consideration of £10.8 million.
Gehua is a Shanghai-based business, founded in 2001, that runs a portfolio of complementary exhibitions in China spanning Textile and Clothing, Auto Parts and Accessories, Mechanical Equipment, Gifts, and Food – attracting both domestic and international exhibitors and visitors.
During the period the Group incurred transaction costs on the Gehua acquisition of £0.1 million, which are included within administrative expenses.
Details of the fair values of the net assets acquired, and the goodwill arising, are presented as follows:
Fair value£000
Assets acquiredIntangible fixed assets – Trademarks (note 9) 2,983Intangible fixed assets – Customer relationships (note 9) 4,451Trade and other receivables 1,811Cash and cash equivalents 343Current liabilities (2,058)Deferred tax liabilities (1,859)
5,671Non-controlling interest (4,636)
Net assets acquired 1,035Goodwill arising on acquisition (note 8) 9,782
Total cost of acquisition 10,817
Satisfied byCash consideration 5,951 Share consideration 3,500Contingent consideration 1,366
10,817
Net cash outflow arising on acquisitionCash consideration paid 5,951Cash and cash equivalents acquired (343)
5,608
The values used in accounting for the identifiable assets and liabilities of these acquisitions are provisional in nature at the balance sheet date. If necessary, adjustments will be made to these carrying values and the related goodwill, within 12 months of the acquisition date.
Notes to the Interim Financial Statements continued
ITE Group plc Interim Report 2017
24
7. ACQUISITION OF BUSINESSES CONTINUED
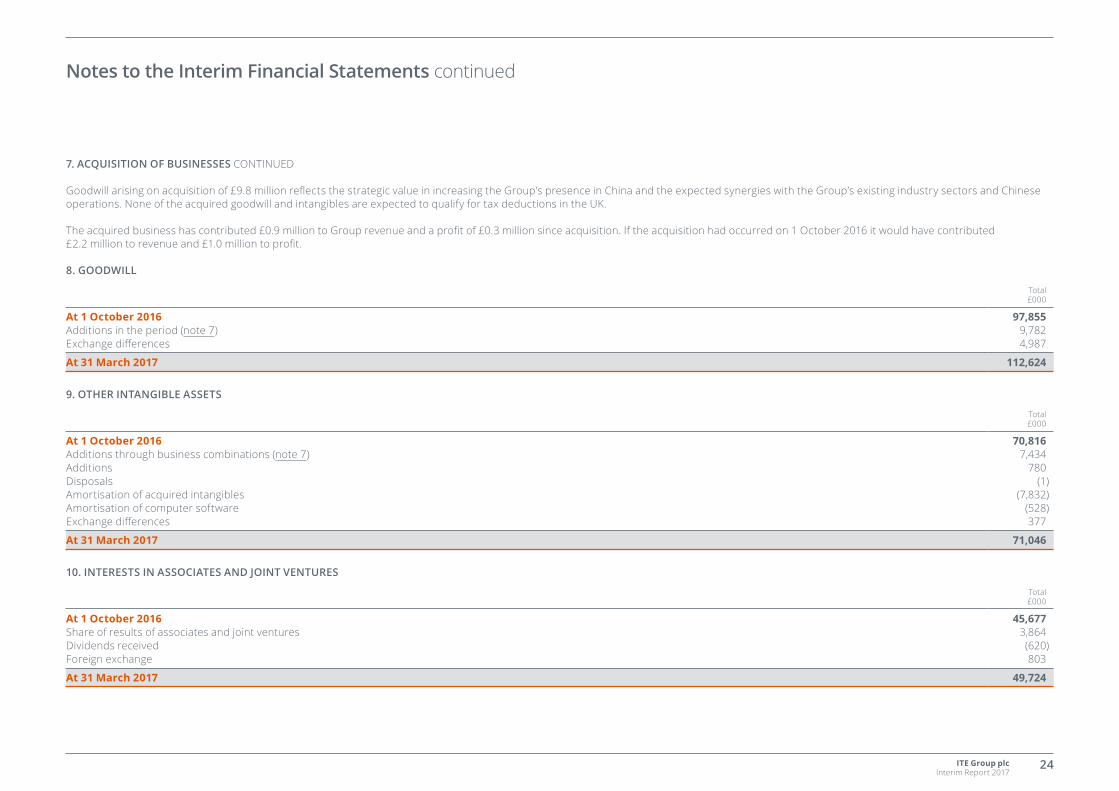
Goodwill arising on acquisition of £9.8 million reflects the strategic value in increasing the Group’s presence in China and the expected synergies with the Group’s existing industry sectors and Chinese operations. None of the acquired goodwill and intangibles are expected to qualify for tax deductions in the UK.
The acquired business has contributed £0.9 million to Group revenue and a profit of £0.3 million since acquisition. If the acquisition had occurred on 1 October 2016 it would have contributed £2.2 million to revenue and £1.0 million to profit.
8. GOODWILL
Total £000
At 1 October 2016 97,855Additions in the period (note 7) 9,782Exchange differences 4,987
At 31 March 2017 112,624
9. OTHER INTANGIBLE ASSETS
Total £000
At 1 October 2016 70,816Additions through business combinations (note 7) 7,434Additions 780Disposals (1)Amortisation of acquired intangibles (7,832)Amortisation of computer software (528)Exchange differences 377
At 31 March 2017 71,046
10. INTERESTS IN ASSOCIATES AND JOINT VENTURES
Total £000
At 1 October 2016 45,677Share of results of associates and joint ventures 3,864Dividends received (620)Foreign exchange 803
At 31 March 2017 49,724
Notes to the Interim Financial Statements continued
ITE Group plc Interim Report 2017
25
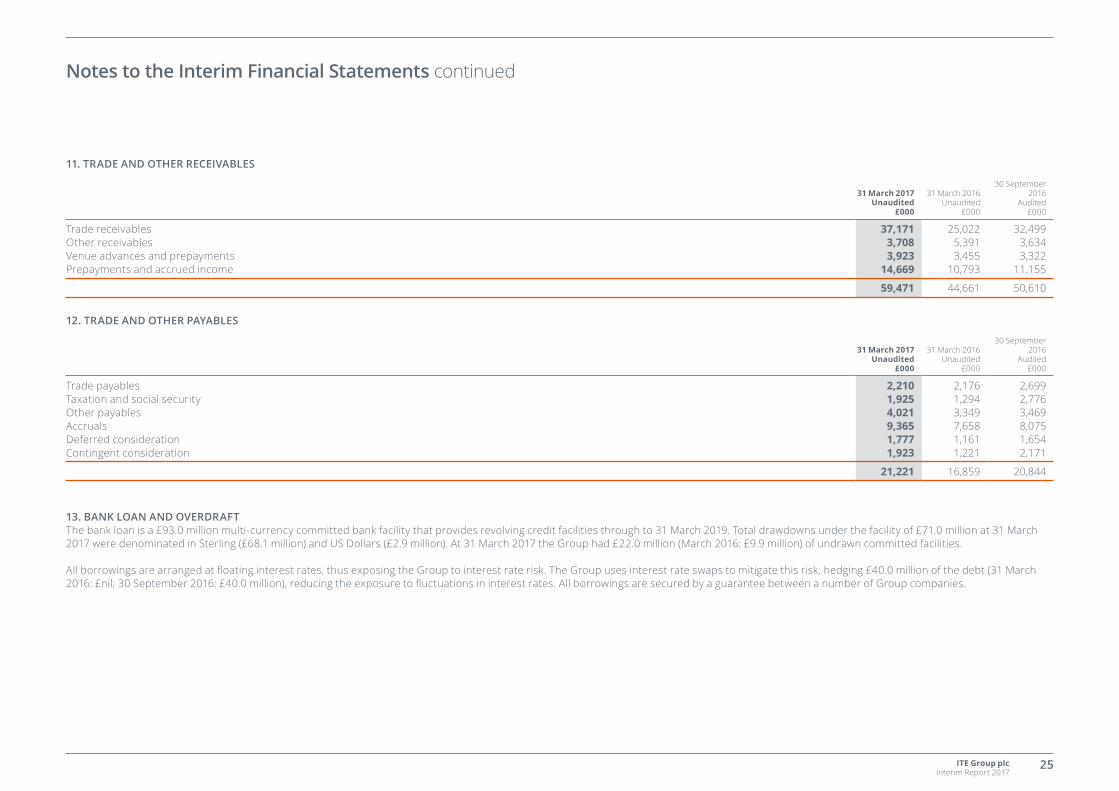
11. TRADE AND OTHER RECEIVABLES
31 March 2017 Unaudited
£000
31 March 2016 Unaudited
£000
30 September 2016
Audited£000
Trade receivables 37,171 25,022 32,499Other receivables 3,708 5,391 3,634Venue advances and prepayments 3,923 3,455 3,322Prepayments and accrued income 14,669 10,793 11,155
59,471 44,661 50,610
12. TRADE AND OTHER PAYABLES
31 March 2017 Unaudited
£000
31 March 2016 Unaudited
£000
30 September 2016
Audited £000
Trade payables 2,210 2,176 2,699Taxation and social security 1,925 1,294 2,776Other payables 4,021 3,349 3,469Accruals 9,365 7,658 8,075Deferred consideration 1,777 1,161 1,654Contingent consideration 1,923 1,221 2,171
21,221 16,859 20,844
13. BANK LOAN AND OVERDRAFT The bank loan is a £93.0 million multi-currency committed bank facility that provides revolving credit facilities through to 31 March 2019. Total drawdowns under the facility of £71.0 million at 31 March 2017 were denominated in Sterling (£68.1 million) and US Dollars (£2.9 million). At 31 March 2017 the Group had £22.0 million (March 2016: £9.9 million) of undrawn committed facilities.
All borrowings are arranged at floating interest rates, thus exposing the Group to interest rate risk. The Group uses interest rate swaps to mitigate this risk, hedging £40.0 million of the debt (31 March 2016: £nil; 30 September 2016: £40.0 million), reducing the exposure to fluctuations in interest rates. All borrowings are secured by a guarantee between a number of Group companies.
Notes to the Interim Financial Statements continued
ITE Group plc Interim Report 2017
26
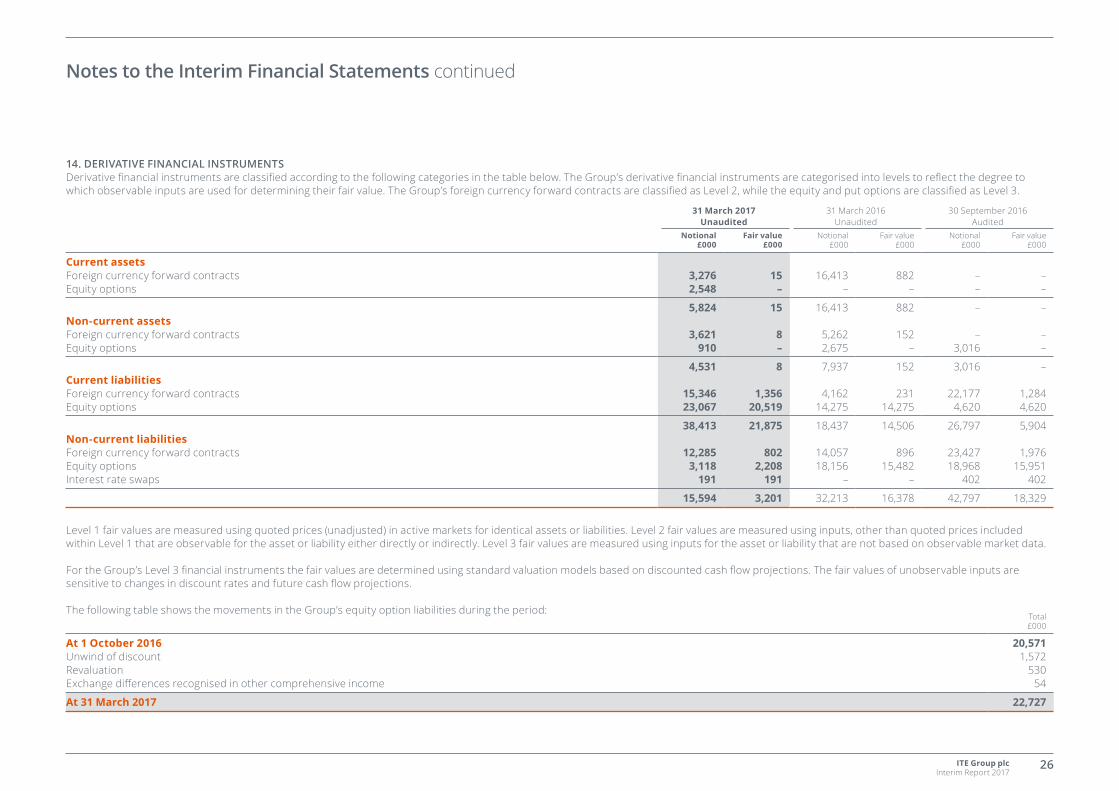
14. DERIVATIVE FINANCIAL INSTRUMENTSDerivative financial instruments are classified according to the following categories in the table below. The Group’s derivative financial instruments are categorised into levels to reflect the degree to which observable inputs are used for determining their fair value. The Group’s foreign currency forward contracts are classified as Level 2, while the equity and put options are classified as Level 3.
31 March 2017 Unaudited
31 March 2016 Unaudited
30 September 2016 Audited
Notional £000
Fair value £000
Notional £000
Fair value £000
Notional £000
Fair value £000
Current assetsForeign currency forward contracts 3,276 15 16,413 882 – –Equity options 2,548 – – – – –
5,824 15 16,413 882 – –Non-current assetsForeign currency forward contracts 3,621 8 5,262 152 – –Equity options 910 – 2,675 – 3,016 –
4,531 8 7,937 152 3,016 –Current liabilitiesForeign currency forward contracts 15,346 1,356 4,162 231 22,177 1,284Equity options 23,067 20,519 14,275 14,275 4,620 4,620
38,413 21,875 18,437 14,506 26,797 5,904Non-current liabilitiesForeign currency forward contracts 12,285 802 14,057 896 23,427 1,976Equity options 3,118 2,208 18,156 15,482 18,968 15,951Interest rate swaps 191 191 – – 402 402
15,594 3,201 32,213 16,378 42,797 18,329
Level 1 fair values are measured using quoted prices (unadjusted) in active markets for identical assets or liabilities. Level 2 fair values are measured using inputs, other than quoted prices included within Level 1 that are observable for the asset or liability either directly or indirectly. Level 3 fair values are measured using inputs for the asset or liability that are not based on observable market data.
For the Group’s Level 3 financial instruments the fair values are determined using standard valuation models based on discounted cash flow projections. The fair values of unobservable inputs are sensitive to changes in discount rates and future cash flow projections.
The following table shows the movements in the Group’s equity option liabilities during the period:Total £000
At 1 October 2016 20,571Unwind of discount 1,572Revaluation 530Exchange differences recognised in other comprehensive income 54
At 31 March 2017 22,727
Notes to the Interim Financial Statements continued
ITE Group plc Interim Report 2017
27
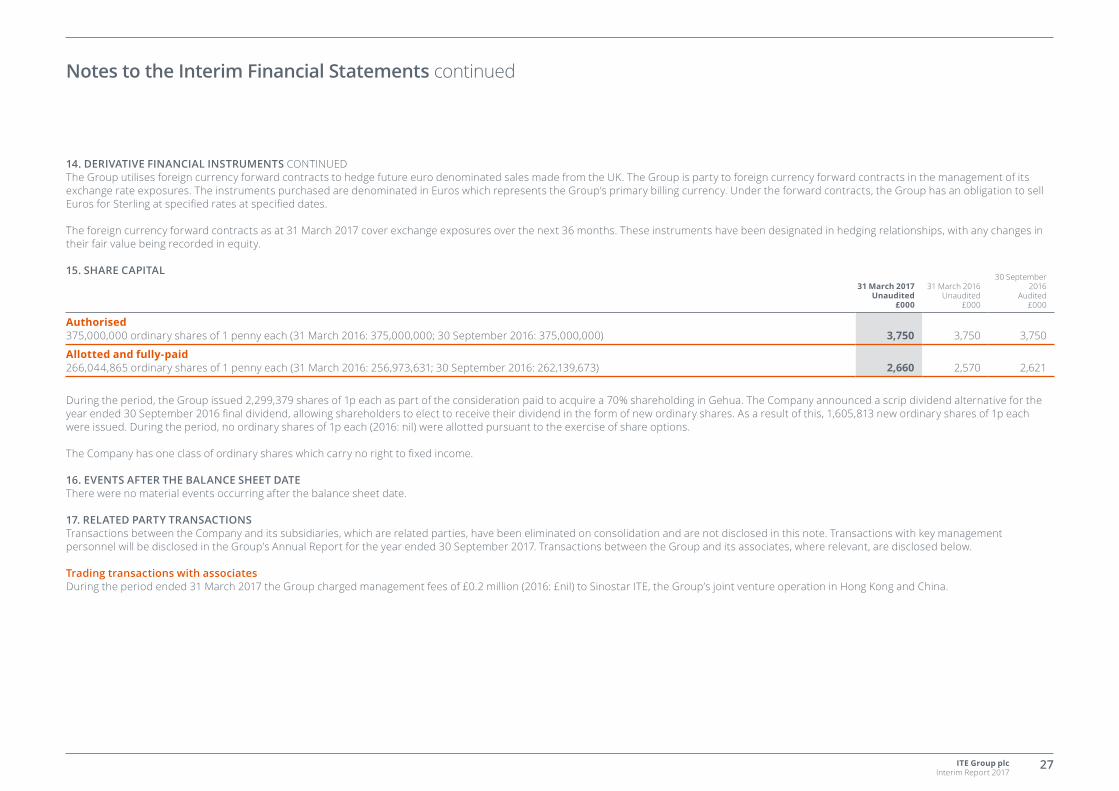
14. DERIVATIVE FINANCIAL INSTRUMENTS CONTINUEDThe Group utilises foreign currency forward contracts to hedge future euro denominated sales made from the UK. The Group is party to foreign currency forward contracts in the management of its exchange rate exposures. The instruments purchased are denominated in Euros which represents the Group’s primary billing currency. Under the forward contracts, the Group has an obligation to sell Euros for Sterling at specified rates at specified dates.
The foreign currency forward contracts as at 31 March 2017 cover exchange exposures over the next 36 months. These instruments have been designated in hedging relationships, with any changes in their fair value being recorded in equity.
15. SHARE CAPITAL31 March 2017
Unaudited £000
31 March 2016 Unaudited
£000
30 September 2016
Audited £000
Authorised375,000,000 ordinary shares of 1 penny each (31 March 2016: 375,000,000; 30 September 2016: 375,000,000) 3,750 3,750 3,750
Allotted and fully-paid266,044,865 ordinary shares of 1 penny each (31 March 2016: 256,973,631; 30 September 2016: 262,139,673) 2,660 2,570 2,621
During the period, the Group issued 2,299,379 shares of 1p each as part of the consideration paid to acquire a 70% shareholding in Gehua. The Company announced a scrip dividend alternative for the year ended 30 September 2016 final dividend, allowing shareholders to elect to receive their dividend in the form of new ordinary shares. As a result of this, 1,605,813 new ordinary shares of 1p each were issued. During the period, no ordinary shares of 1p each (2016: nil) were allotted pursuant to the exercise of share options.
The Company has one class of ordinary shares which carry no right to fixed income.
16. EVENTS AFTER THE BALANCE SHEET DATEThere were no material events occurring after the balance sheet date.
17. RELATED PARTY TRANSACTIONSTransactions between the Company and its subsidiaries, which are related parties, have been eliminated on consolidation and are not disclosed in this note. Transactions with key management personnel will be disclosed in the Group’s Annual Report for the year ended 30 September 2017. Transactions between the Group and its associates, where relevant, are disclosed below.
Trading transactions with associatesDuring the period ended 31 March 2017 the Group charged management fees of £0.2 million (2016: £nil) to Sinostar ITE, the Group’s joint venture operation in Hong Kong and China.
Notes to the Interim Financial Statements continued
ITE Group plc Interim Report 2017
28
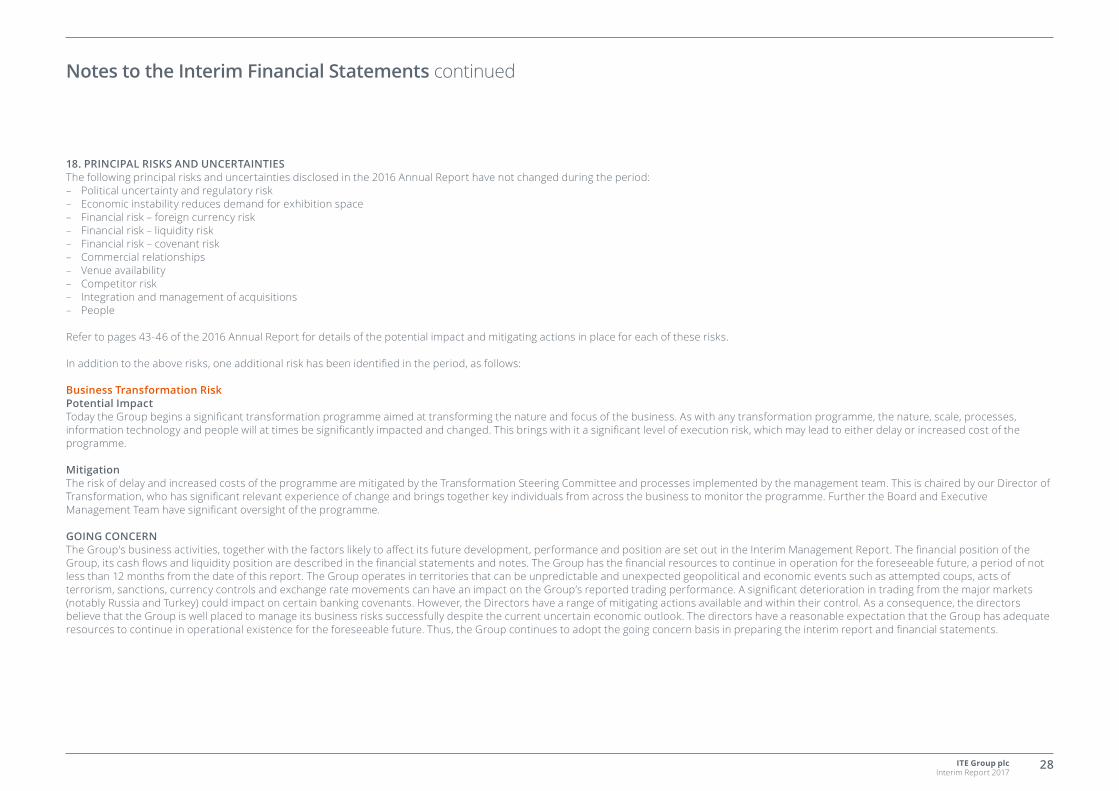
18. PRINCIPAL RISKS AND UNCERTAINTIESThe following principal risks and uncertainties disclosed in the 2016 Annual Report have not changed during the period: – Political uncertainty and regulatory risk – Economic instability reduces demand for exhibition space – Financial risk – foreign currency risk – Financial risk – liquidity risk – Financial risk – covenant risk – Commercial relationships – Venue availability – Competitor risk – Integration and management of acquisitions – People
Refer to pages 43-46 of the 2016 Annual Report for details of the potential impact and mitigating actions in place for each of these risks.
In addition to the above risks, one additional risk has been identified in the period, as follows:
Business Transformation RiskPotential Impact Today the Group begins a significant transformation programme aimed at transforming the nature and focus of the business. As with any transformation programme, the nature, scale, processes, information technology and people will at times be significantly impacted and changed. This brings with it a significant level of execution risk, which may lead to either delay or increased cost of the programme.
MitigationThe risk of delay and increased costs of the programme are mitigated by the Transformation Steering Committee and processes implemented by the management team. This is chaired by our Director of Transformation, who has significant relevant experience of change and brings together key individuals from across the business to monitor the programme. Further the Board and Executive Management Team have significant oversight of the programme.
GOING CONCERNThe Group's business activities, together with the factors likely to affect its future development, performance and position are set out in the Interim Management Report. The financial position of the Group, its cash flows and liquidity position are described in the financial statements and notes. The Group has the financial resources to continue in operation for the foreseeable future, a period of not less than 12 months from the date of this report. The Group operates in territories that can be unpredictable and unexpected geopolitical and economic events such as attempted coups, acts of terrorism, sanctions, currency controls and exchange rate movements can have an impact on the Group’s reported trading performance. A significant deterioration in trading from the major markets (notably Russia and Turkey) could impact on certain banking covenants. However, the Directors have a range of mitigating actions available and within their control. As a consequence, the directors believe that the Group is well placed to manage its business risks successfully despite the current uncertain economic outlook. The directors have a reasonable expectation that the Group has adequate resources to continue in operational existence for the foreseeable future. Thus, the Group continues to adopt the going concern basis in preparing the interim report and financial statements.
Notes to the Interim Financial Statements continued
ITE Group plc Interim Report 2017
29
We confirm that to the best of our knowledge:
(a) the condensed set of interim financial statements, which have been prepared in accordance with IAS 34 “Interim Financial Reporting” give a true and fair view of the assets, liabilities, financial position and profit or loss of the undertakings included in the consolidation as a whole as required by DTR 4.2.4R;
(b) the interim management report includes a fair review of the information required by DTR 4.2.7R (indication of important events and their impact, and description of principal risks and uncertainties for the remaining six months of the financial year); and
(c) the interim management report includes a fair review of the information required regarding related party transactions (under DTR 4.2.8R).
By the order of the board
Mark ShashouaChief Executive Officer
16 May 2017
Responsibility Statement
ITE Group plc Interim Report 2017
30
We have been engaged by the company to review the condensed set of financial statements in the half-yearly financial report for the six months ended 31 March 2017 which comprises the condensed consolidated income statement, the condensed consolidated statement of comprehensive income, the condensed consolidated statement of changes in equity, the condensed consolidated statement of financial position, the condensed consolidated cash flow statement and related notes 1 to 18. We have read the other information contained in the half-yearly financial report and considered whether it contains any apparent misstatements or material inconsistencies with the information in the condensed set of financial statements.
This report is made solely to the company in accordance with International Standard on Review Engagements (UK and Ireland) 2410 “Review of Interim Financial Information Performed by the Independent Auditor of the Entity” issued by the Auditing Practices Board. Our work has been undertaken so that we might state to the company those matters we are required to state to it in an independent review report and for no other purpose. To the fullest extent permitted by law, we do not accept or assume responsibility to anyone other than the company, for our review work, for this report, or for the conclusions we have formed.
DIRECTORS' RESPONSIBILITIESThe half-yearly financial report is the responsibility of, and has been approved by, the directors. The directors are responsible for preparing the half-yearly financial report in accordance with the Disclosure and Transparency Rules of the United Kingdom’s Financial Conduct Authority.
As disclosed in note 1, the annual financial statements of the Group are prepared in accordance with IFRSs as adopted by the European Union. The condensed set of financial statements included in this half-yearly financial report has been prepared in accordance with International Accounting Standard 34 “Interim Financial Reporting” as adopted by the European Union.
OUR RESPONSIBILITYOur responsibility is to express to the Company a conclusion on the condensed set of financial statements in the half-yearly financial report based on our review.
SCOPE OF REVIEW We conducted our review in accordance with International Standard on Review Engagements (UK and Ireland) 2410 “Review of Interim Financial Information Performed by the Independent Auditor of the Entity” issued by the Auditing Practices Board for use in the United Kingdom. A review of interim financial information consists of making inquiries, primarily of persons responsible for financial and accounting matters, and applying analytical and other review procedures. A review is substantially less in scope than an audit conducted in accordance with International Standards on Auditing (UK and Ireland) and consequently does not enable us to obtain assurance that we would become aware of all significant matters that might be identified in an audit. Accordingly, we do not express an audit opinion.
CONCLUSIONBased on our review, nothing has come to our attention that causes us to believe that the condensed set of financial statements in the half-yearly financial report for the six months ended 31 March 2017 is not prepared, in all material respects, in accordance with International Accounting Standard 34 as adopted by the European Union and the Disclosure and Transparency Rules of the United Kingdom’s Financial Conduct Authority.
Deloitte LLPChartered Accountants and Statutory AuditorLondon, United Kingdom
16 May 2017
Independent Review Report to ITE Group plc
ITE Group plc Interim Report 2017
31
DIRECTORS Marco Sodi, non-executive ChairmanMark Shashoua, Chief Executive OfficerAndrew Beach, Chief Financial OfficerNeil England, non-executive DirectorLinda Jensen, non-executive DirectorStephen Puckett, non-executive DirectorSharon Baylay, non-executive Director
COMPANY SECRETARY Anneka Kingan
REGISTERED OFFICE ITE Group plc, 105 Salusbury Road, London, NW6 6RG
REGISTRATION NUMBER 1927339
AUDITOR Deloitte LLP, 2 New Street Square, London, EC4A 3BZ
SOLICITORS Olswang, 90 High Holborn, London, WC1V 6XX
PRINCIPAL BANKERS Barclays Bank plc, 1 Churchill Place, London, E14 5HPHSBC Bank plc, 60 Queen Victoria Street, London, EC4N 4TR
COMPANY BROKERS Numis Securities Limited, The London Stock Exchange Building, 10 Paternoster Square, London, EC4M 7LT
REGISTRARS Equiniti Limited, Aspect House, Spencer Road, Lancing, West Sussex, BN99 6DA
PUBLIC RELATIONS FTI Consulting Limited, 200 Aldersgate, Aldersgate Street, London, EC1A 4HD
WEBSITE www.ite-exhibitions.com
Directors and Professional Advisers
ITE Group plc Interim Report 2017
32
INTERIM DIVIDEND 2017:Ex Dividend Date 08 June 2017Record Date 09 June 2017Payment Date 03 August 2017
The Group’s financial calendar can be found at http://www.ite-exhibitions.com/Financial-Calendar
Financial Calendar