Embed Size (px)
Citation preview

BANG & OLUFSEN A/SCompany announcement no. 17.11 – 04 October 2017
INTERIM REPORT 1ST QUARTER 2017/18
1 JUNE 2017 –31 AUGUST 2017
Bang & Olufsen a/s
Peter Bangs Vej 15
DK-7600 Struer
Tel. +45 9684 1122
www.bang-olufsen.com
Comreg: 41257911
BANG & OLUFSEN A/S INTERIM REPORT 1ST QUARTER 2017/18 · 2
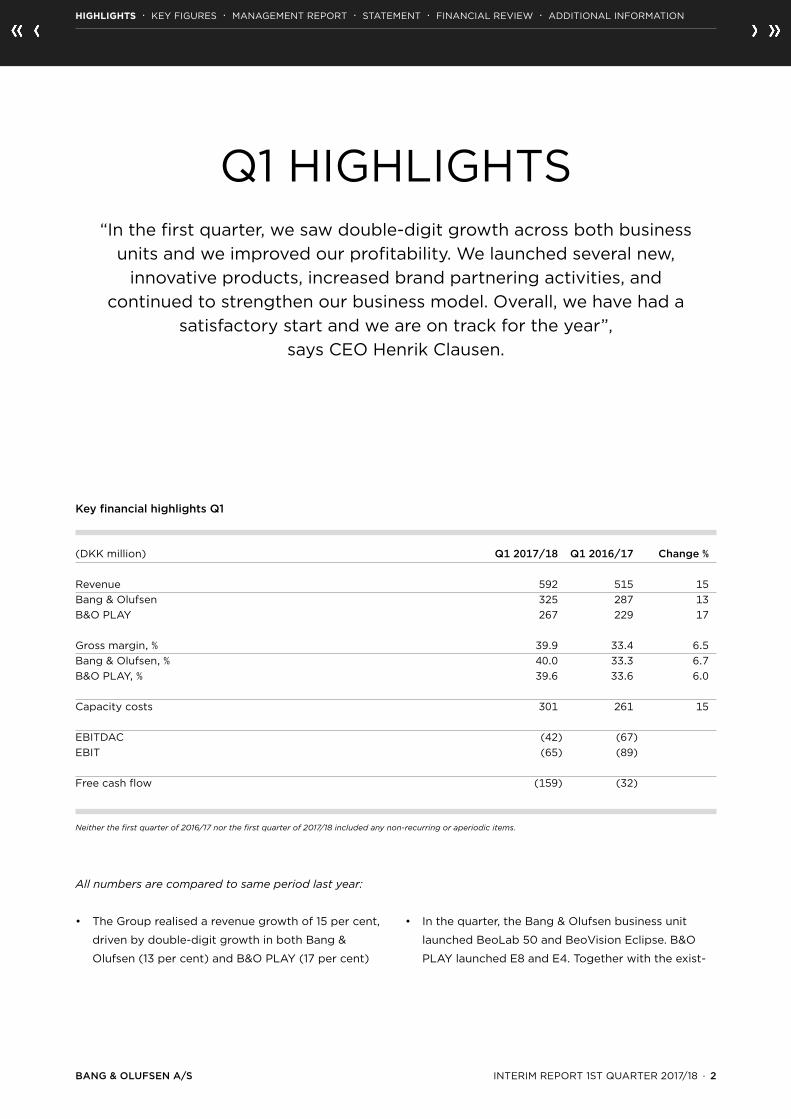
Q1 HIGHLIGHTS“In the first quarter, we saw double-digit growth across both business
units and we improved our profitability. We launched several new, innovative products, increased brand partnering activities, and
continued to strengthen our business model. Overall, we have had a satisfactory start and we are on track for the year”,
says CEO Henrik Clausen.
Neither the first quarter of 2016/17 nor the first quarter of 2017/18 included any non-recurring or aperiodic items.
Key financial highlights Q1
(DKK million) Q1 2017/18 Q1 2016/17 Change %
Revenue 592 515 15Bang & Olufsen 325 287 13B&O PLAY 267 229 17 Gross margin, % 39.9 33.4 6.5Bang & Olufsen, % 40.0 33.3 6.7B&O PLAY, % 39.6 33.6 6.0 Capacity costs 301 261 15
EBITDAC (42) (67) EBIT (65) (89) Free cash flow (159) (32)
All numbers are compared to same period last year:
• The Group realised a revenue growth of 15 per cent,
driven by double-digit growth in both Bang &
Olufsen (13 per cent) and B&O PLAY (17 per cent)
• In the quarter, the Bang & Olufsen business unit
launched BeoLab 50 and BeoVision Eclipse. B&O
PLAY launched E8 and E4. Together with the exist-
HIGHLIGHTS · KEY FIGURES · MANAGEMENT REPORT · STATEMENT · FINANCIAL REVIEW · ADDITIONAL INFORMATIONHighlights
BANG & OLUFSEN A/S INTERIM REPORT 1ST QUARTER 2017/18 · 3
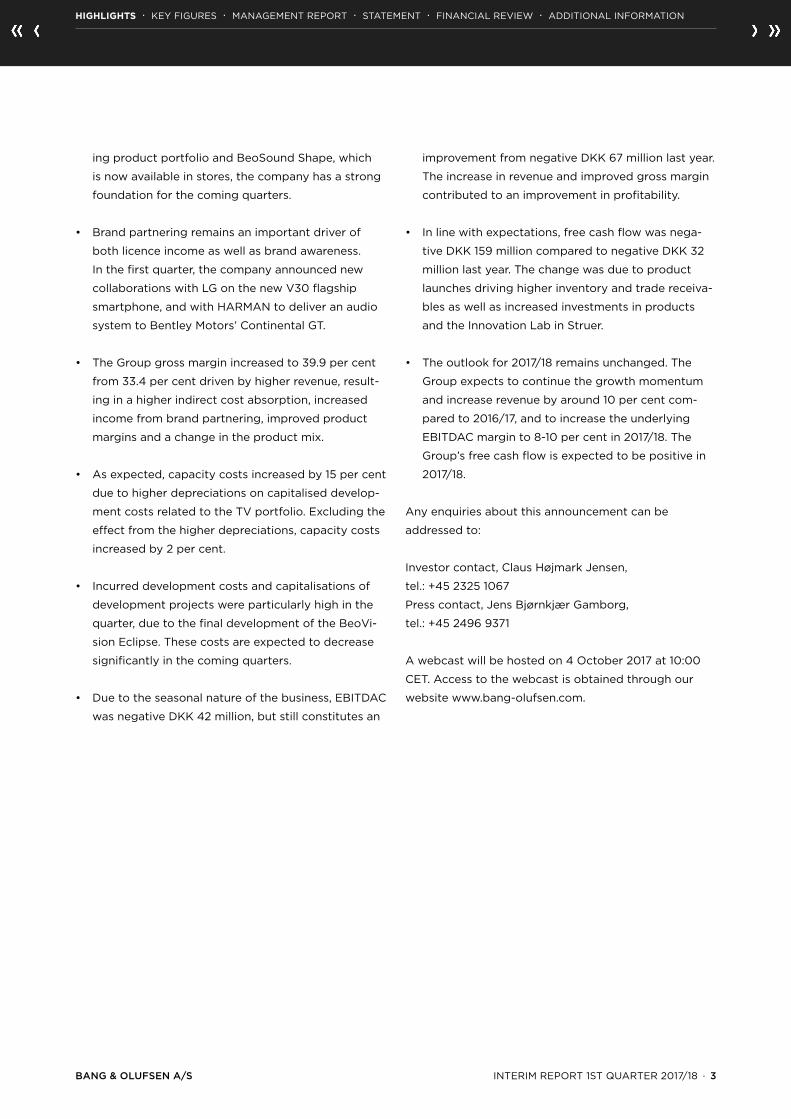
ing product portfolio and BeoSound Shape, which
is now available in stores, the company has a strong
foundation for the coming quarters.
• Brand partnering remains an important driver of
both licence income as well as brand awareness.
In the first quarter, the company announced new
collaborations with LG on the new V30 flagship
smartphone, and with HARMAN to deliver an audio
system to Bentley Motors’ Continental GT.
• The Group gross margin increased to 39.9 per cent
from 33.4 per cent driven by higher revenue, result-
ing in a higher indirect cost absorption, increased
income from brand partnering, improved product
margins and a change in the product mix.
• As expected, capacity costs increased by 15 per cent
due to higher depreciations on capitalised develop-
ment costs related to the TV portfolio. Excluding the
effect from the higher depreciations, capacity costs
increased by 2 per cent.
• Incurred development costs and capitalisations of
development projects were particularly high in the
quarter, due to the final development of the BeoVi-
sion Eclipse. These costs are expected to decrease
significantly in the coming quarters.
• Due to the seasonal nature of the business, EBITDAC
was negative DKK 42 million, but still constitutes an
improvement from negative DKK 67 million last year.
The increase in revenue and improved gross margin
contributed to an improvement in profitability.
• In line with expectations, free cash flow was nega-
tive DKK 159 million compared to negative DKK 32
million last year. The change was due to product
launches driving higher inventory and trade receiva-
bles as well as increased investments in products
and the Innovation Lab in Struer.
• The outlook for 2017/18 remains unchanged. The
Group expects to continue the growth momentum
and increase revenue by around 10 per cent com-
pared to 2016/17, and to increase the underlying
EBITDAC margin to 8-10 per cent in 2017/18. The
Group’s free cash flow is expected to be positive in
2017/18.
Any enquiries about this announcement can be
addressed to:
Investor contact, Claus Højmark Jensen,
tel.: +45 2325 1067
Press contact, Jens Bjørnkjær Gamborg,
tel.: +45 2496 9371
A webcast will be hosted on 4 October 2017 at 10:00
CET. Access to the webcast is obtained through our
website www.bang-olufsen.com.
HIGHLIGHTS · KEY FIGURES · MANAGEMENT REPORT · STATEMENT · FINANCIAL REVIEW · ADDITIONAL INFORMATION

BANG & OLUFSEN A/S INTERIM REPORT 1ST QUARTER 2017/18 · 4
Bang & Olufsen a/s – Group 1st quarter
(DKK million) 2017/18 2016/17
Income statementRevenue 592 515 Gross margin, % 39.9 33.4 Earnings before interest, taxes, depreciation, amortisation andt capitalisation (EBITDAC) (42) (67)Earnings before interest, taxes, depreciation and amortisation (EBITDA) 23 (40)Earnings before interest and tax (EBIT) (65) (89)Financial items, net (5) 1 Earnings before tax (EBT) (70) (87)Earnings after tax (55) (67)
Financial positionTotal assets 2,755 2,749 Share capital 432 432 Equity 1,520 1,655 Net interest-bearing deposit 741 565 Net working capital 130 285
Cash flow– from operating activities (78) (6)– from investment activities (80) (26)Free cash flow (159) (32)– from financing activities (2) (5)Cash flow for the period (161) (38)
Key figuresEBITDA-margin, % 3.9 (7.8)EBIT-margin, % (11.0) (17.2)Return on assets, % (3.5) (4.5)Return on invested capital, excl. goodwill, % 1.1 (6.6)Return on equity, % (3.4) (3.9)Full time employees at the end of the period 1,107 1,690
Stock related key figuresEarnings per share (EPS), DKK (1.3) (1.5)Earnings per share, diluted (EPS-D), DKK (1.3) (1.5)Price/Earnings (81) (42)
KEY FIGURES
HIGHLIGHTS · KEY FIGURES · MANAGEMENT REPORT · STATEMENT · FINANCIAL REVIEW · ADDITIONAL INFORMATIONKey figures

BANG & OLUFSEN A/S INTERIM REPORT 1ST QUARTER 2017/18 · 5
Revenue development by business unit
The Group’s revenue increased from DKK 515 million
last year to DKK 592 million, corresponding to a growth
of 15 per cent (17 per cent in local currency).
The Bang & Olufsen business unit realised a revenue of
DKK 325 million, compared to DKK 287 million last year,
MANAGEMENT REPORTRevenue grew by 15 per cent in the first quarter of 2017/18.
The Bang & Olufsen business unit had a good start to the year and grew 13 per cent while the B&O PLAY business unit continued
the double-digit growth with 17 per cent. EBITDAC improved compared to last year in line with expectations. Due to the seasonal nature of the
business, the net result was negative for the first quarter.
which was an increase of 13 per cent (15 per cent in lo-
cal currency). This was primarily driven by increased
sales of BeoSound 1 and 2, and by the launch of new
products such as BeoLab 50, BeoVision Eclipse, and
BeoSound Shape, together with increased income from
brand partnering.
Revenue by business unit (growth in local currency in parenthesis)
Bang & Olufsen
Q1 16/17
B&O PLAY Total
Q1 17/18
0
100
200
300
400
500
600
700
0
100
200
300
400
500
600
700
-2%
+44%
+17%(+18%)
+14%
+13%(+15%)
+15%(+17%)
Graf-data er her indtakt - ret i denne og kopier,ungroup og flyt 1. hold søjler 2 mm til højre,2. hold 5 mm og 3. hold 8 mm til højre.
DKKm
Revenue by region (growth in local currency in parenthesis)
0
100
200
300
400
500
600
700
Q1 16/17
Q1 17/18
DKKm
+4%(+6%)
+6%(+9%)
+32%(+41%)
+46%(+46%)
+15%(+17%)
Europe1) North America2)
Greater China3)
Rest of World
Total
1) Europe covers Austria, Belgium, Denmark, France, Germany, Italy, Netherlands, Norway, Spain, Sweden, Switzerland and United Kingdom.
2) North America covers USA, Canada and Mexico.3) Greater China covers China, Hong Kong and Taiwan.
HIGHLIGHTS · KEY FIGURES · MANAGEMENT REPORT · STATEMENT · FINANCIAL REVIEW · ADDITIONAL INFORMATION
DELEVOPMENT IN 1ST QUARTER · PRODUCT LAUNCHES · OUTLOOK FOR 2017/18
Management ReportDevelopment in
BANG & OLUFSEN A/S INTERIM REPORT 1ST QUARTER 2017/18 · 6
The revenue in the B&O PLAY business unit grew 17 per
cent (18 per cent in local currency) and realised a reve-
nue of DKK 267 million compared to last year. The main
growth contributors in B&O PLAY were Beoplay A1, A9
and H5, which continued to perform well, as well as
Beoplay P2 and E4 that were launched in the previous
two quarters. Revenue through the B1 and shop-in-shop
channel was at DKK 83 million on par with last year.
Revenue through third-party retail and e-commerce in-
creased by 25 per cent.
Revenue development by channel and region
In first quarter, the company continued the work to
improve the distribution setup to ensure that the cus-
tomer experience was strengthened and sales potential
maximised.
The transformation of the distribution network con-
tinued as 14 new B1 stores and shop-in-shops were
opened or upgraded, while 42 low-performing stores,
primarily in Europe and the Greater China region, were
closed or changed to shop-in-shops. Thus, the number
of B1 stores and shop-in-shops was 598 at the end of
the first quarter compared to 626 at the end of the pre-
vious quarter. B&O PLAY expanded the number of third
party retail stores while maintaining a strong focus on
ensuring quality and depth to improve sales in the ex-
isting stores through stronger in-store merchandising
and increased training. The number of third-party retail
stores increased to 6,833 stores from 5,808 stores in
the same period last year, and from 6,424 at the end of
previous quarter.
Both business units grew in Europe in the first quarter.
The growth was a result of the continued focus on driv-
ing sales of flexible living products as well as the launch
of BeoLab 50. Revenue in Europe was DKK 324 million
against DKK 311 million last year, corresponding to an
increase of 4 per cent (6 per cent growth in local cur-
rency).
Revenue in North America was DKK 55 million against
DKK 52 million last year, corresponding to an increase
of 6 per cent (9 per cent in local currency). The growth
in the first quarter was supported by increased income
from brand partnering. Focus in the quarter was to con-
tinue the transformation of the organisational structure
and the B1 network, while expanding the distribution in
the third-party retail channel. This is expected to mate-
rialise in further growth in the coming quarters.
The growth momentum continued to be strong in the
Greater China region, where key focus continued to be
the growth of B&O PLAY. Revenue in the Greater China
region was DKK 102 million against DKK 78 million last
year, corresponding to an increase of 32 per cent (41
per cent in local currency).
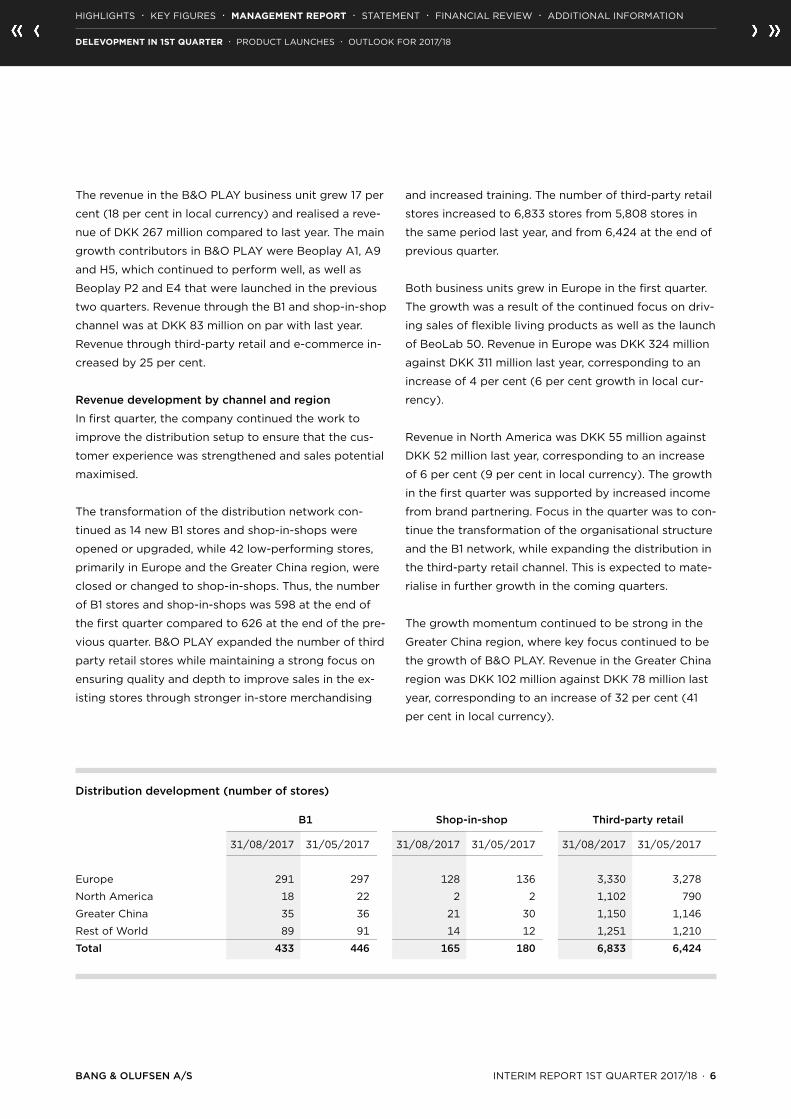
Distribution development (number of stores)
B1 Shop-in-shop Third-party retail
31/08/2017 31/05/2017 31/08/2017 31/05/2017 31/08/2017 31/05/2017
Europe 291 297 128 136 3,330 3,278
North America 18 22 2 2 1,102 790
Greater China 35 36 21 30 1,150 1,146
Rest of World 89 91 14 12 1,251 1,210
Total 433 446 165 180 6,833 6,424
HIGHLIGHTS · KEY FIGURES · MANAGEMENT REPORT · STATEMENT · FINANCIAL REVIEW · ADDITIONAL INFORMATION
DELEVOPMENT IN 1ST QUARTER · PRODUCT LAUNCHES · OUTLOOK FOR 2017/18

BANG & OLUFSEN A/S INTERIM REPORT 1ST QUARTER 2017/18 · 7
Revenue in the region Rest of World was DKK 110 mil-
lion against DKK 75 million last year, corresponding to
an increase of 46 per cent (46 per cent in local curren-
cy). The region was driven by growth in both the Bang
& Olufsen and B&O PLAY business units and partially
supported by increased income from brand partnering.
Gross margin
The Group gross margin was 39.9 per cent against 33.4
per cent last year.
The gross margin in the Bang & Olufsen business unit
was 40.0 per cent against 33.3 per cent last year. The
improvement was driven by higher revenue resulting
in a higher indirect cost absorption in the quarter, in-
creased income from brand partnering, and a change in
product mix due to a higher share of speaker turnover.
The gross margin for B&O PLAY was 39.6 per cent
against 33.6 per cent last year. The improvement in
gross margin was due to product mix and continued
to be driven by higher volumes and positive scalability
impacts on the supply chain.
Capacity costs
The capacity costs were DKK 301 million compared
to DKK 261 million last year. The increase was due to
higher depreciation on development projects, which
increased from DKK 35 million to DKK 70 million. Ad-
justed for this impact, capacity costs increased margin-
ally by DKK 5 million.
Distribution and marketing costs were at DKK 162 mil-
lion on par with last year. This was a result of continued
investments in marketing and distribution in B&O PLAY,
and lower costs in the Bang & Olufsen business unit,
partly due to fewer company-owned and company-
operated stores.
Administration costs totalled DKK 25 million compared
to DKK 23 million in the same quarter last year.
Development costs were DKK 114 million against DKK
75 million last year. The increase was expected due to
higher depreciations of the current TV product port-
folio, as has been the case in the recent quarters. In
addition, incurred development costs increased due to
a higher level of activities related to new product de-
velopment including the impact from the development
of BeoVision Eclipse and BeoLab 50. Incurred develop-
ment costs were DKK 109 million (of which DKK 65 mil-
lion were capitalised) against DKK 67 million last year
(of which DKK 27 million were capitalised). Incurred
development costs and capitalisations are expected to
decrease in the coming quarters while depreciations
will remain at the current level.
Total amortisation charges on development projects
were DKK 70 million against DKK 35 million last year.
The net effect on earnings before interest and tax of
capitalisations and amortisations was negative DKK 5
million compared to a negative effect of DKK 8 million
last year.
As part of the transformation of creating a more agile
and asset-light model, the number of full-time employ-
Capitalised development costs and carrying amount (DKK million)
Q1 – 2017/18
Capitalised, net 65
Carrying amount, net 330
Q1 – 2016/17
Capitalised, net 27
Carrying amount, net 375
HIGHLIGHTS · KEY FIGURES · MANAGEMENT REPORT · STATEMENT · FINANCIAL REVIEW · ADDITIONAL INFORMATION
DELEVOPMENT IN 1ST QUARTER · PRODUCT LAUNCHES · OUTLOOK FOR 2017/18

BANG & OLUFSEN A/S INTERIM REPORT 1ST QUARTER 2017/18 · 8
ees decreased from 1.690 to 1.107. The decrease was
mainly a result of the divestiture of the Czech subsidi-
ary.
Earnings
Earnings before interest, tax, depreciation, amortisation
and capitalisation (EBITDAC) were negative DKK 42
million against negative DKK 67 million last year. The
increase in revenue and improved gross margin con-
tributed to an improvement in profitability. However,
EBITDAC remained negative as expected due to the
seasonal nature of the business.
The company’s net financial items were negative DKK 5
million compared to DKK 1 million last year. The change
was mainly related to a negative impact from changes
in exchange rates.
Earnings before tax were negative DKK 70 million
against negative DKK 87 million last year.
Development in balance sheet items and cash flow
The Group’s net working capital was DKK 130 million.
This was a decrease of DKK 155 million compared to
the same period last year mainly due to the sale of the
Czech production facility at the end of the previous
financial year. Net working capital increased DKK 103
million compared to DKK 27 million in the beginning of
the year. The increase was due to product launches in
the quarter driving higher inventory and trade receiva-
bles.
Free cash flow was negative DKK 159 million compared
to negative DKK 32 million last year, corresponding to
a change of DKK 127 million. The change was related to
an increase in net working capital and increased invest-
ments in products and the Innovation Lab in Struer.
The net interest bearing deposit was DKK 741 million
compared to DKK 565 million last year.
The Group’s equity decreased to DKK 1,520 million
from DKK 1,655 million last year. The Group equity ratio
was 55 per cent compared to 60 per cent last year.
Other events during the first quarter
Brand partnering continues to be a key part of the busi-
ness both as a source of income through licence fees
and as a platform for exposing potential customers to
the brand. In the first quarter, the company entered two
new collaborations.
LG Electronics and B&O PLAY have collaborated on
LG’s new flagship smartphone, LG V30. The smart-
phone will feature best-in-class audio functions devel-
oped in partnership with B&O PLAY and come with
customised B&O PLAY earphones. The product will be
launched in selected markets. Also, Bentley Motors and
HARMAN partnered on the new Bentley Continental
GT. The car will feature an optional audio system from
Bang & Olufsen.
Subsequent events
No material events occured after 31 August 2017.
HIGHLIGHTS · KEY FIGURES · MANAGEMENT REPORT · STATEMENT · FINANCIAL REVIEW · ADDITIONAL INFORMATION
DELEVOPMENT IN 1ST QUARTER · PRODUCT LAUNCHES · OUTLOOK FOR 2017/18

BANG & OLUFSEN A/S INTERIM REPORT 1ST QUARTER 2017/18 · 9
Product launches in Q1 2017/18
While existing products such as the BeoSound Shape and BeoSound 1 and 2 in the Bang & Olufsen business unit
and Beoplay A1, A9, and H5 in the B&O PLAY business unit continued to perform well, the company also launched
several new products in the first quarter. All products are based on the company’s core capabilities of acoustics,
design and craftsmanship and supplemented by collaborations with technology partners.
BeoVision Eclipse
August Bang & Olufsen launched BeoVision Eclipse.
The new TV in the Immersive Moments category offers
the ultimate immersive cinematic experience with focus
on creating the beautifully-designed sound. It builds
on Bang & Olufsen’s core
competencies within
design, acoustics and
craftsmanship, while
offering OLED TV
technology and
create the ultimate
TV experience. The
new TV will be avail-
able in two sizes – a 55”
and a 65” version.
BeoLab 50
August Bang & Olufsen introduced
the new BeoLab 50 speaker
in the Immersive Moments
product category. BeoLab
50 offers the ultimate audio
experience in a design
characterised by aluminium
surfaces and oak wood
lamellas that are recognisable
trademarks of Bang & Olufsen
products. The extraordinary
performance of BeoLab 50 has
benefitted from the uncompromising acoustic
research and technological development of BeoLab
90 and shares several features with this iconic
landmark loudspeaker.
Beoplay E4
June B&O PLAY launched a new pair of earphones
for the Personal on-the-go use case where the music
experience is personal and part of the consumer’s
everyday life. The next genera-
tion of active noise cancel-
ling earphones, Beoplay
E4, is designed as a
stylish accessory for com-
muters and travellers alike.
Beoplay A4 delivers the precise and powerful audio
quality that everyone has come to expect from a B&O
PLAY product.
Beoplay E8
August B&O PLAY introduced Beoplay E8. The com-
pany’s first truly wireless earphones
have been developed to cater
the Personal on-the-go use
case. Beoplay E8 therefore
delivers a seamless listening
experience on the move and a
design in premium materials that re-
main at the heart of the Bang & Olufsen heritage.
HIGHLIGHTS · KEY FIGURES · MANAGEMENT REPORT · STATEMENT · FINANCIAL REVIEW · ADDITIONAL INFORMATION
DELEVOPMENT IN 1ST QUARTER · PRODUCT LAUNCHES · OUTLOOK FOR 2017/18
Product launches

BANG & OLUFSEN A/S INTERIM REPORT 1ST QUARTER 2017/18 · 10
Revenue
Revenue growth for the Group is expected to be
around 10 per cent compared to 2016/17.
The B&O PLAY business unit is expected to continue to
be the main growth driver with growth of more than 20
per cent compared to 2016/17.
The Bang & Olufsen business unit, including revenue
related to brand partnering, is expected to remain flat.
Revenue related to brand partnering is expected to be
in the range of DKK 160-200 million.
Earnings
Earnings before interest, tax, depreciation, amortisation
and capitalisation (EBITDAC) for the underlying busi-
ness is expected to be 8-10 per cent of revenue. 2017/18
will continue to be impacted by the changed operating
model in the Bang & Olufsen business unit, which will
entail a continued high-level of depreciations and am-
ortisations, while the level of capitalisations will decline.
The EBIT margin for the underlying business is expect-
ed to be 1-3 per cent for 2017/18.
Free cash flow
The Group’s free cash flow is expected to be positive in
2017/18.
The outlook excludes impacts from non-recurring and
aperiodic items that may occur during the financial
year.
OUTLOOK FOR 2017/18In 2017/18, the Group expects to maintain the growth momentum,
improve profitability, and to continue the transformation towards a more agile and asset-light operating model.
Safe Harbour statementThe report contains statements relating to the expectations for future developments, including future revenues and operating results, as well as expected business-related events. Such statements are uncertain and carry an element of risk since many factors, of which some are beyond Bang & Olufsen’s control, can mean that actual developments will deviate significantly from the expectations expressed in the report. Without being exhaustive, such factors include among others general economic and commercial factors, including market and competitive matters, supplier issues and financial issues in the form of foreign exchange, interest rates, credit and liquidity risk.
HIGHLIGHTS · KEY FIGURES · MANAGEMENT REPORT · STATEMENT · FINANCIAL REVIEW · ADDITIONAL INFORMATION
DELEVOPMENT IN 1ST QUARTER · PRODUCT LAUNCHES · OUTLOOK FOR 2017/18
Outlook

BANG & OLUFSEN A/S INTERIM REPORT 1ST QUARTER 2017/18 · 11
Struer, 4 October 2017
Executive Management Board:
Henrik Clausen Anders Aakær Jensen Stefan Persson John MollangerPresident & CEO Executive Vice Executive Vice Executive Vice President & CFO President of HOME President & CEO of B&O PLAY
Board of Directors:
Ole Andersen Juha Christensen Albert Bensoussan Brian Bjørn HansenChairman Deputy Chairman
Geoff Martin Ivan Tong Kai Lap Jesper Jarlbæk Mads Nipper
Majken Schultz Søren Balling
Today, we have considered and approved the interim
report for the period 1 June 2017 – 31 August 2017 for
Bang & Olufsen a/s.
The interim report is presented in accordance with IAS
34, Interim Financial Reporting, as endorsed by the EU
and additional requirements in the Danish Financial
Statements Act.
It is our opinion that the interim report provides a true
and fair view of the Group’s assets, liabilities and finan-
cial position as at 31 August 2017 and the results of the
Group’s operations and cash flows for the period
1 June 2017 – 31 August 2017.
It is also our opinion that the management report gives
a true and fair view of developments in the Group’s
activities and financial situation, the earnings for the
period and the Group’s financial position in general as
well as a description of the most significant risks and
uncertainties to which the Group is exposed.
MANAGEMENT’S STATEMENT
HIGHLIGHTS · KEY FIGURES · MANAGEMENT REPORT · STATEMENT · FINANCIAL REVIEW · ADDITIONAL INFORMATIONManagements statement
BANG & OLUFSEN A/S INTERIM REPORT 1ST QUARTER 2017/18 · 12
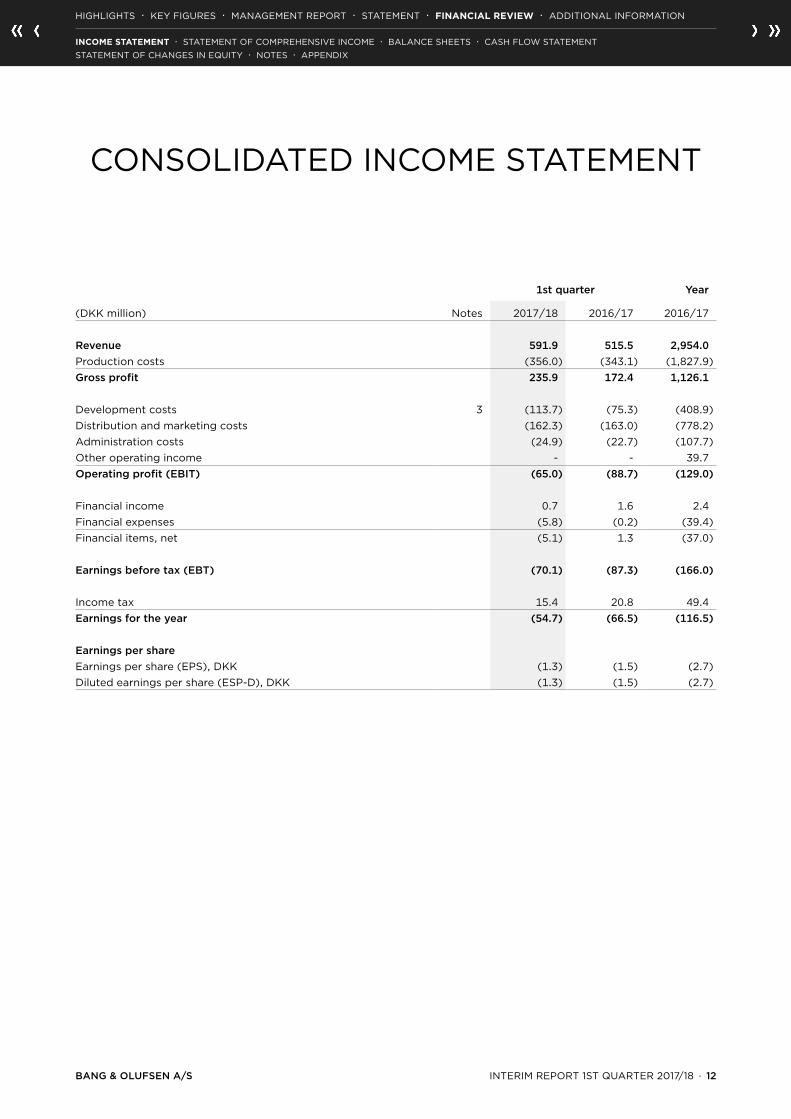
CONSOLIDATED INCOME STATEMENT
1st quarter Year
(DKK million) Notes 2017/18 2016/17 2016/17
Revenue 591.9 515.5 2,954.0 Production costs (356.0) (343.1) (1,827.9)Gross profit 235.9 172.4 1,126.1
Development costs 3 (113.7) (75.3) (408.9)Distribution and marketing costs (162.3) (163.0) (778.2)Administration costs (24.9) (22.7) (107.7)Other operating income - - 39.7 Operating profit (EBIT) (65.0) (88.7) (129.0)
Financial income 0.7 1.6 2.4 Financial expenses (5.8) (0.2) (39.4)Financial items, net (5.1) 1.3 (37.0)
Earnings before tax (EBT) (70.1) (87.3) (166.0)
Income tax 15.4 20.8 49.4 Earnings for the year (54.7) (66.5) (116.5)
Earnings per shareEarnings per share (EPS), DKK (1.3) (1.5) (2.7)Diluted earnings per share (ESP-D), DKK (1.3) (1.5) (2.7)
HIGHLIGHTS · KEY FIGURES · MANAGEMENT REPORT · STATEMENT · FINANCIAL REVIEW · ADDITIONAL INFORMATION
INCOME STATEMENT · STATEMENT OF COMPREHENSIVE INCOME · BALANCE SHEETS · CASH FLOW STATEMENT STATEMENT OF CHANGES IN EQUITY · NOTES · APPENDIX
Income StatementFinancial review

BANG & OLUFSEN A/S INTERIM REPORT 1ST QUARTER 2017/18 · 13
CONSOLIDATED STATEMENT OF COMPREHENSIVE INCOME
1st quarter Year
(DKK million) 2017/18 2016/17 2016/17
Earnings for the year (54.7) (66.5) (116.5)
Items that will be reclassified subsequently to the income statement:Exchange rate adjustment of investment in foreign subsidiaries (5.6) (3.5) (2.3)Change in fair value of derivative financial instruments used as cash flow hedges (6.4) (0.6) (28.9)Transfer to the income statement of fair value adjustments of derivative financial instruments used as cash flow hedges, realised cash flows: Transfer to revenue 2.8 1.0 2.9 Transfer to production costs (5.3) - 6.3 Income tax on items that will be reclassified to the income statement: 2.0 (0.1) 4.4
Items that will not be reclassified subsequently to the income statement:Actuarial gains/(losses) on defined benefit plans - - 0.7 Income tax on items that will not be reclassified to the income statement: - - (0.2)Other comprehensive income for the year, net of tax (12.5) (3.2) (17.1)
Total comprehensive income for the year (67.2) (69.7) (133.6)
HIGHLIGHTS · KEY FIGURES · MANAGEMENT REPORT · STATEMENT · FINANCIAL REVIEW · ADDITIONAL INFORMATION
INCOME STATEMENT · STATEMENT OF COMPREHENSIVE INCOME · BALANCE SHEETS · CASH FLOW STATEMENT STATEMENT OF CHANGES IN EQUITY · NOTES · APPENDIX
Comprehensive Income
BANG & OLUFSEN A/S INTERIM REPORT 1ST QUARTER 2017/18 · 14
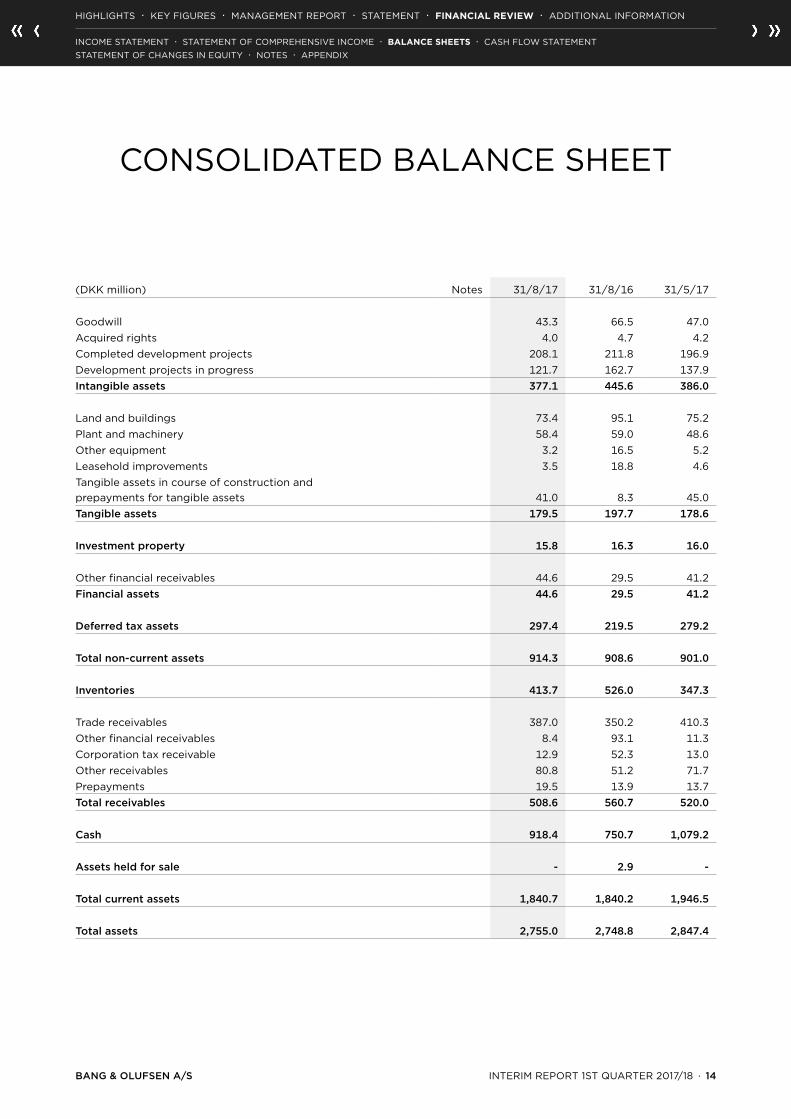
CONSOLIDATED BALANCE SHEET
(DKK million) Notes 31/8/17 31/8/16 31/5/17
Goodwill 43.3 66.5 47.0 Acquired rights 4.0 4.7 4.2 Completed development projects 208.1 211.8 196.9 Development projects in progress 121.7 162.7 137.9 Intangible assets 377.1 445.6 386.0
Land and buildings 73.4 95.1 75.2 Plant and machinery 58.4 59.0 48.6 Other equipment 3.2 16.5 5.2 Leasehold improvements 3.5 18.8 4.6 Tangible assets in course of construction and prepayments for tangible assets 41.0 8.3 45.0 Tangible assets 179.5 197.7 178.6
Investment property 15.8 16.3 16.0
Other financial receivables 44.6 29.5 41.2 Financial assets 44.6 29.5 41.2
Deferred tax assets 297.4 219.5 279.2
Total non-current assets 914.3 908.6 901.0
Inventories 413.7 526.0 347.3
Trade receivables 387.0 350.2 410.3 Other financial receivables 8.4 93.1 11.3 Corporation tax receivable 12.9 52.3 13.0 Other receivables 80.8 51.2 71.7 Prepayments 19.5 13.9 13.7 Total receivables 508.6 560.7 520.0
Cash 918.4 750.7 1,079.2
Assets held for sale - 2.9 -
Total current assets 1,840.7 1,840.2 1,946.5
Total assets 2,755.0 2,748.8 2,847.4
HIGHLIGHTS · KEY FIGURES · MANAGEMENT REPORT · STATEMENT · FINANCIAL REVIEW · ADDITIONAL INFORMATION
INCOME STATEMENT · STATEMENT OF COMPREHENSIVE INCOME · BALANCE SHEETS · CASH FLOW STATEMENT STATEMENT OF CHANGES IN EQUITY · NOTES · APPENDIX
Balance sheet

BANG & OLUFSEN A/S INTERIM REPORT 1ST QUARTER 2017/18 · 15
CONSOLIDATED BALANCE SHEET
(DKK million) Notes 31/8/17 31/8/16 31/5/17
Share capital 432.0 432.0 432.0 Translation reserve 13.1 17.6 18.7 Reserve for cash flow hedges (19.7) 2.8 (12.8)Retained earnings 1,094.8 1,202.5 1,148.2 Total equity 1,520.2 1,654.9 1,586.2
Pensions 14.6 14.9 14.5 Deferred tax 9.6 11.0 10.7 Provisions 36.5 42.0 28.0 Mortgage loans 167.9 177.3 170.2 Other non-current liabilities 23.7 0.9 1.6 Deferred income 123.7 133.7 123.7 Total non-current liabilities 376.1 379.9 348.7
Mortgage loans 9.1 8.5 9.1 Provisions 67.9 24.8 79.4 Trade payables 428.7 365.1 463.2 Corporation tax payable 10.6 24.4 8.2 Other liabilities 321.6 258.3 327.7 Deferred income 20.7 32.8 25.0 Other current liabilities 858.6 714.0 912.5
Total liabilities 1,234.7 1,093.9 1,261.2
Total equity and liabilities 2,755.0 2,748.8 2,847.4
HIGHLIGHTS · KEY FIGURES · MANAGEMENT REPORT · STATEMENT · FINANCIAL REVIEW · ADDITIONAL INFORMATION
INCOME STATEMENT · STATEMENT OF COMPREHENSIVE INCOME · BALANCE SHEETS · CASH FLOW STATEMENT STATEMENT OF CHANGES IN EQUITY · NOTES · APPENDIX

BANG & OLUFSEN A/S INTERIM REPORT 1ST QUARTER 2017/18 · 16
CONSOLIDATED CASH FLOW STATEMENT
1st quarter Year
(DKK million) Notes 2017/18 2016/17 2016/17
Earnings for the year - continuing operations (54.7) (66.5) (116.5)Amortisation, depreciation and impairment losses 88.2 48.7 327.9 Adjustments for non-cash items 4 (4.2) (22.2) (48.4)Change in receivables 8.4 81.1 (5.9)Change in inventories (66.3) (28.0) 59.6 Change in trade payables etc (44.8) (19.4) 154.4 Cash flow from operations (73.4) (6.4) 371.1
Interest received and paid, net (3.3) 1.3 (9.3)Income tax paid (1.6) (1.4) (9.5)Cash flow from operating activities (78.3) (6.5) 352.3
Purchase of intangible non-current assets (65.8) (26.7) (177.5)Purchase of tangible non-current assets (14.0) (3.1) (64.3)Sales of tangible non-current assets - 2.6 2.6 Proceeds from sale of businesses - - 122.9 Change in financial receivables (0.5) 1.2 71.3 Cash flow from investing activities (80.3) (26.0) (45.0)
Free cash flow (158.7) (32.5) 307.2
Repayment of long-term loans (2.2) (3.8) (10.4)Settlement of share options - (1.6) (6.1)Cash flow from financing activities (2.2) (5.4) (16.5)
Change in cash and cash equivalents (160.8) (37.9) 290.7
Cash and cash equivalents, opening balance 1,079.2 788.5 788.5 Cash and cash equivalents, closing balance 918.4 750.6 1,079.2
Cash and cash equivalents:Cash 918.4 750.6 1,079.2 Cash and cash equivalents, closing balance 918.4 750.6 1,079.2
HIGHLIGHTS · KEY FIGURES · MANAGEMENT REPORT · STATEMENT · FINANCIAL REVIEW · ADDITIONAL INFORMATION
INCOME STATEMENT · STATEMENT OF COMPREHENSIVE INCOME · BALANCE SHEETS · CASH FLOW STATEMENT STATEMENT OF CHANGES IN EQUITY · NOTES · APPENDIX
Cash flow
BANG & OLUFSEN A/S INTERIM REPORT 1ST QUARTER 2017/18 · 17
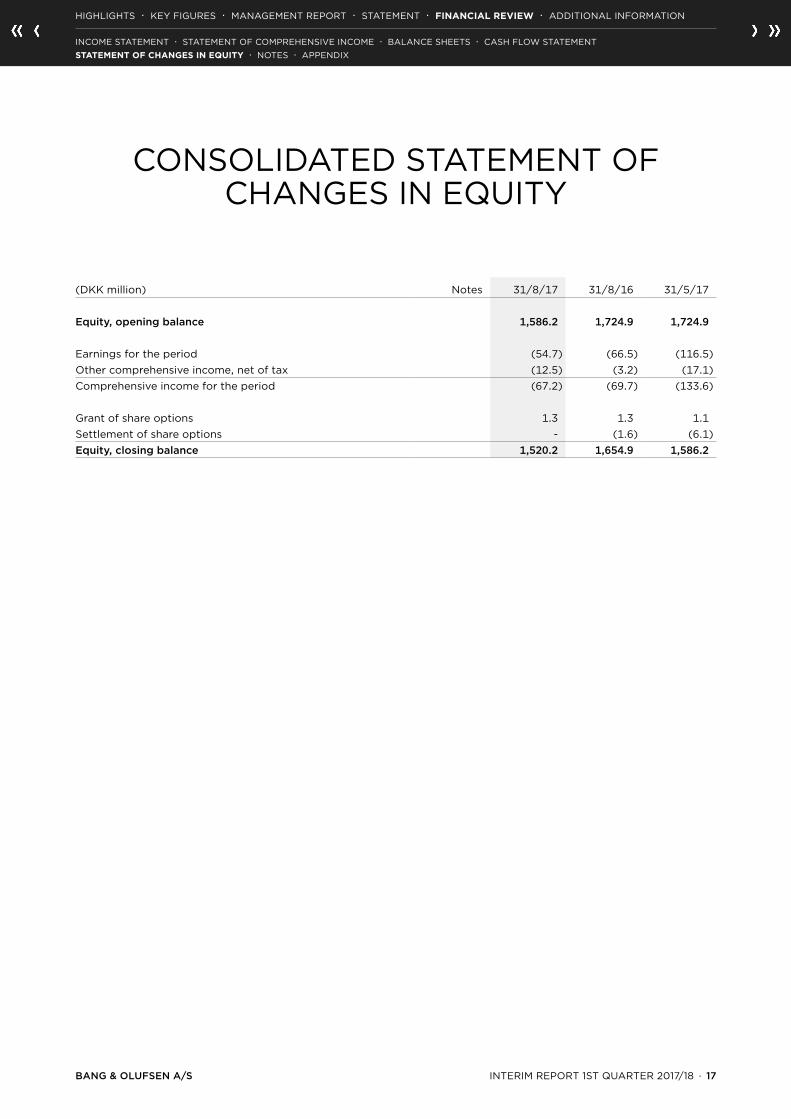
CONSOLIDATED STATEMENT OF CHANGES IN EQUITY
(DKK million) Notes 31/8/17 31/8/16 31/5/17
Equity, opening balance 1,586.2 1,724.9 1,724.9
Earnings for the period (54.7) (66.5) (116.5)Other comprehensive income, net of tax (12.5) (3.2) (17.1)Comprehensive income for the period (67.2) (69.7) (133.6)
Grant of share options 1.3 1.3 1.1 Settlement of share options - (1.6) (6.1)Equity, closing balance 1,520.2 1,654.9 1,586.2
HIGHLIGHTS · KEY FIGURES · MANAGEMENT REPORT · STATEMENT · FINANCIAL REVIEW · ADDITIONAL INFORMATION
INCOME STATEMENT · STATEMENT OF COMPREHENSIVE INCOME · BALANCE SHEETS · CASH FLOW STATEMENT STATEMENT OF CHANGES IN EQUITY · NOTES · APPENDIX
Changes in equity
BANG & OLUFSEN A/S INTERIM REPORT 1ST QUARTER 2017/18 · 18
NOTES
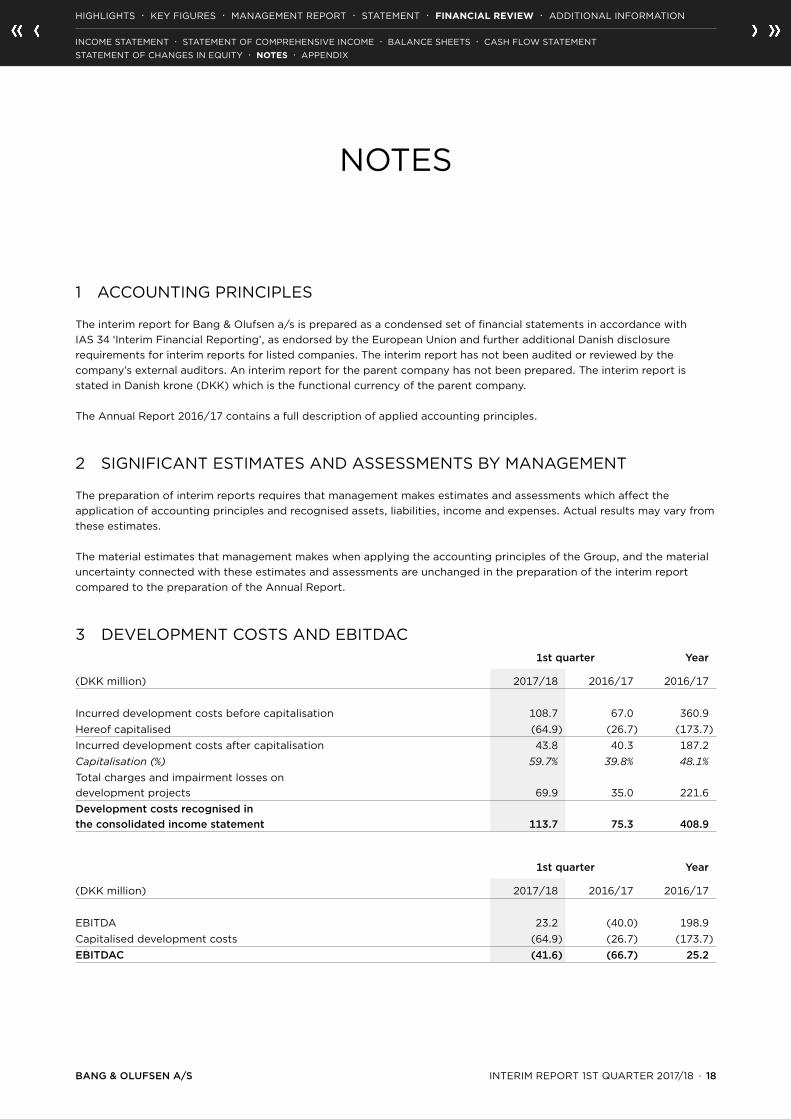
1 ACCOUNTING PRINCIPLES
The interim report for Bang & Olufsen a/s is prepared as a condensed set of financial statements in accordance with IAS 34 ‘Interim Financial Reporting’, as endorsed by the European Union and further additional Danish disclosure requirements for interim reports for listed companies. The interim report has not been audited or reviewed by the company’s external auditors. An interim report for the parent company has not been prepared. The interim report is stated in Danish krone (DKK) which is the functional currency of the parent company.
The Annual Report 2016/17 contains a full description of applied accounting principles.
2 SIGNIFICANT ESTIMATES AND ASSESSMENTS BY MANAGEMENT
The preparation of interim reports requires that management makes estimates and assessments which affect the application of accounting principles and recognised assets, liabilities, income and expenses. Actual results may vary from these estimates.
The material estimates that management makes when applying the accounting principles of the Group, and the material uncertainty connected with these estimates and assessments are unchanged in the preparation of the interim report compared to the preparation of the Annual Report.
3 DEVELOPMENT COSTS AND EBITDAC1st quarter Year
(DKK million) 2017/18 2016/17 2016/17
Incurred development costs before capitalisation 108.7 67.0 360.9 Hereof capitalised (64.9) (26.7) (173.7)Incurred development costs after capitalisation 43.8 40.3 187.2 Capitalisation (%) 59.7% 39.8% 48.1%Total charges and impairment losses on development projects 69.9 35.0 221.6 Development costs recognised in the consolidated income statement 113.7 75.3 408.9
1st quarter Year
(DKK million) 2017/18 2016/17 2016/17
EBITDA 23.2 (40.0) 198.9 Capitalised development costs (64.9) (26.7) (173.7) EBITDAC (41.6) (66.7) 25.2
HIGHLIGHTS · KEY FIGURES · MANAGEMENT REPORT · STATEMENT · FINANCIAL REVIEW · ADDITIONAL INFORMATION
INCOME STATEMENT · STATEMENT OF COMPREHENSIVE INCOME · BALANCE SHEETS · CASH FLOW STATEMENT STATEMENT OF CHANGES IN EQUITY · NOTES · APPENDIX
Notes
BANG & OLUFSEN A/S INTERIM REPORT 1ST QUARTER 2017/18 · 19
NOTES
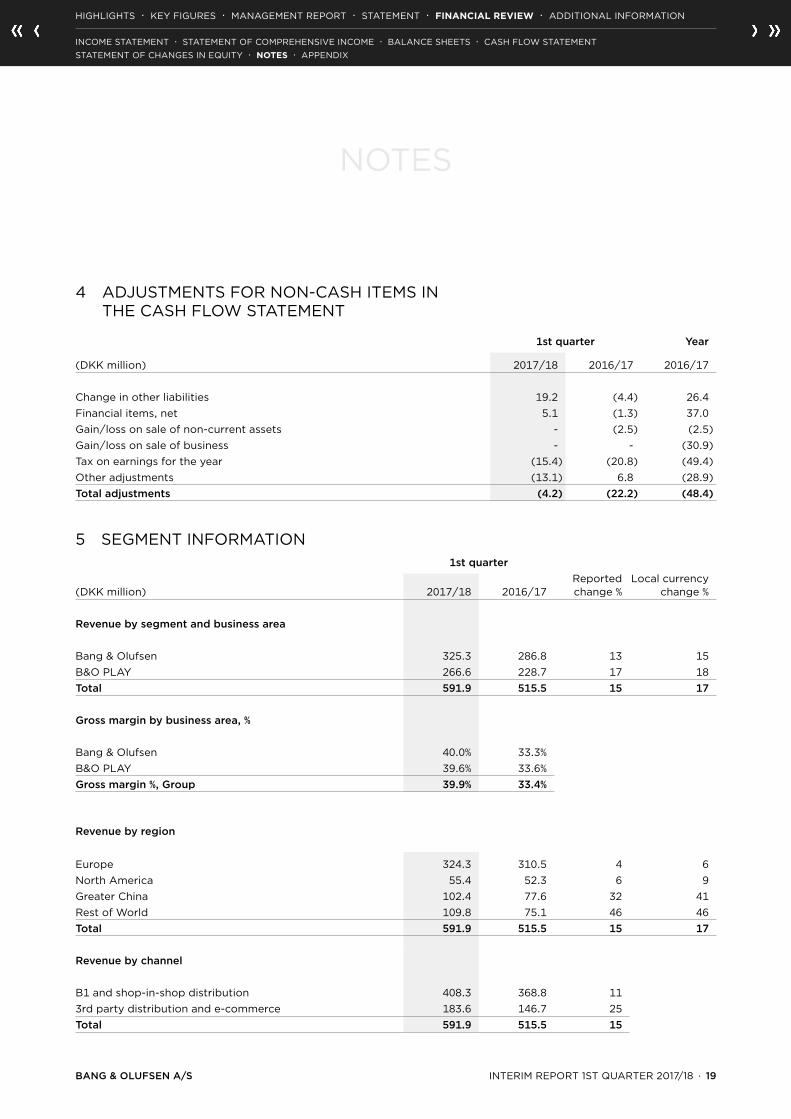
4 ADJUSTMENTS FOR NON-CASH ITEMS IN THE CASH FLOW STATEMENT
1st quarter Year
(DKK million) 2017/18 2016/17 2016/17
Change in other liabilities 19.2 (4.4) 26.4 Financial items, net 5.1 (1.3) 37.0 Gain/loss on sale of non-current assets - (2.5) (2.5)Gain/loss on sale of business - - (30.9)Tax on earnings for the year (15.4) (20.8) (49.4)Other adjustments (13.1) 6.8 (28.9)Total adjustments (4.2) (22.2) (48.4)
5 SEGMENT INFORMATION1st quarter
(DKK million) 2017/18 2016/17Reported change %
Local currency change %
Revenue by segment and business area
Bang & Olufsen 325.3 286.8 13 15B&O PLAY 266.6 228.7 17 18Total 591.9 515.5 15 17
Gross margin by business area, %
Bang & Olufsen 40.0% 33.3%B&O PLAY 39.6% 33.6%Gross margin %, Group 39.9% 33.4%
Revenue by region
Europe 324.3 310.5 4 6 North America 55.4 52.3 6 9 Greater China 102.4 77.6 32 41 Rest of World 109.8 75.1 46 46 Total 591.9 515.5 15 17
Revenue by channel
B1 and shop-in-shop distribution 408.3 368.8 11 3rd party distribution and e-commerce 183.6 146.7 25 Total 591.9 515.5 15
HIGHLIGHTS · KEY FIGURES · MANAGEMENT REPORT · STATEMENT · FINANCIAL REVIEW · ADDITIONAL INFORMATION
INCOME STATEMENT · STATEMENT OF COMPREHENSIVE INCOME · BALANCE SHEETS · CASH FLOW STATEMENT STATEMENT OF CHANGES IN EQUITY · NOTES · APPENDIX

BANG & OLUFSEN A/S INTERIM REPORT 1ST QUARTER 2017/18 · 20
APPENDIX 1
Earnings by quarter 2017/18:2017/18
(DKK million) Q1 Q2 Q3 Q4
Revenue 591.9Production costs (356.0)Gross profit 235.9
Development costs (113.7)Distribution and marketing costs (162.3)Administration costs (24.9)Earnings before interest and tax (EBIT) (65.0)
Financial income 0.7Financial expenses (5.8)Financial items, net (5.1)
Earnings before tax (EBT) (70.1)
Income tax 15.4Earnings for the year (54.7)
Accumulated earnings by quarter 2017/18:2017/18
(DKK million) 3M 6M 9M 12M
Revenue 591.9Production costs (356.0)Gross profit 235.9
Development costs (113.7)Distribution and marketing costs (162.3)Administration costs (24.9)Earnings before interest and tax (EBIT) (65.0)
Financial income 0.7Financial expenses (5.8)Financial items, net (5.1)
Earnings before tax (EBT) (70.1)
Income tax 15.4Earnings for the year (54.7)
HIGHLIGHTS · KEY FIGURES · MANAGEMENT REPORT · STATEMENT · FINANCIAL REVIEW · ADDITIONAL INFORMATION
INCOME STATEMENT · STATEMENT OF COMPREHENSIVE INCOME · BALANCE SHEETS · CASH FLOW STATEMENT STATEMENT OF CHANGES IN EQUITY · NOTES · APPENDIX
Appendix
BANG & OLUFSEN A/S INTERIM REPORT 1ST QUARTER 2017/18 · 21
APPENDIX 1
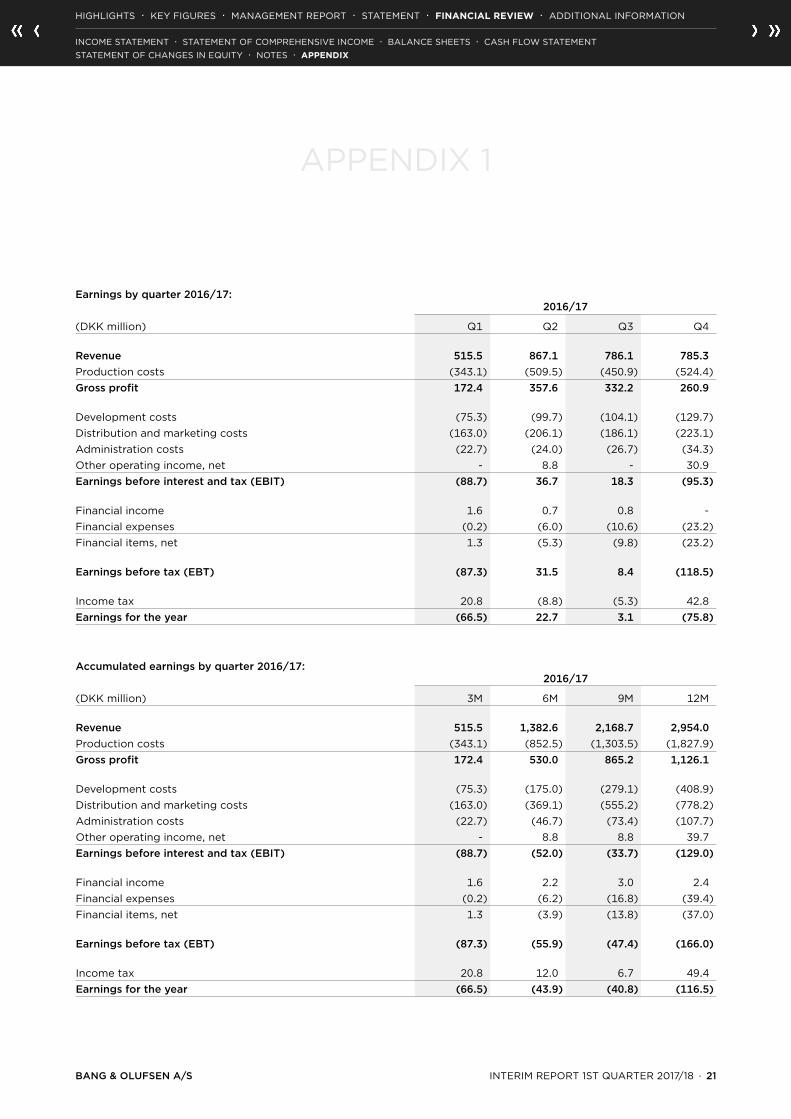
Earnings by quarter 2016/17:2016/17
(DKK million) Q1 Q2 Q3 Q4
Revenue 515.5 867.1 786.1 785.3Production costs (343.1) (509.5) (450.9) (524.4)Gross profit 172.4 357.6 332.2 260.9
Development costs (75.3) (99.7) (104.1) (129.7)Distribution and marketing costs (163.0) (206.1) (186.1) (223.1)Administration costs (22.7) (24.0) (26.7) (34.3)Other operating income, net - 8.8 - 30.9Earnings before interest and tax (EBIT) (88.7) 36.7 18.3 (95.3)
Financial income 1.6 0.7 0.8 -Financial expenses (0.2) (6.0) (10.6) (23.2)Financial items, net 1.3 (5.3) (9.8) (23.2)
Earnings before tax (EBT) (87.3) 31.5 8.4 (118.5)
Income tax 20.8 (8.8) (5.3) 42.8Earnings for the year (66.5) 22.7 3.1 (75.8)
Accumulated earnings by quarter 2016/17:2016/17
(DKK million) 3M 6M 9M 12M
Revenue 515.5 1,382.6 2,168.7 2,954.0Production costs (343.1) (852.5) (1,303.5) (1,827.9)Gross profit 172.4 530.0 865.2 1,126.1
Development costs (75.3) (175.0) (279.1) (408.9)Distribution and marketing costs (163.0) (369.1) (555.2) (778.2)Administration costs (22.7) (46.7) (73.4) (107.7)Other operating income, net - 8.8 8.8 39.7Earnings before interest and tax (EBIT) (88.7) (52.0) (33.7) (129.0)
Financial income 1.6 2.2 3.0 2.4Financial expenses (0.2) (6.2) (16.8) (39.4)Financial items, net 1.3 (3.9) (13.8) (37.0)
Earnings before tax (EBT) (87.3) (55.9) (47.4) (166.0)
Income tax 20.8 12.0 6.7 49.4Earnings for the year (66.5) (43.9) (40.8) (116.5)
HIGHLIGHTS · KEY FIGURES · MANAGEMENT REPORT · STATEMENT · FINANCIAL REVIEW · ADDITIONAL INFORMATION
INCOME STATEMENT · STATEMENT OF COMPREHENSIVE INCOME · BALANCE SHEETS · CASH FLOW STATEMENT STATEMENT OF CHANGES IN EQUITY · NOTES · APPENDIX

BANG & OLUFSEN A/S INTERIM REPORT 1ST QUARTER 2017/18 · 22
ADDITIONAL INFORMATION
For further information, please contact:
CEO, Henrik Clausen, tel.: +45 9684 5000
CFO, Anders Aakær Jensen, tel.: +45 9684 5000
Investors, Claus Højmark Jensen, tel.: +45 2325 1067
Press contact, Jens Gamborg, tel.: +45 2496 9371
Financial calendar
Financial statements
11 January 2018 Interim report (2nd quarter 2017/18)
6 April 2018 Interim report (3rd quarter 2017/18)
12 July 2018 Annual report 2017/18
4 October 2018 Interim report (1st quarter 2018/19)
Safe Harbour statement
The report contains statements relating to expectations for future developments, including future revenue and
earnings, as well as expected business-related events. Such statements are uncertain and carry an element of risk
since many factors, of which some are beyond Bang & Olufsen’s control, can mean that actual developments will
deviate significantly from the expectations expressed in the report. Without being exhaustive, such factors include
among others, general economic and commercial factors, including market and competitive matters, supplier
issues and financial issues in the form of foreign exchange, interest rates, credit, and liquidity risks.
About Bang & Olufsen
Bang & Olufsen develops iconic, innovative audio and video products for consumers and for more than 90 years
the brand has been globally-renowned for its design, acoustics and craftsmanship. Bang & Olufsen was founded in
Struer, Denmark, in 1925 by Peter Bang and Svend Olufsen, two innovative, young engineers devoted to developing
functional and beautiful high-quality audio products. This remains the foundation for the company and over the
last 90 years, Bang & Olufsen has developed its expertise through practice and cooperation with external partners.
The long-standing craftsmanship tradition and the strong commitment to innovation and development have made
the brand globally renowned for its core capabilities within acoustics, design and craftsmanship. Today, Bang &
Olufsen’s product portfolio epitomises seamless media experiences in the home and on the move, for the family
and for the individual.
For additional information: please visit www.bang-olufsen.com.
HIGHLIGHTS · KEY FIGURES · MANAGEMENT REPORT · STATEMENT · FINANCIAL REVIEW · ADDITIONAL INFORMATIONAdditional Information