Embed Size (px)
Citation preview
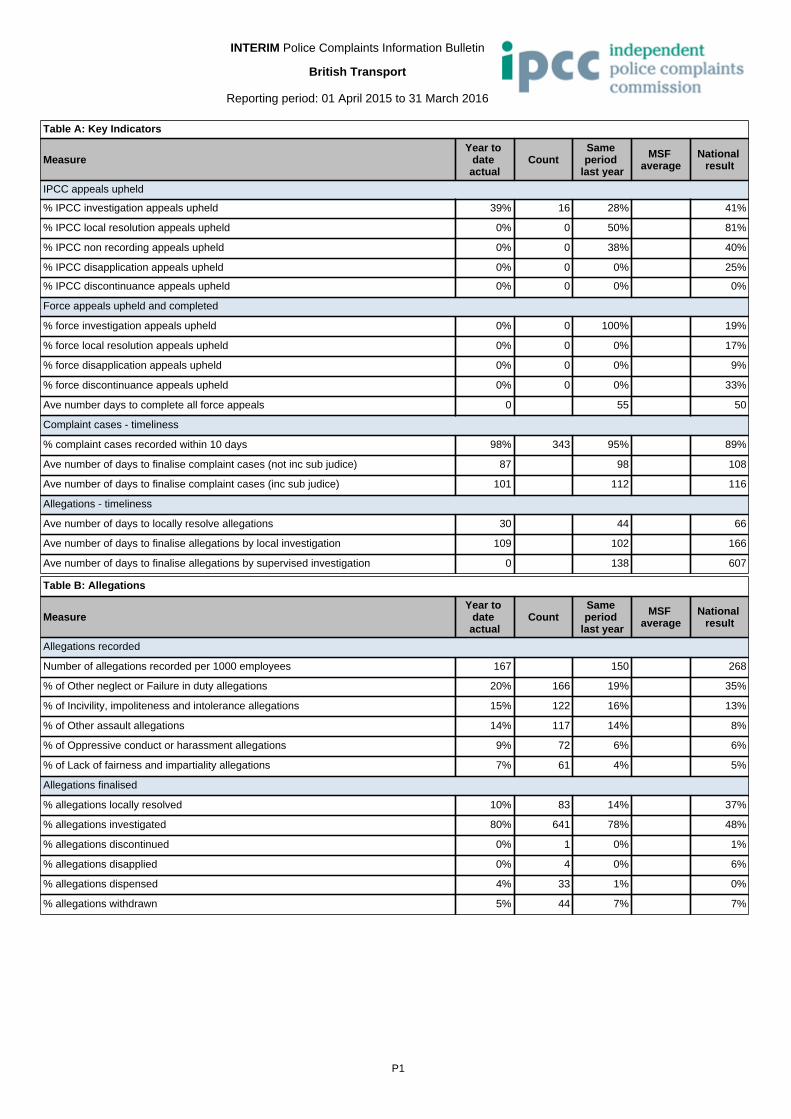
Table A: Key Indicators
MeasureYear to
date actual
CountSame period
last year
MSF average
National result
IPCC appeals upheld
% IPCC investigation appeals upheld 39% 16 28% 41%
% IPCC local resolution appeals upheld 0% 0 50% 81%
% IPCC non recording appeals upheld 0% 0 38% 40%
% IPCC disapplication appeals upheld 0% 0 0% 25%
% IPCC discontinuance appeals upheld 0% 0 0% 0%
Force appeals upheld and completed
% force investigation appeals upheld 0% 0 100% 19%
% force local resolution appeals upheld 0% 0 0% 17%
% force disapplication appeals upheld 0% 0 0% 9%
% force discontinuance appeals upheld 0% 0 0% 33%
Ave number days to complete all force appeals 0 55 50
Complaint cases - timeliness
% complaint cases recorded within 10 days 98% 343 95% 89%
Ave number of days to finalise complaint cases (not inc sub judice) 87 98 108
Ave number of days to finalise complaint cases (inc sub judice) 101 112 116
Allegations - timeliness
Ave number of days to locally resolve allegations 30 44 66
Ave number of days to finalise allegations by local investigation 109 102 166
Ave number of days to finalise allegations by supervised investigation 0 138 607
Table B: Allegations
MeasureYear to
date actual
CountSame period
last year
MSF average
National result
Allegations recorded
Number of allegations recorded per 1000 employees 167 150 268
% of Other neglect or Failure in duty allegations 20% 166 19% 35%
% of Incivility, impoliteness and intolerance allegations 15% 122 16% 13%
% of Other assault allegations 14% 117 14% 8%
% of Oppressive conduct or harassment allegations 9% 72 6% 6%
% of Lack of fairness and impartiality allegations 7% 61 4% 5%
Allegations finalised
% allegations locally resolved 10% 83 14% 37%
% allegations investigated 80% 641 78% 48%
% allegations discontinued 0% 1 0% 1%
% allegations disapplied 0% 4 0% 6%
% allegations dispensed 4% 33 1% 0%
% allegations withdrawn 5% 44 7% 7%
P1
INTERIM Police Complaints Information Bulletin
British Transport
Reporting period: 01 April 2015 to 31 March 2016
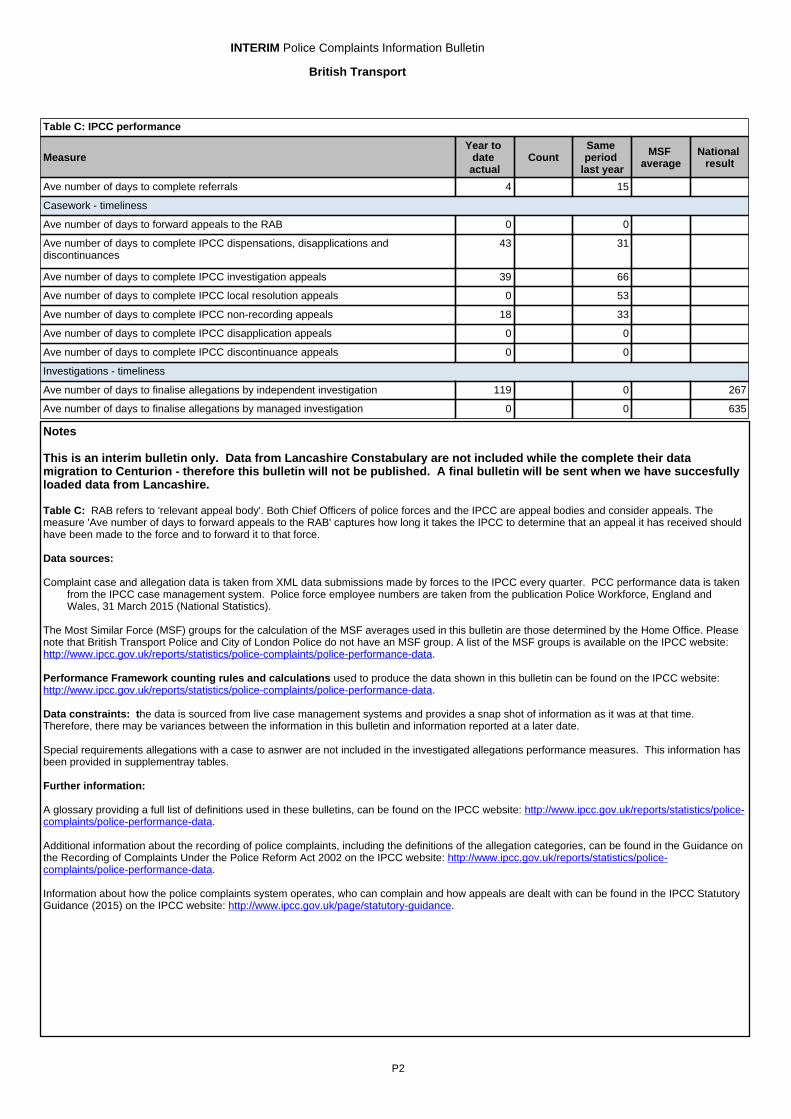
Table C: IPCC performance
MeasureYear to
date actual
CountSame period
last year
MSF average
National result
Ave number of days to complete referrals 4 15
Casework - timeliness
Ave number of days to forward appeals to the RAB 0 0
Ave number of days to complete IPCC dispensations, disapplications and discontinuances
43 31
Ave number of days to complete IPCC investigation appeals 39 66
Ave number of days to complete IPCC local resolution appeals 0 53
Ave number of days to complete IPCC non-recording appeals 18 33
Ave number of days to complete IPCC disapplication appeals 0 0
Ave number of days to complete IPCC discontinuance appeals 0 0
Investigations - timeliness
Ave number of days to finalise allegations by independent investigation 119 0 267
Ave number of days to finalise allegations by managed investigation 0 0 635
Notes
This is an interim bulletin only. Data from Lancashire Constabulary are not included while the complete their data migration to Centurion - therefore this bulletin will not be published. A final bulletin will be sent when we have succesfully loaded data from Lancashire.
Table C: RAB refers to 'relevant appeal body'. Both Chief Officers of police forces and the IPCC are appeal bodies and consider appeals. The measure 'Ave number of days to forward appeals to the RAB' captures how long it takes the IPCC to determine that an appeal it has received should have been made to the force and to forward it to that force.
Data sources:
Complaint case and allegation data is taken from XML data submissions made by forces to the IPCC every quarter. PCC performance data is taken from the IPCC case management system. Police force employee numbers are taken from the publication Police Workforce, England and Wales, 31 March 2015 (National Statistics).
The Most Similar Force (MSF) groups for the calculation of the MSF averages used in this bulletin are those determined by the Home Office. Please note that British Transport Police and City of London Police do not have an MSF group. A list of the MSF groups is available on the IPCC website: http://www.ipcc.gov.uk/reports/statistics/police-complaints/police-performance-data.
Performance Framework counting rules and calculations used to produce the data shown in this bulletin can be found on the IPCC website: http://www.ipcc.gov.uk/reports/statistics/police-complaints/police-performance-data.
Data constraints: the data is sourced from live case management systems and provides a snap shot of information as it was at that time. Therefore, there may be variances between the information in this bulletin and information reported at a later date.
Special requirements allegations with a case to asnwer are not included in the investigated allegations performance measures. This information has been provided in supplementray tables.
Further information:
A glossary providing a full list of definitions used in these bulletins, can be found on the IPCC website: http://www.ipcc.gov.uk/reports/statistics/police-complaints/police-performance-data.
Additional information about the recording of police complaints, including the definitions of the allegation categories, can be found in the Guidance on the Recording of Complaints Under the Police Reform Act 2002 on the IPCC website: http://www.ipcc.gov.uk/reports/statistics/police-complaints/police-performance-data.
Information about how the police complaints system operates, who can complain and how appeals are dealt with can be found in the IPCC Statutory Guidance (2015) on the IPCC website: http://www.ipcc.gov.uk/page/statutory-guidance.
P2
INTERIM Police Complaints Information Bulletin
British Transport
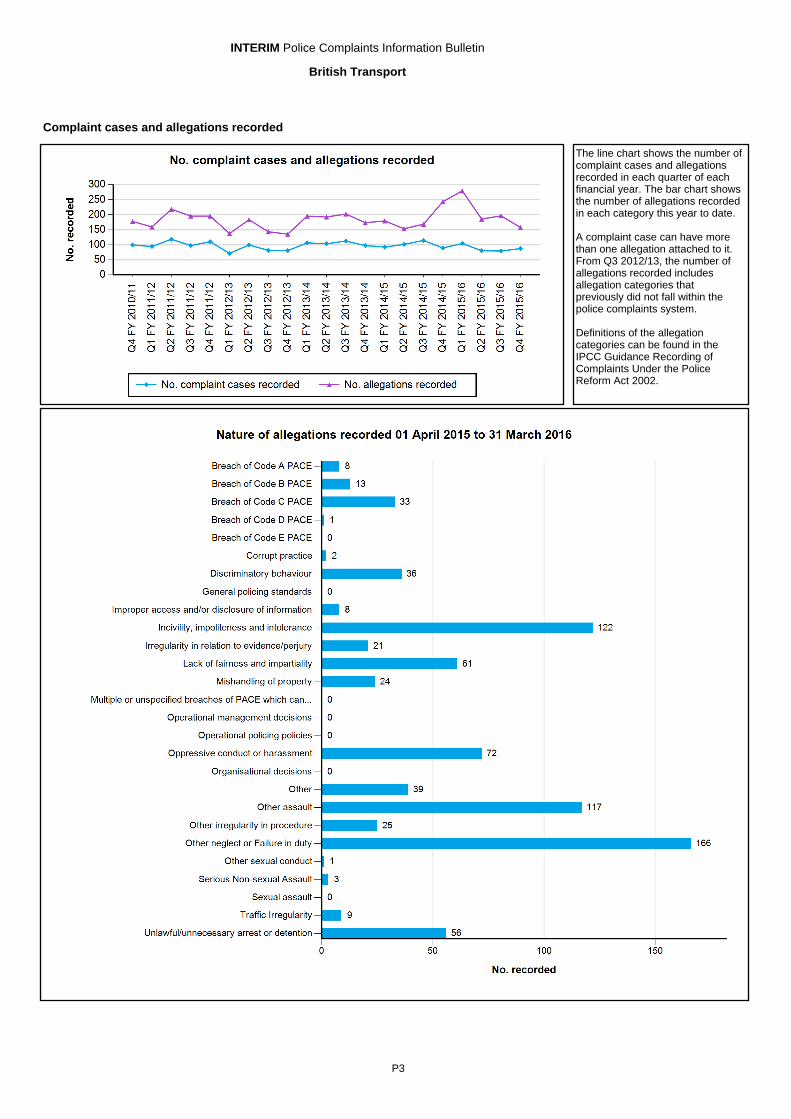
The line chart shows the number of complaint cases and allegations recorded in each quarter of each financial year. The bar chart shows the number of allegations recorded in each category this year to date.
A complaint case can have more than one allegation attached to it. From Q3 2012/13, the number of allegations recorded includes allegation categories that previously did not fall within the police complaints system.
Definitions of the allegation categories can be found in the IPCC Guidance Recording of Complaints Under the Police Reform Act 2002.
Complaint cases and allegations recorded
P3
INTERIM Police Complaints Information Bulletin
British Transport
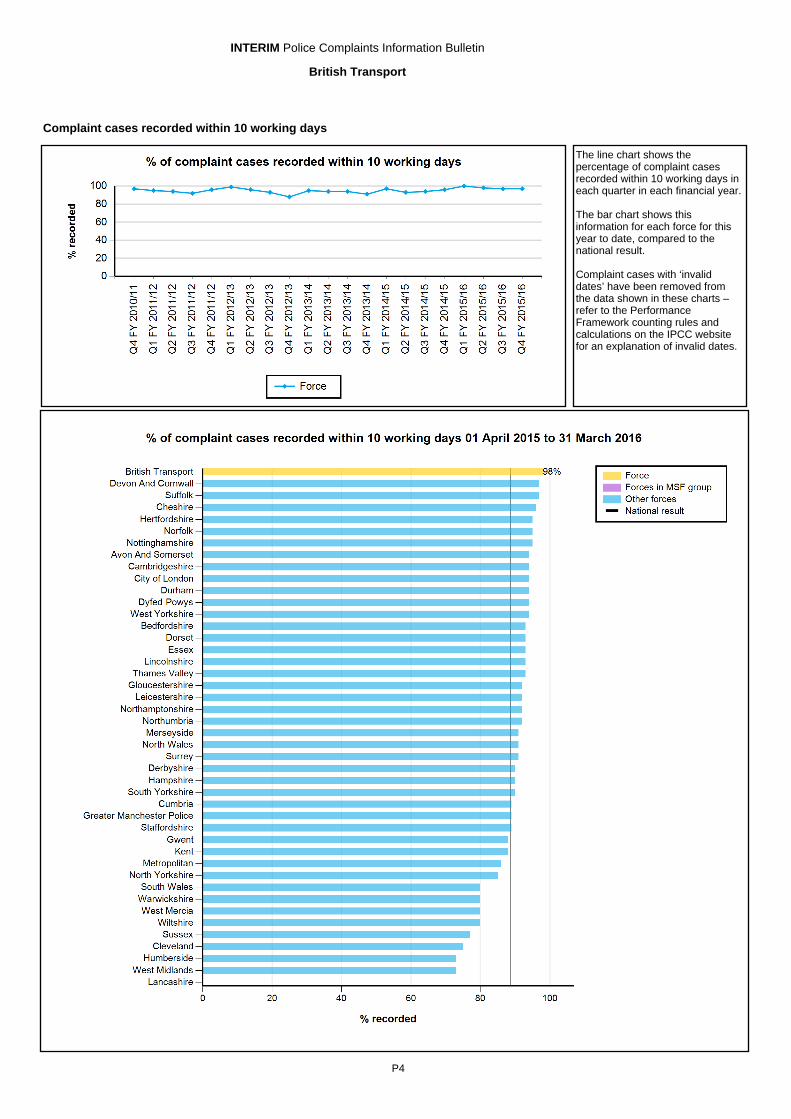
The line chart shows the percentage of complaint cases recorded within 10 working days in each quarter in each financial year.
The bar chart shows this information for each force for this year to date, compared to the national result.
Complaint cases with ‘invalid dates’ have been removed from the data shown in these charts – refer to the Performance Framework counting rules and calculations on the IPCC website for an explanation of invalid dates.
Complaint cases recorded within 10 working days
P4
INTERIM Police Complaints Information Bulletin
British Transport
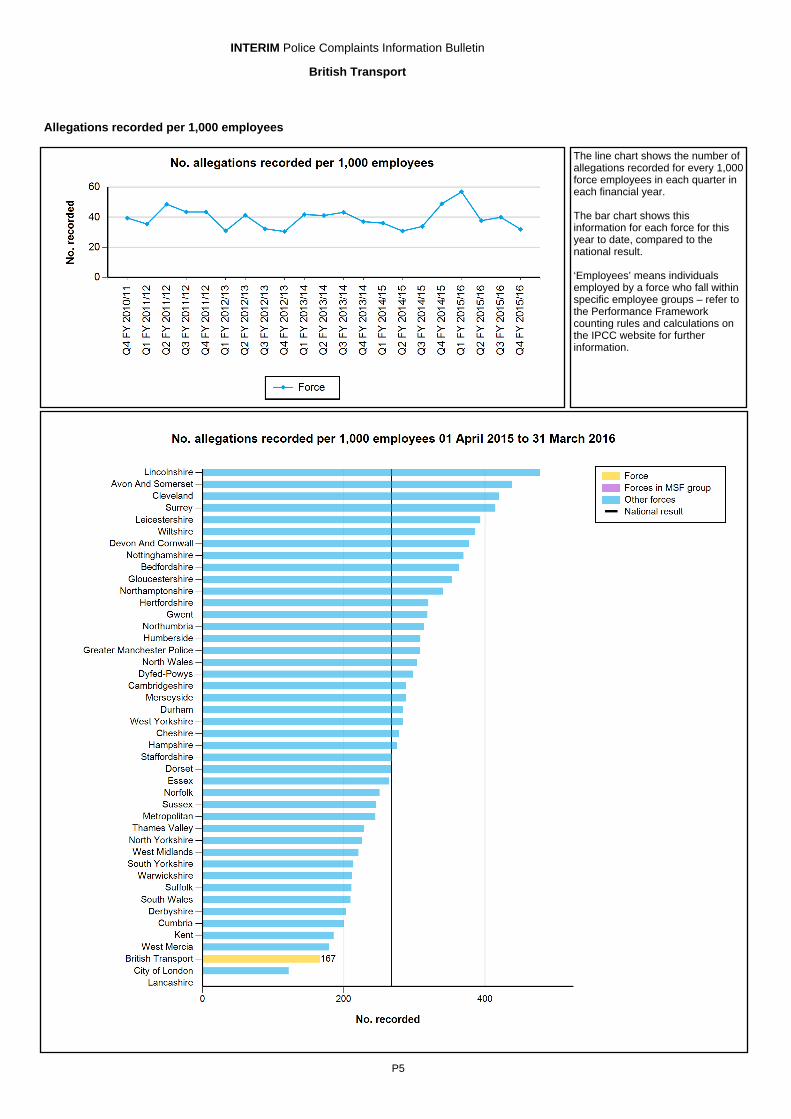
The line chart shows the number of allegations recorded for every 1,000 force employees in each quarter in each financial year.
The bar chart shows this information for each force for this year to date, compared to the national result.
‘Employees’ means individuals employed by a force who fall within specific employee groups – refer to the Performance Framework counting rules and calculations on the IPCC website for further information.
Allegations recorded per 1,000 employees
P5
INTERIM Police Complaints Information Bulletin
British Transport
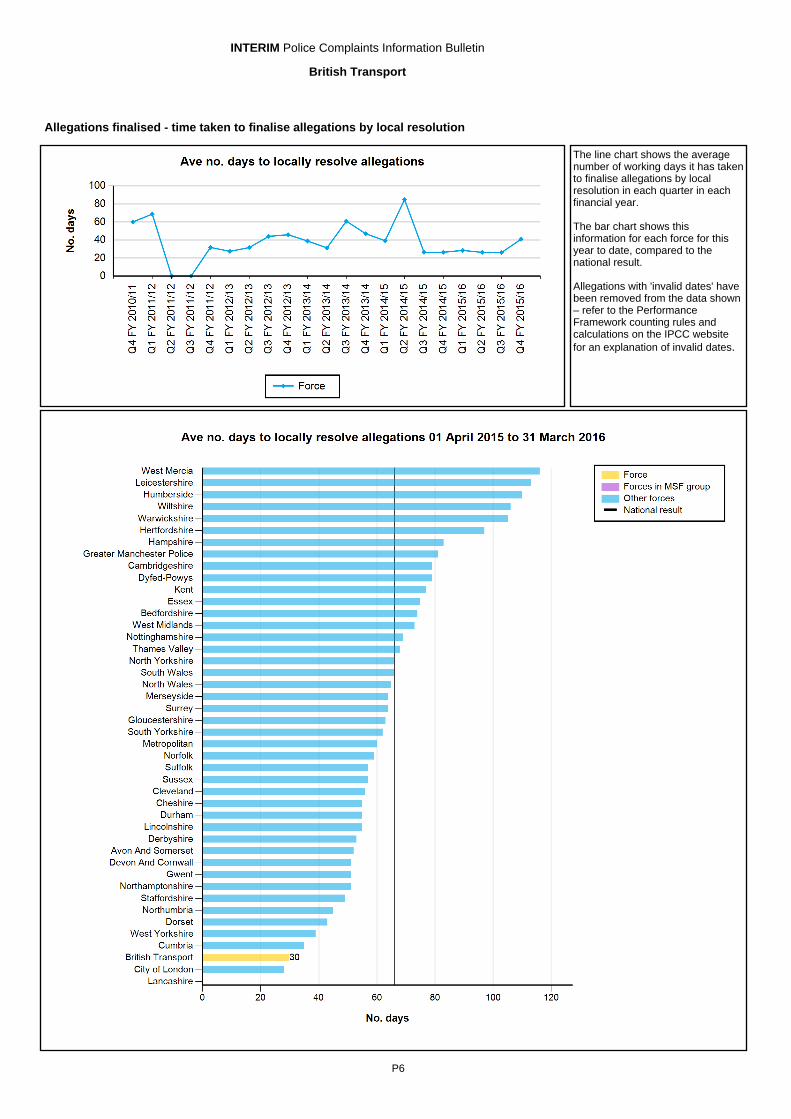
The line chart shows the average number of working days it has taken to finalise allegations by local resolution in each quarter in each financial year.
The bar chart shows this information for each force for this year to date, compared to the national result.
Allegations with 'invalid dates' have been removed from the data shown – refer to the Performance Framework counting rules and calculations on the IPCC website for an explanation of invalid dates.
Allegations finalised - time taken to finalise allegations by local resolution
P6
INTERIM Police Complaints Information Bulletin
British Transport
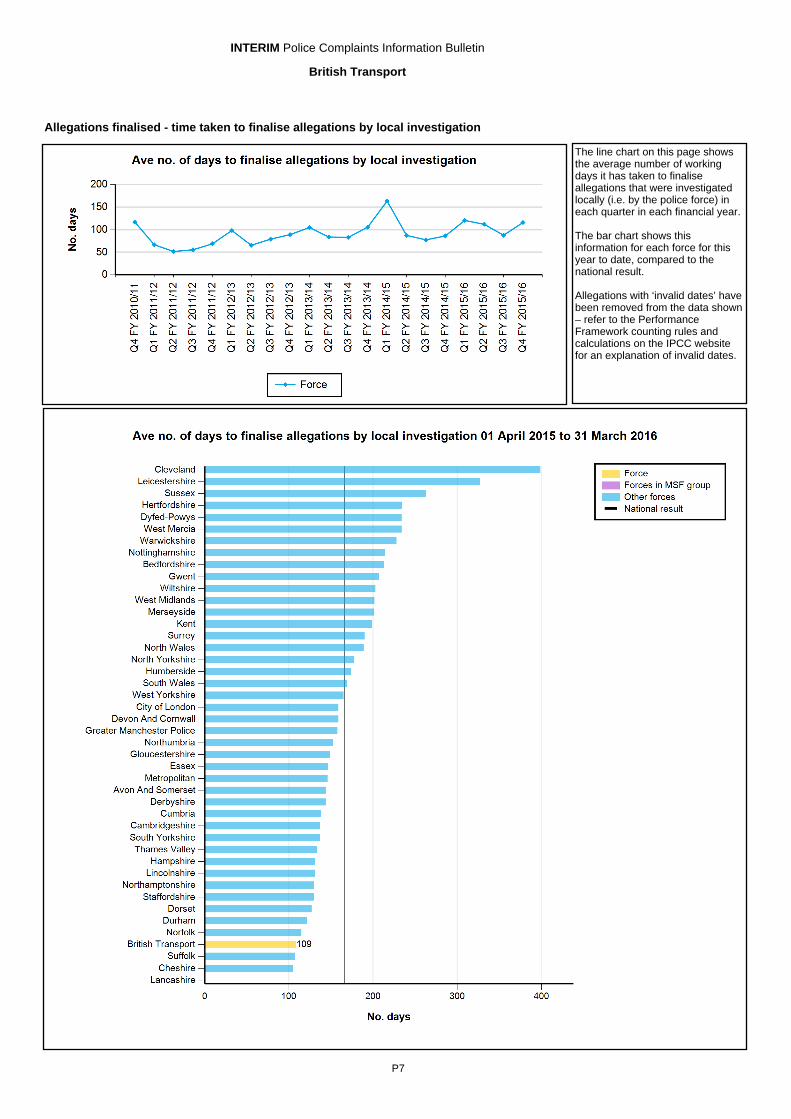
The line chart on this page shows the average number of working days it has taken to finalise allegations that were investigated locally (i.e. by the police force) in each quarter in each financial year.
The bar chart shows this information for each force for this year to date, compared to the national result.
Allegations with ‘invalid dates’ have been removed from the data shown – refer to the Performance Framework counting rules and calculations on the IPCC website for an explanation of invalid dates.
Allegations finalised - time taken to finalise allegations by local investigation
P7
INTERIM Police Complaints Information Bulletin
British Transport
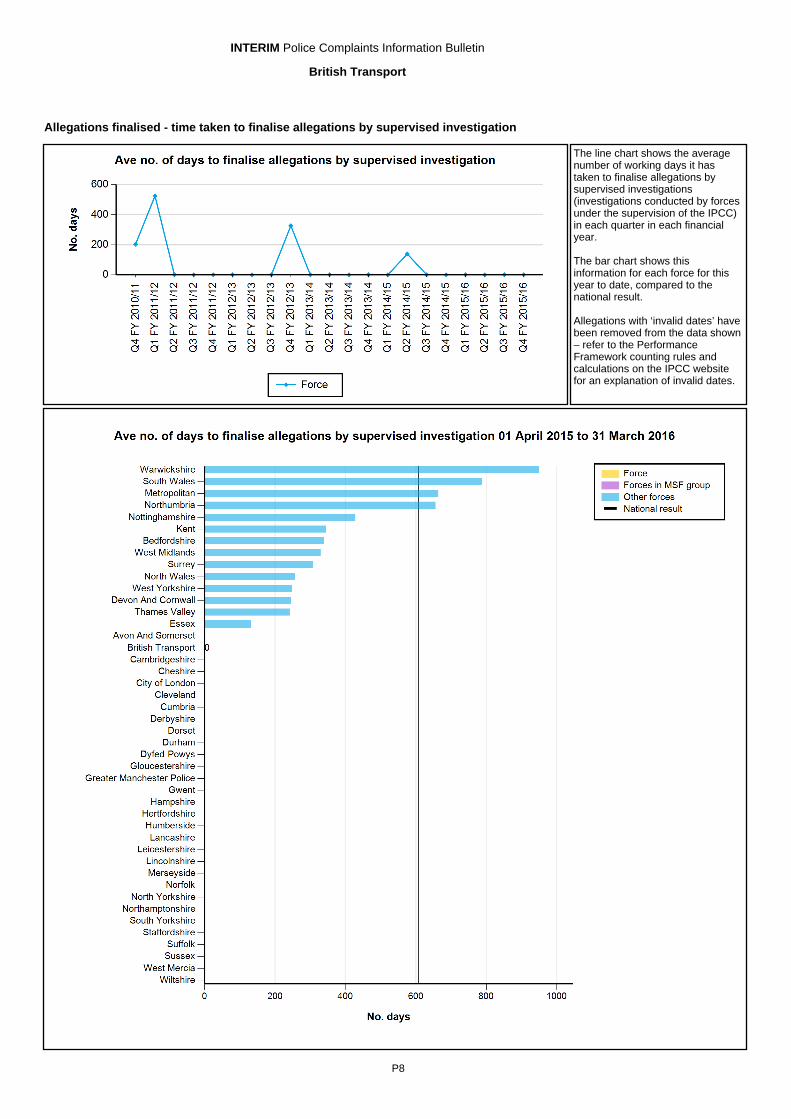
The line chart shows the average number of working days it has taken to finalise allegations by supervised investigations (investigations conducted by forces under the supervision of the IPCC) in each quarter in each financial year.
The bar chart shows this information for each force for this year to date, compared to the national result.
Allegations with ‘invalid dates’ have been removed from the data shown – refer to the Performance Framework counting rules and calculations on the IPCC website for an explanation of invalid dates.
Allegations finalised - time taken to finalise allegations by supervised investigation
P8
INTERIM Police Complaints Information Bulletin
British Transport
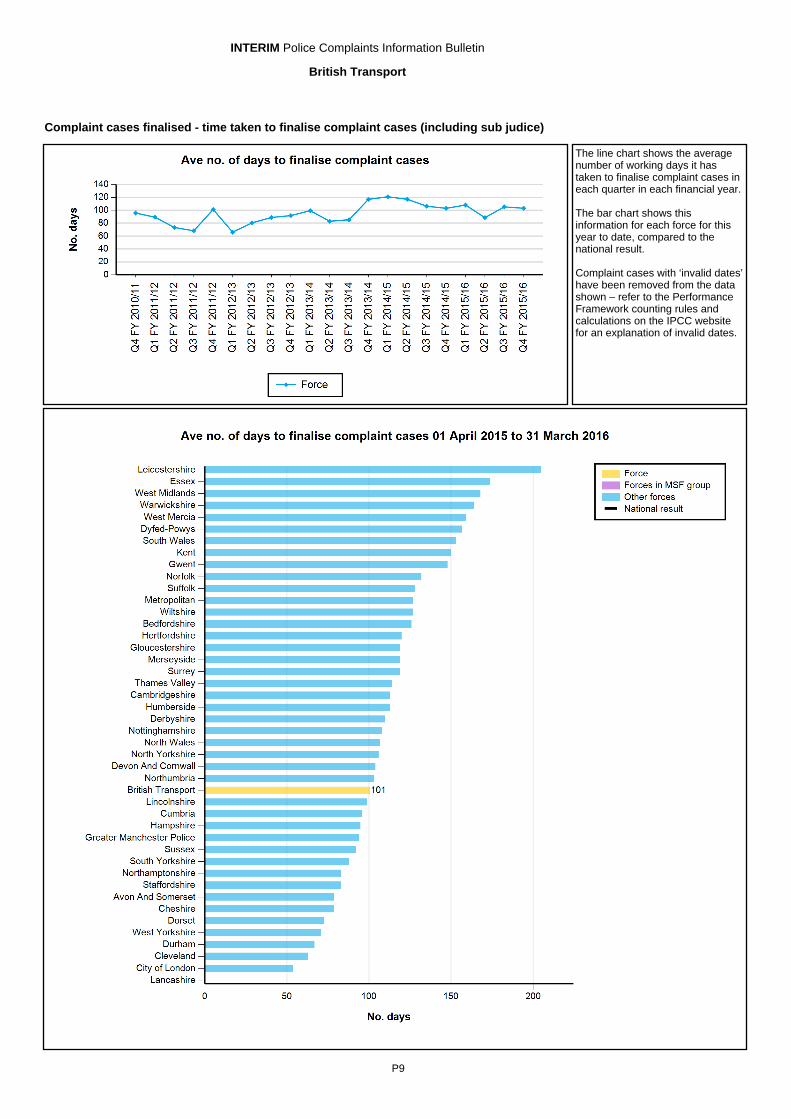
The line chart shows the average number of working days it has taken to finalise complaint cases in each quarter in each financial year.
The bar chart shows this information for each force for this year to date, compared to the national result.
Complaint cases with ‘invalid dates’ have been removed from the data shown – refer to the Performance Framework counting rules and calculations on the IPCC website for an explanation of invalid dates.
Complaint cases finalised - time taken to finalise complaint cases (including sub judice)
P9
INTERIM Police Complaints Information Bulletin
British Transport
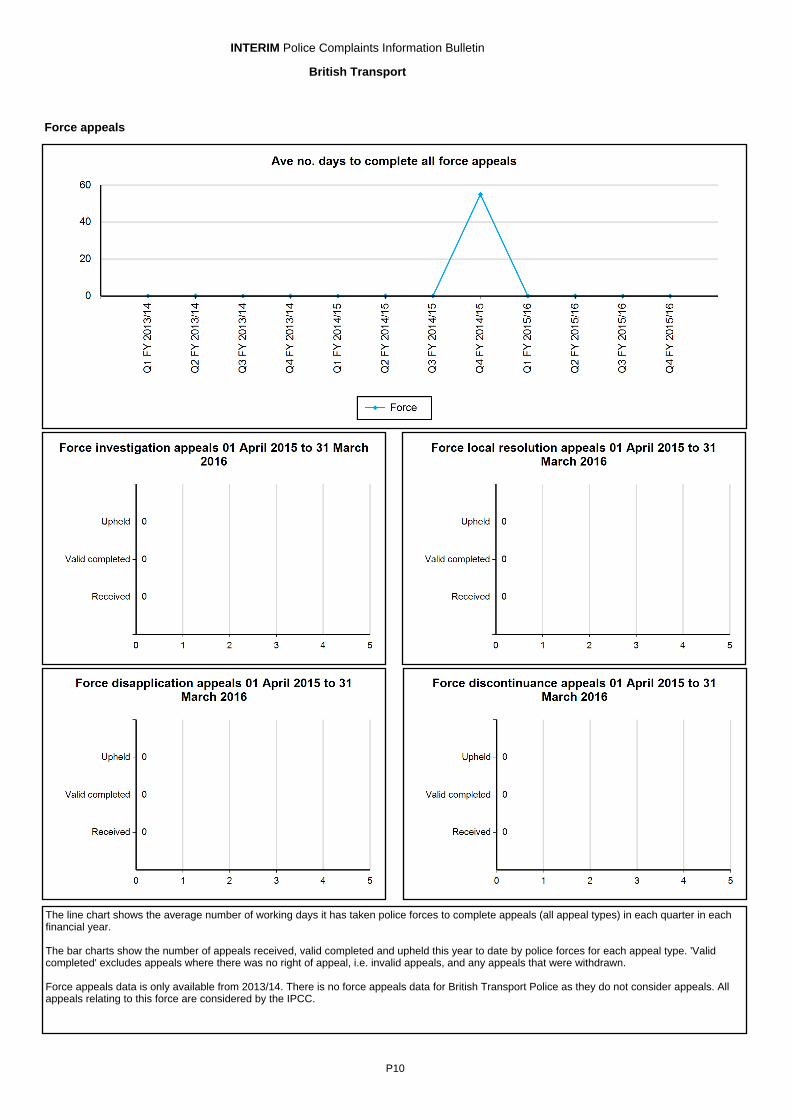
The line chart shows the average number of working days it has taken police forces to complete appeals (all appeal types) in each quarter in each financial year.
The bar charts show the number of appeals received, valid completed and upheld this year to date by police forces for each appeal type. 'Valid completed' excludes appeals where there was no right of appeal, i.e. invalid appeals, and any appeals that were withdrawn.
Force appeals data is only available from 2013/14. There is no force appeals data for British Transport Police as they do not consider appeals. All appeals relating to this force are considered by the IPCC.
Force appeals
P10
INTERIM Police Complaints Information Bulletin
British Transport
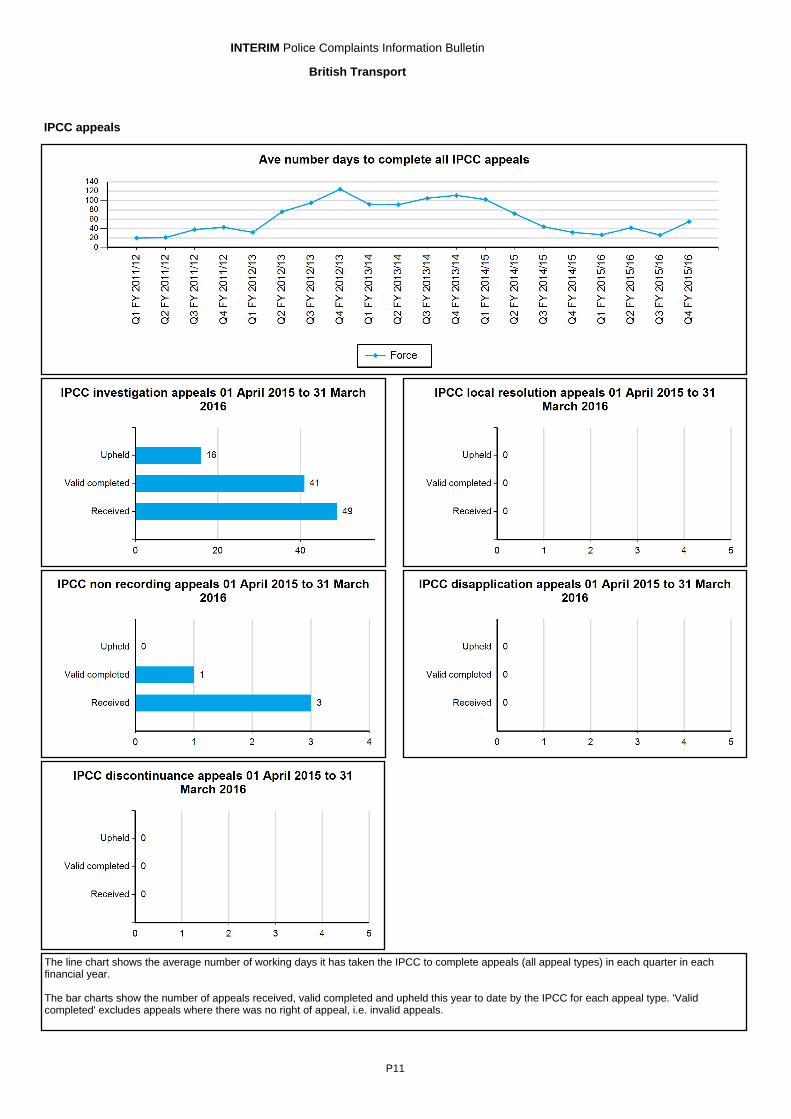
The line chart shows the average number of working days it has taken the IPCC to complete appeals (all appeal types) in each quarter in each financial year.
The bar charts show the number of appeals received, valid completed and upheld this year to date by the IPCC for each appeal type. 'Valid completed' excludes appeals where there was no right of appeal, i.e. invalid appeals.
IPCC appeals
P11
INTERIM Police Complaints Information Bulletin
British Transport
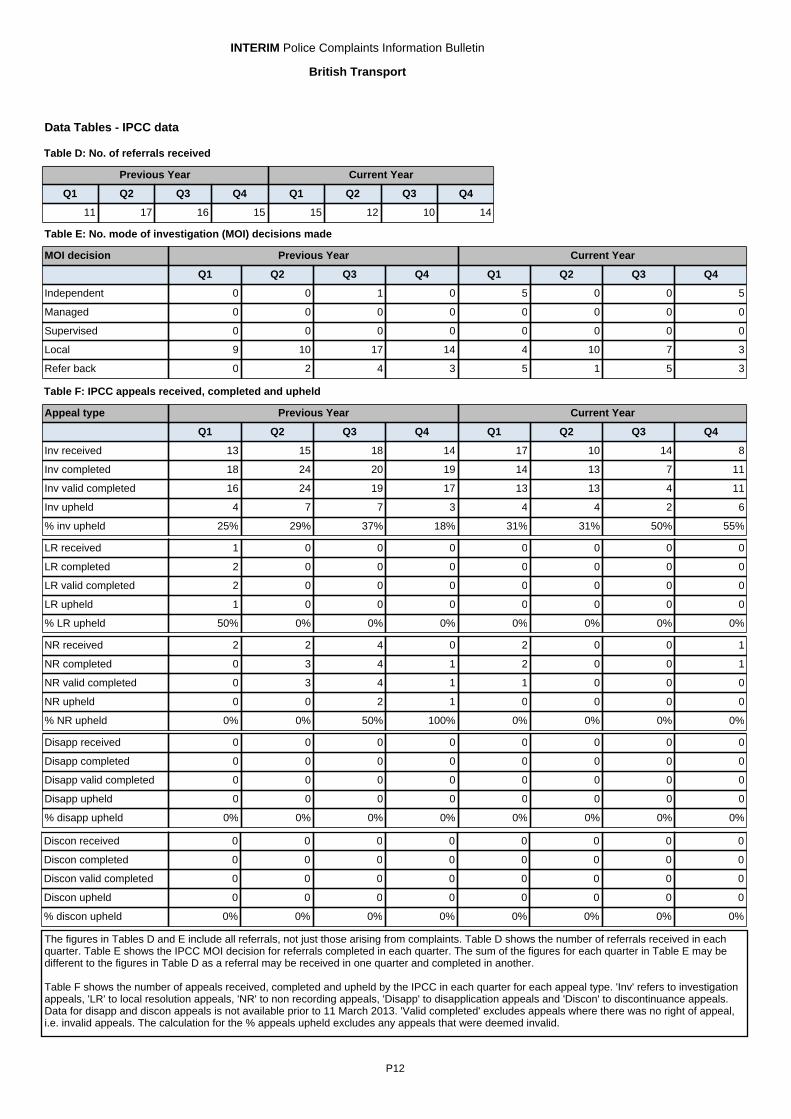
Data Tables - IPCC data
The figures in Tables D and E include all referrals, not just those arising from complaints. Table D shows the number of referrals received in each quarter. Table E shows the IPCC MOI decision for referrals completed in each quarter. The sum of the figures for each quarter in Table E may be different to the figures in Table D as a referral may be received in one quarter and completed in another.
Table F shows the number of appeals received, completed and upheld by the IPCC in each quarter for each appeal type. 'Inv' refers to investigation appeals, 'LR' to local resolution appeals, 'NR' to non recording appeals, 'Disapp' to disapplication appeals and 'Discon' to discontinuance appeals. Data for disapp and discon appeals is not available prior to 11 March 2013. 'Valid completed' excludes appeals where there was no right of appeal, i.e. invalid appeals. The calculation for the % appeals upheld excludes any appeals that were deemed invalid.
Previous Year Current Year
Q1 Q2 Q3 Q4 Q1 Q2 Q3 Q4
11 17 16 15 15 12 10 14
Table D: No. of referrals received
MOI decision Previous Year Current Year
Q1 Q2 Q3 Q4 Q1 Q2 Q3 Q4
Independent 0 0 1 0 5 0 0 5
Managed 0 0 0 0 0 0 0 0
Supervised 0 0 0 0 0 0 0 0
Local 9 10 17 14 4 10 7 3
Refer back 0 2 4 3 5 1 5 3
Table E: No. mode of investigation (MOI) decisions made
Table F: IPCC appeals received, completed and upheld
Appeal type Previous Year Current Year
Q1 Q2 Q3 Q4 Q1 Q2 Q3 Q4
Inv received 13 15 18 14 17 10 14 8
Inv completed 18 24 20 19 14 13 7 11
Inv valid completed 16 24 19 17 13 13 4 11
Inv upheld 4 7 7 3 4 4 2 6
% inv upheld 25% 29% 37% 18% 31% 31% 50% 55%
LR received 1 0 0 0 0 0 0 0
LR completed 2 0 0 0 0 0 0 0
LR valid completed 2 0 0 0 0 0 0 0
LR upheld 1 0 0 0 0 0 0 0
% LR upheld 50% 0% 0% 0% 0% 0% 0% 0%
NR received 2 2 4 0 2 0 0 1
NR completed 0 3 4 1 2 0 0 1
NR valid completed 0 3 4 1 1 0 0 0
NR upheld 0 0 2 1 0 0 0 0
% NR upheld 0% 0% 50% 100% 0% 0% 0% 0%
Disapp received 0 0 0 0 0 0 0 0
Disapp completed 0 0 0 0 0 0 0 0
Disapp valid completed 0 0 0 0 0 0 0 0
Disapp upheld 0 0 0 0 0 0 0 0
% disapp upheld 0% 0% 0% 0% 0% 0% 0% 0%
Discon received 0 0 0 0 0 0 0 0
Discon completed 0 0 0 0 0 0 0 0
Discon valid completed 0 0 0 0 0 0 0 0
Discon upheld 0 0 0 0 0 0 0 0
% discon upheld 0% 0% 0% 0% 0% 0% 0% 0%
P12
INTERIM Police Complaints Information Bulletin
British Transport
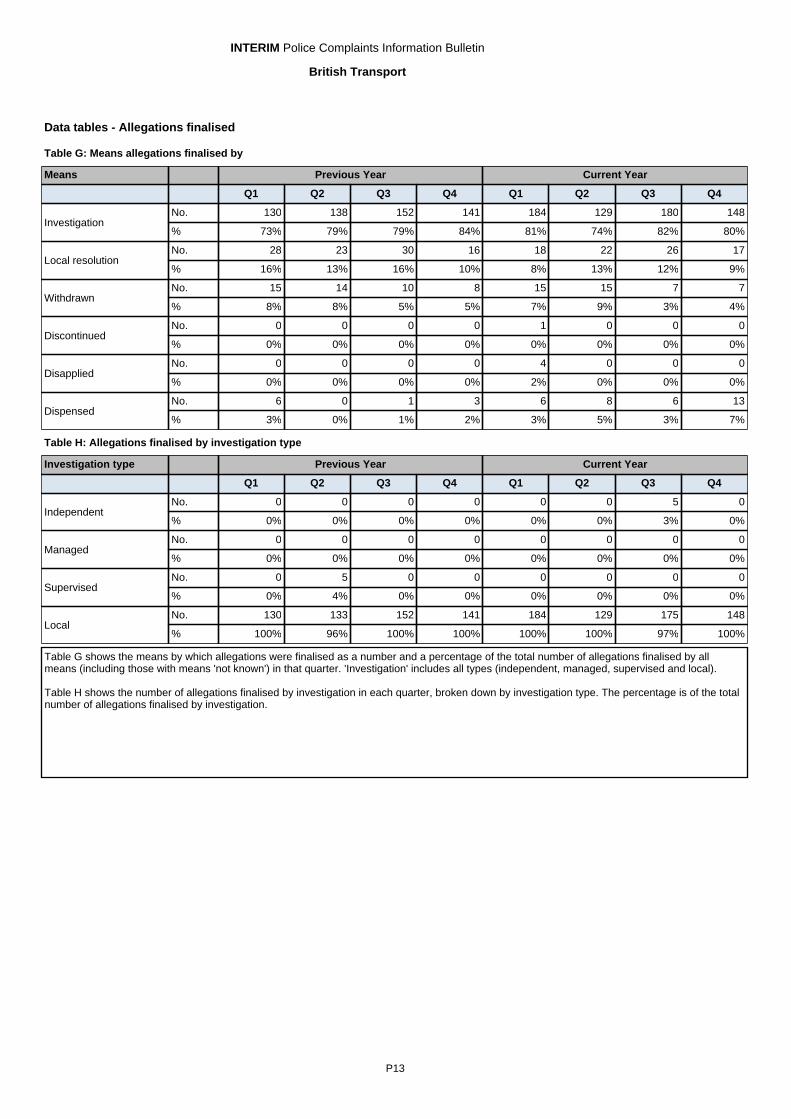
Data tables - Allegations finalised
Means Previous Year Current Year
Q1 Q2 Q3 Q4 Q1 Q2 Q3 Q4
InvestigationNo. 130 138 152 141 184 129 180 148
% 73% 79% 79% 84% 81% 74% 82% 80%
Local resolutionNo. 28 23 30 16 18 22 26 17
% 16% 13% 16% 10% 8% 13% 12% 9%
WithdrawnNo. 15 14 10 8 15 15 7 7
% 8% 8% 5% 5% 7% 9% 3% 4%
DiscontinuedNo. 0 0 0 0 1 0 0 0
% 0% 0% 0% 0% 0% 0% 0% 0%
DisappliedNo. 0 0 0 0 4 0 0 0
% 0% 0% 0% 0% 2% 0% 0% 0%
DispensedNo. 6 0 1 3 6 8 6 13
% 3% 0% 1% 2% 3% 5% 3% 7%
Table G: Means allegations finalised by
Investigation type Previous Year Current Year
Q1 Q2 Q3 Q4 Q1 Q2 Q3 Q4
IndependentNo. 0 0 0 0 0 0 5 0
% 0% 0% 0% 0% 0% 0% 3% 0%
ManagedNo. 0 0 0 0 0 0 0 0
% 0% 0% 0% 0% 0% 0% 0% 0%
SupervisedNo. 0 5 0 0 0 0 0 0
% 0% 4% 0% 0% 0% 0% 0% 0%
LocalNo. 130 133 152 141 184 129 175 148
% 100% 96% 100% 100% 100% 100% 97% 100%
Table H: Allegations finalised by investigation type
Table G shows the means by which allegations were finalised as a number and a percentage of the total number of allegations finalised by all means (including those with means 'not known') in that quarter. 'Investigation' includes all types (independent, managed, supervised and local).
Table H shows the number of allegations finalised by investigation in each quarter, broken down by investigation type. The percentage is of the total number of allegations finalised by investigation.
P13
INTERIM Police Complaints Information Bulletin
British Transport
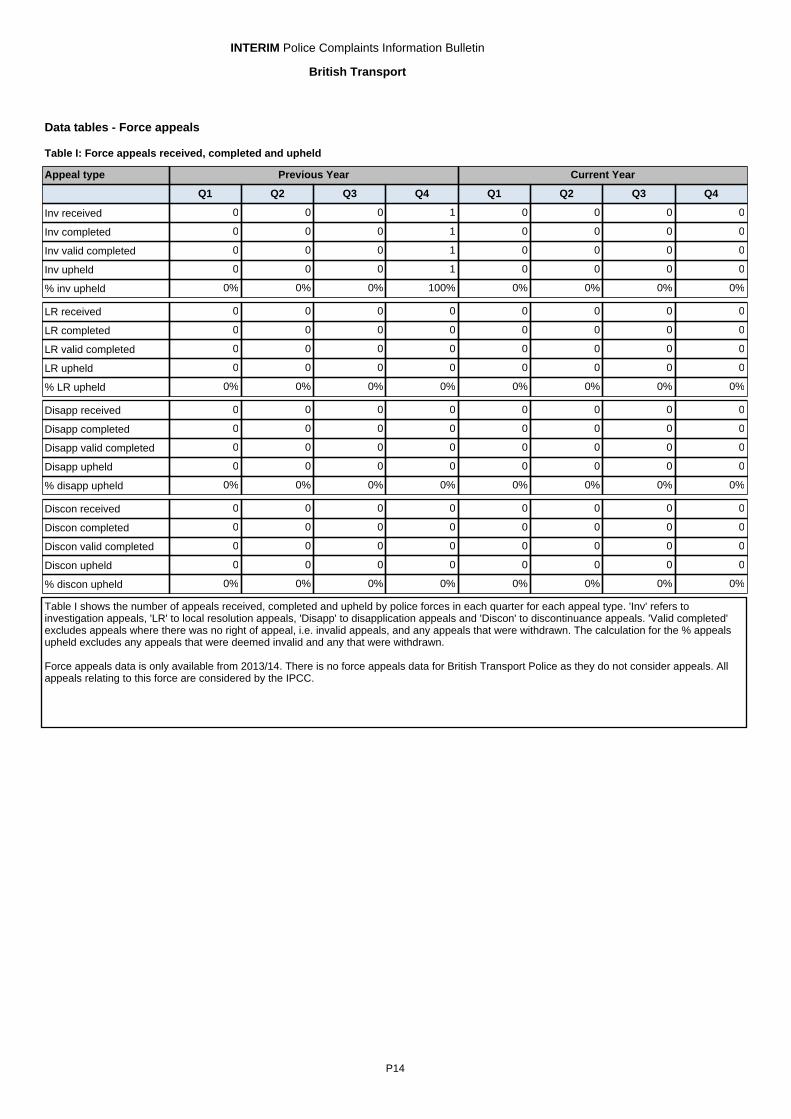
Table I shows the number of appeals received, completed and upheld by police forces in each quarter for each appeal type. 'Inv' refers to investigation appeals, 'LR' to local resolution appeals, 'Disapp' to disapplication appeals and 'Discon' to discontinuance appeals. 'Valid completed' excludes appeals where there was no right of appeal, i.e. invalid appeals, and any appeals that were withdrawn. The calculation for the % appeals upheld excludes any appeals that were deemed invalid and any that were withdrawn.
Force appeals data is only available from 2013/14. There is no force appeals data for British Transport Police as they do not consider appeals. All appeals relating to this force are considered by the IPCC.
Data tables - Force appeals
Appeal type Previous Year Current Year
Q1 Q2 Q3 Q4 Q1 Q2 Q3 Q4
Inv received 0 0 0 1 0 0 0 0
Inv completed 0 0 0 1 0 0 0 0
Inv valid completed 0 0 0 1 0 0 0 0
Inv upheld 0 0 0 1 0 0 0 0
% inv upheld 0% 0% 0% 100% 0% 0% 0% 0%
Table I: Force appeals received, completed and upheld
LR received 0 0 0 0 0 0 0 0
LR completed 0 0 0 0 0 0 0 0
LR valid completed 0 0 0 0 0 0 0 0
LR upheld 0 0 0 0 0 0 0 0
% LR upheld 0% 0% 0% 0% 0% 0% 0% 0%
Disapp received 0 0 0 0 0 0 0 0
Disapp completed 0 0 0 0 0 0 0 0
Disapp valid completed 0 0 0 0 0 0 0 0
Disapp upheld 0 0 0 0 0 0 0 0
% disapp upheld 0% 0% 0% 0% 0% 0% 0% 0%
Discon received 0 0 0 0 0 0 0 0
Discon completed 0 0 0 0 0 0 0 0
Discon valid completed 0 0 0 0 0 0 0 0
Discon upheld 0 0 0 0 0 0 0 0
% discon upheld 0% 0% 0% 0% 0% 0% 0% 0%
P14
INTERIM Police Complaints Information Bulletin
British Transport