Embed Size (px)
Citation preview
INTERIM FINANCIAL STATEMENTS
For the nine months ended September 30, 2020
Financial review for the nine months ended September 30, 2020
ComBank posts steady results amidst the impacts of the pandemic
Group’s Operating income up 11.84% to Rs 55.818 billion
Gains from Treasury Investments, foreign exchange activities help cushion impact of COVID-
19 on profits
Impairment provisions up 95.83% to Rs 16.733 billion
Operating cost escalation curtailed to 2.52%
Gains from government securities, foreign exchange (FX) swap trading and FX trading activities have
enabled the Commercial Bank of Ceylon Group to mitigate to some extent the severity of the impacts
of the COVID-19 pandemic on profits in a period of reduced interest income and substantially higher
impairment provisioning compared to the corresponding quarter of the last year.
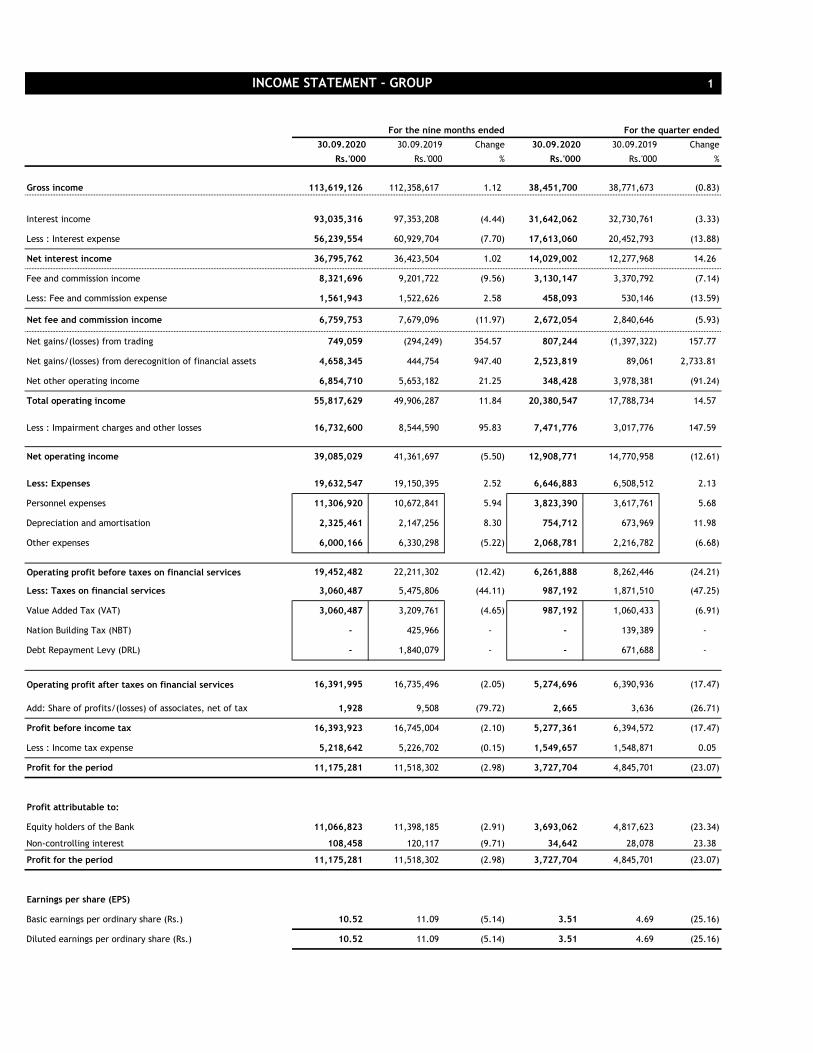
The Group, comprising of Sri Lanka’s benchmark private bank, its subsidiaries and an associate, has
reported total operating income of Rs 55.818 billion for the nine months ending 30th September 2020,
achieving a growth of 11.84% mainly by more than doubling other income for the period from Rs 5.804
billion to Rs 12.262 billion, even though net interest income, the largest component, only improved
by a marginal 1.02% to Rs 36.796 billion.
Financial statements filed with the Colombo Stock Exchange (CSE) show that the capital gains on
Treasury investments generated a net gain of Rs 4.658 billion on de-recognition of financial assets,
more than a 10-fold increase over the Rs 444.754 million for the corresponding nine months of last
year; that mark to market gains on Treasury Bills and Bonds enabled a conversion of a net loss of Rs
294.249 million on trading to a net gain of Rs 749.059 million for the nine months, and that exchange
profit grew by 25.2% to Rs 6.586 billion from FX swap trading and other foreign exchange trading
activities as well as translation gains on the Bank’s US Dollar reserves due to an approximately 2%
depreciation of the Rupee against the Dollar in the period under review.
With interest rates coming down, the Group was able to reduce interest expenses by 7.70% to Rs
56.240 billion in a period when interest income declined by 4.44% to Rs 93.035 billion, mainly due to
modification losses on interest concessions granted as pandemic relief to borrowers, the Bank
reported. Consequently, the achievement of a 1.02% improvement in net interest income at the end
of nine months is noteworthy, considering that net interest income had declined by 5.71% at the end
of the first half of the year. The turnaround was made possible by a 14.26% increase in net interest
income in the third quarter alone.
Meanwhile, net fees and commissions had reduced by 11.97% for the nine months to Rs 6.760 billion
as a result of the disruption caused by the COVID-19 pandemic, especially on trade related activities
and the reduction of fees and charges by the Bank as required by the Central Bank of Sri Lanka (CBSL).
The Central Bank of Sri Lanka had announced another pandemic-linked moratorium for borrowers
after the Bank’s nine-month accounts were finalised. As the impact of these additional concessions is
yet to be known it would be brought to the financial statements of the final quarter, the Bank said.
The impact of higher impairment charges and pandemic-linked concessions already granted to
borrowers resulted in the Group’s operating profit before taxes on financial services for the nine
months reducing by 12.42% to Rs 19.452 billion. Meanwhile, taxes on financial services declined by
44.11% to Rs 3.060 billion due to the abolition of the Debt Repayment Levy (DRL) and Nation Building
Tax (NBT) from January 2020 and December 2019 respectively.
Consequently, profit before income tax recorded a decline of 2.10% over the corresponding period to
total Rs 16.394 billion. The Group’s income tax charge for the period, at Rs 5.219 billion, was marginally
down by 0.15% while net profit at Rs 11.175 billion for the nine months reviewed, reflected a reduction
of 2.98%.
Taken separately, the Commercial Bank of Ceylon PLC reported a profit before tax of Rs 15.566 billion
for the nine months, a decline of 4.43% and profit after tax of Rs 10.595 billion, a reduction of 5.60%.
Total assets of the Group grew by Rs 254.143 billion or 18.04% since 31st December 2019 to Rs 1.663
trillion as at 30th September 2020. Asset growth over the preceding 12 months was Rs 292.730 billion
or 21.36% YoY.
Gross loans and advances of the Group grew by Rs 18.935 billion or 2.03% since end 2019 to Rs
949.672 billion at the end of the nine months reviewed. This includes loans of approximately Rs 20
billion granted to COVID-19 affected businesses. The growth of the loan book of the Group over the
preceding year was Rs 49.554 billion, reflecting YoY growth of 5.51%.
Total deposits of the Group recorded a noteworthy growth of Rs 152.774 billion or 14.29% over the
nine months at a monthly average of Rs 16.975 billion to stand at Rs 1.222 trillion as at 30th September
2020. Deposit growth of the Group since 30th September 2019 was Rs 174.619 billion or 16.68% at a
monthly average of Rs 14.551 billion.
In other key indicators, the Bank’s Tier 1 capital adequacy ratio (CAR) stood at 12.161% as at 30th
September 2020, prior to the infusion of US$ 50 million via an equity investment by the International
Finance Corporation (IFC) Group in October. The Bank’s Tier I CAR even before the IFC investment was
well above the revised minimum requirement of 9% imposed by the regulator consequent to the
COVID-19 pandemic, while its Total Capital Ratio of 15.951% was also comfortably above the revised
requirement of 13%.
The Bank’s gross NPL ratio increased to 5.20% from 4.95% at end 2019 while its net NPL ratio increased
marginally to 3.04% from 3.00%. The Bank’s interest margin recorded a nominal increase from 3.04%
for the six months to 3.17% for the nine months but was lower than the 3.51% at end December 2019.
Return on assets (before tax) and return on equity stood at 1.37% and 10.28% respectively for the
period ended 30th September 2020 compared to 1.66% and 13.54% for the year 2019.
At the forefront as a contributor to the national economy for many decades, the Commercial Bank has
been a driving force in economic recovery in the post-pandemic period, leading the private banks in
granting working capital loans and providing concessions to affected businesses. The Bank has
grouped 11 different programmes being implemented for affected businesses and individuals under
the umbrella of the ‘Arunella’ Financial Support Scheme and extended these relief programmes
beyond the mandated debt moratorium. These concessions included flexible payment options, up to
20% rebates on accrued interest during the moratorium periods, extension of moratorium periods for
up to another six months, further reductions on Credit Card repayments and applicable interest rates,
and Debt Consolidation Plans.
The first Sri Lankan Bank to be listed among the Top 1000 Banks of the World and the only Sri Lankan
bank to be so listed for ten years consecutively, Commercial Bank is celebrating its 100th anniversary
this year. The Bank, which won more than 50 international and local awards in 2019, operates a
network of 268 branches and 875 ATMs in Sri Lanka.
Commercial Bank’s overseas operations encompass Bangladesh, where the Bank operates 19 outlets;
Myanmar, where it has a Microfinance company in Nay Pyi Taw; and the Maldives, where the Bank
has a fully-fledged Tier I Bank with a majority stake.
1
For the nine months ended For the quarter ended
30.09.2020 30.09.2019 Change 30.09.2020 30.09.2019 Change
Rs.'000 Rs.'000 % Rs.'000 Rs.'000 %
Gross income 113,619,126 112,358,617 1.12 38,451,700 38,771,673 (0.83)
Interest income 93,035,316 97,353,208 (4.44) 31,642,062 32,730,761 (3.33)
Less : Interest expense 56,239,554 60,929,704 (7.70) 17,613,060 20,452,793 (13.88)
Net interest income 36,795,762 36,423,504 1.02 14,029,002 12,277,968 14.26
Fee and commission income 8,321,696 9,201,722 (9.56) 3,130,147 3,370,792 (7.14)
Less: Fee and commission expense 1,561,943 1,522,626 2.58 458,093 530,146 (13.59)
Net fee and commission income 6,759,753 7,679,096 (11.97) 2,672,054 2,840,646 (5.93)
Net gains/(losses) from trading 749,059 (294,249) 354.57 807,244 (1,397,322) 157.77
Net gains/(losses) from derecognition of financial assets 4,658,345 444,754 947.40 2,523,819 89,061 2,733.81
Net other operating income 6,854,710 5,653,182 21.25 348,428 3,978,381 (91.24)
Total operating income 55,817,629 49,906,287 11.84 20,380,547 17,788,734 14.57
Less : Impairment charges and other losses 16,732,600 8,544,590 95.83 7,471,776 3,017,776 147.59
Net operating income 39,085,029 41,361,697 (5.50) 12,908,771 14,770,958 (12.61)
Less: Expenses 19,632,547 19,150,395 2.52 6,646,883 6,508,512 2.13
Personnel expenses 11,306,920 10,672,841 5.94 3,823,390 3,617,761 5.68
Depreciation and amortisation 2,325,461 2,147,256 8.30 754,712 673,969 11.98
Other expenses 6,000,166 6,330,298 (5.22) 2,068,781 2,216,782 (6.68)
Operating profit before taxes on financial services 19,452,482 22,211,302 (12.42) 6,261,888 8,262,446 (24.21)
Less: Taxes on financial services 3,060,487 5,475,806 (44.11) 987,192 1,871,510 (47.25)
Value Added Tax (VAT) 3,060,487 3,209,761 (4.65) 987,192 1,060,433 (6.91)
Nation Building Tax (NBT) - 425,966 - - 139,389 -
Debt Repayment Levy (DRL) - 1,840,079 - - 671,688 -
Operating profit after taxes on financial services 16,391,995 16,735,496 (2.05) 5,274,696 6,390,936 (17.47)
Add: Share of profits/(losses) of associates, net of tax 1,928 9,508 (79.72) 2,665 3,636 (26.71)
Profit before income tax 16,393,923 16,745,004 (2.10) 5,277,361 6,394,572 (17.47)
Less : Income tax expense 5,218,642 5,226,702 (0.15) 1,549,657 1,548,871 0.05
Profit for the period 11,175,281 11,518,302 (2.98) 3,727,704 4,845,701 (23.07)
Profit attributable to:
Equity holders of the Bank 11,066,823 11,398,185 (2.91) 3,693,062 4,817,623 (23.34)
Non-controlling interest 108,458 120,117 (9.71) 34,642 28,078 23.38
Profit for the period 11,175,281 11,518,302 (2.98) 3,727,704 4,845,701 (23.07)
Earnings per share (EPS)
Basic earnings per ordinary share (Rs.) 10.52 11.09 (5.14) 3.51 4.69 (25.16)
Diluted earnings per ordinary share (Rs.) 10.52 11.09 (5.14) 3.51 4.69 (25.16)
INCOME STATEMENT - GROUP
2
For the nine months ended For the quarter ended
30.09.2020 30.09.2019 Change 30.09.2020 30.09.2019 Change
Rs.'000 Rs.'000 % Rs.'000 Rs.'000 %
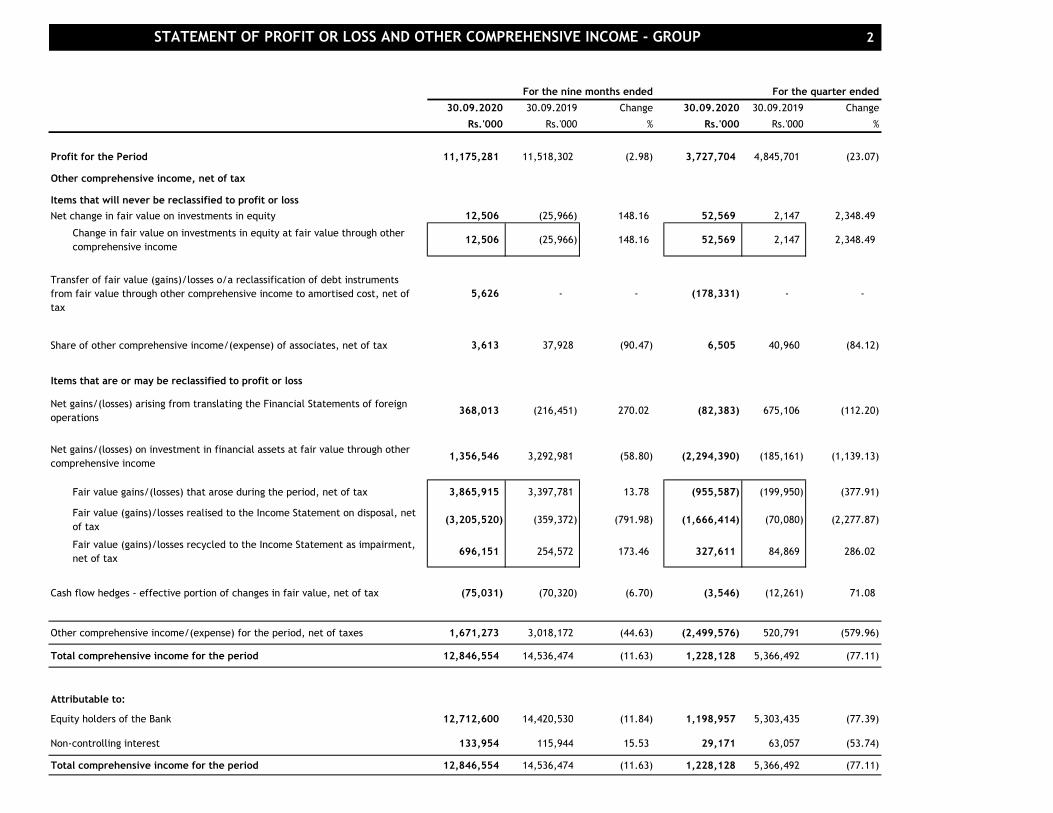
Profit for the Period 11,175,281 11,518,302 (2.98) 3,727,704 4,845,701 (23.07)
Other comprehensive income, net of tax
Items that will never be reclassified to profit or loss
Net change in fair value on investments in equity 12,506 (25,966) 148.16 52,569 2,147 2,348.49
Change in fair value on investments in equity at fair value through other
comprehensive income 12,506 (25,966) 148.16 52,569 2,147 2,348.49
Transfer of fair value (gains)/losses o/a reclassification of debt instruments
from fair value through other comprehensive income to amortised cost, net of
tax
5,626 - - (178,331) - -
Share of other comprehensive income/(expense) of associates, net of tax 3,613 37,928 (90.47) 6,505 40,960 (84.12)
Items that are or may be reclassified to profit or loss
Net gains/(losses) arising from translating the Financial Statements of foreign
operations 368,013 (216,451) 270.02 (82,383) 675,106 (112.20)
Net gains/(losses) on investment in financial assets at fair value through other
comprehensive income1,356,546 3,292,981 (58.80) (2,294,390) (185,161) (1,139.13)
Fair value gains/(losses) that arose during the period, net of tax 3,865,915 3,397,781 13.78 (955,587) (199,950) (377.91)
Fair value (gains)/losses realised to the Income Statement on disposal, net
of tax(3,205,520) (359,372) (791.98) (1,666,414) (70,080) (2,277.87)
Fair value (gains)/losses recycled to the Income Statement as impairment,
net of tax 696,151 254,572 173.46 327,611 84,869 286.02
Cash flow hedges - effective portion of changes in fair value, net of tax (75,031) (70,320) (6.70) (3,546) (12,261) 71.08
Other comprehensive income/(expense) for the period, net of taxes 1,671,273 3,018,172 (44.63) (2,499,576) 520,791 (579.96)
Total comprehensive income for the period 12,846,554 14,536,474 (11.63) 1,228,128 5,366,492 (77.11)
Attributable to:
Equity holders of the Bank 12,712,600 14,420,530 (11.84) 1,198,957 5,303,435 (77.39)
Non-controlling interest 133,954 115,944 15.53 29,171 63,057 (53.74)
Total comprehensive income for the period 12,846,554 14,536,474 (11.63) 1,228,128 5,366,492 (77.11)
STATEMENT OF PROFIT OR LOSS AND OTHER COMPREHENSIVE INCOME - GROUP
3
For the nine months ended For the quarter ended
30.09.2020 30.09.2019 Change 30.09.2020 30.09.2019 Change
Rs.'000 Rs.'000 % Rs.'000 Rs.'000 %
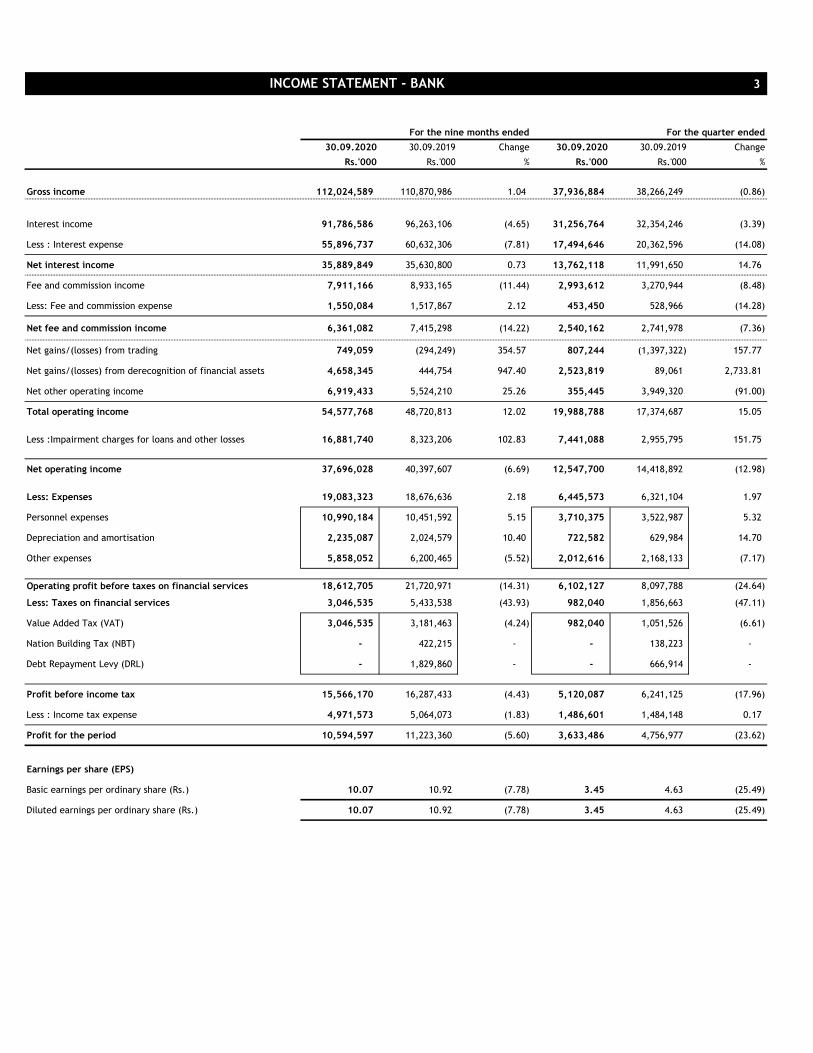
Gross income 112,024,589 110,870,986 1.04 37,936,884 38,266,249 (0.86)
Interest income 91,786,586 96,263,106 (4.65) 31,256,764 32,354,246 (3.39)
Less : Interest expense 55,896,737 60,632,306 (7.81) 17,494,646 20,362,596 (14.08)
Net interest income 35,889,849 35,630,800 0.73 13,762,118 11,991,650 14.76
Fee and commission income 7,911,166 8,933,165 (11.44) 2,993,612 3,270,944 (8.48)
Less: Fee and commission expense 1,550,084 1,517,867 2.12 453,450 528,966 (14.28)
Net fee and commission income 6,361,082 7,415,298 (14.22) 2,540,162 2,741,978 (7.36)
Net gains/(losses) from trading 749,059 (294,249) 354.57 807,244 (1,397,322) 157.77
Net gains/(losses) from derecognition of financial assets 4,658,345 444,754 947.40 2,523,819 89,061 2,733.81
Net other operating income 6,919,433 5,524,210 25.26 355,445 3,949,320 (91.00)
Total operating income 54,577,768 48,720,813 12.02 19,988,788 17,374,687 15.05
Less :Impairment charges for loans and other losses 16,881,740 8,323,206 102.83 7,441,088 2,955,795 151.75
Net operating income 37,696,028 40,397,607 (6.69) 12,547,700 14,418,892 (12.98)
Less: Expenses 19,083,323 18,676,636 2.18 6,445,573 6,321,104 1.97
Personnel expenses 10,990,184 10,451,592 5.15 3,710,375 3,522,987 5.32
Depreciation and amortisation 2,235,087 2,024,579 10.40 722,582 629,984 14.70
Other expenses 5,858,052 6,200,465 (5.52) 2,012,616 2,168,133 (7.17)
Operating profit before taxes on financial services 18,612,705 21,720,971 (14.31) 6,102,127 8,097,788 (24.64)
Less: Taxes on financial services 3,046,535 5,433,538 (43.93) 982,040 1,856,663 (47.11)
Value Added Tax (VAT) 3,046,535 3,181,463 (4.24) 982,040 1,051,526 (6.61)
Nation Building Tax (NBT) - 422,215 - - 138,223 -
Debt Repayment Levy (DRL) - 1,829,860 - - 666,914 -
Profit before income tax 15,566,170 16,287,433 (4.43) 5,120,087 6,241,125 (17.96)
Less : Income tax expense 4,971,573 5,064,073 (1.83) 1,486,601 1,484,148 0.17
Profit for the period 10,594,597 11,223,360 (5.60) 3,633,486 4,756,977 (23.62)
Earnings per share (EPS)
Basic earnings per ordinary share (Rs.) 10.07 10.92 (7.78) 3.45 4.63 (25.49)
Diluted earnings per ordinary share (Rs.) 10.07 10.92 (7.78) 3.45 4.63 (25.49)
INCOME STATEMENT - BANK
4
For the nine months ended For the quarter ended
30.09.2020 30.09.2019 Change 30.09.2020 30.09.2019 Change
Rs.'000 Rs.'000 % Rs.'000 Rs.'000 %
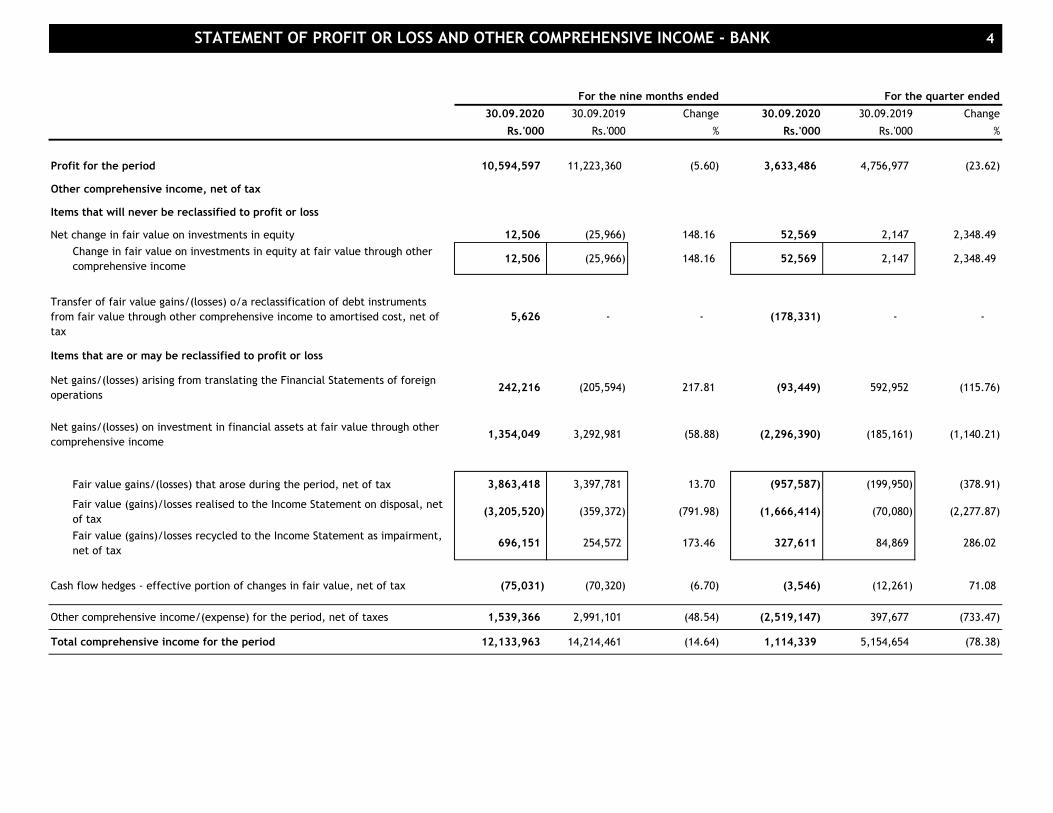
Profit for the period 10,594,597 11,223,360 (5.60) 3,633,486 4,756,977 (23.62)
Other comprehensive income, net of tax
Items that will never be reclassified to profit or loss
Net change in fair value on investments in equity 12,506 (25,966) 148.16 52,569 2,147 2,348.49
Change in fair value on investments in equity at fair value through other
comprehensive income 12,506 (25,966) 148.16 52,569 2,147 2,348.49
Transfer of fair value gains/(losses) o/a reclassification of debt instruments
from fair value through other comprehensive income to amortised cost, net of
tax
5,626 - - (178,331) - -
Items that are or may be reclassified to profit or loss
Net gains/(losses) arising from translating the Financial Statements of foreign
operations 242,216 (205,594) 217.81 (93,449) 592,952 (115.76)
Net gains/(losses) on investment in financial assets at fair value through other
comprehensive income1,354,049 3,292,981 (58.88) (2,296,390) (185,161) (1,140.21)
Fair value gains/(losses) that arose during the period, net of tax 3,863,418 3,397,781 13.70 (957,587) (199,950) (378.91)
Fair value (gains)/losses realised to the Income Statement on disposal, net
of tax(3,205,520) (359,372) (791.98) (1,666,414) (70,080) (2,277.87)
Fair value (gains)/losses recycled to the Income Statement as impairment,
net of tax 696,151 254,572 173.46 327,611 84,869 286.02
Cash flow hedges - effective portion of changes in fair value, net of tax (75,031) (70,320) (6.70) (3,546) (12,261) 71.08
Other comprehensive income/(expense) for the period, net of taxes 1,539,366 2,991,101 (48.54) (2,519,147) 397,677 (733.47)
Total comprehensive income for the period 12,133,963 14,214,461 (14.64) 1,114,339 5,154,654 (78.38)
STATEMENT OF PROFIT OR LOSS AND OTHER COMPREHENSIVE INCOME - BANK
5
Group Bank
As at 30.09.2020 31.12.2019 Change 30.09.2020 31.12.2019 Change
( Audited ) ( Audited )
Rs.'000 Rs.'000 % Rs.'000 Rs.'000 %
ASSETS
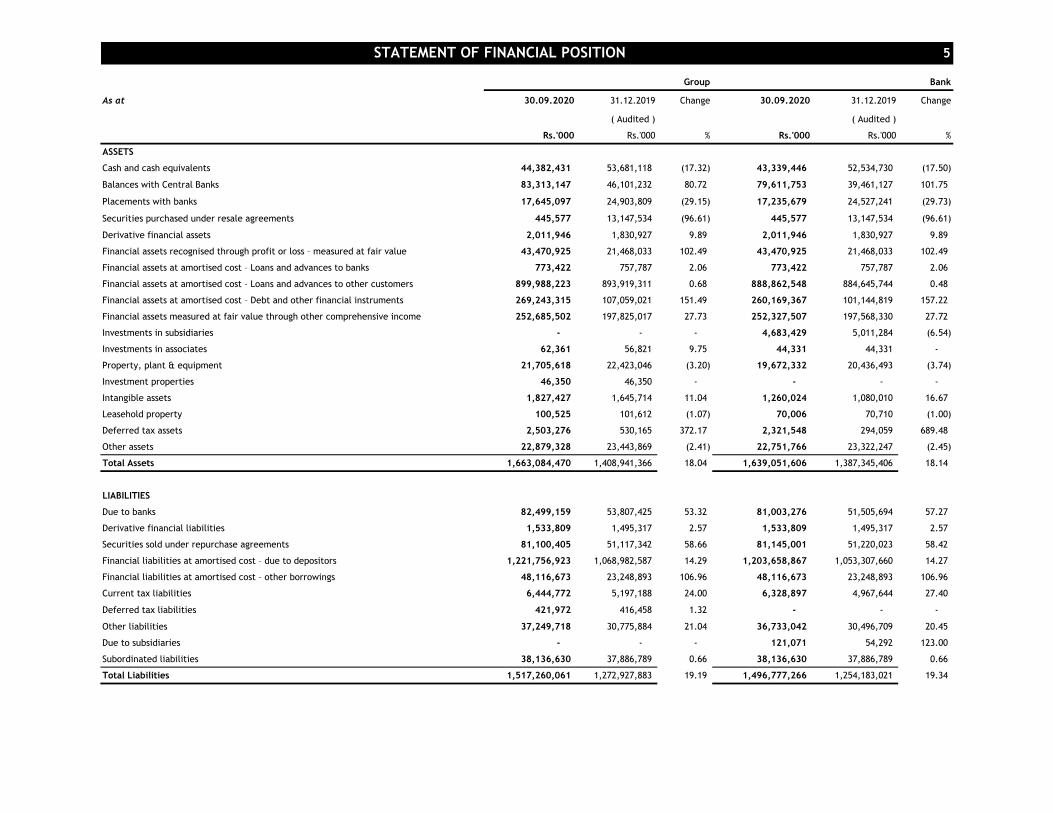
Cash and cash equivalents 44,382,431 53,681,118 (17.32) 43,339,446 52,534,730 (17.50)
Balances with Central Banks 83,313,147 46,101,232 80.72 79,611,753 39,461,127 101.75
Placements with banks 17,645,097 24,903,809 (29.15) 17,235,679 24,527,241 (29.73)
Securities purchased under resale agreements 445,577 13,147,534 (96.61) 445,577 13,147,534 (96.61)
Derivative financial assets 2,011,946 1,830,927 9.89 2,011,946 1,830,927 9.89
Financial assets recognised through profit or loss – measured at fair value 43,470,925 21,468,033 102.49 43,470,925 21,468,033 102.49
Financial assets at amortised cost – Loans and advances to banks 773,422 757,787 2.06 773,422 757,787 2.06
Financial assets at amortised cost – Loans and advances to other customers 899,988,223 893,919,311 0.68 888,862,548 884,645,744 0.48
Financial assets at amortised cost – Debt and other financial instruments 269,243,315 107,059,021 151.49 260,169,367 101,144,819 157.22
Financial assets measured at fair value through other comprehensive income 252,685,502 197,825,017 27.73 252,327,507 197,568,330 27.72
Investments in subsidiaries - - - 4,683,429 5,011,284 (6.54)
Investments in associates 62,361 56,821 9.75 44,331 44,331 -
Property, plant & equipment 21,705,618 22,423,046 (3.20) 19,672,332 20,436,493 (3.74)
Investment properties 46,350 46,350 - - - -
Intangible assets 1,827,427 1,645,714 11.04 1,260,024 1,080,010 16.67
Leasehold property 100,525 101,612 (1.07) 70,006 70,710 (1.00)
Deferred tax assets 2,503,276 530,165 372.17 2,321,548 294,059 689.48
Other assets 22,879,328 23,443,869 (2.41) 22,751,766 23,322,247 (2.45)
Total Assets 1,663,084,470 1,408,941,366 18.04 1,639,051,606 1,387,345,406 18.14
LIABILITIES
Due to banks 82,499,159 53,807,425 53.32 81,003,276 51,505,694 57.27
Derivative financial liabilities 1,533,809 1,495,317 2.57 1,533,809 1,495,317 2.57
Securities sold under repurchase agreements 81,100,405 51,117,342 58.66 81,145,001 51,220,023 58.42
Financial liabilities at amortised cost – due to depositors 1,221,756,923 1,068,982,587 14.29 1,203,658,867 1,053,307,660 14.27
Financial liabilities at amortised cost – other borrowings 48,116,673 23,248,893 106.96 48,116,673 23,248,893 106.96
Current tax liabilities 6,444,772 5,197,188 24.00 6,328,897 4,967,644 27.40
Deferred tax liabilities 421,972 416,458 1.32 - - -
Other liabilities 37,249,718 30,775,884 21.04 36,733,042 30,496,709 20.45
Due to subsidiaries - - - 121,071 54,292 123.00
Subordinated liabilities 38,136,630 37,886,789 0.66 38,136,630 37,886,789 0.66
Total Liabilities 1,517,260,061 1,272,927,883 19.19 1,496,777,266 1,254,183,021 19.34
STATEMENT OF FINANCIAL POSITION
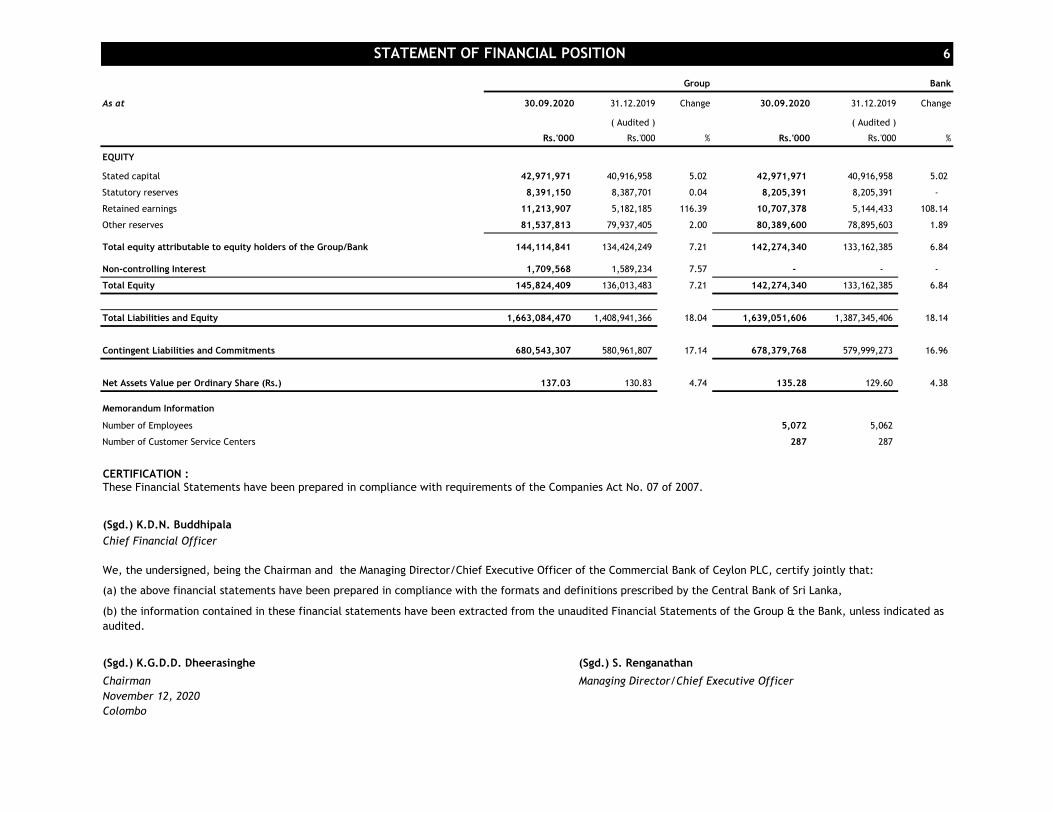
6
Group Bank
As at 30.09.2020 31.12.2019 Change 30.09.2020 31.12.2019 Change
( Audited ) ( Audited )
Rs.'000 Rs.'000 % Rs.'000 Rs.'000 %
EQUITY
Stated capital 42,971,971 40,916,958 5.02 42,971,971 40,916,958 5.02
Statutory reserves 8,391,150 8,387,701 0.04 8,205,391 8,205,391 -
Retained earnings 11,213,907 5,182,185 116.39 10,707,378 5,144,433 108.14
Other reserves 81,537,813 79,937,405 2.00 80,389,600 78,895,603 1.89
Total equity attributable to equity holders of the Group/Bank 144,114,841 134,424,249 7.21 142,274,340 133,162,385 6.84
Non-controlling Interest 1,709,568 1,589,234 7.57 - - -
Total Equity 145,824,409 136,013,483 7.21 142,274,340 133,162,385 6.84
Total Liabilities and Equity 1,663,084,470 1,408,941,366 18.04 1,639,051,606 1,387,345,406 18.14
Contingent Liabilities and Commitments 680,543,307 580,961,807 17.14 678,379,768 579,999,273 16.96
Net Assets Value per Ordinary Share (Rs.) 137.03 130.83 4.74 135.28 129.60 4.38
Memorandum Information
Number of Employees 5,072 5,062
Number of Customer Service Centers 287 287
CERTIFICATION :
(Sgd.) K.D.N. Buddhipala
Chief Financial Officer
(Sgd.) K.G.D.D. Dheerasinghe (Sgd.) S. Renganathan
Chairman Managing Director/Chief Executive Officer
November 12, 2020
Colombo
(b) the information contained in these financial statements have been extracted from the unaudited Financial Statements of the Group & the Bank, unless indicated as
audited.
STATEMENT OF FINANCIAL POSITION
These Financial Statements have been prepared in compliance with requirements of the Companies Act No. 07 of 2007.
We, the undersigned, being the Chairman and the Managing Director/Chief Executive Officer of the Commercial Bank of Ceylon PLC, certify jointly that:
(a) the above financial statements have been prepared in compliance with the formats and definitions prescribed by the Central Bank of Sri Lanka,
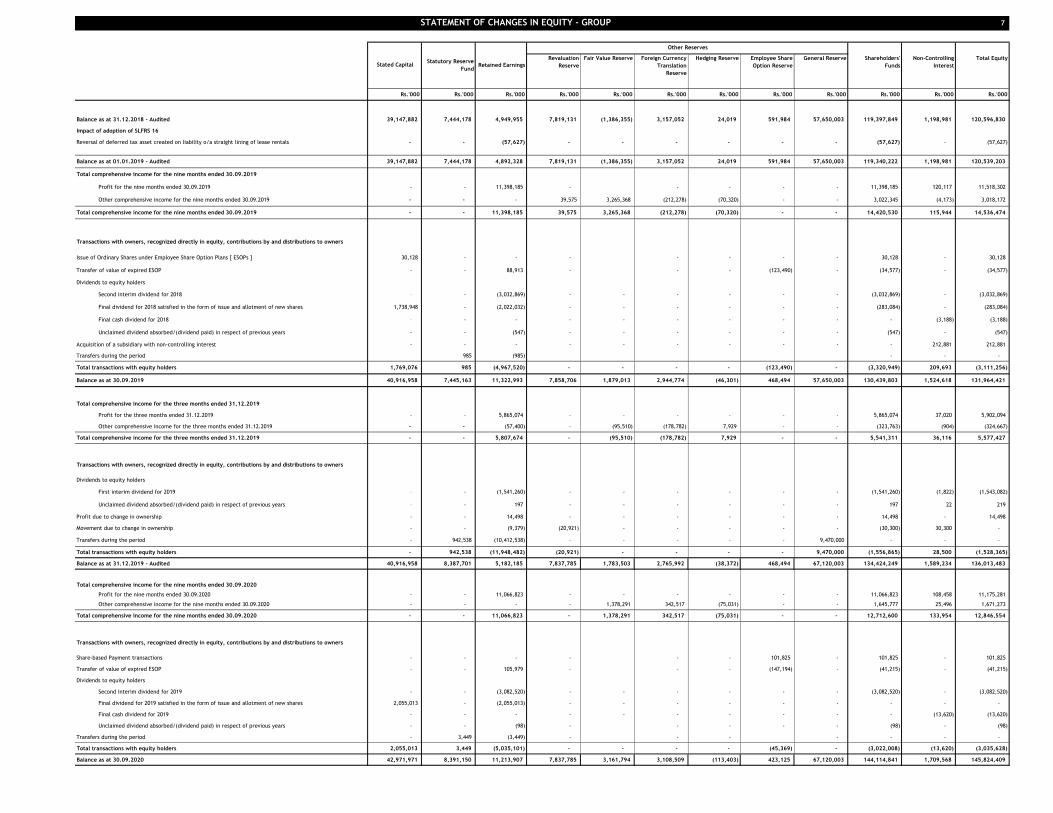
7
Revaluation
Reserve
Fair Value Reserve Foreign Currency
Translation
Reserve
Hedging Reserve Employee Share
Option Reserve
General Reserve Shareholders'
Funds
Non-Controlling
Interest
Total Equity
Rs.'000 Rs.'000 Rs.'000 Rs.'000 Rs.'000 Rs.'000 Rs.'000 Rs.'000 Rs.'000 Rs.'000 Rs.'000 Rs.'000
Balance as at 31.12.2018 - Audited 39,147,882 7,444,178 4,949,955 7,819,131 (1,386,355) 3,157,052 24,019 591,984 57,650,003 119,397,849 1,198,981 120,596,830
Impact of adoption of SLFRS 16
Reversal of deferred tax asset created on liability o/a straight lining of lease rentals - - (57,627) - - - - - - (57,627) - (57,627)
Balance as at 01.01.2019 - Audited 39,147,882 7,444,178 4,892,328 7,819,131 (1,386,355) 3,157,052 24,019 591,984 57,650,003 119,340,222 1,198,981 120,539,203
Total comprehensive income for the nine months ended 30.09.2019
Profit for the nine months ended 30.09.2019 - - 11,398,185 - - - - - 11,398,185 120,117 11,518,302
Other comprehensive income for the nine months ended 30.09.2019 - - - 39,575 3,265,368 (212,278) (70,320) - - 3,022,345 (4,173) 3,018,172
Total comprehensive income for the nine months ended 30.09.2019 - - 11,398,185 39,575 3,265,368 (212,278) (70,320) - - 14,420,530 115,944 14,536,474
Transactions with owners, recognized directly in equity, contributions by and distributions to owners
Issue of Ordinary Shares under Employee Share Option Plans [ ESOPs ] 30,128 - - - - - - - 30,128 - 30,128
Transfer of value of expired ESOP - - 88,913 - - - (123,490) - (34,577) - (34,577)
Dividends to equity holders
Second interim dividend for 2018 - - (3,032,869) - - - - - - (3,032,869) - (3,032,869)
Final dividend for 2018 satisfied in the form of issue and allotment of new shares 1,738,948 - (2,022,032) - - - - - - (283,084) - (283,084)
Final cash dividend for 2018 - - - - - - - - - - (3,188) (3,188)
Unclaimed dividend absorbed/(dividend paid) in respect of previous years - - (547) - - - - - - (547) - (547)
Acquisition of a subsidiary with non-controlling interest - - - - - - - - - - 212,881 212,881
Transfers during the period 985 (985) - - -
Total transactions with equity holders 1,769,076 985 (4,967,520) - - - - (123,490) - (3,320,949) 209,693 (3,111,256)
Balance as at 30.09.2019 40,916,958 7,445,163 11,322,993 7,858,706 1,879,013 2,944,774 (46,301) 468,494 57,650,003 130,439,803 1,524,618 131,964,421
Total comprehensive income for the three months ended 31.12.2019
Profit for the three months ended 31.12.2019 - - 5,865,074 - - - - - - 5,865,074 37,020 5,902,094
Other comprehensive income for the three months ended 31.12.2019 - - (57,400) - (95,510) (178,782) 7,929 - - (323,763) (904) (324,667)
Total comprehensive income for the three months ended 31.12.2019 - - 5,807,674 - (95,510) (178,782) 7,929 - - 5,541,311 36,116 5,577,427
Transactions with owners, recognized directly in equity, contributions by and distributions to owners
Dividends to equity holders
First interim dividend for 2019 - - (1,541,260) - - - - - - (1,541,260) (1,822) (1,543,082)
Unclaimed dividend absorbed/(dividend paid) in respect of previous years - - 197 - - - - - - 197 22 219
Profit due to change in ownership - - 14,498 - - - - - - 14,498 - 14,498
Movement due to change in ownership - - (9,379) (20,921) - - - - - (30,300) 30,300 -
Transfers during the period - 942,538 (10,412,538) - - - - - 9,470,000 - - -
Total transactions with equity holders - 942,538 (11,948,482) (20,921) - - - - 9,470,000 (1,556,865) 28,500 (1,528,365)
Balance as at 31.12.2019 - Audited 40,916,958 8,387,701 5,182,185 7,837,785 1,783,503 2,765,992 (38,372) 468,494 67,120,003 134,424,249 1,589,234 136,013,483
Total comprehensive income for the nine months ended 30.09.2020
Profit for the nine months ended 30.09.2020 - - 11,066,823 - - - - - - 11,066,823 108,458 11,175,281
Other comprehensive income for the nine months ended 30.09.2020 - - - - 1,378,291 342,517 (75,031) - - 1,645,777 25,496 1,671,273
Total comprehensive income for the nine months ended 30.09.2020 - - 11,066,823 - 1,378,291 342,517 (75,031) - - 12,712,600 133,954 12,846,554
Transactions with owners, recognized directly in equity, contributions by and distributions to owners
Share-based Payment transactions - - - - - - 101,825 - 101,825 - 101,825
Transfer of value of expired ESOP - - 105,979 - - - (147,194) - (41,215) - (41,215)
Dividends to equity holders
Second interim dividend for 2019 - - (3,082,520) - - - - - - (3,082,520) - (3,082,520)
Final dividend for 2019 satisfied in the form of issue and allotment of new shares 2,055,013 - (2,055,013) - - - - - - - - -
Final cash dividend for 2019 - - - - - - - - - - (13,620) (13,620)
Unclaimed dividend absorbed/(dividend paid) in respect of previous years - - (98) - - - - - (98) - (98)
Transfers during the period - 3,449 (3,449) - - - - - - -
Total transactions with equity holders 2,055,013 3,449 (5,035,101) - - - - (45,369) - (3,022,008) (13,620) (3,035,628)
Balance as at 30.09.2020 42,971,971 8,391,150 11,213,907 7,837,785 3,161,794 3,108,509 (113,403) 423,125 67,120,003 144,114,841 1,709,568 145,824,409
STATEMENT OF CHANGES IN EQUITY - GROUP
Stated CapitalStatutory Reserve
FundRetained Earnings
Other Reserves
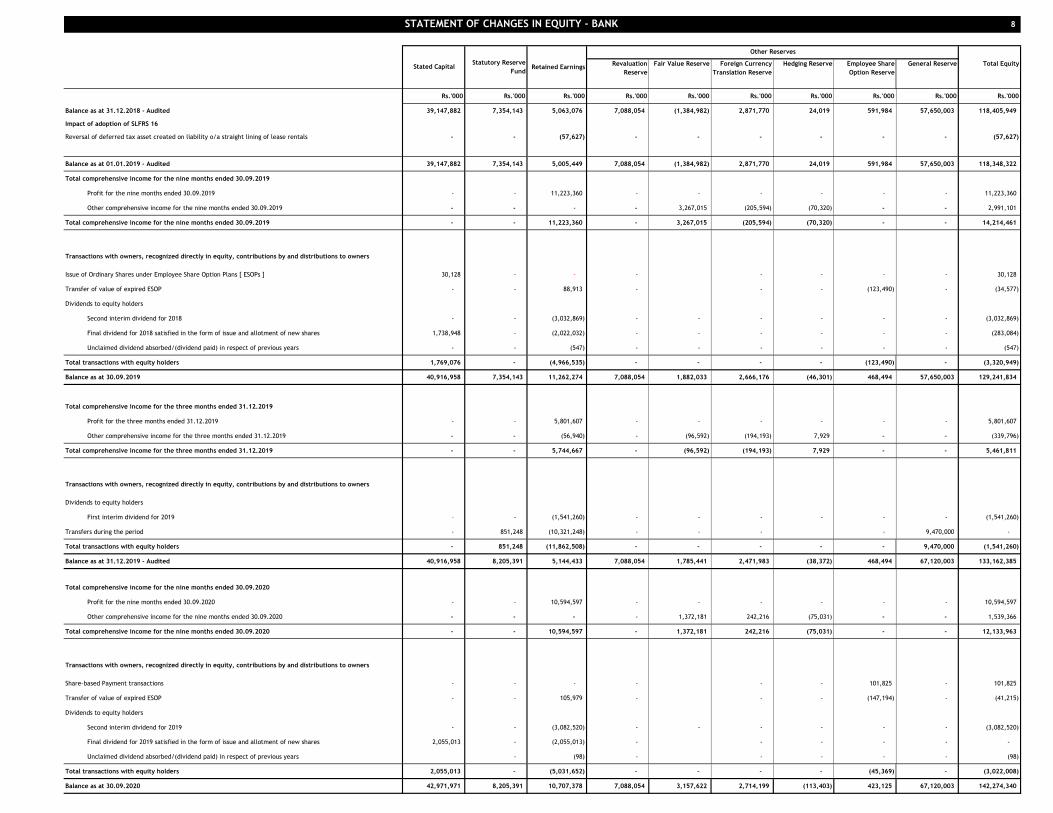
8
Revaluation
Reserve
Fair Value Reserve Foreign Currency
Translation Reserve
Hedging Reserve Employee Share
Option Reserve
General Reserve Total Equity
Rs.'000 Rs.'000 Rs.'000 Rs.'000 Rs.'000 Rs.'000 Rs.'000 Rs.'000 Rs.'000 Rs.'000
Balance as at 31.12.2018 - Audited 39,147,882 7,354,143 5,063,076 7,088,054 (1,384,982) 2,871,770 24,019 591,984 57,650,003 118,405,949
Impact of adoption of SLFRS 16
Reversal of deferred tax asset created on liability o/a straight lining of lease rentals - - (57,627) - - - - - - (57,627)
Balance as at 01.01.2019 - Audited 39,147,882 7,354,143 5,005,449 7,088,054 (1,384,982) 2,871,770 24,019 591,984 57,650,003 118,348,322
Total comprehensive income for the nine months ended 30.09.2019
Profit for the nine months ended 30.09.2019 - - 11,223,360 - - - - - - 11,223,360
Other comprehensive income for the nine months ended 30.09.2019 - - - - 3,267,015 (205,594) (70,320) - - 2,991,101
Total comprehensive income for the nine months ended 30.09.2019 - - 11,223,360 - 3,267,015 (205,594) (70,320) - - 14,214,461
Transactions with owners, recognized directly in equity, contributions by and distributions to owners
Issue of Ordinary Shares under Employee Share Option Plans [ ESOPs ] 30,128 - - - - - - - 30,128
Transfer of value of expired ESOP - - 88,913 - - - (123,490) - (34,577)
Dividends to equity holders
Second interim dividend for 2018 - - (3,032,869) - - - - - - (3,032,869)
Final dividend for 2018 satisfied in the form of issue and allotment of new shares 1,738,948 - (2,022,032) - - - - - - (283,084)
Unclaimed dividend absorbed/(dividend paid) in respect of previous years - - (547) - - - - - - (547)
Total transactions with equity holders 1,769,076 - (4,966,535) - - - - (123,490) - (3,320,949)
Balance as at 30.09.2019 40,916,958 7,354,143 11,262,274 7,088,054 1,882,033 2,666,176 (46,301) 468,494 57,650,003 129,241,834
Total comprehensive income for the three months ended 31.12.2019
Profit for the three months ended 31.12.2019 - - 5,801,607 - - - - - - 5,801,607
Other comprehensive income for the three months ended 31.12.2019 - - (56,940) - (96,592) (194,193) 7,929 - - (339,796)
Total comprehensive income for the three months ended 31.12.2019 - - 5,744,667 - (96,592) (194,193) 7,929 - - 5,461,811
Transactions with owners, recognized directly in equity, contributions by and distributions to owners
Dividends to equity holders
First interim dividend for 2019 - - (1,541,260) - - - - - - (1,541,260)
Transfers during the period - 851,248 (10,321,248) - - - - 9,470,000 -
Total transactions with equity holders - 851,248 (11,862,508) - - - - - 9,470,000 (1,541,260)
Balance as at 31.12.2019 - Audited 40,916,958 8,205,391 5,144,433 7,088,054 1,785,441 2,471,983 (38,372) 468,494 67,120,003 133,162,385
Total comprehensive income for the nine months ended 30.09.2020
Profit for the nine months ended 30.09.2020 - - 10,594,597 - - - - - - 10,594,597
Other comprehensive income for the nine months ended 30.09.2020 - - - - 1,372,181 242,216 (75,031) - - 1,539,366
Total comprehensive income for the nine months ended 30.09.2020 - - 10,594,597 - 1,372,181 242,216 (75,031) - - 12,133,963
Transactions with owners, recognized directly in equity, contributions by and distributions to owners
Share-based Payment transactions - - - - - - 101,825 - 101,825
Transfer of value of expired ESOP - - 105,979 - - - (147,194) - (41,215)
Dividends to equity holders
Second interim dividend for 2019 - - (3,082,520) - - - - - - (3,082,520)
Final dividend for 2019 satisfied in the form of issue and allotment of new shares 2,055,013 - (2,055,013) - - - - - -
Unclaimed dividend absorbed/(dividend paid) in respect of previous years - (98) - - - - - (98)
Total transactions with equity holders 2,055,013 - (5,031,652) - - - - (45,369) - (3,022,008)
Balance as at 30.09.2020 42,971,971 8,205,391 10,707,378 7,088,054 3,157,622 2,714,199 (113,403) 423,125 67,120,003 142,274,340
STATEMENT OF CHANGES IN EQUITY - BANK
Stated CapitalStatutory Reserve
FundRetained Earnings
Other Reserves
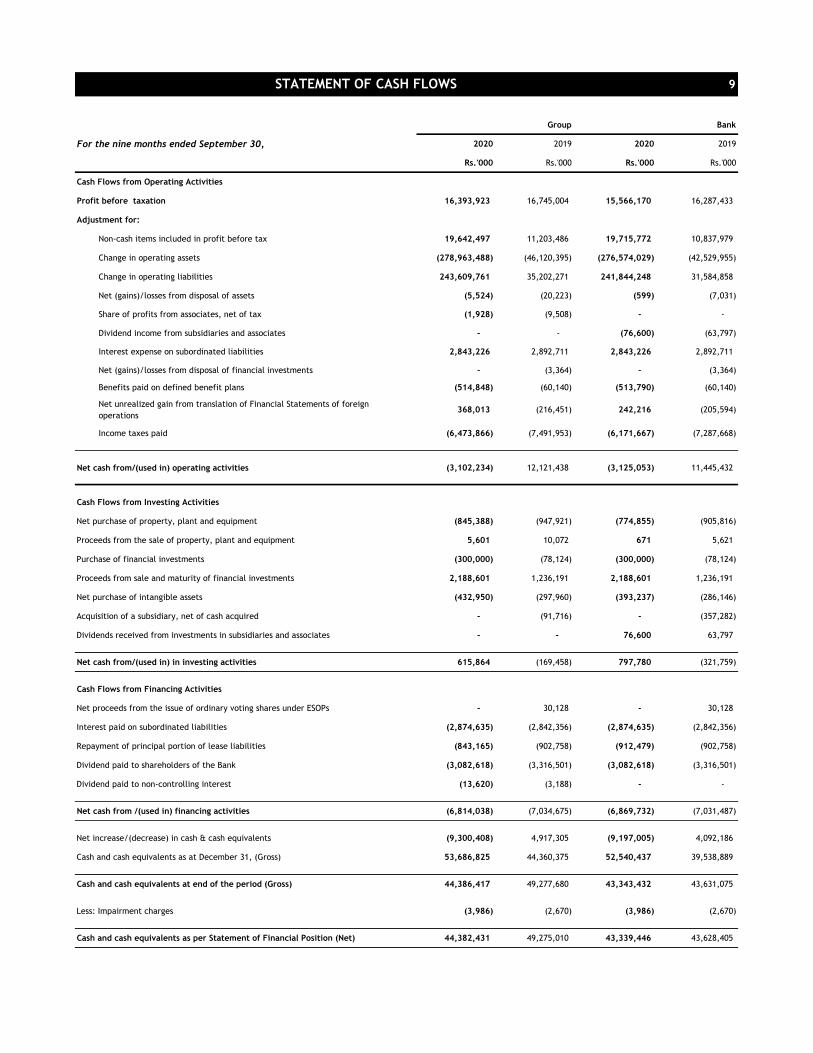
9
Group Bank
For the nine months ended September 30, 2020 2019 2020 2019
Rs.'000 Rs.'000 Rs.'000 Rs.'000
Cash Flows from Operating Activities
Profit before taxation 16,393,923 16,745,004 15,566,170 16,287,433
Adjustment for:
Non-cash items included in profit before tax 19,642,497 11,203,486 19,715,772 10,837,979
Change in operating assets (278,963,488) (46,120,395) (276,574,029) (42,529,955)
Change in operating liabilities 243,609,761 35,202,271 241,844,248 31,584,858
Net (gains)/losses from disposal of assets (5,524) (20,223) (599) (7,031)
Share of profits from associates, net of tax (1,928) (9,508) - -
Dividend income from subsidiaries and associates - - (76,600) (63,797)
Interest expense on subordinated liabilities 2,843,226 2,892,711 2,843,226 2,892,711
Net (gains)/losses from disposal of financial investments - (3,364) - (3,364)
Benefits paid on defined benefit plans (514,848) (60,140) (513,790) (60,140)
Net unrealized gain from translation of Financial Statements of foreign
operations368,013 (216,451) 242,216 (205,594)
Income taxes paid (6,473,866) (7,491,953) (6,171,667) (7,287,668)
Net cash from/(used in) operating activities (3,102,234) 12,121,438 (3,125,053) 11,445,432
Cash Flows from Investing Activities
Net purchase of property, plant and equipment (845,388) (947,921) (774,855) (905,816)
Proceeds from the sale of property, plant and equipment 5,601 10,072 671 5,621
Purchase of financial investments (300,000) (78,124) (300,000) (78,124)
Proceeds from sale and maturity of financial investments 2,188,601 1,236,191 2,188,601 1,236,191
Net purchase of intangible assets (432,950) (297,960) (393,237) (286,146)
Acquisition of a subsidiary, net of cash acquired - (91,716) - (357,282)
Dividends received from investments in subsidiaries and associates - - 76,600 63,797
Net cash from/(used in) in investing activities 615,864 (169,458) 797,780 (321,759)
Cash Flows from Financing Activities
Net proceeds from the issue of ordinary voting shares under ESOPs - 30,128 - 30,128
Interest paid on subordinated liabilities (2,874,635) (2,842,356) (2,874,635) (2,842,356)
Repayment of principal portion of lease liabilities (843,165) (902,758) (912,479) (902,758)
Dividend paid to shareholders of the Bank (3,082,618) (3,316,501) (3,082,618) (3,316,501)
Dividend paid to non-controlling interest (13,620) (3,188) - -
Net cash from /(used in) financing activities (6,814,038) (7,034,675) (6,869,732) (7,031,487)
Net increase/(decrease) in cash & cash equivalents (9,300,408) 4,917,305 (9,197,005) 4,092,186
Cash and cash equivalents as at December 31, (Gross) 53,686,825 44,360,375 52,540,437 39,538,889
Cash and cash equivalents at end of the period (Gross) 44,386,417 49,277,680 43,343,432 43,631,075
Less: Impairment charges (3,986) (2,670) (3,986) (2,670)
Cash and cash equivalents as per Statement of Financial Position (Net) 44,382,431 49,275,010 43,339,446 43,628,405
STATEMENT OF CASH FLOWS
10
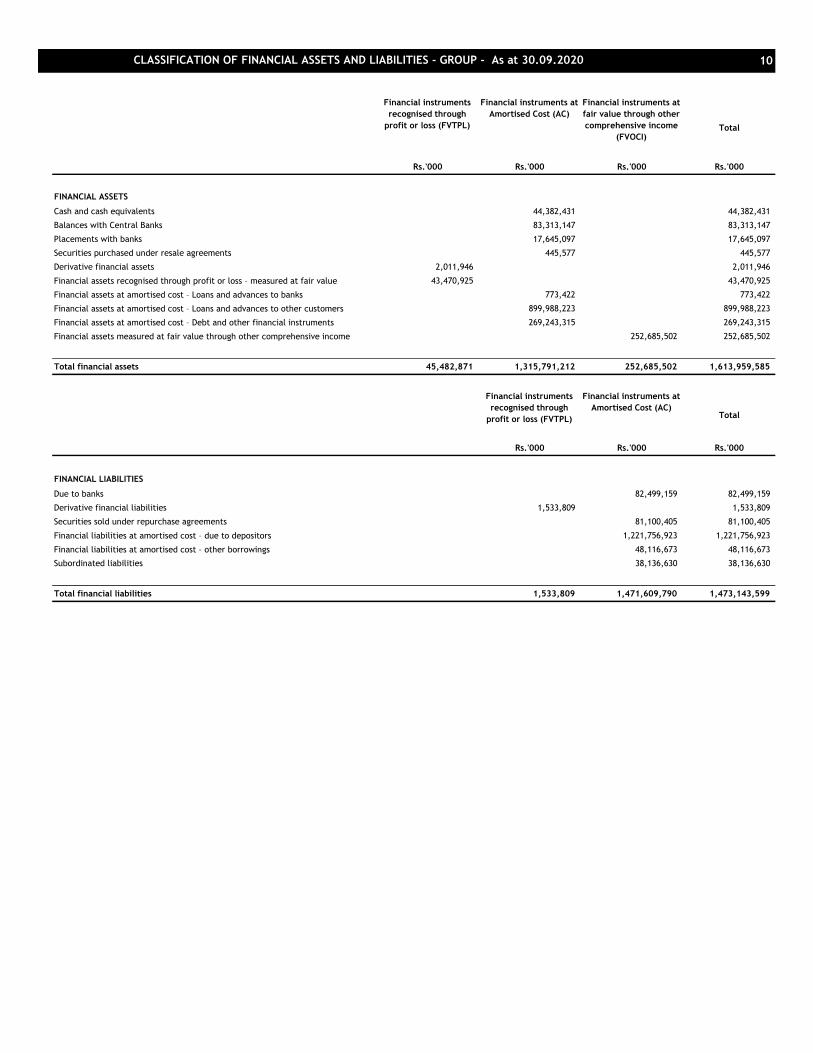
Financial instruments
recognised through
profit or loss (FVTPL)
Financial instruments at
Amortised Cost (AC)
Financial instruments at
fair value through other
comprehensive income
(FVOCI)Total
Rs.'000 Rs.'000 Rs.'000 Rs.'000
FINANCIAL ASSETS
Cash and cash equivalents 44,382,431 44,382,431
Balances with Central Banks 83,313,147 83,313,147
Placements with banks 17,645,097 17,645,097
Securities purchased under resale agreements 445,577 445,577
Derivative financial assets 2,011,946 2,011,946
Financial assets recognised through profit or loss – measured at fair value 43,470,925 43,470,925
Financial assets at amortised cost – Loans and advances to banks 773,422 773,422
Financial assets at amortised cost – Loans and advances to other customers 899,988,223 899,988,223
Financial assets at amortised cost – Debt and other financial instruments 269,243,315 269,243,315
Financial assets measured at fair value through other comprehensive income 252,685,502 252,685,502
Total financial assets 45,482,871 1,315,791,212 252,685,502 1,613,959,585
Financial instruments
recognised through
profit or loss (FVTPL)
Financial instruments at
Amortised Cost (AC)Total
Rs.'000 Rs.'000 Rs.'000
FINANCIAL LIABILITIES
Due to banks 82,499,159 82,499,159
Derivative financial liabilities 1,533,809 1,533,809
Securities sold under repurchase agreements 81,100,405 81,100,405
Financial liabilities at amortised cost – due to depositors 1,221,756,923 1,221,756,923
Financial liabilities at amortised cost – other borrowings 48,116,673 48,116,673
Subordinated liabilities 38,136,630 38,136,630
Total financial liabilities 1,533,809 1,471,609,790 1,473,143,599
CLASSIFICATION OF FINANCIAL ASSETS AND LIABILITIES - GROUP - As at 30.09.2020
11
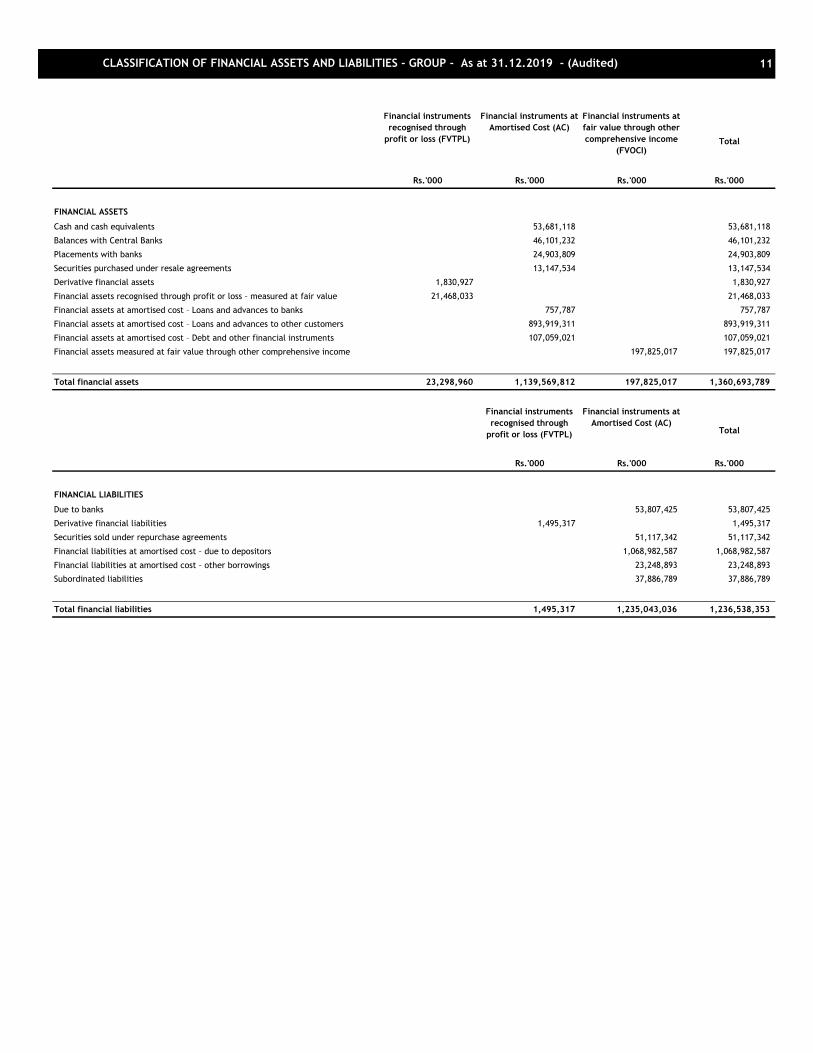
Financial instruments
recognised through
profit or loss (FVTPL)
Financial instruments at
Amortised Cost (AC)
Financial instruments at
fair value through other
comprehensive income
(FVOCI)Total
Rs.'000 Rs.'000 Rs.'000 Rs.'000
FINANCIAL ASSETS
Cash and cash equivalents 53,681,118 53,681,118
Balances with Central Banks 46,101,232 46,101,232
Placements with banks 24,903,809 24,903,809
Securities purchased under resale agreements 13,147,534 13,147,534
Derivative financial assets 1,830,927 1,830,927
Financial assets recognised through profit or loss – measured at fair value 21,468,033 21,468,033
Financial assets at amortised cost – Loans and advances to banks 757,787 757,787
Financial assets at amortised cost – Loans and advances to other customers 893,919,311 893,919,311
Financial assets at amortised cost – Debt and other financial instruments 107,059,021 107,059,021
Financial assets measured at fair value through other comprehensive income 197,825,017 197,825,017
Total financial assets 23,298,960 1,139,569,812 197,825,017 1,360,693,789
Financial instruments
recognised through
profit or loss (FVTPL)
Financial instruments at
Amortised Cost (AC)Total
Rs.'000 Rs.'000 Rs.'000
FINANCIAL LIABILITIES
Due to banks 53,807,425 53,807,425
Derivative financial liabilities 1,495,317 1,495,317
Securities sold under repurchase agreements 51,117,342 51,117,342
Financial liabilities at amortised cost – due to depositors 1,068,982,587 1,068,982,587
Financial liabilities at amortised cost – other borrowings 23,248,893 23,248,893
Subordinated liabilities 37,886,789 37,886,789
Total financial liabilities 1,495,317 1,235,043,036 1,236,538,353
CLASSIFICATION OF FINANCIAL ASSETS AND LIABILITIES - GROUP - As at 31.12.2019 - (Audited)

12
Financial instruments
recognised through
profit or loss (FVTPL)
Financial instruments at
Amortised Cost (AC)
Financial instruments at
fair value through other
comprehensive income
(FVOCI)Total
Rs.'000 Rs.'000 Rs.'000 Rs.'000
FINANCIAL ASSETS
Cash and cash equivalents 43,339,446 43,339,446
Balances with Central Banks 79,611,753 79,611,753
Placements with banks 17,235,679 17,235,679
Securities purchased under resale agreements 445,577 445,577
Derivative financial assets 2,011,946 2,011,946
Financial assets recognised through profit or loss – measured at fair value 43,470,925 43,470,925
Financial assets at amortised cost – Loans and advances to banks 773,422 773,422
Financial assets at amortised cost – Loans and advances to other customers 888,862,548 888,862,548
Financial assets at amortised cost – Debt and other financial instruments 260,169,367 260,169,367
Financial assets measured at fair value through other comprehensive income 252,327,507 252,327,507
Total financial assets 45,482,871 1,290,437,792 252,327,507 1,588,248,170
Financial instruments
recognised through
profit or loss (FVTPL)
Financial instruments at
Amortised Cost (AC)Total
Rs.'000 Rs.'000 Rs.'000
FINANCIAL LIABILITIES
Due to banks 81,003,276 81,003,276
Derivative financial liabilities 1,533,809 1,533,809
Securities sold under repurchase agreements 81,145,001 81,145,001
Financial liabilities at amortised cost – due to depositors 1,203,658,867 1,203,658,867
Financial liabilities at amortised cost – other borrowings 48,116,673 48,116,673
Subordinated liabilities 38,136,630 38,136,630
Total financial liabilities 1,533,809 1,452,060,447 1,453,594,256
CLASSIFICATION OF FINANCIAL ASSETS AND LIABILITIES - BANK - As at 30.09.2020

13
Financial instruments
recognised through
profit or loss (FVTPL)
Financial instruments at
Amortised Cost (AC)
Financial instruments at
fair value through other
comprehensive income
(FVOCI)Total
Rs.'000 Rs.'000 Rs.'000 Rs.'000
FINANCIAL ASSETS
Cash and cash equivalents 52,534,730 52,534,730
Balances with Central Banks 39,461,127 39,461,127
Placements with banks 24,527,241 24,527,241
Securities purchased under resale agreements 13,147,534 13,147,534
Derivative financial assets 1,830,927 1,830,927
Financial assets recognised through profit or loss – measured at fair value 21,468,033 21,468,033
Financial assets at amortised cost – Loans and advances to banks 757,787 757,787
Financial assets at amortised cost – Loans and advances to other customers 884,645,744 884,645,744
Financial assets at amortised cost – Debt and other financial instruments 101,144,819 101,144,819
Financial assets measured at fair value through other comprehensive income 197,568,330 197,568,330
Total financial assets 23,298,960 1,116,218,982 197,568,330 1,337,086,272
Financial instruments
recognised through
profit or loss (FVTPL)
Financial instruments at
Amortised Cost (AC)Total
Rs.'000 Rs.'000 Rs.'000
FINANCIAL LIABILITIES
Due to banks 51,505,694 51,505,694
Derivative financial liabilities 1,495,317 1,495,317
Securities sold under repurchase agreements 51,220,023 51,220,023
Financial liabilities at amortised cost – due to depositors 1,053,307,660 1,053,307,660
Financial liabilities at amortised cost – other borrowings 23,248,893 23,248,893
Subordinated liabilities 37,886,789 37,886,789
Total financial liabilities 1,495,317 1,217,169,059 1,218,664,376
CLASSIFICATION OF FINANCIAL ASSETS AND LIABILITIES - BANK - As at 31.12.2019 - (Audited)
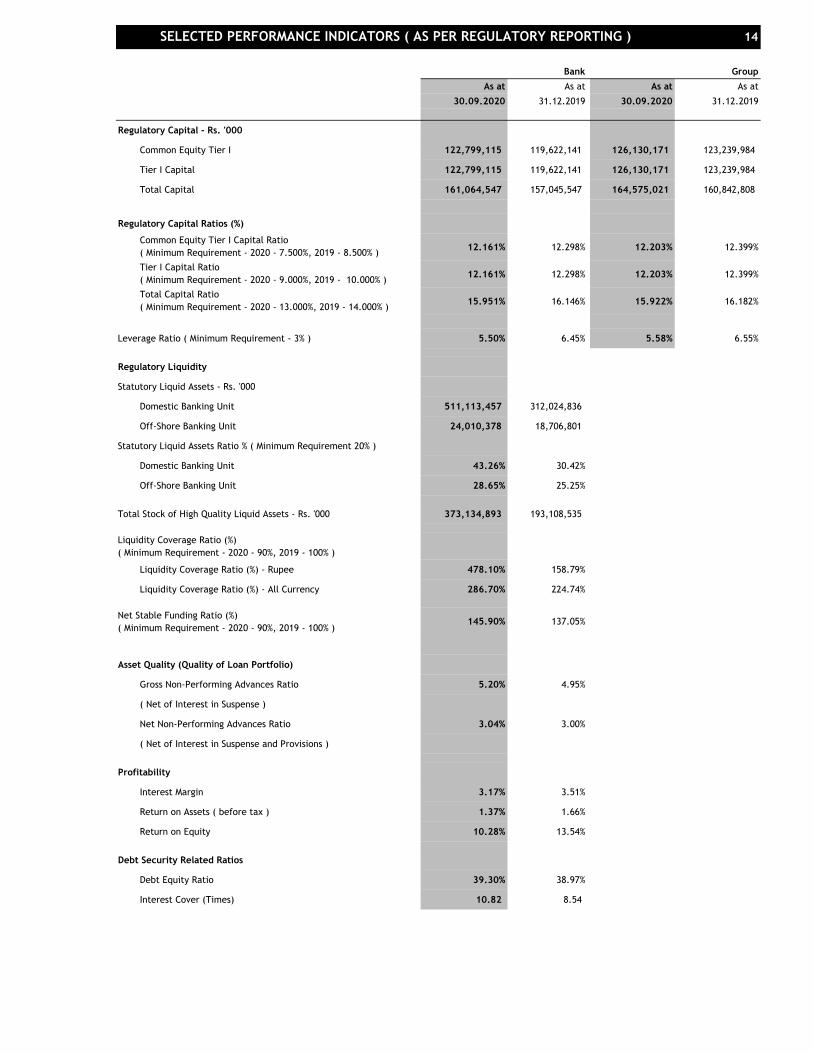
14
Bank Group
As at As at As at As at
30.09.2020 31.12.2019 30.09.2020 31.12.2019
Regulatory Capital - Rs. '000
Common Equity Tier I 122,799,115 119,622,141 126,130,171 123,239,984
Tier I Capital 122,799,115 119,622,141 126,130,171 123,239,984
Total Capital 161,064,547 157,045,547 164,575,021 160,842,808
Regulatory Capital Ratios (%)
Common Equity Tier I Capital Ratio
( Minimum Requirement - 2020 - 7.500%, 2019 - 8.500% )12.161% 12.298% 12.203% 12.399%
Tier I Capital Ratio
( Minimum Requirement - 2020 - 9.000%, 2019 - 10.000% )12.161% 12.298% 12.203% 12.399%
Total Capital Ratio
( Minimum Requirement - 2020 - 13.000%, 2019 - 14.000% )15.951% 16.146% 15.922% 16.182%
Leverage Ratio ( Minimum Requirement - 3% ) 5.50% 6.45% 5.58% 6.55%
Regulatory Liquidity
Statutory Liquid Assets - Rs. '000
Domestic Banking Unit 511,113,457 312,024,836
Off-Shore Banking Unit 24,010,378 18,706,801
Statutory Liquid Assets Ratio % ( Minimum Requirement 20% )
Domestic Banking Unit 43.26% 30.42%
Off-Shore Banking Unit 28.65% 25.25%
Total Stock of High Quality Liquid Assets - Rs. '000 373,134,893 193,108,535
Liquidity Coverage Ratio (%)
( Minimum Requirement - 2020 - 90%, 2019 - 100% )
Liquidity Coverage Ratio (%) - Rupee 478.10% 158.79%
Liquidity Coverage Ratio (%) - All Currency 286.70% 224.74%
Net Stable Funding Ratio (%)
( Minimum Requirement - 2020 - 90%, 2019 - 100% )145.90% 137.05%
Asset Quality (Quality of Loan Portfolio)
Gross Non-Performing Advances Ratio 5.20% 4.95%
( Net of Interest in Suspense )
Net Non-Performing Advances Ratio 3.04% 3.00%
( Net of Interest in Suspense and Provisions )
Profitability
Interest Margin 3.17% 3.51%
Return on Assets ( before tax ) 1.37% 1.66%
Return on Equity 10.28% 13.54%
Debt Security Related Ratios
Debt Equity Ratio 39.30% 38.97%
Interest Cover (Times) 10.82 8.54
SELECTED PERFORMANCE INDICATORS ( AS PER REGULATORY REPORTING )
15
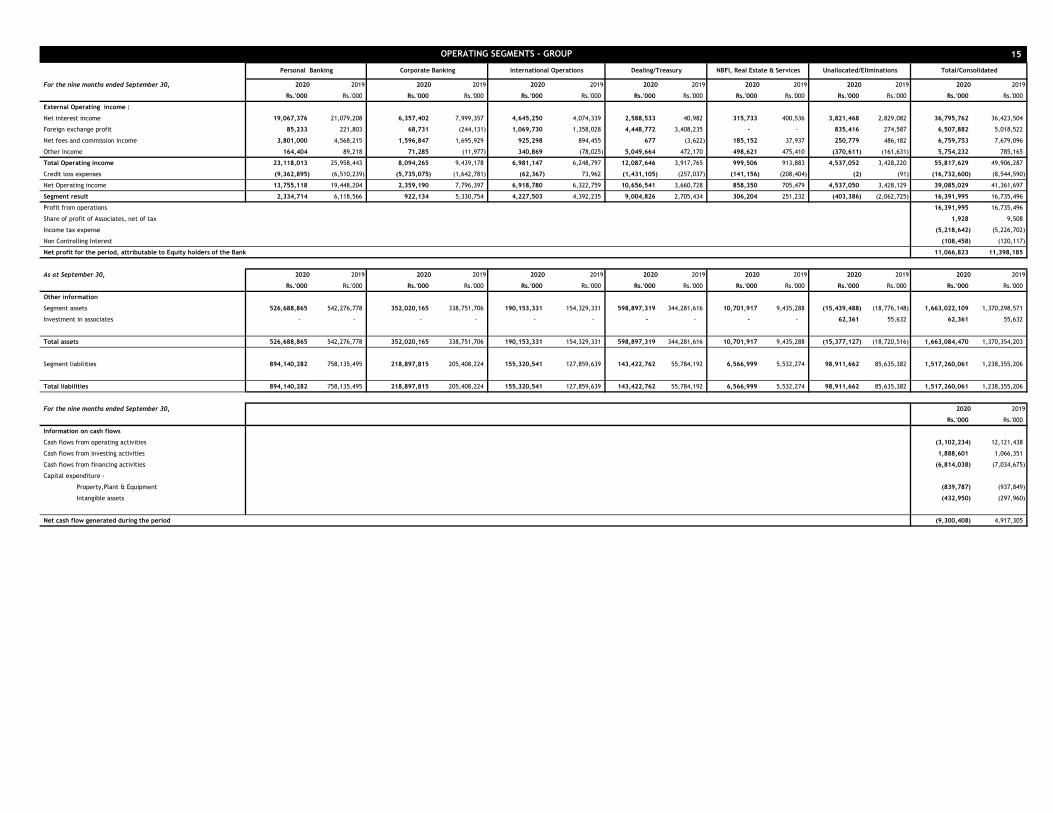
For the nine months ended September 30, 2020 2019 2020 2019 2020 2019 2020 2019 2020 2019 2020 2019 2020 2019
Rs.'000 Rs.'000 Rs.'000 Rs.'000 Rs.'000 Rs.'000 Rs.'000 Rs.'000 Rs.'000 Rs.'000 Rs.'000 Rs.'000 Rs.'000 Rs.'000
External Operating income :
Net interest income 19,067,376 21,079,208 6,357,402 7,999,357 4,645,250 4,074,339 2,588,533 40,982 315,733 400,536 3,821,468 2,829,082 36,795,762 36,423,504
Foreign exchange profit 85,233 221,803 68,731 (244,131) 1,069,730 1,358,028 4,448,772 3,408,235 - - 835,416 274,587 6,507,882 5,018,522
Net fees and commission income 3,801,000 4,568,215 1,596,847 1,695,929 925,298 894,455 677 (3,622) 185,152 37,937 250,779 486,182 6,759,753 7,679,096
Other income 164,404 89,218 71,285 (11,977) 340,869 (78,025) 5,049,664 472,170 498,621 475,410 (370,611) (161,631) 5,754,232 785,165
Total Operating income 23,118,013 25,958,443 8,094,265 9,439,178 6,981,147 6,248,797 12,087,646 3,917,765 999,506 913,883 4,537,052 3,428,220 55,817,629 49,906,287
Credit loss expenses (9,362,895) (6,510,239) (5,735,075) (1,642,781) (62,367) 73,962 (1,431,105) (257,037) (141,156) (208,404) (2) (91) (16,732,600) (8,544,590)
Net Operating income 13,755,118 19,448,204 2,359,190 7,796,397 6,918,780 6,322,759 10,656,541 3,660,728 858,350 705,479 4,537,050 3,428,129 39,085,029 41,361,697
Segment result 2,334,714 6,118,566 922,134 5,330,754 4,227,503 4,392,235 9,004,826 2,705,434 306,204 251,232 (403,386) (2,062,725) 16,391,995 16,735,496
Profit from operations 16,391,995 16,735,496
Share of profit of Associates, net of tax 1,928 9,508
Income tax expense (5,218,642) (5,226,702)
Non Controlling Interest (108,458) (120,117)
Net profit for the period, attributable to Equity holders of the Bank 11,066,823 11,398,185
As at September 30, 2020 2019 2020 2019 2020 2019 2020 2019 2020 2019 2020 2019 2020 2019
Rs.'000 Rs.'000 Rs.'000 Rs.'000 Rs.'000 Rs.'000 Rs.'000 Rs.'000 Rs.'000 Rs.'000 Rs.'000 Rs.'000 Rs.'000 Rs.'000
Other information
Segment assets 526,688,865 542,276,778 352,020,165 338,751,706 190,153,331 154,329,331 598,897,319 344,281,616 10,701,917 9,435,288 (15,439,488) (18,776,148) 1,663,022,109 1,370,298,571
Investment in associates - - - - - - - - - - 62,361 55,632 62,361 55,632
Total assets 526,688,865 542,276,778 352,020,165 338,751,706 190,153,331 154,329,331 598,897,319 344,281,616 10,701,917 9,435,288 (15,377,127) (18,720,516) 1,663,084,470 1,370,354,203
Segment liabilities 894,140,282 758,135,495 218,897,815 205,408,224 155,320,541 127,859,639 143,422,762 55,784,192 6,566,999 5,532,274 98,911,662 85,635,382 1,517,260,061 1,238,355,206
Total liabilities 894,140,282 758,135,495 218,897,815 205,408,224 155,320,541 127,859,639 143,422,762 55,784,192 6,566,999 5,532,274 98,911,662 85,635,382 1,517,260,061 1,238,355,206
For the nine months ended September 30, 2020 2019
Rs.'000 Rs.'000
Information on cash flows
Cash flows from operating activities (3,102,234) 12,121,438
Cash flows from investing activities 1,888,601 1,066,351
Cash flows from financing activities (6,814,038) (7,034,675)
Capital expenditure -
Property,Plant & Equipment (839,787) (937,849)
Intangible assets (432,950) (297,960)
Net cash flow generated during the period (9,300,408) 4,917,305
OPERATING SEGMENTS - GROUP
Personal Banking Corporate Banking International Operations Dealing/Treasury NBFI, Real Estate & Services Unallocated/Eliminations Total/Consolidated
16
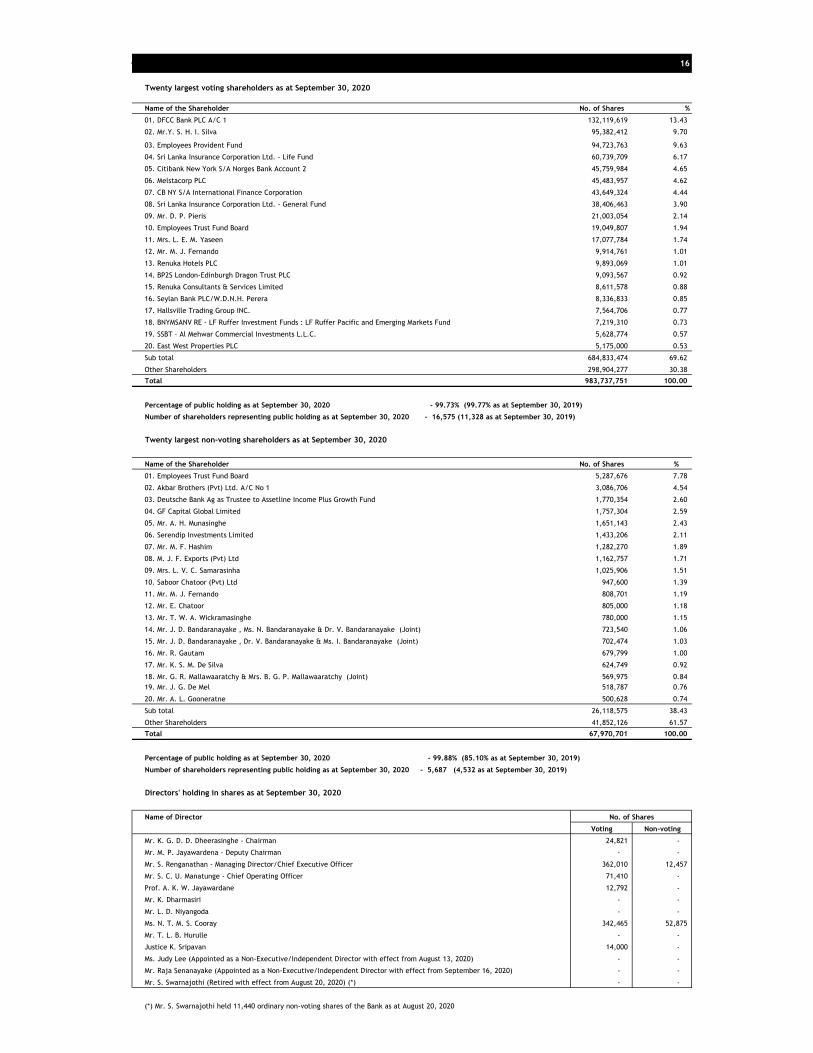
Twenty largest voting shareholders as at September 30, 2020
Name of the Shareholder No. of Shares %
01. DFCC Bank PLC A/C 1 132,119,619 13.43
02. Mr.Y. S. H. I. Silva 95,382,412 9.70
03. Employees Provident Fund 94,723,763 9.63
04. Sri Lanka Insurance Corporation Ltd. - Life Fund 60,739,709 6.17
05. Citibank New York S/A Norges Bank Account 2 45,759,984 4.65
06. Melstacorp PLC 45,483,957 4.62
07. CB NY S/A International Finance Corporation 43,649,324 4.44
08. Sri Lanka Insurance Corporation Ltd. - General Fund 38,406,463 3.90
09. Mr. D. P. Pieris 21,003,054 2.14
10. Employees Trust Fund Board 19,049,807 1.94
11. Mrs. L. E. M. Yaseen 17,077,784 1.74
12. Mr. M. J. Fernando 9,914,761 1.01
13. Renuka Hotels PLC 9,893,069 1.01
14. BP2S London-Edinburgh Dragon Trust PLC 9,093,567 0.92
15. Renuka Consultants & Services Limited 8,611,578 0.88
16. Seylan Bank PLC/W.D.N.H. Perera 8,336,833 0.85
17. Hallsville Trading Group INC. 7,564,706 0.77
18. BNYMSANV RE - LF Ruffer Investment Funds : LF Ruffer Pacific and Emerging Markets Fund 7,219,310 0.73
19. SSBT - Al Mehwar Commercial Investments L.L.C. 5,628,774 0.57
20. East West Properties PLC 5,175,000 0.53
Sub total 684,833,474 69.62
Other Shareholders 298,904,277 30.38
Total 983,737,751 100.00
Percentage of public holding as at September 30, 2020 - 99.73% (99.77% as at September 30, 2019)
Number of shareholders representing public holding as at September 30, 2020 - 16,575 (11,328 as at September 30, 2019)
Twenty largest non-voting shareholders as at September 30, 2020
Name of the Shareholder No. of Shares %
01. Employees Trust Fund Board 5,287,676 7.78
02. Akbar Brothers (Pvt) Ltd. A/C No 1 3,086,706 4.54
03. Deutsche Bank Ag as Trustee to Assetline Income Plus Growth Fund 1,770,354 2.60
04. GF Capital Global Limited 1,757,304 2.59
05. Mr. A. H. Munasinghe 1,651,143 2.43
06. Serendip Investments Limited 1,433,206 2.11
07. Mr. M. F. Hashim 1,282,270 1.89
08. M. J. F. Exports (Pvt) Ltd 1,162,757 1.71
09. Mrs. L. V. C. Samarasinha 1,025,906 1.51
10. Saboor Chatoor (Pvt) Ltd 947,600 1.39
11. Mr. M. J. Fernando 808,701 1.19
12. Mr. E. Chatoor 805,000 1.18
13. Mr. T. W. A. Wickramasinghe 780,000 1.15
14. Mr. J. D. Bandaranayake , Ms. N. Bandaranayake & Dr. V. Bandaranayake (Joint) 723,540 1.06
15. Mr. J. D. Bandaranayake , Dr. V. Bandaranayake & Ms. I. Bandaranayake (Joint) 702,474 1.03
16. Mr. R. Gautam 679,799 1.00
17. Mr. K. S. M. De Silva 624,749 0.92
18. Mr. G. R. Mallawaaratchy & Mrs. B. G. P. Mallawaaratchy (Joint) 569,975 0.84
19. Mr. J. G. De Mel 518,787 0.76
20. Mr. A. L. Gooneratne 500,628 0.74
Sub total 26,118,575 38.43
Other Shareholders 41,852,126 61.57
Total 67,970,701 100.00
Percentage of public holding as at September 30, 2020 - 99.88% (85.10% as at September 30, 2019)
Number of shareholders representing public holding as at September 30, 2020 - 5,687 (4,532 as at September 30, 2019)
Directors' holding in shares as at September 30, 2020
Name of Director
Voting Non-voting
Mr. K. G. D. D. Dheerasinghe - Chairman 24,821 -
Mr. M. P. Jayawardena - Deputy Chairman - -
Mr. S. Renganathan - Managing Director/Chief Executive Officer 362,010 12,457
Mr. S. C. U. Manatunge - Chief Operating Officer 71,410 -
Prof. A. K. W. Jayawardane 12,792 -
Mr. K. Dharmasiri - -
Mr. L. D. Niyangoda - -
Ms. N. T. M. S. Cooray 342,465 52,875
Mr. T. L. B. Hurulle - -
Justice K. Sripavan 14,000 -
Ms. Judy Lee (Appointed as a Non-Executive/Independent Director with effect from August 13, 2020) - -
Mr. Raja Senanayake (Appointed as a Non-Executive/Independent Director with effect from September 16, 2020) - -
Mr. S. Swarnajothi (Retired with effect from August 20, 2020) (*) - -
(*) Mr. S. Swarnajothi held 11,440 ordinary non-voting shares of the Bank as at August 20, 2020
No. of Shares
17
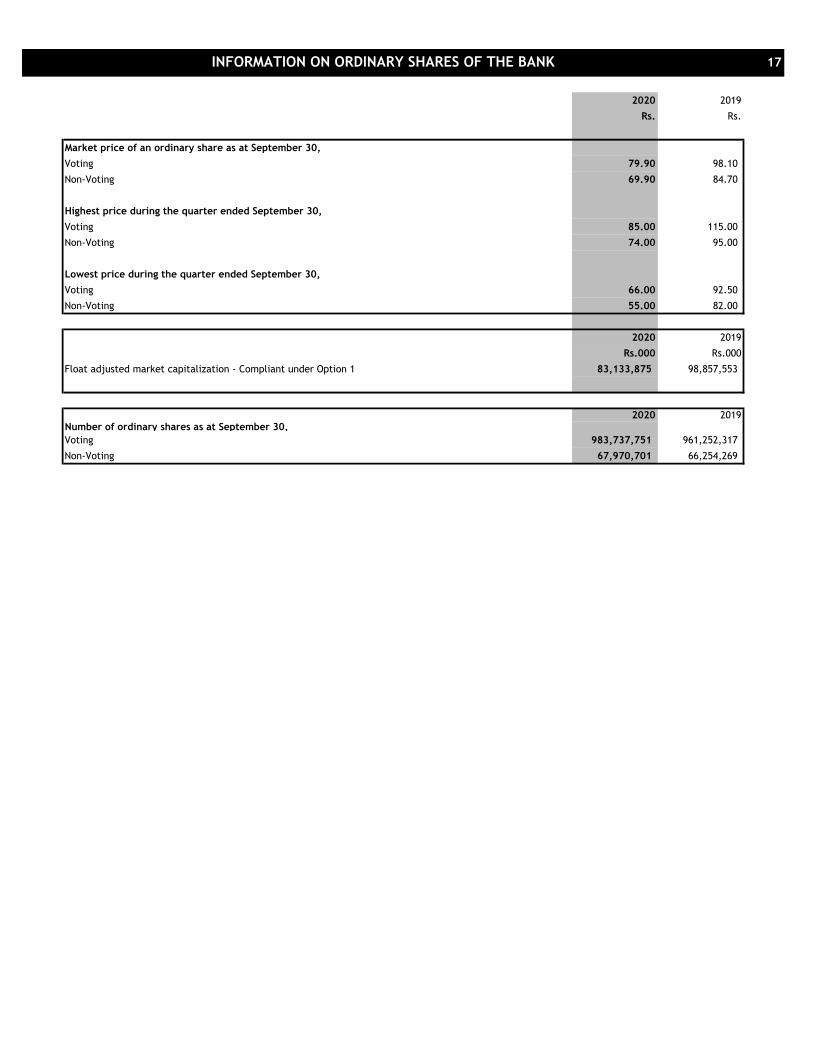
2020 2019
Rs. Rs.
Market price of an ordinary share as at September 30,
Voting 79.90 98.10
Non-Voting 69.90 84.70
Highest price during the quarter ended September 30,
Voting 85.00 115.00
Non-Voting 74.00 95.00
Lowest price during the quarter ended September 30,
Voting 66.00 92.50
Non-Voting 55.00 82.00
2020 2019
Rs.000 Rs.000
Float adjusted market capitalization - Compliant under Option 1 83,133,875 98,857,553
2020 2019Number of ordinary shares as at September 30,
Voting 983,737,751 961,252,317
Non-Voting 67,970,701 66,254,269
INFORMATION ON ORDINARY SHARES OF THE BANK
18
1
2
3
•
•
4
5
6
7
8
9
10
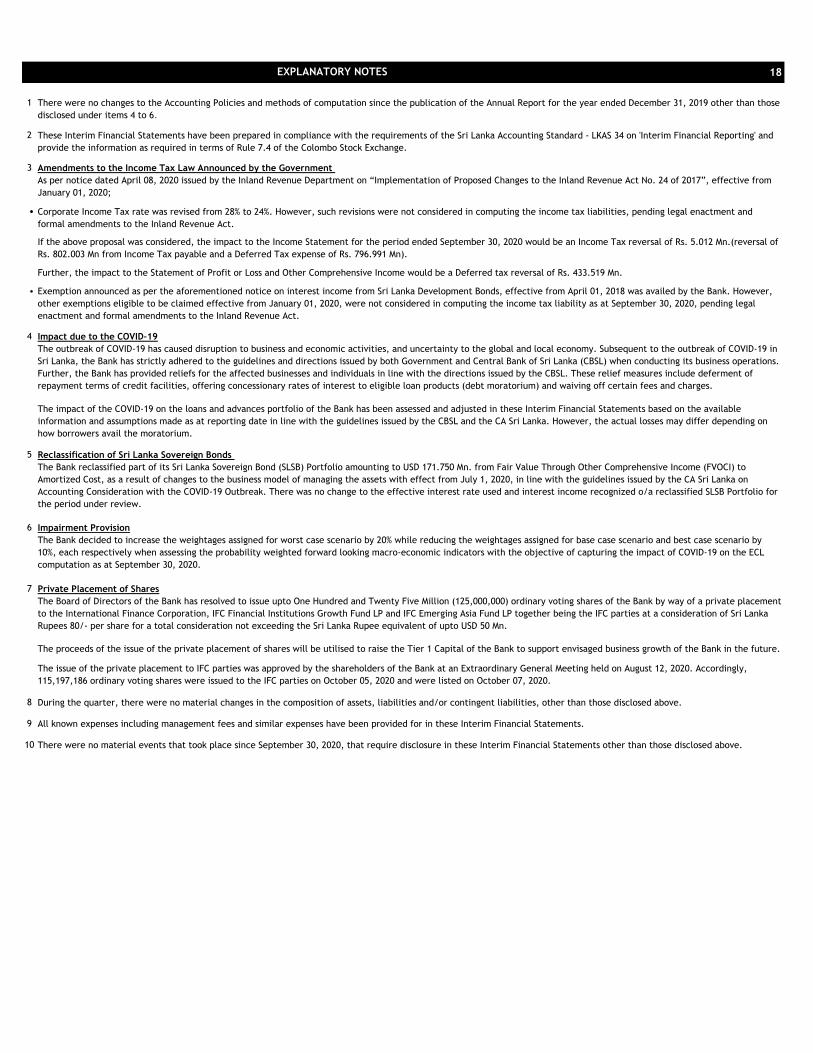
If the above proposal was considered, the impact to the Income Statement for the period ended September 30, 2020 would be an Income Tax reversal of Rs. 5.012 Mn.(reversal of
Rs. 802.003 Mn from Income Tax payable and a Deferred Tax expense of Rs. 796.991 Mn).
EXPLANATORY NOTES
There were no changes to the Accounting Policies and methods of computation since the publication of the Annual Report for the year ended December 31, 2019 other than those
disclosed under items 4 to 6.
These Interim Financial Statements have been prepared in compliance with the requirements of the Sri Lanka Accounting Standard - LKAS 34 on 'Interim Financial Reporting' and
provide the information as required in terms of Rule 7.4 of the Colombo Stock Exchange.
Amendments to the Income Tax Law Announced by the Government
As per notice dated April 08, 2020 issued by the Inland Revenue Department on “Implementation of Proposed Changes to the Inland Revenue Act No. 24 of 2017”, effective from
January 01, 2020;
Corporate Income Tax rate was revised from 28% to 24%. However, such revisions were not considered in computing the income tax liabilities, pending legal enactment and
formal amendments to the Inland Revenue Act.
There were no material events that took place since September 30, 2020, that require disclosure in these Interim Financial Statements other than those disclosed above.
Further, the impact to the Statement of Profit or Loss and Other Comprehensive Income would be a Deferred tax reversal of Rs. 433.519 Mn.
Exemption announced as per the aforementioned notice on interest income from Sri Lanka Development Bonds, effective from April 01, 2018 was availed by the Bank. However,
other exemptions eligible to be claimed effective from January 01, 2020, were not considered in computing the income tax liability as at September 30, 2020, pending legal
enactment and formal amendments to the Inland Revenue Act.
Impact due to the COVID–19
The outbreak of COVID-19 has caused disruption to business and economic activities, and uncertainty to the global and local economy. Subsequent to the outbreak of COVID-19 in
Sri Lanka, the Bank has strictly adhered to the guidelines and directions issued by both Government and Central Bank of Sri Lanka (CBSL) when conducting its business operations.
Further, the Bank has provided reliefs for the affected businesses and individuals in line with the directions issued by the CBSL. These relief measures include deferment of
repayment terms of credit facilities, offering concessionary rates of interest to eligible loan products (debt moratorium) and waiving off certain fees and charges.
The impact of the COVID-19 on the loans and advances portfolio of the Bank has been assessed and adjusted in these Interim Financial Statements based on the available
information and assumptions made as at reporting date in line with the guidelines issued by the CBSL and the CA Sri Lanka. However, the actual losses may differ depending on
how borrowers avail the moratorium.
Reclassification of Sri Lanka Sovereign Bonds
The Bank reclassified part of its Sri Lanka Sovereign Bond (SLSB) Portfolio amounting to USD 171.750 Mn. from Fair Value Through Other Comprehensive Income (FVOCI) to
Amortized Cost, as a result of changes to the business model of managing the assets with effect from July 1, 2020, in line with the guidelines issued by the CA Sri Lanka on
Accounting Consideration with the COVID-19 Outbreak. There was no change to the effective interest rate used and interest income recognized o/a reclassified SLSB Portfolio for
the period under review.
Impairment Provision
The Bank decided to increase the weightages assigned for worst case scenario by 20% while reducing the weightages assigned for base case scenario and best case scenario by
10%, each respectively when assessing the probability weighted forward looking macro-economic indicators with the objective of capturing the impact of COVID-19 on the ECL
computation as at September 30, 2020.
Private Placement of Shares
The Board of Directors of the Bank has resolved to issue upto One Hundred and Twenty Five Million (125,000,000) ordinary voting shares of the Bank by way of a private placement
to the International Finance Corporation, IFC Financial Institutions Growth Fund LP and IFC Emerging Asia Fund LP together being the IFC parties at a consideration of Sri Lanka
Rupees 80/- per share for a total consideration not exceeding the Sri Lanka Rupee equivalent of upto USD 50 Mn.
The proceeds of the issue of the private placement of shares will be utilised to raise the Tier 1 Capital of the Bank to support envisaged business growth of the Bank in the future.
The issue of the private placement to IFC parties was approved by the shareholders of the Bank at an Extraordinary General Meeting held on August 12, 2020. Accordingly,
115,197,186 ordinary voting shares were issued to the IFC parties on October 05, 2020 and were listed on October 07, 2020.
During the quarter, there were no material changes in the composition of assets, liabilities and/or contingent liabilities, other than those disclosed above.
All known expenses including management fees and similar expenses have been provided for in these Interim Financial Statements.
19
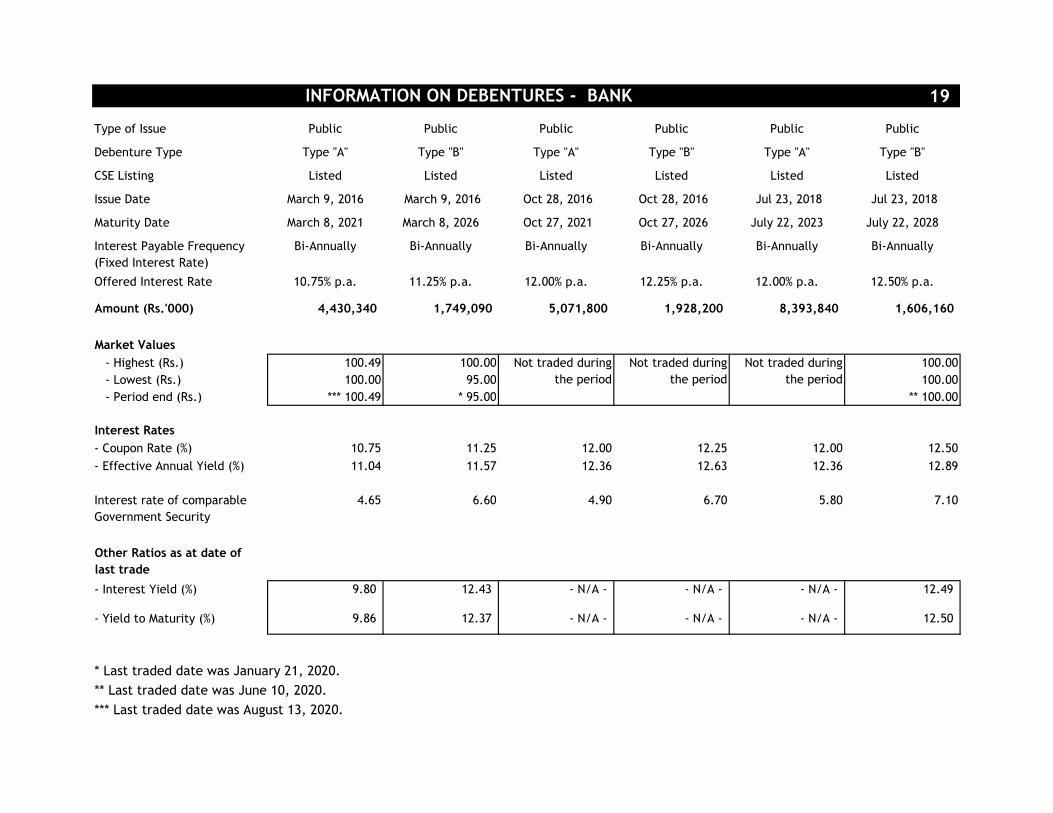
Type of Issue Public Public Public Public Public Public
Debenture Type Type "A" Type "B" Type "A" Type "B" Type "A" Type "B"
CSE Listing Listed Listed Listed Listed Listed Listed
Issue Date March 9, 2016 March 9, 2016 Oct 28, 2016 Oct 28, 2016 Jul 23, 2018 Jul 23, 2018
Maturity Date March 8, 2021 March 8, 2026 Oct 27, 2021 Oct 27, 2026 July 22, 2023 July 22, 2028
Interest Payable Frequency
(Fixed Interest Rate)
Bi-Annually Bi-Annually Bi-Annually Bi-Annually Bi-Annually Bi-Annually
Offered Interest Rate 10.75% p.a. 11.25% p.a. 12.00% p.a. 12.25% p.a. 12.00% p.a. 12.50% p.a.
Amount (Rs.'000) 4,430,340 1,749,090 5,071,800 1,928,200 8,393,840 1,606,160
Market Values
- Highest (Rs.) 100.49 100.00 100.00
- Lowest (Rs.) 100.00 95.00 100.00
- Period end (Rs.) *** 100.49 * 95.00 ** 100.00
Interest Rates
- Coupon Rate (%) 10.75 11.25 12.00 12.25 12.00 12.50
- Effective Annual Yield (%) 11.04 11.57 12.36 12.63 12.36 12.89
Interest rate of comparable
Government Security
4.65 6.60 4.90 6.70 5.80 7.10
Other Ratios as at date of
last trade
- Interest Yield (%) 9.80 12.43 - N/A - - N/A - - N/A - 12.49
- Yield to Maturity (%) 9.86 12.37 - N/A - - N/A - - N/A - 12.50
* Last traded date was January 21, 2020.
** Last traded date was June 10, 2020.
*** Last traded date was August 13, 2020.
INFORMATION ON DEBENTURES - BANK
Not traded during
the period
Not traded during
the period
Not traded during
the period
20
Group Bank
As at 30.09.2020 31.12.2019 30.09.2020 31.12.2019
Rs.'000 Rs.'000 Rs.'000 Rs.'000
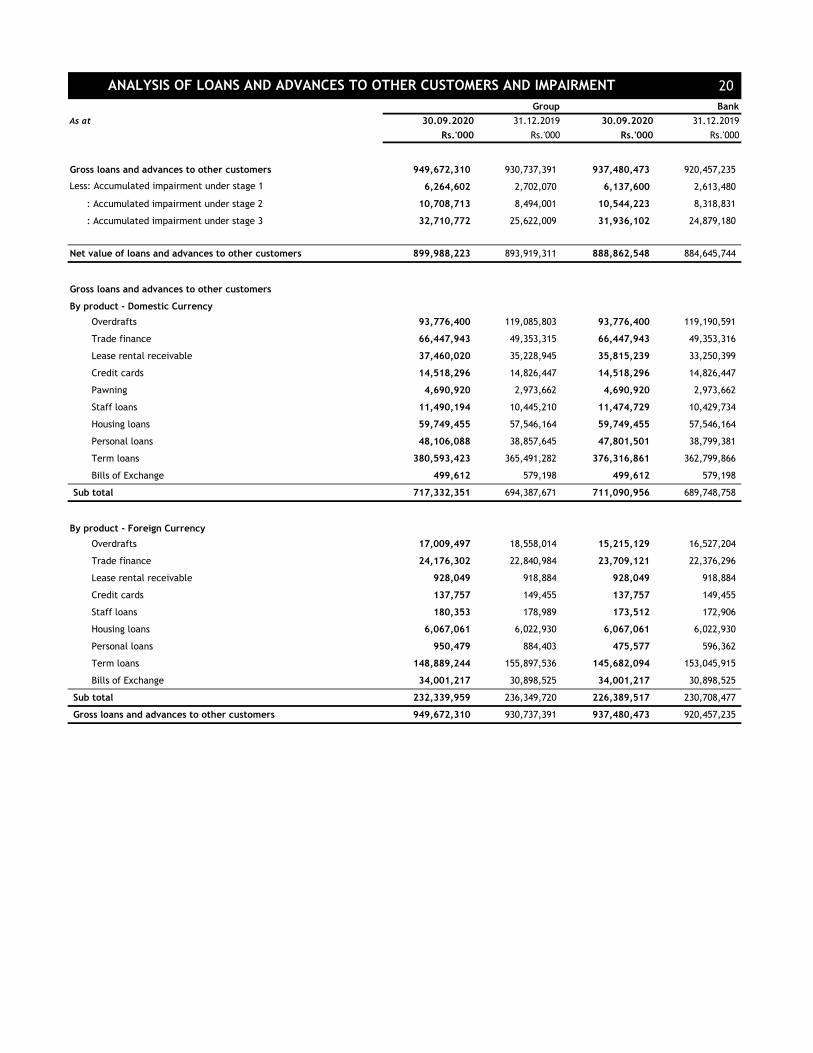
Gross loans and advances to other customers 949,672,310 930,737,391 937,480,473 920,457,235
Less: Accumulated impairment under stage 1 6,264,602 2,702,070 6,137,600 2,613,480
: Accumulated impairment under stage 2 10,708,713 8,494,001 10,544,223 8,318,831
: Accumulated impairment under stage 3 32,710,772 25,622,009 31,936,102 24,879,180
Net value of loans and advances to other customers 899,988,223 893,919,311 888,862,548 884,645,744
Gross loans and advances to other customers
By product - Domestic Currency
Overdrafts 93,776,400 119,085,803 93,776,400 119,190,591
Trade finance 66,447,943 49,353,315 66,447,943 49,353,316
Lease rental receivable 37,460,020 35,228,945 35,815,239 33,250,399
Credit cards 14,518,296 14,826,447 14,518,296 14,826,447
Pawning 4,690,920 2,973,662 4,690,920 2,973,662
Staff loans 11,490,194 10,445,210 11,474,729 10,429,734
Housing loans 59,749,455 57,546,164 59,749,455 57,546,164
Personal loans 48,106,088 38,857,645 47,801,501 38,799,381
Term loans 380,593,423 365,491,282 376,316,861 362,799,866
Bills of Exchange 499,612 579,198 499,612 579,198
Sub total 717,332,351 694,387,671 711,090,956 689,748,758
By product - Foreign Currency
Overdrafts 17,009,497 18,558,014 15,215,129 16,527,204
Trade finance 24,176,302 22,840,984 23,709,121 22,376,296
Lease rental receivable 928,049 918,884 928,049 918,884
Credit cards 137,757 149,455 137,757 149,455
Staff loans 180,353 178,989 173,512 172,906
Housing loans 6,067,061 6,022,930 6,067,061 6,022,930
Personal loans 950,479 884,403 475,577 596,362
Term loans 148,889,244 155,897,536 145,682,094 153,045,915
Bills of Exchange 34,001,217 30,898,525 34,001,217 30,898,525
Sub total 232,339,959 236,349,720 226,389,517 230,708,477
Gross loans and advances to other customers 949,672,310 930,737,391 937,480,473 920,457,235
ANALYSIS OF LOANS AND ADVANCES TO OTHER CUSTOMERS AND IMPAIRMENT
21
Group Bank
2020 2019 2020 2019
( Audited ) ( Audited )
Rs.'000 Rs.'000 Rs.'000 Rs.'000
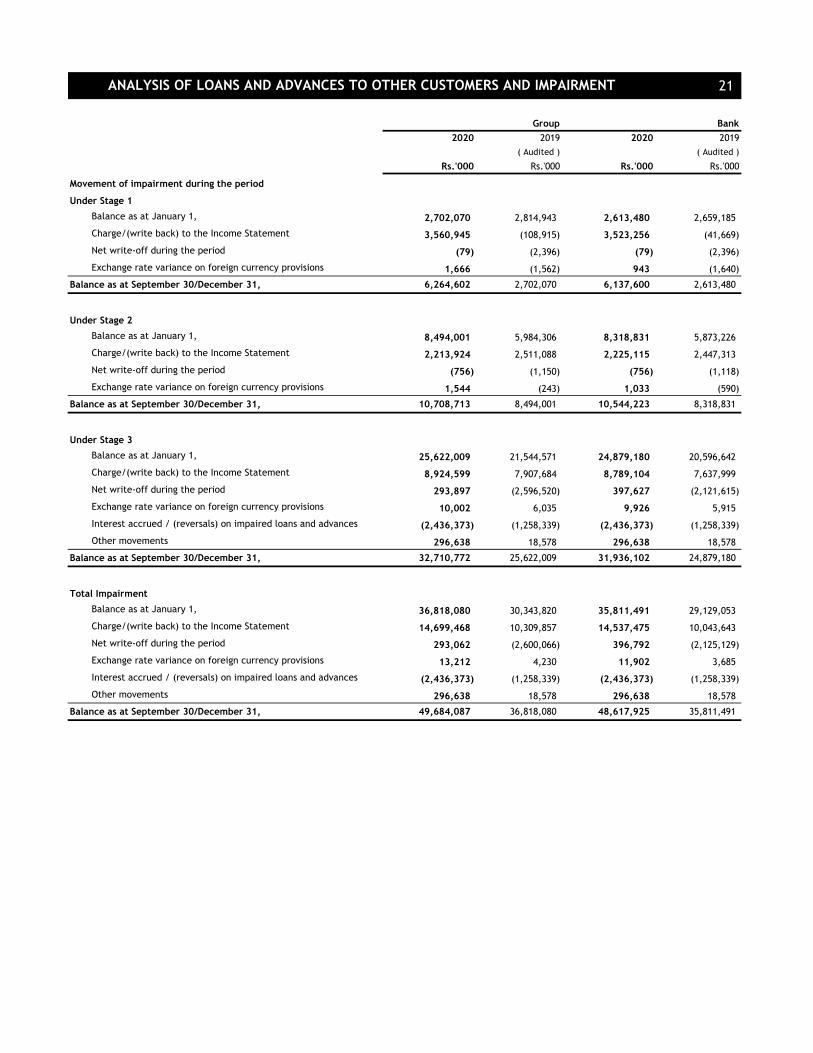
Movement of impairment during the period
Under Stage 1
Balance as at January 1, 2,702,070 2,814,943 2,613,480 2,659,185
Charge/(write back) to the Income Statement 3,560,945 (108,915) 3,523,256 (41,669)
Net write-off during the period (79) (2,396) (79) (2,396)
Exchange rate variance on foreign currency provisions 1,666 (1,562) 943 (1,640)
Balance as at September 30/December 31, 6,264,602 2,702,070 6,137,600 2,613,480
Under Stage 2
Balance as at January 1, 8,494,001 5,984,306 8,318,831 5,873,226
Charge/(write back) to the Income Statement 2,213,924 2,511,088 2,225,115 2,447,313
Net write-off during the period (756) (1,150) (756) (1,118)
Exchange rate variance on foreign currency provisions 1,544 (243) 1,033 (590)
Balance as at September 30/December 31, 10,708,713 8,494,001 10,544,223 8,318,831
Under Stage 3
Balance as at January 1, 25,622,009 21,544,571 24,879,180 20,596,642
Charge/(write back) to the Income Statement 8,924,599 7,907,684 8,789,104 7,637,999
Net write-off during the period 293,897 (2,596,520) 397,627 (2,121,615)
Exchange rate variance on foreign currency provisions 10,002 6,035 9,926 5,915
Interest accrued / (reversals) on impaired loans and advances (2,436,373) (1,258,339) (2,436,373) (1,258,339)
Other movements 296,638 18,578 296,638 18,578
Balance as at September 30/December 31, 32,710,772 25,622,009 31,936,102 24,879,180
Total Impairment
Balance as at January 1, 36,818,080 30,343,820 35,811,491 29,129,053
Charge/(write back) to the Income Statement 14,699,468 10,309,857 14,537,475 10,043,643
Net write-off during the period 293,062 (2,600,066) 396,792 (2,125,129)
Exchange rate variance on foreign currency provisions 13,212 4,230 11,902 3,685
Interest accrued / (reversals) on impaired loans and advances (2,436,373) (1,258,339) (2,436,373) (1,258,339)
Other movements 296,638 18,578 296,638 18,578
Balance as at September 30/December 31, 49,684,087 36,818,080 48,617,925 35,811,491
ANALYSIS OF LOANS AND ADVANCES TO OTHER CUSTOMERS AND IMPAIRMENT
22
As at 30.09.2020 31.12.2019 30.09.2020 31.12.2019
Rs.'000 Rs.'000 Rs.'000 Rs.'000
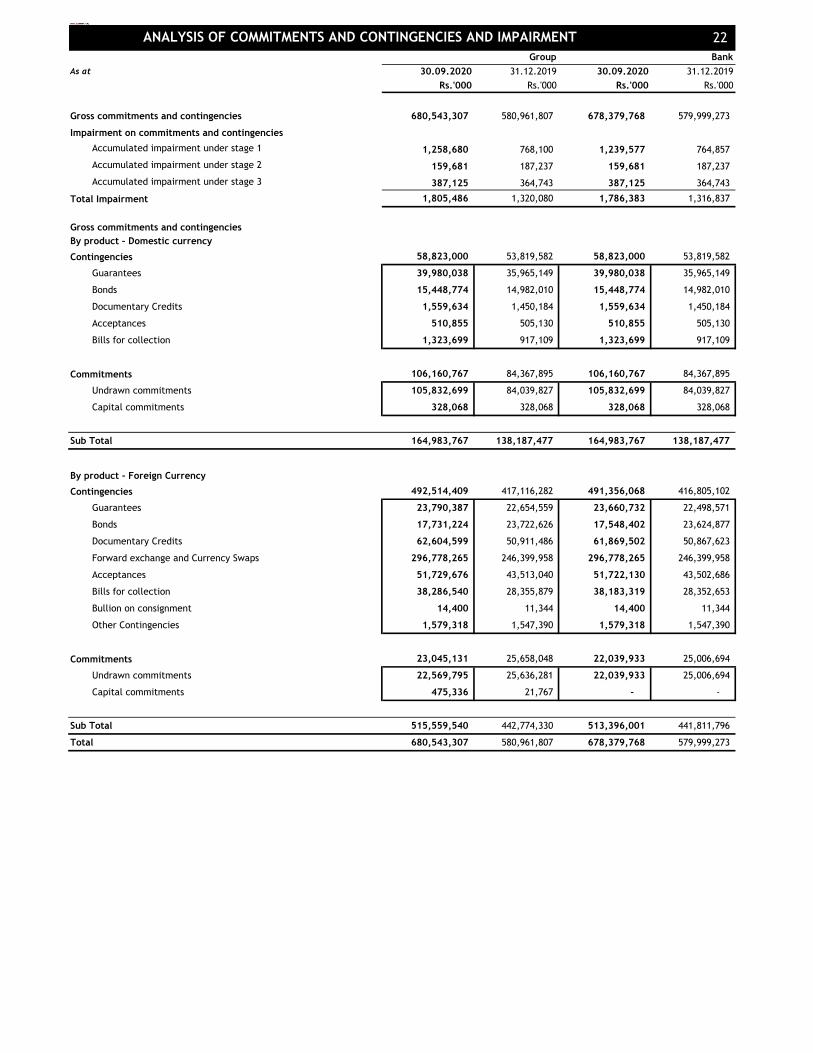
Gross commitments and contingencies 680,543,307 580,961,807 678,379,768 579,999,273
Impairment on commitments and contingencies
Accumulated impairment under stage 1 1,258,680 768,100 1,239,577 764,857
Accumulated impairment under stage 2 159,681 187,237 159,681 187,237
Accumulated impairment under stage 3 387,125 364,743 387,125 364,743
Total Impairment 1,805,486 1,320,080 1,786,383 1,316,837
Gross commitments and contingencies
By product – Domestic currency
Contingencies 58,823,000 53,819,582 58,823,000 53,819,582
Guarantees 39,980,038 35,965,149 39,980,038 35,965,149
Bonds 15,448,774 14,982,010 15,448,774 14,982,010
Documentary Credits 1,559,634 1,450,184 1,559,634 1,450,184
Acceptances 510,855 505,130 510,855 505,130
Bills for collection 1,323,699 917,109 1,323,699 917,109
Commitments 106,160,767 84,367,895 106,160,767 84,367,895
Undrawn commitments 105,832,699 84,039,827 105,832,699 84,039,827
Capital commitments 328,068 328,068 328,068 328,068
Sub Total 164,983,767 138,187,477 164,983,767 138,187,477
By product - Foreign Currency
Contingencies 492,514,409 417,116,282 491,356,068 416,805,102
Guarantees 23,790,387 22,654,559 23,660,732 22,498,571
Bonds 17,731,224 23,722,626 17,548,402 23,624,877
Documentary Credits 62,604,599 50,911,486 61,869,502 50,867,623
Forward exchange and Currency Swaps 296,778,265 246,399,958 296,778,265 246,399,958
Acceptances 51,729,676 43,513,040 51,722,130 43,502,686
Bills for collection 38,286,540 28,355,879 38,183,319 28,352,653
Bullion on consignment 14,400 11,344 14,400 11,344
Other Contingencies 1,579,318 1,547,390 1,579,318 1,547,390
Commitments 23,045,131 25,658,048 22,039,933 25,006,694
Undrawn commitments 22,569,795 25,636,281 22,039,933 25,006,694
Capital commitments 475,336 21,767 - -
Sub Total 515,559,540 442,774,330 513,396,001 441,811,796
Total 680,543,307 580,961,807 678,379,768 579,999,273
ANALYSIS OF COMMITMENTS AND CONTINGENCIES AND IMPAIRMENT
Group Bank
23
2020 2019 2020 2019
( Audited ) ( Audited )
Rs.'000 Rs.'000 Rs.'000 Rs.'000
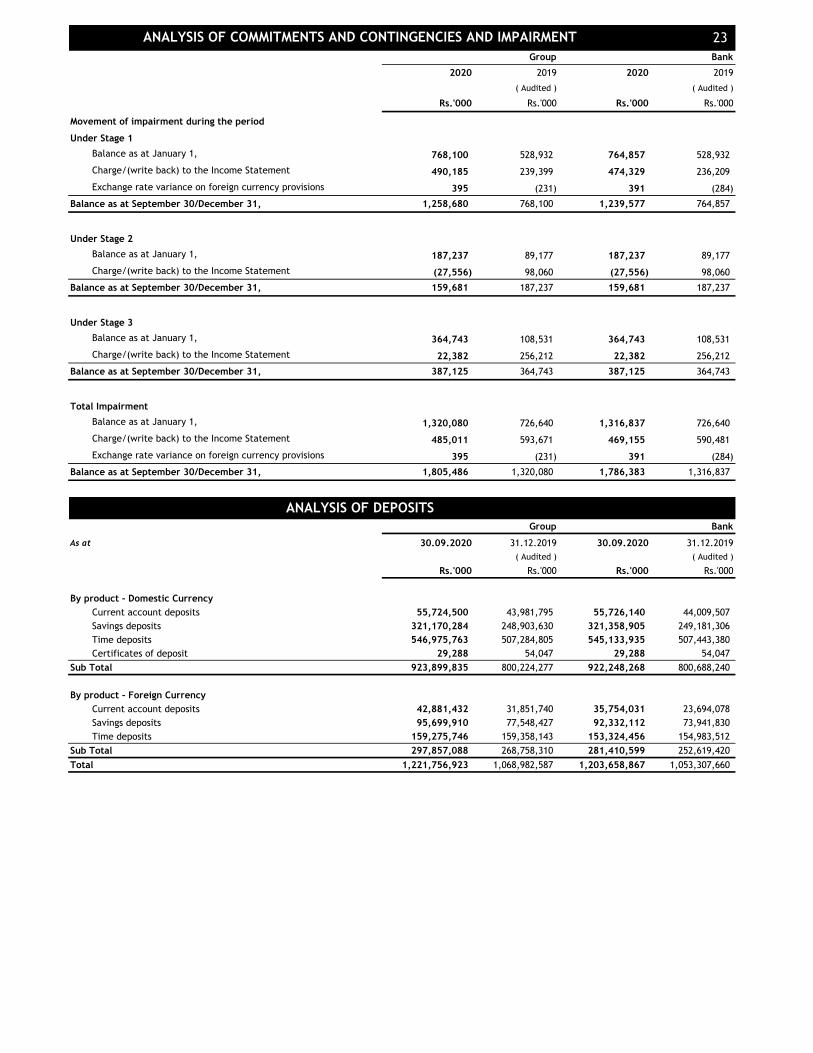
Movement of impairment during the period
Under Stage 1
Balance as at January 1, 768,100 528,932 764,857 528,932
Charge/(write back) to the Income Statement 490,185 239,399 474,329 236,209
Exchange rate variance on foreign currency provisions 395 (231) 391 (284)
Balance as at September 30/December 31, 1,258,680 768,100 1,239,577 764,857
Under Stage 2
Balance as at January 1, 187,237 89,177 187,237 89,177
Charge/(write back) to the Income Statement (27,556) 98,060 (27,556) 98,060
Balance as at September 30/December 31, 159,681 187,237 159,681 187,237
Under Stage 3
Balance as at January 1, 364,743 108,531 364,743 108,531
Charge/(write back) to the Income Statement 22,382 256,212 22,382 256,212
Balance as at September 30/December 31, 387,125 364,743 387,125 364,743
Total Impairment
Balance as at January 1, 1,320,080 726,640 1,316,837 726,640
Charge/(write back) to the Income Statement 485,011 593,671 469,155 590,481
Exchange rate variance on foreign currency provisions 395 (231) 391 (284)
Balance as at September 30/December 31, 1,805,486 1,320,080 1,786,383 1,316,837
Group Bank
As at 30.09.2020 31.12.2019 30.09.2020 31.12.2019
( Audited ) ( Audited )
Rs.'000 Rs.'000 Rs.'000 Rs.'000
By product - Domestic Currency
Current account deposits 55,724,500 43,981,795 55,726,140 44,009,507
Savings deposits 321,170,284 248,903,630 321,358,905 249,181,306
Time deposits 546,975,763 507,284,805 545,133,935 507,443,380
Certificates of deposit 29,288 54,047 29,288 54,047
Sub Total 923,899,835 800,224,277 922,248,268 800,688,240
By product - Foreign Currency
Current account deposits 42,881,432 31,851,740 35,754,031 23,694,078
Savings deposits 95,699,910 77,548,427 92,332,112 73,941,830
Time deposits 159,275,746 159,358,143 153,324,456 154,983,512
Sub Total 297,857,088 268,758,310 281,410,599 252,619,420
Total 1,221,756,923 1,068,982,587 1,203,658,867 1,053,307,660
ANALYSIS OF DEPOSITS
ANALYSIS OF COMMITMENTS AND CONTINGENCIES AND IMPAIRMENT
Group Bank
24
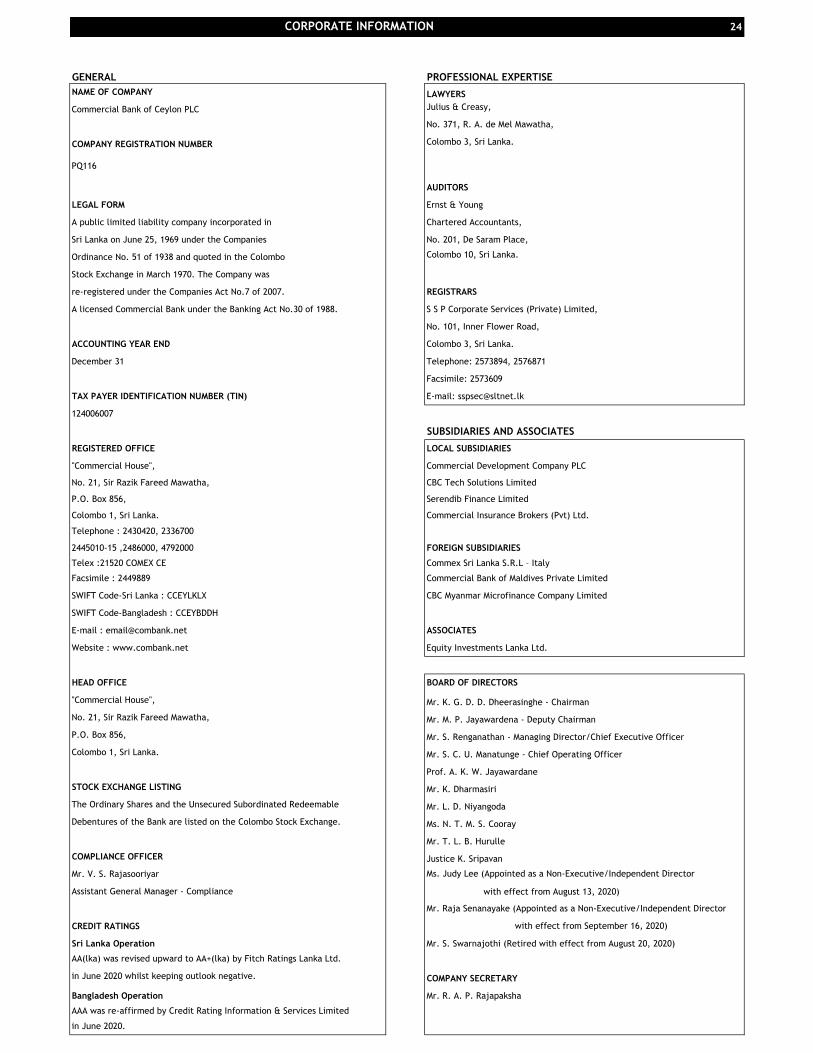
GENERAL PROFESSIONAL EXPERTISE
NAME OF COMPANY LAWYERS
Commercial Bank of Ceylon PLC Julius & Creasy,
No. 371, R. A. de Mel Mawatha,
COMPANY REGISTRATION NUMBER Colombo 3, Sri Lanka.
PQ116
AUDITORS
LEGAL FORM Ernst & Young
A public limited liability company incorporated in Chartered Accountants,
Sri Lanka on June 25, 1969 under the Companies No. 201, De Saram Place,
Ordinance No. 51 of 1938 and quoted in the Colombo Colombo 10, Sri Lanka.
Stock Exchange in March 1970. The Company was
re-registered under the Companies Act No.7 of 2007. REGISTRARS
A licensed Commercial Bank under the Banking Act No.30 of 1988. S S P Corporate Services (Private) Limited,
No. 101, Inner Flower Road,
ACCOUNTING YEAR END Colombo 3, Sri Lanka.
December 31 Telephone: 2573894, 2576871
Facsimile: 2573609
TAX PAYER IDENTIFICATION NUMBER (TIN) E-mail: [email protected]
124006007
SUBSIDIARIES AND ASSOCIATES
REGISTERED OFFICE LOCAL SUBSIDIARIES
"Commercial House", Commercial Development Company PLC
No. 21, Sir Razik Fareed Mawatha, CBC Tech Solutions Limited
P.O. Box 856, Serendib Finance Limited
Colombo 1, Sri Lanka. Commercial Insurance Brokers (Pvt) Ltd.
Telephone : 2430420, 2336700
2445010-15 ,2486000, 4792000 FOREIGN SUBSIDIARIES
Telex :21520 COMEX CE Commex Sri Lanka S.R.L – Italy
Facsimile : 2449889 Commercial Bank of Maldives Private Limited
SWIFT Code-Sri Lanka : CCEYLKLX CBC Myanmar Microfinance Company Limited
SWIFT Code-Bangladesh : CCEYBDDH
E-mail : [email protected] ASSOCIATES
Website : www.combank.net Equity Investments Lanka Ltd.
HEAD OFFICE BOARD OF DIRECTORS
"Commercial House", Mr. K. G. D. D. Dheerasinghe - Chairman
No. 21, Sir Razik Fareed Mawatha, Mr. M. P. Jayawardena - Deputy Chairman
P.O. Box 856, Mr. S. Renganathan - Managing Director/Chief Executive Officer
Colombo 1, Sri Lanka. Mr. S. C. U. Manatunge - Chief Operating Officer
Prof. A. K. W. Jayawardane
STOCK EXCHANGE LISTING Mr. K. Dharmasiri
The Ordinary Shares and the Unsecured Subordinated Redeemable Mr. L. D. Niyangoda
Debentures of the Bank are listed on the Colombo Stock Exchange. Ms. N. T. M. S. Cooray
Mr. T. L. B. Hurulle
COMPLIANCE OFFICER Justice K. Sripavan
Mr. V. S. Rajasooriyar
Assistant General Manager - Compliance with effect from August 13, 2020)
CREDIT RATINGS
Sri Lanka Operation Mr. S. Swarnajothi (Retired with effect from August 20, 2020)
AA(lka) was revised upward to AA+(lka) by Fitch Ratings Lanka Ltd.
in June 2020 whilst keeping outlook negative. COMPANY SECRETARY
Bangladesh Operation Mr. R. A. P. Rajapaksha
AAA was re-affirmed by Credit Rating Information & Services Limited
in June 2020.
CORPORATE INFORMATION
Ms. Judy Lee (Appointed as a Non-Executive/Independent Director
Mr. Raja Senanayake (Appointed as a Non-Executive/Independent Director
with effect from September 16, 2020)