Embed Size (px)
Citation preview
Interim Financial Statements ended
June 30, 2017
IFRS
Luxottica Group S.p.A.Piazzale Luigi Cadorna, 3, 20123 Milan, Italy Tax Code and Milan Companies Register no. 00891030272 - VAT registration number 10182640150
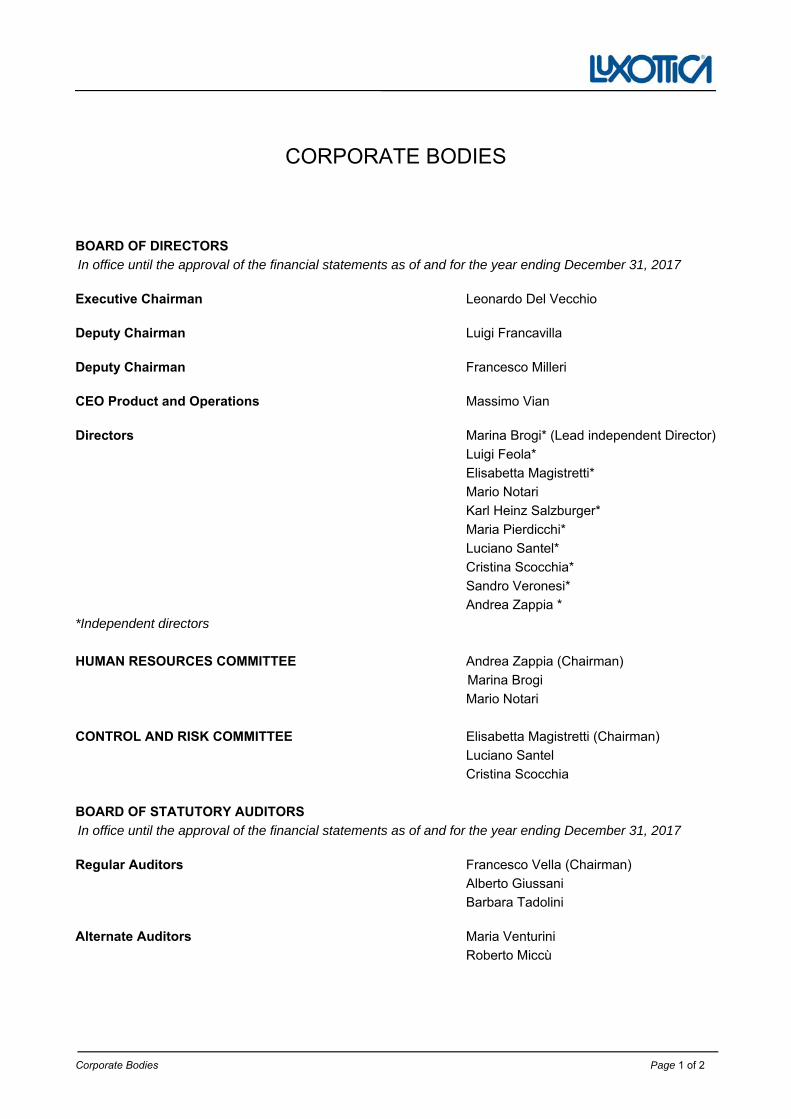
CORPORATE BODIES
Corporate Bodies Page 1 of 2
BOARD OF DIRECTORS
In office until the approval of the financial statements as of and for the year ending December 31, 2017
Executive Chairman Leonardo Del Vecchio
Deputy Chairman Luigi Francavilla
Deputy Chairman Francesco Milleri
CEO Product and Operations Massimo Vian
Directors Marina Brogi* (Lead independent Director)
Luigi Feola*
Elisabetta Magistretti*
Mario Notari
Karl Heinz Salzburger*
Maria Pierdicchi*
Luciano Santel*
Cristina Scocchia*
Sandro Veronesi*
Andrea Zappia *
*Independent directors
HUMAN RESOURCES COMMITTEE Andrea Zappia (Chairman)
Marina Brogi
Mario Notari
CONTROL AND RISK COMMITTEE Elisabetta Magistretti (Chairman)
Luciano Santel
Cristina Scocchia
BOARD OF STATUTORY AUDITORS
In office until the approval of the financial statements as of and for the year ending December 31, 2017
Regular Auditors Francesco Vella (Chairman)
Alberto Giussani
Barbara Tadolini
Alternate Auditors Maria Venturini
Roberto Miccù

CORPORATE BODIES
Corporate Bodies Page 2 of 2
OFFICER RESPONSIBLE FOR PREPARING THE COMPANY’S FINANCIAL REPORTS
Stefano Grassi
INDEPENDENT AUDITORS PricewaterhouseCoopers SpA Until approval of the financial statements as of and for the year ending December 31, 2020
1. MANAGEMENT REPORT ON THE INTERIM FINANCIAL RESULTS AS OFJUNE 30, 2017
Statements of consolidated cash flows and explanatory notes
2. CONDENSED CONSOLIDATED FINANCIAL STATEMENTS AS OF JUNE30, 2017
3. NOTES TO THE CONDENSED CONSOLIDATED FINANCIALSTATEMENTS AS OF JUNE 30, 2017
4. ATTACHMENTS
5. CERTIFICATION OF THE CONDENSED CONSOLIDATED FINANCIALSTATEMENTS AS OF JUNE 30, 2017
6. INDEPENDENT AUDITORS’ REPORT
INDEX
Luxottica Group S.p.A. Piazzale Luigi Cadorna, 3, 20123 Milan, Italy Tax Code and Milan Companies Register no. 00891030272 - VAT registration number 10182640150
MANAGEMENT REPORT ON THE INTERIM
FINANCIAL RESULTS AS OF JUNE 30, 2017
Luxottica Group S.p.A. Headquarters and registered office: Piazzale Luigi Cadorna, 3, 20123 Milan, Italy
Capital Stock € 29.096.245,26 authorized and issued
MANAGEMENT REPORT ON THE INTERIM FINANCIAL RESULTS AS OF JUNE 30, 2017
Management Report on the Interim Financial Results as of June 30, 2017 Page 1 of 24
The following should be read in connection with the disclosure contained in the consolidated financial statements as of December 31, 2016, which includes a discussion of risks and uncertainties that can influence the Group’s operational results or financial position. During the first six months of 2017, there were no changes to risks that were reported as of December 31, 2016.
The Group’s reporting currency for the presentation of the Consolidated Financial Statements is the Euro. Unless otherwise specified, the figures in the Statements and within the Notes to the Consolidated Financial Statements are expressed in thousands of Euro.
1. OPERATING PERFORMANCE
The Group’s growth trend continued in the first six months of 2017. Despite the generally more challenging global macroeconomic context, net sales increased by 4.2% (1.8% at constant exchange rates1) reaching Euro 4,917.3 million, compared to Euro 4,719.4 million in the same period of 2016.
The main performance indicators, summarized below, also showed substantial improvement over the first six months of 2016.
EBITDA2 increased by 10.4% to Euro 1,145.0 million, up from Euro 1,037.1 million in the first six months of 2016. Adjusted EBITDA2 increased by Euro 70.2 million, or 6.3%, from Euro 1,105.6 to Euro 1,175.7 in the first six months of 2017.
Income from operations increased by 10.1%, reaching Euro 867.9 million, up from Euro 788.1 million in the first six months of 2016, while the operating margin for the first six months of 2017 was equal to 17.6%, up from 16.7% in the same period of the previous year.
Adjusted income from operations3 increased by 4.9% to Euro 898.6 million compared to Euro 856.6 million in the first six months of 2016 while the adjusted operating margin4 for the first six months of 2017 was equal to 18.3%, an increase from 18.2% in the same period of the previous year.
1 We calculate constant exchange rates by applying to the current period the average exchange rates between the Euro and the relevant currencies of the various markets in which we operated during the six-month period ended June 30, 2016. Please refer to Attachment 1 for further details on exchange rates. 2 For a further discussion of EBITDA and adjusted EBITDA, see Appendix—Non-IFRS Measures. 3 For a further discussion of adjusted income from operations, see Appendix—Non-IFRS Measures. 4 For a further discussion of adjusted operating margin, see Appendix—Non-IFRS Measures.
Management Report on the Interim Financial Results as of June 30, 2017 Page 2 of 24
In the first six months of 2017, net income attributable to Luxottica Stockholders increased by 18.1% percent to Euro 561.6 million from Euro 475.7 million in the same period of 2016. Adjusted net income attributable to the Group5 increased by 6.7% from Euro 531.5 million to Euro 567.0 million.
Earnings per share (EPS) came in at Euro 1.18, while EPS in US dollars amounted to USD 1.27. Adjusted EPS6 was equal to Euro 1.19 while adjusted EPS6 in dollars was equal to USD 1.29 (average USD/EUR exchange rate of 1.0830).
Also in the first six months of 2017, careful control of our working capital resulted in strong free cash flow7 generation equal to Euro 535.0 million. Net debt as of June 30, 2017 was Euro 1,113.1 million (Euro 1,177.0 million as at December 31, 2016), with a ratio of net debt to EBITDA8 of 0.6x (0.6x as of December 31, 2016).
2. SIGNIFICANT EVENTS IN 2017
January
On January 16, 2017, Essilor International S.A. (“Essilor”) and Delfin S.à r.l. (“Delfin”) announced the strategic combination of Essilor and Luxottica (the “Combination”) through: (i) the contribution from Delfin to Essilor of its holding equal to 62.45% of current Luxottica share capital (the “Holding”) against the assignment of newly issued Essilor shares (the “Contribution”, upon the execution of which Essilor will be renamed "EssilorLuxottica”); and (ii) the subsequent mandatory public exchange offer by EssilorLuxottica, pursuant to the Italian Law, of all outstanding Luxottica shares at the same exchange rate.
Following the Contribution Delfin would own a shareholding comprised between 31% and 38% of the share capital of EssilorLuxottica and, depending on the level of acceptance of the exchange offer, would be its largest shareholder.
The Board of Directors of Luxottica unanimously acknowledged that the transaction is in the best interest of Luxottica and shared the strategic rationale of the Combination.
The Essilor Shareholders’ Meeting, which met on May 11, 2017, also approved the Contribution, the capital increase with the issue of new shares for the exchange offer, as well as certain amendments to the company by-laws including, inter alia: (i) a cap at 31% of voting rights applying to any shareholder, and (ii) the elimination of double voting rights previously envisaged by the by-laws of Essilor. At present, the completion of the transaction is pending authorization by the relevant antitrust authorities.
As regards to the governance of EssilorLuxottica, for the three-year period following the transfer, Luxottica’s Executive Chairman, Leonardo Del Vecchio, would serve as Executive Chairman and CEO of EssilorLuxottica. Essilor’s Chairman and CEO, Hubert Sagnières, would serve as Executive Vice Chairman and Deputy CEO of EssilorLuxottica, with equal powers to those of the Executive Chairman and CEO.
5 For a further discussion of adjusted net income attributable to Luxottica Stockholders, see Appendix—Non-IFRS Measures. 6 For a further discussion of adjusted EPS, see Appendix—Non-IFRS Measures. 7 For a further discussion of free cash flow, see Appendix—Non-IFRS Measures. 8 For a further discussion of the ratio of net debt/EBITDA, see Appendix—Non-IFRS Measures.
Management Report on the Interim Financial Results as of June 30, 2017 Page 3 of 24
As regards to Luxottica, Leonardo Del Vecchio would act as director with executive powers of Luxottica for as long as he is EssilorLuxottica Executive Chairman (or may designate any other person to act as chief executive officer of Luxottica). Upon the conclusion of the Combination, the Board of Directors of EssilorLuxottica will consist of sixteen members and notably, according to the resolutions of the aforementioned Essilor Shareholders’ Meeting held on May 11, 2017:
Leonardo Del Vecchio, Executive Chairman and CEO of EssilorLuxottica; Hubert Sagnières, Deputy Executive Chairman and Deputy CEO of EssilorLuxottica; Three representatives of Delfin: Romolo Bardin, Giovanni Giallombardo and Francesco Milleri; Four indipendent directors designated by Delfin: Rafaella Mazzoli, Gianni Mion, Lucia Morselli and
Cristina Scocchia; Two directors representing Essilor employees who will be appointed by the Works Council by the
end of October 2017; Juliette Favre, Essilor employee shareholders representative and Chairman of Valoptec Association,
an employee shareholders organization of Essilor; Four directors from the current Board of Directors of Essilor: Henrietta Fore, Bernard Hours, Annette
Messemer and Olivier Pécoux.
The completion of the transaction is expected around the end of the year, subject to authorization by the relevant antitrust authority.
On January 29, 2017, the notes issued by Luxottica U.S. Holdings on January 29, 2010 were repaid at maturity. For further discussion see Note 22—Long-term debt.
On January 30, 2017, the Board of Directors of Luxottica Group authorized the early repayment of the notes issued by Luxottica U.S. Holdings on December 15, 2011. This repayment took place on April 10, 2017. For further discussion see Note 22—Long-term debt.
On January 30, 2017, the Luxottica Group signed an agreement with the shareholders of Óticas Carol for the purchase of 100% of one of the most important optics franchise chains in Brazil with approximately 950 stores. Established in 1997, Óticas Carol offers a wide range of eyeglasses and sunglasses. On July 6, 2017, the subsidiary Luxottica Brasil Produtos Oticos e Esportivos Ltda acquired 100% of the share capital of the Brazilian company Orange County Participaçoes S.A., owner of the Óticas Carol retail chain. The newly acquired Brazilian company also controls six companies based in Brazil. Luxottica Group S.p.A. thus informed CONSOB of its adjustment plan pursuant to Article 36-39 of the Market Regulation and, for the companies that do not benefit from the exemption under Article 36, paragraph 2, of the Regulation, will provide evidence as regards to the adaptation of accounting information published pursuant to CONSOB Regulation No. 11971/1999. For further discussion see Note 36 of the Notes to the Condensed Consolidated Financial Statements as of June 30, 2017.
February
On February 9, 2017, the loans and credit revolving facilities arising from the acquisition of Salmoiraghi & Viganò were respectively repaid and cancelled in advance, as was the pledge of trademarks. For further discussion see Note 22—Long-term debt.
On February 23, 2017, the Luxottica Group consolidated its cooperation with Ferrari S.p.A., announcing the signing of a multi-year licensing contract for the development, production and marketing of an eyewear product range featuring the Ferrari and Ray-Ban brands.
On February 24, 2017, the French Antitrust Authority informed the Company of its decision regarding the proceedings mentioned in paragraph 29.
Management Report on the Interim Financial Results as of June 30, 2017 Page 4 of 24
March
On March 10, 2017, the Luxottica Group signed two term facility agreements worth a total of Euro 250 million each, guaranteed by the subsidiary Luxottica U.S. Holdings Corp. The agreements were signed with Banca IMI S.p.A./Intesa San Paolo, in the role of mandated lead arranger and original lender, respectively (“IMI/Intesa facility”) and with Natixis S.A. – Milan Branch in the role of both mandated lead arranger and original lender. The maturity of both agreements is March 10, 2022. In execution of the agreements, on March 10, 2017, Euro 500 million was financed at the EURIBOR interest rate plus an average spread of 0.70% and 0.62% for the IMI/Intensa facility and the Natixis Facility, respectively. In March 2017, two derivative contracts for interest rate hedging were signed for an aggregate notional value of Euro 500 million, with Intesa San Paolo S.p.A. and Natixis S.A. – Milan Branch, respectively. These contracts are cash flow hedges that fix the EURIBOR rate at an average value of 0.1185% per year.
April
At the Stockholders’ Meeting on April 28, 2017, the Group’s Stockholders approved the Statutory Financial Statements as at December 31, 2016, as proposed by the Board of Directors, and the distribution of a cash dividend of Euro 0.92 per ordinary share. The aggregate dividend amount of Euro 439.7 million was fully paid in May 2017.
May
On May 16, 2017, the Board of Directors of Luxottica Group S.p.A. decided to initiate the delisting procedure for the American Depositary Shares (ADS) represented by American Depositary Receipts (ADR) from the New York Stock Exchange.
On May 16, 2017, the Board of Directors of Luxottica Group S.p.A., with regard to the planned combination with Essilor and in view of the changed context resulting therefrom, also approved certain changes to the Stock Option and Performance Share Plans. The changes to the Stock Option Plan concern the anticipation of the term within which the options may be exercised, in consideration of the exchange offer. As regards the Performance Shares Plan, in accordance with the Regulation approved by the Shareholders’ Meeting, the Board resolved to recalibrate its performance targets and to anticipate allocation before the end of the 2015-2017 reference period. Certain changes to the plans are subject to the launch of the exchange offer by Essilor.
3. FINANCIAL RESULTS OF THE GROUP
We are a market leader in the design, manufacture and distribution of fashion, luxury, sport and performance eyewear, with net sales reaching over Euro 9.1 billion in 2016, approximately 80,000 employees and a strong global presence. The Group operates in two segments, which make up sales: (i) manufacturing and wholesale distribution (hereinafter also “Manufacturing & Wholesale” or “Wholesale”); and (ii) retail distribution (hereinafter also “Retail”). See Note 5 of the Notes to the Consolidated Financial Statements as of June 30, 2017 for additional disclosures about our operating segments.
Through our wholesale distribution segment, we are engaged in the design, manufacture, wholesale distribution and marketing of mid- to premium-priced prescription frames and sunglasses, with both own brands and licensed brands. We operate our retail distribution segment principally through our own chains, which include, among others, LensCrafters, Sunglass Hut, OPSM, Pearle Vision, Laubman and Pank, Oakley ‘‘O’’ Stores and Vaults, David Clulow, GMO, Salmoiraghi & Viganò and our Licensed Brands (Sears Optical and Target Optical).
Management Report on the Interim Financial Results as of June 30, 2017 Page 5 of 24
As a result of our numerous acquisitions and the subsequent expansion of our business activities in the United States through these acquisitions, our results of operations, which are reported in Euro, are susceptible to currency rate fluctuations between the Euro and the U.S. dollar. The Euro/U.S. dollar exchange rate has fluctuated to an average exchange rate of Euro 1.00 = USD 1.0830 in the first six months of 2017 from Euro 1.00 = USD 1.1159 in the first six months of 2016. The Group’s results of operations are susceptible to currency fluctuations between the Euro and the Australian Dollar, as well, due to the strong presence of the retail division in Australia. Additionally, we incur part of our manufacturing costs in Chinese Yuan; therefore, the fluctuation of the Chinese Yuan could impact the demand of our products or our consolidated profitability. The Group does not engage in long-term hedging activities to mitigate translation risk. This discussion should be read in conjunction with the risk factor discussion in Section 8 of the Annual Report as at December 31, 2016.
Management Report on the Interim Financial Results as of June 30, 2017 Page 6 of 24
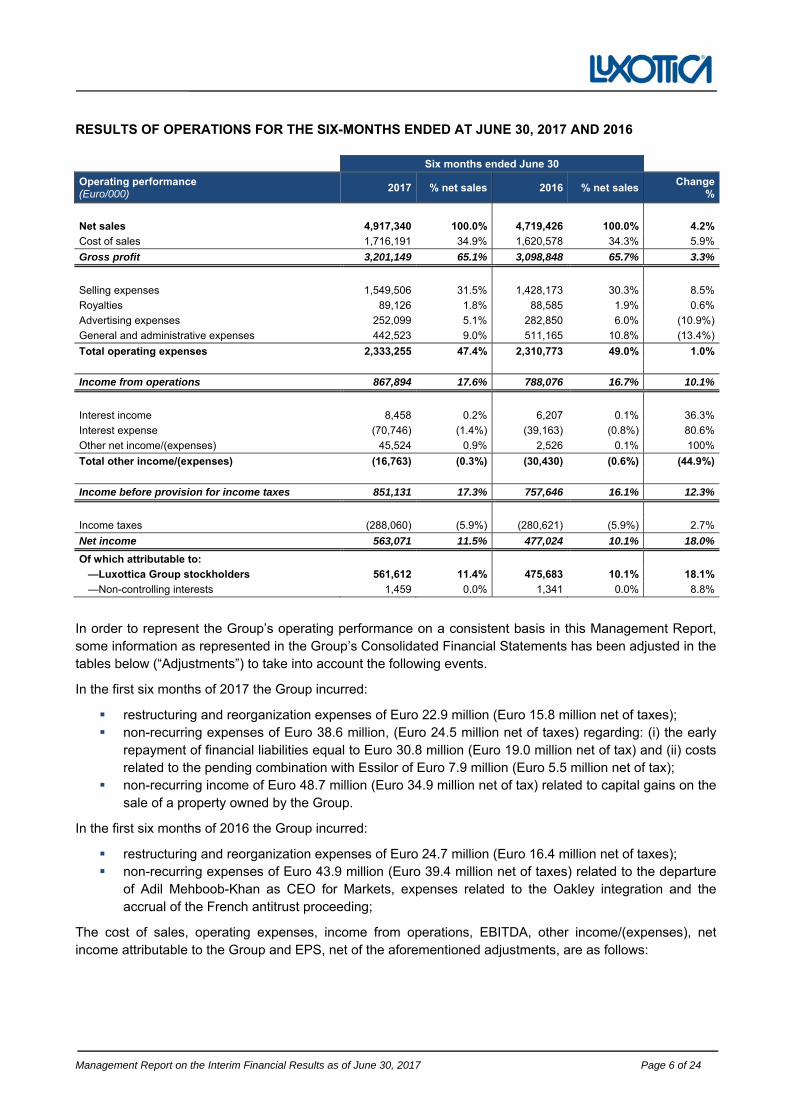
RESULTS OF OPERATIONS FOR THE SIX-MONTHS ENDED AT JUNE 30, 2017 AND 2016
Six months ended June 30
Operating performance (Euro/000)
2017 % net sales 2016 % net sales Change
%
Net sales 4,917,340 100.0% 4,719,426 100.0% 4.2%
Cost of sales 1,716,191 34.9% 1,620,578 34.3% 5.9%
Gross profit 3,201,149 65.1% 3,098,848 65.7% 3.3%
Selling expenses 1,549,506 31.5% 1,428,173 30.3% 8.5%
Royalties 89,126 1.8% 88,585 1.9% 0.6%
Advertising expenses 252,099 5.1% 282,850 6.0% (10.9%)
General and administrative expenses 442,523 9.0% 511,165 10.8% (13.4%)
Total operating expenses 2,333,255 47.4% 2,310,773 49.0% 1.0%
Income from operations 867,894 17.6% 788,076 16.7% 10.1%
Interest income 8,458 0.2% 6,207 0.1% 36.3%
Interest expense (70,746) (1.4%) (39,163) (0.8%) 80.6%
Other net income/(expenses) 45,524 0.9% 2,526 0.1% 100%
Total other income/(expenses) (16,763) (0.3%) (30,430) (0.6%) (44.9%)
Income before provision for income taxes 851,131 17.3% 757,646 16.1% 12.3%
Income taxes (288,060) (5.9%) (280,621) (5.9%) 2.7%
Net income 563,071 11.5% 477,024 10.1% 18.0%
Of which attributable to:
—Luxottica Group stockholders 561,612 11.4% 475,683 10.1% 18.1%
—Non-controlling interests 1,459 0.0% 1,341 0.0% 8.8%
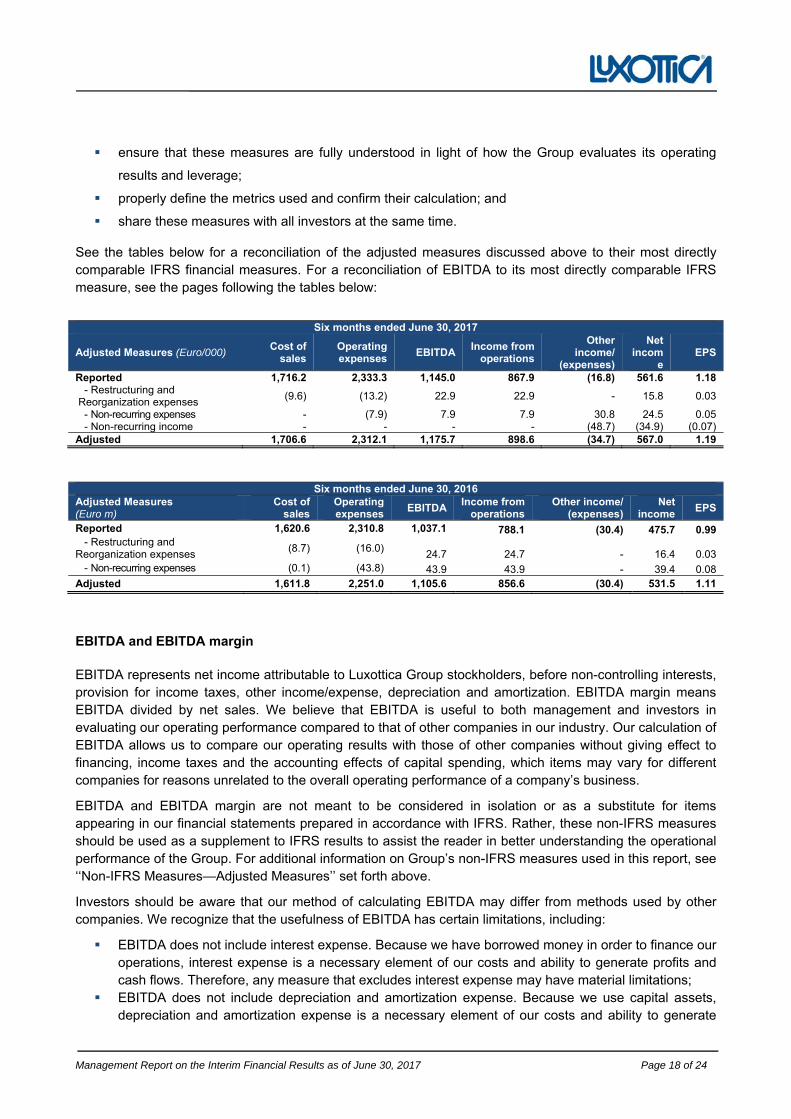
In order to represent the Group’s operating performance on a consistent basis in this Management Report, some information as represented in the Group’s Consolidated Financial Statements has been adjusted in the tables below (“Adjustments”) to take into account the following events.
In the first six months of 2017 the Group incurred:
restructuring and reorganization expenses of Euro 22.9 million (Euro 15.8 million net of taxes); non-recurring expenses of Euro 38.6 million, (Euro 24.5 million net of taxes) regarding: (i) the early
repayment of financial liabilities equal to Euro 30.8 million (Euro 19.0 million net of tax) and (ii) costsrelated to the pending combination with Essilor of Euro 7.9 million (Euro 5.5 million net of tax);
non-recurring income of Euro 48.7 million (Euro 34.9 million net of tax) related to capital gains on thesale of a property owned by the Group.
In the first six months of 2016 the Group incurred:
restructuring and reorganization expenses of Euro 24.7 million (Euro 16.4 million net of taxes); non-recurring expenses of Euro 43.9 million (Euro 39.4 million net of taxes) related to the departure
of Adil Mehboob-Khan as CEO for Markets, expenses related to the Oakley integration and theaccrual of the French antitrust proceeding;
The cost of sales, operating expenses, income from operations, EBITDA, other income/(expenses), net income attributable to the Group and EPS, net of the aforementioned adjustments, are as follows:
Management Report on the Interim Financial Results as of June 30, 2017 Page 7 of 24
Six months ended June 30
(Euro m) 2017 % net sales 2016 % net sales Change
%
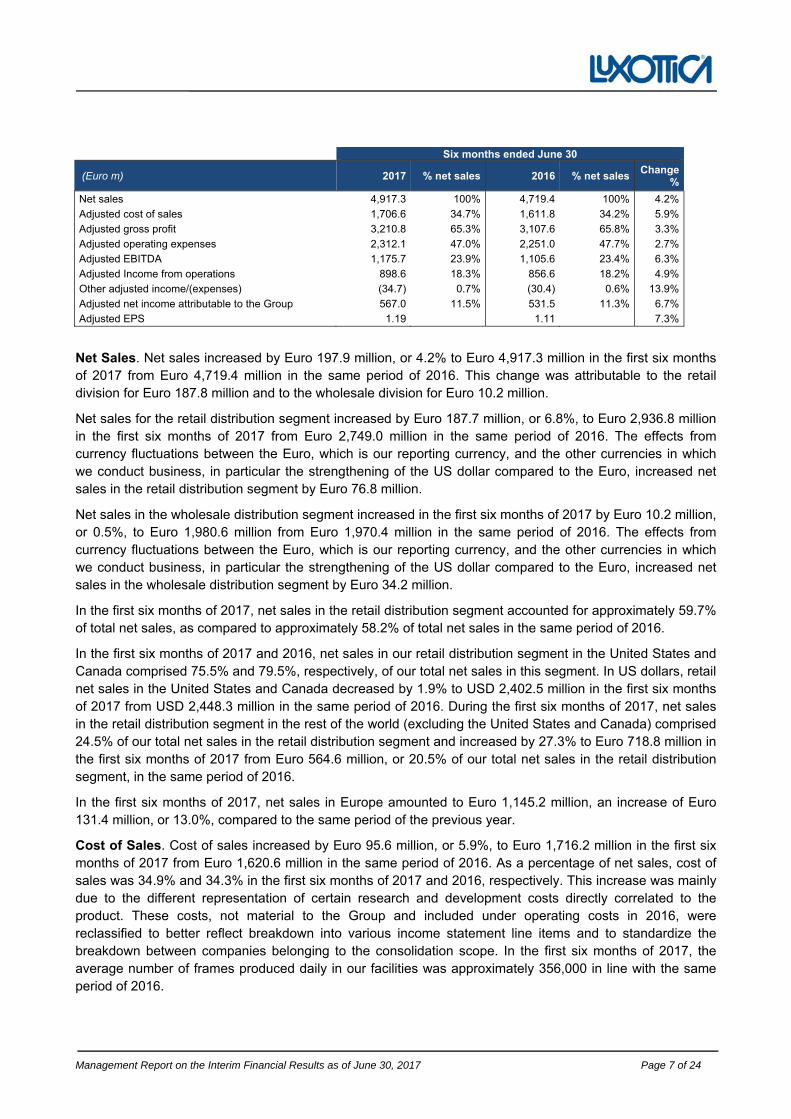
Net sales 4,917.3 100% 4,719.4 100% 4.2%
Adjusted cost of sales 1,706.6 34.7% 1,611.8 34.2% 5.9%
Adjusted gross profit 3,210.8 65.3% 3,107.6 65.8% 3.3%
Adjusted operating expenses 2,312.1 47.0% 2,251.0 47.7% 2.7%
Adjusted EBITDA 1,175.7 23.9% 1,105.6 23.4% 6.3%
Adjusted Income from operations 898.6 18.3% 856.6 18.2% 4.9%
Other adjusted income/(expenses) (34.7) 0.7% (30.4) 0.6% 13.9%
Adjusted net income attributable to the Group 567.0 11.5% 531.5 11.3% 6.7%
Adjusted EPS 1.19 1.11 7.3%
Net Sales. Net sales increased by Euro 197.9 million, or 4.2% to Euro 4,917.3 million in the first six months of 2017 from Euro 4,719.4 million in the same period of 2016. This change was attributable to the retail division for Euro 187.8 million and to the wholesale division for Euro 10.2 million.
Net sales for the retail distribution segment increased by Euro 187.7 million, or 6.8%, to Euro 2,936.8 million in the first six months of 2017 from Euro 2,749.0 million in the same period of 2016. The effects from currency fluctuations between the Euro, which is our reporting currency, and the other currencies in which we conduct business, in particular the strengthening of the US dollar compared to the Euro, increased net sales in the retail distribution segment by Euro 76.8 million.
Net sales in the wholesale distribution segment increased in the first six months of 2017 by Euro 10.2 million, or 0.5%, to Euro 1,980.6 million from Euro 1,970.4 million in the same period of 2016. The effects from currency fluctuations between the Euro, which is our reporting currency, and the other currencies in which we conduct business, in particular the strengthening of the US dollar compared to the Euro, increased net sales in the wholesale distribution segment by Euro 34.2 million.
In the first six months of 2017, net sales in the retail distribution segment accounted for approximately 59.7% of total net sales, as compared to approximately 58.2% of total net sales in the same period of 2016.
In the first six months of 2017 and 2016, net sales in our retail distribution segment in the United States and Canada comprised 75.5% and 79.5%, respectively, of our total net sales in this segment. In US dollars, retail net sales in the United States and Canada decreased by 1.9% to USD 2,402.5 million in the first six months of 2017 from USD 2,448.3 million in the same period of 2016. During the first six months of 2017, net sales in the retail distribution segment in the rest of the world (excluding the United States and Canada) comprised 24.5% of our total net sales in the retail distribution segment and increased by 27.3% to Euro 718.8 million in the first six months of 2017 from Euro 564.6 million, or 20.5% of our total net sales in the retail distribution segment, in the same period of 2016.
In the first six months of 2017, net sales in Europe amounted to Euro 1,145.2 million, an increase of Euro 131.4 million, or 13.0%, compared to the same period of the previous year.
Cost of Sales. Cost of sales increased by Euro 95.6 million, or 5.9%, to Euro 1,716.2 million in the first six months of 2017 from Euro 1,620.6 million in the same period of 2016. As a percentage of net sales, cost of sales was 34.9% and 34.3% in the first six months of 2017 and 2016, respectively. This increase was mainly due to the different representation of certain research and development costs directly correlated to the product. These costs, not material to the Group and included under operating costs in 2016, were reclassified to better reflect breakdown into various income statement line items and to standardize the breakdown between companies belonging to the consolidation scope. In the first six months of 2017, the average number of frames produced daily in our facilities was approximately 356,000 in line with the same period of 2016.
Management Report on the Interim Financial Results as of June 30, 2017 Page 8 of 24
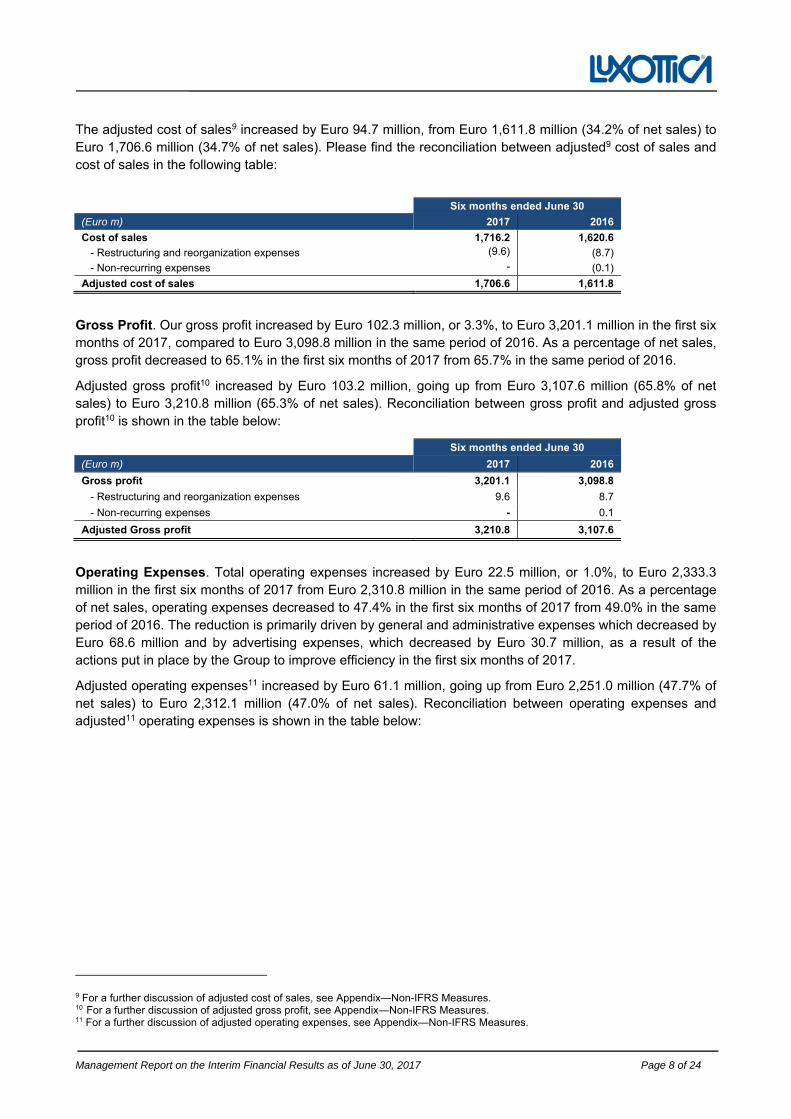
The adjusted cost of sales9 increased by Euro 94.7 million, from Euro 1,611.8 million (34.2% of net sales) to Euro 1,706.6 million (34.7% of net sales). Please find the reconciliation between adjusted9 cost of sales and cost of sales in the following table:
Six months ended June 30
(Euro m) 2017 2016
Cost of sales 1,716.2 1,620.6
- Restructuring and reorganization expenses (9.6) (8.7)
- Non-recurring expenses - (0.1)
Adjusted cost of sales 1,706.6 1,611.8
Gross Profit. Our gross profit increased by Euro 102.3 million, or 3.3%, to Euro 3,201.1 million in the first six months of 2017, compared to Euro 3,098.8 million in the same period of 2016. As a percentage of net sales, gross profit decreased to 65.1% in the first six months of 2017 from 65.7% in the same period of 2016.
Adjusted gross profit10 increased by Euro 103.2 million, going up from Euro 3,107.6 million (65.8% of net sales) to Euro 3,210.8 million (65.3% of net sales). Reconciliation between gross profit and adjusted gross profit10 is shown in the table below:
Six months ended June 30
(Euro m) 2017 2016
Gross profit 3,201.1 3,098.8
- Restructuring and reorganization expenses 9.6 8.7
- Non-recurring expenses - 0.1
Adjusted Gross profit 3,210.8 3,107.6
Operating Expenses. Total operating expenses increased by Euro 22.5 million, or 1.0%, to Euro 2,333.3 million in the first six months of 2017 from Euro 2,310.8 million in the same period of 2016. As a percentage of net sales, operating expenses decreased to 47.4% in the first six months of 2017 from 49.0% in the same period of 2016. The reduction is primarily driven by general and administrative expenses which decreased by Euro 68.6 million and by advertising expenses, which decreased by Euro 30.7 million, as a result of the actions put in place by the Group to improve efficiency in the first six months of 2017.
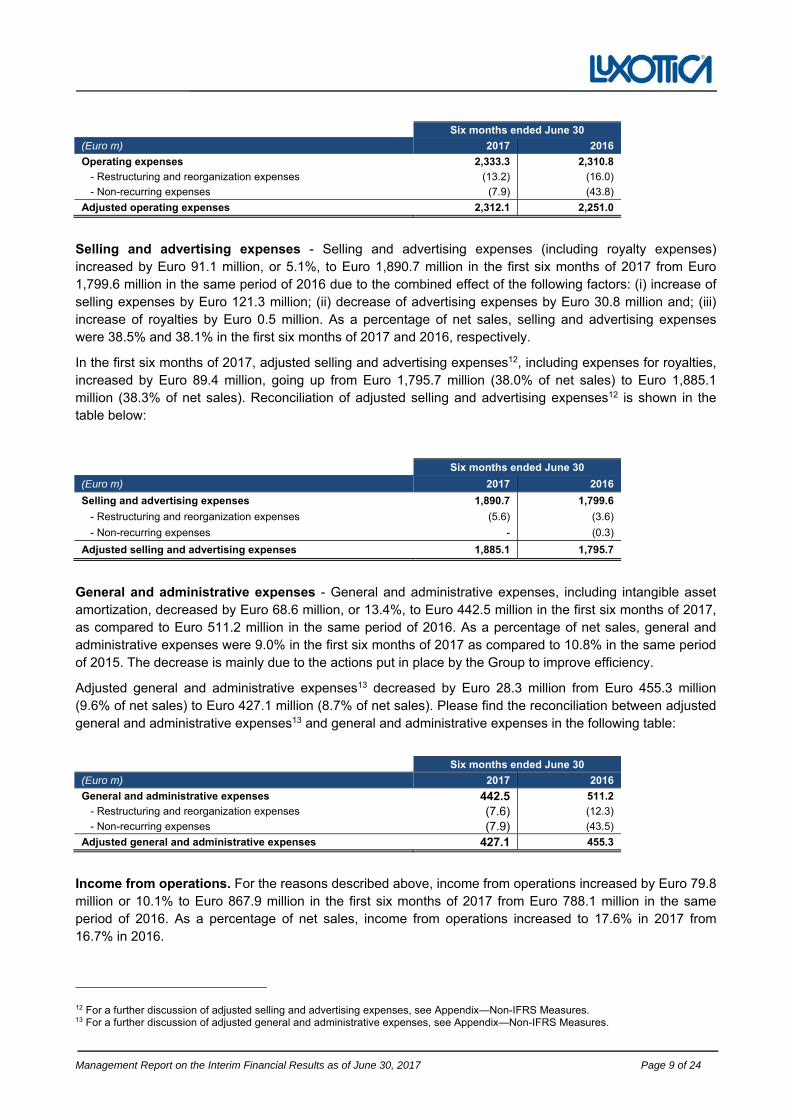
Adjusted operating expenses11 increased by Euro 61.1 million, going up from Euro 2,251.0 million (47.7% of net sales) to Euro 2,312.1 million (47.0% of net sales). Reconciliation between operating expenses and adjusted11 operating expenses is shown in the table below:
9 For a further discussion of adjusted cost of sales, see Appendix—Non-IFRS Measures. 10 For a further discussion of adjusted gross profit, see Appendix—Non-IFRS Measures.11 For a further discussion of adjusted operating expenses, see Appendix—Non-IFRS Measures.
Management Report on the Interim Financial Results as of June 30, 2017 Page 9 of 24
Six months ended June 30
(Euro m) 2017 2016
Operating expenses 2,333.3 2,310.8
- Restructuring and reorganization expenses (13.2) (16.0)
- Non-recurring expenses (7.9) (43.8)
Adjusted operating expenses 2,312.1 2,251.0
Selling and advertising expenses - Selling and advertising expenses (including royalty expenses) increased by Euro 91.1 million, or 5.1%, to Euro 1,890.7 million in the first six months of 2017 from Euro 1,799.6 million in the same period of 2016 due to the combined effect of the following factors: (i) increase of selling expenses by Euro 121.3 million; (ii) decrease of advertising expenses by Euro 30.8 million and; (iii) increase of royalties by Euro 0.5 million. As a percentage of net sales, selling and advertising expenses were 38.5% and 38.1% in the first six months of 2017 and 2016, respectively.
In the first six months of 2017, adjusted selling and advertising expenses12, including expenses for royalties, increased by Euro 89.4 million, going up from Euro 1,795.7 million (38.0% of net sales) to Euro 1,885.1 million (38.3% of net sales). Reconciliation of adjusted selling and advertising expenses12 is shown in the table below:
Six months ended June 30
(Euro m) 2017 2016
Selling and advertising expenses 1,890.7 1,799.6
- Restructuring and reorganization expenses (5.6) (3.6)
- Non-recurring expenses - (0.3)
Adjusted selling and advertising expenses 1,885.1 1,795.7
General and administrative expenses - General and administrative expenses, including intangible asset amortization, decreased by Euro 68.6 million, or 13.4%, to Euro 442.5 million in the first six months of 2017, as compared to Euro 511.2 million in the same period of 2016. As a percentage of net sales, general and administrative expenses were 9.0% in the first six months of 2017 as compared to 10.8% in the same period of 2015. The decrease is mainly due to the actions put in place by the Group to improve efficiency.
Adjusted general and administrative expenses13 decreased by Euro 28.3 million from Euro 455.3 million (9.6% of net sales) to Euro 427.1 million (8.7% of net sales). Please find the reconciliation between adjusted general and administrative expenses13 and general and administrative expenses in the following table:
Six months ended June 30
(Euro m) 2017 2016
General and administrative expenses 442.5 511.2
- Restructuring and reorganization expenses (7.6) (12.3)
- Non-recurring expenses (7.9) (43.5)
Adjusted general and administrative expenses 427.1 455.3
Income from operations. For the reasons described above, income from operations increased by Euro 79.8 million or 10.1% to Euro 867.9 million in the first six months of 2017 from Euro 788.1 million in the same period of 2016. As a percentage of net sales, income from operations increased to 17.6% in 2017 from 16.7% in 2016.
12 For a further discussion of adjusted selling and advertising expenses, see Appendix—Non-IFRS Measures. 13 For a further discussion of adjusted general and administrative expenses, see Appendix—Non-IFRS Measures.
Management Report on the Interim Financial Results as of June 30, 2017 Page 10 of 24
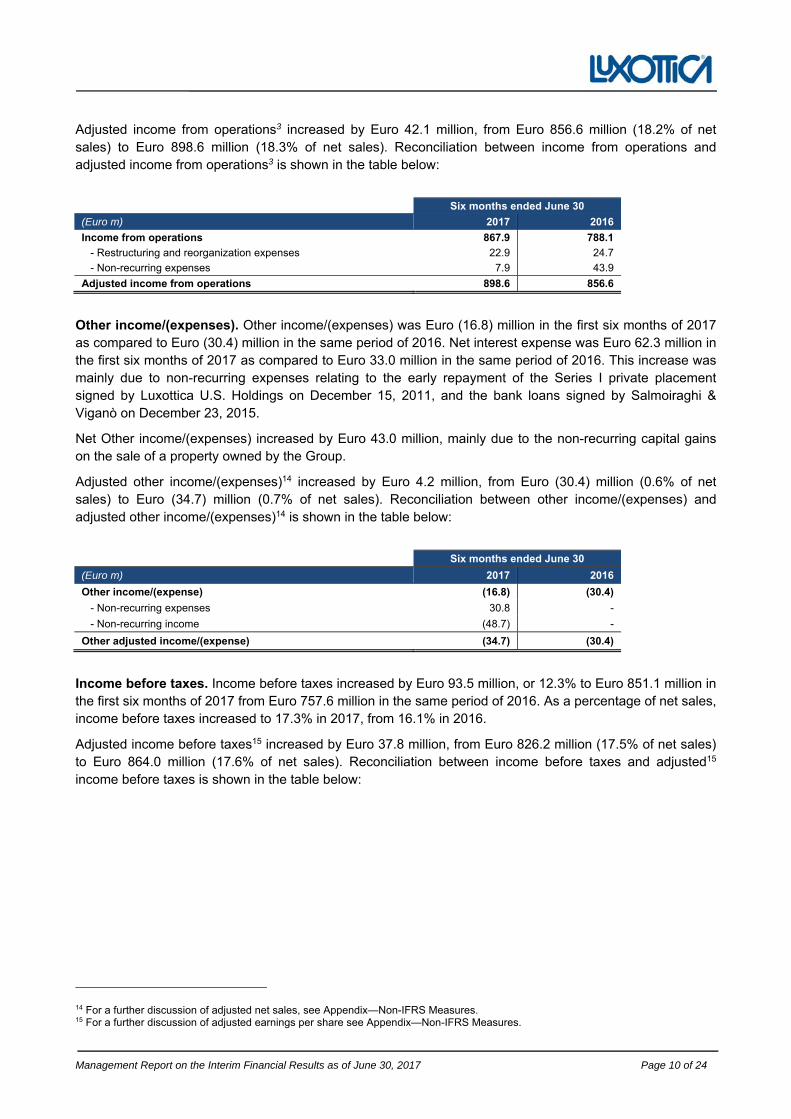
Adjusted income from operations3 increased by Euro 42.1 million, from Euro 856.6 million (18.2% of net sales) to Euro 898.6 million (18.3% of net sales). Reconciliation between income from operations and adjusted income from operations3 is shown in the table below:
Six months ended June 30
(Euro m) 2017 2016
Income from operations 867.9 788.1
- Restructuring and reorganization expenses 22.9 24.7
- Non-recurring expenses 7.9 43.9
Adjusted income from operations 898.6 856.6
Other income/(expenses). Other income/(expenses) was Euro (16.8) million in the first six months of 2017 as compared to Euro (30.4) million in the same period of 2016. Net interest expense was Euro 62.3 million in the first six months of 2017 as compared to Euro 33.0 million in the same period of 2016. This increase was mainly due to non-recurring expenses relating to the early repayment of the Series I private placement signed by Luxottica U.S. Holdings on December 15, 2011, and the bank loans signed by Salmoiraghi & Viganò on December 23, 2015.
Net Other income/(expenses) increased by Euro 43.0 million, mainly due to the non-recurring capital gains on the sale of a property owned by the Group.
Adjusted other income/(expenses)14 increased by Euro 4.2 million, from Euro (30.4) million (0.6% of net sales) to Euro (34.7) million (0.7% of net sales). Reconciliation between other income/(expenses) and adjusted other income/(expenses)14 is shown in the table below:
Six months ended June 30
(Euro m) 2017 2016
Other income/(expense) (16.8) (30.4)
- Non-recurring expenses 30.8 -
- Non-recurring income (48.7) -
Other adjusted income/(expense) (34.7) (30.4)
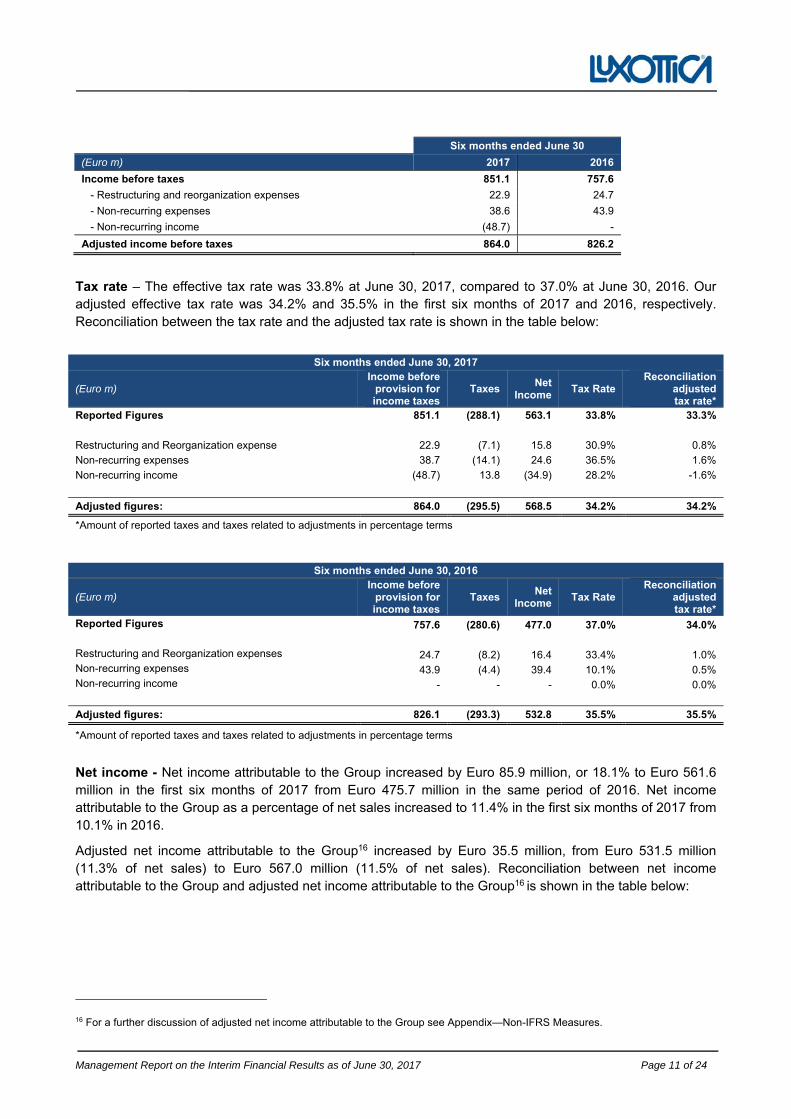
Income before taxes. Income before taxes increased by Euro 93.5 million, or 12.3% to Euro 851.1 million in the first six months of 2017 from Euro 757.6 million in the same period of 2016. As a percentage of net sales, income before taxes increased to 17.3% in 2017, from 16.1% in 2016.
Adjusted income before taxes15 increased by Euro 37.8 million, from Euro 826.2 million (17.5% of net sales) to Euro 864.0 million (17.6% of net sales). Reconciliation between income before taxes and adjusted15 income before taxes is shown in the table below:
14 For a further discussion of adjusted net sales, see Appendix—Non-IFRS Measures. 15 For a further discussion of adjusted earnings per share see Appendix—Non-IFRS Measures.
Management Report on the Interim Financial Results as of June 30, 2017 Page 11 of 24
Six months ended June 30
(Euro m) 2017 2016
Income before taxes 851.1 757.6
- Restructuring and reorganization expenses 22.9 24.7
- Non-recurring expenses 38.6 43.9
- Non-recurring income (48.7) -
Adjusted income before taxes 864.0 826.2
Tax rate – The effective tax rate was 33.8% at June 30, 2017, compared to 37.0% at June 30, 2016. Our adjusted effective tax rate was 34.2% and 35.5% in the first six months of 2017 and 2016, respectively. Reconciliation between the tax rate and the adjusted tax rate is shown in the table below:
Six months ended June 30, 2017
(Euro m) Income before
provision for income taxes
Taxes Net
Income Tax Rate
Reconciliation adjusted tax rate*
Reported Figures 851.1 (288.1) 563.1 33.8% 33.3%
Restructuring and Reorganization expense 22.9 (7.1) 15.8 30.9% 0.8%
Non-recurring expenses 38.7 (14.1) 24.6 36.5% 1.6%
Non-recurring income (48.7) 13.8 (34.9) 28.2% -1.6%
Adjusted figures: 864.0 (295.5) 568.5 34.2% 34.2%
*Amount of reported taxes and taxes related to adjustments in percentage terms
Six months ended June 30, 2016
(Euro m) Income before
provision for income taxes
Taxes Net
Income Tax Rate
Reconciliation adjusted tax rate*
Reported Figures 757.6 (280.6) 477.0 37.0% 34.0%
Restructuring and Reorganization expenses 24.7 (8.2) 16.4 33.4% 1.0%Non-recurring expenses 43.9 (4.4) 39.4 10.1% 0.5%Non-recurring income - - - 0.0% 0.0%
Adjusted figures: 826.1 (293.3) 532.8 35.5% 35.5%
*Amount of reported taxes and taxes related to adjustments in percentage terms
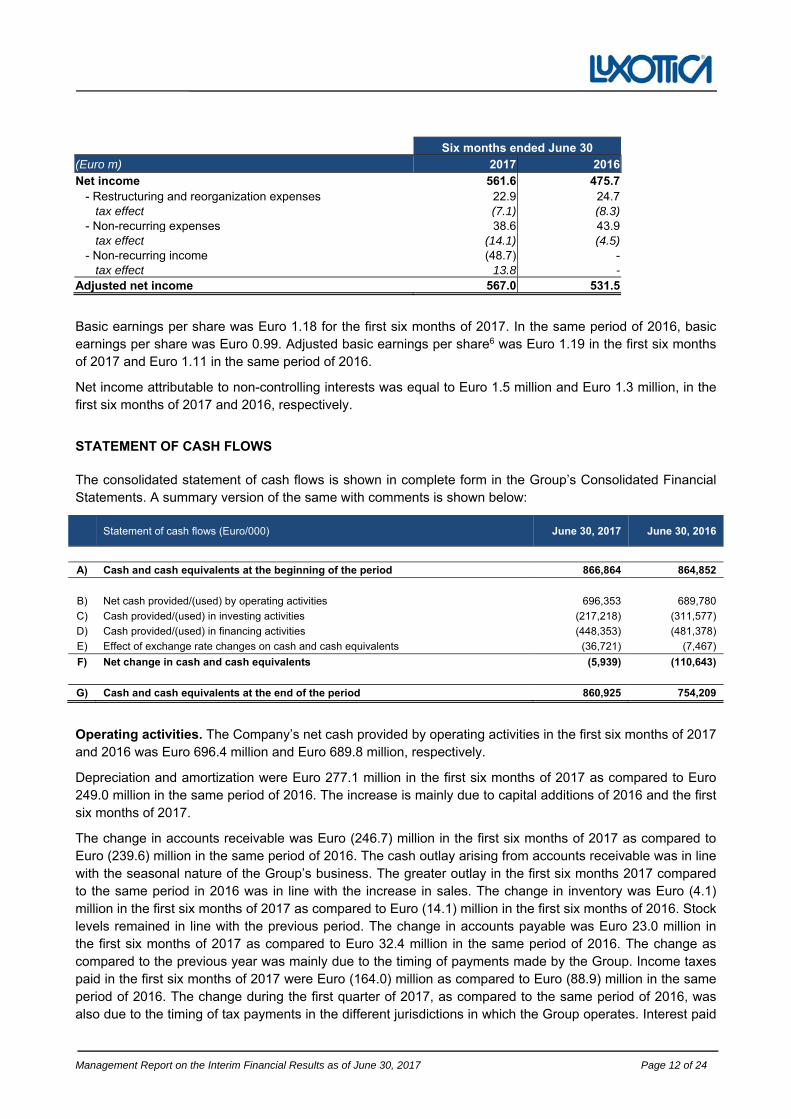
Net income - Net income attributable to the Group increased by Euro 85.9 million, or 18.1% to Euro 561.6 million in the first six months of 2017 from Euro 475.7 million in the same period of 2016. Net income attributable to the Group as a percentage of net sales increased to 11.4% in the first six months of 2017 from 10.1% in 2016.
Adjusted net income attributable to the Group16 increased by Euro 35.5 million, from Euro 531.5 million (11.3% of net sales) to Euro 567.0 million (11.5% of net sales). Reconciliation between net income attributable to the Group and adjusted net income attributable to the Group16 is shown in the table below:
16 For a further discussion of adjusted net income attributable to the Group see Appendix—Non-IFRS Measures.
Management Report on the Interim Financial Results as of June 30, 2017 Page 12 of 24
Six months ended June 30 (Euro m) 2017 2016 Net income 561.6 475.7 - Restructuring and reorganization expenses 22.9 24.7 tax effect (7.1) (8.3) - Non-recurring expenses 38.6 43.9 tax effect (14.1) (4.5) - Non-recurring income (48.7) -
tax effect 13.8 - Adjusted net income 567.0 531.5
Basic earnings per share was Euro 1.18 for the first six months of 2017. In the same period of 2016, basic earnings per share was Euro 0.99. Adjusted basic earnings per share6 was Euro 1.19 in the first six months of 2017 and Euro 1.11 in the same period of 2016.
Net income attributable to non-controlling interests was equal to Euro 1.5 million and Euro 1.3 million, in the first six months of 2017 and 2016, respectively.
STATEMENT OF CASH FLOWS
The consolidated statement of cash flows is shown in complete form in the Group’s Consolidated Financial Statements. A summary version of the same with comments is shown below:
Statement of cash flows (Euro/000) June 30, 2017 June 30, 2016
A) Cash and cash equivalents at the beginning of the period 866,864 864,852
B) Net cash provided/(used) by operating activities 696,353 689,780
C) Cash provided/(used) in investing activities (217,218) (311,577)
D) Cash provided/(used) in financing activities (448,353) (481,378)
E) Effect of exchange rate changes on cash and cash equivalents (36,721) (7,467)
F) Net change in cash and cash equivalents (5,939) (110,643)
G) Cash and cash equivalents at the end of the period 860,925 754,209
Operating activities. The Company’s net cash provided by operating activities in the first six months of 2017 and 2016 was Euro 696.4 million and Euro 689.8 million, respectively.
Depreciation and amortization were Euro 277.1 million in the first six months of 2017 as compared to Euro 249.0 million in the same period of 2016. The increase is mainly due to capital additions of 2016 and the first six months of 2017.
The change in accounts receivable was Euro (246.7) million in the first six months of 2017 as compared to Euro (239.6) million in the same period of 2016. The cash outlay arising from accounts receivable was in line with the seasonal nature of the Group’s business. The greater outlay in the first six months 2017 compared to the same period in 2016 was in line with the increase in sales. The change in inventory was Euro (4.1) million in the first six months of 2017 as compared to Euro (14.1) million in the first six months of 2016. Stock levels remained in line with the previous period. The change in accounts payable was Euro 23.0 million in the first six months of 2017 as compared to Euro 32.4 million in the same period of 2016. The change as compared to the previous year was mainly due to the timing of payments made by the Group. Income taxes paid in the first six months of 2017 were Euro (164.0) million as compared to Euro (88.9) million in the same period of 2016. The change during the first quarter of 2017, as compared to the same period of 2016, was also due to the timing of tax payments in the different jurisdictions in which the Group operates. Interest paid
Management Report on the Interim Financial Results as of June 30, 2017 Page 13 of 24
was Euro (86.1) million as compared to Euro (52.2) million in the first six months of 2017 and 2016, respectively.
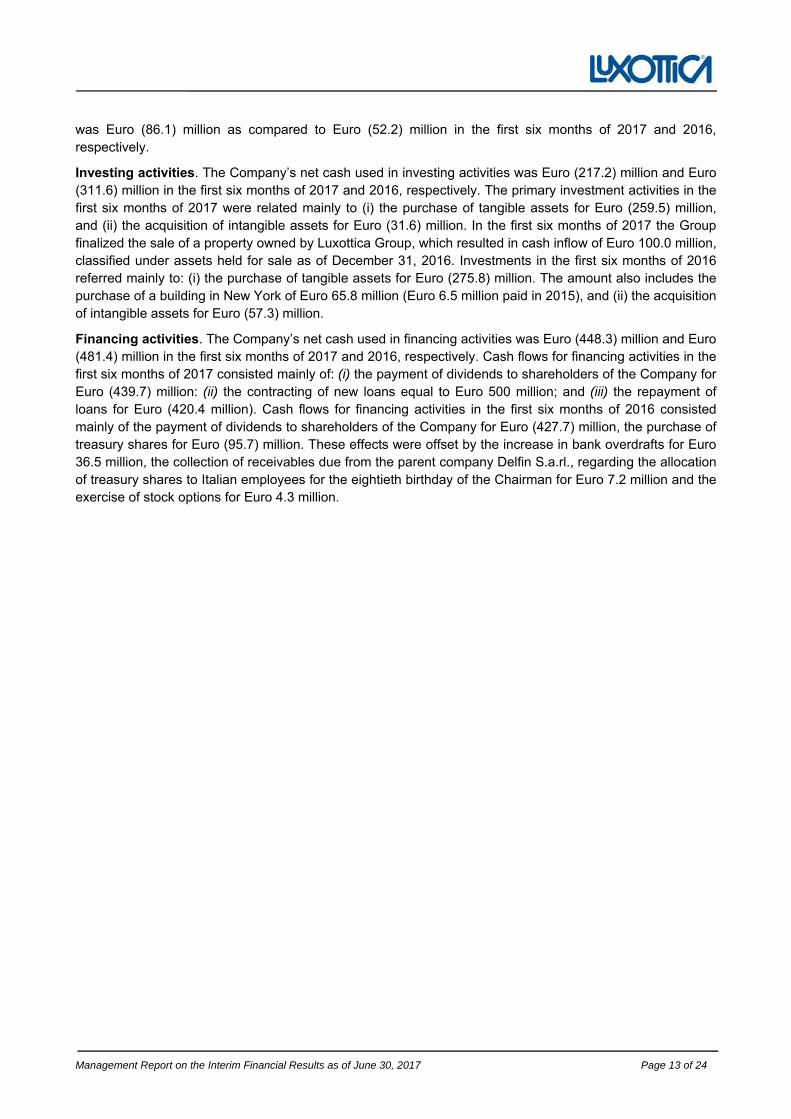
Investing activities. The Company’s net cash used in investing activities was Euro (217.2) million and Euro (311.6) million in the first six months of 2017 and 2016, respectively. The primary investment activities in the first six months of 2017 were related mainly to (i) the purchase of tangible assets for Euro (259.5) million, and (ii) the acquisition of intangible assets for Euro (31.6) million. In the first six months of 2017 the Group finalized the sale of a property owned by Luxottica Group, which resulted in cash inflow of Euro 100.0 million, classified under assets held for sale as of December 31, 2016. Investments in the first six months of 2016 referred mainly to: (i) the purchase of tangible assets for Euro (275.8) million. The amount also includes the purchase of a building in New York of Euro 65.8 million (Euro 6.5 million paid in 2015), and (ii) the acquisition of intangible assets for Euro (57.3) million.
Financing activities. The Company’s net cash used in financing activities was Euro (448.3) million and Euro (481.4) million in the first six months of 2017 and 2016, respectively. Cash flows for financing activities in the first six months of 2017 consisted mainly of: (i) the payment of dividends to shareholders of the Company for Euro (439.7) million: (ii) the contracting of new loans equal to Euro 500 million; and (iii) the repayment of loans for Euro (420.4 million). Cash flows for financing activities in the first six months of 2016 consisted mainly of the payment of dividends to shareholders of the Company for Euro (427.7) million, the purchase of treasury shares for Euro (95.7) million. These effects were offset by the increase in bank overdrafts for Euro 36.5 million, the collection of receivables due from the parent company Delfin S.a.rl., regarding the allocation of treasury shares to Italian employees for the eightieth birthday of the Chairman for Euro 7.2 million and the exercise of stock options for Euro 4.3 million.
Management Report on the Interim Financial Results as of June 30, 2017 Page 14 of 24
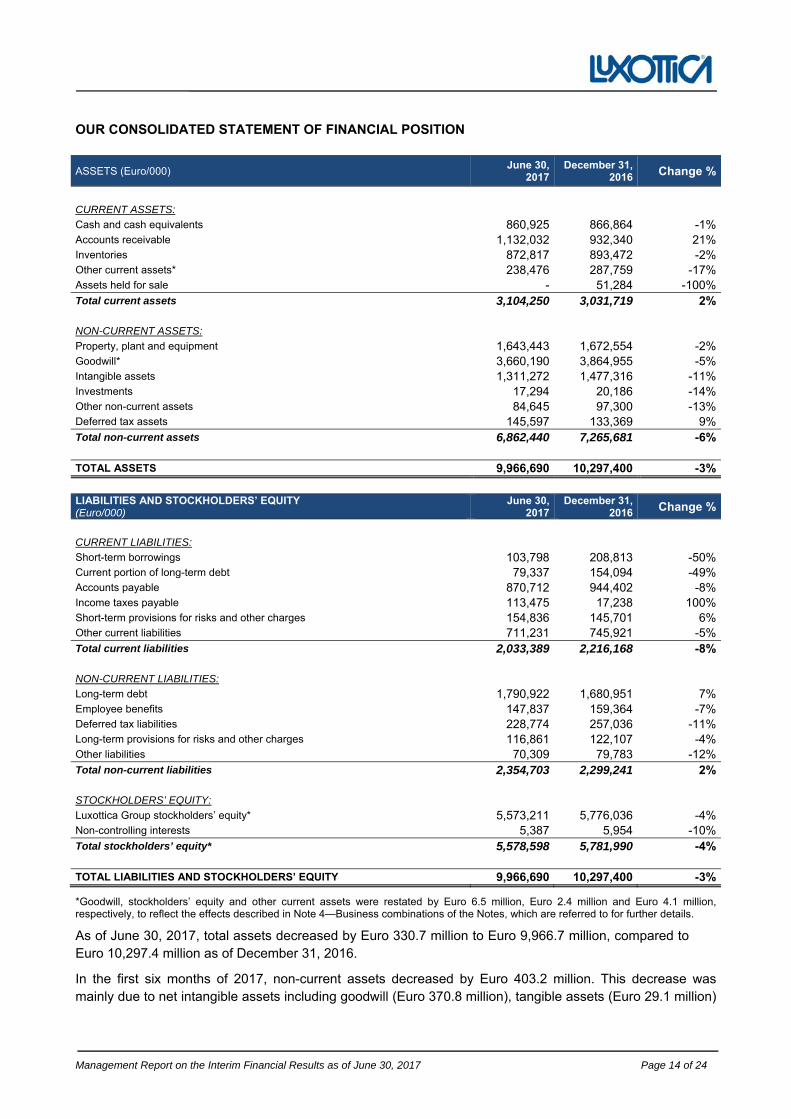
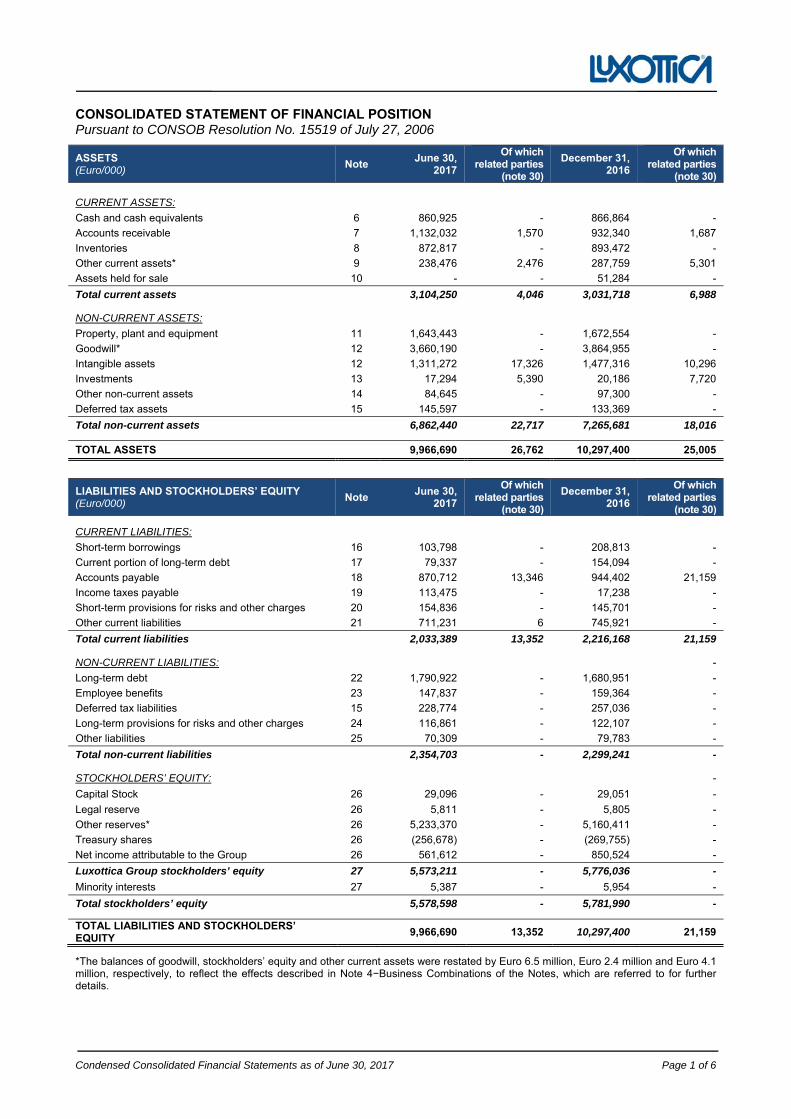
OUR CONSOLIDATED STATEMENT OF FINANCIAL POSITION
ASSETS (Euro/000) June 30,
2017December 31,
2016 Change %
CURRENT ASSETS:
Cash and cash equivalents 860,925 866,864 -1%Accounts receivable 1,132,032 932,340 21%Inventories 872,817 893,472 -2%Other current assets* 238,476 287,759 -17%Assets held for sale - 51,284 -100%Total current assets 3,104,250 3,031,719 2%
NON-CURRENT ASSETS:
Property, plant and equipment 1,643,443 1,672,554 -2%Goodwill* 3,660,190 3,864,955 -5%Intangible assets 1,311,272 1,477,316 -11%Investments 17,294 20,186 -14%Other non-current assets 84,645 97,300 -13%Deferred tax assets 145,597 133,369 9%Total non-current assets 6,862,440 7,265,681 -6%
TOTAL ASSETS 9,966,690 10,297,400 -3%
LIABILITIES AND STOCKHOLDERS’ EQUITY (Euro/000)
June 30,2017
December 31, 2016 Change %
CURRENT LIABILITIES:
Short-term borrowings 103,798 208,813 -50%Current portion of long-term debt 79,337 154,094 -49%Accounts payable 870,712 944,402 -8%Income taxes payable 113,475 17,238 100%Short-term provisions for risks and other charges 154,836 145,701 6%Other current liabilities 711,231 745,921 -5%Total current liabilities 2,033,389 2,216,168 -8%
NON-CURRENT LIABILITIES:
Long-term debt 1,790,922 1,680,951 7%Employee benefits 147,837 159,364 -7%Deferred tax liabilities 228,774 257,036 -11%Long-term provisions for risks and other charges 116,861 122,107 -4%Other liabilities 70,309 79,783 -12%Total non-current liabilities 2,354,703 2,299,241 2%
STOCKHOLDERS’ EQUITY:
Luxottica Group stockholders’ equity* 5,573,211 5,776,036 -4%Non-controlling interests 5,387 5,954 -10%Total stockholders’ equity* 5,578,598 5,781,990 -4%
TOTAL LIABILITIES AND STOCKHOLDERS’ EQUITY 9,966,690 10,297,400 -3%
*Goodwill, stockholders’ equity and other current assets were restated by Euro 6.5 million, Euro 2.4 million and Euro 4.1 million,respectively, to reflect the effects described in Note 4—Business combinations of the Notes, which are referred to for further details.
As of June 30, 2017, total assets decreased by Euro 330.7 million to Euro 9,966.7 million, compared to Euro 10,297.4 million as of December 31, 2016.
In the first six months of 2017, non-current assets decreased by Euro 403.2 million. This decrease was mainly due to net intangible assets including goodwill (Euro 370.8 million), tangible assets (Euro 29.1 million)
Management Report on the Interim Financial Results as of June 30, 2017 Page 15 of 24
and other non-current assets (Euro 12.6 million) and was partially offset by the increase in deferred tax assets (Euro 12.2 million).
The decrease in intangible assets (including goodwill) was due to the negative effects of foreign currency fluctuations of (Euro 292.1 million) and to amortization in the period of (Euro 117.0 million) which were partially offset by the additions in the period of Euro 39.5 million.
The increase in property, plant and equipment was due to the additions in the period of Euro 225.2 million and was partially offset by the negative currency fluctuation effects of Euro 86.7 million as of June 30, 2017 compared to December 31, 2016, and depreciation in the period of Euro 160.0 million.
As of June 30, 2017 as compared to December 31, 2016:
Accounts receivable increased by Euro 199.7 million, primarily due to the seasonality of the Group’s business, which is generally characterized by higher sales in the first part of the year and collection of the related receivables in the second part of the year. Inventory decreased by Euro 20.7 million. Stock levels as of June 30, 2017 were in line with December 31, 2016. Other current assets decreased by Euro 100.6 million mainly due to the sale of the property owned by the Group, for a total of Euro 51.3 million which was classified as an asset held for sale as of December 31, 2016.
Accounts payable decreased by Euro 73.7 million mainly due to payment dynamics. Current taxes payable increased by Euro 96.2 million due to the timing of tax payments made by the Group in various jurisdictions; other current liabilities decreased by Euro 34.7 million mainly because, as of December 31, 2016, liabilities included annual employee bonuses. Employee benefits decreased by Euro 11.6 million which was primarily due to the reduction of rates used to discount the liability.
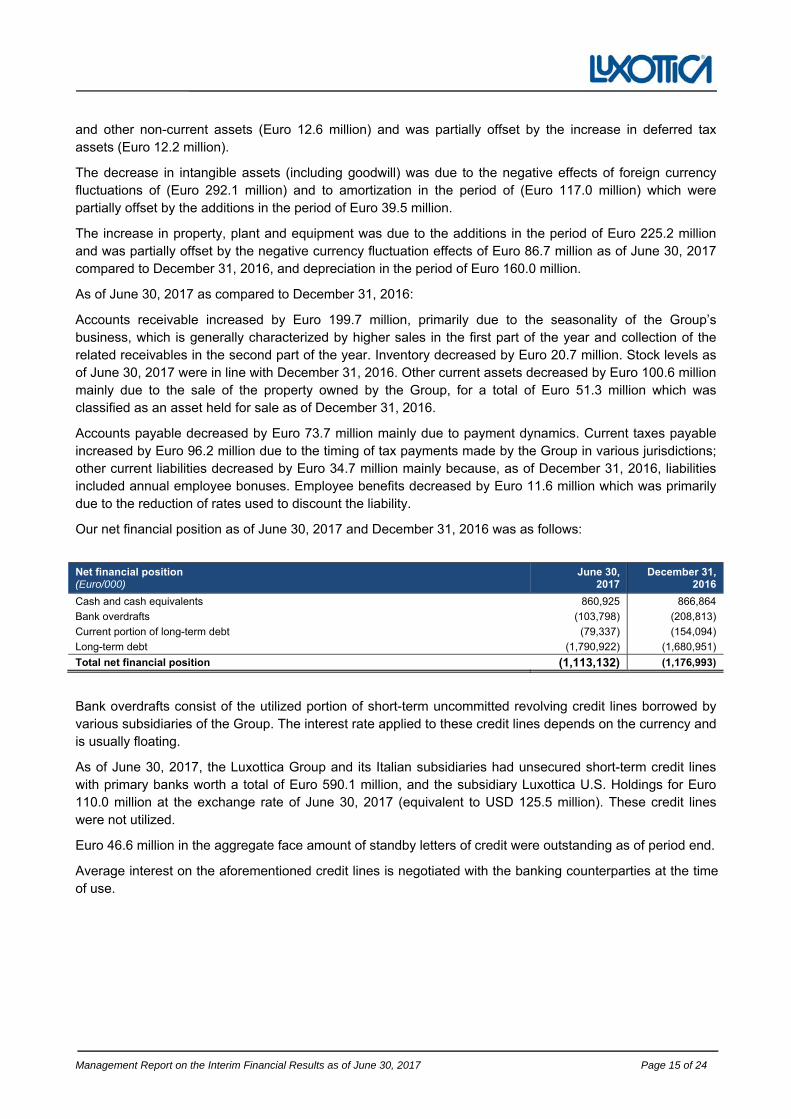
Our net financial position as of June 30, 2017 and December 31, 2016 was as follows:
Net financial position (Euro/000)
June 30, 2017
December 31, 2016
Cash and cash equivalents 860,925 866,864
Bank overdrafts (103,798) (208,813)
Current portion of long-term debt (79,337) (154,094)
Long-term debt (1,790,922) (1,680,951)
Total net financial position (1,113,132) (1,176,993)
Bank overdrafts consist of the utilized portion of short-term uncommitted revolving credit lines borrowed by various subsidiaries of the Group. The interest rate applied to these credit lines depends on the currency and is usually floating.
As of June 30, 2017, the Luxottica Group and its Italian subsidiaries had unsecured short-term credit lines with primary banks worth a total of Euro 590.1 million, and the subsidiary Luxottica U.S. Holdings for Euro 110.0 million at the exchange rate of June 30, 2017 (equivalent to USD 125.5 million). These credit lines were not utilized.
Euro 46.6 million in the aggregate face amount of standby letters of credit were outstanding as of period end.
Average interest on the aforementioned credit lines is negotiated with the banking counterparties at the time of use.
Management Report on the Interim Financial Results as of June 30, 2017 Page 16 of 24
4. RELATED PARTY TRANSACTIONS
Our related party transactions are neither atypical nor unusual and occur in the ordinary course of our business. Said transactions are regulated at market conditions, taking into account the characteristics of the goods and services provided.
For further details on related party transactions during the first six months of 2017, see paragraph 30 of the Notes to the Condensed Consolidated Interim Financial Statements as of June 30, 2017
On January 29, 2013 the Company elected to avail itself of the options provided by Article 70, Section 8, and Article 71, Section 1-bis, of CONSOB Issuers’ Regulations and, consequently, will no longer comply with the obligation to make available to the public an information memorandum in connection with transactions involving significant mergers, spin-offs, increases in capital through contributions in kind, acquisitions and disposals.
5. SUBSEQUENT EVENTS
For further details regarding any subsequent events, please refer to paragraph 36 of the Notes to the Condensed Consolidated Interim Financial Statements as of June 30, 2017.
6. OUTLOOK FOR THE SECOND HALF OF 2017
The results of the first six months were in line with expectations; consequently, the Group confirms the growth trend forecast for financial year 2017, as previously communicated.
Management Report on the Interim Financial Results as of June 30, 2017 Page 17 of 24
APPENDIX
NON-IFRS MEASURES and ADJUSTED MEASURES
In this Management Report on the Interim Financial Results, we use certain performance indicators that are not envisaged by the International Financial Reporting Standards (“IFRS”) as issued by the International Accounting Standards Board, and applied by the European Union. Such measures are not meant to be considered in isolation or as a substitute for items appearing on our financial statements prepared in accordance with IFRS. Rather, these non-IFRS measures should be used as a supplement to IFRS results to assist the reader in better understanding the operational performance of the Group.
Such measures are not defined terms under IFRS and their definitions should be carefully reviewed and understood by investors. Such non-IFRS measures are explained in detail and reconciled to their most comparable IFRS measures below.
In order to provide additional comparative information on the results for the period under review compared to previous periods, some measures have been adjusted (“adjusted measures”). In particular, in the first six months of 2017, we made adjustments to the following measures: cost of sales, operating expenses, income from operations, EBITDA, other income/(expenses), income before taxes, income taxes, net income and earnings per share.
Adjusted measures exclude: (i) costs for corporate reorganization and restructuring transactions for Euro 22.9 million (Euro 15.8 million net of taxes), (ii) non-recurring expenses for Euro 38.6 million (Euro 24.5 million net of taxes) regarding the early repayment of financial liabilities equal to Euro 30.8 million (Euro 19.0 million net of taxes) and costs relating to the pending combination with Essilor for Euro 7.9 million (Euro 5.5 million net of taxes); (iii) non-recurring income for Euro 48.7 million (Euro 34.9 million net of taxes) related to capital gains on the sale of a property owned by the Group.
In the first six months of 2016, we made adjustments to the following measures: cost of sales, operating expenses, EBITDA, operating income, income taxes, net income and earnings per share. Adjusted measures exclude: (i) restructuring and reorganization costs of Euro 24.7 million (Euro 16.4 million net of taxes), and (ii) non-recurring expenses of Euro 43.9 million (Euro 39.4 million net of taxes) related to the departure of Adil Mehboob-Khan as CEO for Markets, expenses related to the Oakley integration and to an accrual for the French anti-trust proceeding.
The adjusted measures referred to above are not performance measures calculated in accordance with IFRS accounting standards. The Group believes that these adjusted measures: (i) are useful for management and investors to assess the operating performance of the Group and to compare it to other companies operating in the same sector, and (ii) provide an additional view of the results, excluding the effect of elements that are unusual, infrequent or unrelated to normal operations.
Non-IFRS performance indicators such as EBITDA, EBITDA margin, free cash flow and the ratio of net debt to EBITDA are included in this Management Report in order to:
improve transparency for investors;
assist investors in their assessment of the Group’s operating performance and its ability to refinance
its debt as it matures and incur additional indebtedness to invest in new business opportunities;
assist investors in their assessment of the Group’s cost of debt;
Management Report on the Interim Financial Results as of June 30, 2017 Page 18 of 24
ensure that these measures are fully understood in light of how the Group evaluates its operating
results and leverage;
properly define the metrics used and confirm their calculation; and
share these measures with all investors at the same time.
See the tables below for a reconciliation of the adjusted measures discussed above to their most directly comparable IFRS financial measures. For a reconciliation of EBITDA to its most directly comparable IFRS measure, see the pages following the tables below:
Six months ended June 30, 2017
Adjusted Measures (Euro/000) Cost of
sales Operating expenses
EBITDA Income from
operations
Other income/
(expenses)
Net incom
eEPS
Reported 1,716.2 2,333.3 1,145.0 867.9 (16.8) 561.6 1.18 - Restructuring and Reorganization expenses
(9.6) (13.2) 22.9 22.9 - 15.8 0.03
- Non-recurring expenses - (7.9) 7.9 7.9 30.8 24.5 0.05 - Non-recurring income - - - - (48.7) (34.9) (0.07)Adjusted 1,706.6 2,312.1 1,175.7 898.6 (34.7) 567.0 1.19
Six months ended June 30, 2016Adjusted Measures (Euro m)
Cost of sales
Operating expenses
EBITDA Income from
operationsOther income/
(expenses) Net
incomeEPS
Reported 1,620.6 2,310.8 1,037.1 788.1 (30.4) 475.7 0.99 - Restructuring and Reorganization expenses
(8.7) (16.0) 24.7 24.7 - 16.4 0.03
- Non-recurring expenses (0.1) (43.8) 43.9 43.9 - 39.4 0.08Adjusted 1,611.8 2,251.0 1,105.6 856.6 (30.4) 531.5 1.11
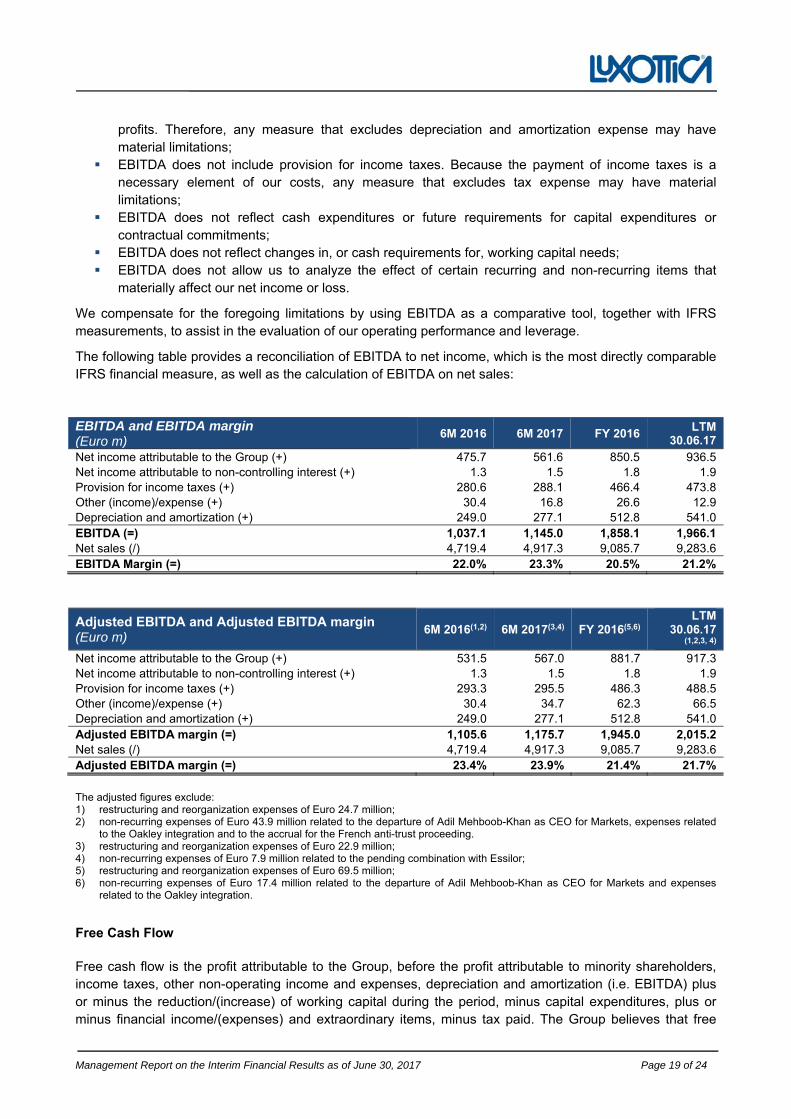
EBITDA and EBITDA margin
EBITDA represents net income attributable to Luxottica Group stockholders, before non-controlling interests, provision for income taxes, other income/expense, depreciation and amortization. EBITDA margin means EBITDA divided by net sales. We believe that EBITDA is useful to both management and investors in evaluating our operating performance compared to that of other companies in our industry. Our calculation of EBITDA allows us to compare our operating results with those of other companies without giving effect to financing, income taxes and the accounting effects of capital spending, which items may vary for different companies for reasons unrelated to the overall operating performance of a company’s business.
EBITDA and EBITDA margin are not meant to be considered in isolation or as a substitute for items appearing in our financial statements prepared in accordance with IFRS. Rather, these non-IFRS measures should be used as a supplement to IFRS results to assist the reader in better understanding the operational performance of the Group. For additional information on Group’s non-IFRS measures used in this report, see ‘‘Non-IFRS Measures—Adjusted Measures’’ set forth above.
Investors should be aware that our method of calculating EBITDA may differ from methods used by other companies. We recognize that the usefulness of EBITDA has certain limitations, including:
EBITDA does not include interest expense. Because we have borrowed money in order to finance our operations, interest expense is a necessary element of our costs and ability to generate profits and cash flows. Therefore, any measure that excludes interest expense may have material limitations;
EBITDA does not include depreciation and amortization expense. Because we use capital assets, depreciation and amortization expense is a necessary element of our costs and ability to generate
Management Report on the Interim Financial Results as of June 30, 2017 Page 19 of 24
profits. Therefore, any measure that excludes depreciation and amortization expense may have material limitations;
EBITDA does not include provision for income taxes. Because the payment of income taxes is a necessary element of our costs, any measure that excludes tax expense may have material limitations;
EBITDA does not reflect cash expenditures or future requirements for capital expenditures or contractual commitments;
EBITDA does not reflect changes in, or cash requirements for, working capital needs; EBITDA does not allow us to analyze the effect of certain recurring and non-recurring items that
materially affect our net income or loss.
We compensate for the foregoing limitations by using EBITDA as a comparative tool, together with IFRS measurements, to assist in the evaluation of our operating performance and leverage.
The following table provides a reconciliation of EBITDA to net income, which is the most directly comparable IFRS financial measure, as well as the calculation of EBITDA on net sales:
EBITDA and EBITDA margin (Euro m)
6M 2016 6M 2017 FY 2016 LTM
30.06.17 Net income attributable to the Group (+) 475.7 561.6 850.5 936.5 Net income attributable to non-controlling interest (+) 1.3 1.5 1.8 1.9 Provision for income taxes (+) 280.6 288.1 466.4 473.8 Other (income)/expense (+) 30.4 16.8 26.6 12.9 Depreciation and amortization (+) 249.0 277.1 512.8 541.0 EBITDA (=) 1,037.1 1,145.0 1,858.1 1,966.1 Net sales (/) 4,719.4 4,917.3 9,085.7 9,283.6 EBITDA Margin (=) 22.0% 23.3% 20.5% 21.2%
Adjusted EBITDA and Adjusted EBITDA margin (Euro m)
6M 2016(1,2) 6M 2017(3,4) FY 2016(5,6) LTM
30.06.17 (1,2,3, 4)
Net income attributable to the Group (+) 531.5 567.0 881.7 917.3 Net income attributable to non-controlling interest (+) 1.3 1.5 1.8 1.9 Provision for income taxes (+) 293.3 295.5 486.3 488.5 Other (income)/expense (+) 30.4 34.7 62.3 66.5 Depreciation and amortization (+) 249.0 277.1 512.8 541.0 Adjusted EBITDA margin (=) 1,105.6 1,175.7 1,945.0 2,015.2 Net sales (/) 4,719.4 4,917.3 9,085.7 9,283.6 Adjusted EBITDA margin (=) 23.4% 23.9% 21.4% 21.7%
The adjusted figures exclude: 1) restructuring and reorganization expenses of Euro 24.7 million; 2) non-recurring expenses of Euro 43.9 million related to the departure of Adil Mehboob-Khan as CEO for Markets, expenses related
to the Oakley integration and to the accrual for the French anti-trust proceeding. 3) restructuring and reorganization expenses of Euro 22.9 million; 4) non-recurring expenses of Euro 7.9 million related to the pending combination with Essilor; 5) restructuring and reorganization expenses of Euro 69.5 million; 6) non-recurring expenses of Euro 17.4 million related to the departure of Adil Mehboob-Khan as CEO for Markets and expenses
related to the Oakley integration.
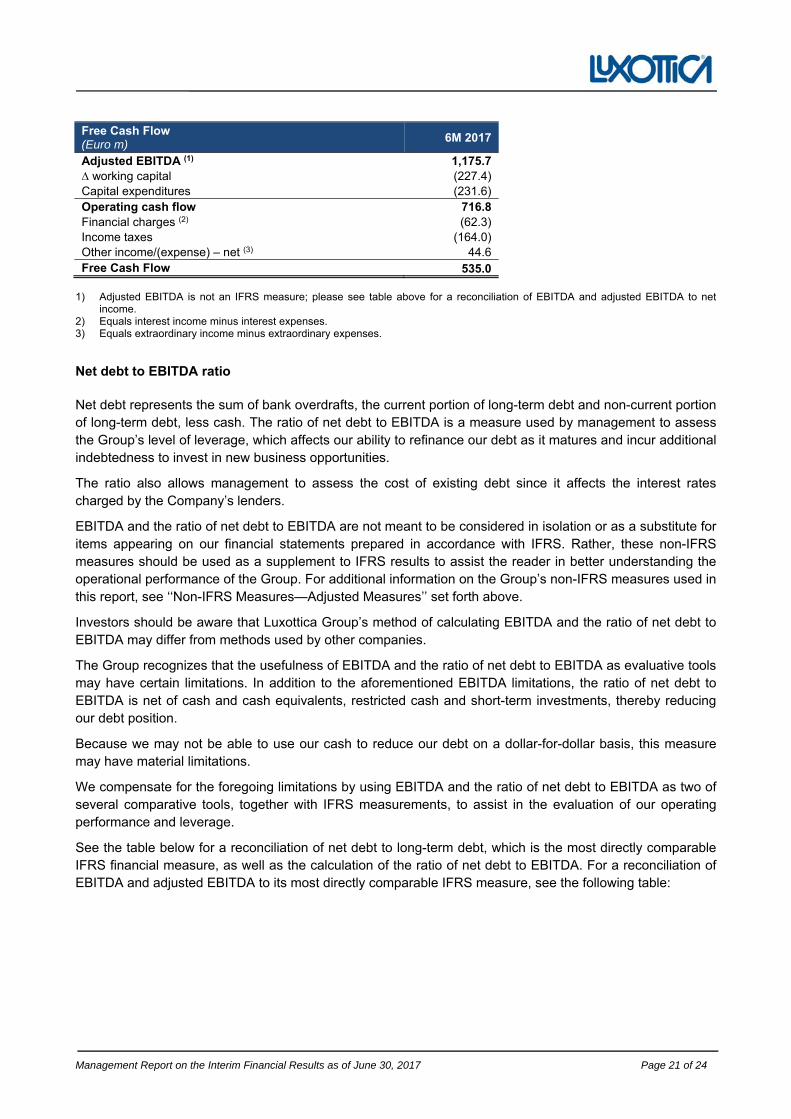
Free Cash Flow
Free cash flow is the profit attributable to the Group, before the profit attributable to minority shareholders, income taxes, other non-operating income and expenses, depreciation and amortization (i.e. EBITDA) plus or minus the reduction/(increase) of working capital during the period, minus capital expenditures, plus or minus financial income/(expenses) and extraordinary items, minus tax paid. The Group believes that free
Management Report on the Interim Financial Results as of June 30, 2017 Page 20 of 24
cash flow is a useful indicator for management and investors to assess the operating performance of the Group and compare it to other companies in the sector. Our calculation of free cash flow provides a clearer picture of our ability to generate net cash from operations, which is used for mandatory debt service requirements, to fund discretionary investments, pay dividends or pursue other strategic opportunities. For additional information on the Group’s non-IFRS measures used in this report, see ‘‘Non-IFRS Measures—Adjusted Measures’’ set forth above.
Free cash flow is not meant to be considered in isolation or as a substitute for items appearing on our financial statements prepared in accordance with IFRS. Rather, this non-IFRS measure should be used as a supplement to IFRS results to assist the reader in better understanding the operational performance of the Group.
The Group cautions that this measure is not a defined term under IFRS and its definition should be carefully reviewed and understood by investors.
Investors should be aware that our method of calculation of free cash flow may differ from methods used by other companies. We recognize that the usefulness of free cash flow as an evaluative tool may have certain limitations, including:
The manner in which we calculate free cash flow may differ from that of other companies, which limits its usefulness as a comparative measure;
Free cash flow does not represent the total increase or decrease in the net debt balance for the period since it excludes, among other things, cash used for funding discretionary investments and to pursue strategic opportunities during the period and any impact of the exchange rate changes; and
Free cash flow can be subject to adjustments at our discretion if we take steps or adopt policies that increase or diminish our current liabilities and/or changes to working capital.
We compensate for the foregoing limitations by using free cash flow as one of several comparative tools, together with IFRS measurements, to assist in the evaluation of the operating performance of the Group.
The following table provides a reconciliation of free cash flow to adjusted EBITDA and the table above provides a reconciliation of EBITDA to net income, which is the most directly comparable IFRS financial measure.
Management Report on the Interim Financial Results as of June 30, 2017 Page 21 of 24
Free Cash Flow (Euro m)
6M 2017
Adjusted EBITDA (1) 1,175.7 ∆ working capital (227.4) Capital expenditures (231.6) Operating cash flow 716.8 Financial charges (2) (62.3) Income taxes (164.0) Other income/(expense) – net (3) 44.6 Free Cash Flow 535.0
1) Adjusted EBITDA is not an IFRS measure; please see table above for a reconciliation of EBITDA and adjusted EBITDA to net
income. 2) Equals interest income minus interest expenses. 3) Equals extraordinary income minus extraordinary expenses.
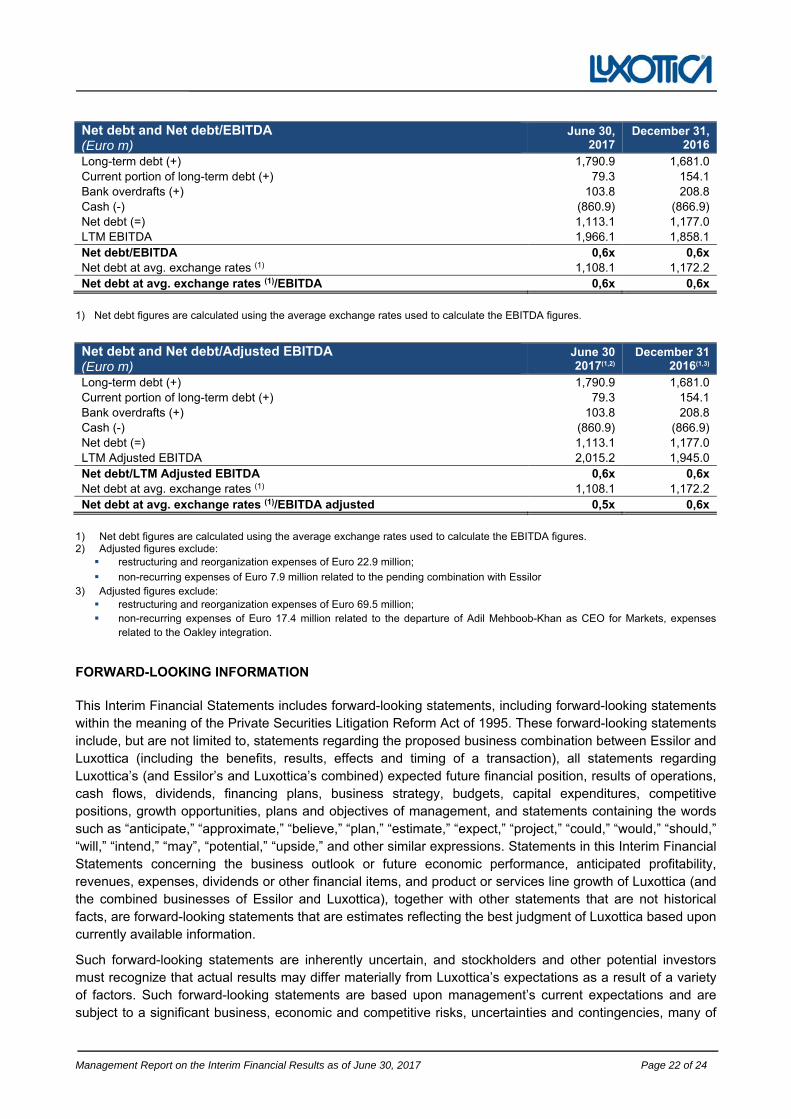
Net debt to EBITDA ratio
Net debt represents the sum of bank overdrafts, the current portion of long-term debt and non-current portion of long-term debt, less cash. The ratio of net debt to EBITDA is a measure used by management to assess the Group’s level of leverage, which affects our ability to refinance our debt as it matures and incur additional indebtedness to invest in new business opportunities.
The ratio also allows management to assess the cost of existing debt since it affects the interest rates charged by the Company’s lenders.
EBITDA and the ratio of net debt to EBITDA are not meant to be considered in isolation or as a substitute for items appearing on our financial statements prepared in accordance with IFRS. Rather, these non-IFRS measures should be used as a supplement to IFRS results to assist the reader in better understanding the operational performance of the Group. For additional information on the Group’s non-IFRS measures used in this report, see ‘‘Non-IFRS Measures—Adjusted Measures’’ set forth above.
Investors should be aware that Luxottica Group’s method of calculating EBITDA and the ratio of net debt to EBITDA may differ from methods used by other companies.
The Group recognizes that the usefulness of EBITDA and the ratio of net debt to EBITDA as evaluative tools may have certain limitations. In addition to the aforementioned EBITDA limitations, the ratio of net debt to EBITDA is net of cash and cash equivalents, restricted cash and short-term investments, thereby reducing our debt position.
Because we may not be able to use our cash to reduce our debt on a dollar-for-dollar basis, this measure may have material limitations.
We compensate for the foregoing limitations by using EBITDA and the ratio of net debt to EBITDA as two of several comparative tools, together with IFRS measurements, to assist in the evaluation of our operating performance and leverage.
See the table below for a reconciliation of net debt to long-term debt, which is the most directly comparable IFRS financial measure, as well as the calculation of the ratio of net debt to EBITDA. For a reconciliation of EBITDA and adjusted EBITDA to its most directly comparable IFRS measure, see the following table:
Management Report on the Interim Financial Results as of June 30, 2017 Page 22 of 24
Net debt and Net debt/EBITDA (Euro m)
June 30, 2017
December 31, 2016
Long-term debt (+) 1,790.9 1,681.0 Current portion of long-term debt (+) 79.3 154.1 Bank overdrafts (+) 103.8 208.8 Cash (-) (860.9) (866.9) Net debt (=) 1,113.1 1,177.0 LTM EBITDA 1,966.1 1,858.1 Net debt/EBITDA 0,6x 0,6x Net debt at avg. exchange rates (1) 1,108.1 1,172.2 Net debt at avg. exchange rates (1)/EBITDA 0,6x 0,6x
1) Net debt figures are calculated using the average exchange rates used to calculate the EBITDA figures.
Net debt and Net debt/Adjusted EBITDA (Euro m)
June 30 2017(1,2)
December 312016(1,3)
Long-term debt (+) 1,790.9 1,681.0 Current portion of long-term debt (+) 79.3 154.1 Bank overdrafts (+) 103.8 208.8 Cash (-) (860.9) (866.9) Net debt (=) 1,113.1 1,177.0 LTM Adjusted EBITDA 2,015.2 1,945.0 Net debt/LTM Adjusted EBITDA 0,6x 0,6x Net debt at avg. exchange rates (1) 1,108.1 1,172.2 Net debt at avg. exchange rates (1)/EBITDA adjusted 0,5x 0,6x
1) Net debt figures are calculated using the average exchange rates used to calculate the EBITDA figures. 2) Adjusted figures exclude: restructuring and reorganization expenses of Euro 22.9 million;
non-recurring expenses of Euro 7.9 million related to the pending combination with Essilor 3) Adjusted figures exclude: restructuring and reorganization expenses of Euro 69.5 million; non-recurring expenses of Euro 17.4 million related to the departure of Adil Mehboob-Khan as CEO for Markets, expenses
related to the Oakley integration.
FORWARD-LOOKING INFORMATION
This Interim Financial Statements includes forward-looking statements, including forward-looking statements within the meaning of the Private Securities Litigation Reform Act of 1995. These forward-looking statements include, but are not limited to, statements regarding the proposed business combination between Essilor and Luxottica (including the benefits, results, effects and timing of a transaction), all statements regarding Luxottica’s (and Essilor’s and Luxottica’s combined) expected future financial position, results of operations, cash flows, dividends, financing plans, business strategy, budgets, capital expenditures, competitive positions, growth opportunities, plans and objectives of management, and statements containing the words such as “anticipate,” “approximate,” “believe,” “plan,” “estimate,” “expect,” “project,” “could,” “would,” “should,” “will,” “intend,” “may”, “potential,” “upside,” and other similar expressions. Statements in this Interim Financial Statements concerning the business outlook or future economic performance, anticipated profitability, revenues, expenses, dividends or other financial items, and product or services line growth of Luxottica (and the combined businesses of Essilor and Luxottica), together with other statements that are not historical facts, are forward-looking statements that are estimates reflecting the best judgment of Luxottica based upon currently available information.
Such forward-looking statements are inherently uncertain, and stockholders and other potential investors must recognize that actual results may differ materially from Luxottica’s expectations as a result of a variety of factors. Such forward-looking statements are based upon management’s current expectations and are subject to a significant business, economic and competitive risks, uncertainties and contingencies, many of
Management Report on the Interim Financial Results as of June 30, 2017 Page 23 of 24
which are unknown and many of which Luxottica is unable to predict or control. Such factors may cause Luxottica’s actual results, performance or plans, or results, performance or plans with respect to the combined Essilor and Luxottica group, to differ materially from any future results, performance or plans expressed or implied by such forward-looking statements. These risks and uncertainties include, but are not limited to, the risk factors discussed or identified in public filings that have been, or will be, made by Essilor or Luxottica from time to time. Luxottica cautions investors that any forward-looking statements made by Luxottica are not guarantees of future performance. Luxottica disclaims any obligation to update any such factors or to announce publicly the results of any revisions to any of the forward-looking statements to reflect future events or developments.
Management Report on the Interim Financial Results as of June 30, 2017 Page 24 of 24
**********
Milan, July 24, 2017
Luxottica Group S.p.A.
On behalf of the Board of Directors
Leonardo Del Vecchio (Executive Chairman)
Massimo Vian(CEO for Product and Operations)
CONDENSED CONSOLIDATED FINANCIAL
STATEMENTS AS OF JUNE 30, 2017
Condensed Consolidated Financial Statements as of June 30, 2017 Page 1 of 6
CONSOLIDATED STATEMENT OF FINANCIAL POSITION Pursuant to CONSOB Resolution No. 15519 of July 27, 2006
ASSETS (Euro/000)
Note June 30,
2017
Of which related parties
(note 30)
December 31, 2016
Of which related parties
(note 30)
CURRENT ASSETS:
Cash and cash equivalents 6 860,925 - 866,864 -
Accounts receivable 7 1,132,032 1,570 932,340 1,687
Inventories 8 872,817 - 893,472 -
Other current assets* 9 238,476 2,476 287,759 5,301
Assets held for sale 10 - - 51,284 -
Total current assets 3,104,250 4,046 3,031,718 6,988
NON-CURRENT ASSETS:
Property, plant and equipment 11 1,643,443 - 1,672,554 -
Goodwill* 12 3,660,190 - 3,864,955 -
Intangible assets 12 1,311,272 17,326 1,477,316 10,296
Investments 13 17,294 5,390 20,186 7,720
Other non-current assets 14 84,645 - 97,300 -
Deferred tax assets 15 145,597 - 133,369 -
Total non-current assets 6,862,440 22,717 7,265,681 18,016
TOTAL ASSETS 9,966,690 26,762 10,297,400 25,005
LIABILITIES AND STOCKHOLDERS’ EQUITY (Euro/000)
Note June 30,
2017
Of which related parties
(note 30)
December 31, 2016
Of which related parties
(note 30)
CURRENT LIABILITIES:
Short-term borrowings 16 103,798 - 208,813 -
Current portion of long-term debt 17 79,337 - 154,094 -
Accounts payable 18 870,712 13,346 944,402 21,159
Income taxes payable 19 113,475 - 17,238 -
Short-term provisions for risks and other charges 20 154,836 - 145,701 -
Other current liabilities 21 711,231 6 745,921 -
Total current liabilities 2,033,389 13,352 2,216,168 21,159
NON-CURRENT LIABILITIES: -
Long-term debt 22 1,790,922 - 1,680,951 -
Employee benefits 23 147,837 - 159,364 -
Deferred tax liabilities 15 228,774 - 257,036 -
Long-term provisions for risks and other charges 24 116,861 - 122,107 -
Other liabilities 25 70,309 - 79,783 -
Total non-current liabilities 2,354,703 - 2,299,241 -
STOCKHOLDERS’ EQUITY: -
Capital Stock 26 29,096 - 29,051 -
Legal reserve 26 5,811 - 5,805 -
Other reserves* 26 5,233,370 - 5,160,411 -
Treasury shares 26 (256,678) - (269,755) -
Net income attributable to the Group 26 561,612 - 850,524 -
Luxottica Group stockholders’ equity 27 5,573,211 - 5,776,036 -
Minority interests 27 5,387 - 5,954 -
Total stockholders’ equity 5,578,598 - 5,781,990 -
TOTAL LIABILITIES AND STOCKHOLDERS’ EQUITY
9,966,690 13,352 10,297,400 21,159
*The balances of goodwill, stockholders’ equity and other current assets were restated by Euro 6.5 million, Euro 2.4 million and Euro 4.1 million, respectively, to reflect the effects described in Note 4−Business Combinations of the Notes, which are referred to for further details.
Condensed Consolidated Financial Statements as of June 30, 2017 Page 2 of 6
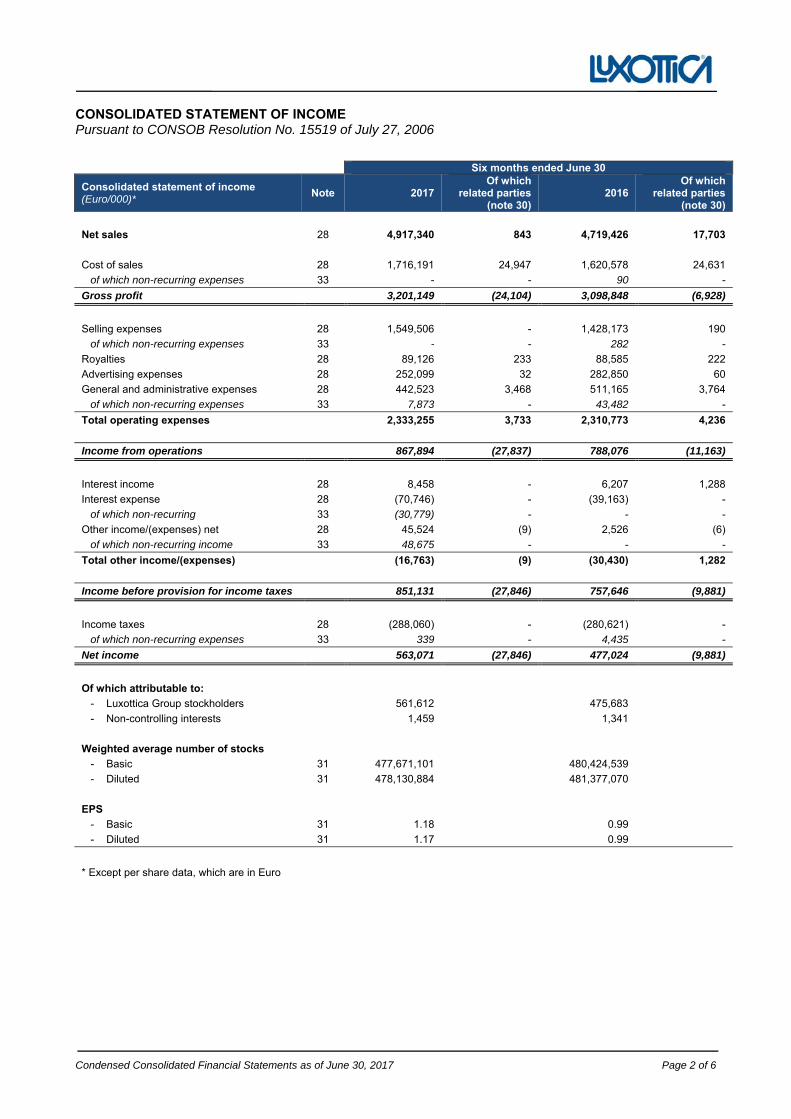
CONSOLIDATED STATEMENT OF INCOME Pursuant to CONSOB Resolution No. 15519 of July 27, 2006
Six months ended June 30
Consolidated statement of income (Euro/000)*
Note 2017 Of which
related parties (note 30)
2016 Of which
related parties (note 30)
Net sales 28 4,917,340 843 4,719,426 17,703
Cost of sales 28 1,716,191 24,947 1,620,578 24,631
of which non-recurring expenses 33 - - 90 -
Gross profit 3,201,149 (24,104) 3,098,848 (6,928)
Selling expenses 28 1,549,506 - 1,428,173 190
of which non-recurring expenses 33 - - 282 -
Royalties 28 89,126 233 88,585 222
Advertising expenses 28 252,099 32 282,850 60
General and administrative expenses 28 442,523 3,468 511,165 3,764
of which non-recurring expenses 33 7,873 - 43,482 -
Total operating expenses 2,333,255 3,733 2,310,773 4,236
Income from operations 867,894 (27,837) 788,076 (11,163)
Interest income 28 8,458 - 6,207 1,288
Interest expense 28 (70,746) - (39,163) -
of which non-recurring 33 (30,779) - - -
Other income/(expenses) net 28 45,524 (9) 2,526 (6)
of which non-recurring income 33 48,675 - - -
Total other income/(expenses) (16,763) (9) (30,430) 1,282
Income before provision for income taxes 851,131 (27,846) 757,646 (9,881)
Income taxes 28 (288,060) - (280,621) -
of which non-recurring expenses 33 339 - 4,435 -
Net income 563,071 (27,846) 477,024 (9,881)
Of which attributable to:
- Luxottica Group stockholders 561,612 475,683
- Non-controlling interests 1,459 1,341
Weighted average number of stocks
- Basic 31 477,671,101 480,424,539
- Diluted 31 478,130,884 481,377,070
EPS
- Basic 31 1.18 0.99
- Diluted 31 1.17 0.99
* Except per share data, which are in Euro
Condensed Consolidated Financial Statements as of June 30, 2017 Page 3 of 6
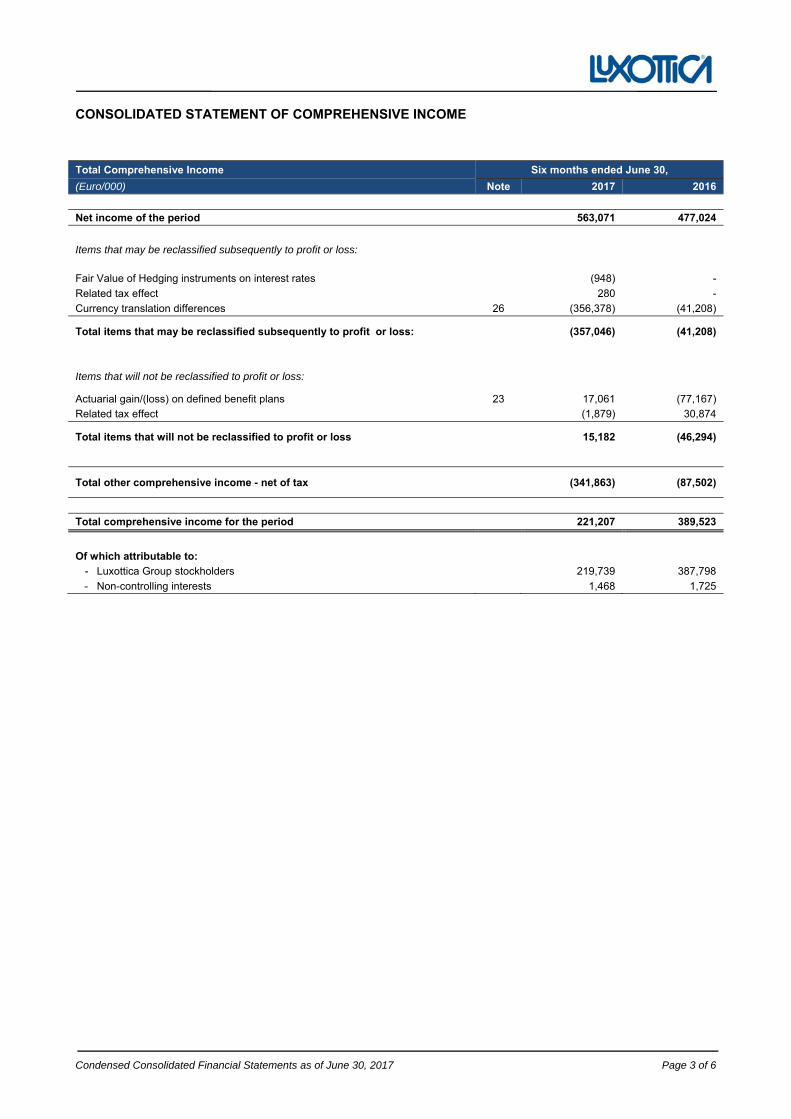
CONSOLIDATED STATEMENT OF COMPREHENSIVE INCOME
Total Comprehensive Income Six months ended June 30,
(Euro/000) Note 2017 2016
Net income of the period 563,071 477,024
Items that may be reclassified subsequently to profit or loss:
Fair Value of Hedging instruments on interest rates (948) -
Related tax effect 280 -
Currency translation differences 26 (356,378) (41,208)
Total items that may be reclassified subsequently to profit or loss: (357,046) (41,208)
Items that will not be reclassified to profit or loss:
Actuarial gain/(loss) on defined benefit plans 23 17,061 (77,167)
Related tax effect (1,879) 30,874
Total items that will not be reclassified to profit or loss 15,182 (46,294)
Total other comprehensive income - net of tax (341,863) (87,502)
Total comprehensive income for the period 221,207 389,523
Of which attributable to:
- Luxottica Group stockholders 219,739 387,798
- Non-controlling interests 1,468 1,725
Condensed Consolidated Financial Statements as of June 30, 2017 Page 4 of 6
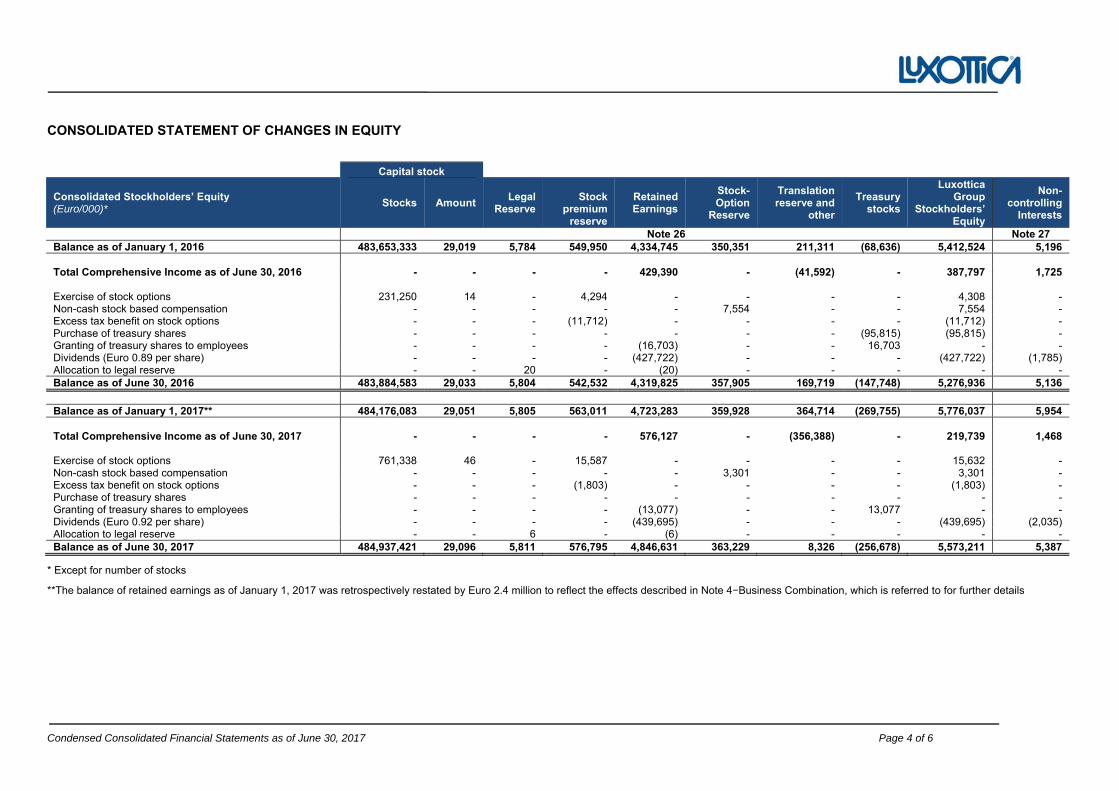
CONSOLIDATED STATEMENT OF CHANGES IN EQUITY
Capital stock
Consolidated Stockholders’ Equity (Euro/000)*
Stocks Amount Legal
Reserve Stock
premium reserve
Retained Earnings
Stock-Option
Reserve
Translation reserve and
other
Treasurystocks
Luxottica Group
Stockholders’ Equity
Non-controlling
Interests
Note 26 Note 27 Balance as of January 1, 2016 483,653,333 29,019 5,784 549,950 4,334,745 350,351 211,311 (68,636) 5,412,524 5,196
Total Comprehensive Income as of June 30, 2016 - - - - 429,390 - (41,592) - 387,797 1,725
Exercise of stock options 231,250 14 - 4,294 - - - - 4,308 - Non-cash stock based compensation - - - - - 7,554 - - 7,554 - Excess tax benefit on stock options - - - (11,712) - - - - (11,712) - Purchase of treasury shares - - - - - - - (95,815) (95,815) - Granting of treasury shares to employees - - - - (16,703) - - 16,703 - - Dividends (Euro 0.89 per share) - - - - (427,722) - - - (427,722) (1,785) Allocation to legal reserve - - 20 - (20) - - - - - Balance as of June 30, 2016 483,884,583 29,033 5,804 542,532 4,319,825 357,905 169,719 (147,748) 5,276,936 5,136
Balance as of January 1, 2017** 484,176,083 29,051 5,805 563,011 4,723,283 359,928 364,714 (269,755) 5,776,037 5,954
Total Comprehensive Income as of June 30, 2017 - - - - 576,127 - (356,388) - 219,739 1,468
Exercise of stock options 761,338 46 - 15,587 - - - - 15,632 - Non-cash stock based compensation - - - - - 3,301 - - 3,301 - Excess tax benefit on stock options - - - (1,803) - - - - (1,803) - Purchase of treasury shares - - - - - - - - - - Granting of treasury shares to employees - - - - (13,077) - - 13,077 - - Dividends (Euro 0.92 per share) - - - - (439,695) - - - (439,695) (2,035) Allocation to legal reserve - - 6 - (6) - - - - - Balance as of June 30, 2017 484,937,421 29,096 5,811 576,795 4,846,631 363,229 8,326 (256,678) 5,573,211 5,387
* Except for number of stocks
**The balance of retained earnings as of January 1, 2017 was retrospectively restated by Euro 2.4 million to reflect the effects described in Note 4−Business Combination, which is referred to for further details
Condensed Consolidated Financial Statements as of June 30, 2017 Page 5 of 6
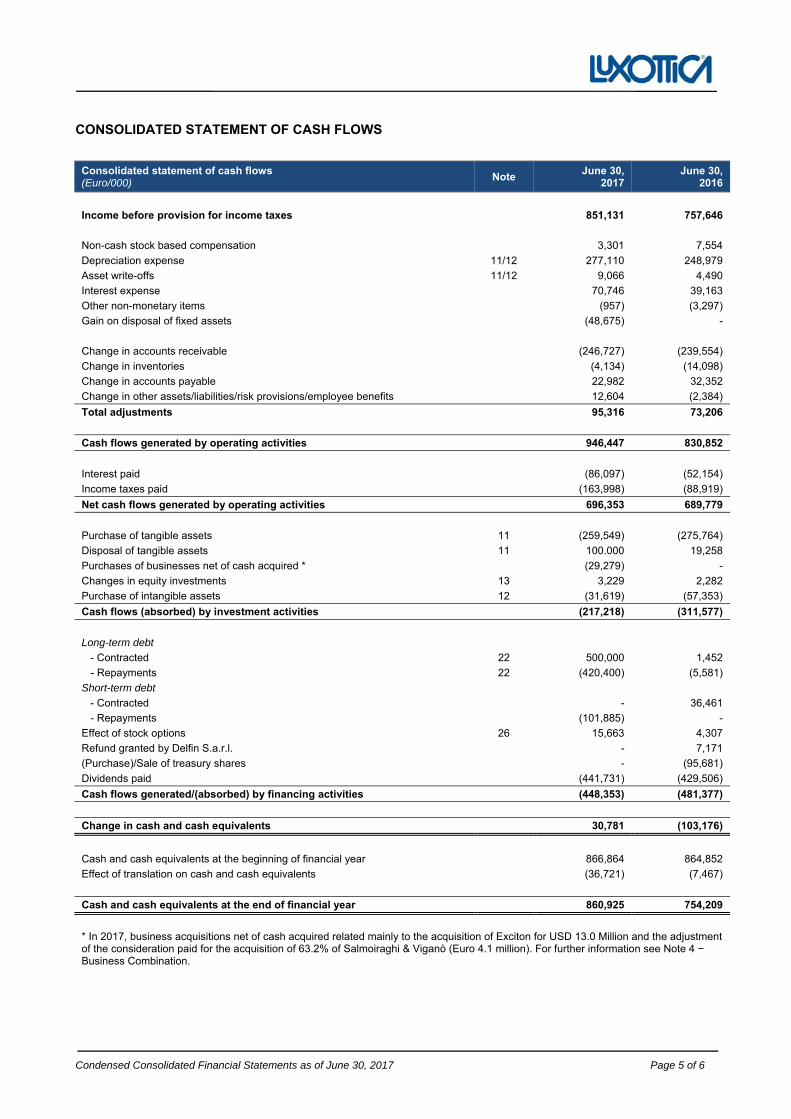
CONSOLIDATED STATEMENT OF CASH FLOWS
Consolidated statement of cash flows (Euro/000)
Note June 30,
2017 June 30,
2016
Income before provision for income taxes 851,131 757,646
Non-cash stock based compensation 3,301 7,554
Depreciation expense 11/12 277,110 248,979
Asset write-offs 11/12 9,066 4,490
Interest expense 70,746 39,163
Other non-monetary items (957) (3,297)
Gain on disposal of fixed assets (48,675) -
Change in accounts receivable (246,727) (239,554)
Change in inventories (4,134) (14,098)
Change in accounts payable 22,982 32,352
Change in other assets/liabilities/risk provisions/employee benefits 12,604 (2,384)
Total adjustments 95,316 73,206
Cash flows generated by operating activities 946,447 830,852
Interest paid (86,097) (52,154)
Income taxes paid (163,998) (88,919)
Net cash flows generated by operating activities 696,353 689,779
Purchase of tangible assets 11 (259,549) (275,764)
Disposal of tangible assets 11 100.000 19,258
Purchases of businesses net of cash acquired * (29,279) -
Changes in equity investments 13 3,229 2,282
Purchase of intangible assets 12 (31,619) (57,353)
Cash flows (absorbed) by investment activities (217,218) (311,577)
Long-term debt
- Contracted 22 500,000 1,452
- Repayments 22 (420,400) (5,581)
Short-term debt
- Contracted - 36,461
- Repayments (101,885) -
Effect of stock options 26 15,663 4,307
Refund granted by Delfin S.a.r.l. - 7,171
(Purchase)/Sale of treasury shares - (95,681)
Dividends paid (441,731) (429,506)
Cash flows generated/(absorbed) by financing activities (448,353) (481,377)
Change in cash and cash equivalents 30,781 (103,176)
Cash and cash equivalents at the beginning of financial year 866,864 864,852
Effect of translation on cash and cash equivalents (36,721) (7,467)
Cash and cash equivalents at the end of financial year 860,925 754,209
* In 2017, business acquisitions net of cash acquired related mainly to the acquisition of Exciton for USD 13.0 Million and the adjustment of the consideration paid for the acquisition of 63.2% of Salmoiraghi & Viganò (Euro 4.1 million). For further information see Note 4 − Business Combination.
Condensed Consolidated Financial Statements as of June 30, 2017 Page 6 of 6
**********
Milan, July 24, 2017
Luxottica Group S.p.A.
On behalf of the Board of Directors
Leonardo Del Vecchio Massimo Vian (Executive Chairman) (CEO for Product and Operations)
NOTES TO THE CONDENSED CONSOLIDATED
FINANCIAL STATEMENTS AS OF JUNE 30,
2017
Luxottica Group S.p.A. Headquarters and registered office: Piazzale Luigi Cadorna, 3, 20123 Milan, Italy
Capital Stock € 29,096,245.26 authorized and issued
NOTES TO THE
CONDENSED CONSOLIDATED FINANCIAL STATEMENTS
AS OF JUNE 30, 2017
Notes to the Condensed Consolidated Financial Statements as of June 30, 2017 Page 1 of 31
1. GENERAL INFORMATION
Luxottica Group S.p.A. (hereinafter the ‘‘Company’’ or together with its consolidated subsidiaries, the ‘‘Group’’) is a company listed on Borsa Italiana with its registered office located in Milan, Italy, at Piazzale Luigi Cadorna 3, organized under the laws of the Republic of Italy.
The Group operates in two segments, which make up sales: (i) manufacturing and wholesale distribution (hereinafter also “Manufacturing & Wholesale” or “Wholesale”); and (ii) retail distribution (hereinafter also “Retail”). In manufacturing and wholesale, the Group is a leader in the design, production and distribution of high-end luxury and sports eyewear, with a strong and well balanced brand portfolio both of its own and in licensed.
The Company is controlled by Delfin S.à r.l., a company subject to Luxembourg law. The chairman of the Board of Directors of the Company, Leonardo Del Vecchio, controls Delfin S.à r.l..
The Company’s Board of Directors, at its meeting on July 24, 2017, approved the Group’s condensed consolidated interim financial statements as of June 30, 2017 (hereinafter referred to as the ‘‘Financial Report’’) for publication. The financial statements included in this Financial Report are unaudited.
2. BASIS OF PREPARATION
This Financial Report as of, June 30, 2017 has been prepared in accordance with article 154-ter of the Legislative Decree No. 58 of February 24, 1998 and subsequent modifications and in accordance with the CONSOB Issuers Regulation in compliance with the International Financial Reporting Standards (‘‘IFRS’’) issued by the International Accounting Standards Board (‘‘IASB’’) and endorsed by the European Union in accordance with the regulation (CE) n. 1606/2002 of the European Parliament and of the Council dated July 19, 2002. Furthermore, this Financial Report has been prepared in accordance with International Accounting Standard (‘‘IAS’’) 34—Interim Financial Reporting, and of the provisions which implement Article 9 of Legislative Decree no. 38/2005.
Notes to the Condensed Consolidated Financial Statements as of June 30, 2017 Page 2 of 31
IFRS are all the international accounting standards (‘‘IAS’’) and all the interpretations of the International Financial Reporting Interpretations Committee (‘‘IFRIC’’), previously named the Standing Interpretations Committee (‘‘SIC’’).
This Financial Report as of, June 30, 2017 should be read in connection with the consolidated financial statements as of December 31, 2016 which were prepared in accordance with IFRS, as endorsed by the European Union.
In accordance with IAS 34, the Group has chosen to publish a set of condensed financial statements in its financial report as of June 30, 2017.
The principles and standards used in the preparation of this unaudited Financial Report are consistent with those used in preparing the audited consolidated financial statements as of December 31, 2016 except taxes on income which are accrued using the tax rate that would be applicable to projected total annual profit.
This Financial Report as of June 30, 2017 has been prepared on a going concern basis. Management believes that there are no indicators that may cast significant doubt upon the Group’s ability to continue as a going concern, in particular, over the next twelve months.
This Financial Report is composed of the Consolidated Statements of Financial Position, the Consolidated Statements of Income, the Consolidated Statements of Comprehensive Income, the Consolidated Statements of Changes in Equity, the Consolidated Statements of Cash Flows and Notes to the Condensed Consolidated Financial Statements as of June 30, 2017.
The Group’s reporting currency for the presentation of the Consolidated Financial Statements is the Euro. Unless otherwise specified, the figures in the statements and within these Notes to the Consolidated Financial Statements are expressed in thousands of Euro.
The Group presents its Consolidated Statements of Income using the function of expense method. The Company presents current and non-current assets and current and non-current liabilities as separate classifications in its consolidated statements of financial position. This presentation of the Consolidated Statements of Income and of the Consolidated Statements of Financial Position is believed to provide the most relevant information. The Consolidated Statements of Cash Flows was prepared and presented utilizing the indirect method.
The Financial Statements were prepared using the historical cost convention, with the exception of certain financial assets and liabilities for which measurement at fair value is required.
The Group applied CONSOB resolution n. 15519 dated July 27, 2006 and CONSOB communication n. 6064293 dated July 28, 2006, which defines non-recurring transactions as events which do not occur frequently in the ordinary course of business.
The preparation of this report required management to use estimates and assumptions that affected the reported amounts of revenue, costs, assets and liabilities, as well as disclosures relating to contingent assets and liabilities at the reporting date. Results published on the basis of such estimates and assumptions could vary from actual results that may be realized in the future.
These measurement processes and, in particular, those that are more complex, such as the calculation of impairment losses on non-current assets, and the actuarial calculations necessary to calculate certain employee benefits liabilities, are generally carried out only when the audited consolidated financial statements for the fiscal year are prepared, unless there are indicators which require updates to the applicable estimates.
Notes to the Condensed Consolidated Financial Statements as of June 30, 2017 Page 3 of 31
3. NEW ACCOUNTING PRINCIPLES
New and amended accounting standards and interpretations, if not early adopted, must be adopted in the financial statements issued after the applicable effective date.
New standard and amendments that are effective for the reporting periods beginning on January 1, 2017.
There are no new standards, amendments to existing standards or interpretations effective for periods beginning on January 1, 2017 such as to require changes to accounting policies or retrospective adjustments following first application.
New standard and amendments that are effective for the reporting periods beginning after January 1, 2017 and not early adopted by the Group.
IFRS 16—Leases. The standard replaces IAS 17—Leases and requires all leases to be recorded on the balance sheet as assets and liabilities. The standard is not applicable until January 1, 2019, unless changes after the European Union endorsement which has not yet occurred as of the date this Financial Report was authorized for issue. An entity can apply IFRS 16 before that date but only if it also applies IFRS 15—Revenue from contracts with customers.
Assessment of the types of leasing contracts entered into by the Group is underway, with particular reference to store leases in the retail segment, an area subject to detailed analysis aimed at quantifying the effects of the application of the standard which, although not yet determined, we expect to be significant.
IFRS 15—Revenue from Contracts with Customers. This standard replaces IAS 18—Revenues, IAS 11—Construction Contracts, IFRIC 13—Customer Loyalty Programs, IFRIC 15—Agreements for Constructions of Real Estate, IFRIC 18—Transfers of Assets from Customers and SIC 31—Revenue—Barter Transactions Involving Advertising Services. Revenue is recognized when the customer obtains control over goods or services and, therefore, when it has the ability to direct the use of and obtain the benefit from them. If an entity agrees to provide goods or services for consideration that varies upon certain future events occurring or not occurring, an estimate of this variable consideration is included in the transaction price only if highly probable. The consideration in multiple element transactions is allocated based on the price an entity would charge a customer on a stand-alone basis for each good or service. Entities sometimes incur costs, such as sales commissions, to obtain or fulfill a contract. Contract costs that meet certain criteria are capitalized as an asset and are amortized as revenue is recognized. The standard also specifies that an entity should adjust the transaction price for the time value of money in case the contract includes a significant financing component. IFRS 15 is applicable to periods beginning on or after January 1, 2018.
The directors have carried out a preliminary analysis of the sales contracts concluded by the Group. Quantification of the impacts arising from the application of the new standard is currently underway.
IFRS 9—Financial instruments. This standard was issued on July 24, 2014. The final version of IFRS 9 brings together the classification and measurement, impairment and hedge accounting phases of the IASB’s project to replace IAS 39—Financial instruments: recognition and measurement. IFRS 9 introduces new requirements for classifying and measuring financial assets. The new standard reduces to three the number of categories of financial assets pursuant to IAS 39 and requires that all financial assets be: (i) classified on the basis of the model which a company has adopted in order to manage its financial activities and on the basis of the cash flows from financing activities; (ii) initially measured at fair value plus any transaction costs in the case of financial assets not measured at fair value through profit and loss; and (iii) subsequently measured at their fair value or at the amortized cost. IFRS 9 also provides that embedded derivatives which
Notes to the Condensed Consolidated Financial Statements as of June 30, 2017 Page 4 of 31
fall within the scope of IFRS 9 must no longer be separated from the primary contract which contains them and states that a company may decide to directly record—within the consolidated statement of comprehensive income—any changes in the fair value of investments which fall within the scope of IFRS 9. The new model introduced by IFRS 9 eliminates the threshold for the recognition of expected impairment losses, so that it is no longer necessary for a trigger event to have occurred before impairment losses are recognized, and requires an entity to recognize expected impairment losses at all times and to update the amount of expected impairment losses at each reporting date to reflect changes in the credit risk of the financial instrument. IFRS 9 contains a three-stage approach to account for impairment losses. Each stage dictates how an entity measures impairment losses. IFRS 9 aligns hedge accounting with risk management activities undertaken by companies when hedging their financial and non-financial risk exposures. The new standard enables an entity to use information produced internally as a basis for hedge accounting. The standard is not applicable until January 1, 2018.
Quantification of the impacts arising from the application of the new standard is currently underway. On the basis of the information available at the present time, we do not expect any significant effects.
In addition to the above, the Group is assessing the full impact of the new and amended accounting standards and interpretations on its consolidated financial statements. On the basis of the information available at the present time, we do not expect any significant effects.
Amendments to IAS 12—Recognition of Deferred Tax Assets on Unrealized Losses. The amendments provide clarifications on the recognition of deferred tax assets on debt instruments measured at fair value. The amendments will be applicable after the European Union endorsement, which has not yet occurred as of the date this Financial Report was authorized for issue.
Amendments to IAS 7—Disclosure Initiatives. The amendments will require entities to provide disclosures that enable investors to evaluate changes in liabilities arising from financing activities. The amendments will be applicable after the European Union endorsement, which has not yet occurred as of the date this Financial Report was authorized for issue.
Clarifications to IFRS 15—Revenue from contracts with customers. The objective of the document is to clarify the guidance in IFRS 15 in respect of issues arising from the discussions of the Transition Resource Group for Revenue Recognition (TRG). The clarifications are applicable to periods beginning on or after January 1, 2018 unless changed after the European Union endorsement, which has not yet occurred as of the date this Financial Report was authorized for issue.
Amendments to IFRS 2—Clarification and Measurement of Share-based Payment Transaction. These amendments clarify the accounting treatment in relation to profits or losses arising from share-based payment transactions. The clarifications are applicable to periods beginning on or after January 1, 2018 unless changed after the European Union endorsement, which has not yet occurred as of the date this Financial Report was authorized for issue.
Amendments to IFRS 4—Applying IFRS 9 Financial instruments with IFRS 4 Insurance contracts. The amendments introduced aim to better define the accounting treatment of insurance contracts in light of the new provisions to be introduced by IFRS 9. The clarifications are applicable to periods beginning on or after January 1, 2018 unless changed after the European Union endorsement, which has not yet occurred as of the date this Financial Report was authorized for issue.
Annual Improvements to IFRSs—2014-2016 Cycle. The amendment will modify: (i) IFRS 1, eliminating short-term exemptions for first-time adopters; (ii) IAS 28 concerning the accounting of investments in associates and joint ventures; (iii) IFRS 12, clarifying the extension of the standard. The clarifications are applicable to periods beginning on or after January 1, 2018 unless changed after the European Union endorsement, which
Notes to the Condensed Consolidated Financial Statements as of June 30, 2017 Page 5 of 31
has not yet occurred as of the date this Financial Report was authorized for issue.
IFRIC Interpretation 22—Foreign currency transactions and advance considerations. These amendments clarify the accounting treatment in relation to profits or losses arising from foreign currency transactions. The clarifications are applicable to periods beginning on or after January 1, 2018 unless changed after the European Union endorsement, which has not yet occurred as of the date this Financial Report was authorized for issue.
IFRIC 23—Uncertainty over Income Tax Treatments. The new international accounting standard will provide guidance on how to reflect uncertainty over determined income tax treatments in income tax accounting. The standard is not applicable until January 1, 2019, unless changes after the European Union endorsement, which has not yet occurred as of the date this Financial Report was authorized for issue.
IFRS 17—Insurance contracts. The new international accounting standard for the treatment of insurance contracts will replace IFRS 4. The standard is not applicable until January 1, 2021, unless changes after the European Union endorsement, which has not yet occurred as of the date this Financial Report was authorized for issue.
Amendments to IFRS 10 and IAS 28—Sale or Contribution of Assets between an Investor and its Associate or Joint Venture. These amendments clarify the accounting treatment in relation to profits or losses arising from transactions with joint ventures or associates accounted for using the equity method. The application date has not yet been defined, as of the date this Financial Report was authorized for issue.
Notes to the Condensed Consolidated Financial Statements as of June 30, 2017 Page 6 of 31
4. BUSINESS COMBINATIONS
Salmoiraghi & Viganò
In execution of the agreement signed in 2012 with Fenix S.r.l. (the “Contract”), formerly Salmoiraghi & Viganò Holding, on November 25, 2016 Luxottica Group S.p.A. exercised the option to purchase 63.2% of Salmoiraghi & Viganò S.p.A. (hereinafter, also “Salmoiraghi & Viganò” or “S&V”). On such date Luxottica Group S.p.A. acquired control of the company and thus, with effect as of November 25, 2016, the Luxottica Group’s investment in Salmoiraghi & Viganò, classified until November 25, 2016 as an investment in an associate and valued using the equity method, was fully consolidated pursuant to the provisions of IFRS 10—Consolidated Financial Statements.
The acquisition of the controlling stake in Salmoiraghi & Viganò was a business combination achieved in stages, recognized in accordance with IFRS 3—Business Combinations (“IFRS 3”).
For the purposes of the consolidated financial statements as of December 31, 2016, in accordance with the provisions of IFRS 3, the fair value of the assets and liabilities acquired, as well as the consideration for the acquisition was determined on a provisional basis, since certain valuation processes had not yet been finalized at the balance sheet date. This valuation resulted in the provisional determination of goodwill equal to Euro 190 million.
As of June 30, 2017 the valuation processes relating to the acquisition of Salmoiraghi & Viganò S.p.A. had been completed and, consequently, the comparative figures for the financial information as of December 31, 2016 were restated on the basis of the definitive figures. Reconciliation of the figures estimated on a provisional basis and those determined definitively is shown below.
(Euro/000) December 31,
2016Price
adjustment June 30,
2017
Acquisition value 100% (A) 237,830 (6,487) 231,343 Fair value of acquired net assets (B) 47,850 47,850 Goodwill (C=A-B) 189,980 (6,487) 183,493
Consideration for acquisition (D) 150,308 (4,100) 146,208 Cash and cash equivalents in the acquired company (E) (22,792) (22,792) Cash flow absorbed by the acquisition (F=E-D) 127,516 (4,100) 123,416
The redetermination of the transaction on the basis of the above information resulted in: (i) a Euro 4.1 million reduction of the value of the investment held by Luxottica Group S.p.A. in Salmoiraghi e Viganò S.p.A.; (ii) a Euro 2.4 million reduction of the adjustment between the value of the shareholding (equal to 36.8%) held prior to the year of the above transaction and its fair value; and (iii) a Euro 6.5 million reduction of the goodwill generated by the acquisition.
Consequently, in accordance with the provisions of IFRS 3, the comparative information as of December 31, 2016 was retrospectively modified to reflect the above changes. In particular, stockholders’ equity was reduced by Euro 2.4 million, goodwill was reduced by Euro 6.5 million and other current liabilities was increased by Euro 4.1 million.
Exciton
On January 27, 2017 the Group acquired the assets of the company Exciton for a consideration of USD 13.0 million (approx. Euro 12.2 million). This acquisition is considered a business combination in accordance with the provisions of IFRS 3. The difference between the acquisition price and the fair value of the assets acquired at such date was accounted for with a goodwill of Euro 9.0 million. The goodwill arises mainly from
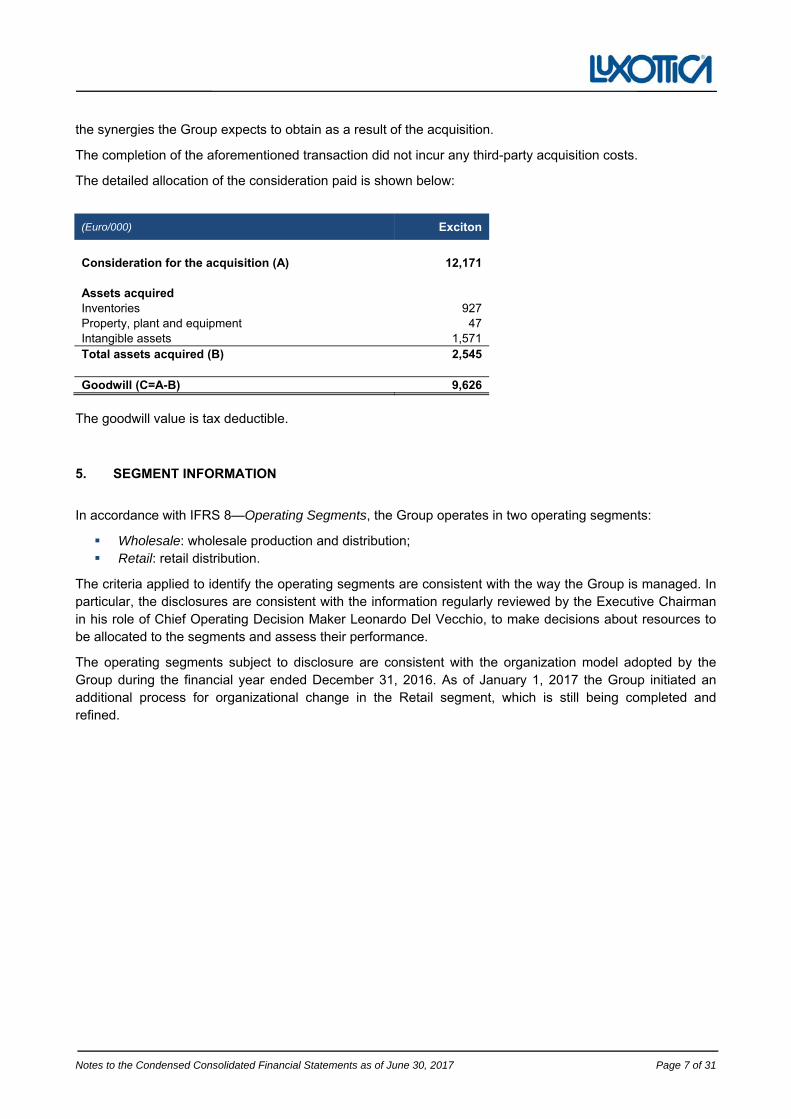
Notes to the Condensed Consolidated Financial Statements as of June 30, 2017 Page 7 of 31
the synergies the Group expects to obtain as a result of the acquisition.
The completion of the aforementioned transaction did not incur any third-party acquisition costs.
The detailed allocation of the consideration paid is shown below:
(Euro/000) Exciton
Consideration for the acquisition (A) 12,171
Assets acquired Inventories 927 Property, plant and equipment 47 Intangible assets 1,571 Total assets acquired (B) 2,545
Goodwill (C=A-B) 9,626
The goodwill value is tax deductible.
5. SEGMENT INFORMATION
In accordance with IFRS 8—Operating Segments, the Group operates in two operating segments:
Wholesale: wholesale production and distribution; Retail: retail distribution.
The criteria applied to identify the operating segments are consistent with the way the Group is managed. In particular, the disclosures are consistent with the information regularly reviewed by the Executive Chairman in his role of Chief Operating Decision Maker Leonardo Del Vecchio, to make decisions about resources to be allocated to the segments and assess their performance.
The operating segments subject to disclosure are consistent with the organization model adopted by the Group during the financial year ended December 31, 2016. As of January 1, 2017 the Group initiated an additional process for organizational change in the Retail segment, which is still being completed and refined.
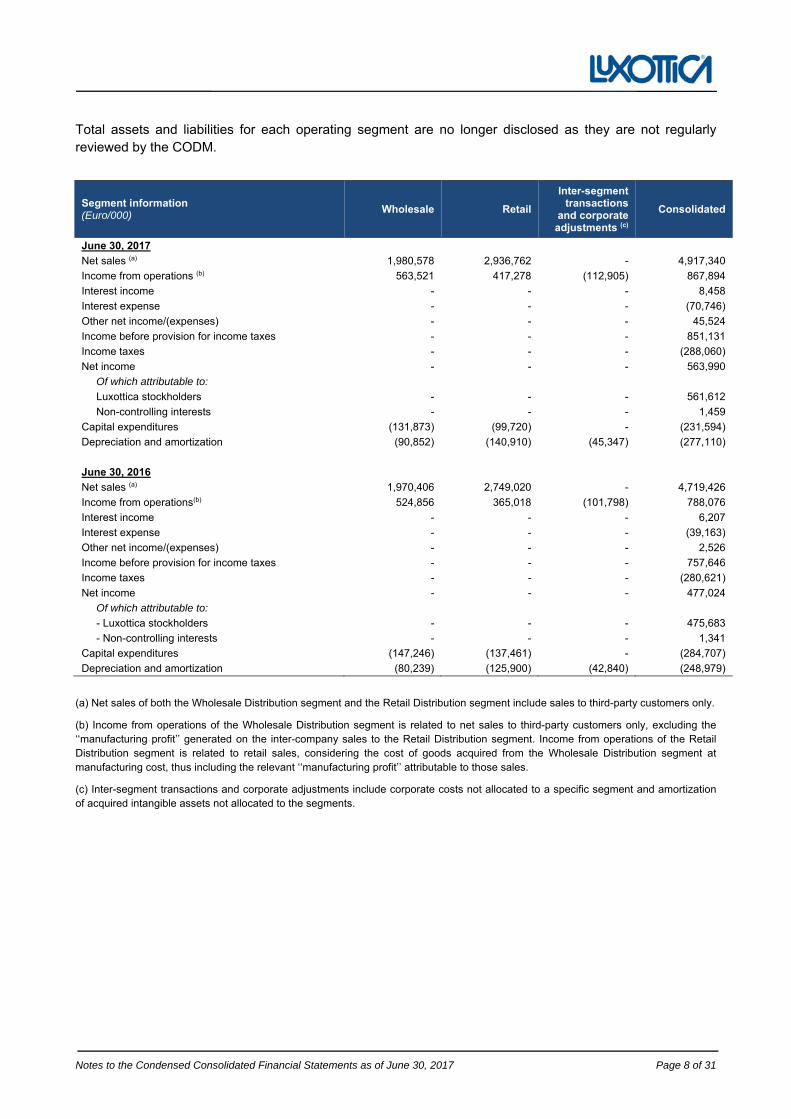
Notes to the Condensed Consolidated Financial Statements as of June 30, 2017 Page 8 of 31
Total assets and liabilities for each operating segment are no longer disclosed as they are not regularly reviewed by the CODM.
Segment information (Euro/000)
Wholesale Retail
Inter-segment transactions
and corporate adjustments (c)
Consolidated
June 30, 2017
Net sales (a) 1,980,578 2,936,762 - 4,917,340
Income from operations (b) 563,521 417,278 (112,905) 867,894
Interest income - - - 8,458
Interest expense - - - (70,746)
Other net income/(expenses) - - - 45,524
Income before provision for income taxes - - - 851,131
Income taxes - - - (288,060)
Net income - - - 563,990
Of which attributable to:
Luxottica stockholders - - - 561,612
Non-controlling interests - - - 1,459
Capital expenditures (131,873) (99,720) - (231,594)
Depreciation and amortization (90,852) (140,910) (45,347) (277,110)
June 30, 2016
Net sales (a) 1,970,406 2,749,020 - 4,719,426
Income from operations(b) 524,856 365,018 (101,798) 788,076
Interest income - - - 6,207
Interest expense - - - (39,163)
Other net income/(expenses) - - - 2,526
Income before provision for income taxes - - - 757,646
Income taxes - - - (280,621)
Net income - - - 477,024
Of which attributable to:
- Luxottica stockholders - - - 475,683
- Non-controlling interests - - - 1,341
Capital expenditures (147,246) (137,461) - (284,707)
Depreciation and amortization (80,239) (125,900) (42,840) (248,979)
(a) Net sales of both the Wholesale Distribution segment and the Retail Distribution segment include sales to third-party customers only.
(b) Income from operations of the Wholesale Distribution segment is related to net sales to third-party customers only, excluding the ‘‘manufacturing profit’’ generated on the inter-company sales to the Retail Distribution segment. Income from operations of the Retail Distribution segment is related to retail sales, considering the cost of goods acquired from the Wholesale Distribution segment at manufacturing cost, thus including the relevant ‘‘manufacturing profit’’ attributable to those sales.
(c) Inter-segment transactions and corporate adjustments include corporate costs not allocated to a specific segment and amortization of acquired intangible assets not allocated to the segments.
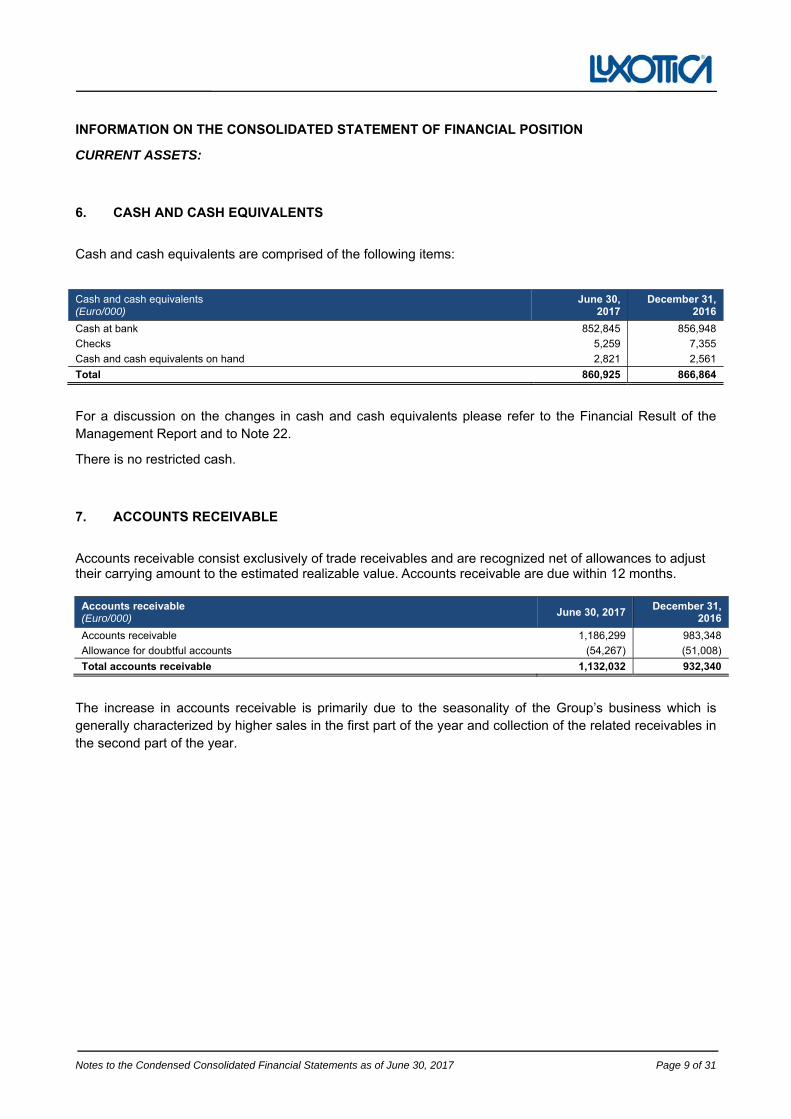
Notes to the Condensed Consolidated Financial Statements as of June 30, 2017 Page 9 of 31
INFORMATION ON THE CONSOLIDATED STATEMENT OF FINANCIAL POSITION
CURRENT ASSETS:
6. CASH AND CASH EQUIVALENTS
Cash and cash equivalents are comprised of the following items:
Cash and cash equivalents (Euro/000)
June 30, 2017
December 31, 2016
Cash at bank 852,845 856,948
Checks 5,259 7,355
Cash and cash equivalents on hand 2,821 2,561
Total 860,925 866,864
For a discussion on the changes in cash and cash equivalents please refer to the Financial Result of the Management Report and to Note 22.
There is no restricted cash.
7. ACCOUNTS RECEIVABLE
Accounts receivable consist exclusively of trade receivables and are recognized net of allowances to adjust their carrying amount to the estimated realizable value.Accounts receivable are due within 12 months.
Accounts receivable (Euro/000)
June 30, 2017 December 31,
2016
Accounts receivable 1,186,299 983,348
Allowance for doubtful accounts (54,267) (51,008)
Total accounts receivable 1,132,032 932,340
The increase in accounts receivable is primarily due to the seasonality of the Group’s business which is generally characterized by higher sales in the first part of the year and collection of the related receivables in the second part of the year.
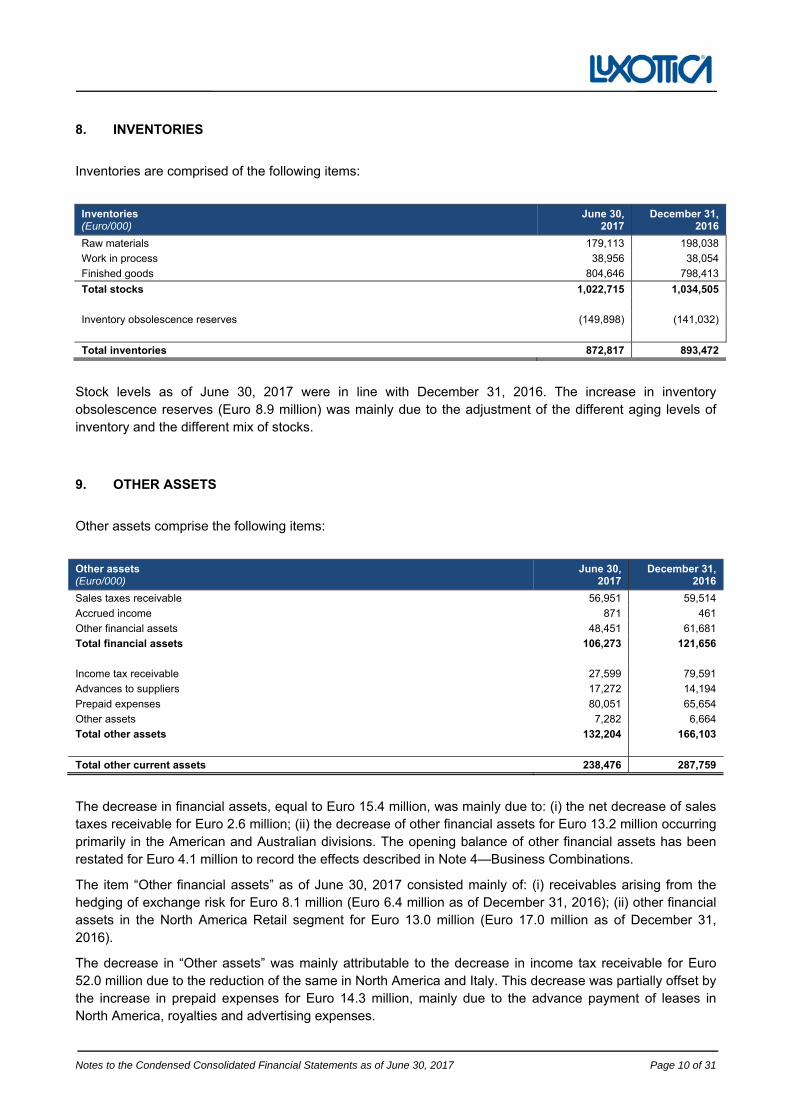
Notes to the Condensed Consolidated Financial Statements as of June 30, 2017 Page 10 of 31
8. INVENTORIES
Inventories are comprised of the following items:
Inventories (Euro/000)
June 30, 2017
December 31, 2016
Raw materials 179,113 198,038
Work in process 38,956 38,054
Finished goods 804,646 798,413
Total stocks 1,022,715 1,034,505
Inventory obsolescence reserves (149,898) (141,032)
Total inventories 872,817 893,472
Stock levels as of June 30, 2017 were in line with December 31, 2016. The increase in inventory obsolescence reserves (Euro 8.9 million) was mainly due to the adjustment of the different aging levels of inventory and the different mix of stocks.
9. OTHER ASSETS
Other assets comprise the following items:
Other assets (Euro/000)
June 30, 2017
December 31, 2016
Sales taxes receivable 56,951 59,514
Accrued income 871 461
Other financial assets 48,451 61,681
Total financial assets 106,273 121,656
Income tax receivable 27,599 79,591
Advances to suppliers 17,272 14,194
Prepaid expenses 80,051 65,654
Other assets 7,282 6,664
Total other assets 132,204 166,103
Total other current assets 238,476 287,759
The decrease in financial assets, equal to Euro 15.4 million, was mainly due to: (i) the net decrease of sales taxes receivable for Euro 2.6 million; (ii) the decrease of other financial assets for Euro 13.2 million occurring primarily in the American and Australian divisions. The opening balance of other financial assets has been restated for Euro 4.1 million to record the effects described in Note 4—Business Combinations.
The item “Other financial assets” as of June 30, 2017 consisted mainly of: (i) receivables arising from the hedging of exchange risk for Euro 8.1 million (Euro 6.4 million as of December 31, 2016); (ii) other financial assets in the North America Retail segment for Euro 13.0 million (Euro 17.0 million as of December 31, 2016).
The decrease in “Other assets” was mainly attributable to the decrease in income tax receivable for Euro 52.0 million due to the reduction of the same in North America and Italy. This decrease was partially offset by the increase in prepaid expenses for Euro 14.3 million, mainly due to the advance payment of leases in North America, royalties and advertising expenses.
Notes to the Condensed Consolidated Financial Statements as of June 30, 2017 Page 11 of 31
“Other assets” include the short-term portion of advance payments made to certain designers for future contracted minimum royalties totaling Euro 7.3 million as of June 30, 2017 (Euro 6.6 million as of December 31, 2016).
The net book value of financial assets is approximately equal to their fair value and this value also corresponds to the maximum exposure of the credit risk. The Group has no guarantees or other instruments to manage credit risk.
10. ASSETS HELD FOR SALE
The item “Assets held for sale” as of December 31, 2016 showed a balance of Euro 51.3 million and contained the value of a property owned by the Group and sold in March 2017. With this sale, the Group realized non-recurring capital gains of Euro 48.7 million.
For further details see Note 33.
Notes to the Condensed Consolidated Financial Statements as of June 30, 2017 Page 12 of 31
NON-CURRENT ASSETS
11. PROPERTY, PLANT AND EQUIPMENT
Changes in items of property, plant and equipment in the six months as of June 30, 2017 were as follows:
Property, plant and equipment (Euro/000)
Land and buildings, including leasehold
improvements
Industrial plant, machinery and
equipment Aircraft
Other equipment
Total
Total as of December 31, 2016
Historical cost 1,270,763 1,677,540 11,361 1,014,331 3,973,995
Accumulated depreciation (682,588) (1,101,384) (1,433) (516,038) (2,031,443)
Total as of December 31, 2016 588,175 576,156 9,928 498,293 1,672,552
Total as of June 30, 2017
Total as of January 1, 2017 588,175 576,156 9,928 498,293 1,672,552
Increases 53,214 28,114 - 121,920 203,248
Decreases/write downs (1,427) (1,175) - (4,924) (7,526)
Business combinations - - - 22,000 22,000
Translation difference and others (18,630) 42,182 - (110,272) (86,720)
Depreciation expense (43,763) (72,812) (281) (43,254) (160,110)
Total as of June 30, 2017 577,569 572,465 9,647 483,763 1,643,443
Of which
Historical cost 1,244,465 1,691,774 11,362 997,946 3,945,547
Accumulated depreciation (666,896) (1,119,309) (1,715) (514,183) (2,302,103)
Total as of June 30, 2017 577,569 572,465 9,647 483,763 1,643,443
Of the total depreciation expense of Euro 160.1 million as of June 30, 2017 (Euro 139.8 million in the same period of 2016), Euro 54.7 million (Euro 47.9 million in the same period of 2016) is included in cost of sales, Euro 77.5 million (Euro 68.2 million in the same period of 2016) in selling expenses, Euro 7.5 million (Euro 6.9 million in the same period of 2016) in advertising expenses, and Euro 20.4 million (Euro 16.8 million in the same period of 2016) in general and administrative expenses.
Capital expenditures in the first six months of 2017 mainly relate to routine technology upgrades to the manufacturing infrastructure, opening of new stores and the remodeling of older stores. In the first six months of 2017, the Group purchased land and buildings for a consideration of Euro 38.6 million, mainly in relation to the acquisition of the area where the Brazilian manufacturing site is located.
Other equipment includes Euro 235.4 million for assets under construction as of June 30, 2017 (Euro 233.3 million as of December 31, 2016). Leasehold improvements totaled Euro 215.4 million and Euro 252.5 million as of June 30, 2017 and December 31, 2016, respectively.
The value included in business combinations represents the value of a property currently undergoing renovations, acquired by the Group in the first six months of 2017 through a corporate vehicle. The purchase of 100% of this vehicle allowed the Luxottica Group to gain control of the company which, in turn, became part of the consolidation scope.
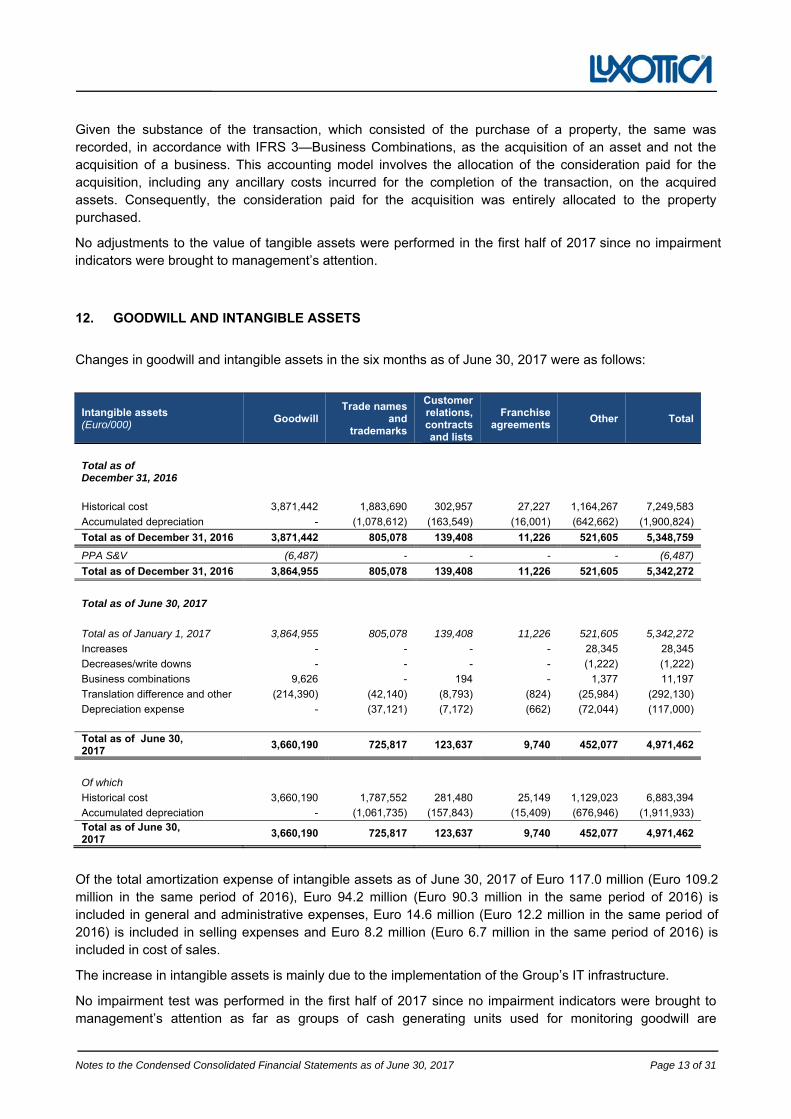
Notes to the Condensed Consolidated Financial Statements as of June 30, 2017 Page 13 of 31
Given the substance of the transaction, which consisted of the purchase of a property, the same was recorded, in accordance with IFRS 3—Business Combinations, as the acquisition of an asset and not the acquisition of a business. This accounting model involves the allocation of the consideration paid for the acquisition, including any ancillary costs incurred for the completion of the transaction, on the acquired assets. Consequently, the consideration paid for the acquisition was entirely allocated to the property purchased.
No adjustments to the value of tangible assets were performed in the first half of 2017 since no impairment indicators were brought to management’s attention.
12. GOODWILL AND INTANGIBLE ASSETS
Changes in goodwill and intangible assets in the six months as of June 30, 2017 were as follows:
Intangible assets (Euro/000)
Goodwill Trade names
and trademarks
Customer relations, contracts and lists
Franchise agreements
Other Total
Total as of December 31, 2016
Historical cost 3,871,442 1,883,690 302,957 27,227 1,164,267 7,249,583
Accumulated depreciation - (1,078,612) (163,549) (16,001) (642,662) (1,900,824)
Total as of December 31, 2016 3,871,442 805,078 139,408 11,226 521,605 5,348,759
PPA S&V (6,487) - - - - (6,487)
Total as of December 31, 2016 3,864,955 805,078 139,408 11,226 521,605 5,342,272
Total as of June 30, 2017
Total as of January 1, 2017 3,864,955 805,078 139,408 11,226 521,605 5,342,272
Increases - - - - 28,345 28,345
Decreases/write downs - - - - (1,222) (1,222)
Business combinations 9,626 - 194 - 1,377 11,197
Translation difference and other (214,390) (42,140) (8,793) (824) (25,984) (292,130)
Depreciation expense - (37,121) (7,172) (662) (72,044) (117,000)
Total as of June 30, 2017
3,660,190 725,817 123,637 9,740 452,077 4,971,462
Of which
Historical cost 3,660,190 1,787,552 281,480 25,149 1,129,023 6,883,394
Accumulated depreciation - (1,061,735) (157,843) (15,409) (676,946) (1,911,933) Total as of June 30, 2017
3,660,190 725,817 123,637 9,740 452,077 4,971,462
Of the total amortization expense of intangible assets as of June 30, 2017 of Euro 117.0 million (Euro 109.2 million in the same period of 2016), Euro 94.2 million (Euro 90.3 million in the same period of 2016) is included in general and administrative expenses, Euro 14.6 million (Euro 12.2 million in the same period of 2016) is included in selling expenses and Euro 8.2 million (Euro 6.7 million in the same period of 2016) is included in cost of sales.
The increase in intangible assets is mainly due to the implementation of the Group’s IT infrastructure.
No impairment test was performed in the first half of 2017 since no impairment indicators were brought to management’s attention as far as groups of cash generating units used for monitoring goodwill are
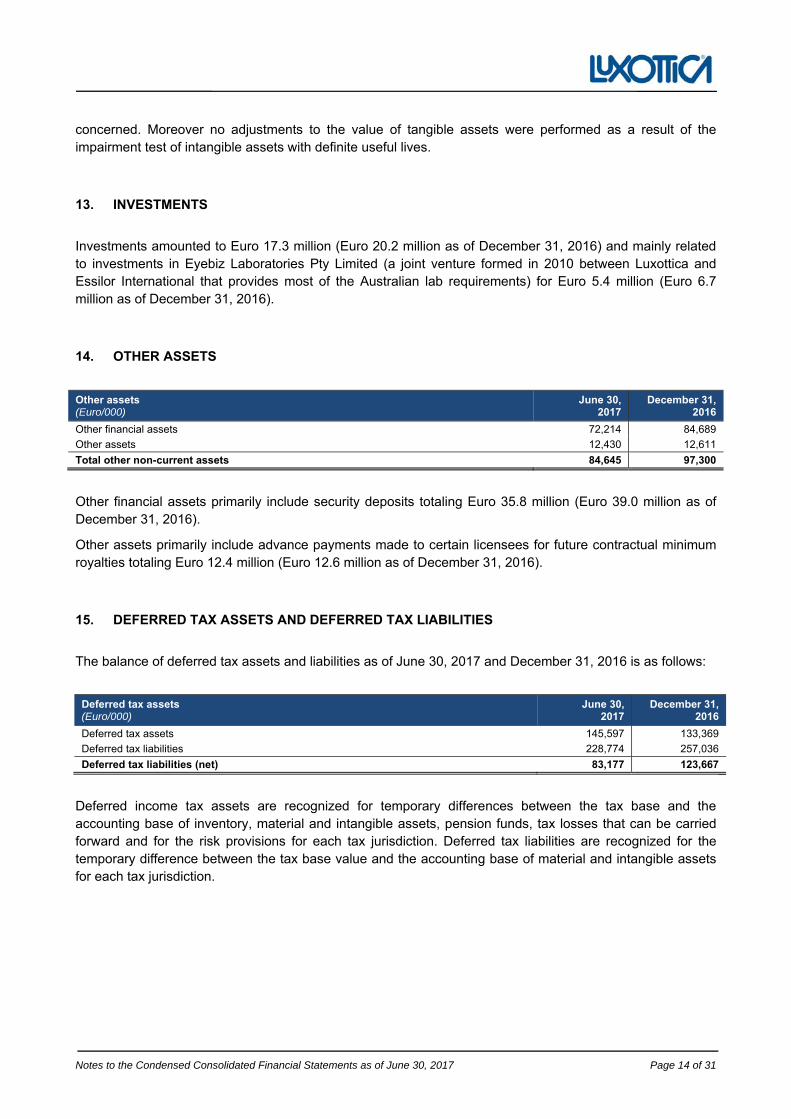
Notes to the Condensed Consolidated Financial Statements as of June 30, 2017 Page 14 of 31
concerned. Moreover no adjustments to the value of tangible assets were performed as a result of the impairment test of intangible assets with definite useful lives.
13. INVESTMENTS
Investments amounted to Euro 17.3 million (Euro 20.2 million as of December 31, 2016) and mainly related to investments in Eyebiz Laboratories Pty Limited (a joint venture formed in 2010 between Luxottica and Essilor International that provides most of the Australian lab requirements) for Euro 5.4 million (Euro 6.7 million as of December 31, 2016).
14. OTHER ASSETS
Other assets (Euro/000)
June 30, 2017
December 31, 2016
Other financial assets 72,214 84,689
Other assets 12,430 12,611
Total other non-current assets 84,645 97,300
Other financial assets primarily include security deposits totaling Euro 35.8 million (Euro 39.0 million as of December 31, 2016).
Other assets primarily include advance payments made to certain licensees for future contractual minimum royalties totaling Euro 12.4 million (Euro 12.6 million as of December 31, 2016).
15. DEFERRED TAX ASSETS AND DEFERRED TAX LIABILITIES
The balance of deferred tax assets and liabilities as of June 30, 2017 and December 31, 2016 is as follows:
Deferred tax assets (Euro/000)
June 30, 2017
December 31, 2016
Deferred tax assets 145,597 133,369
Deferred tax liabilities 228,774 257,036
Deferred tax liabilities (net) 83,177 123,667
Deferred income tax assets are recognized for temporary differences between the tax base and the accounting base of inventory, material and intangible assets, pension funds, tax losses that can be carried forward and for the risk provisions for each tax jurisdiction. Deferred tax liabilities are recognized for the temporary difference between the tax base value and the accounting base of material and intangible assets for each tax jurisdiction.
Notes to the Condensed Consolidated Financial Statements as of June 30, 2017 Page 15 of 31
CURRENT LIABILITIES
16. BANK OVERDRAFTS
Short-term borrowings at June 30, 2017 and as of December 31, 2016, reflects current account overdrafts with various banks as well as uncommitted short-term lines of credit with different financial institutions. The interest rates on these credit lines are floating. The credit lines may be used, if necessary, to obtain letters of credit.
As of June 30, 2017 and as of December 31, 2016, Luxottica Group had unused short-term lines of credit of approximately Euro 999.8 million and Euro 651.0 million, respectively.
The Company and its wholly-owned Italian subsidiaries Luxottica S.r.l. and Luxottica Italia S.r.l. maintain unsecured lines of credit with primary banks for an aggregate maximum credit of Euro 590.1 million. These lines of credit are renewable annually, can be canceled at short notice and have no commitment fees. As of June 30, 2017, these credit lines were not utilized.
Luxottica U.S. Holdings Corp. (‘‘U.S. Holdings’’) maintains unsecured lines of credit with two separate banks for an aggregate maximum credit of Euro 110.0 million (USD 125.5 million). These lines of credit are renewable annually, can be canceled at short notice and have no commitment fees. As of June 30, 2017, there was Euro 46.6 million in the aggregate face amount of standby letters of credit outstanding.
Average interest on the aforementioned credit lines is negotiated with the banking counterparties at the time of use.
The book value of short-term borrowings is approximately equal to their fair value.
17. CURRENT PORTION OF LONG-TERM DEBT
This item consists of the current portion of loans granted to the Group as further described below as “Long-term debt.” For further details see Note 22—Long-term debt.
18. ACCOUNTS PAYABLE
Accounts payable were Euro 870.7 million as of June 30, 2017 (Euro 944.4 million as of December 31, 2016). The decrease in accounts payable is primarily due to timing of the payments made by the Group partially offset by the weakening of the main currencies in which the Group operates against the Euro.
The carrying value of accounts payable is approximately equal to their fair value.
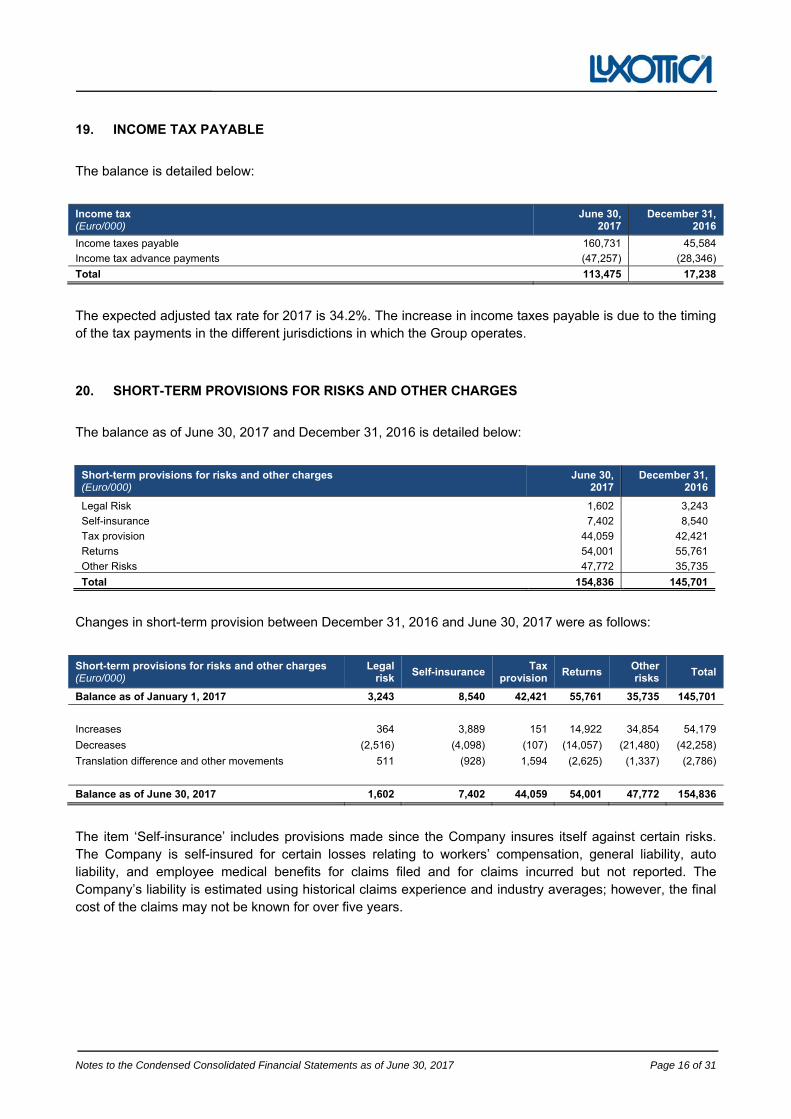
Notes to the Condensed Consolidated Financial Statements as of June 30, 2017 Page 16 of 31
19. INCOME TAX PAYABLE
The balance is detailed below:
Income tax (Euro/000)
June 30, 2017
December 31, 2016
Income taxes payable 160,731 45,584
Income tax advance payments (47,257) (28,346)
Total 113,475 17,238
The expected adjusted tax rate for 2017 is 34.2%. The increase in income taxes payable is due to the timing of the tax payments in the different jurisdictions in which the Group operates.
20. SHORT-TERM PROVISIONS FOR RISKS AND OTHER CHARGES
The balance as of June 30, 2017 and December 31, 2016 is detailed below:
Short-term provisions for risks and other charges (Euro/000)
June 30, 2017
December 31, 2016
Legal Risk 1,602 3,243
Self-insurance 7,402 8,540
Tax provision 44,059 42,421
Returns 54,001 55,761
Other Risks 47,772 35,735
Total 154,836 145,701
Changes in short-term provision between December 31, 2016 and June 30, 2017 were as follows:
Short-term provisions for risks and other charges (Euro/000)
Legal risk
Self-insurance Tax
provision Returns
Other risks
Total
Balance as of January 1, 2017 3,243 8,540 42,421 55,761 35,735 145,701
Increases 364 3,889 151 14,922 34,854 54,179
Decreases (2,516) (4,098) (107) (14,057) (21,480) (42,258)
Translation difference and other movements 511 (928) 1,594 (2,625) (1,337) (2,786)
Balance as of June 30, 2017 1,602 7,402 44,059 54,001 47,772 154,836
The item ‘Self-insurance’ includes provisions made since the Company insures itself against certain risks. The Company is self-insured for certain losses relating to workers’ compensation, general liability, auto liability, and employee medical benefits for claims filed and for claims incurred but not reported. The Company’s liability is estimated using historical claims experience and industry averages; however, the final cost of the claims may not be known for over five years.
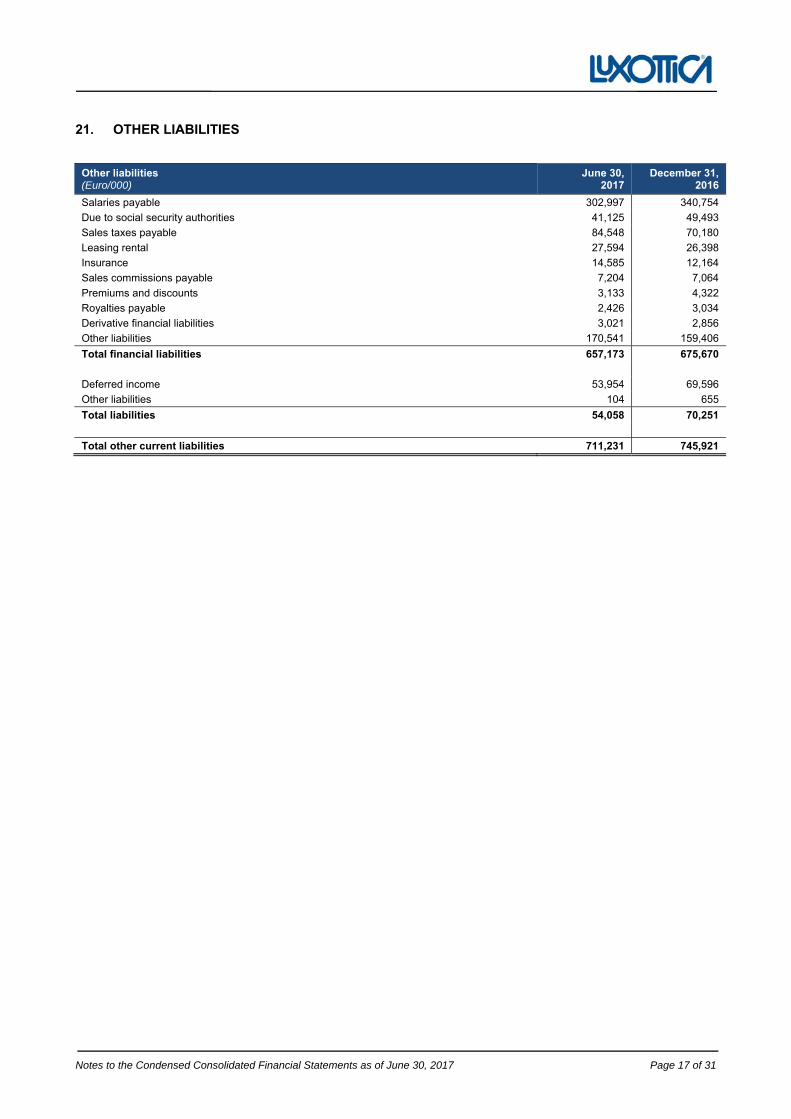
Notes to the Condensed Consolidated Financial Statements as of June 30, 2017 Page 17 of 31
21. OTHER LIABILITIES
Other liabilities (Euro/000)
June 30, 2017
December 31, 2016
Salaries payable 302,997 340,754
Due to social security authorities 41,125 49,493
Sales taxes payable 84,548 70,180
Leasing rental 27,594 26,398
Insurance 14,585 12,164
Sales commissions payable 7,204 7,064
Premiums and discounts 3,133 4,322
Royalties payable 2,426 3,034
Derivative financial liabilities 3,021 2,856
Other liabilities 170,541 159,406
Total financial liabilities 657,173 675,670
Deferred income 53,954 69,596
Other liabilities 104 655
Total liabilities 54,058 70,251
Total other current liabilities 711,231 745,921
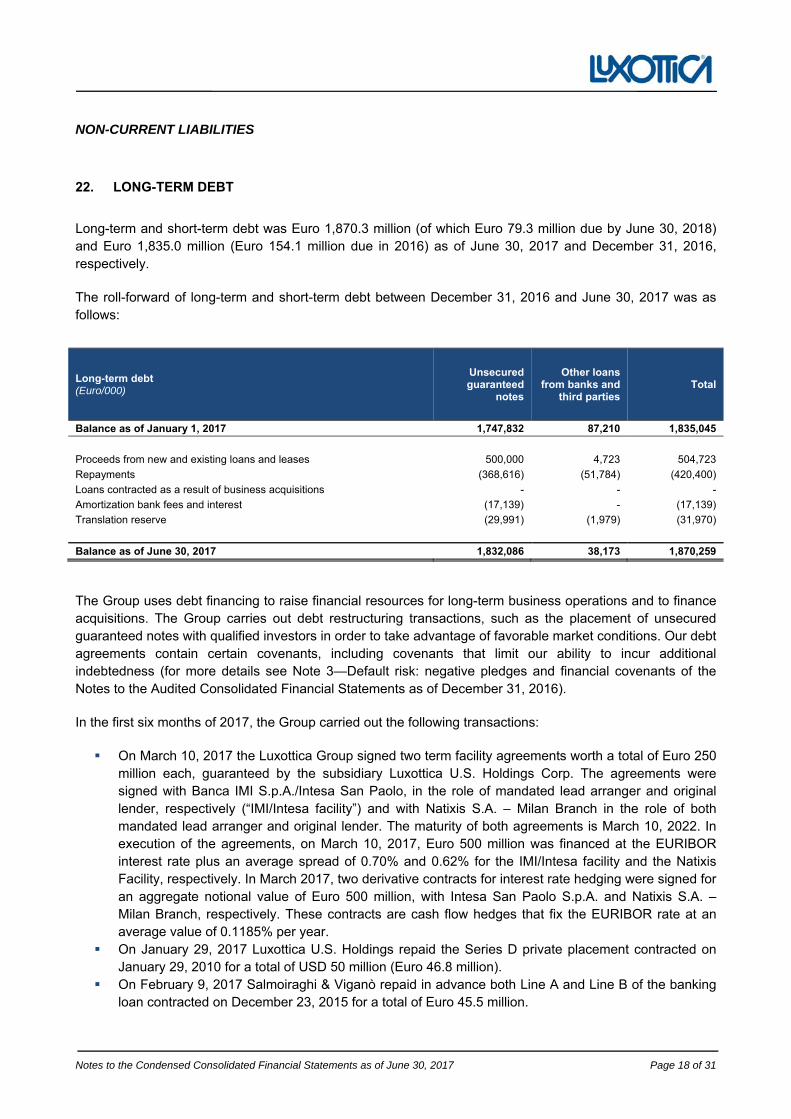
Notes to the Condensed Consolidated Financial Statements as of June 30, 2017 Page 18 of 31
NON-CURRENT LIABILITIES
22. LONG-TERM DEBT
Long-term and short-term debt was Euro 1,870.3 million (of which Euro 79.3 million due by June 30, 2018) and Euro 1,835.0 million (Euro 154.1 million due in 2016) as of June 30, 2017 and December 31, 2016, respectively.
The roll-forward of long-term and short-term debt between December 31, 2016 and June 30, 2017 was as follows:
Long-term debt (Euro/000)
Unsecured guaranteed
notes
Other loans from banks and
third parties Total
Balance as of January 1, 2017 1,747,832 87,210 1,835,045
Proceeds from new and existing loans and leases 500,000 4,723 504,723
Repayments (368,616) (51,784) (420,400)
Loans contracted as a result of business acquisitions - - -
Amortization bank fees and interest (17,139) - (17,139)
Translation reserve (29,991) (1,979) (31,970)
Balance as of June 30, 2017 1,832,086 38,173 1,870,259
The Group uses debt financing to raise financial resources for long-term business operations and to finance acquisitions. The Group carries out debt restructuring transactions, such as the placement of unsecured guaranteed notes with qualified investors in order to take advantage of favorable market conditions. Our debt agreements contain certain covenants, including covenants that limit our ability to incur additional indebtedness (for more details see Note 3—Default risk: negative pledges and financial covenants of the Notes to the Audited Consolidated Financial Statements as of December 31, 2016).
In the first six months of 2017, the Group carried out the following transactions:
On March 10, 2017 the Luxottica Group signed two term facility agreements worth a total of Euro 250 million each, guaranteed by the subsidiary Luxottica U.S. Holdings Corp. The agreements were signed with Banca IMI S.p.A./Intesa San Paolo, in the role of mandated lead arranger and original lender, respectively (“IMI/Intesa facility”) and with Natixis S.A. – Milan Branch in the role of both mandated lead arranger and original lender. The maturity of both agreements is March 10, 2022. In execution of the agreements, on March 10, 2017, Euro 500 million was financed at the EURIBOR interest rate plus an average spread of 0.70% and 0.62% for the IMI/Intesa facility and the Natixis Facility, respectively. In March 2017, two derivative contracts for interest rate hedging were signed for an aggregate notional value of Euro 500 million, with Intesa San Paolo S.p.A. and Natixis S.A. – Milan Branch, respectively. These contracts are cash flow hedges that fix the EURIBOR rate at an average value of 0.1185% per year.
On January 29, 2017 Luxottica U.S. Holdings repaid the Series D private placement contracted on January 29, 2010 for a total of USD 50 million (Euro 46.8 million).
On February 9, 2017 Salmoiraghi & Viganò repaid in advance both Line A and Line B of the banking loan contracted on December 23, 2015 for a total of Euro 45.5 million.
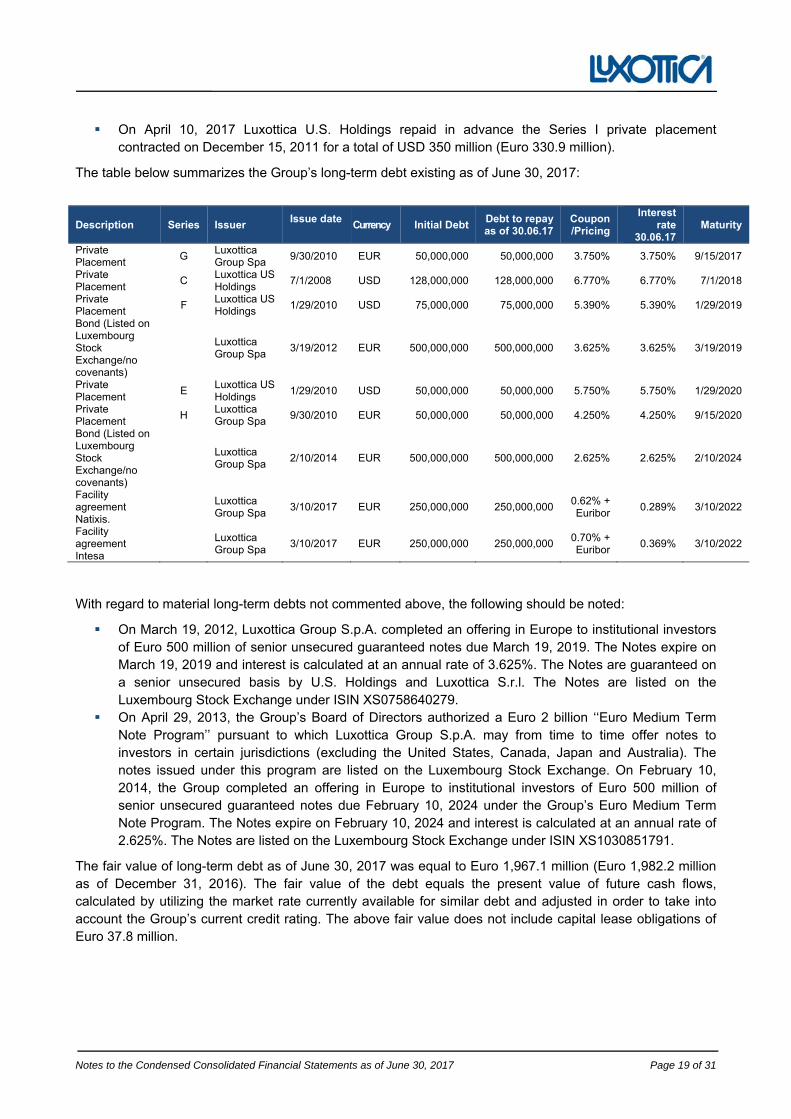
Notes to the Condensed Consolidated Financial Statements as of June 30, 2017 Page 19 of 31
On April 10, 2017 Luxottica U.S. Holdings repaid in advance the Series I private placement contracted on December 15, 2011 for a total of USD 350 million (Euro 330.9 million).
The table below summarizes the Group’s long-term debt existing as of June 30, 2017:
Description Series Issuer Issue date
Currency Initial Debt Debt to repay as of 30.06.17
Coupon/Pricing
Interest rate
30.06.17Maturity
Private Placement
G Luxottica Group Spa
9/30/2010 EUR 50,000,000 50,000,000 3.750% 3.750% 9/15/2017
Private Placement
C Luxottica US Holdings
7/1/2008 USD 128,000,000 128,000,000 6.770% 6.770% 7/1/2018
Private Placement
F Luxottica US Holdings
1/29/2010 USD 75,000,000 75,000,000 5.390% 5.390% 1/29/2019
Bond (Listed on Luxembourg Stock Exchange/no covenants)
Luxottica Group Spa
3/19/2012 EUR 500,000,000 500,000,000 3.625% 3.625% 3/19/2019
Private Placement
E Luxottica US Holdings
1/29/2010 USD 50,000,000 50,000,000 5.750% 5.750% 1/29/2020
Private Placement
H Luxottica Group Spa
9/30/2010 EUR 50,000,000 50,000,000 4.250% 4.250% 9/15/2020
Bond (Listed on Luxembourg Stock Exchange/no covenants)
Luxottica Group Spa
2/10/2014 EUR 500,000,000 500,000,000 2.625% 2.625% 2/10/2024
Facility agreement Natixis.
Luxottica Group Spa
3/10/2017 EUR 250,000,000 250,000,000 0.62% + Euribor
0.289% 3/10/2022
Facility agreement Intesa
Luxottica Group Spa
3/10/2017 EUR 250,000,000 250,000,000 0.70% + Euribor
0.369% 3/10/2022
With regard to material long-term debts not commented above, the following should be noted:
On March 19, 2012, Luxottica Group S.p.A. completed an offering in Europe to institutional investors of Euro 500 million of senior unsecured guaranteed notes due March 19, 2019. The Notes expire on March 19, 2019 and interest is calculated at an annual rate of 3.625%. The Notes are guaranteed on a senior unsecured basis by U.S. Holdings and Luxottica S.r.l. The Notes are listed on the Luxembourg Stock Exchange under ISIN XS0758640279.
On April 29, 2013, the Group’s Board of Directors authorized a Euro 2 billion ‘‘Euro Medium Term Note Program’’ pursuant to which Luxottica Group S.p.A. may from time to time offer notes to investors in certain jurisdictions (excluding the United States, Canada, Japan and Australia). The notes issued under this program are listed on the Luxembourg Stock Exchange. On February 10, 2014, the Group completed an offering in Europe to institutional investors of Euro 500 million of senior unsecured guaranteed notes due February 10, 2024 under the Group’s Euro Medium Term Note Program. The Notes expire on February 10, 2024 and interest is calculated at an annual rate of 2.625%. The Notes are listed on the Luxembourg Stock Exchange under ISIN XS1030851791.
The fair value of long-term debt as of June 30, 2017 was equal to Euro 1,967.1 million (Euro 1,982.2 million as of December 31, 2016). The fair value of the debt equals the present value of future cash flows, calculated by utilizing the market rate currently available for similar debt and adjusted in order to take into account the Group’s current credit rating. The above fair value does not include capital lease obligations of Euro 37.8 million.
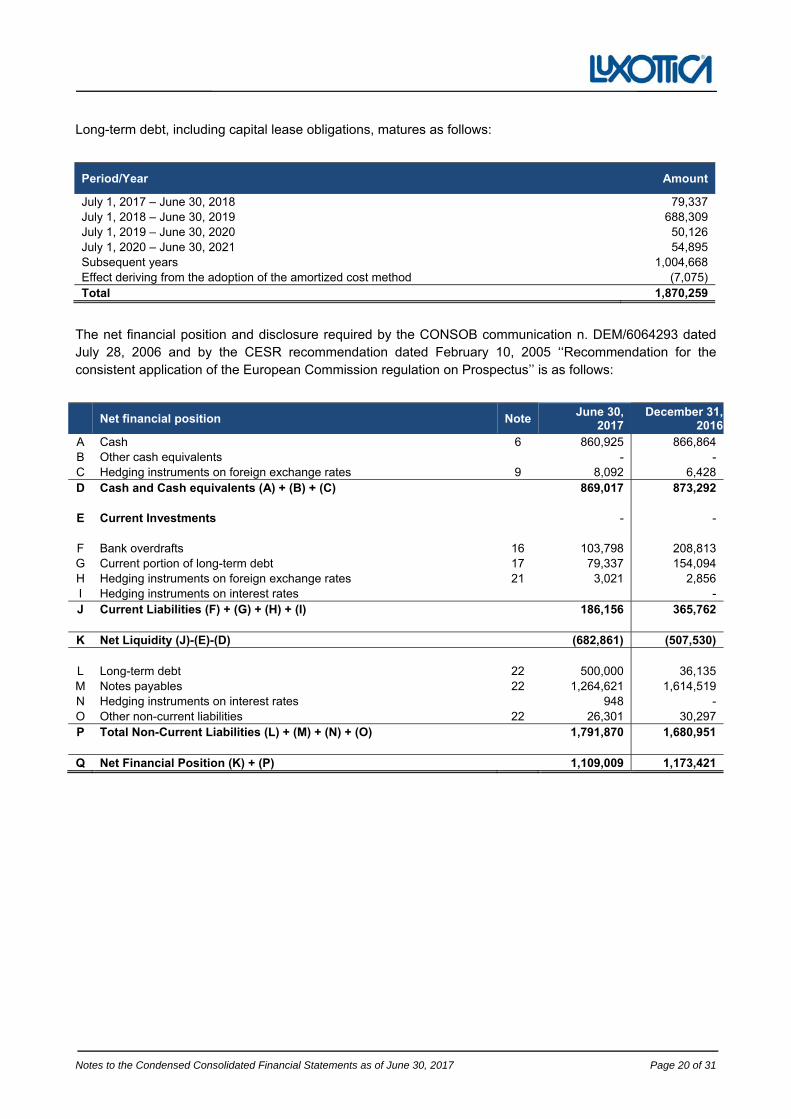
Notes to the Condensed Consolidated Financial Statements as of June 30, 2017 Page 20 of 31
Long-term debt, including capital lease obligations, matures as follows:
Period/Year Amount
July 1, 2017 – June 30, 2018 79,337 July 1, 2018 – June 30, 2019 688,309 July 1, 2019 – June 30, 2020 50,126 July 1, 2020 – June 30, 2021 54,895 Subsequent years 1,004,668 Effect deriving from the adoption of the amortized cost method (7,075) Total 1,870,259
The net financial position and disclosure required by the CONSOB communication n. DEM/6064293 dated July 28, 2006 and by the CESR recommendation dated February 10, 2005 ‘‘Recommendation for the consistent application of the European Commission regulation on Prospectus’’ is as follows:
Net financial position Note
June 30, 2017
December 31, 2016
A Cash 6 860,925 866,864 B Other cash equivalents - - C Hedging instruments on foreign exchange rates 9 8,092 6,428 D Cash and Cash equivalents (A) + (B) + (C) 869,017 873,292
E Current Investments - -
F Bank overdrafts 16 103,798 208,813 G Current portion of long-term debt 17 79,337 154,094 H Hedging instruments on foreign exchange rates 21 3,021 2,856 I Hedging instruments on interest rates - J Current Liabilities (F) + (G) + (H) + (I) 186,156 365,762
K Net Liquidity (J)-(E)-(D) (682,861) (507,530)
L Long-term debt 22 500,000 36,135 M Notes payables 22 1,264,621 1,614,519 N Hedging instruments on interest rates 948 - O Other non-current liabilities 22 26,301 30,297 P Total Non-Current Liabilities (L) + (M) + (N) + (O) 1,791,870 1,680,951
Q Net Financial Position (K) + (P) 1,109,009 1,173,421
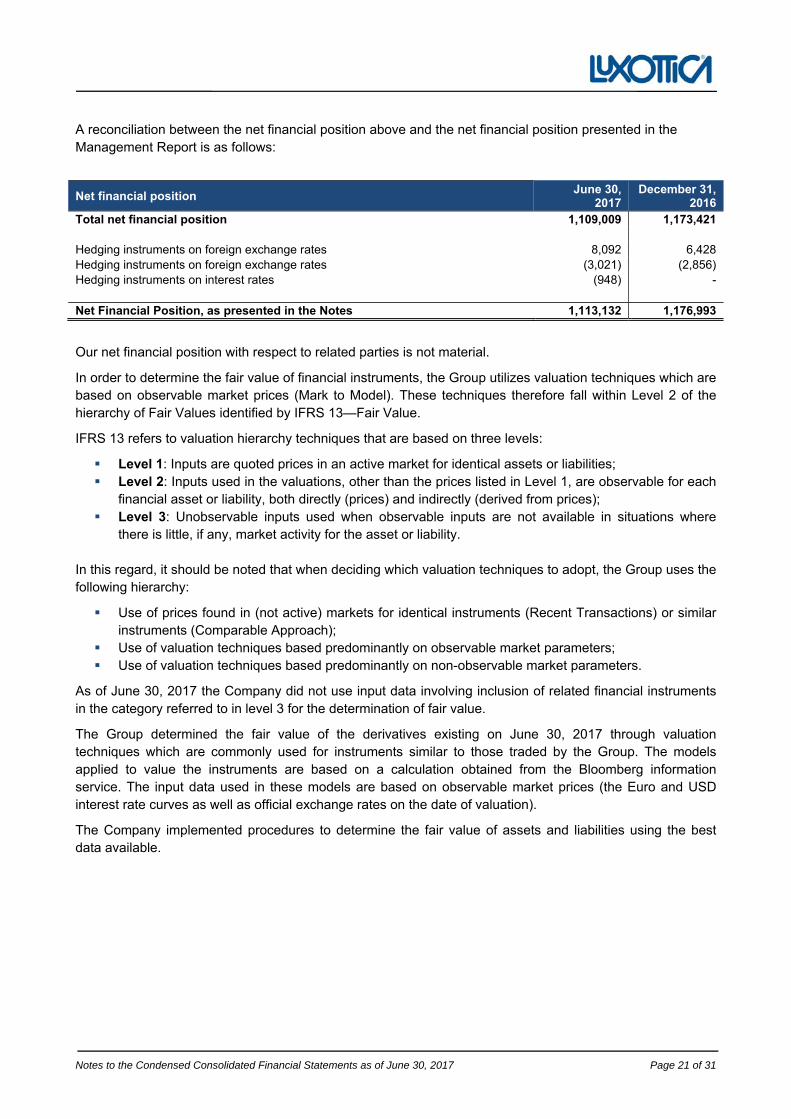
Notes to the Condensed Consolidated Financial Statements as of June 30, 2017 Page 21 of 31
A reconciliation between the net financial position above and the net financial position presented in the Management Report is as follows:
Net financial position June 30,
2017 December 31,
2016 Total net financial position 1,109,009 1,173,421
Hedging instruments on foreign exchange rates 8,092 6,428 Hedging instruments on foreign exchange rates (3,021) (2,856) Hedging instruments on interest rates (948) -
Net Financial Position, as presented in the Notes 1,113,132 1,176,993
Our net financial position with respect to related parties is not material.
In order to determine the fair value of financial instruments, the Group utilizes valuation techniques which are based on observable market prices (Mark to Model). These techniques therefore fall within Level 2 of the hierarchy of Fair Values identified by IFRS 13—Fair Value.
IFRS 13 refers to valuation hierarchy techniques that are based on three levels:
Level 1: Inputs are quoted prices in an active market for identical assets or liabilities; Level 2: Inputs used in the valuations, other than the prices listed in Level 1, are observable for each
financial asset or liability, both directly (prices) and indirectly (derived from prices); Level 3: Unobservable inputs used when observable inputs are not available in situations where
there is little, if any, market activity for the asset or liability.
In this regard, it should be noted that when deciding which valuation techniques to adopt, the Group uses the following hierarchy:
Use of prices found in (not active) markets for identical instruments (Recent Transactions) or similar instruments (Comparable Approach);
Use of valuation techniques based predominantly on observable market parameters; Use of valuation techniques based predominantly on non-observable market parameters.
As of June 30, 2017 the Company did not use input data involving inclusion of related financial instruments in the category referred to in level 3 for the determination of fair value.
The Group determined the fair value of the derivatives existing on June 30, 2017 through valuation techniques which are commonly used for instruments similar to those traded by the Group. The models applied to value the instruments are based on a calculation obtained from the Bloomberg information service. The input data used in these models are based on observable market prices (the Euro and USD interest rate curves as well as official exchange rates on the date of valuation).
The Company implemented procedures to determine the fair value of assets and liabilities using the best data available.
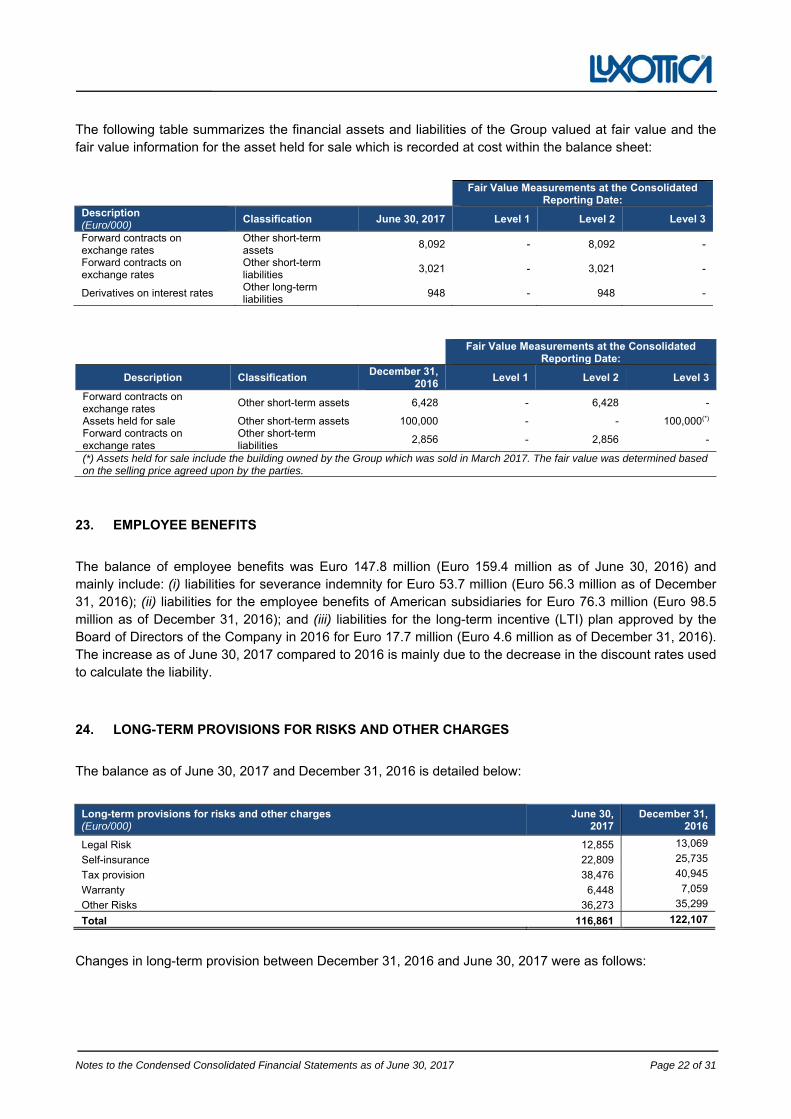
Notes to the Condensed Consolidated Financial Statements as of June 30, 2017 Page 22 of 31
The following table summarizes the financial assets and liabilities of the Group valued at fair value and the fair value information for the asset held for sale which is recorded at cost within the balance sheet:
Fair Value Measurements at the Consolidated Reporting Date:
Description (Euro/000)
Classification June 30, 2017 Level 1 Level 2 Level 3
Forward contracts on exchange rates
Other short-term assets
8,092 - 8,092 -
Forward contracts on exchange rates
Other short-term liabilities
3,021 - 3,021 -
Derivatives on interest rates Other long-term liabilities
948 - 948 -
Fair Value Measurements at the Consolidated
Reporting Date:
Description Classification December 31,
2016Level 1 Level 2 Level 3
Forward contracts on exchange rates
Other short-term assets 6,428 - 6,428 -
Assets held for sale Other short-term assets 100,000 - - 100,000(*)
Forward contracts on exchange rates
Other short-term liabilities
2,856 - 2,856 -
(*) Assets held for sale include the building owned by the Group which was sold in March 2017. The fair value was determined based on the selling price agreed upon by the parties.
23. EMPLOYEE BENEFITS
The balance of employee benefits was Euro 147.8 million (Euro 159.4 million as of June 30, 2016) and mainly include: (i) liabilities for severance indemnity for Euro 53.7 million (Euro 56.3 million as of December 31, 2016); (ii) liabilities for the employee benefits of American subsidiaries for Euro 76.3 million (Euro 98.5 million as of December 31, 2016); and (iii) liabilities for the long-term incentive (LTI) plan approved by the Board of Directors of the Company in 2016 for Euro 17.7 million (Euro 4.6 million as of December 31, 2016). The increase as of June 30, 2017 compared to 2016 is mainly due to the decrease in the discount rates used to calculate the liability.
24. LONG-TERM PROVISIONS FOR RISKS AND OTHER CHARGES
The balance as of June 30, 2017 and December 31, 2016 is detailed below:
Long-term provisions for risks and other charges (Euro/000)
June 30, 2017
December 31, 2016
Legal Risk 12,855 13,069
Self-insurance 22,809 25,735
Tax provision 38,476 40,945
Warranty 6,448 7,059
Other Risks 36,273 35,299
Total 116,861 122,107
Changes in long-term provision between December 31, 2016 and June 30, 2017 were as follows:
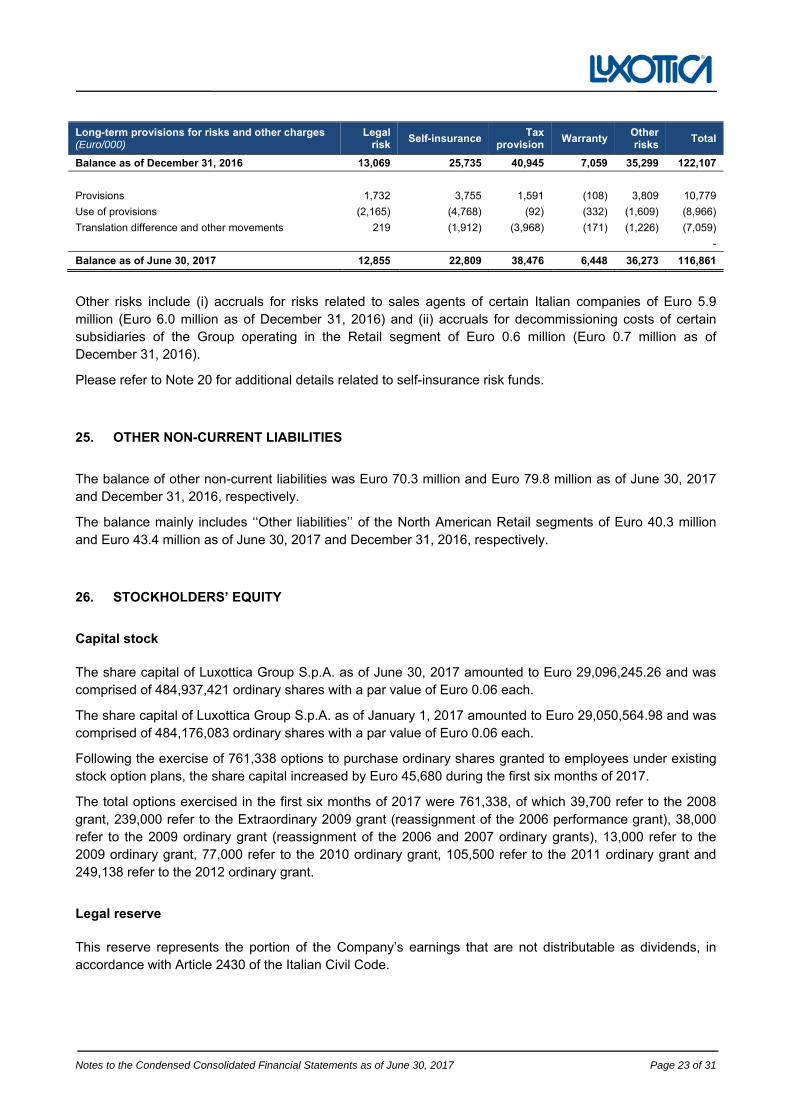
Notes to the Condensed Consolidated Financial Statements as of June 30, 2017 Page 23 of 31
Long-term provisions for risks and other charges (Euro/000)
Legal risk
Self-insurance Tax
provision Warranty
Other risks
Total
Balance as of December 31, 2016 13,069 25,735 40,945 7,059 35,299 122,107
Provisions 1,732 3,755 1,591 (108) 3,809 10,779
Use of provisions (2,165) (4,768) (92) (332) (1,609) (8,966)
Translation difference and other movements 219 (1,912) (3,968) (171) (1,226) (7,059)
-
Balance as of June 30, 2017 12,855 22,809 38,476 6,448 36,273 116,861
Other risks include (i) accruals for risks related to sales agents of certain Italian companies of Euro 5.9 million (Euro 6.0 million as of December 31, 2016) and (ii) accruals for decommissioning costs of certain subsidiaries of the Group operating in the Retail segment of Euro 0.6 million (Euro 0.7 million as of December 31, 2016).
Please refer to Note 20 for additional details related to self-insurance risk funds.
25. OTHER NON-CURRENT LIABILITIES
The balance of other non-current liabilities was Euro 70.3 million and Euro 79.8 million as of June 30, 2017 and December 31, 2016, respectively.
The balance mainly includes ‘‘Other liabilities’’ of the North American Retail segments of Euro 40.3 million and Euro 43.4 million as of June 30, 2017 and December 31, 2016, respectively.
26. STOCKHOLDERS’ EQUITY
Capital stock
The share capital of Luxottica Group S.p.A. as of June 30, 2017 amounted to Euro 29,096,245.26 and was comprised of 484,937,421 ordinary shares with a par value of Euro 0.06 each.
The share capital of Luxottica Group S.p.A. as of January 1, 2017 amounted to Euro 29,050,564.98 and was comprised of 484,176,083 ordinary shares with a par value of Euro 0.06 each.
Following the exercise of 761,338 options to purchase ordinary shares granted to employees under existing stock option plans, the share capital increased by Euro 45,680 during the first six months of 2017.
The total options exercised in the first six months of 2017 were 761,338, of which 39,700 refer to the 2008 grant, 239,000 refer to the Extraordinary 2009 grant (reassignment of the 2006 performance grant), 38,000 refer to the 2009 ordinary grant (reassignment of the 2006 and 2007 ordinary grants), 13,000 refer to the 2009 ordinary grant, 77,000 refer to the 2010 ordinary grant, 105,500 refer to the 2011 ordinary grant and 249,138 refer to the 2012 ordinary grant.
Legal reserve
This reserve represents the portion of the Company’s earnings that are not distributable as dividends, in accordance with Article 2430 of the Italian Civil Code.
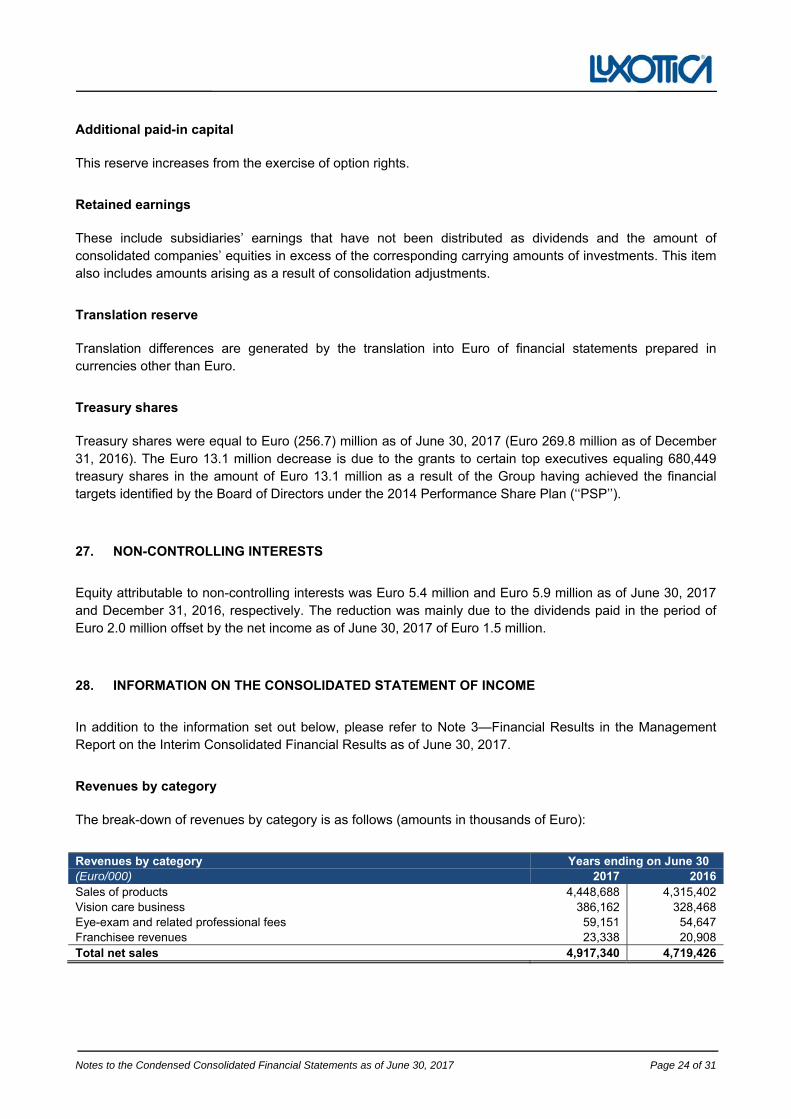
Notes to the Condensed Consolidated Financial Statements as of June 30, 2017 Page 24 of 31
Additional paid-in capital
This reserve increases from the exercise of option rights.
Retained earnings
These include subsidiaries’ earnings that have not been distributed as dividends and the amount of consolidated companies’ equities in excess of the corresponding carrying amounts of investments. This item also includes amounts arising as a result of consolidation adjustments.
Translation reserve
Translation differences are generated by the translation into Euro of financial statements prepared in currencies other than Euro.
Treasury shares
Treasury shares were equal to Euro (256.7) million as of June 30, 2017 (Euro 269.8 million as of December 31, 2016). The Euro 13.1 million decrease is due to the grants to certain top executives equaling 680,449 treasury shares in the amount of Euro 13.1 million as a result of the Group having achieved the financial targets identified by the Board of Directors under the 2014 Performance Share Plan (‘‘PSP’’).
27. NON-CONTROLLING INTERESTS
Equity attributable to non-controlling interests was Euro 5.4 million and Euro 5.9 million as of June 30, 2017 and December 31, 2016, respectively. The reduction was mainly due to the dividends paid in the period of Euro 2.0 million offset by the net income as of June 30, 2017 of Euro 1.5 million.
28. INFORMATION ON THE CONSOLIDATED STATEMENT OF INCOME
In addition to the information set out below, please refer to Note 3—Financial Results in the Management Report on the Interim Consolidated Financial Results as of June 30, 2017.
Revenues by category
The break-down of revenues by category is as follows (amounts in thousands of Euro):
Revenues by category Years ending on June 30 (Euro/000) 2017 2016 Sales of products 4,448,688 4,315,402 Vision care business 386,162 328,468 Eye-exam and related professional fees 59,151 54,647 Franchisee revenues 23,338 20,908 Total net sales 4,917,340 4,719,426
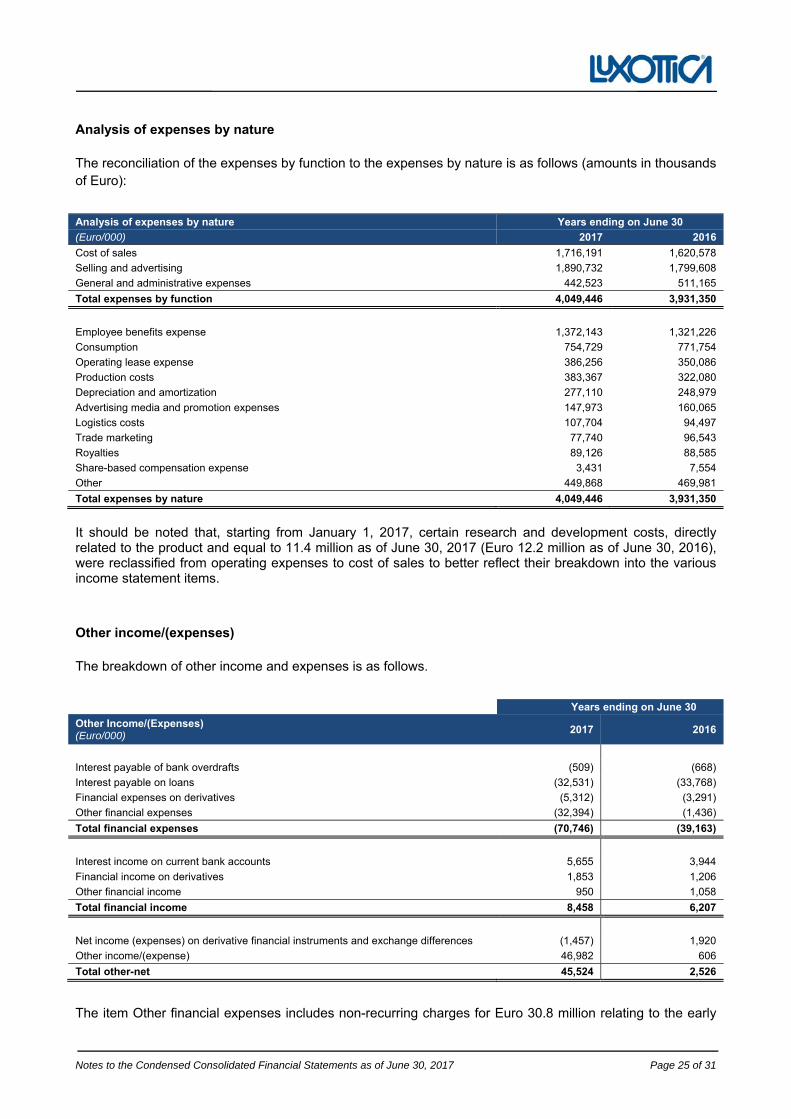
Notes to the Condensed Consolidated Financial Statements as of June 30, 2017 Page 25 of 31
Analysis of expenses by nature
The reconciliation of the expenses by function to the expenses by nature is as follows (amounts in thousands of Euro):
Analysis of expenses by nature Years ending on June 30
(Euro/000) 2017 2016
Cost of sales 1,716,191 1,620,578
Selling and advertising 1,890,732 1,799,608
General and administrative expenses 442,523 511,165
Total expenses by function 4,049,446 3,931,350
Employee benefits expense 1,372,143 1,321,226
Consumption 754,729 771,754
Operating lease expense 386,256 350,086
Production costs 383,367 322,080
Depreciation and amortization 277,110 248,979
Advertising media and promotion expenses 147,973 160,065
Logistics costs 107,704 94,497
Trade marketing 77,740 96,543
Royalties 89,126 88,585
Share-based compensation expense 3,431 7,554
Other 449,868 469,981
Total expenses by nature 4,049,446 3,931,350
It should be noted that, starting from January 1, 2017, certain research and development costs, directly related to the product and equal to 11.4 million as of June 30, 2017 (Euro 12.2 million as of June 30, 2016), were reclassified from operating expenses to cost of sales to better reflect their breakdown into the various income statement items.
Other income/(expenses)
The breakdown of other income and expenses is as follows.
Years ending on June 30
Other Income/(Expenses) (Euro/000)
2017 2016
Interest payable of bank overdrafts (509) (668)
Interest payable on loans (32,531) (33,768)
Financial expenses on derivatives (5,312) (3,291)
Other financial expenses (32,394) (1,436)
Total financial expenses (70,746) (39,163)
Interest income on current bank accounts 5,655 3,944
Financial income on derivatives 1,853 1,206
Other financial income 950 1,058
Total financial income 8,458 6,207
Net income (expenses) on derivative financial instruments and exchange differences (1,457) 1,920
Other income/(expense) 46,982 606
Total other-net 45,524 2,526
The item Other financial expenses includes non-recurring charges for Euro 30.8 million relating to the early
Notes to the Condensed Consolidated Financial Statements as of June 30, 2017 Page 26 of 31
repayment of the Series I private placement contracted by Luxottica U.S. Holdings on December 15, 2011 and the early repayment of the bank loans contracted by Salmoiraghi & Viganò on December 23, 2015.
The item Other income/(expenses) includes non-recurring income for Euro 48.7 million relating to the capital gains on the sale of property owned by the Group and sold in March 2017.
29. COMMITMENTS AND RISKS
The Group has commitments under contractual agreements in place. Such commitments relate to the following:
Royalty agreements signed with certain designers whereby the Group is required to pay royalties andadvertising fees calculated as a percentage of turnover guaranteeing, in some cases, a minimumannual amount. These agreements require minimum payments of an aggregate of Euro 914.1 millionas of June 30, 2017 and Euro 1,023.7 million as of December 31, 2016.
Rental and operating lease agreements for various stores, plants, warehouses and offices, along witha portion of the IT system and motor vehicles. The agreements include renewal options subject tovarious conditions. The rental and licensing agreements for the Group’s points of sale in the UnitedStates often include rent increase clauses and conditions requiring the payment of progressivelyhigher rent installments, in addition to an established minimum, in relation to the achievement of salestargets set forth in such agreements. Future minimum rental payments required under these rentaland operating agreements were Euro 1,921.2 million as of June 30, 2017 and Euro 1,543.5 million asof December 31, 2016.
Other commitments which include future payments for endorsement contracts, supplier purchasesand other long-term commitments mainly consist of machinery and equipment and auto leasecommitments were Euro 409.6 million as of June 30, 2017 and Euro 267.2 million as of December 31,2016.
Warranty
A wholly-owned U.S. subsidiary guaranteed future minimum lease payments for lease agreements on certain stores. The lease agreements were signed directly by the franchisees as part of certain franchising agreements. Total minimum guaranteed payments under this guarantee were Euro 2.2 million (USD 2.5 million) as of June 30, 2017 and Euro 3.8 million as of December 31, 2016. The commitments provided for by the guarantee arise if the franchisee cannot honor its financial commitments under the lease agreements. A liability has been recorded based on the present value of the estimated fair value of the commitments related to the stipulated guarantees. This liability is not significant to the interim financial results as of June 30, 2017. The liability expires at various dates by January 31, 2020.
Litigation
French Competition Authority Investigation
The French subsidiaries of Luxottica, Luxottica France S.A.S.U., Alain Mikli International S.A.S.U. and Mikli Diffusion France S.A.S.U. (the “French Subsidiaries”), together with the other main competitors in the French eyewear industry are undergoing investigation by the French Competition Authority (“FCA” or the “Authority”) in relation to price fixing and sales practices in this particular market sector. In May 2015, the Company and the French Subsidiaries received a Statement of Objections from the FCA. This statement outlined the preliminary position of the Authority in relation to the alleged anti-competitive practices and did not anticipate any content of the final decision.
Notes to the Condensed Consolidated Financial Statements as of June 30, 2017 Page 27 of 31
In August 2015, the Company and the French Subsidiaries filed their response to the Statement of Objections. In 2016, the FCA received additional information, as it is typical in these types of proceedings. In July 2016, the Authority notified a technical note (“Raport”) in response to the observations filed by the companies involved in the investigation. In October 2016, Luxottica filed defense briefs in response to the Authority’s Raport. Following this deposit, a final hearing was set for December 15, 2016. On February 24, 2017 Luxottica was notified of the Authority’s decision on the proceedings under review. The FCA considered that there was insufficient evidence to confirm the alleged anti-competitive practices outlined in the Raport and forwarded the file to the investigative department of the Authority for further review and, possibly, notification of additional charges. So far no fines or penalties have been imposed in relation to the Authority’s decision on February 24.
Given the current state of the proceeding, the Company, with the support of external legal consultants, quantified the risk of a potential liability for Luxottica as being unlikely and also concluded that it is impossible to quantify the amount associated with the potential liability relating to this proceeding. The outcome of such proceedings are by nature uncertain and it is thus impossible to know, should the proceeding conclude with an unfavorable ruling for Luxottica, whether this will have material repercussions on the economic and financial results.
Other proceedings
The Group is a defendant in various other legal and fiscal lawsuits arising in the ordinary course of business. It is the opinion of the management of the Company that it has meritorious defenses against all such outstanding claims, which the Company will vigorously pursue, and that the outcome of such claims, individually or in the aggregate, will not have a material adverse effect on the Group’s consolidated financial position or results of operations.
30. RELATED PARTY TRANSACTIONS
Licensing Agreements
The Group executed an exclusive worldwide license for the production and distribution of Brooks Brothers brand eyewear. The brand is held by Brooks Brothers Group, Inc., which is owned and controlled by Claudio Del Vecchio. The license expired on December 31, 2015 and has been renewed for an additional five years, i.e. until December 31, 2019. Royalties paid under this agreement to Brooks Brothers Group, Inc. were Euro 0.3 million during the first six month of 2017 and Euro 0.5 million in 2016. Management believes that the terms of the license agreement are fair to the Company.
Technology Advisory Agreements
The Company and certain of its subsidiaries entered into transactions with entities owned or controlled by Mr. Francesco Milleri, Deputy Chairman of the Company since April 29, 2016, primarily related to the implementation of the Group’s IT platform. Amounts related to these transactions were Euro 10,2 million in the first six months of 2017 and Euro 7.1 in 2016. Management believes that the terms of the above agreements are fair to the Company.
Lease of corporate offices
On April 29, 2014, the Board of Directors of Luxottica Group authorized the Company to enter into an agreement to lease a building located in Piazzale Luigi Cadorna 3, Milan (hereinafter “Building”). The lease will be for a period of seven years and 5 months and will be renewable for an additional six years. The
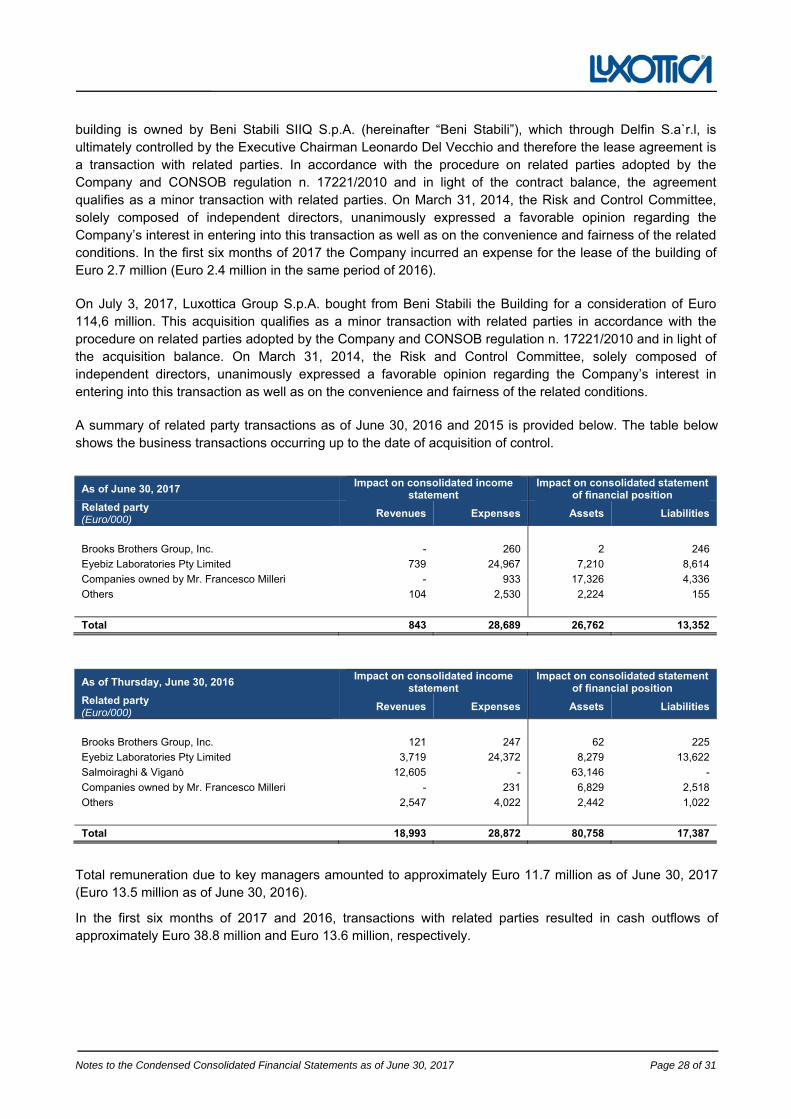
Notes to the Condensed Consolidated Financial Statements as of June 30, 2017 Page 28 of 31
building is owned by Beni Stabili SIIQ S.p.A. (hereinafter “Beni Stabili”), which through Delfin S.a`r.l, is ultimately controlled by the Executive Chairman Leonardo Del Vecchio and therefore the lease agreement is a transaction with related parties. In accordance with the procedure on related parties adopted by the Company and CONSOB regulation n. 17221/2010 and in light of the contract balance, the agreement qualifies as a minor transaction with related parties. On March 31, 2014, the Risk and Control Committee, solely composed of independent directors, unanimously expressed a favorable opinion regarding the Company’s interest in entering into this transaction as well as on the convenience and fairness of the related conditions. In the first six months of 2017 the Company incurred an expense for the lease of the building of Euro 2.7 million (Euro 2.4 million in the same period of 2016).
On July 3, 2017, Luxottica Group S.p.A. bought from Beni Stabili the Building for a consideration of Euro 114,6 million. This acquisition qualifies as a minor transaction with related parties in accordance with the procedure on related parties adopted by the Company and CONSOB regulation n. 17221/2010 and in light of the acquisition balance. On March 31, 2014, the Risk and Control Committee, solely composed of independent directors, unanimously expressed a favorable opinion regarding the Company’s interest in entering into this transaction as well as on the convenience and fairness of the related conditions.
A summary of related party transactions as of June 30, 2016 and 2015 is provided below. The table below shows the business transactions occurring up to the date of acquisition of control.
As of June 30, 2017 Impact on consolidated income
statementImpact on consolidated statement
of financial positionRelated party (Euro/000)
Revenues Expenses Assets Liabilities
Brooks Brothers Group, Inc. - 260 2 246
Eyebiz Laboratories Pty Limited 739 24,967 7,210 8,614
Companies owned by Mr. Francesco Milleri - 933 17,326 4,336
Others 104 2,530 2,224 155
Total 843 28,689 26,762 13,352
As of Thursday, June 30, 2016 Impact on consolidated income
statementImpact on consolidated statement
of financial positionRelated party (Euro/000)
Revenues Expenses Assets Liabilities
Brooks Brothers Group, Inc. 121 247 62 225
Eyebiz Laboratories Pty Limited 3,719 24,372 8,279 13,622
Salmoiraghi & Viganò 12,605 - 63,146 -
Companies owned by Mr. Francesco Milleri - 231 6,829 2,518
Others 2,547 4,022 2,442 1,022
Total 18,993 28,872 80,758 17,387
Total remuneration due to key managers amounted to approximately Euro 11.7 million as of June 30, 2017 (Euro 13.5 million as of June 30, 2016).
In the first six months of 2017 and 2016, transactions with related parties resulted in cash outflows of approximately Euro 38.8 million and Euro 13.6 million, respectively.
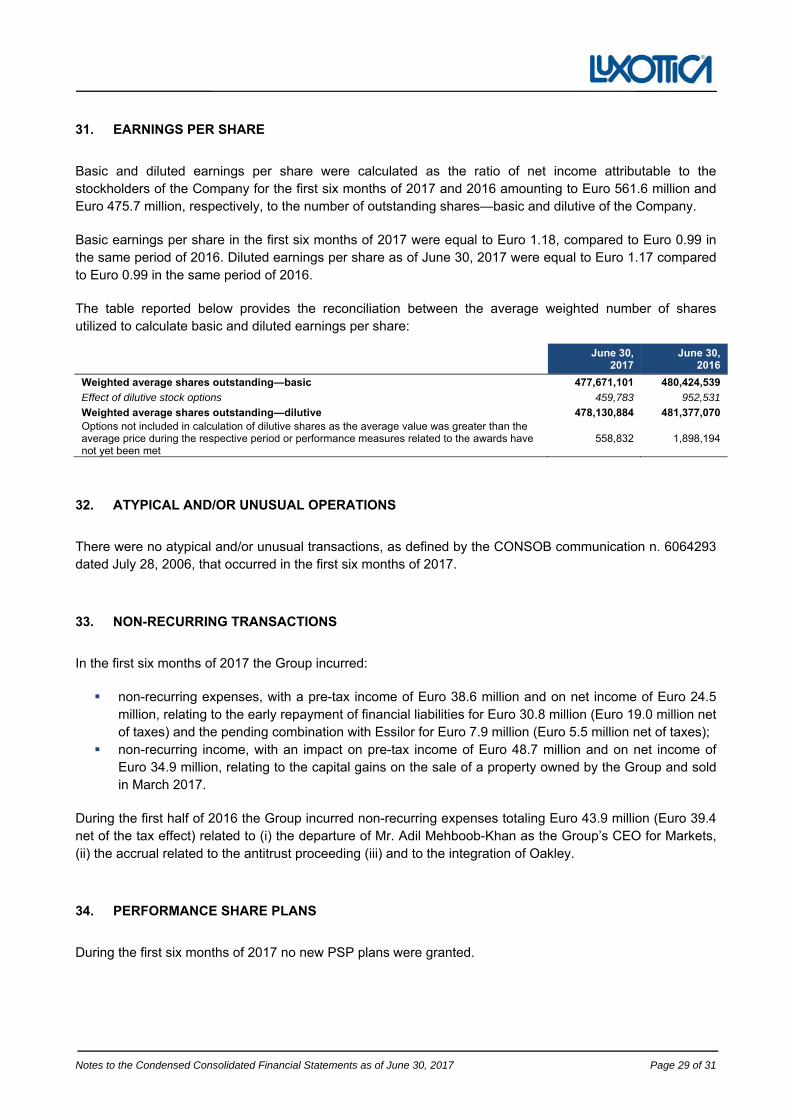
Notes to the Condensed Consolidated Financial Statements as of June 30, 2017 Page 29 of 31
31. EARNINGS PER SHARE
Basic and diluted earnings per share were calculated as the ratio of net income attributable to the stockholders of the Company for the first six months of 2017 and 2016 amounting to Euro 561.6 million and Euro 475.7 million, respectively, to the number of outstanding shares—basic and dilutive of the Company.
Basic earnings per share in the first six months of 2017 were equal to Euro 1.18, compared to Euro 0.99 in the same period of 2016. Diluted earnings per share as of June 30, 2017 were equal to Euro 1.17 compared to Euro 0.99 in the same period of 2016.
The table reported below provides the reconciliation between the average weighted number of shares utilized to calculate basic and diluted earnings per share:
June 30,
2017 June 30,
2016
Weighted average shares outstanding—basic 477,671,101 480,424,539
Effect of dilutive stock options 459,783 952,531
Weighted average shares outstanding—dilutive 478,130,884 481,377,070 Options not included in calculation of dilutive shares as the average value was greater than the average price during the respective period or performance measures related to the awards have not yet been met
558,832 1,898,194
32. ATYPICAL AND/OR UNUSUAL OPERATIONS
There were no atypical and/or unusual transactions, as defined by the CONSOB communication n. 6064293 dated July 28, 2006, that occurred in the first six months of 2017.
33. NON-RECURRING TRANSACTIONS
In the first six months of 2017 the Group incurred:
non-recurring expenses, with a pre-tax income of Euro 38.6 million and on net income of Euro 24.5 million, relating to the early repayment of financial liabilities for Euro 30.8 million (Euro 19.0 million net of taxes) and the pending combination with Essilor for Euro 7.9 million (Euro 5.5 million net of taxes);
non-recurring income, with an impact on pre-tax income of Euro 48.7 million and on net income of Euro 34.9 million, relating to the capital gains on the sale of a property owned by the Group and sold in March 2017.
During the first half of 2016 the Group incurred non-recurring expenses totaling Euro 43.9 million (Euro 39.4 net of the tax effect) related to (i) the departure of Mr. Adil Mehboob-Khan as the Group’s CEO for Markets, (ii) the accrual related to the antitrust proceeding (iii) and to the integration of Oakley.
34. PERFORMANCE SHARE PLANS
During the first six months of 2017 no new PSP plans were granted.
Notes to the Condensed Consolidated Financial Statements as of June 30, 2017 Page 30 of 31
35. SEASONAL AND CYCLICAL EFFECTS ON OPERATIONS
We have historically experienced sales volume fluctuations by quarter due to seasonality associated with the sale of sunglasses, which represented 47.1% percent of our net sales in the first six months of 2017 (48.7% in the same period of 2016).
36. SUBSEQUENT EVENTS
On July 6, 2017 the Luxottica Group completed the acquisition of 100% of Óticas Carol, one of the most important optics franchise chains in Brazil with approximately 990 stores. Thanks to this acquisition, Luxottica will enter the optics retail segment in Brazil, where the Group is already present with a network of Sunglass Hut and Oakley brand stores, a large wholesale network and a manufacturing plant in Campinas. In particular, the subsidiary Luxottica Brasil Produtos Oticos e Esportivos Ltda acquired 100% of the share capital of the Brazilian company Orange County Participaçoes S.A., owner of the Óticas Carol retail chain. The newly acquired Brazilian company also controls six companies based in Brazil. Luxottica Group S.p.A. thus informed CONSOB of its adjustment plan pursuant to Article 36-39 of the Market Regulation and, for the companies that do not benefit from the exemption under Article 36, paragraph 2, of the Regulation, it will provide evidence as regards the adaptation of accounting information published pursuant to CONSOB Regulation No. 11971/1999. The consideration paid for the acquisition was Euro 110.0 million and was determined with the application of recognized business valuation methods, subject to appropriate due diligence.
On July 3, 2017 Luxottica Group S.p.A. bought the building located in Piazzale Luigi Cadorna 3, Milan from Beni Stabili SIIQ S.p.A. for a consideration of Euro 114.6 million. For additional details please refer to Note 30 – related party transactions.
There were no additional events subsequent June 30, 2017 and up to the date this report was authorized for issue that are required to be described herein.
Notes to the Condensed Consolidated Financial Statements as of June 30, 2017 Page 31 of 31
**********
Milan, July 24, 2017
Luxottica Group S.p.A.
On behalf of the Board of Directors
Leonardo Del Vecchio Massimo Vian (Executive Chairman) (CEO for Product and Operations)
ATTACHMENTS
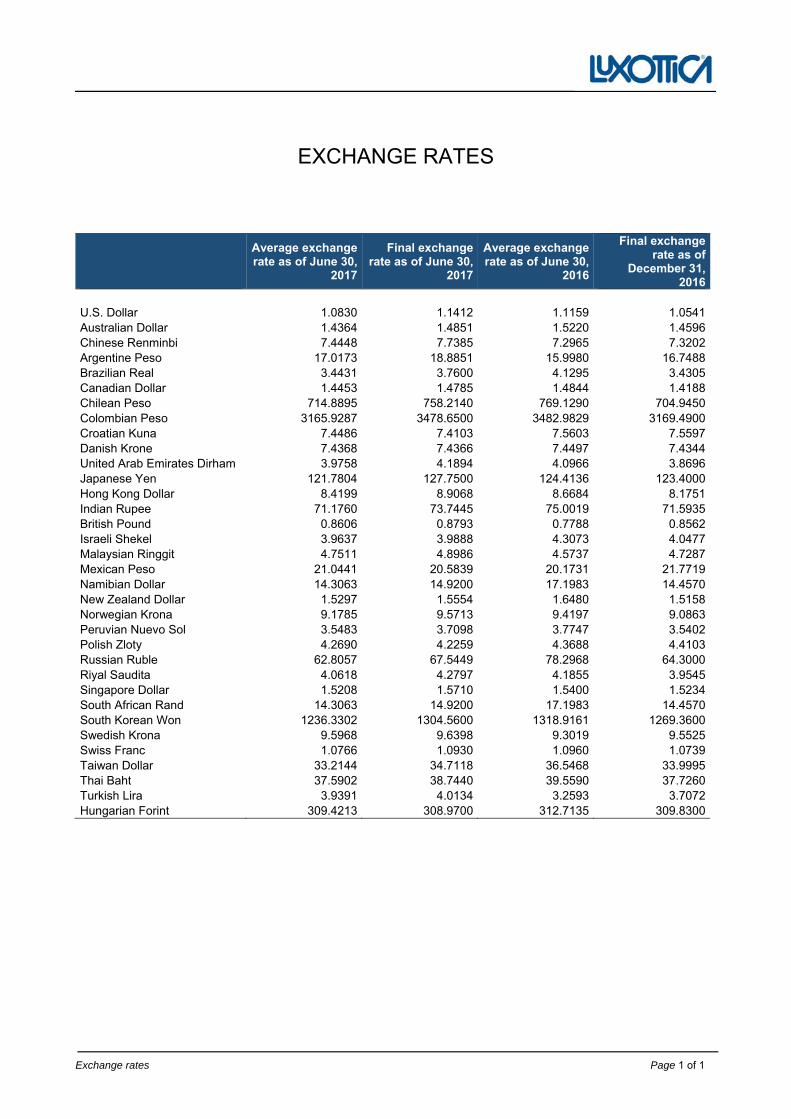
EXCHANGE RATES
Exchange rates Page 1 of 1
Average exchange rate as of June 30,
2017
Final exchange rate as of June 30,
2017
Average exchange rate as of June 30,
2016
Final exchange rate as of
December 31, 2016
U.S. Dollar 1.0830 1.1412 1.1159 1.0541Australian Dollar 1.4364 1.4851 1.5220 1.4596Chinese Renminbi 7.4448 7.7385 7.2965 7.3202Argentine Peso 17.0173 18.8851 15.9980 16.7488Brazilian Real 3.4431 3.7600 4.1295 3.4305Canadian Dollar 1.4453 1.4785 1.4844 1.4188Chilean Peso 714.8895 758.2140 769.1290 704.9450Colombian Peso 3165.9287 3478.6500 3482.9829 3169.4900Croatian Kuna 7.4486 7.4103 7.5603 7.5597Danish Krone 7.4368 7.4366 7.4497 7.4344United Arab Emirates Dirham 3.9758 4.1894 4.0966 3.8696Japanese Yen 121.7804 127.7500 124.4136 123.4000Hong Kong Dollar 8.4199 8.9068 8.6684 8.1751Indian Rupee 71.1760 73.7445 75.0019 71.5935British Pound 0.8606 0.8793 0.7788 0.8562Israeli Shekel 3.9637 3.9888 4.3073 4.0477Malaysian Ringgit 4.7511 4.8986 4.5737 4.7287Mexican Peso 21.0441 20.5839 20.1731 21.7719Namibian Dollar 14.3063 14.9200 17.1983 14.4570New Zealand Dollar 1.5297 1.5554 1.6480 1.5158Norwegian Krona 9.1785 9.5713 9.4197 9.0863Peruvian Nuevo Sol 3.5483 3.7098 3.7747 3.5402Polish Zloty 4.2690 4.2259 4.3688 4.4103Russian Ruble 62.8057 67.5449 78.2968 64.3000Riyal Saudita 4.0618 4.2797 4.1855 3.9545Singapore Dollar 1.5208 1.5710 1.5400 1.5234South African Rand 14.3063 14.9200 17.1983 14.4570South Korean Won 1236.3302 1304.5600 1318.9161 1269.3600Swedish Krona 9.5968 9.6398 9.3019 9.5525Swiss Franc 1.0766 1.0930 1.0960 1.0739Taiwan Dollar 33.2144 34.7118 36.5468 33.9995Thai Baht 37.5902 38.7440 39.5590 37.7260Turkish Lira 3.9391 4.0134 3.2593 3.7072Hungarian Forint 309.4213 308.9700 312.7135 309.8300
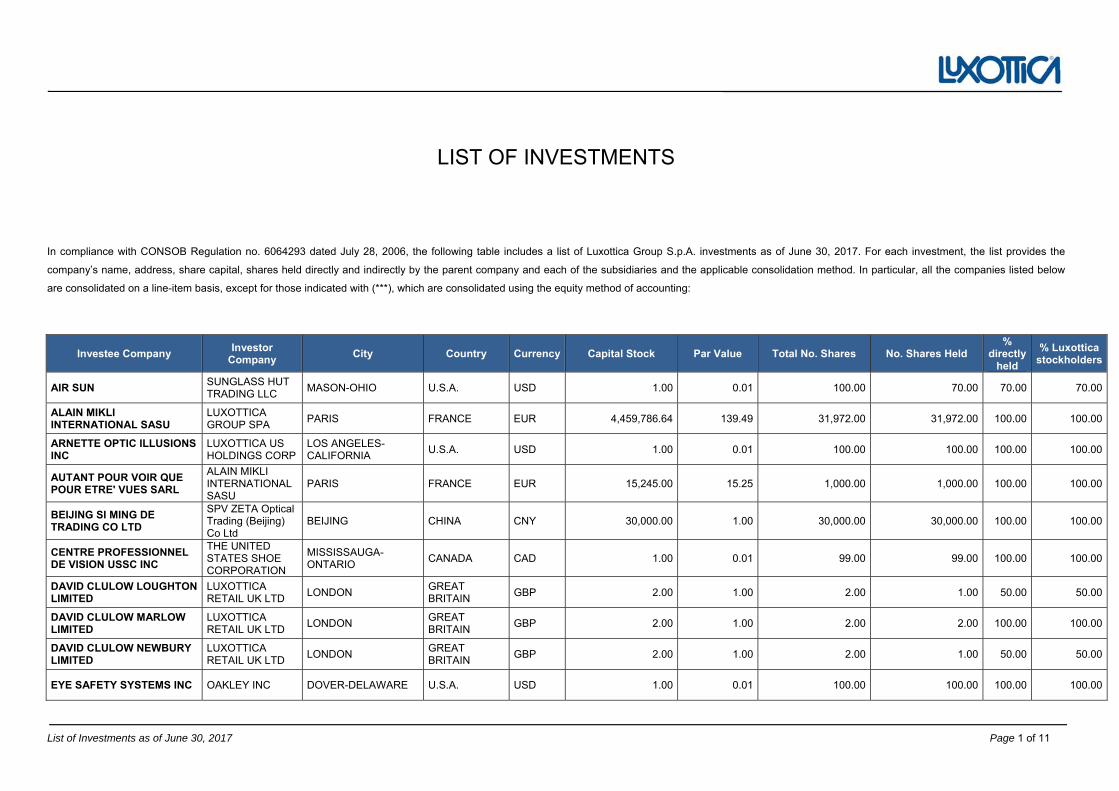
LIST OF INVESTMENTS
List of Investments as of June 30, 2017 Page 1 of 11
In compliance with CONSOB Regulation no. 6064293 dated July 28, 2006, the following table includes a list of Luxottica Group S.p.A. investments as of June 30, 2017. For each investment, the list provides the
company’s name, address, share capital, shares held directly and indirectly by the parent company and each of the subsidiaries and the applicable consolidation method. In particular, all the companies listed below
are consolidated on a line-item basis, except for those indicated with (***), which are consolidated using the equity method of accounting:
Investee Company Investor
Company City Country Currency Capital Stock Par Value Total No. Shares No. Shares Held
% directly
held
% Luxottica stockholders
AIR SUN SUNGLASS HUT TRADING LLC
MASON-OHIO U.S.A. USD 1.00 0.01 100.00 70.00 70.00 70.00
ALAIN MIKLI INTERNATIONAL SASU
LUXOTTICA GROUP SPA
PARIS FRANCE EUR 4,459,786.64 139.49 31,972.00 31,972.00 100.00 100.00
ARNETTE OPTIC ILLUSIONS INC
LUXOTTICA US HOLDINGS CORP
LOS ANGELES-CALIFORNIA
U.S.A. USD 1.00 0.01 100.00 100.00 100.00 100.00
AUTANT POUR VOIR QUE POUR ETRE' VUES SARL
ALAIN MIKLI INTERNATIONAL SASU
PARIS FRANCE EUR 15,245.00 15.25 1,000.00 1,000.00 100.00 100.00
BEIJING SI MING DE TRADING CO LTD
SPV ZETA Optical Trading (Beijing) Co Ltd
BEIJING CHINA CNY 30,000.00 1.00 30,000.00 30,000.00 100.00 100.00
CENTRE PROFESSIONNEL DE VISION USSC INC
THE UNITED STATES SHOE CORPORATION
MISSISSAUGA-ONTARIO
CANADA CAD 1.00 0.01 99.00 99.00 100.00 100.00
DAVID CLULOW LOUGHTON LIMITED
LUXOTTICA RETAIL UK LTD
LONDON GREAT BRITAIN
GBP 2.00 1.00 2.00 1.00 50.00 50.00
DAVID CLULOW MARLOW LIMITED
LUXOTTICA RETAIL UK LTD
LONDON GREAT BRITAIN
GBP 2.00 1.00 2.00 2.00 100.00 100.00
DAVID CLULOW NEWBURY LIMITED
LUXOTTICA RETAIL UK LTD
LONDON GREAT BRITAIN
GBP 2.00 1.00 2.00 1.00 50.00 50.00
EYE SAFETY SYSTEMS INC OAKLEY INC DOVER-DELAWARE U.S.A. USD 1.00 0.01 100.00 100.00 100.00 100.00
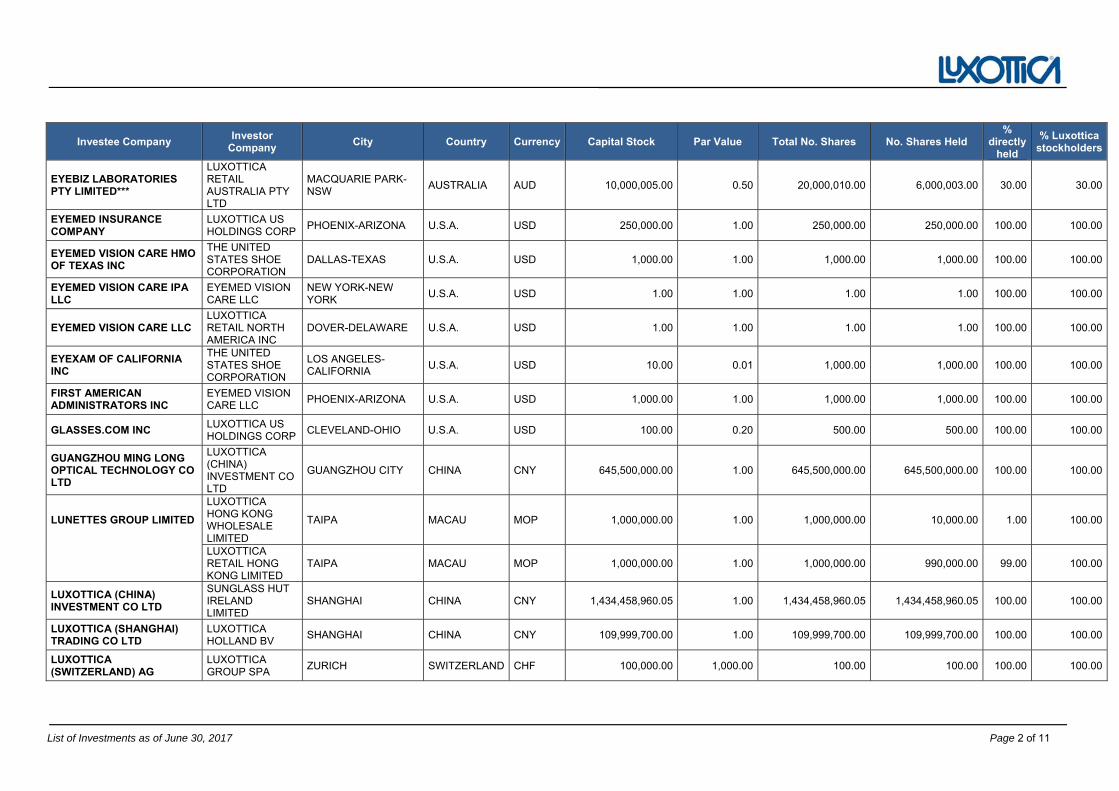
List of Investments as of June 30, 2017 Page 2 of 11
Investee Company Investor
Company City Country Currency Capital Stock Par Value Total No. Shares No. Shares Held
% directly
held
% Luxottica stockholders
EYEBIZ LABORATORIES PTY LIMITED***
LUXOTTICA RETAIL AUSTRALIA PTY LTD
MACQUARIE PARK-NSW
AUSTRALIA AUD 10,000,005.00 0.50 20,000,010.00 6,000,003.00 30.00 30.00
EYEMED INSURANCE COMPANY
LUXOTTICA US HOLDINGS CORP
PHOENIX-ARIZONA U.S.A. USD 250,000.00 1.00 250,000.00 250,000.00 100.00 100.00
EYEMED VISION CARE HMO OF TEXAS INC
THE UNITED STATES SHOE CORPORATION
DALLAS-TEXAS U.S.A. USD 1,000.00 1.00 1,000.00 1,000.00 100.00 100.00
EYEMED VISION CARE IPA LLC
EYEMED VISION CARE LLC
NEW YORK-NEW YORK
U.S.A. USD 1.00 1.00 1.00 1.00 100.00 100.00
EYEMED VISION CARE LLC LUXOTTICA RETAIL NORTH AMERICA INC
DOVER-DELAWARE U.S.A. USD 1.00 1.00 1.00 1.00 100.00 100.00
EYEXAM OF CALIFORNIA INC
THE UNITED STATES SHOE CORPORATION
LOS ANGELES-CALIFORNIA
U.S.A. USD 10.00 0.01 1,000.00 1,000.00 100.00 100.00
FIRST AMERICAN ADMINISTRATORS INC
EYEMED VISION CARE LLC
PHOENIX-ARIZONA U.S.A. USD 1,000.00 1.00 1,000.00 1,000.00 100.00 100.00
GLASSES.COM INC LUXOTTICA US HOLDINGS CORP
CLEVELAND-OHIO U.S.A. USD 100.00 0.20 500.00 500.00 100.00 100.00
GUANGZHOU MING LONG OPTICAL TECHNOLOGY CO LTD
LUXOTTICA (CHINA) INVESTMENT CO LTD
GUANGZHOU CITY CHINA CNY 645,500,000.00 1.00 645,500,000.00 645,500,000.00 100.00 100.00
LUNETTES GROUP LIMITED
LUXOTTICA HONG KONG WHOLESALE LIMITED
TAIPA MACAU MOP 1,000,000.00 1.00 1,000,000.00 10,000.00 1.00 100.00
LUXOTTICA RETAIL HONG KONG LIMITED
TAIPA MACAU MOP 1,000,000.00 1.00 1,000,000.00 990,000.00 99.00 100.00
LUXOTTICA (CHINA) INVESTMENT CO LTD
SUNGLASS HUT IRELAND LIMITED
SHANGHAI CHINA CNY 1,434,458,960.05 1.00 1,434,458,960.05 1,434,458,960.05 100.00 100.00
LUXOTTICA (SHANGHAI) TRADING CO LTD
LUXOTTICA HOLLAND BV
SHANGHAI CHINA CNY 109,999,700.00 1.00 109,999,700.00 109,999,700.00 100.00 100.00
LUXOTTICA (SWITZERLAND) AG
LUXOTTICA GROUP SPA
ZURICH SWITZERLAND CHF 100,000.00 1,000.00 100.00 100.00 100.00 100.00
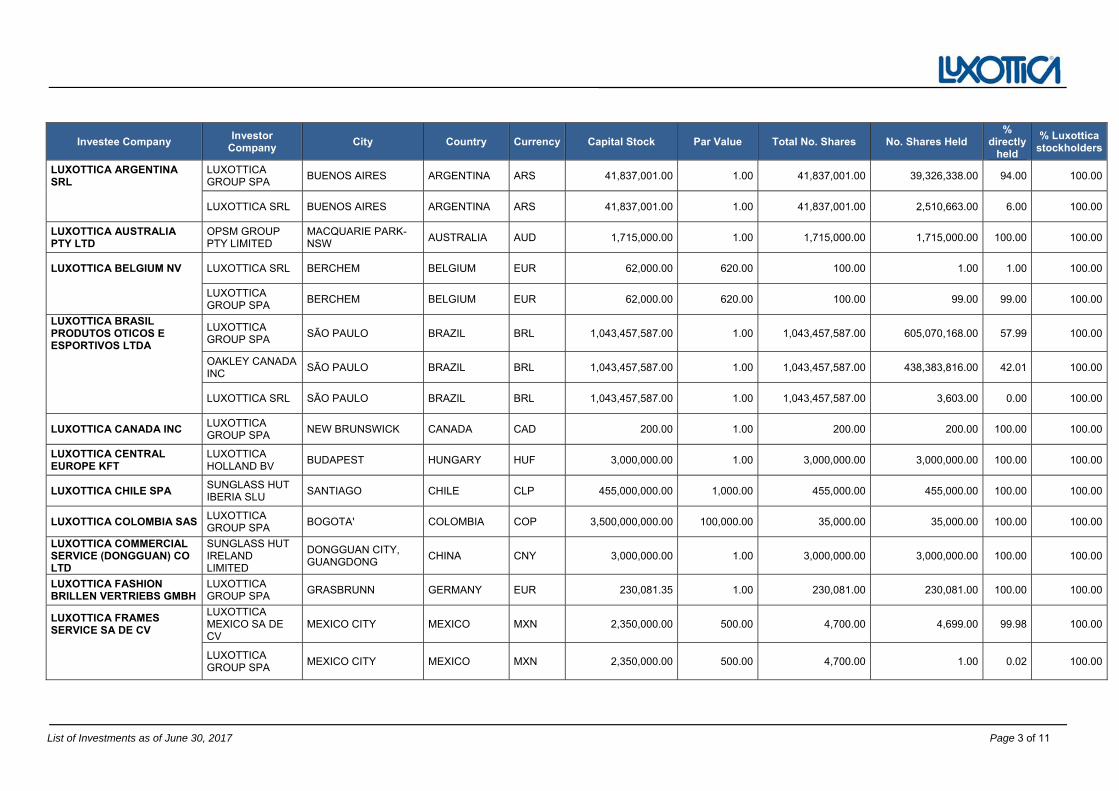
List of Investments as of June 30, 2017 Page 3 of 11
Investee Company Investor
Company City Country Currency Capital Stock Par Value Total No. Shares No. Shares Held
% directly
held
% Luxottica stockholders
LUXOTTICA ARGENTINA SRL
LUXOTTICA GROUP SPA
BUENOS AIRES ARGENTINA ARS 41,837,001.00 1.00 41,837,001.00 39,326,338.00 94.00 100.00
LUXOTTICA SRL BUENOS AIRES ARGENTINA ARS 41,837,001.00 1.00 41,837,001.00 2,510,663.00 6.00 100.00
LUXOTTICA AUSTRALIA PTY LTD
OPSM GROUP PTY LIMITED
MACQUARIE PARK-NSW
AUSTRALIA AUD 1,715,000.00 1.00 1,715,000.00 1,715,000.00 100.00 100.00
LUXOTTICA BELGIUM NV LUXOTTICA SRL BERCHEM BELGIUM EUR 62,000.00 620.00 100.00 1.00 1.00 100.00
LUXOTTICA GROUP SPA
BERCHEM BELGIUM EUR 62,000.00 620.00 100.00 99.00 99.00 100.00
LUXOTTICA BRASIL PRODUTOS OTICOS E ESPORTIVOS LTDA
LUXOTTICA GROUP SPA
SÃO PAULO BRAZIL BRL 1,043,457,587.00 1.00 1,043,457,587.00 605,070,168.00 57.99 100.00
OAKLEY CANADA INC
SÃO PAULO BRAZIL BRL 1,043,457,587.00 1.00 1,043,457,587.00 438,383,816.00 42.01 100.00
LUXOTTICA SRL SÃO PAULO BRAZIL BRL 1,043,457,587.00 1.00 1,043,457,587.00 3,603.00 0.00 100.00
LUXOTTICA CANADA INC LUXOTTICA GROUP SPA
NEW BRUNSWICK CANADA CAD 200.00 1.00 200.00 200.00 100.00 100.00
LUXOTTICA CENTRAL EUROPE KFT
LUXOTTICA HOLLAND BV
BUDAPEST HUNGARY HUF 3,000,000.00 1.00 3,000,000.00 3,000,000.00 100.00 100.00
LUXOTTICA CHILE SPA SUNGLASS HUT IBERIA SLU
SANTIAGO CHILE CLP 455,000,000.00 1,000.00 455,000.00 455,000.00 100.00 100.00
LUXOTTICA COLOMBIA SASLUXOTTICA GROUP SPA
BOGOTA' COLOMBIA COP 3,500,000,000.00 100,000.00 35,000.00 35,000.00 100.00 100.00
LUXOTTICA COMMERCIAL SERVICE (DONGGUAN) CO LTD
SUNGLASS HUT IRELAND LIMITED
DONGGUAN CITY, GUANGDONG
CHINA CNY 3,000,000.00 1.00 3,000,000.00 3,000,000.00 100.00 100.00
LUXOTTICA FASHION BRILLEN VERTRIEBS GMBH
LUXOTTICA GROUP SPA
GRASBRUNN GERMANY EUR 230,081.35 1.00 230,081.00 230,081.00 100.00 100.00
LUXOTTICA FRAMES SERVICE SA DE CV
LUXOTTICA MEXICO SA DE CV
MEXICO CITY MEXICO MXN 2,350,000.00 500.00 4,700.00 4,699.00 99.98 100.00
LUXOTTICA GROUP SPA
MEXICO CITY MEXICO MXN 2,350,000.00 500.00 4,700.00 1.00 0.02 100.00
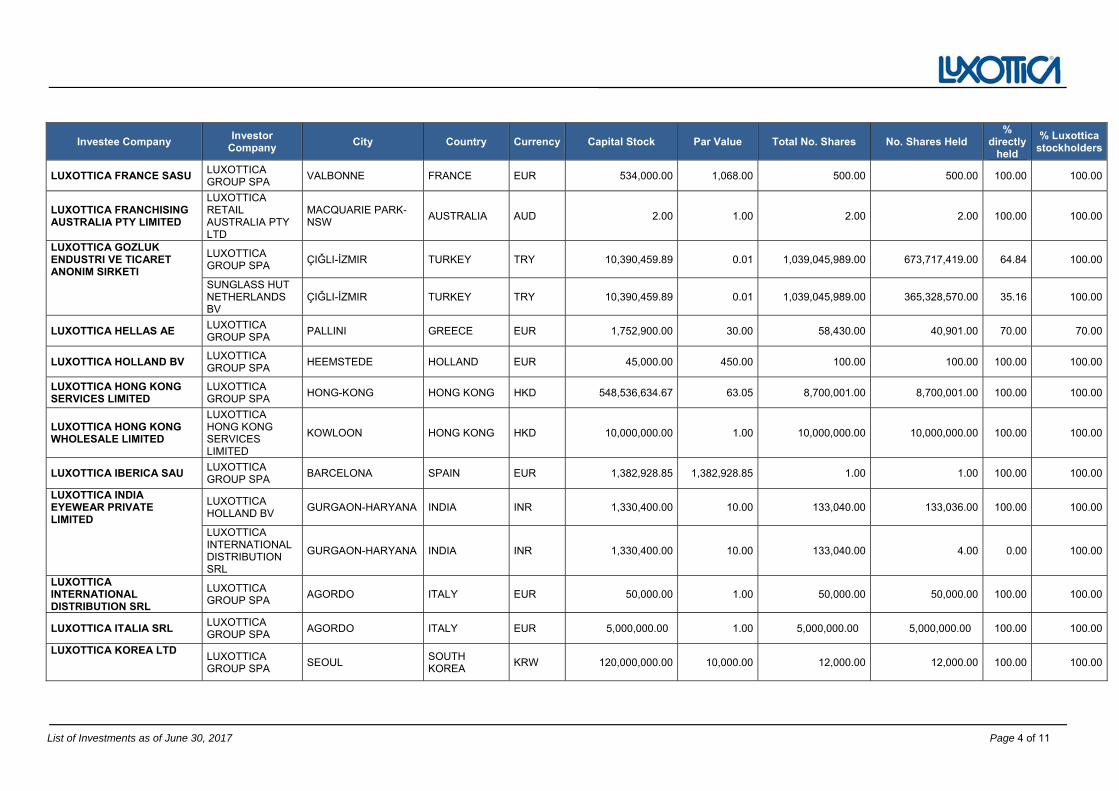
List of Investments as of June 30, 2017 Page 4 of 11
Investee Company Investor
Company City Country Currency Capital Stock Par Value Total No. Shares No. Shares Held
% directly
held
% Luxottica stockholders
LUXOTTICA FRANCE SASU LUXOTTICAGROUP SPA
VALBONNE FRANCE EUR 534,000.00 1,068.00 500.00 500.00 100.00 100.00
LUXOTTICA FRANCHISING AUSTRALIA PTY LIMITED
LUXOTTICA RETAIL AUSTRALIA PTY LTD
MACQUARIE PARK-NSW
AUSTRALIA AUD 2.00 1.00 2.00 2.00 100.00 100.00
LUXOTTICA GOZLUK ENDUSTRI VE TICARET ANONIM SIRKETI
LUXOTTICA GROUP SPA
ÇIǦLI-İZMIR TURKEY TRY 10,390,459.89 0.01 1,039,045,989.00 673,717,419.00 64.84 100.00
SUNGLASS HUT NETHERLANDS BV
ÇIǦLI-İZMIR TURKEY TRY 10,390,459.89 0.01 1,039,045,989.00 365,328,570.00 35.16 100.00
LUXOTTICA HELLAS AE LUXOTTICA GROUP SPA
PALLINI GREECE EUR 1,752,900.00 30.00 58,430.00 40,901.00 70.00 70.00
LUXOTTICA HOLLAND BV LUXOTTICA GROUP SPA
HEEMSTEDE HOLLAND EUR 45,000.00 450.00 100.00 100.00 100.00 100.00
LUXOTTICA HONG KONG SERVICES LIMITED
LUXOTTICA GROUP SPA
HONG-KONG HONG KONG HKD 548,536,634.67 63.05 8,700,001.00 8,700,001.00 100.00 100.00
LUXOTTICA HONG KONG WHOLESALE LIMITED
LUXOTTICA HONG KONG SERVICES LIMITED
KOWLOON HONG KONG HKD 10,000,000.00 1.00 10,000,000.00 10,000,000.00 100.00 100.00
LUXOTTICA IBERICA SAU LUXOTTICA GROUP SPA
BARCELONA SPAIN EUR 1,382,928.85 1,382,928.85 1.00 1.00 100.00 100.00
LUXOTTICA INDIA EYEWEAR PRIVATE LIMITED
LUXOTTICA HOLLAND BV
GURGAON-HARYANA INDIA INR 1,330,400.00 10.00 133,040.00 133,036.00 100.00 100.00
LUXOTTICA INTERNATIONAL DISTRIBUTION SRL
GURGAON-HARYANA INDIA INR 1,330,400.00 10.00 133,040.00 4.00 0.00 100.00
LUXOTTICA INTERNATIONAL DISTRIBUTION SRL
LUXOTTICA GROUP SPA
AGORDO ITALY EUR 50,000.00 1.00 50,000.00 50,000.00 100.00 100.00
LUXOTTICA ITALIA SRL LUXOTTICA GROUP SPA
AGORDO ITALY EUR 5,000,000.00 1.00 5,000,000.00 5,000,000.00 100.00 100.00
LUXOTTICA KOREA LTD LUXOTTICA GROUP SPA
SEOUL SOUTH KOREA
KRW 120,000,000.00 10,000.00 12,000.00 12,000.00 100.00 100.00
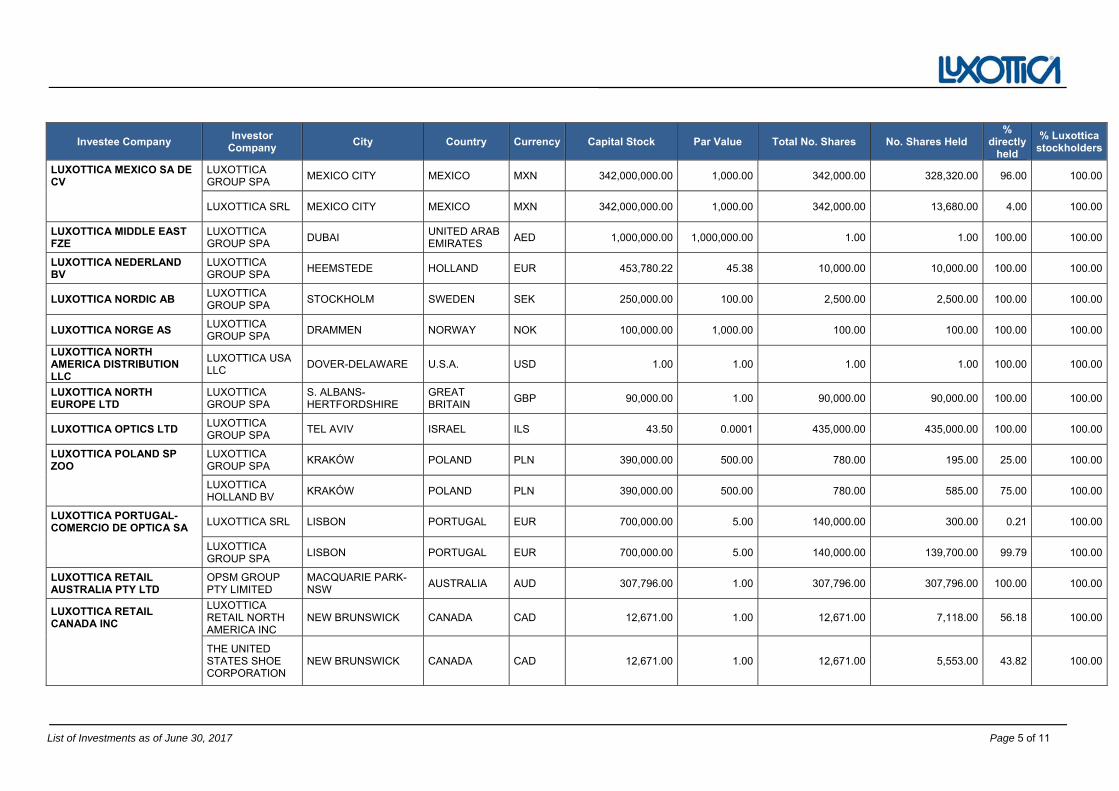
List of Investments as of June 30, 2017 Page 5 of 11
Investee Company Investor
Company City Country Currency Capital Stock Par Value Total No. Shares No. Shares Held
% directly
held
% Luxottica stockholders
LUXOTTICA MEXICO SA DE CV
LUXOTTICA GROUP SPA
MEXICO CITY MEXICO MXN 342,000,000.00 1,000.00 342,000.00 328,320.00 96.00 100.00
LUXOTTICA SRL MEXICO CITY MEXICO MXN 342,000,000.00 1,000.00 342,000.00 13,680.00 4.00 100.00
LUXOTTICA MIDDLE EAST FZE
LUXOTTICA GROUP SPA
DUBAI UNITED ARAB EMIRATES
AED 1,000,000.00 1,000,000.00 1.00 1.00 100.00 100.00
LUXOTTICA NEDERLAND BV
LUXOTTICA GROUP SPA
HEEMSTEDE HOLLAND EUR 453,780.22 45.38 10,000.00 10,000.00 100.00 100.00
LUXOTTICA NORDIC AB LUXOTTICA GROUP SPA
STOCKHOLM SWEDEN SEK 250,000.00 100.00 2,500.00 2,500.00 100.00 100.00
LUXOTTICA NORGE AS LUXOTTICA GROUP SPA
DRAMMEN NORWAY NOK 100,000.00 1,000.00 100.00 100.00 100.00 100.00
LUXOTTICA NORTH AMERICA DISTRIBUTION LLC
LUXOTTICA USA LLC
DOVER-DELAWARE U.S.A. USD 1.00 1.00 1.00 1.00 100.00 100.00
LUXOTTICA NORTH EUROPE LTD
LUXOTTICA GROUP SPA
S. ALBANS-HERTFORDSHIRE
GREAT BRITAIN
GBP 90,000.00 1.00 90,000.00 90,000.00 100.00 100.00
LUXOTTICA OPTICS LTD LUXOTTICA GROUP SPA
TEL AVIV ISRAEL ILS 43.50 0.0001 435,000.00 435,000.00 100.00 100.00
LUXOTTICA POLAND SP ZOO
LUXOTTICA GROUP SPA
KRAKÓW POLAND PLN 390,000.00 500.00 780.00 195.00 25.00 100.00
LUXOTTICA HOLLAND BV
KRAKÓW POLAND PLN 390,000.00 500.00 780.00 585.00 75.00 100.00
LUXOTTICA PORTUGAL-COMERCIO DE OPTICA SA
LUXOTTICA SRL LISBON PORTUGAL EUR 700,000.00 5.00 140,000.00 300.00 0.21 100.00
LUXOTTICA GROUP SPA
LISBON PORTUGAL EUR 700,000.00 5.00 140,000.00 139,700.00 99.79 100.00
LUXOTTICA RETAIL AUSTRALIA PTY LTD
OPSM GROUP PTY LIMITED
MACQUARIE PARK-NSW
AUSTRALIA AUD 307,796.00 1.00 307,796.00 307,796.00 100.00 100.00
LUXOTTICA RETAIL CANADA INC
LUXOTTICA RETAIL NORTH AMERICA INC
NEW BRUNSWICK CANADA CAD 12,671.00 1.00 12,671.00 7,118.00 56.18 100.00
THE UNITED STATES SHOE CORPORATION
NEW BRUNSWICK CANADA CAD 12,671.00 1.00 12,671.00 5,553.00 43.82 100.00
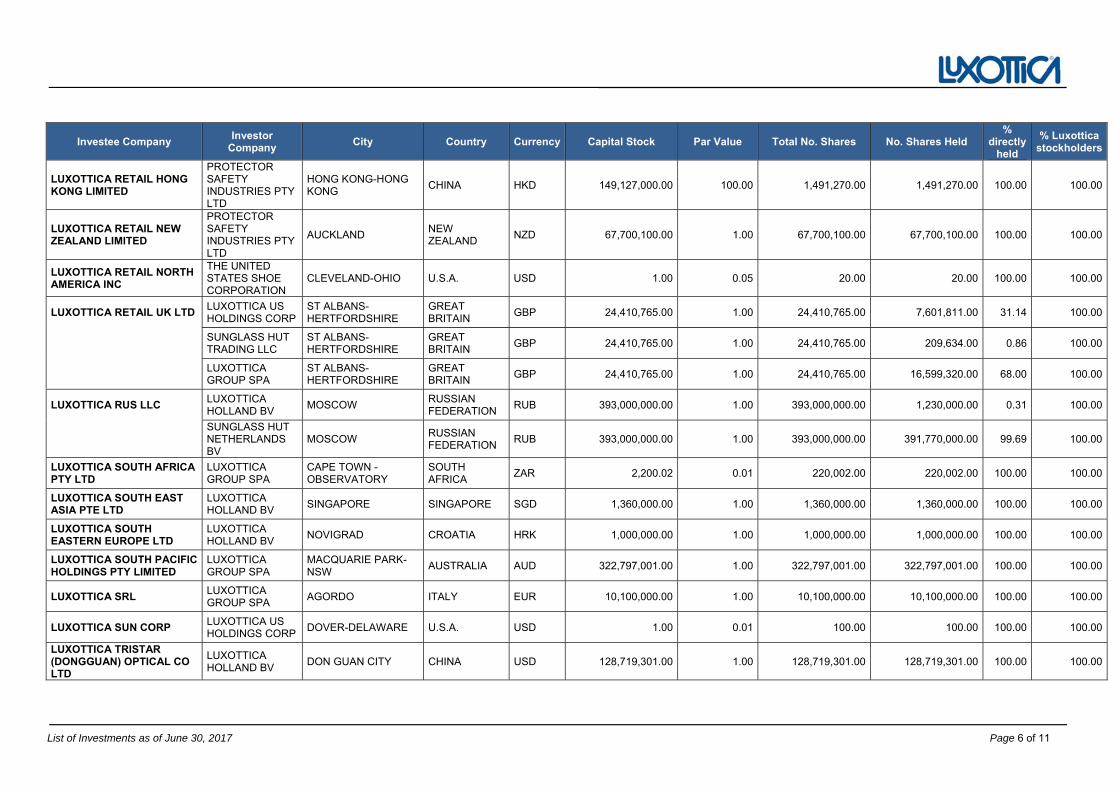
List of Investments as of June 30, 2017 Page 6 of 11
Investee Company Investor
Company City Country Currency Capital Stock Par Value Total No. Shares No. Shares Held
% directly
held
% Luxottica stockholders
LUXOTTICA RETAIL HONG KONG LIMITED
PROTECTOR SAFETY INDUSTRIES PTY LTD
HONG KONG-HONG KONG
CHINA HKD 149,127,000.00 100.00 1,491,270.00 1,491,270.00 100.00 100.00
LUXOTTICA RETAIL NEW ZEALAND LIMITED
PROTECTOR SAFETY INDUSTRIES PTY LTD
AUCKLAND NEW ZEALAND
NZD 67,700,100.00 1.00 67,700,100.00 67,700,100.00 100.00 100.00
LUXOTTICA RETAIL NORTH AMERICA INC
THE UNITED STATES SHOE CORPORATION
CLEVELAND-OHIO U.S.A. USD 1.00 0.05 20.00 20.00 100.00 100.00
LUXOTTICA RETAIL UK LTD LUXOTTICA USHOLDINGS CORP
ST ALBANS-HERTFORDSHIRE
GREAT BRITAIN
GBP 24,410,765.00 1.00 24,410,765.00 7,601,811.00 31.14 100.00
SUNGLASS HUT TRADING LLC
ST ALBANS-HERTFORDSHIRE
GREAT BRITAIN
GBP 24,410,765.00 1.00 24,410,765.00 209,634.00 0.86 100.00
LUXOTTICA GROUP SPA
ST ALBANS-HERTFORDSHIRE
GREAT BRITAIN
GBP 24,410,765.00 1.00 24,410,765.00 16,599,320.00 68.00 100.00
LUXOTTICA RUS LLC LUXOTTICA HOLLAND BV
MOSCOW RUSSIANFEDERATION
RUB 393,000,000.00 1.00 393,000,000.00 1,230,000.00 0.31 100.00
SUNGLASS HUT NETHERLANDS BV
MOSCOW RUSSIANFEDERATION
RUB 393,000,000.00 1.00 393,000,000.00 391,770,000.00 99.69 100.00
LUXOTTICA SOUTH AFRICA PTY LTD
LUXOTTICA GROUP SPA
CAPE TOWN - OBSERVATORY
SOUTH AFRICA
ZAR 2,200.02 0.01 220,002.00 220,002.00 100.00 100.00
LUXOTTICA SOUTH EAST ASIA PTE LTD
LUXOTTICA HOLLAND BV
SINGAPORE SINGAPORE SGD 1,360,000.00 1.00 1,360,000.00 1,360,000.00 100.00 100.00
LUXOTTICA SOUTH EASTERN EUROPE LTD
LUXOTTICA HOLLAND BV
NOVIGRAD CROATIA HRK 1,000,000.00 1.00 1,000,000.00 1,000,000.00 100.00 100.00
LUXOTTICA SOUTH PACIFIC HOLDINGS PTY LIMITED
LUXOTTICA GROUP SPA
MACQUARIE PARK-NSW
AUSTRALIA AUD 322,797,001.00 1.00 322,797,001.00 322,797,001.00 100.00 100.00
LUXOTTICA SRL LUXOTTICA GROUP SPA
AGORDO ITALY EUR 10,100,000.00 1.00 10,100,000.00 10,100,000.00 100.00 100.00
LUXOTTICA SUN CORP LUXOTTICA USHOLDINGS CORP
DOVER-DELAWARE U.S.A. USD 1.00 0.01 100.00 100.00 100.00 100.00
LUXOTTICA TRISTAR (DONGGUAN) OPTICAL CO LTD
LUXOTTICA HOLLAND BV
DON GUAN CITY CHINA USD 128,719,301.00 1.00 128,719,301.00 128,719,301.00 100.00 100.00
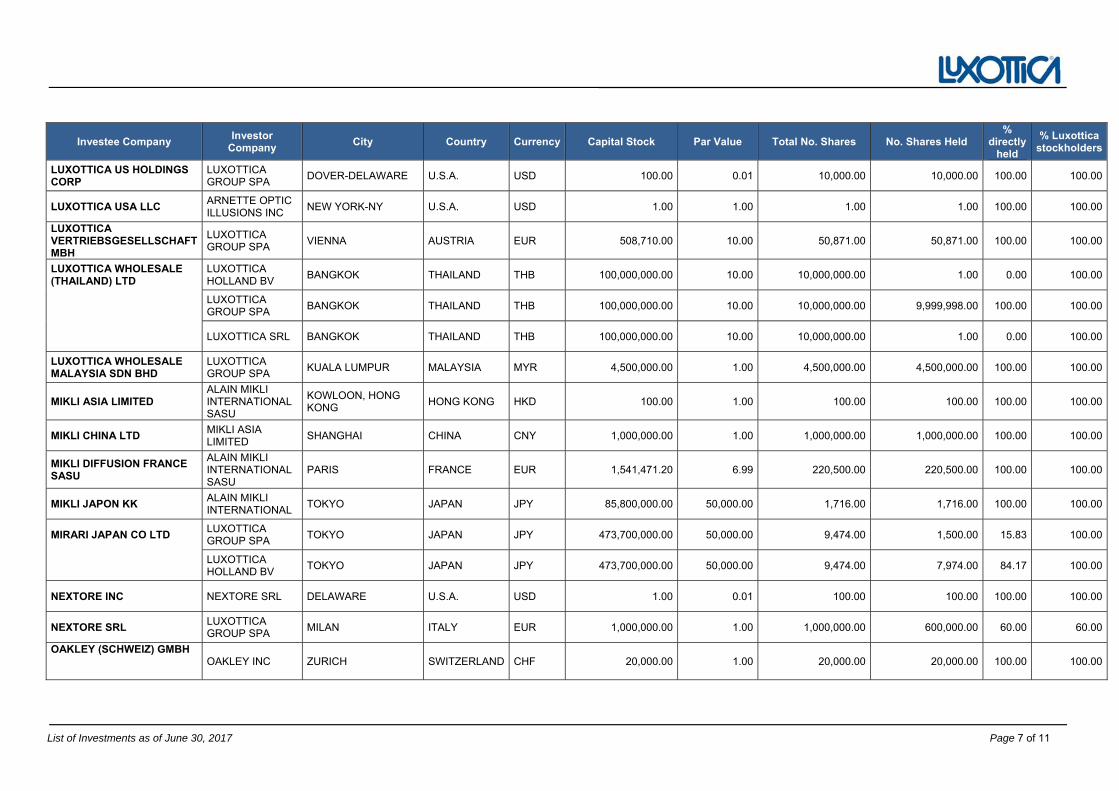
List of Investments as of June 30, 2017 Page 7 of 11
Investee Company Investor
Company City Country Currency Capital Stock Par Value Total No. Shares No. Shares Held
% directly
held
% Luxottica stockholders
LUXOTTICA US HOLDINGS CORP
LUXOTTICA GROUP SPA
DOVER-DELAWARE U.S.A. USD 100.00 0.01 10,000.00 10,000.00 100.00 100.00
LUXOTTICA USA LLC ARNETTE OPTIC ILLUSIONS INC
NEW YORK-NY U.S.A. USD 1.00 1.00 1.00 1.00 100.00 100.00
LUXOTTICA VERTRIEBSGESELLSCHAFT MBH
LUXOTTICA GROUP SPA
VIENNA AUSTRIA EUR 508,710.00 10.00 50,871.00 50,871.00 100.00 100.00
LUXOTTICA WHOLESALE (THAILAND) LTD
LUXOTTICA HOLLAND BV
BANGKOK THAILAND THB 100,000,000.00 10.00 10,000,000.00 1.00 0.00 100.00
LUXOTTICA GROUP SPA
BANGKOK THAILAND THB 100,000,000.00 10.00 10,000,000.00 9,999,998.00 100.00 100.00
LUXOTTICA SRL BANGKOK THAILAND THB 100,000,000.00 10.00 10,000,000.00 1.00 0.00 100.00
LUXOTTICA WHOLESALE MALAYSIA SDN BHD
LUXOTTICA GROUP SPA
KUALA LUMPUR MALAYSIA MYR 4,500,000.00 1.00 4,500,000.00 4,500,000.00 100.00 100.00
MIKLI ASIA LIMITED ALAIN MIKLI INTERNATIONAL SASU
KOWLOON, HONG KONG
HONG KONG HKD 100.00 1.00 100.00 100.00 100.00 100.00
MIKLI CHINA LTD MIKLI ASIA LIMITED
SHANGHAI CHINA CNY 1,000,000.00 1.00 1,000,000.00 1,000,000.00 100.00 100.00
MIKLI DIFFUSION FRANCE SASU
ALAIN MIKLI INTERNATIONAL SASU
PARIS FRANCE EUR 1,541,471.20 6.99 220,500.00 220,500.00 100.00 100.00
MIKLI JAPON KK ALAIN MIKLI INTERNATIONAL
TOKYO JAPAN JPY 85,800,000.00 50,000.00 1,716.00 1,716.00 100.00 100.00
MIRARI JAPAN CO LTD LUXOTTICA GROUP SPA
TOKYO JAPAN JPY 473,700,000.00 50,000.00 9,474.00 1,500.00 15.83 100.00
LUXOTTICA HOLLAND BV
TOKYO JAPAN JPY 473,700,000.00 50,000.00 9,474.00 7,974.00 84.17 100.00
NEXTORE INC NEXTORE SRL DELAWARE U.S.A. USD 1.00 0.01 100.00 100.00 100.00 100.00
NEXTORE SRL LUXOTTICA GROUP SPA
MILAN ITALY EUR 1,000,000.00 1.00 1,000,000.00 600,000.00 60.00 60.00
OAKLEY (SCHWEIZ) GMBH
OAKLEY INC ZURICH SWITZERLAND CHF 20,000.00 1.00 20,000.00 20,000.00 100.00 100.00
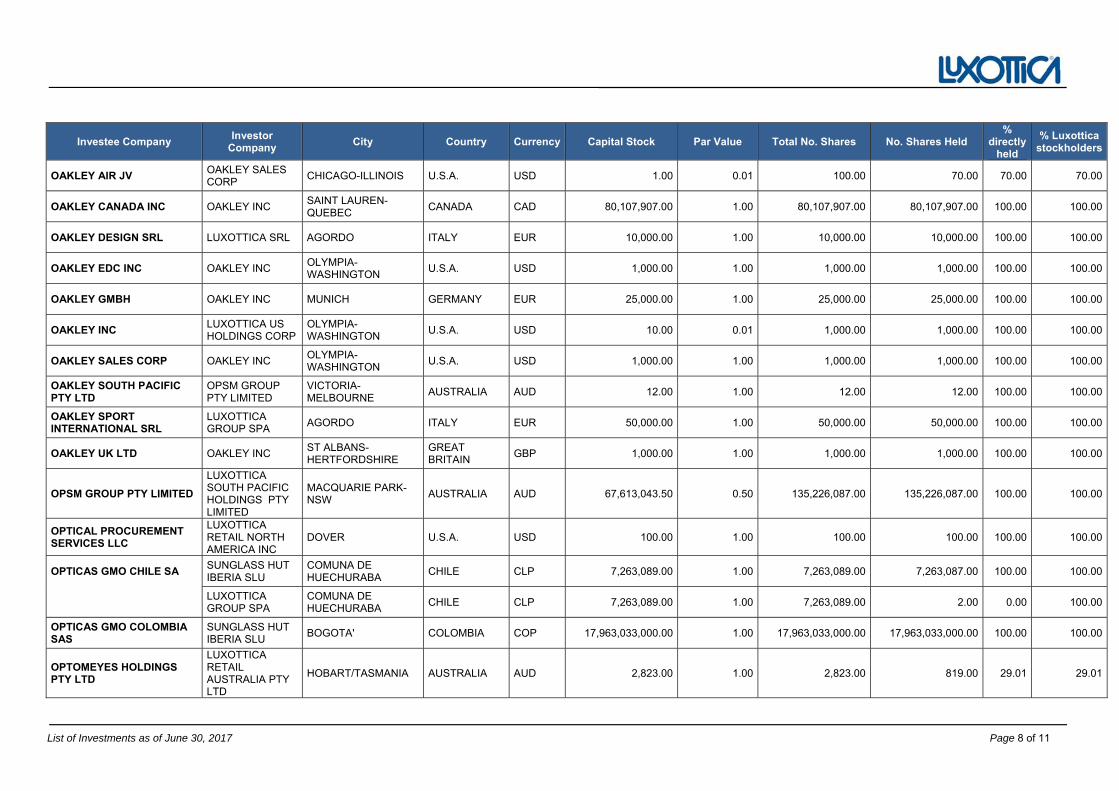
List of Investments as of June 30, 2017 Page 8 of 11
Investee Company Investor
Company City Country Currency Capital Stock Par Value Total No. Shares No. Shares Held
% directly
held
% Luxottica stockholders
OAKLEY AIR JV OAKLEY SALES CORP
CHICAGO-ILLINOIS U.S.A. USD 1.00 0.01 100.00 70.00 70.00 70.00
OAKLEY CANADA INC OAKLEY INC SAINT LAUREN-QUEBEC
CANADA CAD 80,107,907.00 1.00 80,107,907.00 80,107,907.00 100.00 100.00
OAKLEY DESIGN SRL LUXOTTICA SRL AGORDO ITALY EUR 10,000.00 1.00 10,000.00 10,000.00 100.00 100.00
OAKLEY EDC INC OAKLEY INC OLYMPIA-WASHINGTON
U.S.A. USD 1,000.00 1.00 1,000.00 1,000.00 100.00 100.00
OAKLEY GMBH OAKLEY INC MUNICH GERMANY EUR 25,000.00 1.00 25,000.00 25,000.00 100.00 100.00
OAKLEY INC LUXOTTICA US HOLDINGS CORP
OLYMPIA-WASHINGTON
U.S.A. USD 10.00 0.01 1,000.00 1,000.00 100.00 100.00
OAKLEY SALES CORP OAKLEY INC OLYMPIA-WASHINGTON
U.S.A. USD 1,000.00 1.00 1,000.00 1,000.00 100.00 100.00
OAKLEY SOUTH PACIFIC PTY LTD
OPSM GROUP PTY LIMITED
VICTORIA-MELBOURNE
AUSTRALIA AUD 12.00 1.00 12.00 12.00 100.00 100.00
OAKLEY SPORT INTERNATIONAL SRL
LUXOTTICA GROUP SPA
AGORDO ITALY EUR 50,000.00 1.00 50,000.00 50,000.00 100.00 100.00
OAKLEY UK LTD OAKLEY INC ST ALBANS-HERTFORDSHIRE
GREAT BRITAIN
GBP 1,000.00 1.00 1,000.00 1,000.00 100.00 100.00
OPSM GROUP PTY LIMITED
LUXOTTICA SOUTH PACIFIC HOLDINGS PTY LIMITED
MACQUARIE PARK-NSW
AUSTRALIA AUD 67,613,043.50 0.50 135,226,087.00 135,226,087.00 100.00 100.00
OPTICAL PROCUREMENT SERVICES LLC
LUXOTTICA RETAIL NORTH AMERICA INC
DOVER U.S.A. USD 100.00 1.00 100.00 100.00 100.00 100.00
OPTICAS GMO CHILE SA SUNGLASS HUT IBERIA SLU
COMUNA DE HUECHURABA
CHILE CLP 7,263,089.00 1.00 7,263,089.00 7,263,087.00 100.00 100.00
LUXOTTICA GROUP SPA
COMUNA DE HUECHURABA
CHILE CLP 7,263,089.00 1.00 7,263,089.00 2.00 0.00 100.00
OPTICAS GMO COLOMBIA SAS
SUNGLASS HUT IBERIA SLU
BOGOTA' COLOMBIA COP 17,963,033,000.00 1.00 17,963,033,000.00 17,963,033,000.00 100.00 100.00
OPTOMEYES HOLDINGS PTY LTD
LUXOTTICA RETAIL AUSTRALIA PTY LTD
HOBART/TASMANIA AUSTRALIA AUD 2,823.00 1.00 2,823.00 819.00 29.01 29.01
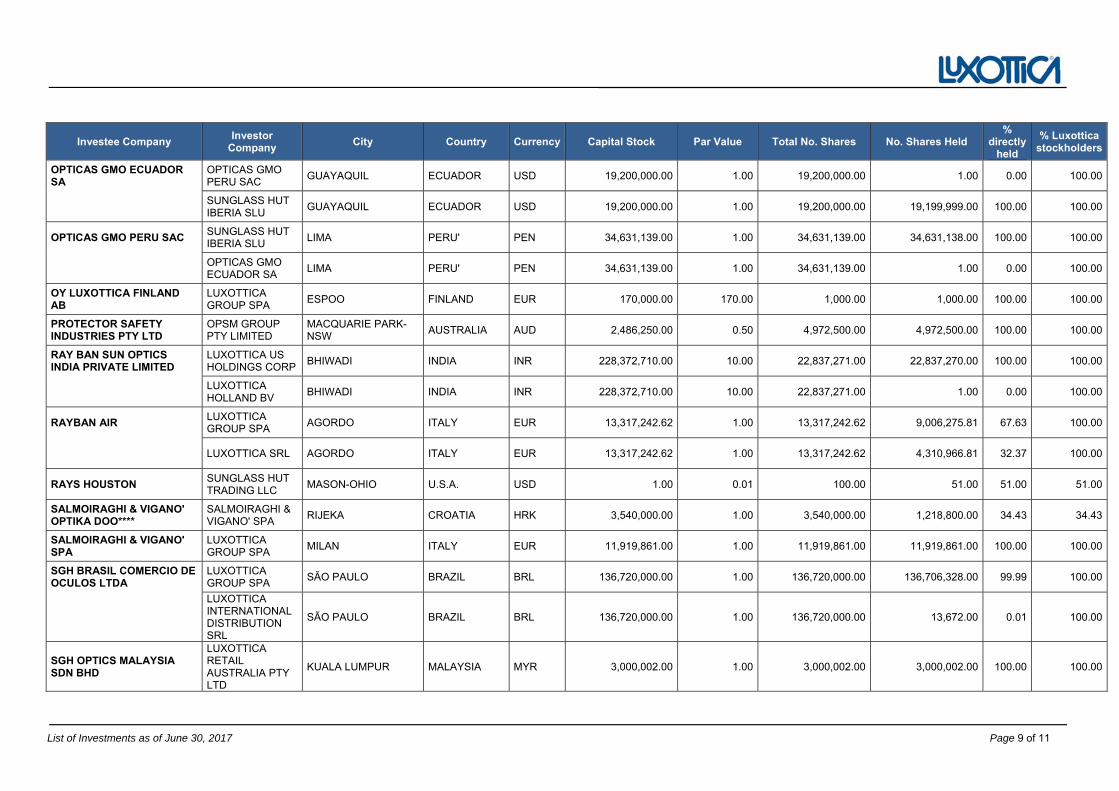
List of Investments as of June 30, 2017 Page 9 of 11
Investee Company Investor
Company City Country Currency Capital Stock Par Value Total No. Shares No. Shares Held
% directly
held
% Luxottica stockholders
OPTICAS GMO ECUADOR SA
OPTICAS GMO PERU SAC
GUAYAQUIL ECUADOR USD 19,200,000.00 1.00 19,200,000.00 1.00 0.00 100.00
SUNGLASS HUT IBERIA SLU
GUAYAQUIL ECUADOR USD 19,200,000.00 1.00 19,200,000.00 19,199,999.00 100.00 100.00
OPTICAS GMO PERU SAC SUNGLASS HUT IBERIA SLU
LIMA PERU' PEN 34,631,139.00 1.00 34,631,139.00 34,631,138.00 100.00 100.00
OPTICAS GMO ECUADOR SA
LIMA PERU' PEN 34,631,139.00 1.00 34,631,139.00 1.00 0.00 100.00
OY LUXOTTICA FINLAND AB
LUXOTTICA GROUP SPA
ESPOO FINLAND EUR 170,000.00 170.00 1,000.00 1,000.00 100.00 100.00
PROTECTOR SAFETY INDUSTRIES PTY LTD
OPSM GROUP PTY LIMITED
MACQUARIE PARK-NSW
AUSTRALIA AUD 2,486,250.00 0.50 4,972,500.00 4,972,500.00 100.00 100.00
RAY BAN SUN OPTICS INDIA PRIVATE LIMITED
LUXOTTICA US HOLDINGS CORP
BHIWADI INDIA INR 228,372,710.00 10.00 22,837,271.00 22,837,270.00 100.00 100.00
LUXOTTICA HOLLAND BV
BHIWADI INDIA INR 228,372,710.00 10.00 22,837,271.00 1.00 0.00 100.00
RAYBAN AIR LUXOTTICA GROUP SPA
AGORDO ITALY EUR 13,317,242.62 1.00 13,317,242.62 9,006,275.81 67.63 100.00
LUXOTTICA SRL AGORDO ITALY EUR 13,317,242.62 1.00 13,317,242.62 4,310,966.81 32.37 100.00
RAYS HOUSTON SUNGLASS HUT TRADING LLC
MASON-OHIO U.S.A. USD 1.00 0.01 100.00 51.00 51.00 51.00
SALMOIRAGHI & VIGANO' OPTIKA DOO****
SALMOIRAGHI & VIGANO' SPA
RIJEKA CROATIA HRK 3,540,000.00 1.00 3,540,000.00 1,218,800.00 34.43 34.43
SALMOIRAGHI & VIGANO' SPA
LUXOTTICA GROUP SPA
MILAN ITALY EUR 11,919,861.00 1.00 11,919,861.00 11,919,861.00 100.00 100.00
SGH BRASIL COMERCIO DE OCULOS LTDA
LUXOTTICA GROUP SPA
SÃO PAULO BRAZIL BRL 136,720,000.00 1.00 136,720,000.00 136,706,328.00 99.99 100.00
LUXOTTICA INTERNATIONAL DISTRIBUTION SRL
SÃO PAULO BRAZIL BRL 136,720,000.00 1.00 136,720,000.00 13,672.00 0.01 100.00
SGH OPTICS MALAYSIA SDN BHD
LUXOTTICA RETAIL AUSTRALIA PTY LTD
KUALA LUMPUR MALAYSIA MYR 3,000,002.00 1.00 3,000,002.00 3,000,002.00 100.00 100.00
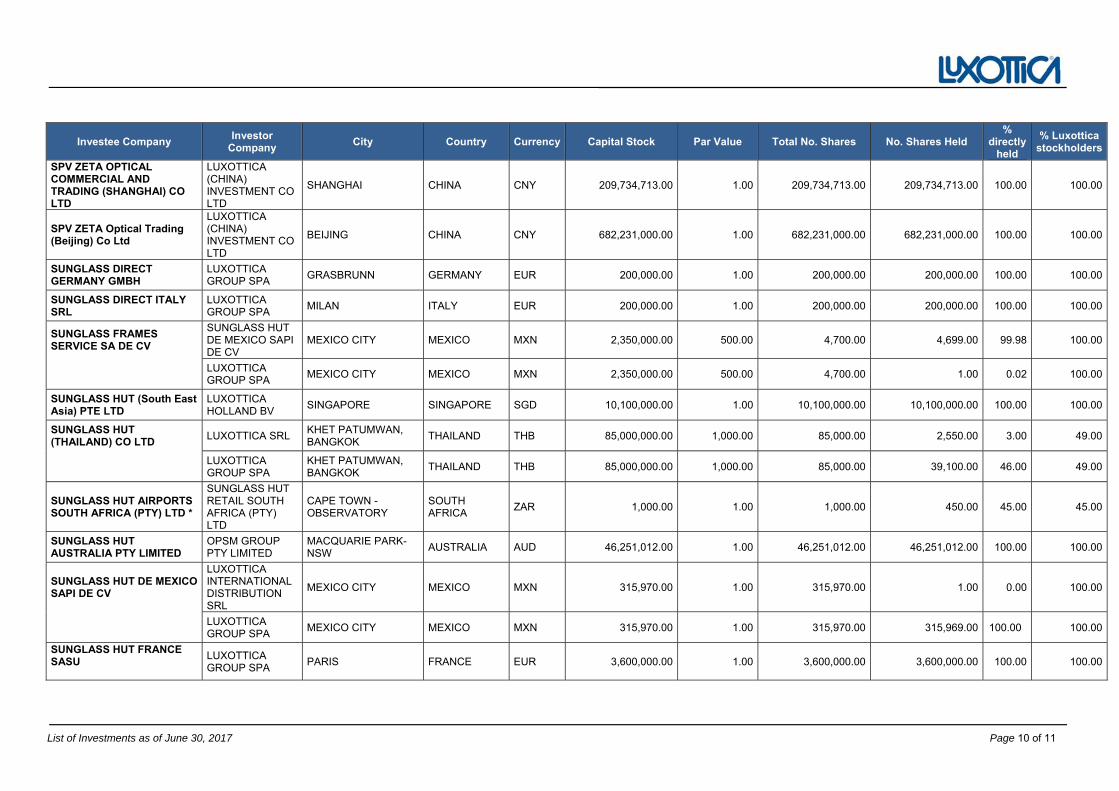
List of Investments as of June 30, 2017 Page 10 of 11
Investee Company Investor
Company City Country Currency Capital Stock Par Value Total No. Shares No. Shares Held
% directly
held
% Luxottica stockholders
SPV ZETA OPTICAL COMMERCIAL AND TRADING (SHANGHAI) CO LTD
LUXOTTICA (CHINA) INVESTMENT CO LTD
SHANGHAI CHINA CNY 209,734,713.00 1.00 209,734,713.00 209,734,713.00 100.00 100.00
SPV ZETA Optical Trading (Beijing) Co Ltd
LUXOTTICA (CHINA) INVESTMENT CO LTD
BEIJING CHINA CNY 682,231,000.00 1.00 682,231,000.00 682,231,000.00 100.00 100.00
SUNGLASS DIRECT GERMANY GMBH
LUXOTTICA GROUP SPA
GRASBRUNN GERMANY EUR 200,000.00 1.00 200,000.00 200,000.00 100.00 100.00
SUNGLASS DIRECT ITALY SRL
LUXOTTICA GROUP SPA
MILAN ITALY EUR 200,000.00 1.00 200,000.00 200,000.00 100.00 100.00
SUNGLASS FRAMES SERVICE SA DE CV
SUNGLASS HUT DE MEXICO SAPI DE CV
MEXICO CITY MEXICO MXN 2,350,000.00 500.00 4,700.00 4,699.00 99.98 100.00
LUXOTTICA GROUP SPA
MEXICO CITY MEXICO MXN 2,350,000.00 500.00 4,700.00 1.00 0.02 100.00
SUNGLASS HUT (South East Asia) PTE LTD
LUXOTTICA HOLLAND BV
SINGAPORE SINGAPORE SGD 10,100,000.00 1.00 10,100,000.00 10,100,000.00 100.00 100.00
SUNGLASS HUT (THAILAND) CO LTD
LUXOTTICA SRL KHET PATUMWAN, BANGKOK
THAILAND THB 85,000,000.00 1,000.00 85,000.00 2,550.00 3.00 49.00
LUXOTTICA GROUP SPA
KHET PATUMWAN, BANGKOK
THAILAND THB 85,000,000.00 1,000.00 85,000.00 39,100.00 46.00 49.00
SUNGLASS HUT AIRPORTS SOUTH AFRICA (PTY) LTD *
SUNGLASS HUT RETAIL SOUTH AFRICA (PTY) LTD
CAPE TOWN - OBSERVATORY
SOUTH AFRICA
ZAR 1,000.00 1.00 1,000.00 450.00 45.00 45.00
SUNGLASS HUT AUSTRALIA PTY LIMITED
OPSM GROUP PTY LIMITED
MACQUARIE PARK-NSW
AUSTRALIA AUD 46,251,012.00 1.00 46,251,012.00 46,251,012.00 100.00 100.00
SUNGLASS HUT DE MEXICO SAPI DE CV
LUXOTTICA INTERNATIONAL DISTRIBUTION SRL
MEXICO CITY MEXICO MXN 315,970.00 1.00 315,970.00 1.00 0.00 100.00
LUXOTTICA GROUP SPA
MEXICO CITY MEXICO MXN 315,970.00 1.00 315,970.00 315,969.00 100.00 100.00
SUNGLASS HUT FRANCE SASU
LUXOTTICA GROUP SPA
PARIS FRANCE EUR 3,600,000.00 1.00 3,600,000.00 3,600,000.00 100.00 100.00
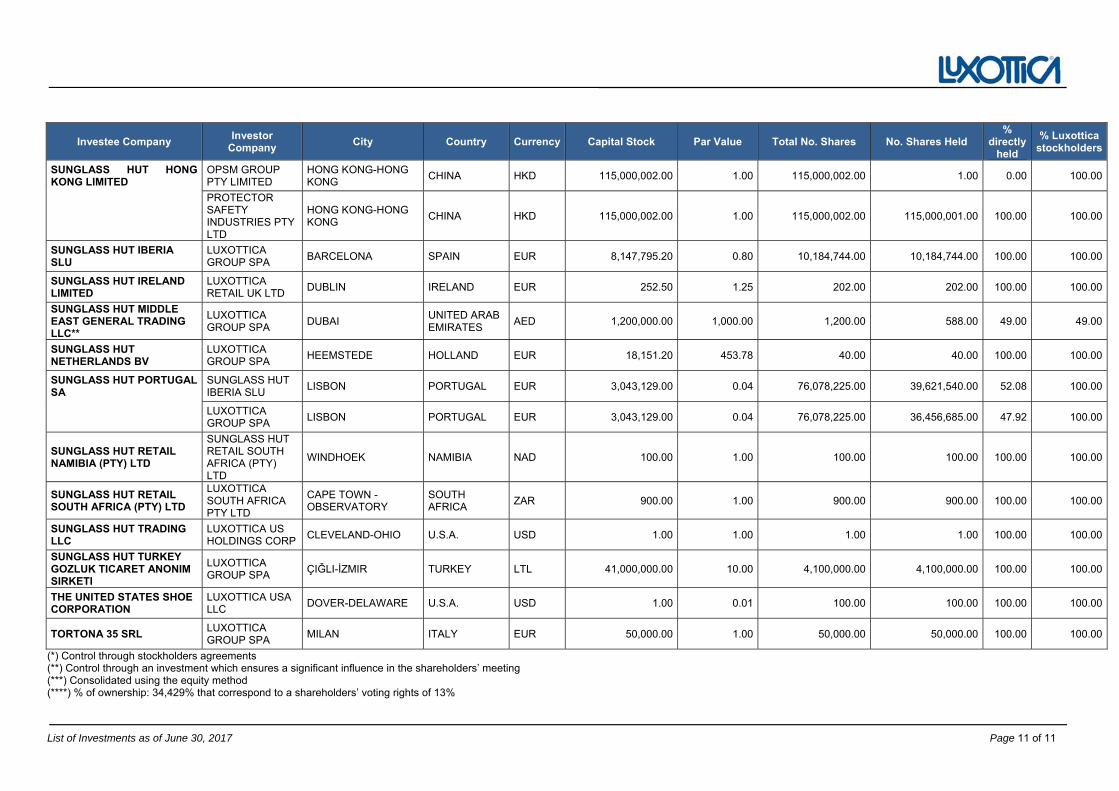
List of Investments as of June 30, 2017 Page 11 of 11
Investee Company Investor
Company City Country Currency Capital Stock Par Value Total No. Shares No. Shares Held
% directly
held
% Luxottica stockholders
SUNGLASS HUT HONG KONG LIMITED
OPSM GROUP PTY LIMITED
HONG KONG-HONG KONG
CHINA HKD 115,000,002.00 1.00 115,000,002.00 1.00 0.00 100.00
PROTECTOR SAFETY INDUSTRIES PTY LTD
HONG KONG-HONG KONG
CHINA HKD 115,000,002.00 1.00 115,000,002.00 115,000,001.00 100.00 100.00
SUNGLASS HUT IBERIA SLU
LUXOTTICA GROUP SPA
BARCELONA SPAIN EUR 8,147,795.20 0.80 10,184,744.00 10,184,744.00 100.00 100.00
SUNGLASS HUT IRELAND LIMITED
LUXOTTICA RETAIL UK LTD
DUBLIN IRELAND EUR 252.50 1.25 202.00 202.00 100.00 100.00
SUNGLASS HUT MIDDLE EAST GENERAL TRADING LLC**
LUXOTTICA GROUP SPA
DUBAI UNITED ARAB EMIRATES
AED 1,200,000.00 1,000.00 1,200.00 588.00 49.00 49.00
SUNGLASS HUT NETHERLANDS BV
LUXOTTICA GROUP SPA
HEEMSTEDE HOLLAND EUR 18,151.20 453.78 40.00 40.00 100.00 100.00
SUNGLASS HUT PORTUGAL SA
SUNGLASS HUT IBERIA SLU
LISBON PORTUGAL EUR 3,043,129.00 0.04 76,078,225.00 39,621,540.00 52.08 100.00
LUXOTTICA GROUP SPA
LISBON PORTUGAL EUR 3,043,129.00 0.04 76,078,225.00 36,456,685.00 47.92 100.00
SUNGLASS HUT RETAIL NAMIBIA (PTY) LTD
SUNGLASS HUT RETAIL SOUTH AFRICA (PTY) LTD
WINDHOEK NAMIBIA NAD 100.00 1.00 100.00 100.00 100.00 100.00
SUNGLASS HUT RETAIL SOUTH AFRICA (PTY) LTD
LUXOTTICA SOUTH AFRICA PTY LTD
CAPE TOWN - OBSERVATORY
SOUTH AFRICA
ZAR 900.00 1.00 900.00 900.00 100.00 100.00
SUNGLASS HUT TRADING LLC
LUXOTTICA US HOLDINGS CORP
CLEVELAND-OHIO U.S.A. USD 1.00 1.00 1.00 1.00 100.00 100.00
SUNGLASS HUT TURKEY GOZLUK TICARET ANONIM SIRKETI
LUXOTTICA GROUP SPA
ÇIǦLI-İZMIR TURKEY LTL 41,000,000.00 10.00 4,100,000.00 4,100,000.00 100.00 100.00
THE UNITED STATES SHOE CORPORATION
LUXOTTICA USA LLC
DOVER-DELAWARE U.S.A. USD 1.00 0.01 100.00 100.00 100.00 100.00
TORTONA 35 SRL LUXOTTICA GROUP SPA
MILAN ITALY EUR 50,000.00 1.00 50,000.00 50,000.00 100.00 100.00
(*) Control through stockholders agreements (**) Control through an investment which ensures a significant influence in the shareholders’ meeting (***) Consolidated using the equity method (****) % of ownership: 34,429% that correspond to a shareholders’ voting rights of 13%
CERTIFICATION OF THE CONDENSED
CONSOLIDATED FINANCIAL STATEMENTS AS
OF JUNE 30, 2017
Certification of the Consolidated Financial Statements as of June 30, 2017 Page 1 of 2
Certification of the consolidated financial statements pursuant to Article 154-bis of Legislative
Decree 58/98.
1. The undersigned Leonardo Del Vecchio, as Executive Chairman, Massimo Vian, as Chief Executive
Officer for Product and Operations and Stefano Grassi, as Chief Financial Officer of Luxottica Group S.p.A,
having also taken into account the provisions of Article 154-bis, paragraphs 3 and 4, of Legislative Decree
no. 58 of 24 February 1998, hereby certify:
• the adequacy in relation to the characteristics of the Company and
• the effective implementation of the administrative and accounting procedures for the preparation of the
condensed consolidated financial statements during the period ending as of June 30, 2017.
2. The assessment of the adequacy of the administrative and accounting procedures for the preparation of
the condensed consolidated financial statements as of June 30, 2017 was based on a process developed by
Luxottica Group S.p.A in accordance with the model of Internal Control—Integrated Framework issued by
the Committee of Sponsoring Organizations of the Treadway Commission which is a framework generally
accepted internationally.
3. It is also certified that:
3.1 the condensed consolidated financial statements as of June 30, 2017:
a) have been prepared in accordance with International Accounting Standards recognized in the European
Union under EC Regulation no. 1606/2002 of the European Parliament and of the Council of July 19, 2002,
in particular with IAS 34—Interim Financial Reporting, and the provisions which implement Art. 9 of
Legislative Decree no. 38/205 issued in implementation of Article 9 of Legislative Decree no. 38/205;
b) are consistent with the entries in the accounting books and records;
c) are suitable for providing a truthful and accurate representation of the financial and economic situation of
the issuer as well as of the companies included within the scope of consolidation.
3.2 The management report on the condensed consolidated financial statements includes a reliable
analysis of operating trends and results for the period as well as the condition of the issuer and of the
companies included within the scope of consolidation. The management report also includes a description of
the primary risks and uncertainties to which the Group is exposed. The management report also contains
information on relevant transactions with related party.
Certification of the Consolidated Financial Statements as of June 30, 2017 Page 2 of 2
**********
Milan, July 24, 2017
Luxottica Group S.p.A.
On behalf of the Board of Directors
Leonardo Del Vecchio (Executive Chairman)
Massimo Vian Stefano Grassi (C.E.O for Product and Operations) (Officer responsible for
preparing the Company’s financial reports)
STATUTORY AUDITORS’ REPORT