Embed Size (px)
Citation preview

Interim Financial ReportMacquarie Group
Half-year ended 30 September 2019
MACQUARIE GROUP LIMITED ACN 122 169 279
Macquarie Group 2019 Interim Financial ReportThis Interim Financial Report has been prepared in accordance with Australian Accounting Standards and the Corporations Act 2001 (Cth) and does not include all the notes of the type normally included in an annual financial report.
The material in this report has been prepared by MGL ABN 94 122 169 279 and is current at the date of this report. It is general background information about Macquarie’s activities, is provided in summary form in terms of the requirements of AASB 134 Interim Financial Reporting and does not purport to be complete. It is not intended to be relied upon as advice to investors or potential investors and does not take into account the investment objectives, financial situation or needs of any particular investor. These should be considered with professional advice when deciding if an investment is appropriate.
The Interim Financial Report was authorised for issue by MGL’s Directors on 1 November 2019. The Board of Directors has the power to amend and reissue the Financial Report.
The Macquarie name and Holey Dollar device are registered trade marks of Macquarie Group Limited ACN 122 169 279.

This page has been intentionally left blank.

01Directors’ Report
4 Macquarie Group Limited and its subsidiaries 2020 Interim Report
DirectorsFor the half-year ended 30 September 2019
The Directors of MGL submit their report with the financial report of the Consolidated Entity for the half-year ended 30 September 2019.
DirectorsAt the date of this report, the Directors of Macquarie are:
Independent DirectorsP.H. Warne, Chairman
G.R. Banks AO
J.R. Broadbent AC
G.M. Cairns
P.M. Coffey
M.J. Coleman
D.J. Grady AM
M.J. Hawker AM
G.R. Stevens AC
N.M. Wakefield Evans
Executive Voting DirectorS.R. Wikramanayake, Managing Director and Chief Executive Officer
The Directors listed above each held office as a Director of Macquarie throughout the period and until the date of this report. Those Directors listed as Independent Directors have been independent throughout the period of their appointment.
ResultThe financial report for the half-year ended 30 September 2019 and the results herein are prepared in accordance with AASB 134 Interim Financial Reporting and the Corporations Act 2001 (Cth).
The consolidated profit attributable to the ordinary equity holders of Macquarie Group Limited, in accordance with Australian Accounting Standards, for the period was $A1,457 million (half-year to 31 March 2019: $A1,672 million; half-year to 30 September 2018: $A1,310 million).

16 Macquarie Group Limited and its subsidiaries 2020 Interim Report
Auditor’s independence declarationFor the half-year ended 30 September 2019
As lead auditor for the review of Macquarie Group Limited for the half-year ended 30 September 2019, I declare that to the best of my knowledge and belief, there have been: – no contraventions of the auditor independence requirements of
the Corporations Act 2001 (Cth) in relation to the review; and – no contraventions of any applicable code of professional
conduct in relation to the review.
This declaration is in respect of Macquarie Group Limited and the entities it controlled during the period.
Kristin StubbinsPartnerPricewaterhouseCoopers
Sydney1 November 2019
PricewaterhouseCoopers, ABN 52 780 433 757
One International Towers Sydney, Watermans Quay, Barangaroo, GPO BOX 2650, SYDNEY NSW 2001 T: +61 2 8266 0000, F: +61 2 8266 9999, www.pwc.com.au
Liability is limited by a scheme approved under Professional Standards Legislation.

Macquarie Group Limited and its subsidiaries 2020 Interim Report 17
Financial ReportDirectors’ Report
This page has been intentionally left blank.

02Financial Report
Macquarie Group Limited and its subsidiaries 2020 Interim Report 19
Directors’ Report Financial Report
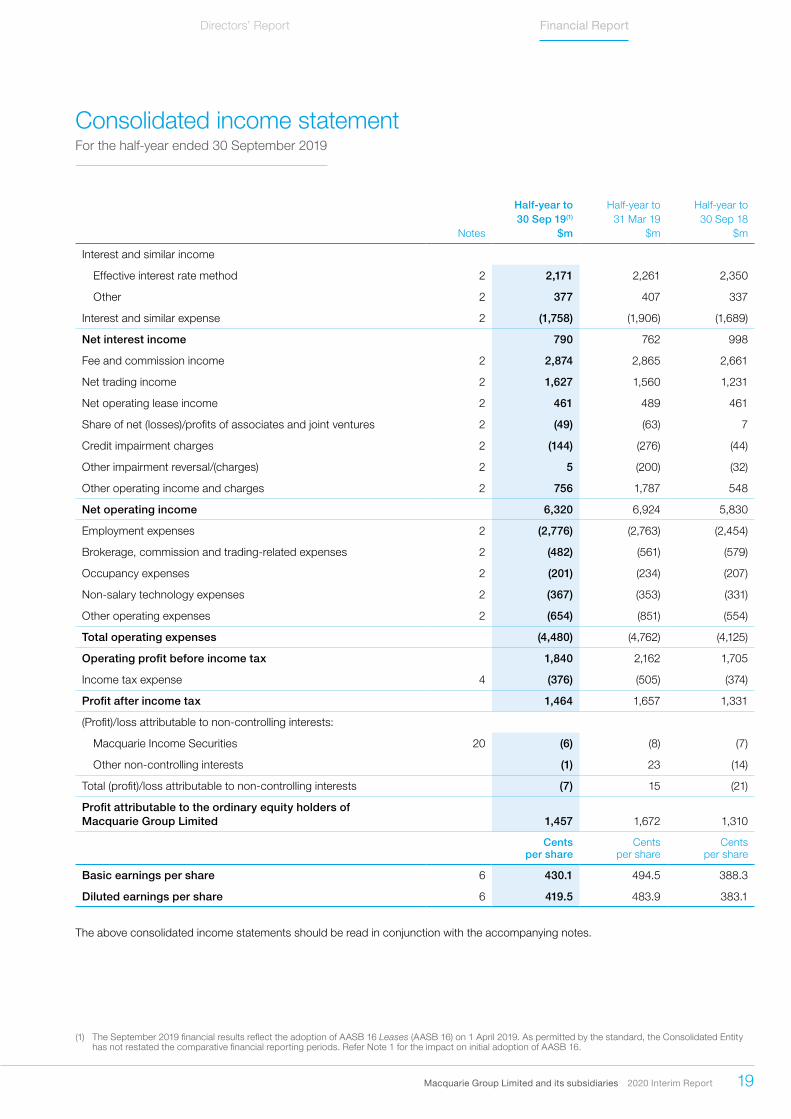
Half-year to Half-year to Half-year to 30 Sep 19(1) 31 Mar 19 30 Sep 18
Notes $m $m $m
Interest and similar income
Effective interest rate method 2 2,171 2,261 2,350
Other 2 377 407 337
Interest and similar expense 2 (1,758) (1,906) (1,689)
Net interest income 790 762 998
Fee and commission income 2 2,874 2,865 2,661
Net trading income 2 1,627 1,560 1,231
Net operating lease income 2 461 489 461
Share of net (losses)/profits of associates and joint ventures 2 (49) (63) 7
Credit impairment charges 2 (144) (276) (44)
Other impairment reversal/(charges) 2 5 (200) (32)
Other operating income and charges 2 756 1,787 548
Net operating income 6,320 6,924 5,830
Employment expenses 2 (2,776) (2,763) (2,454)
Brokerage, commission and trading-related expenses 2 (482) (561) (579)
Occupancy expenses 2 (201) (234) (207)
Non-salary technology expenses 2 (367) (353) (331)
Other operating expenses 2 (654) (851) (554)
Total operating expenses (4,480) (4,762) (4,125)
Operating profit before income tax 1,840 2,162 1,705
Income tax expense 4 (376) (505) (374)
Profit after income tax 1,464 1,657 1,331
(Profit)/loss attributable to non-controlling interests:
Macquarie Income Securities 20 (6) (8) (7)
Other non-controlling interests (1) 23 (14)
Total (profit)/loss attributable to non-controlling interests (7) 15 (21)
Profit attributable to the ordinary equity holders of Macquarie Group Limited 1,457 1,672 1,310
Cents per share
Cents per share
Cents per share
Basic earnings per share 6 430.1 494.5 388.3
Diluted earnings per share 6 419.5 483.9 383.1
The above consolidated income statements should be read in conjunction with the accompanying notes.
(1) The September 2019 financial results reflect the adoption of AASB 16 Leases (AASB 16) on 1 April 2019. As permitted by the standard, the Consolidated Entity has not restated the comparative financial reporting periods. Refer Note 1 for the impact on initial adoption of AASB 16.
Consolidated income statementFor the half-year ended 30 September 2019
20 Macquarie Group Limited and its subsidiaries 2020 Interim Report
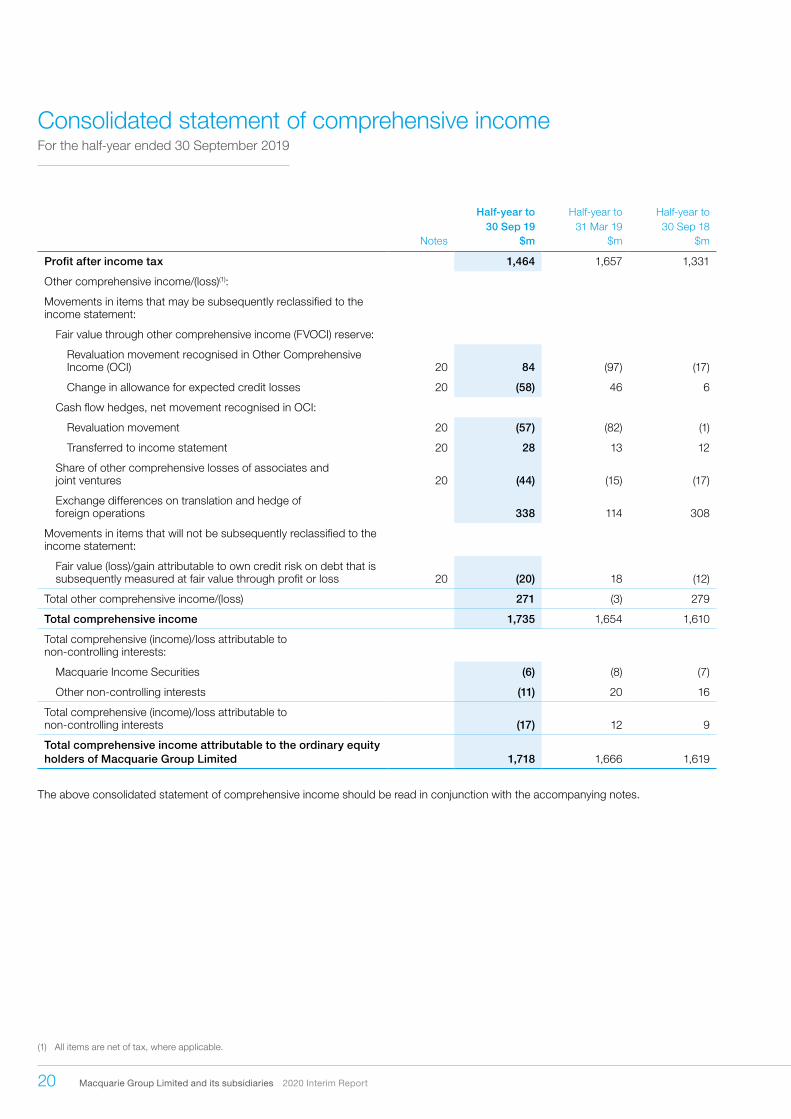
Consolidated statement of comprehensive income For the half-year ended 30 September 2019
Half-year to Half-year to Half-year to 30 Sep 19 31 Mar 19 30 Sep 18
Notes $m $m $m
Profit after income tax 1,464 1,657 1,331
Other comprehensive income/(loss)(1):
Movements in items that may be subsequently reclassified to the income statement:
Fair value through other comprehensive income (FVOCI) reserve:
Revaluation movement recognised in Other Comprehensive Income (OCI) 20 84 (97) (17)
Change in allowance for expected credit losses 20 (58) 46 6
Cash flow hedges, net movement recognised in OCI:
Revaluation movement 20 (57) (82) (1)
Transferred to income statement 20 28 13 12
Share of other comprehensive losses of associates and joint ventures 20 (44) (15) (17)
Exchange differences on translation and hedge of foreign operations 338 114 308
Movements in items that will not be subsequently reclassified to the income statement:
Fair value (loss)/gain attributable to own credit risk on debt that is subsequently measured at fair value through profit or loss 20 (20) 18 (12)
Total other comprehensive income/(loss) 271 (3) 279
Total comprehensive income 1,735 1,654 1,610
Total comprehensive (income)/loss attributable to non-controlling interests:
Macquarie Income Securities (6) (8) (7)
Other non-controlling interests (11) 20 16
Total comprehensive (income)/loss attributable to non-controlling interests (17) 12 9
Total comprehensive income attributable to the ordinary equity holders of Macquarie Group Limited 1,718 1,666 1,619
The above consolidated statement of comprehensive income should be read in conjunction with the accompanying notes.
(1) All items are net of tax, where applicable.
Macquarie Group Limited and its subsidiaries 2020 Interim Report 21
Directors’ Report Financial Report
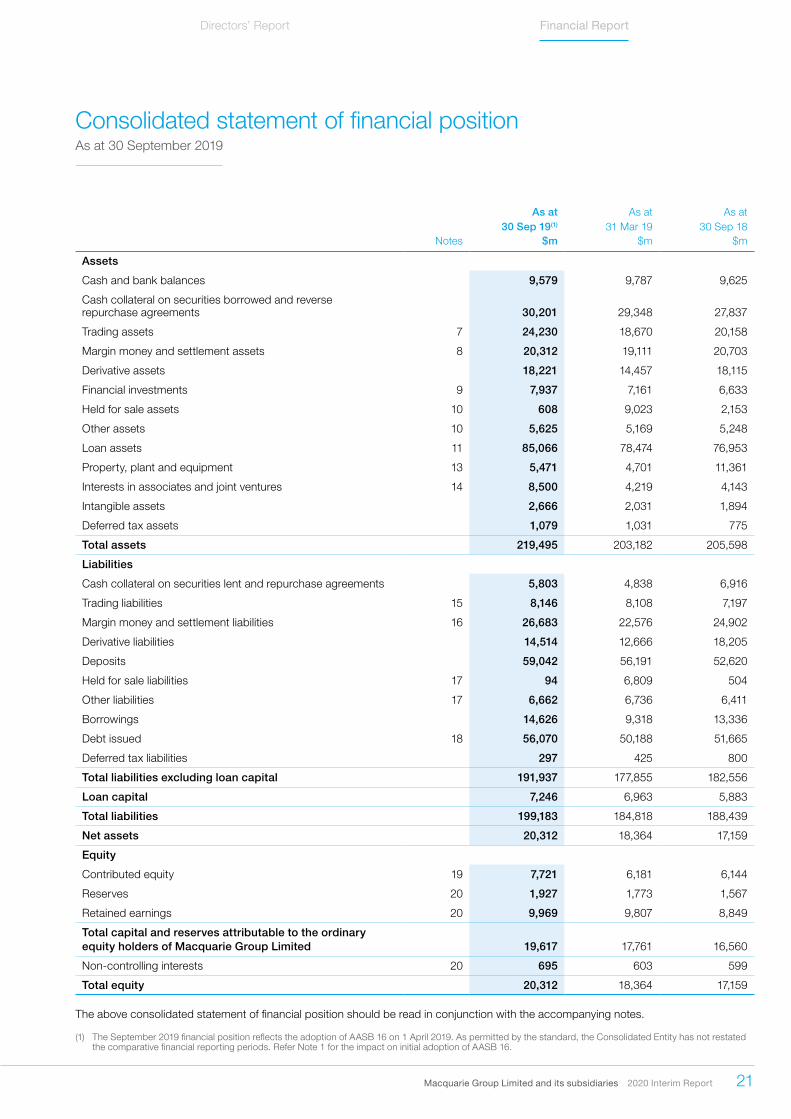
As at As at As at 30 Sep 19(1) 31 Mar 19 30 Sep 18
Notes $m $m $m
Assets
Cash and bank balances 9,579 9,787 9,625
Cash collateral on securities borrowed and reverse repurchase agreements 30,201 29,348 27,837
Trading assets 7 24,230 18,670 20,158
Margin money and settlement assets 8 20,312 19,111 20,703
Derivative assets 18,221 14,457 18,115
Financial investments 9 7,937 7,161 6,633
Held for sale assets 10 608 9,023 2,153
Other assets 10 5,625 5,169 5,248
Loan assets 11 85,066 78,474 76,953
Property, plant and equipment 13 5,471 4,701 11,361
Interests in associates and joint ventures 14 8,500 4,219 4,143
Intangible assets 2,666 2,031 1,894
Deferred tax assets 1,079 1,031 775
Total assets 219,495 203,182 205,598
Liabilities
Cash collateral on securities lent and repurchase agreements 5,803 4,838 6,916
Trading liabilities 15 8,146 8,108 7,197
Margin money and settlement liabilities 16 26,683 22,576 24,902
Derivative liabilities 14,514 12,666 18,205
Deposits 59,042 56,191 52,620
Held for sale liabilities 17 94 6,809 504
Other liabilities 17 6,662 6,736 6,411
Borrowings 14,626 9,318 13,336
Debt issued 18 56,070 50,188 51,665
Deferred tax liabilities 297 425 800
Total liabilities excluding loan capital 191,937 177,855 182,556
Loan capital 7,246 6,963 5,883
Total liabilities 199,183 184,818 188,439
Net assets 20,312 18,364 17,159
Equity
Contributed equity 19 7,721 6,181 6,144
Reserves 20 1,927 1,773 1,567
Retained earnings 20 9,969 9,807 8,849
Total capital and reserves attributable to the ordinary equity holders of Macquarie Group Limited 19,617 17,761 16,560
Non-controlling interests 20 695 603 599
Total equity 20,312 18,364 17,159
The above consolidated statement of financial position should be read in conjunction with the accompanying notes.
(1) The September 2019 financial position reflects the adoption of AASB 16 on 1 April 2019. As permitted by the standard, the Consolidated Entity has not restated the comparative financial reporting periods. Refer Note 1 for the impact on initial adoption of AASB 16.
Consolidated statement of financial positionAs at 30 September 2019
22 Macquarie Group Limited and its subsidiaries 2020 Interim Report
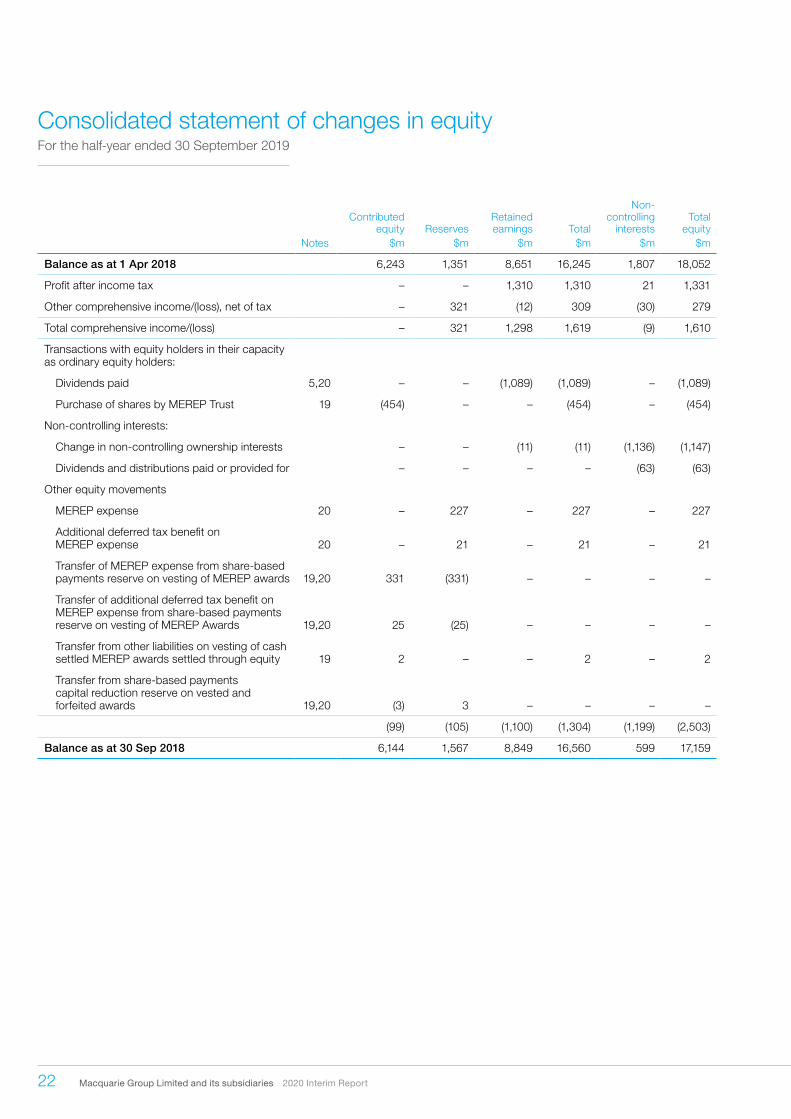
Consolidated statement of changes in equity For the half-year ended 30 September 2019
Contributed equity Reserves
Retained earnings Total
Non- controlling
interestsTotal
equityNotes $m $m $m $m $m $m
Balance as at 1 Apr 2018 6,243 1,351 8,651 16,245 1,807 18,052
Profit after income tax – – 1,310 1,310 21 1,331
Other comprehensive income/(loss), net of tax – 321 (12) 309 (30) 279
Total comprehensive income/(loss) – 321 1,298 1,619 (9) 1,610
Transactions with equity holders in their capacity as ordinary equity holders:
Dividends paid 5,20 – – (1,089) (1,089) – (1,089)
Purchase of shares by MEREP Trust 19 (454) – – (454) – (454)
Non-controlling interests:
Change in non-controlling ownership interests – – (11) (11) (1,136) (1,147)
Dividends and distributions paid or provided for – – – – (63) (63)
Other equity movements
MEREP expense 20 – 227 – 227 – 227
Additional deferred tax benefit on MEREP expense 20 – 21 – 21 – 21
Transfer of MEREP expense from share-based payments reserve on vesting of MEREP awards 19,20 331 (331) – – – –
Transfer of additional deferred tax benefit on MEREP expense from share-based payments reserve on vesting of MEREP Awards 19,20 25 (25) – – – –
Transfer from other liabilities on vesting of cash settled MEREP awards settled through equity 19 2 – – 2 – 2
Transfer from share-based payments capital reduction reserve on vested and forfeited awards 19,20 (3) 3 – – – –
(99) (105) (1,100) (1,304) (1,199) (2,503)
Balance as at 30 Sep 2018 6,144 1,567 8,849 16,560 599 17,159

Macquarie Group Limited and its subsidiaries 2020 Interim Report 23
Directors’ Report Financial Report
Contributed equity Reserves
Retained earnings Total
Non-controlling
interestsTotal
equityNotes $m $m $m $m $m $m
Balance as at 30 Sep 2018 6,144 1,567 8,849 16,560 599 17,159
Profit after income tax – – 1,672 1,672 (15) 1,657
Other comprehensive (loss)/income, net of tax – (24) 18 (6) 3 (3)
Total comprehensive (loss)/income – (24) 1,690 1,666 (12) 1,654
Transactions with equity holders in their capacity as ordinary equity holders:
Dividends paid 5,20 – – (730) (730) – (730)
Non-controlling interests:
Change in non-controlling ownership interests – – (2) (2) 58 56
Dividends and distributions paid or provided for – – – – (42) (42)
Other equity movements:
MEREP expense 20 – 264 – 264 – 264
Additional deferred tax benefit on MEREP expense 20 – 3 – 3 – 3
Transfer of MEREP expense from share-based payments reserve on vesting of MEREP awards 19,20 39 (39) – – – –
Transfer of additional deferred tax benefit on MEREP expense from share-based payments reserve on vesting of MEREP awards 19,20 (2) 2 – – – –
37 230 (732) (465) 16 (449)
Balance as at 31 Mar 2019 6,181 1,773 9,807 17,761 603 18,364
Change on initial application of AASB 16 1 – – (49) (49) – (49)
Restated balance as at 1 Apr 2019 6,181 1,773 9,758 17,712 603 18,315
Profit after income tax – – 1,457 1,457 7 1,464
Other comprehensive income/(loss), net of tax – 281 (20) 261 10 271
Total comprehensive income – 281 1,437 1,718 17 1,735
Transactions with equity holders in their capacity as ordinary equity holders:
Issue of shares 19 1,670 – – 1,670 – 1,670
Dividends paid 5,20 – – (1,224) (1,224) – (1,224)
Purchase of shares by MEREP Trust 19 (607) – – (607) – (607)
Non-controlling interests:
Change in non-controlling ownership interests – – (2) (2) 81 79
Dividends and distributions paid or provided for – – – – (6) (6)
Other equity movements:
MEREP expense 20 – 336 – 336 – 336
Additional deferred tax benefit on MEREP expense 20 – 14 – 14 – 14
Transfer of MEREP expense from share-based payments reserve on vesting of MEREP awards 19,20 448 (448) – – – –
Transfer of additional deferred tax benefit on MEREP expense from share based payments reserve on vesting of MEREP awards 19,20 31 (31) – – – –
Transfer from share-based payments capital reduction reserve on vested and forfeited awards 19,20 (2) 2 – – – –
1,540 (127) (1,226) 187 75 262
Balance as at 30 Sep 2019 7,721 1,927 9,969 19,617 695 20,312
The above consolidated statement of changes in equity should be read in conjunction with the accompanying notes.

24 Macquarie Group Limited and its subsidiaries 2020 Interim Report
Consolidated statement of cash flowsFor the half-year ended 30 September 2019
Half-year to Half-year to Half-year to 30 Sep 19(1) 31 Mar 19 30 Sep 18
Notes $m $m $m
Cash flows generated from/(utilised in) operating activities
Interest and similar income received 2,538 2,672 2,690
Interest and similar expenses paid(1) (1,794) (1,878) (1,669)
Fees and other non-interest income received 2,557 2,659 2,406
Fees and commissions paid (485) (639) (451)
Operating lease income received 973 1,621 1,098
Dividends and distributions received 143 151 158
Employment expenses paid (3,077) (1,663) (2,753)
Operating expenses paid(1) (1,085) (727) (830)
Income tax paid (613) (713) (448)
Changes in operating assets and liabilities:
Net movement in loan assets (6,338) (1,104) (3,101)
Net movement in assets under operating lease (328) (1,111) (557)
Net movement in deposits 2,802 3,499 4,218
Net movement in borrowings 4,924 788 3,887
Net movement in debt issued 4,078 (2,309) (6,076)
Net movement in trading assets and liabilities (1,802) (3,086) 4,162
Net movement in other assets and liabilities(1) (232) 83 (209)
Life business:
Life investment linked contract premiums received, disposal of investment assets and other unitholder contributions 174 715 611
Life investment linked contract payments, acquisition of investment assets and other unitholder redemptions (173) (718) (612)
Net cash flows generated from/(utilised in) operating activities 21 2,262 (1,760) 2,524
Cash flows (utilised in)/generated from investing activities
Net (payments for)/proceeds from financial investments (627) (91) 764
Proceeds from the disposal of or capital return from associates, subsidiaries and businesses, net of cash deconsolidated 679 3,007 1,791
Payments for the acquisition of/capital contribution in associates, subsidiaries and businesses, net of cash acquired (3,418) (1,152) (1,285)
Proceeds from the disposal of property, plant and equipment, and intangible assets 12 – 6
Payments for the acquisition of property, plant and equipment, intangible assets and other assets (584) (65) (574)
Net cash flows (utilised in)/generated from investing activities (3,938) 1,699 702
Cash flows generated from/(utilised in) financing activities
Proceeds from the issue of ordinary shares 1,670 – –
Receipt from/(payments to) non-controlling interests 216 (65) (71)
Proceeds from the issue of loan capital – 887 670
Payments on redemption of loan capital – – (270)
Dividends and distributions paid (1,231) (739) (1,096)
Payments for the acquisition of treasury shares (607) – (454)
Net cash flows generated from/(utilised in) financing activities 48 83 (1,221)
Net (decrease)/increase in cash and cash equivalents (1,628) 22 2,005
Cash and cash equivalents at the beginning of the period 14,128 14,106 12,101
Cash and cash equivalents at the end of the period 21 12,500 14,128 14,106
The above consolidated statement of cash flows should be read in conjunction with the accompanying notes.
(1) The September 2019 financial results reflect the adoption of AASB 16 on 1 April 2019. As permitted by AASB 16, the Consolidated Entity has not restated the comparative financial reporting periods. Refer Note 1 for the impact on initial adoption of AASB 16.
Macquarie Group Limited and its subsidiaries 2020 Interim Report 25
Directors’ Report Financial Report
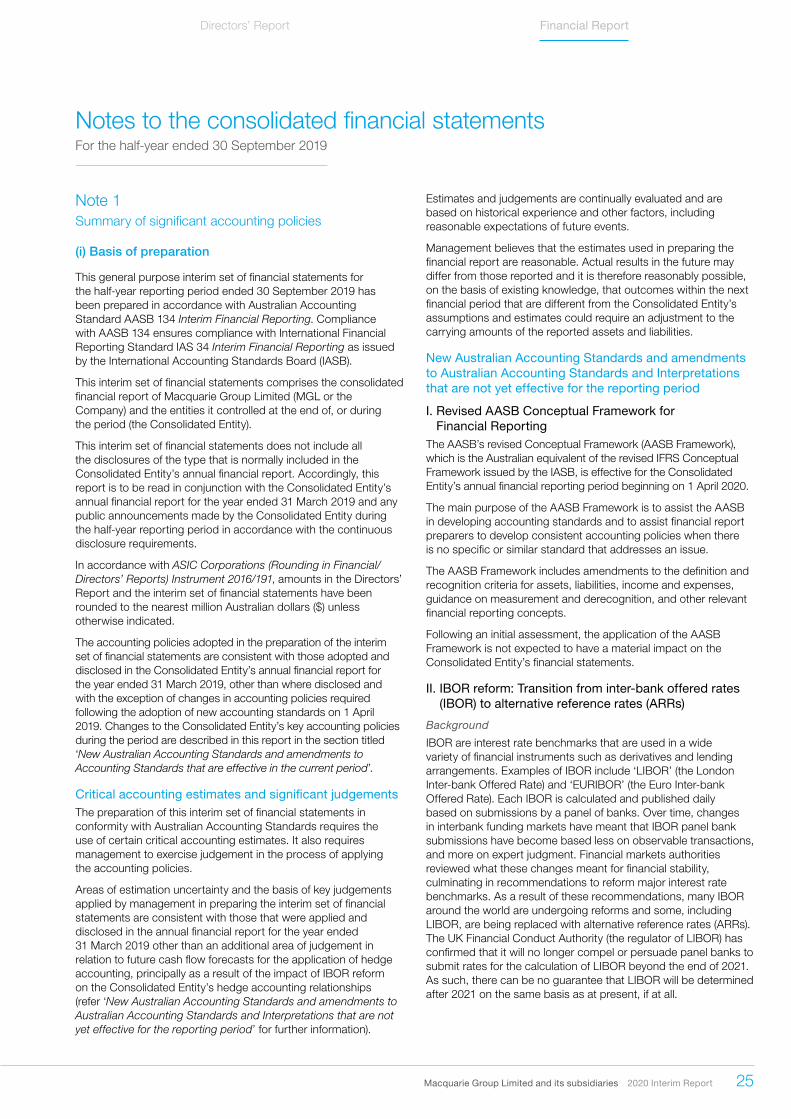
Note 1 Summary of significant accounting policies
(i) Basis of preparation
This general purpose interim set of financial statements for the half-year reporting period ended 30 September 2019 has been prepared in accordance with Australian Accounting Standard AASB 134 Interim Financial Reporting. Compliance with AASB 134 ensures compliance with International Financial Reporting Standard IAS 34 Interim Financial Reporting as issued by the International Accounting Standards Board (IASB).
This interim set of financial statements comprises the consolidated financial report of Macquarie Group Limited (MGL or the Company) and the entities it controlled at the end of, or during the period (the Consolidated Entity).
This interim set of financial statements does not include all the disclosures of the type that is normally included in the Consolidated Entity’s annual financial report. Accordingly, this report is to be read in conjunction with the Consolidated Entity’s annual financial report for the year ended 31 March 2019 and any public announcements made by the Consolidated Entity during the half-year reporting period in accordance with the continuous disclosure requirements.
In accordance with ASIC Corporations (Rounding in Financial/Directors’ Reports) Instrument 2016/191, amounts in the Directors’ Report and the interim set of financial statements have been rounded to the nearest million Australian dollars ($) unless otherwise indicated.
The accounting policies adopted in the preparation of the interim set of financial statements are consistent with those adopted and disclosed in the Consolidated Entity’s annual financial report for the year ended 31 March 2019, other than where disclosed and with the exception of changes in accounting policies required following the adoption of new accounting standards on 1 April 2019. Changes to the Consolidated Entity’s key accounting policies during the period are described in this report in the section titled ‘New Australian Accounting Standards and amendments to Accounting Standards that are effective in the current period’.
Critical accounting estimates and significant judgementsThe preparation of this interim set of financial statements in conformity with Australian Accounting Standards requires the use of certain critical accounting estimates. It also requires management to exercise judgement in the process of applying the accounting policies.
Areas of estimation uncertainty and the basis of key judgements applied by management in preparing the interim set of financial statements are consistent with those that were applied and disclosed in the annual financial report for the year ended 31 March 2019 other than an additional area of judgement in relation to future cash flow forecasts for the application of hedge accounting, principally as a result of the impact of IBOR reform on the Consolidated Entity’s hedge accounting relationships (refer ‘New Australian Accounting Standards and amendments to Australian Accounting Standards and Interpretations that are not yet effective for the reporting period’ for further information).
Estimates and judgements are continually evaluated and are based on historical experience and other factors, including reasonable expectations of future events.
Management believes that the estimates used in preparing the financial report are reasonable. Actual results in the future may differ from those reported and it is therefore reasonably possible, on the basis of existing knowledge, that outcomes within the next financial period that are different from the Consolidated Entity’s assumptions and estimates could require an adjustment to the carrying amounts of the reported assets and liabilities.
New Australian Accounting Standards and amendments to Australian Accounting Standards and Interpretations that are not yet effective for the reporting period
I. Revised AASB Conceptual Framework for Financial Reporting
The AASB’s revised Conceptual Framework (AASB Framework), which is the Australian equivalent of the revised IFRS Conceptual Framework issued by the IASB, is effective for the Consolidated Entity’s annual financial reporting period beginning on 1 April 2020.
The main purpose of the AASB Framework is to assist the AASB in developing accounting standards and to assist financial report preparers to develop consistent accounting policies when there is no specific or similar standard that addresses an issue.
The AASB Framework includes amendments to the definition and recognition criteria for assets, liabilities, income and expenses, guidance on measurement and derecognition, and other relevant financial reporting concepts.
Following an initial assessment, the application of the AASB Framework is not expected to have a material impact on the Consolidated Entity’s financial statements.
II. IBOR reform: Transition from inter-bank offered rates(IBOR) to alternative reference rates (ARRs)
Background
IBOR are interest rate benchmarks that are used in a wide variety of financial instruments such as derivatives and lending arrangements. Examples of IBOR include ‘LIBOR’ (the London Inter-bank Offered Rate) and ‘EURIBOR’ (the Euro Inter-bank Offered Rate). Each IBOR is calculated and published daily based on submissions by a panel of banks. Over time, changes in interbank funding markets have meant that IBOR panel bank submissions have become based less on observable transactions, and more on expert judgment. Financial markets authorities reviewed what these changes meant for financial stability, culminating in recommendations to reform major interest rate benchmarks. As a result of these recommendations, many IBOR around the world are undergoing reforms and some, including LIBOR, are being replaced with alternative reference rates (ARRs). The UK Financial Conduct Authority (the regulator of LIBOR) has confirmed that it will no longer compel or persuade panel banks to submit rates for the calculation of LIBOR beyond the end of 2021. As such, there can be no guarantee that LIBOR will be determined after 2021 on the same basis as at present, if at all.
Notes to the consolidated financial statementsFor the half-year ended 30 September 2019

26 Macquarie Group Limited and its subsidiaries 2020 Interim Report
Notes to the consolidated financial statementsFor the half-year ended 30 September 2019 continued
Note 1Summary of significant accounting policies continued
(i) Basis of preparation continued
As a diversified financial services group with a variety of global products and services, IBOR reforms, including the transition from LIBOR to ARRs are important changes for the Consolidated Entity.
The Consolidated Entity’s IBOR project
During 2018, the Consolidated Entity initiated a project, which is sponsored by its Chief Financial Officer (CFO), to manage the impacts of IBOR reform, including overseeing the transition from LIBOR to ARRs. A group-wide steering committee was established with its key responsibility being the governance of the project. This committee includes senior executives from the Consolidated Entity’s Operating Groups, Financial Management Group (FMG), Risk Management Group (RMG), Corporate Operations Group (COG) and Legal and Governance team.
The Consolidated Entity is conducting a detailed analysis of its use of LIBOR across existing and new legal agreements, systems, models and processes. The project’s scope includes assessing the impact on clients and the continued monitoring of market developments with respect to the transition from LIBOR to ARRs, including any changes to accounting standards and other regulator activity. The project’s scope also includes identification of the impact of the reform on separate legal entities within the Consolidated Entity, including those entities that are subject to separate regulatory requirements and oversight.
Impact on hedge accounting
Management continues to exercise its judgement to determine that certain hedge relationships continue to qualify for hedge accounting despite the uncertainty arising from IBOR reform. Impacted hedge relationships include those that hedge the variability of cash flows (cash flow hedges) and fixed interest rate risk (fair value hedges) due to changes in USD LIBOR and GBP LIBOR, being the most significant interest rate benchmarks to which the Consolidated Entity’s hedging relationships are exposed. These judgements are supported by the recent publication of AASB 2019–3 Amendments to Australian Accounting Standards Interest Rate Benchmark Reform. The amendments provide certain temporary relief enabling the continuation of hedge accounting during the period of uncertainty prior to IBOR transition. Whilst the amendments are mandatorily effective for annual reporting period beginning on or after 1 January 2020, the Consolidated Entity will consider early adoption of the requirements.
Other impacts on financial reporting
The IASB has also commenced its project to address the accounting issues that will arise following transition to ARRs. These issues include providing guidance on the accounting for the contractual amendments necessary to facilitate the transition, further guidance on hedge accounting relating to post-transition issues, as well as additional quantitative and qualitative disclosure requirements. This guidance is expected to be published during 2020. The Consolidated Entity will continue to monitor these developments to determine the impact thereof on its project and its financial reports.
New Australian Accounting Standards and amendments to Australian Accounting Standards that are effective in the current period
I. AASB 16 LeasesAASB 16 replaced AASB 117 Leases (AASB 117) for the Consolidated Entity’s financial year commencing on 1 April 2019. Subject to certain exceptions, contracts that are leases within the scope of AASB 16 from the lessee’s perspective require the recognition of a right-of-use (ROU) asset and a related lease liability. The classification of leases where the Consolidated Entity is a lessor remains unchanged under AASB 16.
(1) Transition
The Consolidated Entity has applied AASB 16 from 1 April 2019 using the modified retrospective approach and therefore the comparative information has not been restated and continues to be reported under AASB 117 and Interpretation 4 Determining whether an arrangement contains a lease. The resultant reclassifications and adjustments arising upon transition to the new standard have been recognised in the opening balance sheet on 1 April 2019.
For leases of office space, a transition adjustment was recognised as an adjustment to the Consolidated Entity’s retained earnings at 1 April 2019 for leases where the Consolidated Entity measured the ROU asset as if AASB 16 had always been applied. For other leases, the ROU asset was measured based on the lease liability as at the transition date.
At transition, the Consolidated Entity recognised lease liabilities of $949 million as a part of other liabilities and ROU assets of $737 million as a part of property, plant and equipment. After adjusting related amounts previously recorded on the balance sheet, this resulted in a reduction to retained earnings of $49 million (post tax). As permitted by AASB 16 the transition adjustment has been determined by the Consolidated Entity by electing practical expedients to not recognise short-term or low value leases on its statement of financial position at the transition date. Judgement has been applied by the Consolidated Entity in determining the transition adjustment which includes the determination of which contractual arrangements represent a lease, the period over which the lease exists, the incremental borrowing rate of the lessee entities within the Macquarie Group, and the variability of future cash flows.

Macquarie Group Limited and its subsidiaries 2020 Interim Report 27
Directors’ Report Financial Report
Note 1Summary of significant accounting policies continued
(i) Basis of preparation continued
The table below presents a reconciliation of the operating lease commitments as disclosed in the Consolidated Entity’s 31 March 2019 financial statements, to the lease liabilities recognised on the transition date:
CONSOLIDATED 2019
Particulars $m
Operating lease commitments disclosed as at 31 March 2019 1,118
Add: Technology assets not recognised as a lease under previous Accounting Standard (AASB 117) 16
(Less): Lease executed but not yet effective on transition date (94)
(Less): Impact of discounting the future lease cash flows at the incremental borrowing rate of each lessee (weighted average rate of 3.13%) (91)
Lease liability recognised as at 1 April 2019 949
(2) Amendment to accounting policy following the adoption of AASB 16 on 1 April 2019
At the inception of a contract, the Consolidated Entity assesses whether a contract is, or contains, a lease.
At inception, or on reassessment of a contract that contains a lease component, the Consolidated Entity will allocate the consideration in the contract to each lease component unless an election is made to account for the lease and non-lease components as a single lease component.
a. Accounting where the Consolidated Entity is the lessee
The Consolidated entity leases corporate buildings, commodity storage facilities, technology and other equipment for which contracts are typically entered into for fixed periods and may include extension options. Leases are recognised as a ROU asset and a corresponding liability at the commencement date, being the date the leased asset is available for use by the Consolidated Entity.
Lease liability
Lease liabilities are measured at amortised cost using the effective interest method. Interest expense is recognised as part of ‘interest and similar expense’ in the income statement over the lease period on the remaining lease liability balance for each period. Lease liabilities are remeasured when there is a change in future lease payments arising from a change in an index or rate, changes in the estimated amount payable under a residual value guarantee, or changes in cash flows associated with purchase, extension or termination options.
When the lease liability is remeasured, a corresponding adjustment is made to the carrying value of the ROU asset, or, in the income statement, where the carrying value of the ROU asset has been fully written down.
Right-of-use asset
ROU assets are measured at cost and comprise of the amount that corresponds to the amount recognised for the lease liability on initial recognition together with any lease payments made at or before the commencement date (less any lease incentives received), initial direct costs and restoration-related costs. The ROU asset is depreciated over the lease term on a straight-line basis. The depreciation charge relating to corporate building leases is presented as part of ‘occupancy expenses’ while depreciation relating to leases entered into by trading-related business is presented as part of net trading income in the income statement. The Consolidated Entity does not recognise a ROU asset for short-term or low value leases, instead the expense is recognised on a straight-line basis over the lease term as part of ‘operating expenses’ in the income statement.
Presentation
The Consolidated Entity presents ROU assets in ‘property, plant and equipment’ (refer Note 13) and lease liabilities in ‘other liabilities’ (refer Note 17) in the statement of financial position.
b. Accounting where the Consolidated Entity is a lessor
The accounting policies where the Consolidated Entity is a lessor are consistent with those that were applied and disclosed in the annual financial report for the year ended 31 March 2019.
When the Consolidated Entity is an intermediate lessor, it accounts for its interests in the head lease and the sub-lease separately. The lease classification of the sublease is determined with reference to the ROU asset arising from the head lease.
II. AASB Interpretation 23 (Interpretation 23) Uncertaintyover Income Tax Treatment
Interpretation 23 clarified the application of the recognition and measurement criteria in AASB 112 Income Taxes (AASB 112) where there is uncertainty over income tax treatments and requires an assessment of each uncertain tax position as to whether it is probable that a taxation authority will accept the position. Where it is not probable, the effect of the uncertainty is reflected in determining the relevant taxable profit or loss, tax bases, unused tax losses and unused tax credits or tax rates. The amount is determined as either the single most likely amount or the sum of the probability weighted amounts in a range of possible outcomes, whichever better predicts the resolution of the uncertainty. Judgements are reassessed as and when new facts and circumstances are presented.
28 Macquarie Group Limited and its subsidiaries 2020 Interim Report
Notes to the consolidated financial statementsFor the half-year ended 30 September 2019 continued
Note 1Summary of significant accounting policies continued
(i) Basis of preparation continued
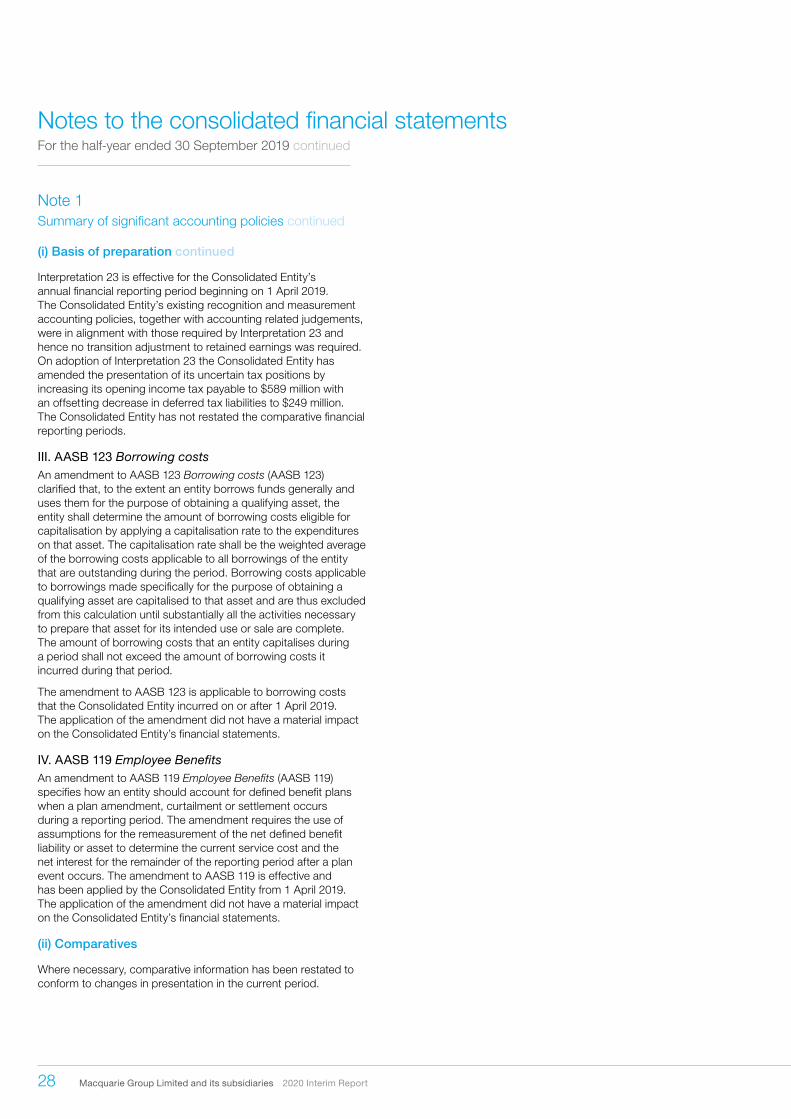
Interpretation 23 is effective for the Consolidated Entity’s annual financial reporting period beginning on 1 April 2019. The Consolidated Entity’s existing recognition and measurement accounting policies, together with accounting related judgements, were in alignment with those required by Interpretation 23 and hence no transition adjustment to retained earnings was required. On adoption of Interpretation 23 the Consolidated Entity has amended the presentation of its uncertain tax positions by increasing its opening income tax payable to $589 million with an offsetting decrease in deferred tax liabilities to $249 million. The Consolidated Entity has not restated the comparative financial reporting periods.
III. AASB 123 Borrowing costsAn amendment to AASB 123 Borrowing costs (AASB 123) clarified that, to the extent an entity borrows funds generally and uses them for the purpose of obtaining a qualifying asset, the entity shall determine the amount of borrowing costs eligible for capitalisation by applying a capitalisation rate to the expenditures on that asset. The capitalisation rate shall be the weighted average of the borrowing costs applicable to all borrowings of the entity that are outstanding during the period. Borrowing costs applicable to borrowings made specifically for the purpose of obtaining a qualifying asset are capitalised to that asset and are thus excluded from this calculation until substantially all the activities necessary to prepare that asset for its intended use or sale are complete. The amount of borrowing costs that an entity capitalises during a period shall not exceed the amount of borrowing costs it incurred during that period.
The amendment to AASB 123 is applicable to borrowing costs that the Consolidated Entity incurred on or after 1 April 2019. The application of the amendment did not have a material impact on the Consolidated Entity’s financial statements.
IV. AASB 119 Employee BenefitsAn amendment to AASB 119 Employee Benefits (AASB 119) specifies how an entity should account for defined benefit plans when a plan amendment, curtailment or settlement occurs during a reporting period. The amendment requires the use of assumptions for the remeasurement of the net defined benefit liability or asset to determine the current service cost and the net interest for the remainder of the reporting period after a plan event occurs. The amendment to AASB 119 is effective and has been applied by the Consolidated Entity from 1 April 2019. The application of the amendment did not have a material impact on the Consolidated Entity’s financial statements.
(ii) Comparatives
Where necessary, comparative information has been restated to conform to changes in presentation in the current period.
Macquarie Group Limited and its subsidiaries 2020 Interim Report 29
Directors’ Report Financial Report
Half-year to Half-year to Half-year to30 Sep 19 31 Mar 19 30 Sep 18
$m $m $m
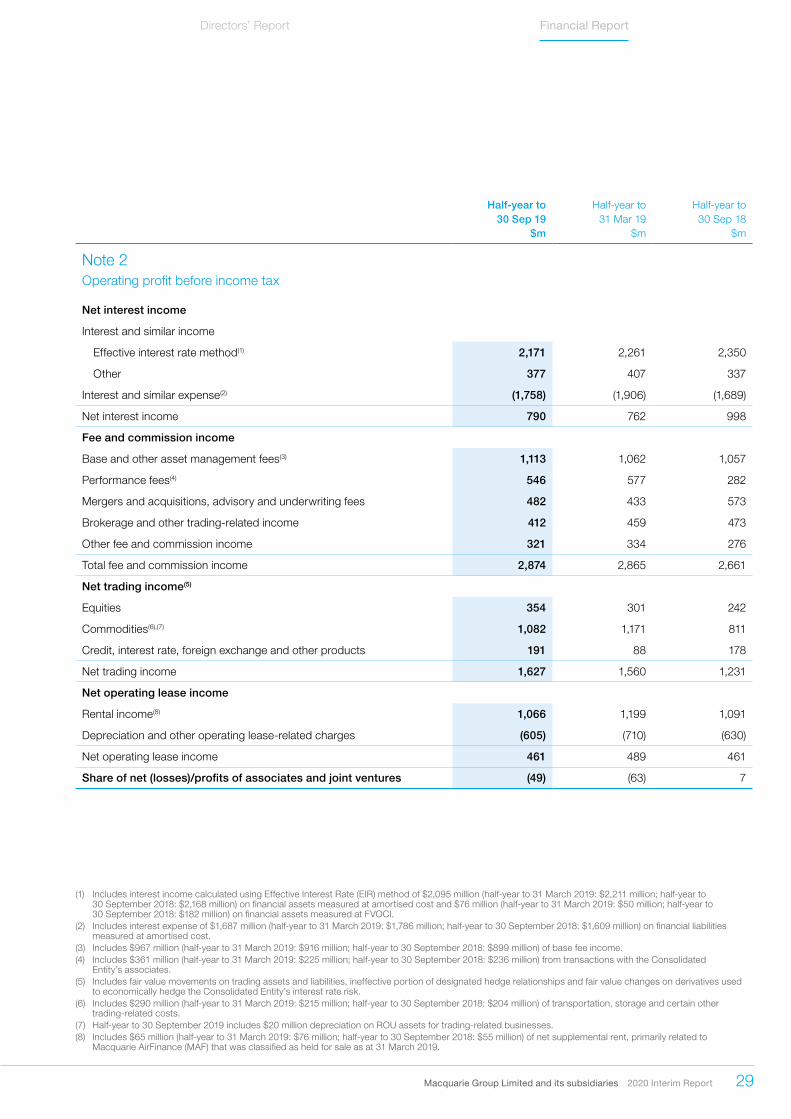
Note 2 Operating profit before income tax
Net interest income
Interest and similar income
Effective interest rate method(1) 2,171 2,261 2,350
Other 377 407 337
Interest and similar expense(2) (1,758) (1,906) (1,689)
Net interest income 790 762 998
Fee and commission income
Base and other asset management fees(3) 1,113 1,062 1,057
Performance fees(4) 546 577 282
Mergers and acquisitions, advisory and underwriting fees 482 433 573
Brokerage and other trading-related income 412 459 473
Other fee and commission income 321 334 276
Total fee and commission income 2,874 2,865 2,661
Net trading income(5)
Equities 354 301 242
Commodities(6),(7) 1,082 1,171 811
Credit, interest rate, foreign exchange and other products 191 88 178
Net trading income 1,627 1,560 1,231
Net operating lease income
Rental income(8) 1,066 1,199 1,091
Depreciation and other operating lease-related charges (605) (710) (630)
Net operating lease income 461 489 461
Share of net (losses)/profits of associates and joint ventures (49) (63) 7
(1) Includes interest income calculated using Effective Interest Rate (EIR) method of $2,095 million (half-year to 31 March 2019: $2,211 million; half-year to 30 September 2018: $2,168 million) on financial assets measured at amortised cost and $76 million (half-year to 31 March 2019: $50 million; half-year to 30 September 2018: $182 million) on financial assets measured at FVOCI.
(2) Includes interest expense of $1,687 million (half-year to 31 March 2019: $1,786 million; half-year to 30 September 2018: $1,609 million) on financial liabilities measured at amortised cost.
(3) Includes $967 million (half-year to 31 March 2019: $916 million; half-year to 30 September 2018: $899 million) of base fee income.(4) Includes $361 million (half-year to 31 March 2019: $225 million; half-year to 30 September 2018: $236 million) from transactions with the Consolidated
Entity’s associates.(5) Includes fair value movements on trading assets and liabilities, ineffective portion of designated hedge relationships and fair value changes on derivatives used
to economically hedge the Consolidated Entity’s interest rate risk.(6) Includes $290 million (half-year to 31 March 2019: $215 million; half-year to 30 September 2018: $204 million) of transportation, storage and certain other
trading-related costs.(7) Half-year to 30 September 2019 includes $20 million depreciation on ROU assets for trading-related businesses.(8) Includes $65 million (half-year to 31 March 2019: $76 million; half-year to 30 September 2018: $55 million) of net supplemental rent, primarily related to
Macquarie AirFinance (MAF) that was classified as held for sale as at 31 March 2019.

30 Macquarie Group Limited and its subsidiaries 2020 Interim Report
Notes to the consolidated financial statementsFor the half-year ended 30 September 2019 continued
Half-year to Half-year to Half-year to30 Sep 19 31 Mar 19 30 Sep 18
$m $m $m
Note 2Operating profit before income tax continued
Credit and other impairment (charges)/reversal
Credit impairment (charges)/reversal
Loan assets (126) (127) (46)
Loans to associates and joint ventures (6) (81) (8)
Other assets (16) (36) (3)
Financial investments (2) (30) (5)
Undrawn credit commitments and financial guarantees (8) (6) 8
Recovery of loans previously written off 14 4 10
Total credit impairment charges (144) (276) (44)
Other impairment reversal/(charges)
Interests in associates and joint ventures 7 (177) (30)
Intangible assets and other non-financial assets (2) (23) (2)
Total other impairment reversal/(charges) 5 (200) (32)
Total credit and other impairment charges (139) (476) (76)
Other operating income and charges
Investment income
Net gain on equity investments 91 13 148
Net gain on debt investments 7 4 13
Net gain on interests in associates and joint ventures 248 971 126
Net gain on disposal of businesses and subsidiaries held for sale 211 601 23
Net gain on change of control, joint control and/or significant influence and reclassifications to/from held for sale 113 28 175
Total investment income 670 1,617 485
Other income and charges(1),(2) 86 170 63
Total other operating income and charges 756 1,787 548
Net operating income 6,320 6,924 5,830
(1) Includes $9 million (half-year to 31 March 2019: $9 million; half-year to 30 September 2018: $22 million) of loss on derecognition of loans at amortised cost and $7 million (half-year to 31 March 2019: $9 million; half-year to 30 September 2018: $25 million) of fair value losses on loans measured at FVTPL.
(2) Includes $164 million (half-year to 31 March 2019: $84 million; half-year to 30 September 2018: $52 million) of income and $216 million (half-year to 31 March 2019: $86 million; half-year to 30 September 2018: $72 million) of expenses relating to subsidiaries that do not form part of the Consolidated Entity’s integrated business operations.
Macquarie Group Limited and its subsidiaries 2020 Interim Report 31
Directors’ Report Financial Report
Half-year to Half-year to Half-year to30 Sep 19 31 Mar 19 30 Sep 18
$m $m $m
Note 2Operating profit before income tax continued
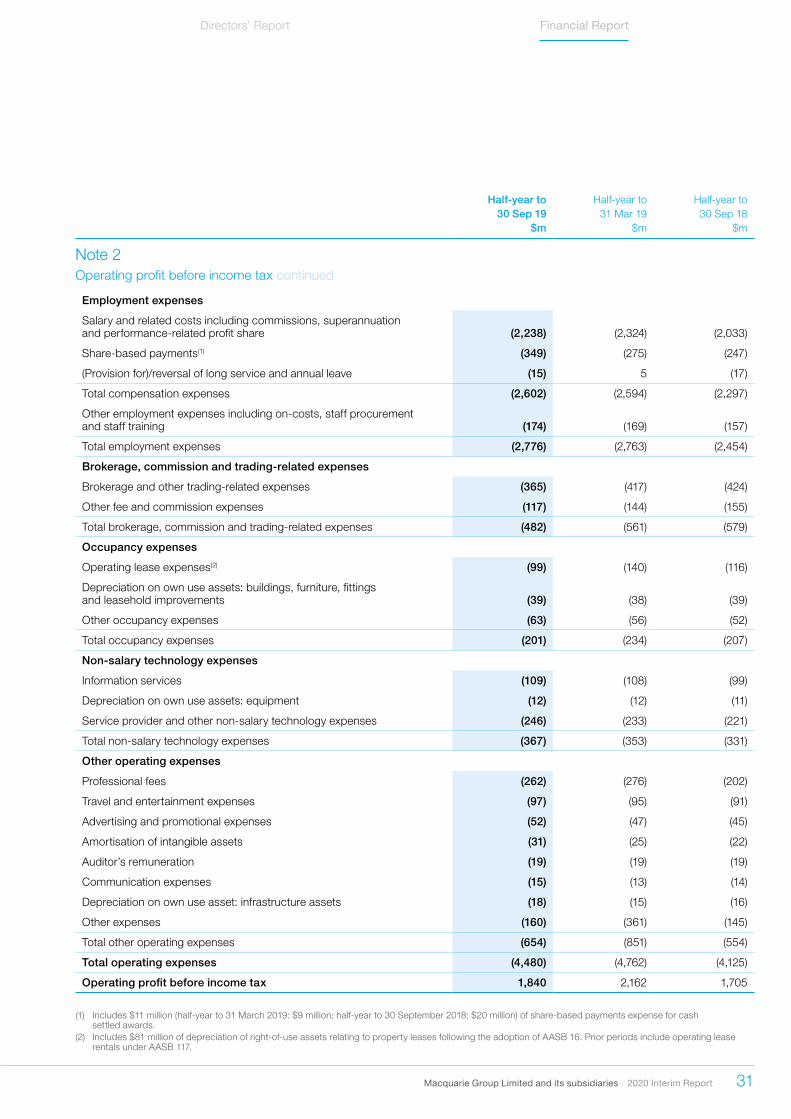
Employment expenses
Salary and related costs including commissions, superannuation and performance-related profit share (2,238) (2,324) (2,033)
Share-based payments(1) (349) (275) (247)
(Provision for)/reversal of long service and annual leave (15) 5 (17)
Total compensation expenses (2,602) (2,594) (2,297)
Other employment expenses including on-costs, staff procurement and staff training (174) (169) (157)
Total employment expenses (2,776) (2,763) (2,454)
Brokerage, commission and trading-related expenses
Brokerage and other trading-related expenses (365) (417) (424)
Other fee and commission expenses (117) (144) (155)
Total brokerage, commission and trading-related expenses (482) (561) (579)
Occupancy expenses
Operating lease expenses(2) (99) (140) (116)
Depreciation on own use assets: buildings, furniture, fittings and leasehold improvements (39) (38) (39)
Other occupancy expenses (63) (56) (52)
Total occupancy expenses (201) (234) (207)
Non-salary technology expenses
Information services (109) (108) (99)
Depreciation on own use assets: equipment (12) (12) (11)
Service provider and other non-salary technology expenses (246) (233) (221)
Total non-salary technology expenses (367) (353) (331)
Other operating expenses
Professional fees (262) (276) (202)
Travel and entertainment expenses (97) (95) (91)
Advertising and promotional expenses (52) (47) (45)
Amortisation of intangible assets (31) (25) (22)
Auditor’s remuneration (19) (19) (19)
Communication expenses (15) (13) (14)
Depreciation on own use asset: infrastructure assets (18) (15) (16)
Other expenses (160) (361) (145)
Total other operating expenses (654) (851) (554)
Total operating expenses (4,480) (4,762) (4,125)
Operating profit before income tax 1,840 2,162 1,705
(1) Includes $11 million (half-year to 31 March 2019: $9 million; half-year to 30 September 2018: $20 million) of share-based payments expense for cash settled awards.
(2) Includes $81 million of depreciation of right-of-use assets relating to property leases following the adoption of AASB 16. Prior periods include operating lease rentals under AASB 117.

32 Macquarie Group Limited and its subsidiaries 2020 Interim Report
Notes to the consolidated financial statementsFor the half-year ended 30 September 2019 continued
Note 3 Segment reporting
(i) Operating Segments
AASB 8 Operating Segments requires the ‘management approach’ to disclosing information about the Consolidated Entity’s reportable segments. The financial information is reported on the same basis as used internally by senior management for evaluating Operating Segment performance and for deciding how to allocate resources to Operating Segments. Such information may be produced using different measures to that used in preparing the statutory income statement.
For internal reporting, performance measurement and risk management purposes, the Consolidated Entity is divided into Operating Groups and a Corporate segment.
During the half-year ended March 2019, certain businesses were reorganised between Operating Groups including: – Macquarie’s Australian vehicle finance business moved from
CAF into BFS – Macquarie Capital’s global real estate business moved into
MAM and merged with MIRA Real Estate.
During the current period, CAF businesses have been aligned to other Operating Groups where they have the greatest opportunities in terms of shared clients and complementary offerings as follows: – CAF Principal Finance joined Macquarie Capital, to bring
together all principal investing activity and enhance our ability to invest directly and alongside clients and partners
– CAF Transportation Finance joined MAM, reflecting its evolution towards a fiduciary business following the sale of Macquarie AirFinance to a newly formed joint venture
– CAF Asset Finance moved to CGM, reflecting a longstanding, shared focus on innovative financing solutions for corporates, some of which are already shared clients
– In addition, certain fiduciary businesses, such as the infrastructure debt business (MIDIS), moved from CAF Asset Finance in the Bank Group to MAM in the Non-Bank Group.
Comparatives have been reclassified to reflect this reorganisation between the Operating Groups. The financial information disclosed relates to the Consolidated Entity’s ordinary activities.
These segments have been set up based on the different core products and services offered. Following the reorganisation described above, the Operating Groups comprise:
– MAM provides investment solutions to clients across a range of capabilities, including infrastructure, renewables, real estate, agriculture, transportation finance, equities, fixed income, private credit and multi-asset solutions
– BFS provides a diverse range of personal banking, wealth management, business banking and vehicle finance products and services to retail clients, advisers, brokers and business clients
– CGM provides integrated, end-to-end offering across global markets including equities, fixed income, foreign exchange, commodities and technology, media and telecoms as well as providing clients with risk and capital solutions across physical and financial markets. CGM also delivers a diverse range of tailored finance solutions globally across a variety of industries and asset classes
– Macquarie Capital has global capability in advisory, capital raising services, providing clients with specialist expertise, advice and flexible capital solutions across a range of sectors and investing alongside partners and clients, across the capital structure. It also has global capability in infrastructure, green and conventional energy, focusing on utilising its balance sheet to construct assets, build businesses and create platforms across development, construction and operational phases.
The Corporate segment, which is not considered an Operating Group, comprises head office and central service groups, including Group Treasury. As applicable, the Corporate segment holds certain legacy investments, assets and businesses that are no longer core for strategic reasons and are not allocated to any of the Operating Groups.
Items of income and expense within the Corporate segment include the net result of managing Macquarie’s liquidity and funding requirements, earnings on capital and the residual accounting volatility relating to economically hedged positions where hedge accounting is applied as well as accounting volatility for other economically hedged positions where hedge accounting is not applicable. Other items of income and expenses include earnings from investments, central credit and asset related impairments, unallocated head office costs and costs of central service groups, the Consolidated Entity’s performance-related profit share and share-based payments expense, income tax expense and certain distributions attributable to certain non-controlling interests and holders of Macquarie Income Securities (MIS).
Below is a selection of key policies applied in determining Operating Segment results.
Internal funding arrangementsGroup Treasury has the responsibility for managing funding for the Consolidated Entity, and Operating Groups obtain their funding from Group Treasury. The interest rates charged by Group Treasury are determined by the currency and term of the funding. Break costs are charged to Operating Groups for the early repayment of term funding.
Generally, Operating Groups may only source funding directly from external sources where the funding is secured by the Operating Group’s assets. In such cases the Operating Group bears the funding costs directly and Group Treasury may levy additional charges where appropriate.
Deposits are a funding source for the Consolidated Entity. BFS receives a deposit premium from Group Treasury on deposits that it generates. This deposit premium is included within Net interest and trading income for segment reporting purposes.

Macquarie Group Limited and its subsidiaries 2020 Interim Report 33
Directors’ Report Financial Report
Note 3Segment reporting continued
(i) Operating Segments continued
Transactions between Operating SegmentsOperating Segments that enter into arrangements with other Operating Segments must do so on commercial terms or as agreed by the Consolidated Entity’s Chief Executive Officer or Chief Financial Officer. There is a requirement for accounting symmetry in such transactions.
Internal transactions are recognised in each of the relevant categories of income and expense and eliminated on consolidation as appropriate.
Accounting for derivatives that hedge interest rate riskFor businesses that predominantly earn income from lending activities, derivatives that hedge interest rate risk are required to be measured at fair value. The changes in fair value (volatility) is recognised in net trading income unless hedge accounting is applied by the Consolidated Entity, where either the hedged item is revalued for changes in fair value that is attributable to the hedged risk to remove the volatility, or the fair value volatility on the derivative is deferred until the hedged transaction is recognised in the income statement. For segment reporting, derivatives are accounted for on an accrual basis in the results of the applicable Operating Groups, with changes in fair value recognised within the Corporate segment and managed via the application of hedge accounting.
Central service groupsThe central service groups provide a range of functions supporting Macquarie’s Operating Groups, ensuring they have the appropriate workplace support and systems to operate effectively and the necessary resources to meet their regulatory, compliance, financial reporting, legal and risk management requirements.
Central service groups recover their costs from Operating Groups generally on either a time and effort allocation basis or a fee for service basis. Central service groups include the Corporate Operations Group (COG), Financial Management Group (FMG), Risk Management Group (RMG), Legal and Governance and Central Executive.
Performance-related profit share and share-based payments expensePerformance-related profit share and share-based payments expense relating to the Macquarie Group Employee Retained Equity Plan (MEREP) are recognised in the Corporate segment and not allocated to the Operating Groups.
Income taxIncome tax expense and benefits are recognised in the Corporate segment and not allocated to the Operating Groups. However, to recognise an Operating Group’s contribution to permanent income tax differences, an internal management revenue/charge is used. These internal management revenue/charges are offset by an equal and opposite amount recognised in the Corporate segment such that they are eliminated on consolidation.
Presentation of segment income statementsThe income statements on the following pages for each of the reported segments are in some cases summarised by grouping non-material balances together. Where appropriate, all material or key balances have been reported separately to provide users with information relevant to the understanding of the Consolidated Entity’s financial performance. The financial information disclosed relates to the Consolidated Entity’s ordinary activities.
34 Macquarie Group Limited and its subsidiaries 2020 Interim Report
Notes to the consolidated financial statementsFor the half-year ended 30 September 2019 continued
Macquarie Asset Management
Banking and Financial Services
Commodities andGlobal Markets
MacquarieCapital Corporate Total
$m $m $m $m $m $m
Note 3Segment reporting continued
(i) Operating Segments continued
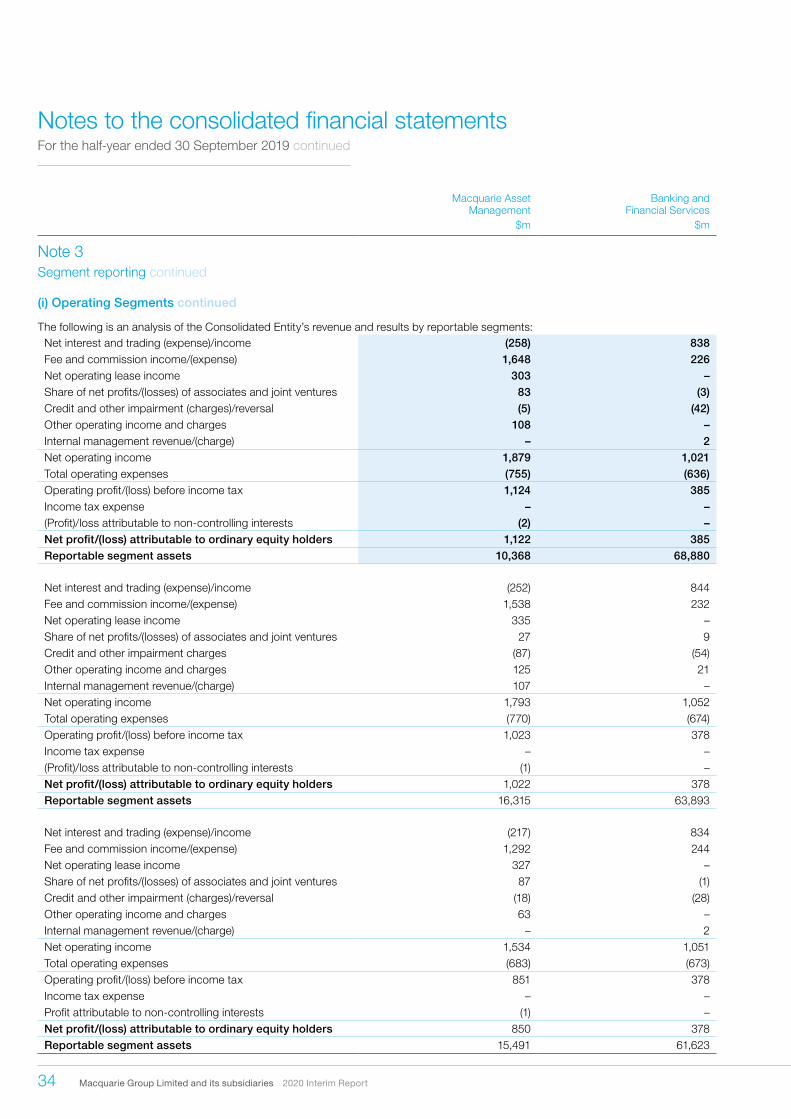
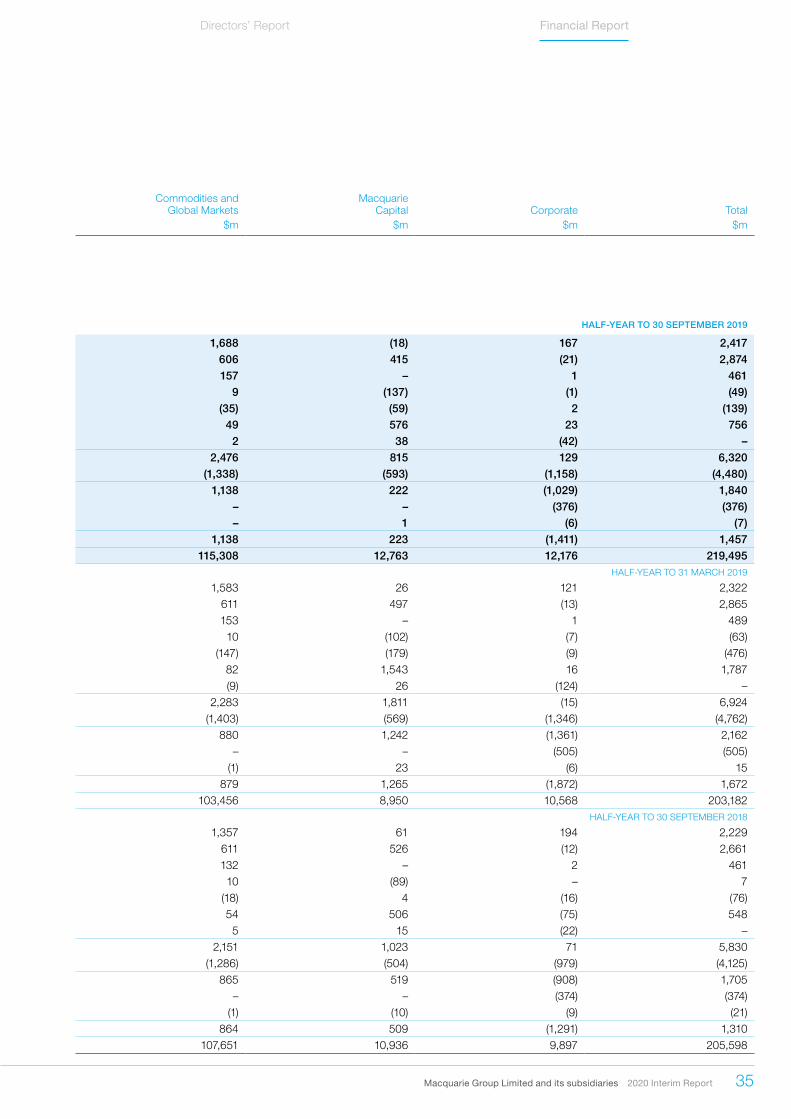
The following is an analysis of the Consolidated Entity’s revenue and results by reportable segments: HALF-YEAR TO 30 SEPTEMBER 2019
Net interest and trading (expense)/income (258) 838 1,688 (18) 167 2,417Fee and commission income/(expense) 1,648 226 606 415 (21) 2,874Net operating lease income 303 – 157 – 1 461Share of net profits/(losses) of associates and joint ventures 83 (3) 9 (137) (1) (49)Credit and other impairment (charges)/reversal (5) (42) (35) (59) 2 (139)Other operating income and charges 108 – 49 576 23 756Internal management revenue/(charge) – 2 2 38 (42) –Net operating income 1,879 1,021 2,476 815 129 6,320Total operating expenses (755) (636) (1,338) (593) (1,158) (4,480)Operating profit/(loss) before income tax 1,124 385 1,138 222 (1,029) 1,840Income tax expense – – – – (376) (376)(Profit)/loss attributable to non-controlling interests (2) – – 1 (6) (7)Net profit/(loss) attributable to ordinary equity holders 1,122 385 1,138 223 (1,411) 1,457Reportable segment assets 10,368 68,880 115,308 12,763 12,176 219,495
HALF-YEAR TO 31 MARCH 2019
Net interest and trading (expense)/income (252) 844 1,583 26 121 2,322Fee and commission income/(expense) 1,538 232 611 497 (13) 2,865Net operating lease income 335 – 153 – 1 489Share of net profits/(losses) of associates and joint ventures 27 9 10 (102) (7) (63)Credit and other impairment charges (87) (54) (147) (179) (9) (476)Other operating income and charges 125 21 82 1,543 16 1,787Internal management revenue/(charge) 107 – (9) 26 (124) –Net operating income 1,793 1,052 2,283 1,811 (15) 6,924Total operating expenses (770) (674) (1,403) (569) (1,346) (4,762)Operating profit/(loss) before income tax 1,023 378 880 1,242 (1,361) 2,162Income tax expense – – – – (505) (505)(Profit)/loss attributable to non-controlling interests (1) – (1) 23 (6) 15Net profit/(loss) attributable to ordinary equity holders 1,022 378 879 1,265 (1,872) 1,672Reportable segment assets 16,315 63,893 103,456 8,950 10,568 203,182
HALF-YEAR TO 30 SEPTEMBER 2018
Net interest and trading (expense)/income (217) 834 1,357 61 194 2,229Fee and commission income/(expense) 1,292 244 611 526 (12) 2,661Net operating lease income 327 – 132 – 2 461Share of net profits/(losses) of associates and joint ventures 87 (1) 10 (89) – 7Credit and other impairment (charges)/reversal (18) (28) (18) 4 (16) (76)Other operating income and charges 63 – 54 506 (75) 548Internal management revenue/(charge) – 2 5 15 (22) –Net operating income 1,534 1,051 2,151 1,023 71 5,830Total operating expenses (683) (673) (1,286) (504) (979) (4,125)Operating profit/(loss) before income tax 851 378 865 519 (908) 1,705Income tax expense – – – – (374) (374)Profit attributable to non-controlling interests (1) – (1) (10) (9) (21)Net profit/(loss) attributable to ordinary equity holders 850 378 864 509 (1,291) 1,310Reportable segment assets 15,491 61,623 107,651 10,936 9,897 205,598
Macquarie Group Limited and its subsidiaries 2020 Interim Report 35
Directors’ Report Financial Report
Macquarie Asset Management
Banking and Financial Services
Commodities and Global Markets
Macquarie Capital Corporate Total
$m $m $m $m $m $m
Note 3Segment reporting continued
(i) Operating Segments continued
The following is an analysis of the Consolidated Entity’s revenue and results by reportable segments: HALF-YEAR TO 30 SEPTEMBER 2019
Net interest and trading (expense)/income (258) 838 1,688 (18) 167 2,417Fee and commission income/(expense) 1,648 226 606 415 (21) 2,874Net operating lease income 303 – 157 – 1 461Share of net profits/(losses) of associates and joint ventures 83 (3) 9 (137) (1) (49)Credit and other impairment (charges)/reversal (5) (42) (35) (59) 2 (139)Other operating income and charges 108 – 49 576 23 756Internal management revenue/(charge) – 2 2 38 (42) –Net operating income 1,879 1,021 2,476 815 129 6,320Total operating expenses (755) (636) (1,338) (593) (1,158) (4,480)Operating profit/(loss) before income tax 1,124 385 1,138 222 (1,029) 1,840Income tax expense – – – – (376) (376)(Profit)/loss attributable to non-controlling interests (2) – – 1 (6) (7)Net profit/(loss) attributable to ordinary equity holders 1,122 385 1,138 223 (1,411) 1,457Reportable segment assets 10,368 68,880 115,308 12,763 12,176 219,495
HALF-YEAR TO 31 MARCH 2019
Net interest and trading (expense)/income (252) 844 1,583 26 121 2,322Fee and commission income/(expense) 1,538 232 611 497 (13) 2,865Net operating lease income 335 – 153 – 1 489Share of net profits/(losses) of associates and joint ventures 27 9 10 (102) (7) (63)Credit and other impairment charges (87) (54) (147) (179) (9) (476)Other operating income and charges 125 21 82 1,543 16 1,787Internal management revenue/(charge) 107 – (9) 26 (124) –Net operating income 1,793 1,052 2,283 1,811 (15) 6,924Total operating expenses (770) (674) (1,403) (569) (1,346) (4,762)Operating profit/(loss) before income tax 1,023 378 880 1,242 (1,361) 2,162Income tax expense – – – – (505) (505)(Profit)/loss attributable to non-controlling interests (1) – (1) 23 (6) 15Net profit/(loss) attributable to ordinary equity holders 1,022 378 879 1,265 (1,872) 1,672Reportable segment assets 16,315 63,893 103,456 8,950 10,568 203,182
HALF-YEAR TO 30 SEPTEMBER 2018
Net interest and trading (expense)/income (217) 834 1,357 61 194 2,229Fee and commission income/(expense) 1,292 244 611 526 (12) 2,661Net operating lease income 327 – 132 – 2 461Share of net profits/(losses) of associates and joint ventures 87 (1) 10 (89) – 7Credit and other impairment (charges)/reversal (18) (28) (18) 4 (16) (76)Other operating income and charges 63 – 54 506 (75) 548Internal management revenue/(charge) – 2 5 15 (22) –Net operating income 1,534 1,051 2,151 1,023 71 5,830Total operating expenses (683) (673) (1,286) (504) (979) (4,125)Operating profit/(loss) before income tax 851 378 865 519 (908) 1,705Income tax expense – – – – (374) (374)Profit attributable to non-controlling interests (1) – (1) (10) (9) (21)Net profit/(loss) attributable to ordinary equity holders 850 378 864 509 (1,291) 1,310Reportable segment assets 15,491 61,623 107,651 10,936 9,897 205,598

36 Macquarie Group Limited and its subsidiaries 2020 Interim Report
Notes to the consolidated financial statementsFor the half-year ended 30 September 2019 continued
Note 3Segment reporting continued
(ii) Fee and commission income/(expense) relating to contracts with customers
The below table represents a disaggregation of fee and commission income by Operating Segment:
Macquarie Asset
Management
Banking and Financial
Services
Commodities and Global
MarketsMacquarie
Capital Corporate Total$m $m $m $m $m $m
Fee and commission income HALF-YEAR TO 30 SEPTEMBER 2019
Base and other asset management fees 999 110 4 – – 1,113
Performance fees 546 – – – – 546
Mergers and acquisitions, advisory and underwriting fees 23 – 58 411 (10) 482
Brokerage and other trading-related income 4 25 383 – – 412
Other fee and commission income 76 91 161 4 (11) 321
Total 1,648 226 606 415 (21) 2,874
Fee and commission income HALF-YEAR TO 31 MARCH 2019
Base and other asset management fees 947 112 3 – – 1,062
Performance fees 483 – – 94 – 577
Mergers and acquisitions, advisory and underwriting fees 23 – 16 396 (2) 433
Brokerage and other trading-related income 6 28 425 – – 459
Other fee and commission income 79 92 167 7 (11) 334
Total 1,538 232 611 497 (13) 2,865
Fee and commission income HALF-YEAR TO 30 SEPTEMBER 2018
Base and other asset management fees 930 121 6 – – 1,057
Performance fees 282 – – – – 282
Mergers and acquisitions, advisory and underwriting fees 12 – 55 508 (2) 573
Brokerage and other trading-related income 2 39 432 – – 473
Other fee and commission income 66 84 118 18 (10) 276
Total 1,292 244 611 526 (12) 2,661
Macquarie Group Limited and its subsidiaries 2020 Interim Report 37
Directors’ Report Financial Report
Note 3Segment reporting continued
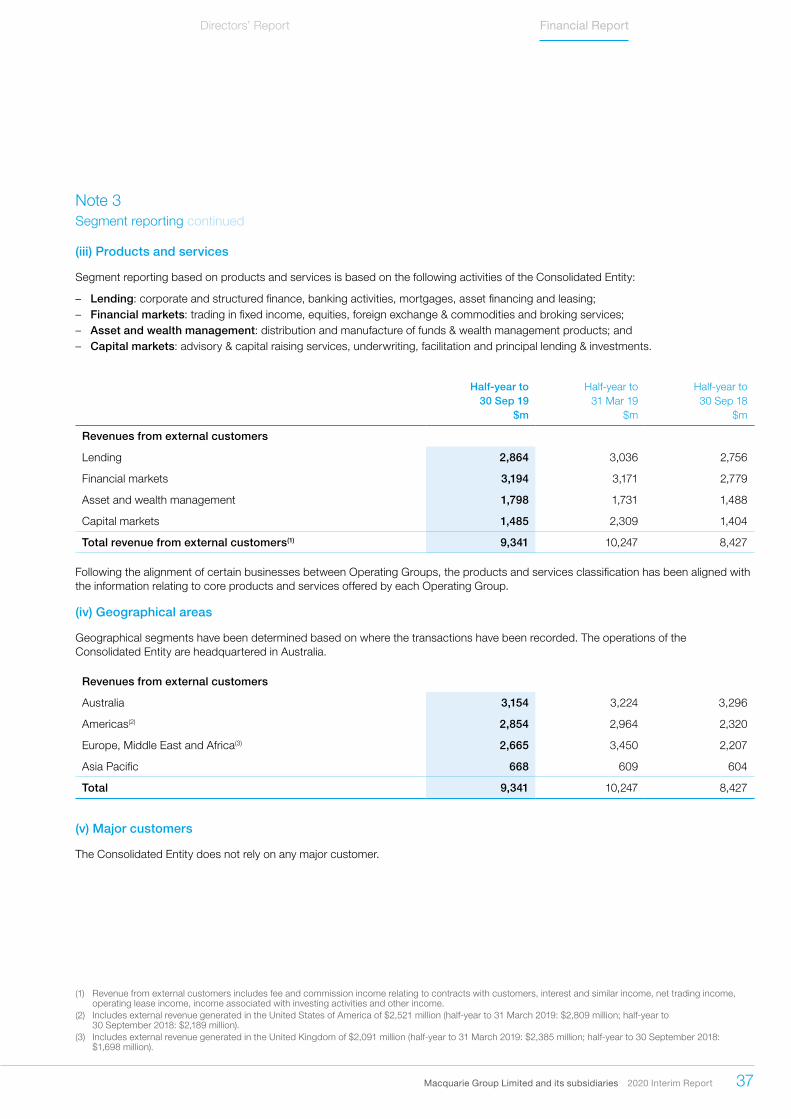
(iii) Products and services
Segment reporting based on products and services is based on the following activities of the Consolidated Entity:
– Lending: corporate and structured finance, banking activities, mortgages, asset financing and leasing; – Financial markets: trading in fixed income, equities, foreign exchange & commodities and broking services; – Asset and wealth management: distribution and manufacture of funds & wealth management products; and – Capital markets: advisory & capital raising services, underwriting, facilitation and principal lending & investments.
Half-year to Half-year to Half-year to30 Sep 19 31 Mar 19 30 Sep 18
$m $m $m
Revenues from external customers
Lending 2,864 3,036 2,756
Financial markets 3,194 3,171 2,779
Asset and wealth management 1,798 1,731 1,488
Capital markets 1,485 2,309 1,404
Total revenue from external customers(1) 9,341 10,247 8,427
Following the alignment of certain businesses between Operating Groups, the products and services classification has been aligned with the information relating to core products and services offered by each Operating Group.
(iv) Geographical areas
Geographical segments have been determined based on where the transactions have been recorded. The operations of the Consolidated Entity are headquartered in Australia.
Revenues from external customers
Australia 3,154 3,224 3,296
Americas(2) 2,854 2,964 2,320
Europe, Middle East and Africa(3) 2,665 3,450 2,207
Asia Pacific 668 609 604
Total 9,341 10,247 8,427
(v) Major customers
The Consolidated Entity does not rely on any major customer.
(1) Revenue from external customers includes fee and commission income relating to contracts with customers, interest and similar income, net trading income, operating lease income, income associated with investing activities and other income.
(2) Includes external revenue generated in the United States of America of $2,521 million (half-year to 31 March 2019: $2,809 million; half-year to 30 September 2018: $2,189 million).
(3) Includes external revenue generated in the United Kingdom of $2,091 million (half-year to 31 March 2019: $2,385 million; half-year to 30 September 2018: $1,698 million).

38 Macquarie Group Limited and its subsidiaries 2020 Interim Report
Notes to the consolidated financial statementsFor the half-year ended 30 September 2019 continued
Half-year to Half-year to Half-year to30 Sep 19 31 Mar 19 30 Sep 18
$m $m $m
Note 4 Income tax expense
(i) Reconciliation of income tax expense to prima facie tax payable
Prima facie income tax expense on operating profit(1) (552) (648) (512)
Tax effect of amounts which are non-assessable/(non-deductible) in calculating taxable income:
Rate differential on offshore income 204 136 153
Other items (28) 7 (15)
Total income tax expense (376) (505) (374)
(ii) Tax benefit/(expense) relating to items of OCI
FVOCI reserve (2) 4 5
Own credit risk 8 (8) 5
Cash flow hedges 2 7 4
Foreign currency translation and net investment hedge reserve – 1 –
Share of other comprehensive (income)/expense of associates and joint ventures (6) 7 6
Total tax benefit relating to items of OCI 2 11 20
Revenue authorities undertake risk reviews and audits as part of their normal activities. The Consolidated Entity has assessed these and other taxation claims and litigation, including seeking advice where appropriate, and considers that it holds appropriate provisions.
(1) Prima facie income tax expense on operating profit is calculated at the Australian statutory corporate tax rate of 30% (half-year to 31 March 2019: 30%; half-year to 30 September 2018: 30%).
Macquarie Group Limited and its subsidiaries 2020 Interim Report 39
Directors’ Report Financial Report
Half-year to Half-year to Half-year to30 Sep 19 31 Mar 19 30 Sep 18
$m $m $m
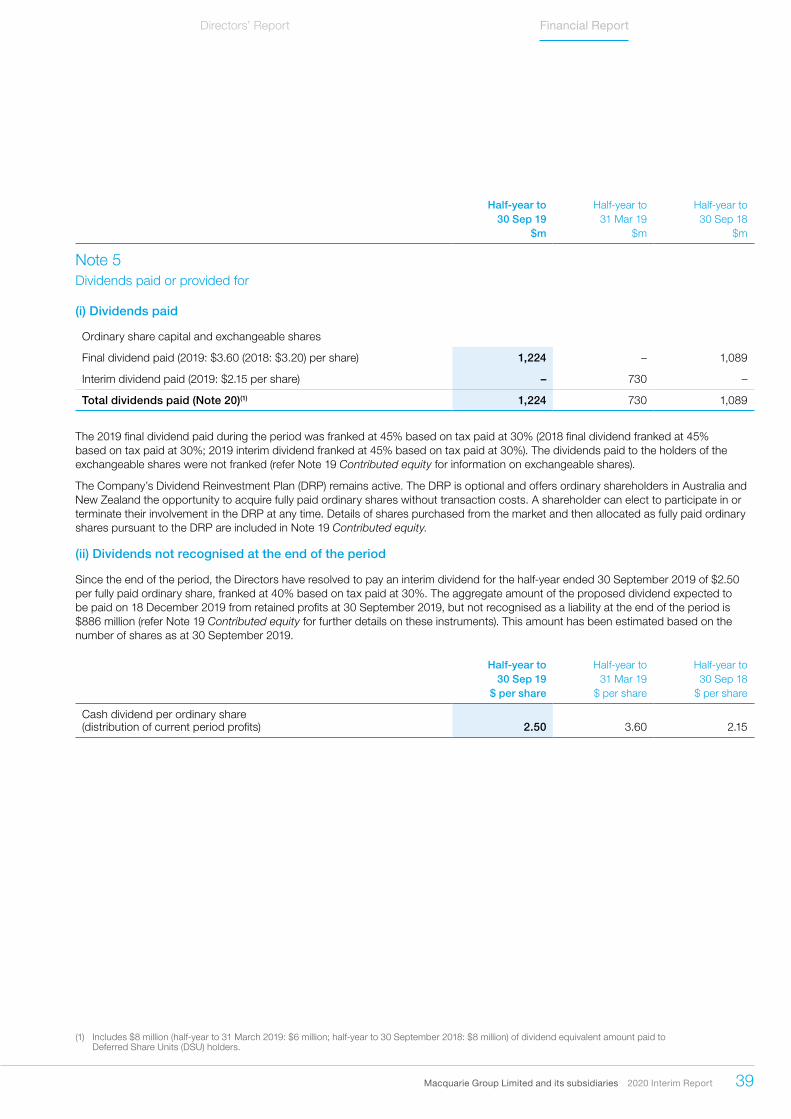
Note 5 Dividends paid or provided for
(i) Dividends paid
Ordinary share capital and exchangeable shares
Final dividend paid (2019: $3.60 (2018: $3.20) per share) 1,224 – 1,089
Interim dividend paid (2019: $2.15 per share) – 730 –
Total dividends paid (Note 20)(1) 1,224 730 1,089
The 2019 final dividend paid during the period was franked at 45% based on tax paid at 30% (2018 final dividend franked at 45% based on tax paid at 30%; 2019 interim dividend franked at 45% based on tax paid at 30%). The dividends paid to the holders of the exchangeable shares were not franked (refer Note 19 Contributed equity for information on exchangeable shares).
The Company’s Dividend Reinvestment Plan (DRP) remains active. The DRP is optional and offers ordinary shareholders in Australia and New Zealand the opportunity to acquire fully paid ordinary shares without transaction costs. A shareholder can elect to participate in or terminate their involvement in the DRP at any time. Details of shares purchased from the market and then allocated as fully paid ordinary shares pursuant to the DRP are included in Note 19 Contributed equity.
(ii) Dividends not recognised at the end of the period
Since the end of the period, the Directors have resolved to pay an interim dividend for the half-year ended 30 September 2019 of $2.50 per fully paid ordinary share, franked at 40% based on tax paid at 30%. The aggregate amount of the proposed dividend expected to be paid on 18 December 2019 from retained profits at 30 September 2019, but not recognised as a liability at the end of the period is $886 million (refer Note 19 Contributed equity for further details on these instruments). This amount has been estimated based on the number of shares as at 30 September 2019.
Half-year to Half-year to Half-year to30 Sep 19 31 Mar 19 30 Sep 18
$ per share $ per share $ per share
Cash dividend per ordinary share (distribution of current period profits) 2.50 3.60 2.15
(1) Includes $8 million (half-year to 31 March 2019: $6 million; half-year to 30 September 2018: $8 million) of dividend equivalent amount paid to Deferred Share Units (DSU) holders.
40 Macquarie Group Limited and its subsidiaries 2020 Interim Report
Notes to the consolidated financial statementsFor the half-year ended 30 September 2019 continued
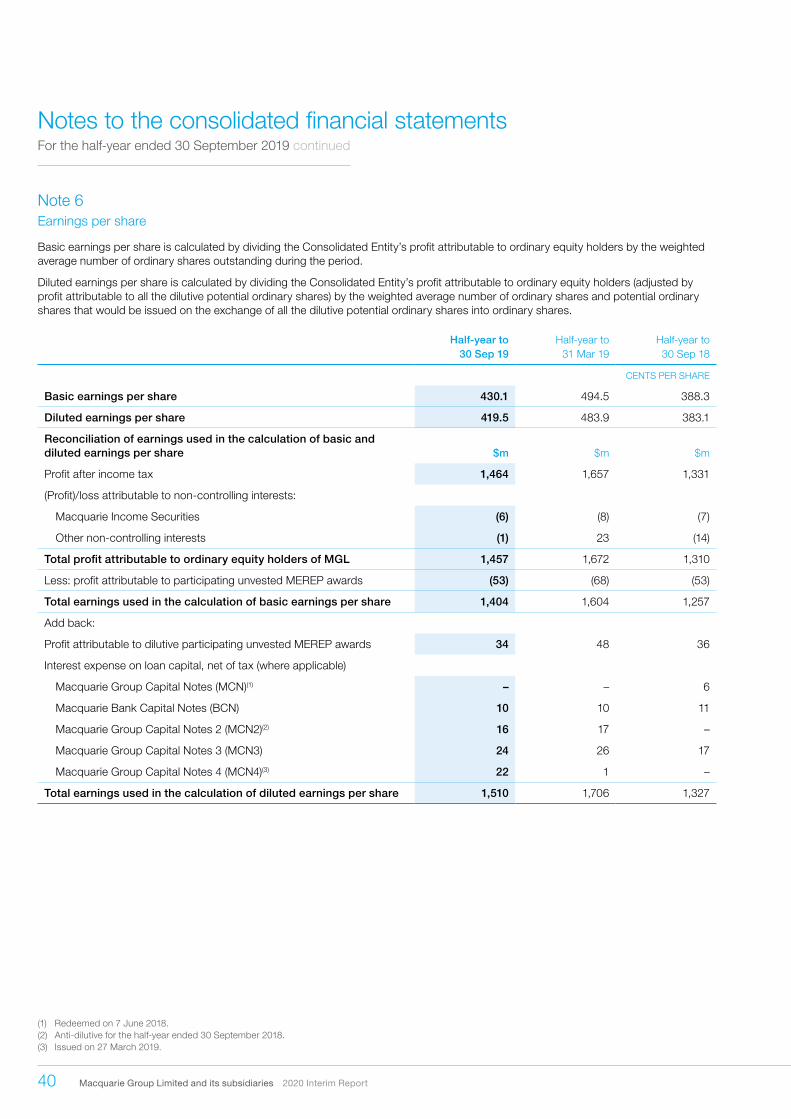
Note 6 Earnings per share
Basic earnings per share is calculated by dividing the Consolidated Entity’s profit attributable to ordinary equity holders by the weighted average number of ordinary shares outstanding during the period.
Diluted earnings per share is calculated by dividing the Consolidated Entity’s profit attributable to ordinary equity holders (adjusted by profit attributable to all the dilutive potential ordinary shares) by the weighted average number of ordinary shares and potential ordinary shares that would be issued on the exchange of all the dilutive potential ordinary shares into ordinary shares.
Half-year to Half-year to Half-year to30 Sep 19 31 Mar 19 30 Sep 18
CENTS PER SHARE
Basic earnings per share 430.1 494.5 388.3
Diluted earnings per share 419.5 483.9 383.1
Reconciliation of earnings used in the calculation of basic and diluted earnings per share $m $m $m
Profit after income tax 1,464 1,657 1,331
(Profit)/loss attributable to non-controlling interests:
Macquarie Income Securities (6) (8) (7)
Other non-controlling interests (1) 23 (14)
Total profit attributable to ordinary equity holders of MGL 1,457 1,672 1,310
Less: profit attributable to participating unvested MEREP awards (53) (68) (53)
Total earnings used in the calculation of basic earnings per share 1,404 1,604 1,257
Add back:
Profit attributable to dilutive participating unvested MEREP awards 34 48 36
Interest expense on loan capital, net of tax (where applicable)
Macquarie Group Capital Notes (MCN)(1) – – 6
Macquarie Bank Capital Notes (BCN) 10 10 11
Macquarie Group Capital Notes 2 (MCN2)(2) 16 17 –
Macquarie Group Capital Notes 3 (MCN3) 24 26 17
Macquarie Group Capital Notes 4 (MCN4)(3) 22 1 –
Total earnings used in the calculation of diluted earnings per share 1,510 1,706 1,327
(1) Redeemed on 7 June 2018.(2) Anti-dilutive for the half-year ended 30 September 2018.(3) Issued on 27 March 2019.
Macquarie Group Limited and its subsidiaries 2020 Interim Report 41
Directors’ Report Financial Report
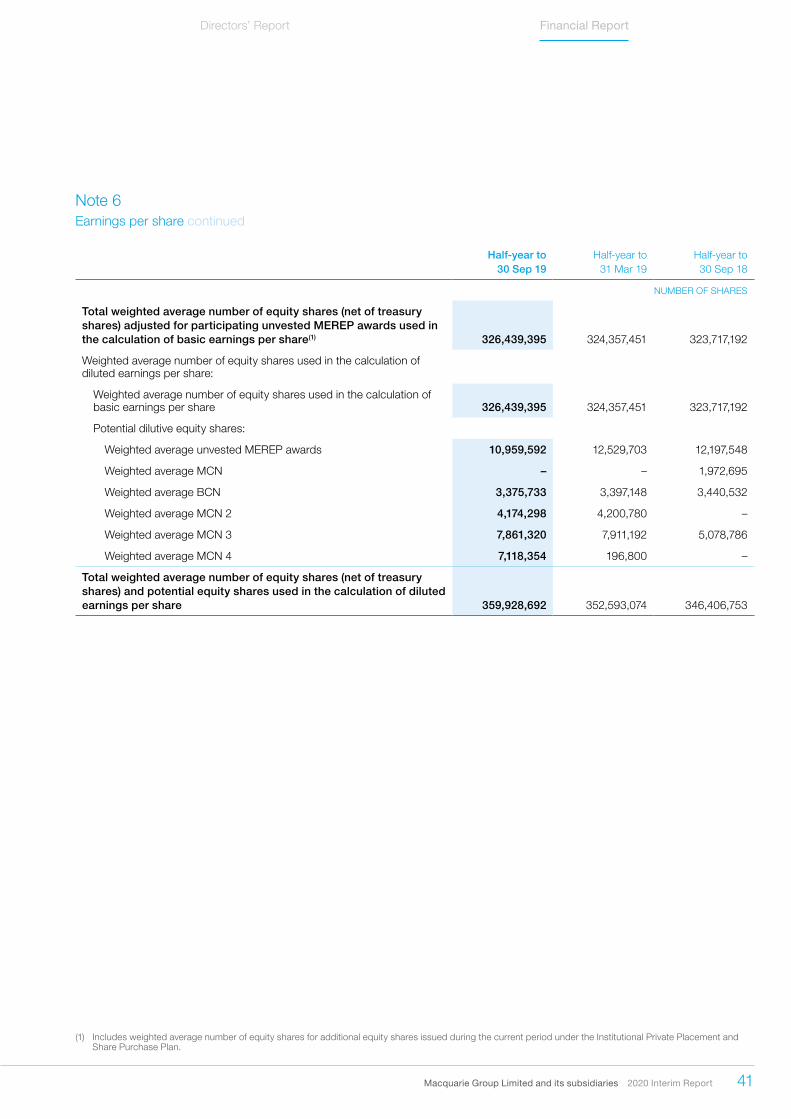
Note 6Earnings per share continued
Half-year to Half-year to Half-year to30 Sep 19 31 Mar 19 30 Sep 18
NUMBER OF SHARES
Total weighted average number of equity shares (net of treasury shares) adjusted for participating unvested MEREP awards used in the calculation of basic earnings per share(1) 326,439,395 324,357,451 323,717,192
Weighted average number of equity shares used in the calculation of diluted earnings per share:
Weighted average number of equity shares used in the calculation of basic earnings per share 326,439,395 324,357,451 323,717,192
Potential dilutive equity shares:
Weighted average unvested MEREP awards 10,959,592 12,529,703 12,197,548
Weighted average MCN – – 1,972,695
Weighted average BCN 3,375,733 3,397,148 3,440,532
Weighted average MCN 2 4,174,298 4,200,780 –
Weighted average MCN 3 7,861,320 7,911,192 5,078,786
Weighted average MCN 4 7,118,354 196,800 –
Total weighted average number of equity shares (net of treasury shares) and potential equity shares used in the calculation of diluted earnings per share 359,928,692 352,593,074 346,406,753
(1) Includes weighted average number of equity shares for additional equity shares issued during the current period under the Institutional Private Placement and Share Purchase Plan.
42 Macquarie Group Limited and its subsidiaries 2020 Interim Report
Notes to the consolidated financial statementsFor the half-year ended 30 September 2019 continued
As at As at As at30 Sep 19 31 Mar 19 30 Sep 18
$m $m $m
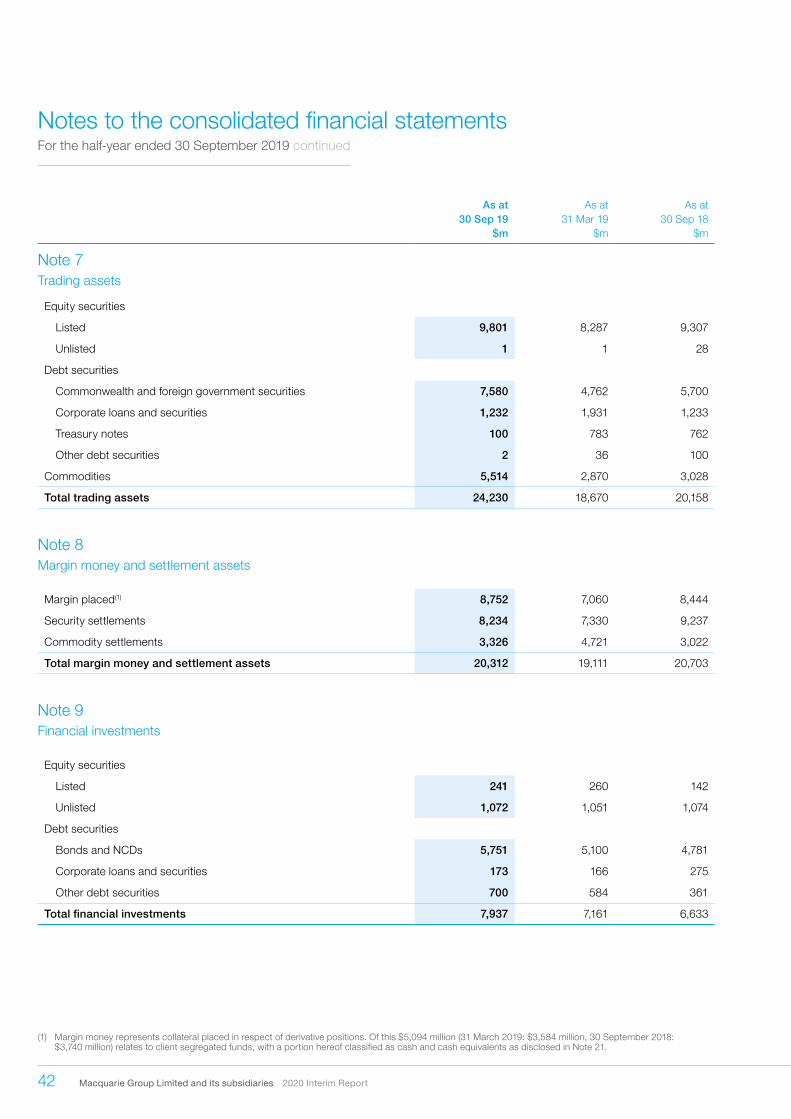
Note 7 Trading assets
Equity securities
Listed 9,801 8,287 9,307
Unlisted 1 1 28
Debt securities
Commonwealth and foreign government securities 7,580 4,762 5,700
Corporate loans and securities 1,232 1,931 1,233
Treasury notes 100 783 762
Other debt securities 2 36 100
Commodities 5,514 2,870 3,028
Total trading assets 24,230 18,670 20,158
Note 8 Margin money and settlement assets
Margin placed(1) 8,752 7,060 8,444
Security settlements 8,234 7,330 9,237
Commodity settlements 3,326 4,721 3,022
Total margin money and settlement assets 20,312 19,111 20,703
Note 9 Financial investments
Equity securities
Listed 241 260 142
Unlisted 1,072 1,051 1,074
Debt securities
Bonds and NCDs 5,751 5,100 4,781
Corporate loans and securities 173 166 275
Other debt securities 700 584 361
Total financial investments 7,937 7,161 6,633
(1) Margin money represents collateral placed in respect of derivative positions. Of this $5,094 million (31 March 2019: $3,584 million, 30 September 2018: $3,740 million) relates to client segregated funds, with a portion hereof classified as cash and cash equivalents as disclosed in Note 21.
Macquarie Group Limited and its subsidiaries 2020 Interim Report 43
Directors’ Report Financial Report
As at As at As at30 Sep 19 31 Mar 19 30 Sep 18
$m $m $m
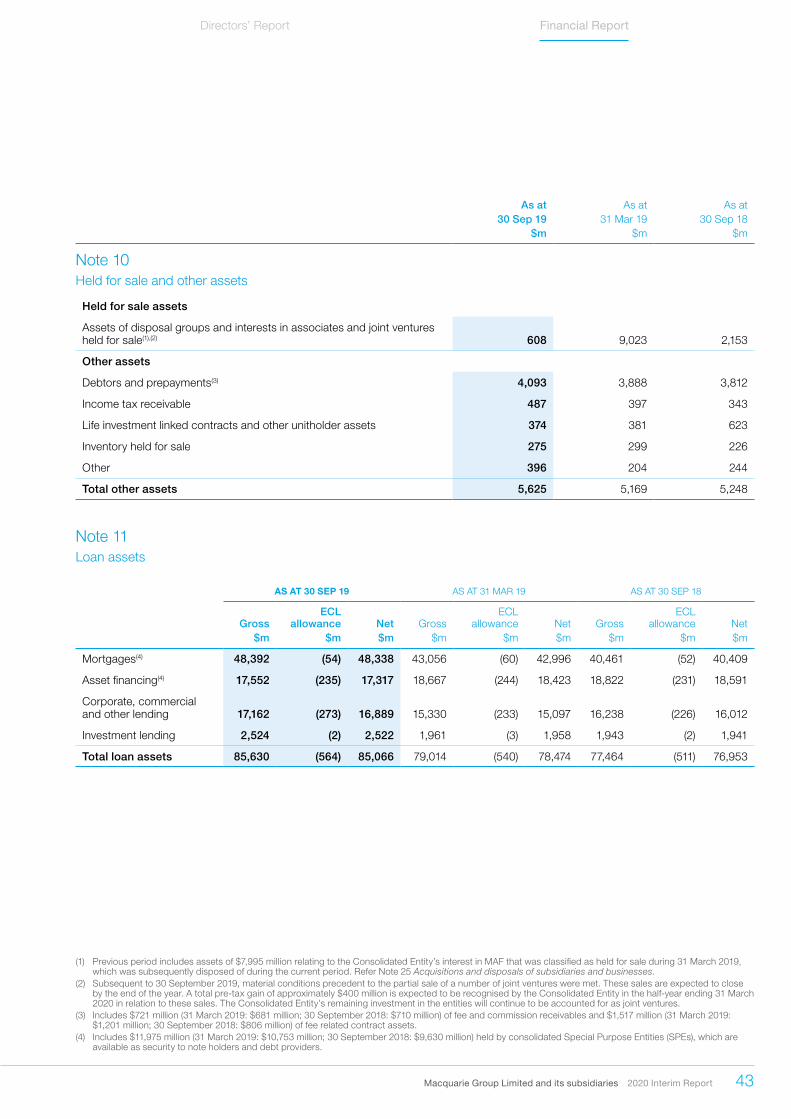
Note 10 Held for sale and other assets
Held for sale assets
Assets of disposal groups and interests in associates and joint ventures held for sale(1),(2) 608 9,023 2,153
Other assets
Debtors and prepayments(3) 4,093 3,888 3,812
Income tax receivable 487 397 343
Life investment linked contracts and other unitholder assets 374 381 623
Inventory held for sale 275 299 226
Other 396 204 244
Total other assets 5,625 5,169 5,248
Note 11 Loan assets
AS AT 30 SEP 19 AS AT 31 MAR 19 AS AT 30 SEP 18
GrossECL
allowance Net GrossECL
allowance Net GrossECL
allowance Net$m $m $m $m $m $m $m $m $m
Mortgages(4) 48,392 (54) 48,338 43,056 (60) 42,996 40,461 (52) 40,409
Asset financing(4) 17,552 (235) 17,317 18,667 (244) 18,423 18,822 (231) 18,591
Corporate, commercial and other lending 17,162 (273) 16,889 15,330 (233) 15,097 16,238 (226) 16,012
Investment lending 2,524 (2) 2,522 1,961 (3) 1,958 1,943 (2) 1,941
Total loan assets 85,630 (564) 85,066 79,014 (540) 78,474 77,464 (511) 76,953
(1) Previous period includes assets of $7,995 million relating to the Consolidated Entity’s interest in MAF that was classified as held for sale during 31 March 2019, which was subsequently disposed of during the current period. Refer Note 25 Acquisitions and disposals of subsidiaries and businesses.
(2) Subsequent to 30 September 2019, material conditions precedent to the partial sale of a number of joint ventures were met. These sales are expected to close by the end of the year. A total pre-tax gain of approximately $400 million is expected to be recognised by the Consolidated Entity in the half-year ending 31 March 2020 in relation to these sales. The Consolidated Entity’s remaining investment in the entities will continue to be accounted for as joint ventures.
(3) Includes $721 million (31 March 2019: $681 million; 30 September 2018: $710 million) of fee and commission receivables and $1,517 million (31 March 2019: $1,201 million; 30 September 2018: $806 million) of fee related contract assets.
(4) Includes $11,975 million (31 March 2019: $10,753 million; 30 September 2018: $9,630 million) held by consolidated Special Purpose Entities (SPEs), which are available as security to note holders and debt providers.
44 Macquarie Group Limited and its subsidiaries 2020 Interim Report
Notes to the consolidated financial statementsFor the half-year ended 30 September 2019 continued
Note 12Expected credit losses
The Consolidated Entity determines its Expected Credit Losses (ECL) with reference to a range of inputs notably that of Exposure at Default (EAD), Probability of Default (PD) and Loss Given Default (LGD). In addition, AASB 9 requires the inclusion of Forward-Looking Information (FLI) to be included in the determination of the ECL. The inclusion of FLI in calculating ECL allowances adjusts the PD, the determination of whether there has been a Significant Increase in Credit Risk (SICR) as well as the LGD (relevant to the determination of the recovery rate on collateral).
The Consolidated Entity’s Risk Management Group is responsible for the FLI including the development of scenarios and the weighting applied to those scenarios. In calculating the ECL, EADs, PDs and LGDs are determined under each scenario. The resultant ECL for each scenario is then probability weighted to determine the reported ECL. The scenarios and the assigned probabilities are updated semi-annually or more frequently if a material disruption event were to occur. The scenarios, including its underlying indicators, are developed using a combination of publicly available data, internal forecasts and third-party information.
The scenarios are refined through consultation with internal specialists and benchmarking to external data from reputable sources. Assigning probabilities to these scenarios requires professional judgement which draws on internal risk and economics’ specialist input and comparison to general market outlooks and publicly available market commentary. The scenarios and the associated probabilities are ultimately approved by senior risk and finance executives.
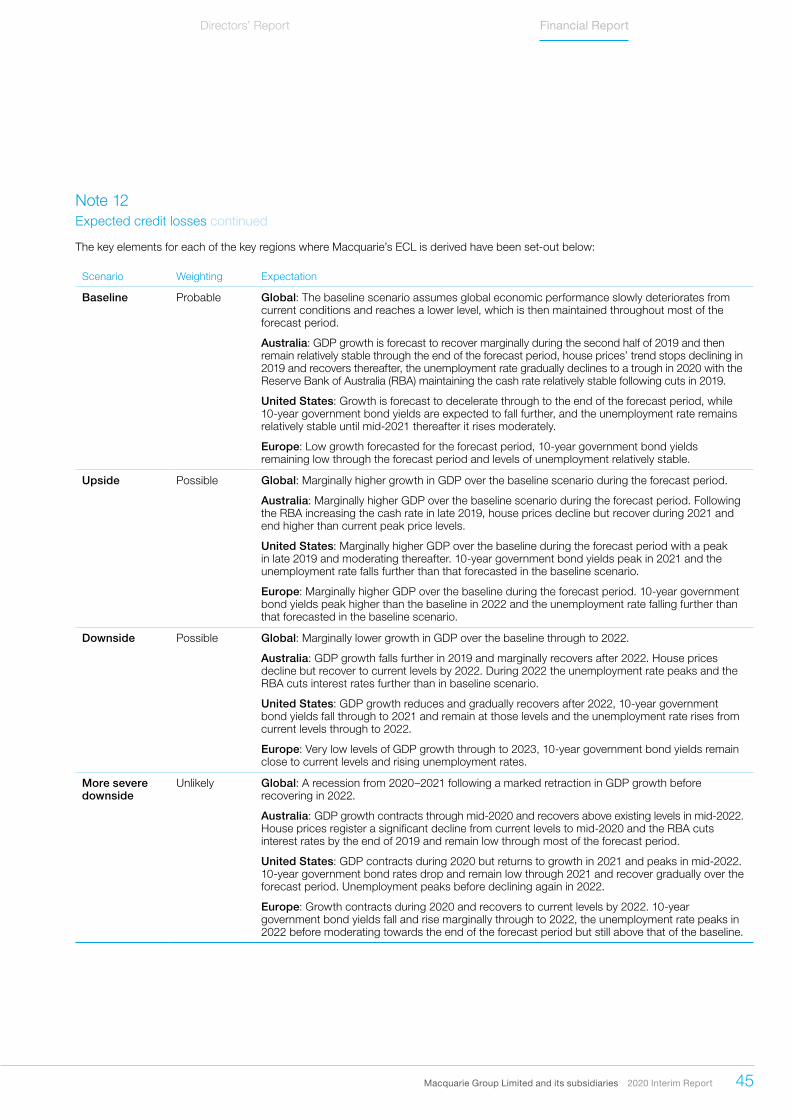
Macquarie Group Limited and its subsidiaries 2020 Interim Report 45
Directors’ Report Financial Report
Note 12Expected credit losses continued
The key elements for each of the key regions where Macquarie’s ECL is derived have been set-out below:
Scenario Weighting Expectation
Baseline Probable Global: The baseline scenario assumes global economic performance slowly deteriorates from current conditions and reaches a lower level, which is then maintained throughout most of the forecast period.
Australia: GDP growth is forecast to recover marginally during the second half of 2019 and then remain relatively stable through the end of the forecast period, house prices’ trend stops declining in 2019 and recovers thereafter, the unemployment rate gradually declines to a trough in 2020 with the Reserve Bank of Australia (RBA) maintaining the cash rate relatively stable following cuts in 2019.
United States: Growth is forecast to decelerate through to the end of the forecast period, while 10-year government bond yields are expected to fall further, and the unemployment rate remains relatively stable until mid-2021 thereafter it rises moderately.
Europe: Low growth forecasted for the forecast period, 10-year government bond yields remaining low through the forecast period and levels of unemployment relatively stable.
Upside Possible Global: Marginally higher growth in GDP over the baseline scenario during the forecast period.
Australia: Marginally higher GDP over the baseline scenario during the forecast period. Following the RBA increasing the cash rate in late 2019, house prices decline but recover during 2021 and end higher than current peak price levels.
United States: Marginally higher GDP over the baseline during the forecast period with a peak in late 2019 and moderating thereafter. 10-year government bond yields peak in 2021 and the unemployment rate falls further than that forecasted in the baseline scenario.
Europe: Marginally higher GDP over the baseline during the forecast period. 10-year government bond yields peak higher than the baseline in 2022 and the unemployment rate falling further than that forecasted in the baseline scenario.
Downside Possible Global: Marginally lower growth in GDP over the baseline through to 2022.
Australia: GDP growth falls further in 2019 and marginally recovers after 2022. House prices decline but recover to current levels by 2022. During 2022 the unemployment rate peaks and the RBA cuts interest rates further than in baseline scenario.
United States: GDP growth reduces and gradually recovers after 2022, 10-year government bond yields fall through to 2021 and remain at those levels and the unemployment rate rises from current levels through to 2022.
Europe: Very low levels of GDP growth through to 2023, 10-year government bond yields remain close to current levels and rising unemployment rates.
More severe downside
Unlikely Global: A recession from 2020–2021 following a marked retraction in GDP growth before recovering in 2022.
Australia: GDP growth contracts through mid-2020 and recovers above existing levels in mid-2022. House prices register a significant decline from current levels to mid-2020 and the RBA cuts interest rates by the end of 2019 and remain low through most of the forecast period.
United States: GDP contracts during 2020 but returns to growth in 2021 and peaks in mid-2022. 10-year government bond rates drop and remain low through 2021 and recover gradually over the forecast period. Unemployment peaks before declining again in 2022.
Europe: Growth contracts during 2020 and recovers to current levels by 2022. 10-year government bond yields fall and rise marginally through to 2022, the unemployment rate peaks in 2022 before moderating towards the end of the forecast period but still above that of the baseline.
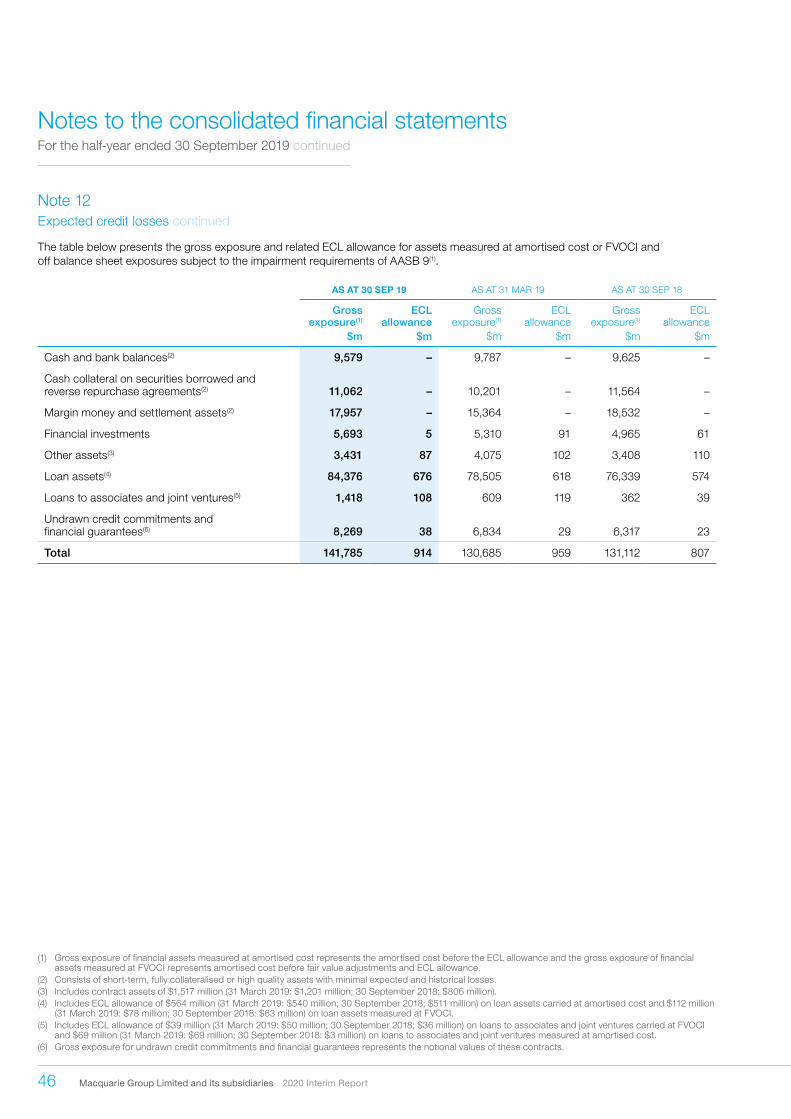
46 Macquarie Group Limited and its subsidiaries 2020 Interim Report
Notes to the consolidated financial statementsFor the half-year ended 30 September 2019 continued
Note 12Expected credit losses continued
The table below presents the gross exposure and related ECL allowance for assets measured at amortised cost or FVOCI and off balance sheet exposures subject to the impairment requirements of AASB 9(1).
AS AT 30 SEP 19 AS AT 31 MAR 19 AS AT 30 SEP 18
Gross exposure(1)
ECL allowance
Gross exposure(1)
ECL allowance
Gross exposure(1)
ECL allowance
$m $m $m $m $m $m
Cash and bank balances(2) 9,579 – 9,787 – 9,625 –
Cash collateral on securities borrowed and reverse repurchase agreements(2) 11,062 – 10,201 – 11,564 –
Margin money and settlement assets(2) 17,957 – 15,364 – 18,532 –
Financial investments 5,693 5 5,310 91 4,965 61
Other assets(3) 3,431 87 4,075 102 3,408 110
Loan assets(4) 84,376 676 78,505 618 76,339 574
Loans to associates and joint ventures(5) 1,418 108 609 119 362 39
Undrawn credit commitments and financial guarantees(6) 8,269 38 6,834 29 6,317 23
Total 141,785 914 130,685 959 131,112 807
(1) Gross exposure of financial assets measured at amortised cost represents the amortised cost before the ECL allowance and the gross exposure of financial assets measured at FVOCI represents amortised cost before fair value adjustments and ECL allowance.
(2) Consists of short-term, fully collateralised or high quality assets with minimal expected and historical losses. (3) Includes contract assets of $1,517 million (31 March 2019: $1,201 million; 30 September 2018: $806 million).(4) Includes ECL allowance of $564 million (31 March 2019: $540 million; 30 September 2018; $511 million) on loan assets carried at amortised cost and $112 million
(31 March 2019: $78 million; 30 September 2018: $63 million) on loan assets measured at FVOCI.(5) Includes ECL allowance of $39 million (31 March 2019: $50 million; 30 September 2018; $36 million) on loans to associates and joint ventures carried at FVOCI
and $69 million (31 March 2019: $69 million; 30 September 2018: $3 million) on loans to associates and joint ventures measured at amortised cost.(6) Gross exposure for undrawn credit commitments and financial guarantees represents the notional values of these contracts.
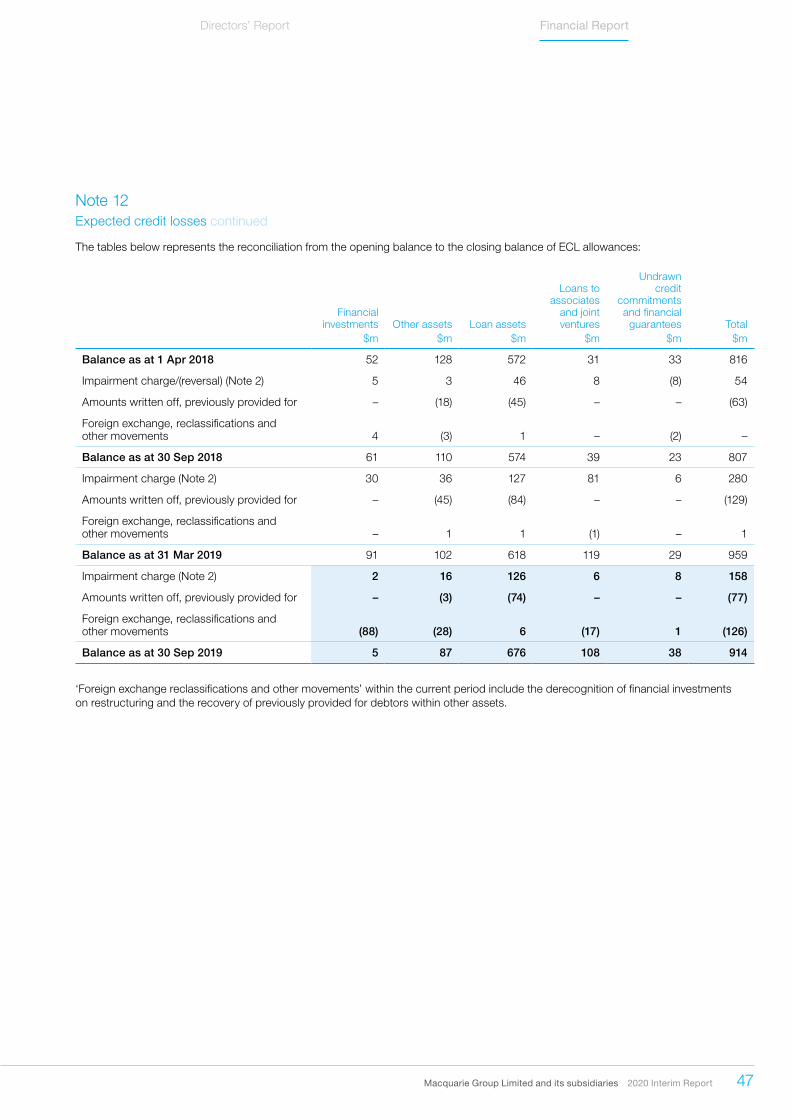
Macquarie Group Limited and its subsidiaries 2020 Interim Report 47
Directors’ Report Financial Report
Note 12Expected credit losses continued
The tables below represents the reconciliation from the opening balance to the closing balance of ECL allowances:
Financial investments Other assets Loan assets
Loans to associates
and joint ventures
Undrawn credit
commitments and financial
guarantees Total$m $m $m $m $m $m
Balance as at 1 Apr 2018 52 128 572 31 33 816
Impairment charge/(reversal) (Note 2) 5 3 46 8 (8) 54
Amounts written off, previously provided for – (18) (45) – – (63)
Foreign exchange, reclassifications and other movements 4 (3) 1 – (2) –
Balance as at 30 Sep 2018 61 110 574 39 23 807
Impairment charge (Note 2) 30 36 127 81 6 280
Amounts written off, previously provided for – (45) (84) – – (129)
Foreign exchange, reclassifications and other movements – 1 1 (1) – 1
Balance as at 31 Mar 2019 91 102 618 119 29 959
Impairment charge (Note 2) 2 16 126 6 8 158
Amounts written off, previously provided for – (3) (74) – – (77)
Foreign exchange, reclassifications and other movements (88) (28) 6 (17) 1 (126)
Balance as at 30 Sep 2019 5 87 676 108 38 914
‘Foreign exchange reclassifications and other movements’ within the current period include the derecognition of financial investments on restructuring and the recovery of previously provided for debtors within other assets.
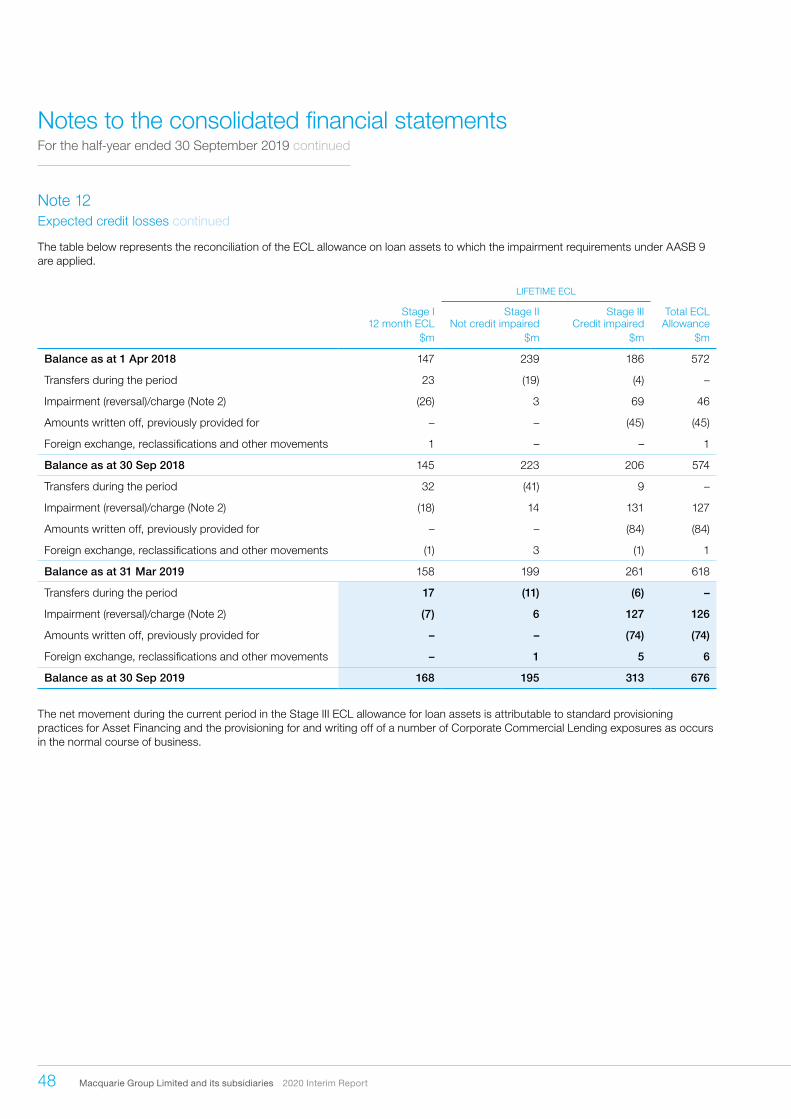
48 Macquarie Group Limited and its subsidiaries 2020 Interim Report
Notes to the consolidated financial statementsFor the half-year ended 30 September 2019 continued
Note 12Expected credit losses continued
The table below represents the reconciliation of the ECL allowance on loan assets to which the impairment requirements under AASB 9 are applied.
LIFETIME ECL
Stage I 12 month ECL
Stage II Not credit impaired
Stage III Credit impaired
Total ECL Allowance
$m $m $m $m
Balance as at 1 Apr 2018 147 239 186 572
Transfers during the period 23 (19) (4) –
Impairment (reversal)/charge (Note 2) (26) 3 69 46
Amounts written off, previously provided for – – (45) (45)
Foreign exchange, reclassifications and other movements 1 – – 1
Balance as at 30 Sep 2018 145 223 206 574
Transfers during the period 32 (41) 9 –
Impairment (reversal)/charge (Note 2) (18) 14 131 127
Amounts written off, previously provided for – – (84) (84)
Foreign exchange, reclassifications and other movements (1) 3 (1) 1
Balance as at 31 Mar 2019 158 199 261 618
Transfers during the period 17 (11) (6) –
Impairment (reversal)/charge (Note 2) (7) 6 127 126
Amounts written off, previously provided for – – (74) (74)
Foreign exchange, reclassifications and other movements – 1 5 6
Balance as at 30 Sep 2019 168 195 313 676
The net movement during the current period in the Stage III ECL allowance for loan assets is attributable to standard provisioning practices for Asset Financing and the provisioning for and writing off of a number of Corporate Commercial Lending exposures as occurs in the normal course of business.
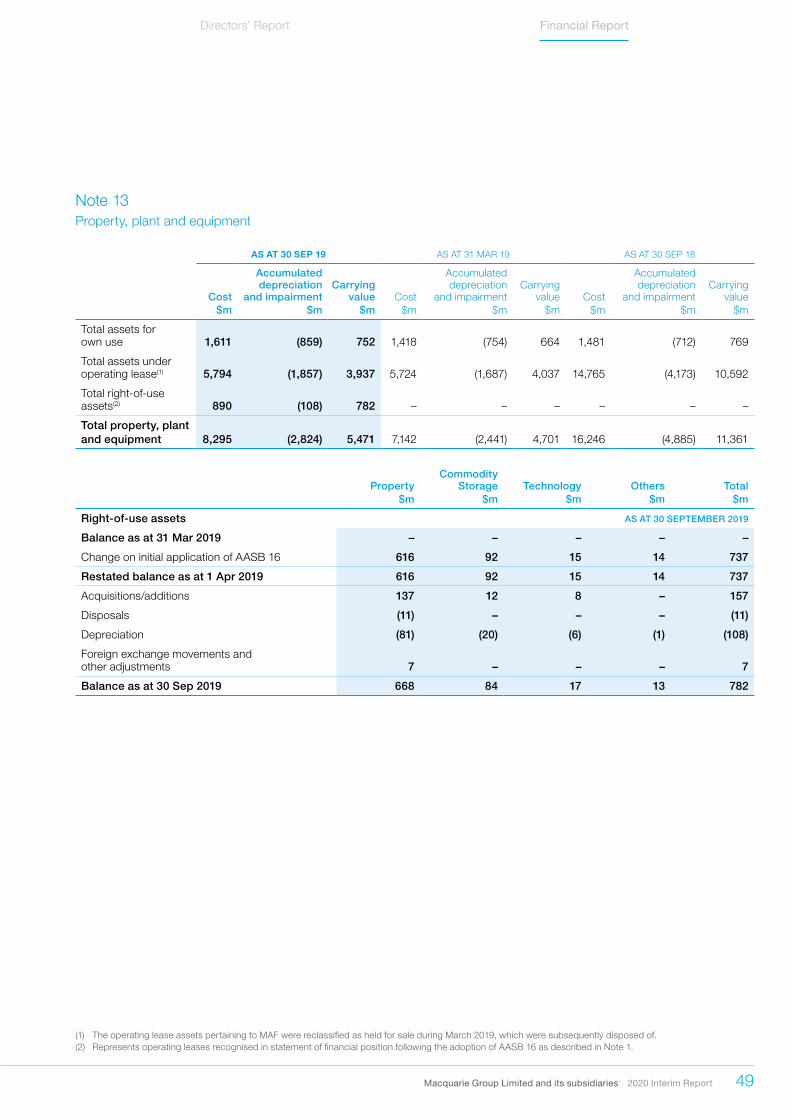
Macquarie Group Limited and its subsidiaries 2020 Interim Report 49
Directors’ Report Financial Report
Note 13 Property, plant and equipment
AS AT 30 SEP 19 AS AT 31 MAR 19 AS AT 30 SEP 18
Cost
Accumulated depreciation
and impairmentCarrying
value Cost
Accumulated depreciation
and impairmentCarrying
value Cost
Accumulated depreciation
and impairmentCarrying
value$m $m $m $m $m $m $m $m $m
Total assets for own use 1,611 (859) 752 1,418 (754) 664 1,481 (712) 769
Total assets under operating lease(1) 5,794 (1,857) 3,937 5,724 (1,687) 4,037 14,765 (4,173) 10,592
Total right-of-use assets(2) 890 (108) 782 – – – – – –
Total property, plant and equipment 8,295 (2,824) 5,471 7,142 (2,441) 4,701 16,246 (4,885) 11,361
PropertyCommodity
Storage Technology Others Total$m $m $m $m $m
Right-of-use assets AS AT 30 SEPTEMBER 2019
Balance as at 31 Mar 2019 – – – – –
Change on initial application of AASB 16 616 92 15 14 737
Restated balance as at 1 Apr 2019 616 92 15 14 737
Acquisitions/additions 137 12 8 – 157
Disposals (11) – – – (11)
Depreciation (81) (20) (6) (1) (108)
Foreign exchange movements and other adjustments 7 – – – 7
Balance as at 30 Sep 2019 668 84 17 13 782
(1) The operating lease assets pertaining to MAF were reclassified as held for sale during March 2019, which were subsequently disposed of.(2) Represents operating leases recognised in statement of financial position following the adoption of AASB 16 as described in Note 1.

50 Macquarie Group Limited and its subsidiaries 2020 Interim Report
Notes to the consolidated financial statementsFor the half-year ended 30 September 2019 continued
As at As at As at30 Sep 19 31 Mar 19 30 Sep 18
$m $m $m
Note 14 Interests in associates and joint ventures
Equity investments with no provisions for impairment 6,165 2,748 2,864
Equity investments with provisions for impairment
Gross carrying value 1,476 1,423 1,274
Less: provisions for impairment (493) (483) (349)
Equity investments with provisions for impairment 983 940 925
Total equity investments in associates and joint ventures 7,148 3,688 3,789
Loans to associates and joint ventures 1,421 600 357
Less: credit impairment charges (69) (69) (3)
Total loans to associates and joint ventures 1,352 531 354
Total interests in associates and joint ventures(1),(2) 8,500 4,219 4,143
Disclosure of material associate and joint venture
The Consolidated Entity’s material associate and joint venture at the balance date are:
Associate and joint venture
Carrying value ($m)
Ownership interest
Nature of investment Nature of activities
Financial reporting date
Macquarie AirFinance 1,554 75% Joint venture Aircraft leasing 31 March
East Anglia ONE Limited 2,225 40% Associate Offshore windfarm 31 March
Macquarie AirFinance (MAF)On 1 August 2019, the Consolidated Entity disposed of 25% of its Macquarie AirFinance (MAF) business which was classified as held for sale as at 31 March 2019. The retained interest in MAF is accounted as an equity-accounted joint venture on the basis of exercising joint control. The total carrying value of the investment represents $757 million of equity investment and $797 million of debt investment which is a long term interest in the joint venture. The joint venture has net assets of $2,072 million as at 30 September 2019 comprising of total assets of $8,969 million, primarily relating to aviation assets under operating leases and total liabilities of $6,897 million, primarily relating to debt funding in relation to these assets. The total contribution of the joint venture to the Consolidated Entity’s income statement pertaining to the period under joint control was not material to the Consolidated Entity.
Refer Note 25 Acquisitions and disposals of subsidiaries and businesses for details of the disposal transaction.
East Anglia ONE LimitedOn 30 August 2019, the Consolidated Entity acquired a 40% interest in East Anglia ONE Limited, a UK offshore wind farm. The acquisition was partially funded with borrowings of $1,824 million.
The Consolidated Entity has accounted for its interest as an equity-accounted associate on the basis of exercising significant influence. The carrying value of the investment in associate represents Macquarie’s share in the fair value of the net assets of the associate.
(1) Includes $5,690 million (31 March 2019: $2,948 million; 30 September 2018: $3,337 million) relating to interests in associates and $2,810 million (31 March 2019: $1,271 million; 30 September 2018: $806 million) relating to interests in joint ventures.
(2) Financial statements of associates and joint ventures have various reporting dates.
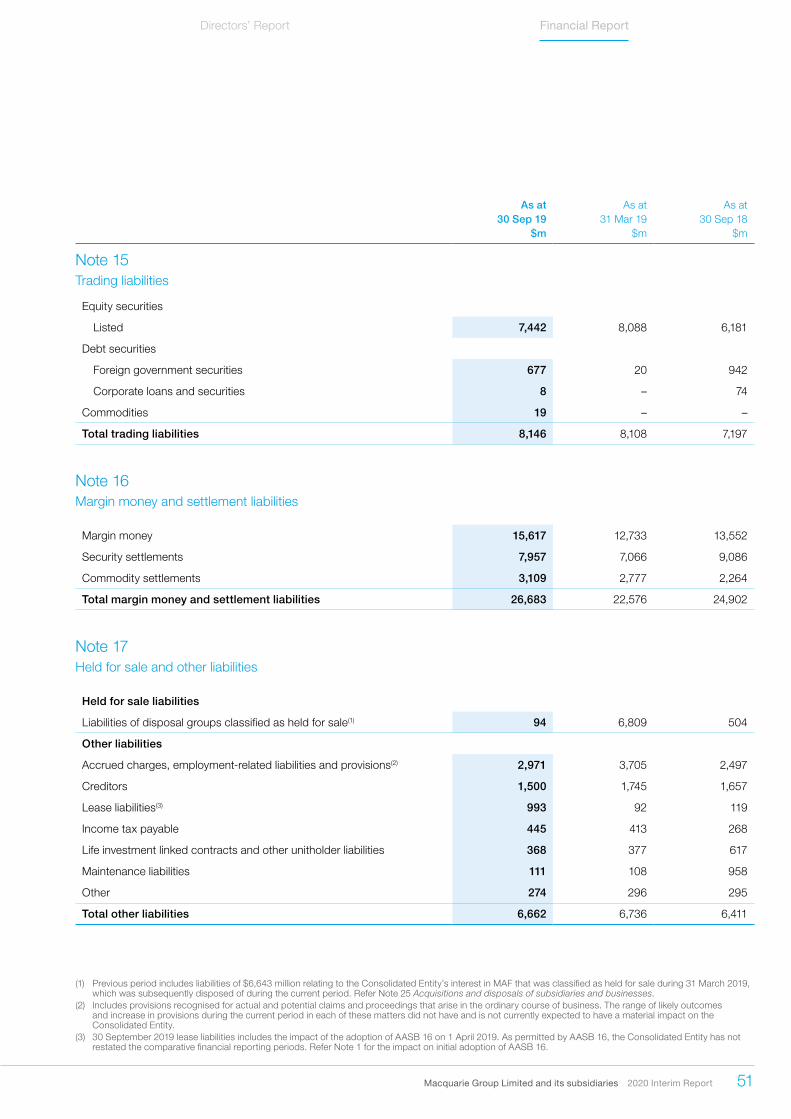
Macquarie Group Limited and its subsidiaries 2020 Interim Report 51
Directors’ Report Financial Report
As at As at As at30 Sep 19 31 Mar 19 30 Sep 18
$m $m $m
Note 15 Trading liabilities
Equity securities
Listed 7,442 8,088 6,181
Debt securities
Foreign government securities 677 20 942
Corporate loans and securities 8 – 74
Commodities 19 – –
Total trading liabilities 8,146 8,108 7,197
Note 16 Margin money and settlement liabilities
Margin money 15,617 12,733 13,552
Security settlements 7,957 7,066 9,086
Commodity settlements 3,109 2,777 2,264
Total margin money and settlement liabilities 26,683 22,576 24,902
Note 17 Held for sale and other liabilities
Held for sale liabilities
Liabilities of disposal groups classified as held for sale(1) 94 6,809 504
Other liabilities
Accrued charges, employment-related liabilities and provisions(2) 2,971 3,705 2,497
Creditors 1,500 1,745 1,657
Lease liabilities(3) 993 92 119
Income tax payable 445 413 268
Life investment linked contracts and other unitholder liabilities 368 377 617
Maintenance liabilities 111 108 958
Other 274 296 295
Total other liabilities 6,662 6,736 6,411
(1) Previous period includes liabilities of $6,643 million relating to the Consolidated Entity’s interest in MAF that was classified as held for sale during 31 March 2019, which was subsequently disposed of during the current period. Refer Note 25 Acquisitions and disposals of subsidiaries and businesses.
(2) Includes provisions recognised for actual and potential claims and proceedings that arise in the ordinary course of business. The range of likely outcomes and increase in provisions during the current period in each of these matters did not have and is not currently expected to have a material impact on the Consolidated Entity.
(3) 30 September 2019 lease liabilities includes the impact of the adoption of AASB 16 on 1 April 2019. As permitted by AASB 16, the Consolidated Entity has not restated the comparative financial reporting periods. Refer Note 1 for the impact on initial adoption of AASB 16.

52 Macquarie Group Limited and its subsidiaries 2020 Interim Report
Notes to the consolidated financial statementsFor the half-year ended 30 September 2019 continued
As at As at As at30 Sep 19 31 Mar 19 30 Sep 18
$m $m $m
Note 18 Debt issued
Bonds, negotiable certificates of deposit and commercial paper(1) 53,968 47,924 49,633
Structured notes(2) 2,102 2,264 2,032
Total debt issued(3),(4) 56,070 50,188 51,665
The Consolidated Entity has not had any defaults of principal, interest or other breaches with respect to its debt during the reported periods.
Reconciliation of debt issued by major currency(In Australian dollar equivalent)
United States dollar 30,997 30,756 31,113
Australian dollar 15,762 10,722 11,348
Euro 5,213 4,877 4,950
Japanese yen 1,180 1,079 1,023
Swiss franc 1,122 1,058 1,544
British pound 834 783 816
South African rand 255 288 276
Norwegian krone 166 164 170
Hong Kong dollar 156 148 126
Chinese renminbi 150 168 185
Korean won 113 114 114
Other 122 31 –
Total debt issued 56,070 50,188 51,665
(1) Includes $9,360 million (31 March 2019: $7,855 million; 30 September 2018: $8,115 million) payable to note holders and debt holders for which loan assets are held by consolidated SPEs and are available as security.
(2) Includes debt instruments on which the return is linked to commodities, equities, currencies, interest rates, other assets or credit risk of a counterparty.(3) The amount that would be contractually required to be paid at maturity to the holders of the debt issued measured at DFVTPL (Refer Note 23 Measurement
categories of financial instruments) for the Consolidated Entity is $2,682 million (31 March 2019: $3,246 million; 30 September 2018: $3,155 million). This amount is based on the final notional amount rather than the fair value.
(4) Includes cumulative fair value gain of $6 million (31 March 2019: $31 million gain; 30 September 2018: $9 million gain) due to changes in own credit risk on DFVTPL debt securities.
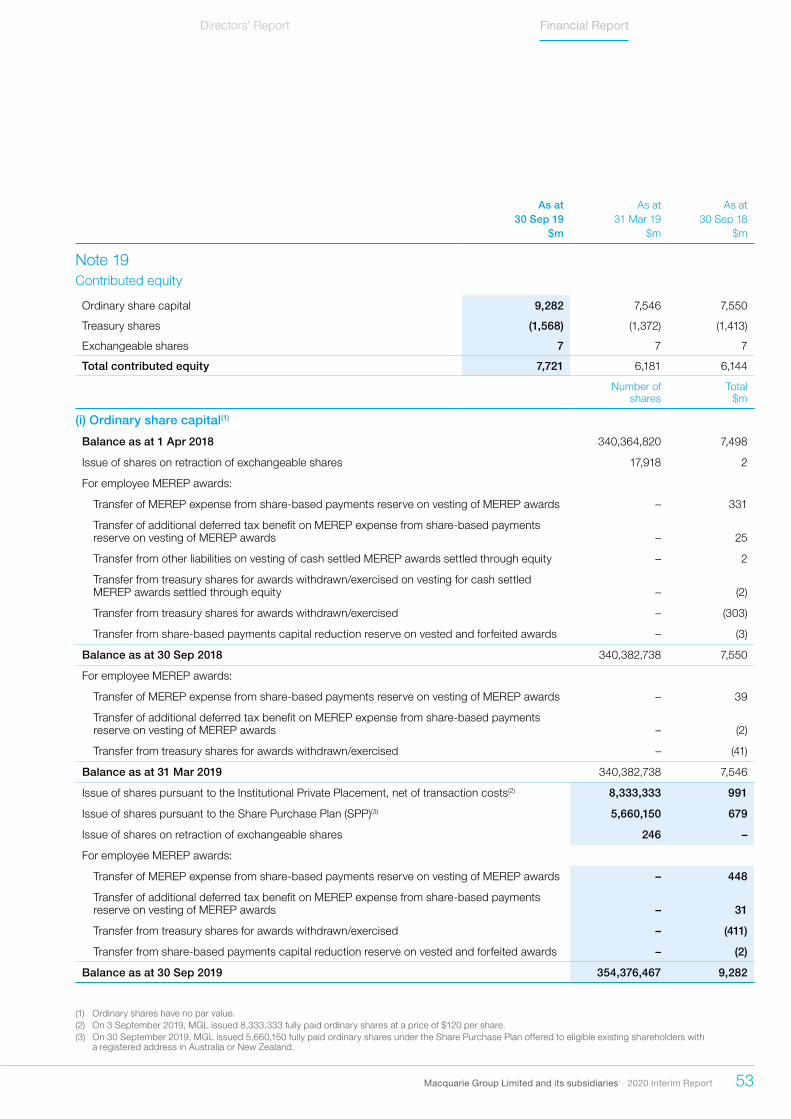
Macquarie Group Limited and its subsidiaries 2020 Interim Report 53
Directors’ Report Financial Report
As at As at As at30 Sep 19 31 Mar 19 30 Sep 18
$m $m $m
Note 19 Contributed equity
Ordinary share capital 9,282 7,546 7,550
Treasury shares (1,568) (1,372) (1,413)
Exchangeable shares 7 7 7
Total contributed equity 7,721 6,181 6,144
Number of shares
Total $m
(i) Ordinary share capital(1)
Balance as at 1 Apr 2018 340,364,820 7,498
Issue of shares on retraction of exchangeable shares 17,918 2
For employee MEREP awards:
Transfer of MEREP expense from share-based payments reserve on vesting of MEREP awards – 331
Transfer of additional deferred tax benefit on MEREP expense from share-based payments reserve on vesting of MEREP awards – 25
Transfer from other liabilities on vesting of cash settled MEREP awards settled through equity – 2
Transfer from treasury shares for awards withdrawn/exercised on vesting for cash settled MEREP awards settled through equity – (2)
Transfer from treasury shares for awards withdrawn/exercised – (303)
Transfer from share-based payments capital reduction reserve on vested and forfeited awards – (3)
Balance as at 30 Sep 2018 340,382,738 7,550
For employee MEREP awards:
Transfer of MEREP expense from share-based payments reserve on vesting of MEREP awards – 39
Transfer of additional deferred tax benefit on MEREP expense from share-based payments reserve on vesting of MEREP awards – (2)
Transfer from treasury shares for awards withdrawn/exercised – (41)
Balance as at 31 Mar 2019 340,382,738 7,546
Issue of shares pursuant to the Institutional Private Placement, net of transaction costs(2) 8,333,333 991
Issue of shares pursuant to the Share Purchase Plan (SPP)(3) 5,660,150 679
Issue of shares on retraction of exchangeable shares 246 –
For employee MEREP awards:
Transfer of MEREP expense from share-based payments reserve on vesting of MEREP awards – 448
Transfer of additional deferred tax benefit on MEREP expense from share-based payments reserve on vesting of MEREP awards – 31
Transfer from treasury shares for awards withdrawn/exercised – (411)
Transfer from share-based payments capital reduction reserve on vested and forfeited awards – (2)
Balance as at 30 Sep 2019 354,376,467 9,282
(1) Ordinary shares have no par value.(2) On 3 September 2019, MGL issued 8,333,333 fully paid ordinary shares at a price of $120 per share.(3) On 30 September 2019, MGL issued 5,660,150 fully paid ordinary shares under the Share Purchase Plan offered to eligible existing shareholders with
a registered address in Australia or New Zealand.
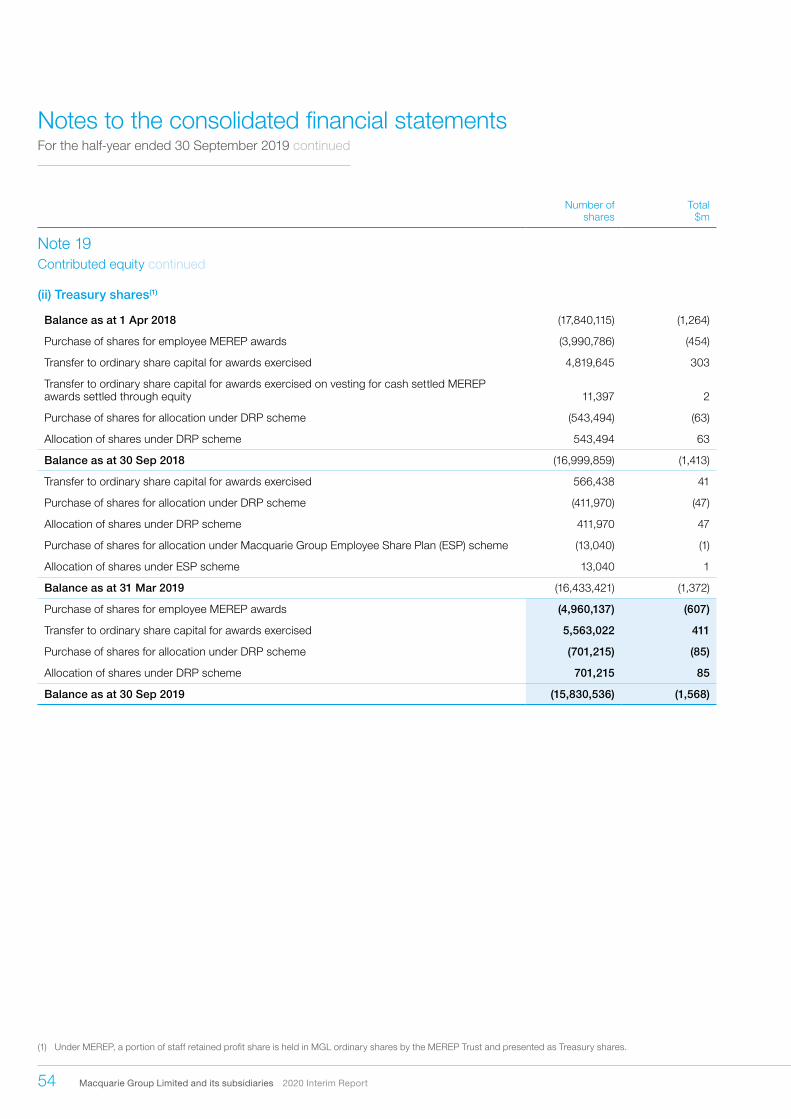
54 Macquarie Group Limited and its subsidiaries 2020 Interim Report
Notes to the consolidated financial statementsFor the half-year ended 30 September 2019 continued
Number of shares
Total $m
Note 19Contributed equity continued
(ii) Treasury shares(1)
Balance as at 1 Apr 2018 (17,840,115) (1,264)
Purchase of shares for employee MEREP awards (3,990,786) (454)
Transfer to ordinary share capital for awards exercised 4,819,645 303
Transfer to ordinary share capital for awards exercised on vesting for cash settled MEREP awards settled through equity 11,397 2
Purchase of shares for allocation under DRP scheme (543,494) (63)
Allocation of shares under DRP scheme 543,494 63
Balance as at 30 Sep 2018 (16,999,859) (1,413)
Transfer to ordinary share capital for awards exercised 566,438 41
Purchase of shares for allocation under DRP scheme (411,970) (47)
Allocation of shares under DRP scheme 411,970 47
Purchase of shares for allocation under Macquarie Group Employee Share Plan (ESP) scheme (13,040) (1)
Allocation of shares under ESP scheme 13,040 1
Balance as at 31 Mar 2019 (16,433,421) (1,372)
Purchase of shares for employee MEREP awards (4,960,137) (607)
Transfer to ordinary share capital for awards exercised 5,563,022 411
Purchase of shares for allocation under DRP scheme (701,215) (85)
Allocation of shares under DRP scheme 701,215 85
Balance as at 30 Sep 2019 (15,830,536) (1,568)
(1) Under MEREP, a portion of staff retained profit share is held in MGL ordinary shares by the MEREP Trust and presented as Treasury shares.
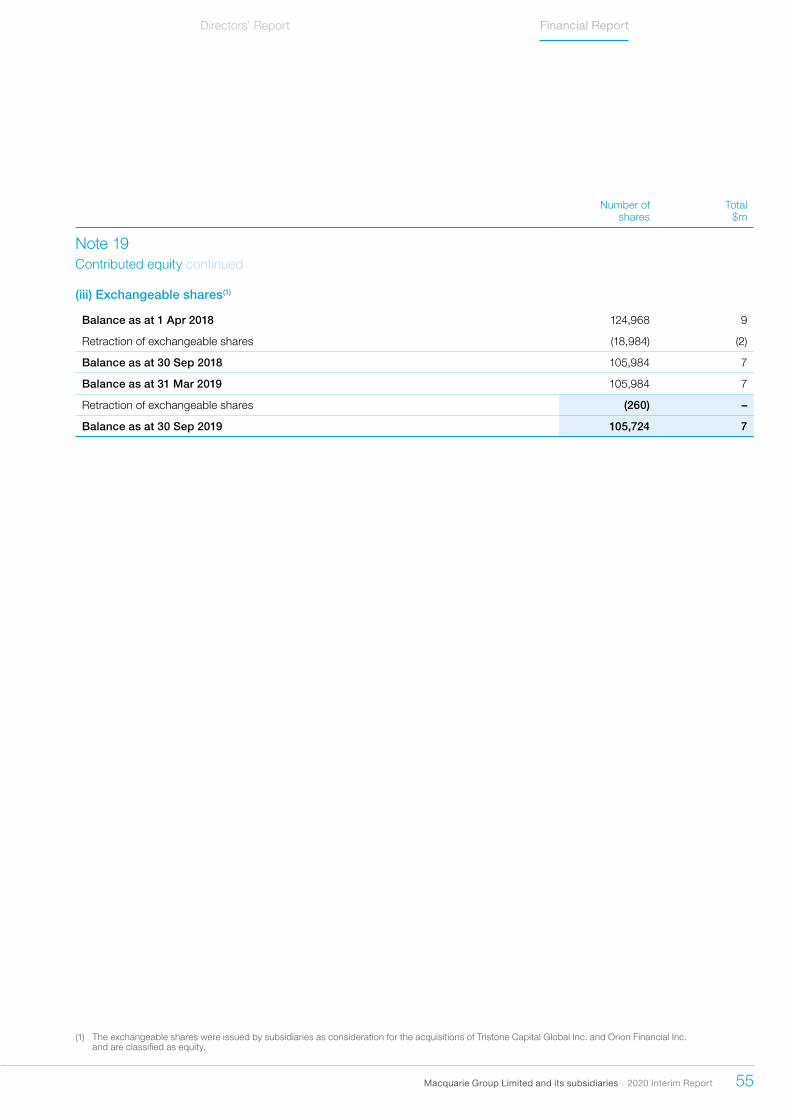
Macquarie Group Limited and its subsidiaries 2020 Interim Report 55
Directors’ Report Financial Report
Number of shares
Total $m
Note 19Contributed equity continued
(iii) Exchangeable shares(1)
Balance as at 1 Apr 2018 124,968 9
Retraction of exchangeable shares (18,984) (2)
Balance as at 30 Sep 2018 105,984 7
Balance as at 31 Mar 2019 105,984 7
Retraction of exchangeable shares (260) –
Balance as at 30 Sep 2019 105,724 7
(1) The exchangeable shares were issued by subsidiaries as consideration for the acquisitions of Tristone Capital Global Inc. and Orion Financial Inc. and are classified as equity.
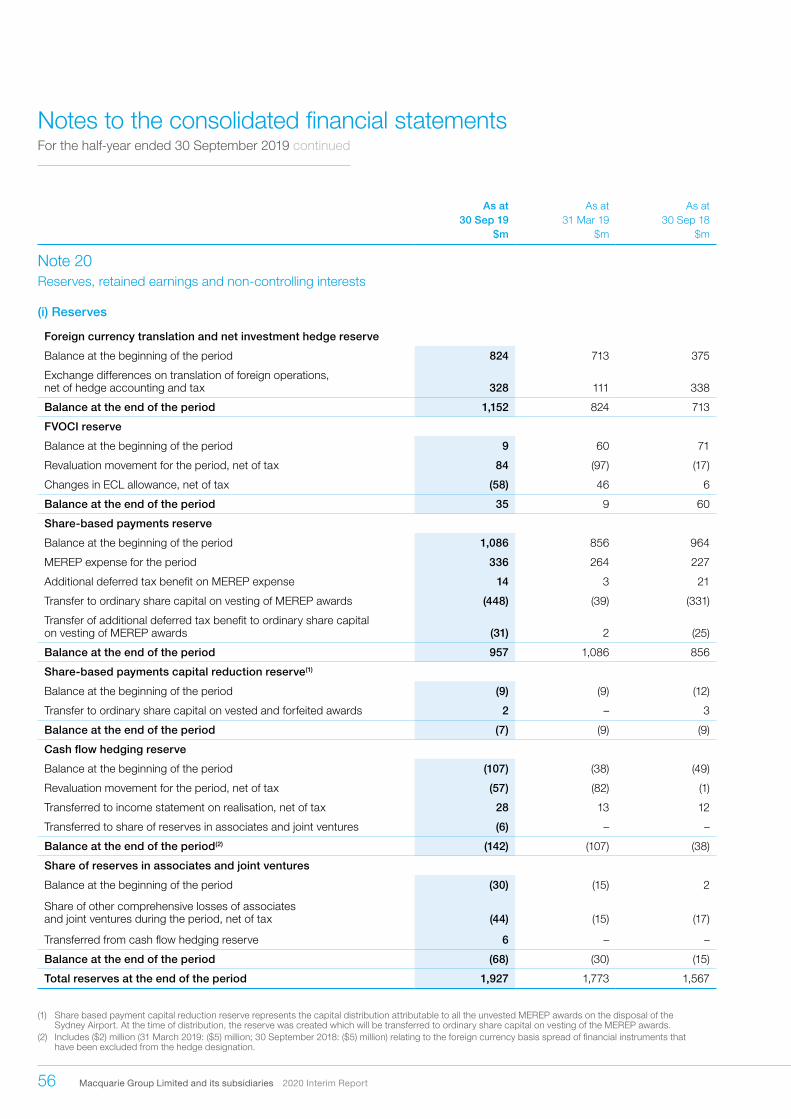
56 Macquarie Group Limited and its subsidiaries 2020 Interim Report
Notes to the consolidated financial statementsFor the half-year ended 30 September 2019 continued
As at As at As at30 Sep 19 31 Mar 19 30 Sep 18
$m $m $m
Note 20 Reserves, retained earnings and non-controlling interests
(i) Reserves
Foreign currency translation and net investment hedge reserve
Balance at the beginning of the period 824 713 375
Exchange differences on translation of foreign operations, net of hedge accounting and tax 328 111 338
Balance at the end of the period 1,152 824 713
FVOCI reserve
Balance at the beginning of the period 9 60 71
Revaluation movement for the period, net of tax 84 (97) (17)
Changes in ECL allowance, net of tax (58) 46 6
Balance at the end of the period 35 9 60
Share-based payments reserve
Balance at the beginning of the period 1,086 856 964
MEREP expense for the period 336 264 227
Additional deferred tax benefit on MEREP expense 14 3 21
Transfer to ordinary share capital on vesting of MEREP awards (448) (39) (331)
Transfer of additional deferred tax benefit to ordinary share capital on vesting of MEREP awards (31) 2 (25)
Balance at the end of the period 957 1,086 856
Share-based payments capital reduction reserve(1)
Balance at the beginning of the period (9) (9) (12)
Transfer to ordinary share capital on vested and forfeited awards 2 – 3
Balance at the end of the period (7) (9) (9)
Cash flow hedging reserve
Balance at the beginning of the period (107) (38) (49)
Revaluation movement for the period, net of tax (57) (82) (1)
Transferred to income statement on realisation, net of tax 28 13 12
Transferred to share of reserves in associates and joint ventures (6) – –
Balance at the end of the period(2) (142) (107) (38)
Share of reserves in associates and joint ventures
Balance at the beginning of the period (30) (15) 2
Share of other comprehensive losses of associates and joint ventures during the period, net of tax (44) (15) (17)
Transferred from cash flow hedging reserve 6 – –
Balance at the end of the period (68) (30) (15)
Total reserves at the end of the period 1,927 1,773 1,567
(1) Share based payment capital reduction reserve represents the capital distribution attributable to all the unvested MEREP awards on the disposal of the Sydney Airport. At the time of distribution, the reserve was created which will be transferred to ordinary share capital on vesting of the MEREP awards.
(2) Includes ($2) million (31 March 2019: ($5) million; 30 September 2018: ($5) million) relating to the foreign currency basis spread of financial instruments that have been excluded from the hedge designation.
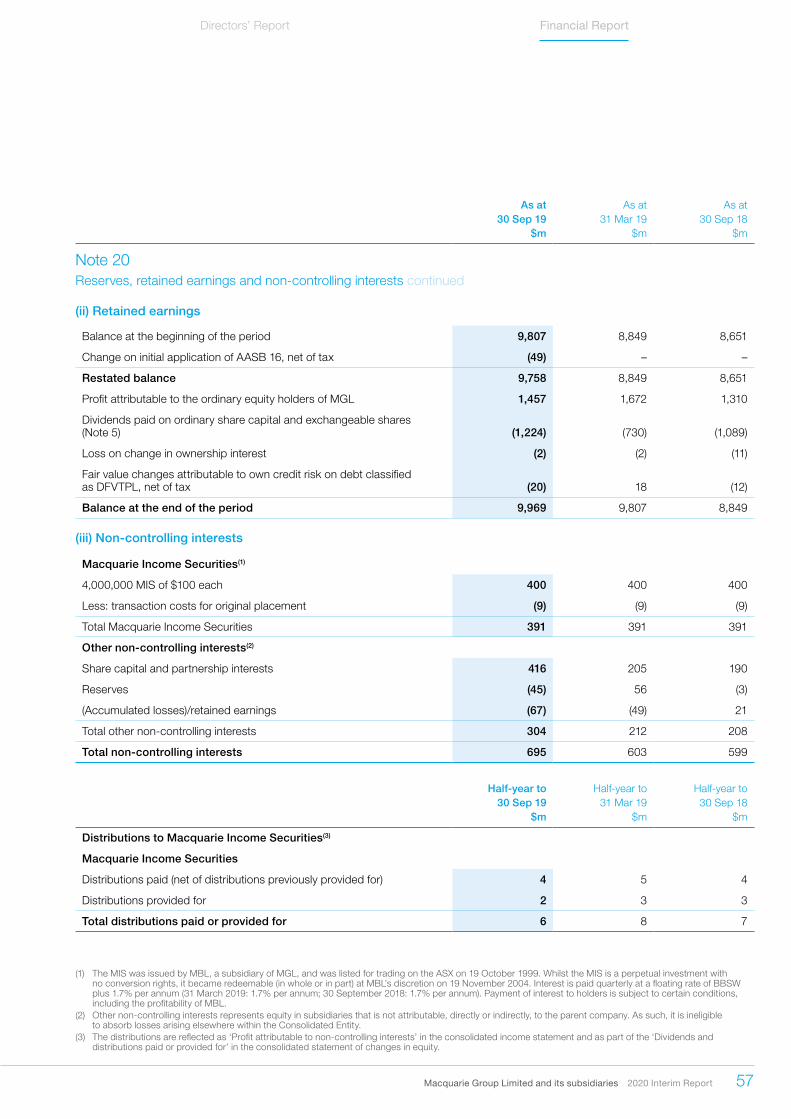
Macquarie Group Limited and its subsidiaries 2020 Interim Report 57
Directors’ Report Financial Report
As at As at As at30 Sep 19 31 Mar 19 30 Sep 18
$m $m $m
Note 20Reserves, retained earnings and non-controlling interests continued
(ii) Retained earnings
Balance at the beginning of the period 9,807 8,849 8,651
Change on initial application of AASB 16, net of tax (49) – –
Restated balance 9,758 8,849 8,651
Profit attributable to the ordinary equity holders of MGL 1,457 1,672 1,310
Dividends paid on ordinary share capital and exchangeable shares (Note 5) (1,224) (730) (1,089)
Loss on change in ownership interest (2) (2) (11)
Fair value changes attributable to own credit risk on debt classified as DFVTPL, net of tax (20) 18 (12)
Balance at the end of the period 9,969 9,807 8,849
(iii) Non-controlling interests
Macquarie Income Securities(1)
4,000,000 MIS of $100 each 400 400 400
Less: transaction costs for original placement (9) (9) (9)
Total Macquarie Income Securities 391 391 391
Other non-controlling interests(2)
Share capital and partnership interests 416 205 190
Reserves (45) 56 (3)
(Accumulated losses)/retained earnings (67) (49) 21
Total other non-controlling interests 304 212 208
Total non-controlling interests 695 603 599
Half-year to Half-year to Half-year to30 Sep 19 31 Mar 19 30 Sep 18
$m $m $m
Distributions to Macquarie Income Securities(3)
Macquarie Income Securities
Distributions paid (net of distributions previously provided for) 4 5 4
Distributions provided for 2 3 3
Total distributions paid or provided for 6 8 7
(1) The MIS was issued by MBL, a subsidiary of MGL, and was listed for trading on the ASX on 19 October 1999. Whilst the MIS is a perpetual investment with no conversion rights, it became redeemable (in whole or in part) at MBL’s discretion on 19 November 2004. Interest is paid quarterly at a floating rate of BBSW plus 1.7% per annum (31 March 2019: 1.7% per annum; 30 September 2018: 1.7% per annum). Payment of interest to holders is subject to certain conditions, including the profitability of MBL.
(2) Other non-controlling interests represents equity in subsidiaries that is not attributable, directly or indirectly, to the parent company. As such, it is ineligible to absorb losses arising elsewhere within the Consolidated Entity.
(3) The distributions are reflected as ‘Profit attributable to non-controlling interests’ in the consolidated income statement and as part of the ‘Dividends and distributions paid or provided for’ in the consolidated statement of changes in equity.

58 Macquarie Group Limited and its subsidiaries 2020 Interim Report
Notes to the consolidated financial statementsFor the half-year ended 30 September 2019 continued
As at As at As at30 Sep 19 31 Mar 19 30 Sep 18
$m $m $m
Note 21 Notes to the consolidated statement of cash flows
(i) Reconciliation of cash and cash equivalents
Cash and cash equivalents at the end of the financial period are reflected in the related items in the consolidated statement of financial position as follows:
Cash and bank balances(1),(2) 9,088 9,488 9,307
Trading assets(3) 101 784 763
Financial investments(4),(5) 624 792 394
Margin money(6) 2,676 2,816 3,600
Held for sale assets(7) 11 248 42
Cash and cash equivalents at the end of the period 12,500 14,128 14,106
(1) Cash and bank balances includes cash at bank, overnight cash at bank and other loans to banks. Cash and bank balances includes $3,134 million (half-year to 31 March 2019: $3,205 million, half-year to 30 September 2018: $2,941 million) of certain funds received from clients, which are segregated from the Consolidated Entity’s own funds and thus restricted from use.
(2) Cash and bank balances also includes $444 million (half-year to 31 March 2019: $361 million, half-year to 30 September 2018: $561 million) of balances held by consolidated special purpose vehicles that are restricted from use, balances required to be maintained with central banks and other regulatory authorities, balances dedicated to servicing certain debt obligations and other similarly restricted balances.
(3) Trading assets includes certificates of deposit, bank bills, treasury notes and other short-term debt securities with a maturity of three months or less from the date of acquisition. As at 30 September 2019, no amounts within the trading assets related to certain funds received from clients, which are segregated from the Consolidated Entity’s own funds and thus restricted from use (half-year to 31 March 2019: $702 million, half-year to 30 September 2018: $690 million).
(4) Financial investments also includes short-term debt securities with a maturity of three months or less from the date of acquisition. Financial investment also includes $266 million (half-year to 31 March 2019: $336 million, half-year to 30 September 2018: $103 million) of balances held in countries where remittance of cash outside of the country is restricted.
(5) Financial investments have been adjusted to exclude certain liquid financial investments with a residual maturity of three months or less at the balance date but whose maturity exceeded three months at the date of acquisition. Comparatives have been updated to conform to current period presentation.
(6) Margin money represents certain cash collateral placed with financial institution counterparties in respect of derivative positions. Of these balances, $1,498 million (31 March 2019: $1,388 million, 30 September 2018: $1,317 million) relates to funds received from clients, which are segregated from the Consolidated Entity’s own funds and thus restricted from use.
(7) Includes cash and cash equivalents held as a part of assets of disposal groups held for sale.
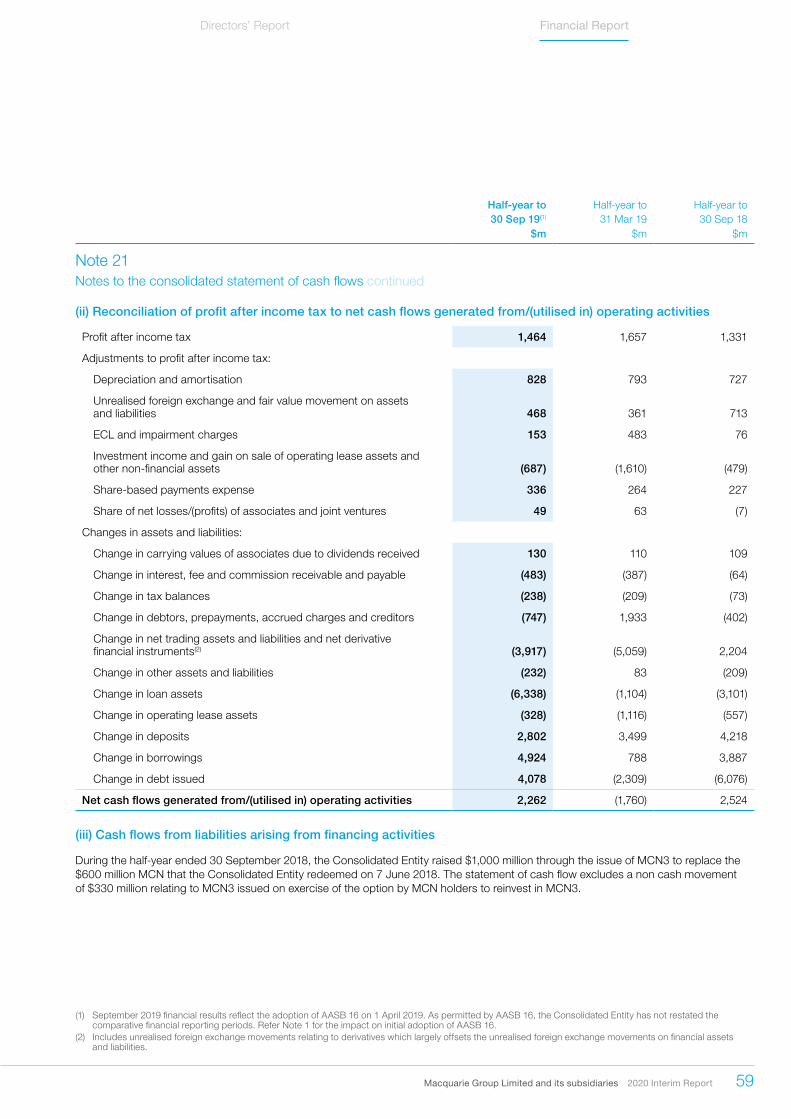
Macquarie Group Limited and its subsidiaries 2020 Interim Report 59
Directors’ Report Financial Report
Half-year to Half-year to Half-year to30 Sep 19(1) 31 Mar 19 30 Sep 18
$m $m $m
Note 21Notes to the consolidated statement of cash flows continued
(ii) Reconciliation of profit after income tax to net cash flows generated from/(utilised in) operating activities
Profit after income tax 1,464 1,657 1,331
Adjustments to profit after income tax:
Depreciation and amortisation 828 793 727
Unrealised foreign exchange and fair value movement on assets and liabilities 468 361 713
ECL and impairment charges 153 483 76
Investment income and gain on sale of operating lease assets and other non-financial assets (687) (1,610) (479)
Share-based payments expense 336 264 227
Share of net losses/(profits) of associates and joint ventures 49 63 (7)
Changes in assets and liabilities:
Change in carrying values of associates due to dividends received 130 110 109
Change in interest, fee and commission receivable and payable (483) (387) (64)
Change in tax balances (238) (209) (73)
Change in debtors, prepayments, accrued charges and creditors (747) 1,933 (402)
Change in net trading assets and liabilities and net derivative financial instruments(2) (3,917) (5,059) 2,204
Change in other assets and liabilities (232) 83 (209)
Change in loan assets (6,338) (1,104) (3,101)
Change in operating lease assets (328) (1,116) (557)
Change in deposits 2,802 3,499 4,218
Change in borrowings 4,924 788 3,887
Change in debt issued 4,078 (2,309) (6,076)
Net cash flows generated from/(utilised in) operating activities 2,262 (1,760) 2,524
(iii) Cash flows from liabilities arising from financing activities
During the half-year ended 30 September 2018, the Consolidated Entity raised $1,000 million through the issue of MCN3 to replace the $600 million MCN that the Consolidated Entity redeemed on 7 June 2018. The statement of cash flow excludes a non cash movement of $330 million relating to MCN3 issued on exercise of the option by MCN holders to reinvest in MCN3.
(1) September 2019 financial results reflect the adoption of AASB 16 on 1 April 2019. As permitted by AASB 16, the Consolidated Entity has not restated the comparative financial reporting periods. Refer Note 1 for the impact on initial adoption of AASB 16.
(2) Includes unrealised foreign exchange movements relating to derivatives which largely offsets the unrealised foreign exchange movements on financial assets and liabilities.

60 Macquarie Group Limited and its subsidiaries 2020 Interim Report
Notes to the consolidated financial statementsFor the half-year ended 30 September 2019 continued
As at As at As at30 Sep 19 31 Mar 19 30 Sep 18
$m $m $m
Note 22 Contingent liabilities and commitments
Contingent liabilities exist in respect of:
Letters of credit 1,185 1,085 893
Guarantees 593 213 182
Indemnities 556 469 209
Performance related contingents 296 291 245
Total contingent liabilities(1),(2) 2,630 2,058 1,529
Commitments exist in respect of:
Undrawn credit facilities and securities commitments(3),(4),(5),(6) 14,791 10,518 10,769
Property, plant and equipment and other assets(7),(8) 2,114 3,472 3,587
Total commitments 16,905 13,990 14,356
Total contingent liabilities and commitments 19,535 16,048 15,885
(1) Contingent liabilities exist in respect of actual and potential claims and proceedings that arise in the conduct of the Consolidated Entity’s business. In the event it is likely that economic outflow of resources is probable and can be reliably measured then a liability is recognised, and the exposure is excluded from the contingent liabilities above. Other than those recognised liabilities, the Consolidated Entity is currently not engaged in any litigation or claim which is likely to have a material adverse effect on the Consolidated Entity’s business, financial condition or performance.
(2) It is not practicable to ascertain the timing of any outflow and the possibility of any reimbursement related to these contingent liabilities.(3) Undrawn credit facilities are irrevocably extended to clients. These amounts include fully or partially undrawn commitments that are legally binding and cannot be
unconditionally cancelled by the Consolidated Entity. Securities underwriting includes firm commitments to underwrite debt and equity securities issuances and private equity commitments.
(4) Includes $927 million (31 March 2019: $815 million; 30 September 2018: $826 million) in undrawn facilities where the loan and further commitment will be assigned to a third-party post first drawdown.
(5) Includes $1,017 million (31 March 2019: $1,038 million; 30 September 2018: $1,092 million) for certain contractually irrevocable mortgage related facilities which have been reassessed to be included in the comparative previous reporting periods.
(6) Includes $720 million of equity commitment to an associate of the Consolidated Entity.(7) Includes $261 million of commitment related to the acquisition of management rights in a mutual fund from Foresters Financial Holding Company. The commitment
was settled subsequent to 30 September 2019.(8) Previous period (31 March 2019: $1,475 million; 30 September 2018: $1,450 million) includes commitments for the purchase of assets relating to the MAF
business which was deconsolidated during the current period. Refer Note 25 Acquisitions and disposals of subsidiaries and businesses for details.

Macquarie Group Limited and its subsidiaries 2020 Interim Report 61
Directors’ Report Financial Report
Note 23Measurement categories of financial instruments
The following table contains information relating to the measurement categories of financial instruments of the Consolidated Entity. The methods and significant assumptions that have been applied in determining the fair values of financial instruments are disclosed in Note 24 Fair values of financial assets and liabilities.
FINANCIAL INSTRUMENTS CARRIED AT FAIR VALUE OF FINANCIAL INSTRUMENTS
CARRIED ATFAIR VALUE
Amortised cost
Non- financial
instruments
Statement of financial
position totalHFT DFVTPL FVTPL FVOCI
Fair value
Amortised cost
$m $m $m $m $m $m $m $m $m
Assets AS AT 30 SEPTEMBER 2019
Cash and bank balances – – – – 9,579 – 9,579 – 9,579Cash collateral on securities borrowed and reverse repurchase agreements – – 19,139 – 11,062 – 30,201 19,139 11,062Trading assets(1) 24,230 – – – – – 24,230 24,230 –Margin money and settlement assets – – 2,355 – 17,957 – 20,312 2,355 17,957Derivative assets(2) 18,221 – – – – – 18,221 18,221 –Financial investments
Equity – – 1,313 – – – 1,313 1,313 –Debt – – 911 5,713 – – 6,624 6,624 –
Held for sale assets(3) – – 36 8 15 549 608 44 15Other assets(3) – 140 426 – 1,804 3,255 5,625 566 1,804Loan assets(4) – 11 1,329 609 83,117 – 85,066 1,949 83,630Property, plant and equipment – – – – – 5,471 5,471 – –Interest in associates and joint ventures
Equity interests – – – – – 7,148 7,148 – –Loans to associates and joint ventures(4) – – 39 207 1,106 – 1,352 246 1,108
Intangible assets – – – – – 2,666 2,666 – –Deferred tax assets – – – – – 1,079 1,079 – –Total assets 42,451 151 25,548 6,537 124,640 20,168 219,495 74,687 125,155LiabilitiesCash collateral on securities lent and repurchase agreements – 3,023 – – 2,780 – 5,803 3,023 2,780Trading liabilities 8,146 – – – – – 8,146 8,146 –Margin money and settlement liabilities – – – – 26,683 – 26,683 – 26,683Derivative liabilities(2) 14,514 – – – – – 14,514 14,514 –Deposits – – – – 59,042 – 59,042 – 59,096Held for sale liabilities(5) – – – – 67 27 94 – 67Other liabilities(5) – 456 – – 2,299 3,907 6,662 456 1,306Borrowings – – – – 14,626 – 14,626 – 14,687Debt issued(4) – 2,208 – – 53,862 – 56,070 2,208 54,776Deferred tax liabilities – – – – – 297 297 – –Loan capital(4) – – – – 7,246 – 7,246 – 7,492Total liabilities 22,660 5,687 – – 166,605 4,231 199,183 28,347 166,887
(1) Includes commodities carried at fair value which are held for trading purposes.(2) All derivatives, including those held for hedging purposes, are classified as HFT.(3) Non-financial assets primarily represent non-financial assets of disposal groups and equity interests in associates and joint ventures that have been classified
as held for sale, fee related contract assets, prepayments, tax receivable, inventory held for sale and investment property.(4) Items measured at amortised cost includes, where applicable, hedge accounting adjustments for the designated hedged risks.(5) Non-financial liabilities primarily represent non-financial liabilities of disposal groups classified as held for sale, accrued charges, employee related provisions,
retained director profit share, tax payable, income received in advance, aircraft and rail maintenance liabilities. The fair value of other liabilities excludes the fair value of lease liabilities.
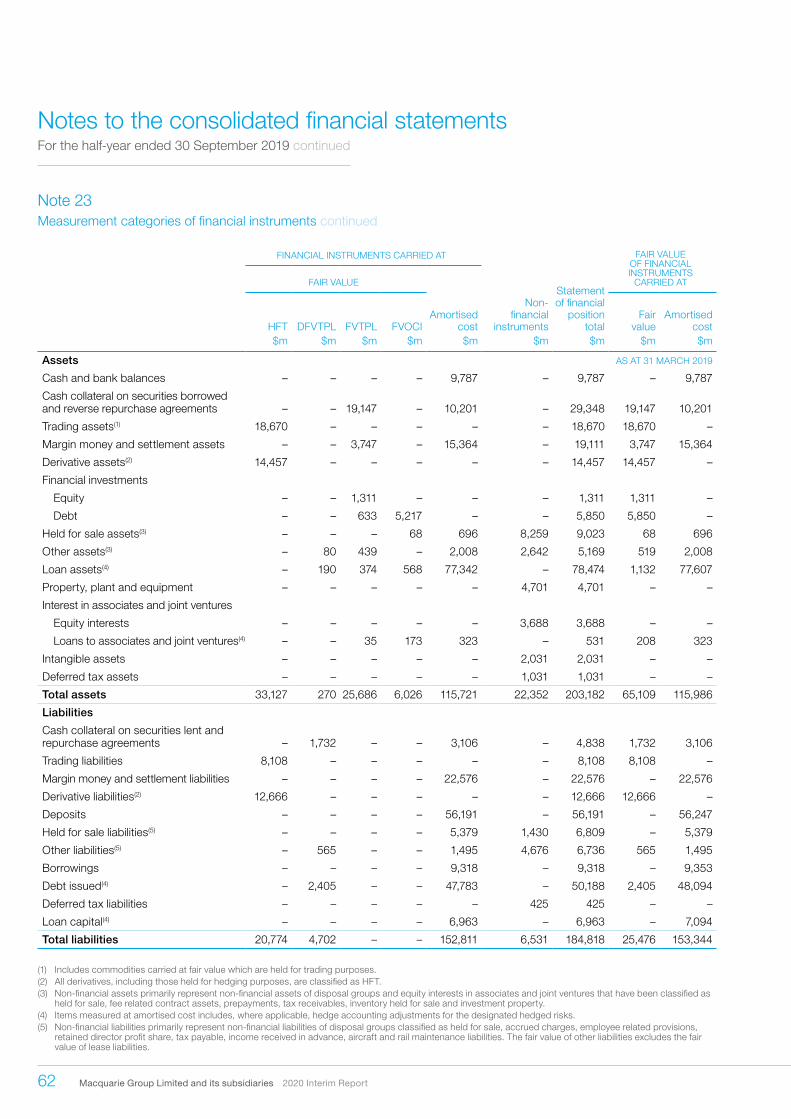
62 Macquarie Group Limited and its subsidiaries 2020 Interim Report
Notes to the consolidated financial statementsFor the half-year ended 30 September 2019 continued
Note 23Measurement categories of financial instruments continued
FINANCIAL INSTRUMENTS CARRIED AT FAIR VALUE OF FINANCIAL INSTRUMENTS
CARRIED ATFAIR VALUEStatement of financial
position totalHFT DFVTPL FVTPL FVOCI
Amortised cost
Non- financial
instrumentsFair
valueAmortised
cost$m $m $m $m $m $m $m $m $m
Assets AS AT 31 MARCH 2019
Cash and bank balances – – – – 9,787 – 9,787 – 9,787
Cash collateral on securities borrowed and reverse repurchase agreements – – 19,147 – 10,201 – 29,348 19,147 10,201
Trading assets(1) 18,670 – – – – – 18,670 18,670 –
Margin money and settlement assets – – 3,747 – 15,364 – 19,111 3,747 15,364
Derivative assets(2) 14,457 – – – – – 14,457 14,457 –
Financial investments
Equity – – 1,311 – – – 1,311 1,311 –
Debt – – 633 5,217 – – 5,850 5,850 –
Held for sale assets(3) – – – 68 696 8,259 9,023 68 696
Other assets(3) – 80 439 – 2,008 2,642 5,169 519 2,008
Loan assets(4) – 190 374 568 77,342 – 78,474 1,132 77,607
Property, plant and equipment – – – – – 4,701 4,701 – –
Interest in associates and joint ventures
Equity interests – – – – – 3,688 3,688 – –
Loans to associates and joint ventures(4) – – 35 173 323 – 531 208 323
Intangible assets – – – – – 2,031 2,031 – –
Deferred tax assets – – – – – 1,031 1,031 – –
Total assets 33,127 270 25,686 6,026 115,721 22,352 203,182 65,109 115,986
Liabilities
Cash collateral on securities lent and repurchase agreements – 1,732 – – 3,106 – 4,838 1,732 3,106
Trading liabilities 8,108 – – – – – 8,108 8,108 –
Margin money and settlement liabilities – – – – 22,576 – 22,576 – 22,576
Derivative liabilities(2) 12,666 – – – – – 12,666 12,666 –
Deposits – – – – 56,191 – 56,191 – 56,247
Held for sale liabilities(5) – – – – 5,379 1,430 6,809 – 5,379
Other liabilities(5) – 565 – – 1,495 4,676 6,736 565 1,495
Borrowings – – – – 9,318 – 9,318 – 9,353
Debt issued(4) – 2,405 – – 47,783 – 50,188 2,405 48,094
Deferred tax liabilities – – – – – 425 425 – –
Loan capital(4) – – – – 6,963 – 6,963 – 7,094
Total liabilities 20,774 4,702 – – 152,811 6,531 184,818 25,476 153,344
(1) Includes commodities carried at fair value which are held for trading purposes.(2) All derivatives, including those held for hedging purposes, are classified as HFT.(3) Non-financial assets primarily represent non-financial assets of disposal groups and equity interests in associates and joint ventures that have been classified as
held for sale, fee related contract assets, prepayments, tax receivables, inventory held for sale and investment property.(4) Items measured at amortised cost includes, where applicable, hedge accounting adjustments for the designated hedged risks.(5) Non-financial liabilities primarily represent non-financial liabilities of disposal groups classified as held for sale, accrued charges, employee related provisions,
retained director profit share, tax payable, income received in advance, aircraft and rail maintenance liabilities. The fair value of other liabilities excludes the fair value of lease liabilities.
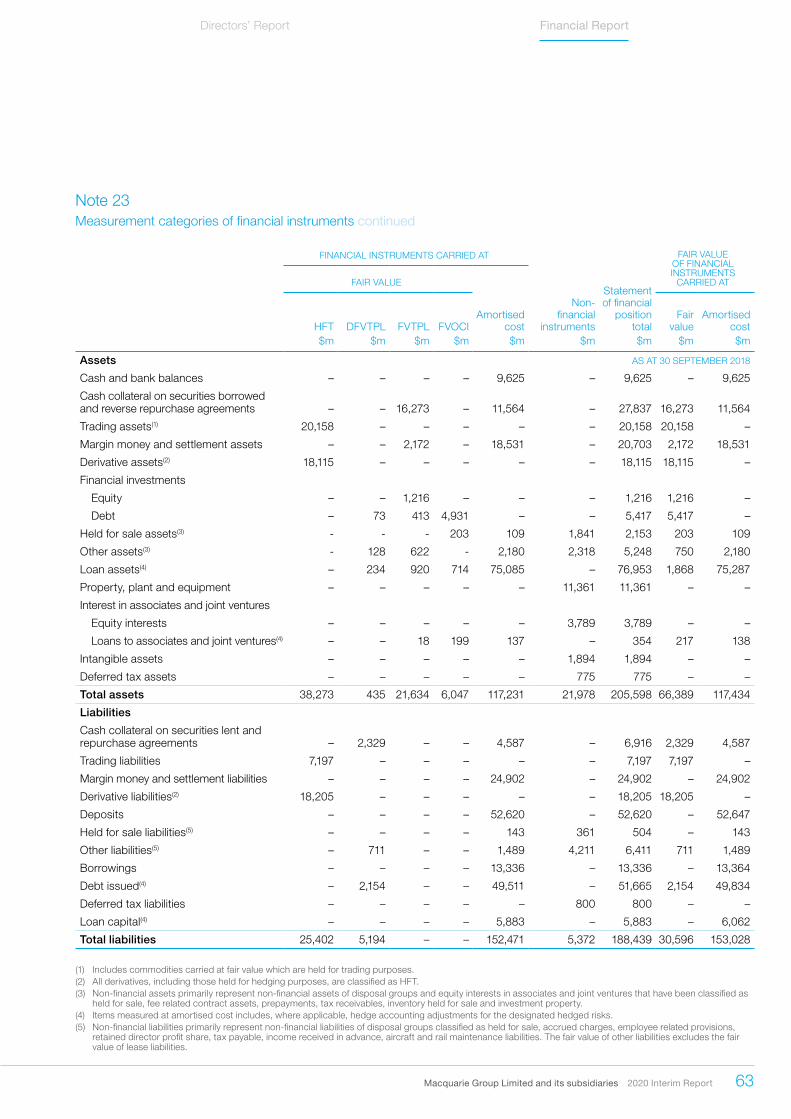
Macquarie Group Limited and its subsidiaries 2020 Interim Report 63
Directors’ Report Financial Report
Note 23Measurement categories of financial instruments continued
FINANCIAL INSTRUMENTS CARRIED AT FAIR VALUE OF FINANCIAL INSTRUMENTS
CARRIED ATFAIR VALUEStatement of financial
position totalHFT DFVTPL FVTPL FVOCI
Amortised cost
Non- financial
instrumentsFair
valueAmortised
cost$m $m $m $m $m $m $m $m $m
Assets AS AT 30 SEPTEMBER 2018
Cash and bank balances – – – – 9,625 – 9,625 – 9,625
Cash collateral on securities borrowed and reverse repurchase agreements – – 16,273 – 11,564 – 27,837 16,273 11,564
Trading assets(1) 20,158 – – – – – 20,158 20,158 –
Margin money and settlement assets – – 2,172 – 18,531 – 20,703 2,172 18,531
Derivative assets(2) 18,115 – – – – – 18,115 18,115 –
Financial investments
Equity – – 1,216 – – – 1,216 1,216 –
Debt – 73 413 4,931 – – 5,417 5,417 –
Held for sale assets(3) - - - 203 109 1,841 2,153 203 109
Other assets(3) - 128 622 - 2,180 2,318 5,248 750 2,180
Loan assets(4) – 234 920 714 75,085 – 76,953 1,868 75,287
Property, plant and equipment – – – – – 11,361 11,361 – –
Interest in associates and joint ventures
Equity interests – – – – – 3,789 3,789 – –
Loans to associates and joint ventures(4) – – 18 199 137 – 354 217 138
Intangible assets – – – – – 1,894 1,894 – –
Deferred tax assets – – – – – 775 775 – –
Total assets 38,273 435 21,634 6,047 117,231 21,978 205,598 66,389 117,434
Liabilities
Cash collateral on securities lent and repurchase agreements – 2,329 – – 4,587 – 6,916 2,329 4,587
Trading liabilities 7,197 – – – – – 7,197 7,197 –
Margin money and settlement liabilities – – – – 24,902 – 24,902 – 24,902
Derivative liabilities(2) 18,205 – – – – – 18,205 18,205 –
Deposits – – – – 52,620 – 52,620 – 52,647
Held for sale liabilities(5) – – – – 143 361 504 – 143
Other liabilities(5) – 711 – – 1,489 4,211 6,411 711 1,489
Borrowings – – – – 13,336 – 13,336 – 13,364
Debt issued(4) – 2,154 – – 49,511 – 51,665 2,154 49,834
Deferred tax liabilities – – – – – 800 800 – –
Loan capital(4) – – – – 5,883 – 5,883 – 6,062
Total liabilities 25,402 5,194 – – 152,471 5,372 188,439 30,596 153,028
(1) Includes commodities carried at fair value which are held for trading purposes.(2) All derivatives, including those held for hedging purposes, are classified as HFT.(3) Non-financial assets primarily represent non-financial assets of disposal groups and equity interests in associates and joint ventures that have been classified as
held for sale, fee related contract assets, prepayments, tax receivables, inventory held for sale and investment property.(4) Items measured at amortised cost includes, where applicable, hedge accounting adjustments for the designated hedged risks.(5) Non-financial liabilities primarily represent non-financial liabilities of disposal groups classified as held for sale, accrued charges, employee related provisions,
retained director profit share, tax payable, income received in advance, aircraft and rail maintenance liabilities. The fair value of other liabilities excludes the fair value of lease liabilities.
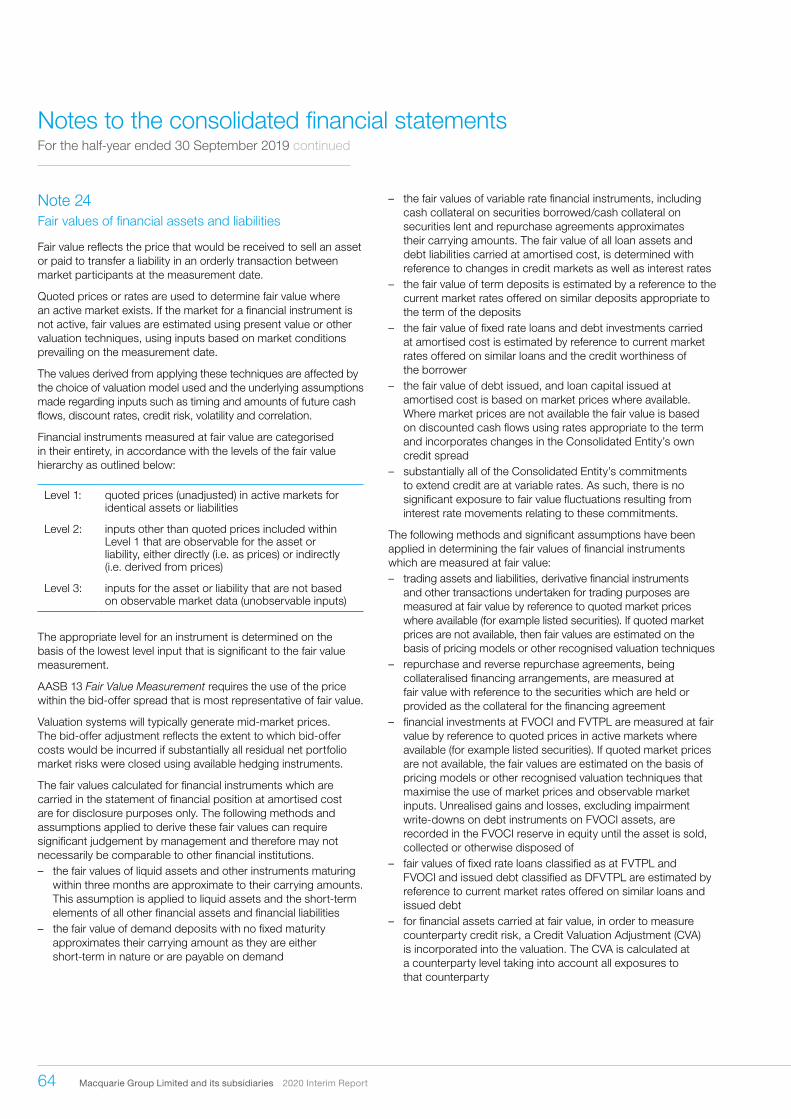
64 Macquarie Group Limited and its subsidiaries 2020 Interim Report
Notes to the consolidated financial statementsFor the half-year ended 30 September 2019 continued
Note 24 Fair values of financial assets and liabilities
Fair value reflects the price that would be received to sell an asset or paid to transfer a liability in an orderly transaction between market participants at the measurement date.
Quoted prices or rates are used to determine fair value where an active market exists. If the market for a financial instrument is not active, fair values are estimated using present value or other valuation techniques, using inputs based on market conditions prevailing on the measurement date.
The values derived from applying these techniques are affected by the choice of valuation model used and the underlying assumptions made regarding inputs such as timing and amounts of future cash flows, discount rates, credit risk, volatility and correlation.
Financial instruments measured at fair value are categorised in their entirety, in accordance with the levels of the fair value hierarchy as outlined below:
Level 1: quoted prices (unadjusted) in active markets for identical assets or liabilities
Level 2: inputs other than quoted prices included within Level 1 that are observable for the asset or liability, either directly (i.e. as prices) or indirectly (i.e. derived from prices)
Level 3: inputs for the asset or liability that are not based on observable market data (unobservable inputs)
The appropriate level for an instrument is determined on the basis of the lowest level input that is significant to the fair value measurement.
AASB 13 Fair Value Measurement requires the use of the price within the bid-offer spread that is most representative of fair value.
Valuation systems will typically generate mid-market prices. The bid-offer adjustment reflects the extent to which bid-offer costs would be incurred if substantially all residual net portfolio market risks were closed using available hedging instruments.
The fair values calculated for financial instruments which are carried in the statement of financial position at amortised cost are for disclosure purposes only. The following methods and assumptions applied to derive these fair values can require significant judgement by management and therefore may not necessarily be comparable to other financial institutions. – the fair values of liquid assets and other instruments maturing
within three months are approximate to their carrying amounts. This assumption is applied to liquid assets and the short-term elements of all other financial assets and financial liabilities
– the fair value of demand deposits with no fixed maturity approximates their carrying amount as they are either short-term in nature or are payable on demand
– the fair values of variable rate financial instruments, including cash collateral on securities borrowed/cash collateral on securities lent and repurchase agreements approximates their carrying amounts. The fair value of all loan assets and debt liabilities carried at amortised cost, is determined with reference to changes in credit markets as well as interest rates
– the fair value of term deposits is estimated by a reference to the current market rates offered on similar deposits appropriate to the term of the deposits
– the fair value of fixed rate loans and debt investments carried at amortised cost is estimated by reference to current market rates offered on similar loans and the credit worthiness of the borrower
– the fair value of debt issued, and loan capital issued at amortised cost is based on market prices where available. Where market prices are not available the fair value is based on discounted cash flows using rates appropriate to the term and incorporates changes in the Consolidated Entity’s own credit spread
– substantially all of the Consolidated Entity’s commitments to extend credit are at variable rates. As such, there is no significant exposure to fair value fluctuations resulting from interest rate movements relating to these commitments.
The following methods and significant assumptions have been applied in determining the fair values of financial instruments which are measured at fair value: – trading assets and liabilities, derivative financial instruments
and other transactions undertaken for trading purposes are measured at fair value by reference to quoted market prices where available (for example listed securities). If quoted market prices are not available, then fair values are estimated on the basis of pricing models or other recognised valuation techniques
– repurchase and reverse repurchase agreements, being collateralised financing arrangements, are measured at fair value with reference to the securities which are held or provided as the collateral for the financing agreement
– financial investments at FVOCI and FVTPL are measured at fair value by reference to quoted prices in active markets where available (for example listed securities). If quoted market prices are not available, the fair values are estimated on the basis of pricing models or other recognised valuation techniques that maximise the use of market prices and observable market inputs. Unrealised gains and losses, excluding impairment write-downs on debt instruments on FVOCI assets, are recorded in the FVOCI reserve in equity until the asset is sold, collected or otherwise disposed of
– fair values of fixed rate loans classified as at FVTPL and FVOCI and issued debt classified as DFVTPL are estimated by reference to current market rates offered on similar loans and issued debt
– for financial assets carried at fair value, in order to measure counterparty credit risk, a Credit Valuation Adjustment (CVA) is incorporated into the valuation. The CVA is calculated at a counterparty level taking into account all exposures to that counterparty

Macquarie Group Limited and its subsidiaries 2020 Interim Report 65
Directors’ Report Financial Report
Note 24Fair values of financial assets and liabilities continued
– for financial liabilities carried at fair value, in order to measure the Consolidated Entity’s own credit risk, a Debit Valuation Adjustment (DVA) is incorporated into the valuations
– the Consolidated Entity has incorporated market implied funding costs for uncollateralised derivative positions as a Funding Valuation Adjustment (FVA). FVA is determined by calculating the net expected exposures at a counterparty level and applying the Consolidated Entity’s internal Treasury lending rates as an input into the calculation. The approach takes into account the PD of each counterparty, as well as any mandatory break clauses.
Where valuation techniques are used to determine fair values, they are validated and periodically reviewed by qualified personnel independent of the area that created them. All models are certified before they are used, and models are calibrated periodically to test that outputs reflect prices from observable current market transactions in the same instrument or other available observable market data.
To the extent possible, models use only observable market data (for example OTC derivatives), however management is required to make assumptions for certain inputs that are not supported by prices from observable current market transactions in the same instrument such as volatility and correlation.

66 Macquarie Group Limited and its subsidiaries 2020 Interim Report
Notes to the consolidated financial statementsFor the half-year ended 30 September 2019 continued
Note 24Fair values of financial assets and liabilities continued
The following table summarises the levels of the fair value hierarchy for financial assets and liabilities held at amortised cost:
Level 1 Level 2 Level 3 Total$m $m $m $m
Assets AS AT 30 SEPTEMBER 2019
Cash and bank balances 9,579 – – 9,579
Cash collateral on securities borrowed and reverse repurchase agreements – 11,062 – 11,062
Margin money and settlement assets 7,281 10,676 – 17,957
Held for sale and other assets – 1,819 – 1,819
Loan assets – 6,894 76,736 83,630
Loans to associates and joint ventures – – 1,108 1,108
Total assets 16,860 30,451 77,844 125,155
Liabilities
Cash collateral on securities lent and repurchase agreements – 2,780 – 2,780
Margin money and settlement liabilities 15,694 10,989 – 26,683
Deposits 46,455 12,641 – 59,096
Held for sale and other liabilities(1) – 1,373 – 1,373
Borrowings 185 13,772 730 14,687
Debt issued – 46,471 8,305 54,776
Loan capital 3,034 4,458 – 7,492
Total liabilities 65,368 92,484 9,035 166,887
Assets AS AT 31 MARCH 2019
Cash and bank balances 9,787 – – 9,787
Cash collateral on securities borrowed and reverse repurchase agreements – 10,201 – 10,201
Margin money and settlement assets 5,611 9,753 – 15,364
Held for sale and other assets – 2,704 – 2,704
Loan assets – 5,993 71,614 77,607
Loans to associates and joint ventures – – 323 323
Total assets 15,398 28,651 71,937 115,986
Liabilities
Cash collateral on securities lent and repurchase agreements – 3,106 – 3,106
Margin money and settlement liabilities 14,411 8,165 – 22,576
Deposits 42,910 13,337 – 56,247
Held for sale and other liabilities – 1,365 5,509 6,874
Borrowings 625 8,322 406 9,353
Debt issued – 43,098 4,996 48,094
Loan capital 2,944 4,150 – 7,094
Total liabilities 60,890 81,543 10,911 153,344
(1) The fair value of other liabilities excludes the fair value of lease liabilities.
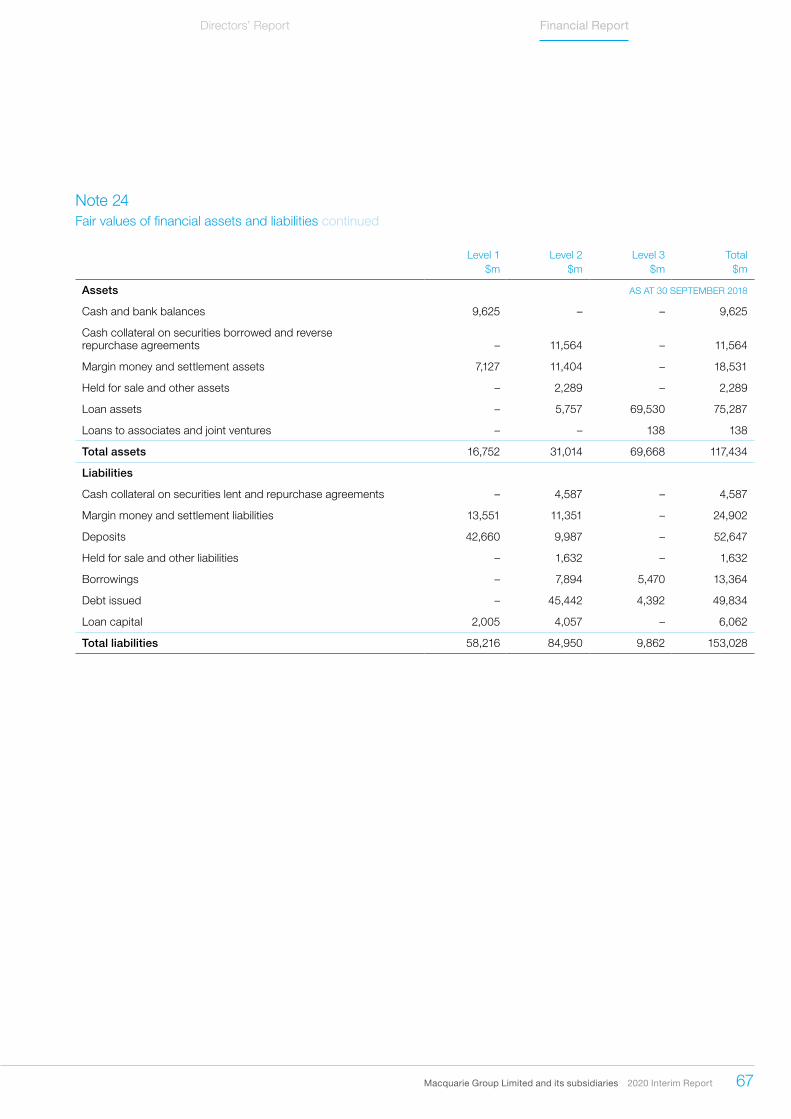
Macquarie Group Limited and its subsidiaries 2020 Interim Report 67
Directors’ Report Financial Report
Note 24Fair values of financial assets and liabilities continued
Level 1 Level 2 Level 3 Total$m $m $m $m
Assets AS AT 30 SEPTEMBER 2018
Cash and bank balances 9,625 – – 9,625
Cash collateral on securities borrowed and reverse repurchase agreements – 11,564 – 11,564
Margin money and settlement assets 7,127 11,404 – 18,531
Held for sale and other assets – 2,289 – 2,289
Loan assets – 5,757 69,530 75,287
Loans to associates and joint ventures – – 138 138
Total assets 16,752 31,014 69,668 117,434
Liabilities
Cash collateral on securities lent and repurchase agreements – 4,587 – 4,587
Margin money and settlement liabilities 13,551 11,351 – 24,902
Deposits 42,660 9,987 – 52,647
Held for sale and other liabilities – 1,632 – 1,632
Borrowings – 7,894 5,470 13,364
Debt issued – 45,442 4,392 49,834
Loan capital 2,005 4,057 – 6,062
Total liabilities 58,216 84,950 9,862 153,028

68 Macquarie Group Limited and its subsidiaries 2020 Interim Report
Notes to the consolidated financial statementsFor the half-year ended 30 September 2019 continued
Note 24Fair values of financial assets and liabilities continued
The following table summarises the levels of the fair value hierarchy for financial instruments measured at fair value:
Level 1 Level 2 Level 3 Total$m $m $m $m
Assets AS AT 30 SEPTEMBER 2019
Reverse repurchase agreements – 19,139 – 19,139
Trading assets(1) 16,529 7,066 635 24,230
Margin money and settlement assets 1,585 770 – 2,355
Derivative assets 210 17,384 627 18,221
Financial investments 649 6,002 1,286 7,937
Held for sale and other assets 10 550 50 610
Loan assets – 1,383 566 1,949
Loans to associates and joint ventures – – 246 246
Total assets 18,983 52,294 3,410 74,687
Liabilities
Repurchase agreements – 3,023 – 3,023
Trading liabilities 6,740 1,406 – 8,146
Derivative liabilities 416 13,774 324 14,514
Held for sale and other liabilities 3 450 3 456
Debt issued – 2,208 – 2,208
Total liabilities 7,159 20,861 327 28,347
Assets AS AT 31 MARCH 2019
Reverse repurchase agreements – 19,147 – 19,147
Trading assets(1) 13,045 5,400 225 18,670
Margin money and settlement assets 1,547 2,200 – 3,747
Derivative assets 248 13,638 571 14,457
Financial investments 486 5,173 1,502 7,161
Held for sale and other assets 9 481 97 587
Loan assets – 511 621 1,132
Loans to associates and joint ventures – – 208 208
Total assets 15,335 46,550 3,224 65,109
Liabilities
Repurchase agreements – 1,732 – 1,732
Trading liabilities 6,790 1,318 – 8,108
Derivative liabilities 329 12,004 333 12,666
Held for sale and other liabilities 41 524 – 565
Debt issued – 2,405 – 2,405
Total liabilities 7,160 17,983 333 25,476
(1) Includes commodities carried at fair value which are held for trading purposes.
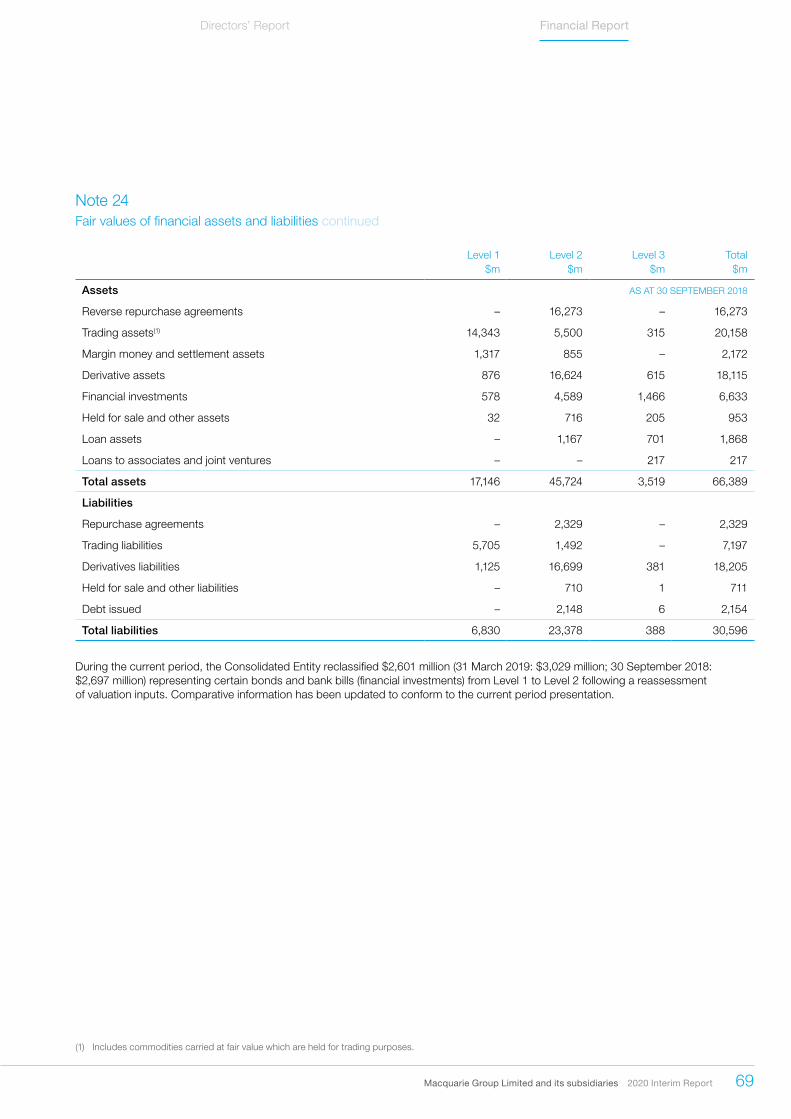
Macquarie Group Limited and its subsidiaries 2020 Interim Report 69
Directors’ Report Financial Report
Note 24Fair values of financial assets and liabilities continued
Level 1 Level 2 Level 3 Total$m $m $m $m
Assets AS AT 30 SEPTEMBER 2018
Reverse repurchase agreements – 16,273 – 16,273
Trading assets(1) 14,343 5,500 315 20,158
Margin money and settlement assets 1,317 855 – 2,172
Derivative assets 876 16,624 615 18,115
Financial investments 578 4,589 1,466 6,633
Held for sale and other assets 32 716 205 953
Loan assets – 1,167 701 1,868
Loans to associates and joint ventures – – 217 217
Total assets 17,146 45,724 3,519 66,389
Liabilities
Repurchase agreements – 2,329 – 2,329
Trading liabilities 5,705 1,492 – 7,197
Derivatives liabilities 1,125 16,699 381 18,205
Held for sale and other liabilities – 710 1 711
Debt issued – 2,148 6 2,154
Total liabilities 6,830 23,378 388 30,596
During the current period, the Consolidated Entity reclassified $2,601 million (31 March 2019: $3,029 million; 30 September 2018: $2,697 million) representing certain bonds and bank bills (financial investments) from Level 1 to Level 2 following a reassessment of valuation inputs. Comparative information has been updated to conform to the current period presentation.
(1) Includes commodities carried at fair value which are held for trading purposes.

70 Macquarie Group Limited and its subsidiaries 2020 Interim Report
Notes to the consolidated financial statementsFor the half-year ended 30 September 2019 continued
Note 24Fair values of financial assets and liabilities continued
Reconciliation of balances in Level 3 of the fair value hierarchyThe following table summarises the movements in Level 3 of the fair value hierarchy for the financial instruments measured at fair value.
Trading assetsFinancial
investments
Held for sale and other
assets Loan assetsLoans to associates
and joint venturesHeld for sale and
other liabilities Debt issued
Derivative financialinstruments
(net replacement values)(1) Total$m $m $m $m $m $m $m $m $m
Balance as at 1 Apr 2018 213 1,039 173 714 204 (1) (6) 301 2,637
Purchases, originations, issuances and other additions 93 430 29 287 41 – – 54 934
Sales, settlements and repayments (53) (233) – (306) (6) – – (72) (670)
Transfers into Level 3(2) 46 157 – – – – – 2 205
Transfers out of Level 3(2) (2) (59) – – (28) – – 12 (77)
Fair value movements recognised in the income statement(3) 18 131 3 9 18 – – (63) 116
Fair value movements recognised in OCI(3) – 1 – (3) (12) – – – (14)
Balance as at 30 Sep 2018 315 1,466 205 701 217 (1) (6) 234 3,131
Fair value movements for the period included in the income statements for assets and liabilities held at the end of the period(3) 17 13 3 9 18 – – (64) (4)
Balance as at 1 Oct 2018 315 1,466 205 701 217 (1) (6) 234 3,131
Purchases, originations, issuances and other additions – 231 54 135 64 1 6 (22) 469
Sales, settlements and repayments (19) (125) (237) (180) (44) – – (3) (608)
Transfers into Level 3(2) – – – – – – – 8 8
Transfers out of Level 3(2) (45) (28) – – (8) – – – (81)
Fair value movements recognised in the income statement(3) (26) 31 75 (27) 2 – – 21 76
Fair value movements recognised in OCI(3) – (73) – (8) (23) – – – (104)
Balance as at 31 Mar 2019 225 1,502 97 621 208 – – 238 2,891
Fair value movements for the period included in the income statement for assets and liabilities held at the end of the period(3) (11) 34 (2) (3) (8) – – 22 32
Balance as at 1 Apr 2019 225 1,502 97 621 208 – – 238 2,891
Purchases, originations, issuances and other additions 245 119 44 217 105 (3) – 17 744
Sales, settlements and repayments (36) (317) (71) (164) (33) – – (23) (644)
Transfers into Level 3(2) 212 66 7 – – – – 21 306
Transfers out of Level 3(2) (35) (214) (45) (113) (6) – – (55) (468)
Fair value movements recognised in the income statement(3) 24 110 18 36 (23) – – 105 270
Fair value movements recognised in OCI(3) – 20 – (31) (5) – – – (16)
Balance as at 30 Sep 2019 635 1,286 50 566 246 (3) – 303 3,083
Fair value movements for the period included in the income statement for assets and liabilities held at the end of the period(3) 24 77 4 30 (23) – – 105 217
(1) The derivative financial instruments in the table above are represented on a net basis. On a gross basis, derivative assets are $627 million (31 March 2019: $571 million; 30 September 2018: $615 million) and derivative liabilities are $324 million (31 March 2019: $333 million; 30 September 2018: $381 million).
(2) Assets and liabilities transferred into or out of Level 3 are presented as if those assets or liabilities had been transferred at the beginning of the period.(3) The Consolidated Entity employs various hedging techniques in order to manage risks, including risks in Level 3 positions. Such techniques may include the
purchase or sale of financial instruments that are classified as Levels 1 and/or 2. The realised and unrealised gains and losses for assets and liabilities in Level 3 presented in the table above do not include the related realised or unrealised gains and losses arising on economic hedging instruments classified in Level 1 and/or 2.
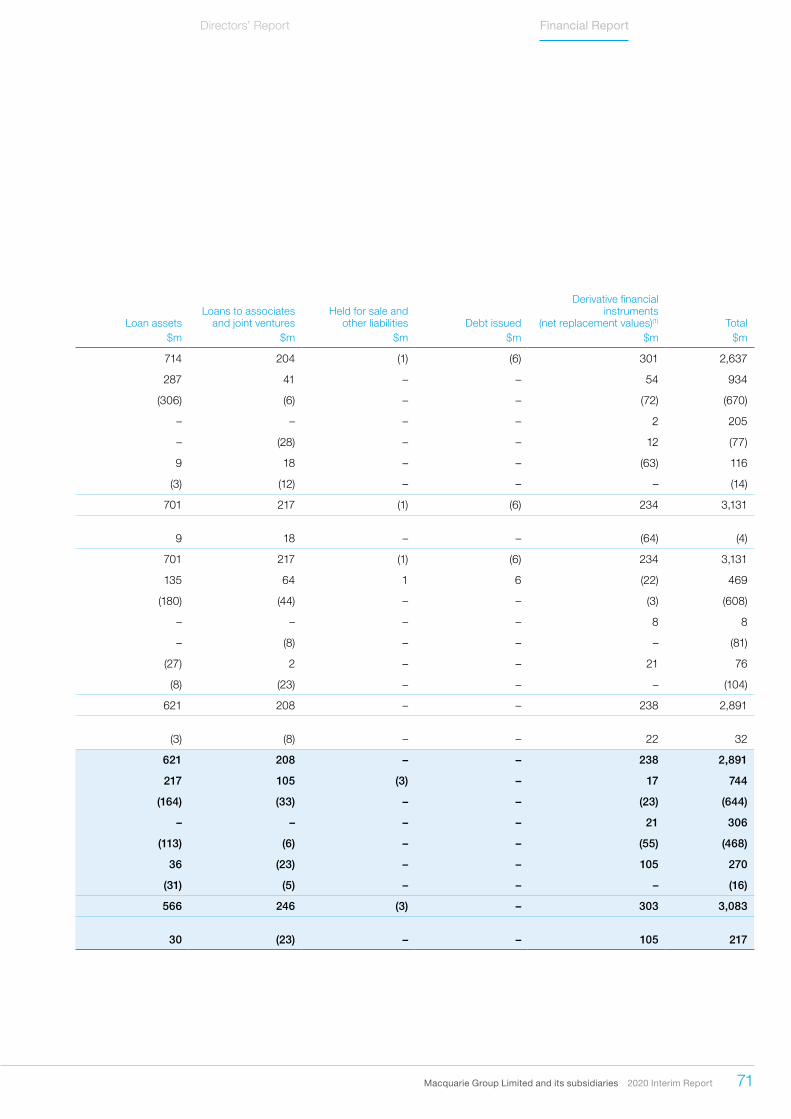
Macquarie Group Limited and its subsidiaries 2020 Interim Report 71
Directors’ Report Financial Report
Note 24Fair values of financial assets and liabilities continued
Reconciliation of balances in Level 3 of the fair value hierarchyThe following table summarises the movements in Level 3 of the fair value hierarchy for the financial instruments measured at fair value.
Trading assetsFinancial
investments
Held for sale and other
assets Loan assetsLoans to associates
and joint venturesHeld for sale and
other liabilities Debt issued
Derivative financial instruments
(net replacement values)(1) Total$m $m $m $m $m $m $m $m $m
Balance as at 1 Apr 2018 213 1,039 173 714 204 (1) (6) 301 2,637
Purchases, originations, issuances and other additions 93 430 29 287 41 – – 54 934
Sales, settlements and repayments (53) (233) – (306) (6) – – (72) (670)
Transfers into Level 3(2) 46 157 – – – – – 2 205
Transfers out of Level 3(2) (2) (59) – – (28) – – 12 (77)
Fair value movements recognised in the income statement(3) 18 131 3 9 18 – – (63) 116
Fair value movements recognised in OCI(3) – 1 – (3) (12) – – – (14)
Balance as at 30 Sep 2018 315 1,466 205 701 217 (1) (6) 234 3,131
Fair value movements for the period included in the income statements for assets and liabilities held at the end of the period(3) 17 13 3 9 18 – – (64) (4)
Balance as at 1 Oct 2018 315 1,466 205 701 217 (1) (6) 234 3,131
Purchases, originations, issuances and other additions – 231 54 135 64 1 6 (22) 469
Sales, settlements and repayments (19) (125) (237) (180) (44) – – (3) (608)
Transfers into Level 3(2) – – – – – – – 8 8
Transfers out of Level 3(2) (45) (28) – – (8) – – – (81)
Fair value movements recognised in the income statement(3) (26) 31 75 (27) 2 – – 21 76
Fair value movements recognised in OCI(3) – (73) – (8) (23) – – – (104)
Balance as at 31 Mar 2019 225 1,502 97 621 208 – – 238 2,891
Fair value movements for the period included in the income statement for assets and liabilities held at the end of the period(3) (11) 34 (2) (3) (8) – – 22 32
Balance as at 1 Apr 2019 225 1,502 97 621 208 – – 238 2,891
Purchases, originations, issuances and other additions 245 119 44 217 105 (3) – 17 744
Sales, settlements and repayments (36) (317) (71) (164) (33) – – (23) (644)
Transfers into Level 3(2) 212 66 7 – – – – 21 306
Transfers out of Level 3(2) (35) (214) (45) (113) (6) – – (55) (468)
Fair value movements recognised in the income statement(3) 24 110 18 36 (23) – – 105 270
Fair value movements recognised in OCI(3) – 20 – (31) (5) – – – (16)
Balance as at 30 Sep 2019 635 1,286 50 566 246 (3) – 303 3,083
Fair value movements for the period included in the income statement for assets and liabilities held at the end of the period(3) 24 77 4 30 (23) – – 105 217
(1) The derivative financial instruments in the table above are represented on a net basis. On a gross basis, derivative assets are $627 million (31 March 2019: $571 million; 30 September 2018: $615 million) and derivative liabilities are $324 million (31 March 2019: $333 million; 30 September 2018: $381 million).
(2) Assets and liabilities transferred into or out of Level 3 are presented as if those assets or liabilities had been transferred at the beginning of the period.(3) The Consolidated Entity employs various hedging techniques in order to manage risks, including risks in Level 3 positions. Such techniques may include the
purchase or sale of financial instruments that are classified as Levels 1 and/or 2. The realised and unrealised gains and losses for assets and liabilities in Level 3 presented in the table above do not include the related realised or unrealised gains and losses arising on economic hedging instruments classified in Level 1 and/or 2.

72 Macquarie Group Limited and its subsidiaries 2020 Interim Report
Note 24Fair values of financial assets and liabilities continued
Significant transfers between levels of the fair value hierarchyDuring the period, the Consolidated Entity did not have significant transfers between Level 1 and 2. Certain comparatives have been updated to conform to current period presentation.
Transfers into Level 3 were due to the lack of observable valuation inputs for certain securities and investments. Transfers out of Level 3 were principally due to valuation inputs becoming observable during the period. Financial assets reclassified out of the fair value hierarchy disclosure due to recognition and measurement category changes or due to significant influence or control are also presented as transfers out of Level 3.
Unrecognised gainsFor financial instruments measured at FVTPL, the best evidence of fair value at initial recognition is its transaction price, unless its fair value is evidenced by comparison with other observable current market transactions in the same instrument or based on a valuation technique for which variables include only data from observable markets. Where such alternative evidence exists, the Consolidated Entity recognises profit or loss immediately when the financial instrument is recognised (‘day 1 profit or loss’). When significant unobservable inputs are used to determine fair value, the day 1 profit or loss is deferred and is recognised in the income statement over the life of the transaction or when the inputs become observable.
The table below summarises the deferral and recognition of profit or loss where a valuation technique has been applied for which not all inputs are observable in the market:
Half-year to Half-year to Half-year to30 Sep 19 31 Mar 19 30 Sep 18
$m $m $m
Balance at the beginning of the period 185 174 178Deferral on new transactions 91 52 19Amounts recognised in the income statement during the period (50) (41) (23)Balance at the end of the period 226 185 174
Sensitivity analysis of valuations using unobservable inputsThe table below shows the sensitivity to reasonably possible alternative assumptions, for Level 3 financial instruments whose fair values are determined in whole or in part using unobservable inputs, valuation techniques such as discounted cash flows based on assumptions by reference to historical company and industry experience. The impact of sensitivity of financial instruments which hedge the Level 3 positions but are classified as Level 1 and 2 are not included in the below table.
FAVOURABLE CHANGES UNFAVOURABLE CHANGES
Profit or loss OCI Profit or loss OCI$m $m $m $m
Product type AS AT 30 SEPTEMBER 2019
Equity and equity-linked products 87 – (95) –Commodities 113 – (112) –Interest rate and other products 21 45 (21) (45)Total 221 45 (228) (45)Product type AS AT 31 MARCH 2019
Equity and equity-linked products 68 – (71) –Commodities 107 – (114) –Interest rate and other products 24 54 (24) (54)Total 199 54 (209) (54)Product type AS AT 30 SEPTEMBER 2018
Equity and equity-linked products 59 – (60) –Commodities 68 – (56) –Interest rate and other products 54 59 (54) (59)Total 181 59 (170) (59)
Notes to the consolidated financial statementsFor the half-year ended 30 September 2019 continued

Macquarie Group Limited and its subsidiaries 2020 Interim Report 73
Directors’ Report Financial Report
Note 24Fair values of financial assets and liabilities continued
Significant unobservable inputsThe following table contains information about the significant unobservable inputs used in Level 3 valuations, and the valuation techniques used to measure the fair values of the instruments. The range of values represents the highest and lowest inputs used in the valuation techniques.
Therefore, the range does not reflect the level of uncertainty regarding a particular input, but rather the different underlying characteristics of the relevant assets and liabilities.
RANGE OF INPUTS
Assets Liabilities Valuation technique(s)
Significant unobservable inputs
Minimum value
Maximum value
$m $m $m $m
AS AT 30 SEPTEMBER 2019
Equity and equity-linked products 781 – Discounted cash flows Discount rate 5.0% 10.7%
Pricing model Earnings multiple 1.5x 14.9x
Market comparability Price in %(1)
Commodities 1,055 319 Pricing model Volatility 0.0% 100.0%
Interest rate and other products 1,574 8 Discounted cash flows Discount rate(2)
Pricing model Correlation 0.0% 100.0%
Market comparability Price in %(1)
Total 3,410 327
AS AT 31 MARCH 2019
Equity and equity-linked products 728 2 Discounted cash flows Discount rate 5.0% 11.0%
Pricing model Earnings multiple 1x 16x
– – Market comparability Price in %(1)
Commodities 629 328 Pricing model Volatility 0.0% 176.4%
Interest rate and other products 1,867 3 Discounted cash flows Discount rate(2)
Pricing model Correlation 0.0% 100.0%
Market comparability Price in %(1)
Total 3,224 333
AS AT 30 SEPTEMBER 2018
Equity and equity-linked products 664 6 Discounted cash flows Discount rate 5.0% 11.0%
Pricing model Earnings multiple 1.7x 17.5x
Market comparability Price in %(1)
Commodities 645 370 Pricing model Volatility 5.1% 126.7%
Interest rate and other products 2,210 12 Discounted cash flows Discount rate(2)
Pricing model Correlation 0.0% 102.5%
Market comparability Price in %(1)
Total 3,519 388
(1) The range of inputs relating to market comparability has not been disclosed as the diverse nature of the underlying investments results in a wide range of inputs.(2) The range of inputs relating to discounted cash flows has not been disclosed as the diverse nature of the underlying products results in a wide range of inputs.

74 Macquarie Group Limited and its subsidiaries 2020 Interim Report
Notes to the consolidated financial statementsFor the half-year ended 30 September 2019 continued
Note 24Fair values of financial assets and liabilities continued
CorrelationCorrelation is a measure of the relationship between the movements of two variables (i.e. how the change in one variable influences a change in the other variable). Correlation is a key input of derivatives with more than one underlying and is generally used to value hybrid and exotic instruments.
VolatilityVolatility is a measure of the variability or uncertainty in returns for a given derivative underlying. It represents an estimate of how much a particular underlying instrument, parameter or index will change in value over time. Volatility is an input in the valuation of derivatives containing optionality. Volatility and skew are impacted by the underlying risk, term and strike price of a derivative.
Inputs for unlisted equity securities (discount rates, earnings multiples)Unlisted equity instruments are generally valued based on the earnings multiples of comparable companies. Significant unobservable inputs may include earnings multiples, discount rates and forecast earnings of the investee entities.
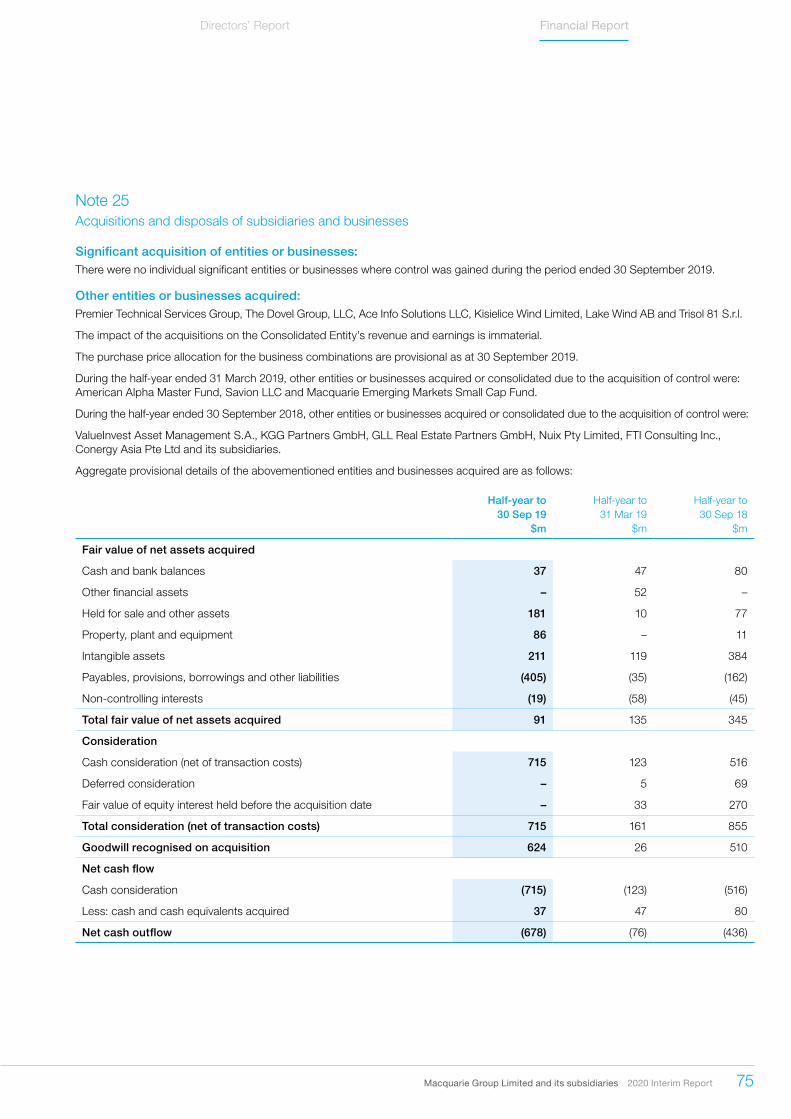
Macquarie Group Limited and its subsidiaries 2020 Interim Report 75
Directors’ Report Financial Report
Note 25 Acquisitions and disposals of subsidiaries and businesses
Significant acquisition of entities or businesses:There were no individual significant entities or businesses where control was gained during the period ended 30 September 2019.
Other entities or businesses acquired:Premier Technical Services Group, The Dovel Group, LLC, Ace Info Solutions LLC, Kisielice Wind Limited, Lake Wind AB and Trisol 81 S.r.l.
The impact of the acquisitions on the Consolidated Entity’s revenue and earnings is immaterial.
The purchase price allocation for the business combinations are provisional as at 30 September 2019.
During the half-year ended 31 March 2019, other entities or businesses acquired or consolidated due to the acquisition of control were: American Alpha Master Fund, Savion LLC and Macquarie Emerging Markets Small Cap Fund.
During the half-year ended 30 September 2018, other entities or businesses acquired or consolidated due to the acquisition of control were:
ValueInvest Asset Management S.A., KGG Partners GmbH, GLL Real Estate Partners GmbH, Nuix Pty Limited, FTI Consulting Inc., Conergy Asia Pte Ltd and its subsidiaries.
Aggregate provisional details of the abovementioned entities and businesses acquired are as follows:
Half-year to Half-year to Half-year to30 Sep 19 31 Mar 19 30 Sep 18
$m $m $m
Fair value of net assets acquired
Cash and bank balances 37 47 80
Other financial assets – 52 –
Held for sale and other assets 181 10 77
Property, plant and equipment 86 – 11
Intangible assets 211 119 384
Payables, provisions, borrowings and other liabilities (405) (35) (162)
Non-controlling interests (19) (58) (45)
Total fair value of net assets acquired 91 135 345
Consideration
Cash consideration (net of transaction costs) 715 123 516
Deferred consideration – 5 69
Fair value of equity interest held before the acquisition date – 33 270
Total consideration (net of transaction costs) 715 161 855
Goodwill recognised on acquisition 624 26 510
Net cash flow
Cash consideration (715) (123) (516)
Less: cash and cash equivalents acquired 37 47 80
Net cash outflow (678) (76) (436)
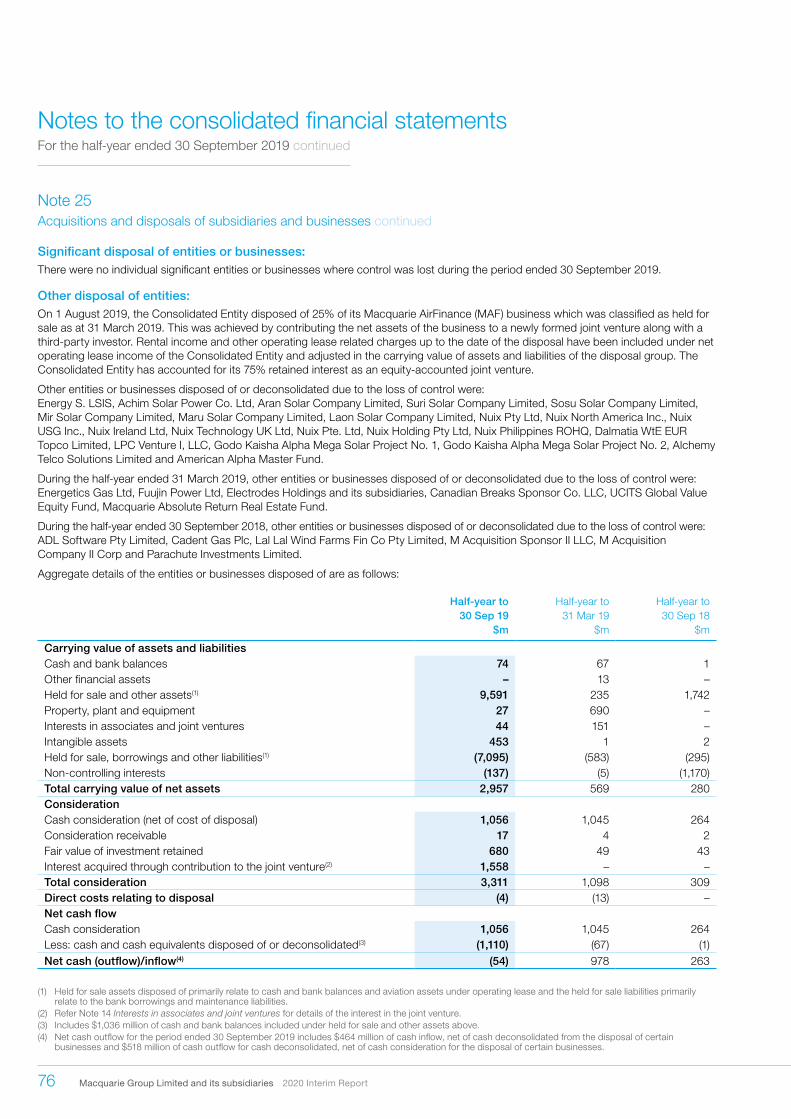
76 Macquarie Group Limited and its subsidiaries 2020 Interim Report
Notes to the consolidated financial statementsFor the half-year ended 30 September 2019 continued
Note 25Acquisitions and disposals of subsidiaries and businesses continued
Significant disposal of entities or businesses:There were no individual significant entities or businesses where control was lost during the period ended 30 September 2019.
Other disposal of entities:On 1 August 2019, the Consolidated Entity disposed of 25% of its Macquarie AirFinance (MAF) business which was classified as held for sale as at 31 March 2019. This was achieved by contributing the net assets of the business to a newly formed joint venture along with a third-party investor. Rental income and other operating lease related charges up to the date of the disposal have been included under net operating lease income of the Consolidated Entity and adjusted in the carrying value of assets and liabilities of the disposal group. The Consolidated Entity has accounted for its 75% retained interest as an equity-accounted joint venture.
Other entities or businesses disposed of or deconsolidated due to the loss of control were: Energy S. LSIS, Achim Solar Power Co. Ltd, Aran Solar Company Limited, Suri Solar Company Limited, Sosu Solar Company Limited, Mir Solar Company Limited, Maru Solar Company Limited, Laon Solar Company Limited, Nuix Pty Ltd, Nuix North America Inc., Nuix USG Inc., Nuix Ireland Ltd, Nuix Technology UK Ltd, Nuix Pte. Ltd, Nuix Holding Pty Ltd, Nuix Philippines ROHQ, Dalmatia WtE EUR Topco Limited, LPC Venture I, LLC, Godo Kaisha Alpha Mega Solar Project No. 1, Godo Kaisha Alpha Mega Solar Project No. 2, Alchemy Telco Solutions Limited and American Alpha Master Fund.
During the half-year ended 31 March 2019, other entities or businesses disposed of or deconsolidated due to the loss of control were: Energetics Gas Ltd, Fuujin Power Ltd, Electrodes Holdings and its subsidiaries, Canadian Breaks Sponsor Co. LLC, UCITS Global Value Equity Fund, Macquarie Absolute Return Real Estate Fund.
During the half-year ended 30 September 2018, other entities or businesses disposed of or deconsolidated due to the loss of control were: ADL Software Pty Limited, Cadent Gas Plc, Lal Lal Wind Farms Fin Co Pty Limited, M Acquisition Sponsor II LLC, M Acquisition Company II Corp and Parachute Investments Limited.
Aggregate details of the entities or businesses disposed of are as follows:
Half-year to Half-year to Half-year to30 Sep 19 31 Mar 19 30 Sep 18
$m $m $m
Carrying value of assets and liabilitiesCash and bank balances 74 67 1Other financial assets – 13 –Held for sale and other assets(1) 9,591 235 1,742Property, plant and equipment 27 690 –Interests in associates and joint ventures 44 151 –Intangible assets 453 1 2Held for sale, borrowings and other liabilities(1) (7,095) (583) (295)Non-controlling interests (137) (5) (1,170)Total carrying value of net assets 2,957 569 280ConsiderationCash consideration (net of cost of disposal) 1,056 1,045 264Consideration receivable 17 4 2Fair value of investment retained 680 49 43Interest acquired through contribution to the joint venture(2) 1,558 – –Total consideration 3,311 1,098 309Direct costs relating to disposal (4) (13) –Net cash flowCash consideration 1,056 1,045 264Less: cash and cash equivalents disposed of or deconsolidated(3) (1,110) (67) (1)Net cash (outflow)/inflow(4) (54) 978 263
(1) Held for sale assets disposed of primarily relate to cash and bank balances and aviation assets under operating lease and the held for sale liabilities primarily relate to the bank borrowings and maintenance liabilities.
(2) Refer Note 14 Interests in associates and joint ventures for details of the interest in the joint venture.(3) Includes $1,036 million of cash and bank balances included under held for sale and other assets above. (4) Net cash outflow for the period ended 30 September 2019 includes $464 million of cash inflow, net of cash deconsolidated from the disposal of certain
businesses and $518 million of cash outflow for cash deconsolidated, net of cash consideration for the disposal of certain businesses.

Macquarie Group Limited and its subsidiaries 2020 Interim Report 77
Directors’ Report Financial Report
Note 26Events after the reporting date
There were no material events subsequent to 30 September 2019 that have not been disclosed elsewhere in the financial statements.

78 Macquarie Group Limited and its subsidiaries 2020 Interim Report
In the Directors’ opinion:
(a) the financial statements and notes set out on pages 19 to 77 are in accordance with the Corporations Act 2001 (Cth) including:i. complying with the Australian Accounting Standards, andii. giving a true and fair view of the Consolidated Entity’s
financial position as at 30 September 2019 andperformance for the half-year ended on that date, and
(b) there are reasonable grounds to believe that Macquarie Group Limited will be able to pay its debts as and when they become due and payable.
This declaration is made in accordance with a resolution of the Directors.
Peter Warne Independent Director and Chairman
Shemara Wikramanayake Managing Director and Chief Executive Officer
Sydney 1 November 2019
Directors’ declarationMacquarie Group Limited
Macquarie Group Limited and its subsidiaries 2020 Interim Report 79
Directors’ Report Financial Report
Report on the half-year financial reportWe have reviewed the accompanying half-year financial report of Macquarie Group Limited (the Company) and the entities it controlled during the half-year (together the Consolidated Entity), which comprises the consolidated statement of financial position as at 30 September 2019, the consolidated statement of comprehensive income, consolidated statement of changes in equity, consolidated statement of cash flows and consolidated income statement for the half-year ended on that date, selected other explanatory notes and the directors’ declaration.
Directors’ responsibility for the half-year financial reportThe directors of the Company are responsible for the preparation of the half-year financial report that gives a true and fair view in accordance with Australian Accounting Standards and the Corporations Act 2001 (Cth) and for such internal control as the directors determine is necessary to enable the preparation of the half-year financial report that gives a true and fair view and is free from material misstatement whether due to fraud or error.
Auditor’s responsibilityOur responsibility is to express a conclusion on the half-year financial report based on our review. We conducted our review in accordance with Australian Auditing Standard on Review Engagements ASRE 2410 Review of a Financial Report Performed by the Independent Auditor of the Entity, in order to state whether, on the basis of the procedures described, we have become aware of any matter that makes us believe that the half-year financial report is not in accordance with the Corporations Act 2001 (Cth) including giving a true and fair view of the Consolidated Entity’s financial position as at 30 September 2019 and its performance for the half-year ended on that date; and complying with Accounting Standard AASB 134 Interim Financial Reporting and the Corporations Regulations 2001 (Cth). As the auditor of Macquarie Group Limited, ASRE 2410 requires that we comply with the ethical requirements relevant to the audit of the annual financial report.
A review of a half-year financial report consists of making enquiries, primarily of persons responsible for financial and accounting matters, and applying analytical and other review procedures. A review is substantially less in scope than an audit conducted in accordance with Australian Auditing Standards and consequently does not enable us to obtain assurance that we would become aware of all significant matters that might be identified in an audit. Accordingly, we do not express an audit opinion.
IndependenceIn conducting our review, we have complied with the independence requirements of the Corporations Act 2001 (Cth).
ConclusionBased on our review, which is not an audit, we have not become aware of any matter that makes us believe that the half-year financial report of Macquarie Group Limited is not in accordance with the Corporations Act 2001 (Cth) including:(a) giving a true and fair view of the Consolidated Entity’s financial
position as at 30 September 2019 and of its performance for the half-year ended on that date;
(b) complying with Accounting Standard AASB 134 Interim Financial Reporting and the Corporations Regulations 2001 (Cth).
PricewaterhouseCoopers
Kristin Stubbins Partner
Sydney 1 November 2019
PricewaterhouseCoopers, ABN 52 780 433 757
One International Towers Sydney, Watermans Quay, Barangaroo, GPO BOX 2650, SYDNEY NSW 2001 T: +61 2 8266 0000, F: +61 2 8266 9999, www.pwc.com.au
Liability is limited by a scheme approved under Professional Standards Legislation.
Independent auditor’s review reportTo the members of Macquarie Group Limited

Contact details
Macquarie Group Principal Administrative Office
50 Martin Place Sydney NSW 2000 Australia
Registered Office Macquarie Group Limited
Level 6, 50 Martin Place Sydney NSW 2000 Australia