Embed Size (px)
DESCRIPTION
This account presents an interim estimate of annual historical CO2 emissions (refer to from here on in, as a GHG emissions) from the deforestation of natural forests and the peat decomposition of degraded peatlands in Central Kalimantan for the period 2000 to 2009, using a simple approach to GHG emissions estimation at the request of the REDD+ Special Team (UKP4) and the REL Team of the REDD+ Pilot Province of Central Kalimantan. | Authors: Haruni Krisnawati, Rinaldi Imanuddin, Wahyu Catur Adinugroho, Nofaldi, Septa Heksaputri, Silver Hutabarat | Design & Layout: Stella Pong | Publisher: IAFCP
Citation preview

Interim estimates of CO2 emissions for Central KalimantanB
A simple CO2 emissions account from deforestation and peat decomposition components for Central Kalimantan
December, 2013
Interim Estimates of CO2 Emissions for Central KalimantanA simple CO2 emissions account from deforestation and peat decomposition components for Central Kalimantan
Authors:Haruni KrisnawatiRinaldi ImanuddinWahyu Catur AdinugrohoNofaldi Septa HeksaputriSilver Hutabarat
Reviewers:Nikki FitzgeraldMichael ParsonsThomas HarveyAdi Susmianto
© 2013 Research and Development Center for Conservation and Rehabilitation, Forestry Research and Development Agency
ISBN: 978-602-1681-08-4
Citation is permitted with acknowledgement of the source:Krisnawati, H., Imanuddin, R., Adinugroho, W.C., Nofaldi, Heksaputri, S. and Hutabarat, S. 2013. Interim Estimates of CO2 Emissions for Central Kalimantan: A simple CO2 emissions account from deforestation and peat decomposition components for Central Kalimantan. Research and Development Center for Conservation and Rehabilitation, Forestry Research and Development Agency, Bogor, Indonesia.
Published by:Research and Development Center for Conservation and Rehabilitation, Forestry Research and Development Agency – Ministry of ForestryJl. Gunung Batu No. 5, Bogor 16610, IndonesiaTelp/Fax: +62-251 8633234/+62-251 8638111Email: [email protected]; website: http://puskonser.or.id
This publication was produced by the Indonesia-Australia Forest Carbon Partnership (IAFCP) through the INCAS program of support funded by Australian Aid
Interim estimates of CO2 emissions for Central Kalimantan iii
Preface
The Government of Indonesia has committed to reducing greenhouse gas (GHG) emissions by 26% below business as usual levels by 2020 independently and up to 41% with international assistance. Many initiatives have been taken at both the local and national levels to help
meet this commitment and ensure its implementation. One of these efforts is the bilateral parnership with the Government of Norway on reducing GHG emissions from deforestation, forest degradation, and peatlands.
One of the essential components for ensuring GHG emissions reductions is a credible and transparent Measurement, Reporting, Verification (MRV) system. The Indonesian National Carbon Accounting System (INCAS) is a Government of Indonesia system designed to support Indonesia’s emissions reporting requirements for forests, including MRV for REDD+. It is currently being supported by the Indonesia-Australia Forest Carbon Partnership (IAFCP), with funding and technical advice provided by the Government of Australia.
This report has been prepared as an output from the collaboration between the REDD+ Special Team of UKP4 and REL Team of Central Kalimantan Province to help meet interim reporting requirements between the Government of Indonesia and its partnership with the Government of Norway on REDD+. This report shows measurement analysis of annual historical GHG emissions (2000-2009) from deforestation and the decomposition of peat in Central Kalimantan (as the first REDD+ pilot province) using a simple approach. The report was prepared by the INCAS Team in FORDA (Forestry Research and Development Agency), with support from program partners, especially LAPAN (National Institute of Aeronautics and Space) and the Directorate General of Forestry Planning.
This report will be updated with more detailed data and analysis in the future, to provide a more comprehensive account of GHG emissions. The INCAS framework has been designed to provide a detailed account of GHG emissions. The primary analysis shown in this report describes a simple implementation of the INCAS approach, that can be consistently replicated for other province(s) and at a national scale, and can be used as a first step in the development of an MRV system for REDD+ in Indonesia.
We would like to express our appreciation to parties who have contributed directly or indirectly in preparing this report. Thank you to the IAFCP for facilitating discussions, supporting the review process and funding the publication of this report. Special thanks to the Authors – researchers of the Research and Development Center for Conservation and Rehabilitation and the INCAS team, we express our appreciation for their hardwork and congratulations on this achievement.
I hope this report serves a useful source of information for related activities.
Jakarta, December 2013 Acting Director General, Forestry Research and Development Agency
Dr.Ir. I.B. Putera Parthama, M.Sc
Interim estimates of CO2 emissions for Central Kalimantaniv
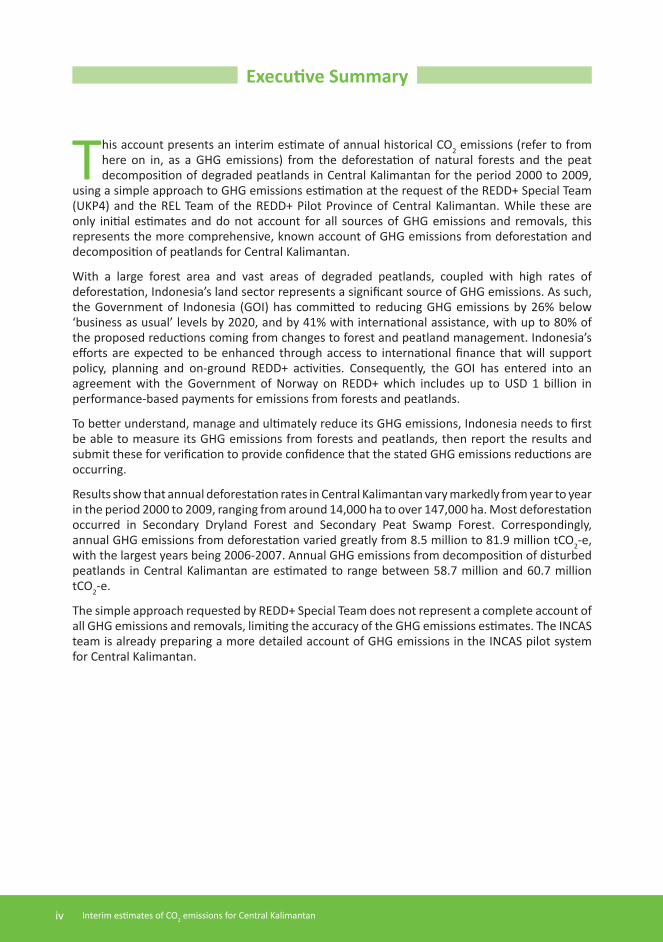
This account presents an interim estimate of annual historical CO2 emissions (refer to from here on in, as a GHG emissions) from the deforestation of natural forests and the peat decomposition of degraded peatlands in Central Kalimantan for the period 2000 to 2009,
using a simple approach to GHG emissions estimation at the request of the REDD+ Special Team (UKP4) and the REL Team of the REDD+ Pilot Province of Central Kalimantan. While these are only initial estimates and do not account for all sources of GHG emissions and removals, this represents the more comprehensive, known account of GHG emissions from deforestation and decomposition of peatlands for Central Kalimantan.
With a large forest area and vast areas of degraded peatlands, coupled with high rates of deforestation, Indonesia’s land sector represents a significant source of GHG emissions. As such, the Government of Indonesia (GOI) has committed to reducing GHG emissions by 26% below ‘business as usual’ levels by 2020, and by 41% with international assistance, with up to 80% of the proposed reductions coming from changes to forest and peatland management. Indonesia’s efforts are expected to be enhanced through access to international finance that will support policy, planning and on-ground REDD+ activities. Consequently, the GOI has entered into an agreement with the Government of Norway on REDD+ which includes up to USD 1 billion in performance-based payments for emissions from forests and peatlands.
To better understand, manage and ultimately reduce its GHG emissions, Indonesia needs to first be able to measure its GHG emissions from forests and peatlands, then report the results and submit these for verification to provide confidence that the stated GHG emissions reductions are occurring.
Results show that annual deforestation rates in Central Kalimantan vary markedly from year to year in the period 2000 to 2009, ranging from around 14,000 ha to over 147,000 ha. Most deforestation occurred in Secondary Dryland Forest and Secondary Peat Swamp Forest. Correspondingly, annual GHG emissions from deforestation varied greatly from 8.5 million to 81.9 million tCO2-e, with the largest years being 2006-2007. Annual GHG emissions from decomposition of disturbed peatlands in Central Kalimantan are estimated to range between 58.7 million and 60.7 million tCO2-e.
The simple approach requested by REDD+ Special Team does not represent a complete account of all GHG emissions and removals, limiting the accuracy of the GHG emissions estimates. The INCAS team is already preparing a more detailed account of GHG emissions in the INCAS pilot system for Central Kalimantan.
Executive Summary
Interim estimates of CO2 emissions for Central Kalimantan v
PREFACE iii
EXECUTIVE SUMMARY iv
TABLE OF CONTENTS v
LIST OF FIGURES vi
LIST OF TABLES vii
1. INTRODUCTION 1
2. METHODS 3
2.1. Emissions from Deforestation 5
2.1.1 Calculation of Forest Area (Activity Data) 5
2.1.2 Emissions Factors 7
2.1.3 Deforestation Emissions Calculation 8
2.2 Emissions from Peat Decomposition 8
2.2.1 Peatland Area Data 8
2.2.2 Peatland Area Calculation 8
2.2.3 Peat Emissions Factors Data 9
2.2.4 Peat Emissions Calculation 9
3. RESULTS 11
3.1 Deforestation Component 12
3.2 Peat Decomposition Component 13
4. DISCUSSION 14
4.1 Limitations 14
4.1.1 Deforestation Component 14
4.1.2 Peat Decomposition Component 15
4.2 Improvement Plan 15
4.2.1 Deforestation Component 15
4.2.2 Peat Decomposition Component 16
Table of Contents
Interim estimates of CO2 emissions for Central Kalimantanvi
Figure 1. Overview of the simple approach used to estimate GHG emissions from deforestation and peat decomposition in Central Kalimantan 4
Figure 2. Deforestation area calculation workflow diagram 5
Figure 3. The two main datasets used in the deforestation approach − forest/non-forest classification and six natural forest classes 6
Figure 4. Annual deforestation from 2000 to 2009 7
List of Figures
Interim estimates of CO2 emissions for Central Kalimantan vii
Table 1. Relationship between the land cover map used, forest/non-forest classificationperiod and deforestation year 6
Table 2. Land use classes modelled in analysis of GHG emissions from peat 9
Table 3. CO2 emissions factors for drained organic soils in modelled land-use categories 9
Table 4. Summary of annual GHG emissions from deforestation of natural forests and the decomposition of peatlands in Central Kalimantan 11
Table 5. Area of annual deforestation of natural forests in Central Kalimantan 12
Table 6. GHG emissions from deforestation in Central Kalimantan for each land cover modelled (t CO2-e) 12
Table 7. Area of peatland modelled by land cover for each year (ha) 13
Table 8. GHG emissions from peatland in Central Kalimantan for each land usemodelled (tCO2-e) 13
List of Tables

Interim estimates of CO2 emissions for Central Kalimantan 1
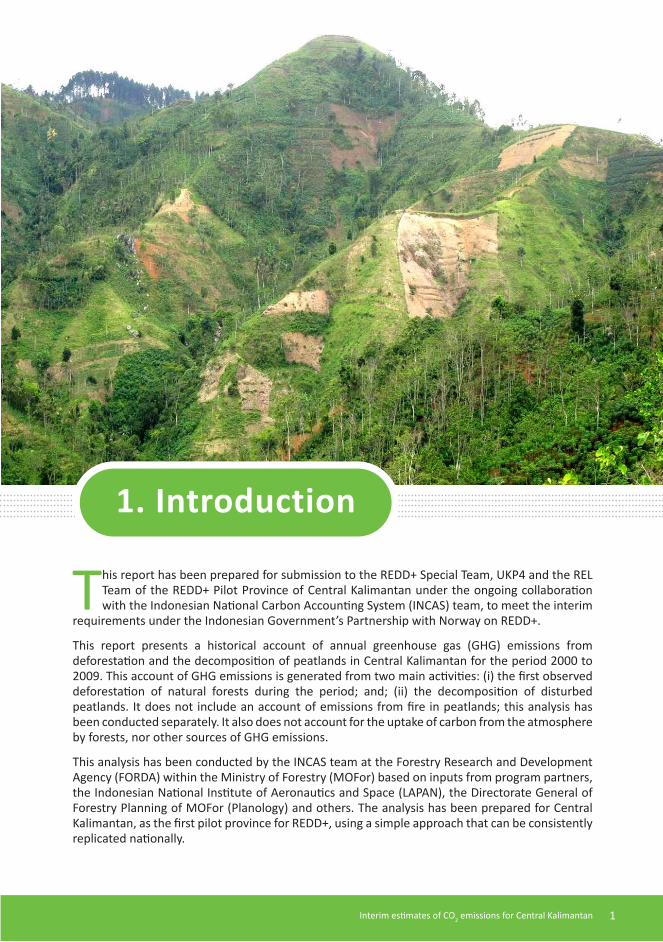
This report has been prepared for submission to the REDD+ Special Team, UKP4 and the REL Team of the REDD+ Pilot Province of Central Kalimantan under the ongoing collaboration with the Indonesian National Carbon Accounting System (INCAS) team, to meet the interim
requirements under the Indonesian Government’s Partnership with Norway on REDD+.
This report presents a historical account of annual greenhouse gas (GHG) emissions from deforestation and the decomposition of peatlands in Central Kalimantan for the period 2000 to 2009. This account of GHG emissions is generated from two main activities: (i) the first observed deforestation of natural forests during the period; and; (ii) the decomposition of disturbed peatlands. It does not include an account of emissions from fire in peatlands; this analysis has been conducted separately. It also does not account for the uptake of carbon from the atmosphere by forests, nor other sources of GHG emissions.
This analysis has been conducted by the INCAS team at the Forestry Research and Development Agency (FORDA) within the Ministry of Forestry (MOFor) based on inputs from program partners, the Indonesian National Institute of Aeronautics and Space (LAPAN), the Directorate General of Forestry Planning of MOFor (Planology) and others. The analysis has been prepared for Central Kalimantan, as the first pilot province for REDD+, using a simple approach that can be consistently replicated nationally.
1. Introduction
Interim estimates of CO2 emissions for Central Kalimantan2
Emissions have been accounted for according to the interim requirements for emissions reporting set by the REDD+ Special Team during the coordination meeting held on 11-12 November 2013, at the Aryaduta Hotel in Jakarta. These requirements cover some, but not all potential sources of GHG emissions from forested land and disturbed peatland in Central Kalimantan during 2000 to 2009. The simple approach requested by the REDD+ Special Team does not represent a complete account of all emissions. This limits the accuracy of the GHG emissions estimates and means this analysis contains some limitations, these are discussed in detail below. This approach, does however represent a more improved account of historical GHG emissions than is known to have been prepared previously for the province. This improved approach includes analysis conducted on an annual basis, loss of forest cover detected at the pixel level (from Landsat imagery), improved emissions factors for forests generated from Central Kalimantan-based forest inventory plot; and FORDA’s recently published monograph and guidelines for measuring forest biomass and forest carbon content. Additionally, emissions from the decomposition of peatlands have been calculated according to the working draft methodology for peat, formulated by the REDD+ Special Team based on the result of a UKP4 workshop on Methodology of Measuring Emissions from Peatlands for REDD+ (Jakarta on 6 November 2013).
Indonesia’s Measurement, Reporting and Verification (MRV) requirements for REDD+ are expected to become more comprehensive in time and the coverage of the system will need to improve to show a more detailed account of GHG emissions. The INCAS framework is designed to provide this more detailed coverage, and a pilot system is under development for Central Kalimantan.
The initial analysis reported here represents a simple application of components of the INCAS framework and can be used as a starting point in the development of Indonesia’s MRV system.
Interim estimates of CO2 emissions for Central Kalimantan 3
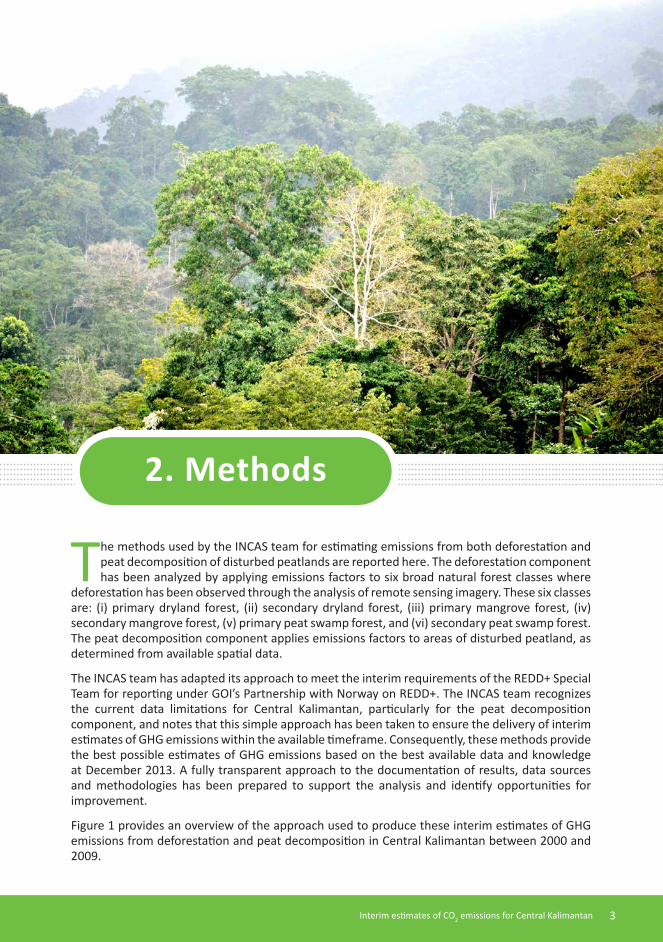
The methods used by the INCAS team for estimating emissions from both deforestation and peat decomposition of disturbed peatlands are reported here. The deforestation component has been analyzed by applying emissions factors to six broad natural forest classes where
deforestation has been observed through the analysis of remote sensing imagery. These six classes are: (i) primary dryland forest, (ii) secondary dryland forest, (iii) primary mangrove forest, (iv) secondary mangrove forest, (v) primary peat swamp forest, and (vi) secondary peat swamp forest. The peat decomposition component applies emissions factors to areas of disturbed peatland, as determined from available spatial data.
The INCAS team has adapted its approach to meet the interim requirements of the REDD+ Special Team for reporting under GOI’s Partnership with Norway on REDD+. The INCAS team recognizes the current data limitations for Central Kalimantan, particularly for the peat decomposition component, and notes that this simple approach has been taken to ensure the delivery of interim estimates of GHG emissions within the available timeframe. Consequently, these methods provide the best possible estimates of GHG emissions based on the best available data and knowledge at December 2013. A fully transparent approach to the documentation of results, data sources and methodologies has been prepared to support the analysis and identify opportunities for improvement.
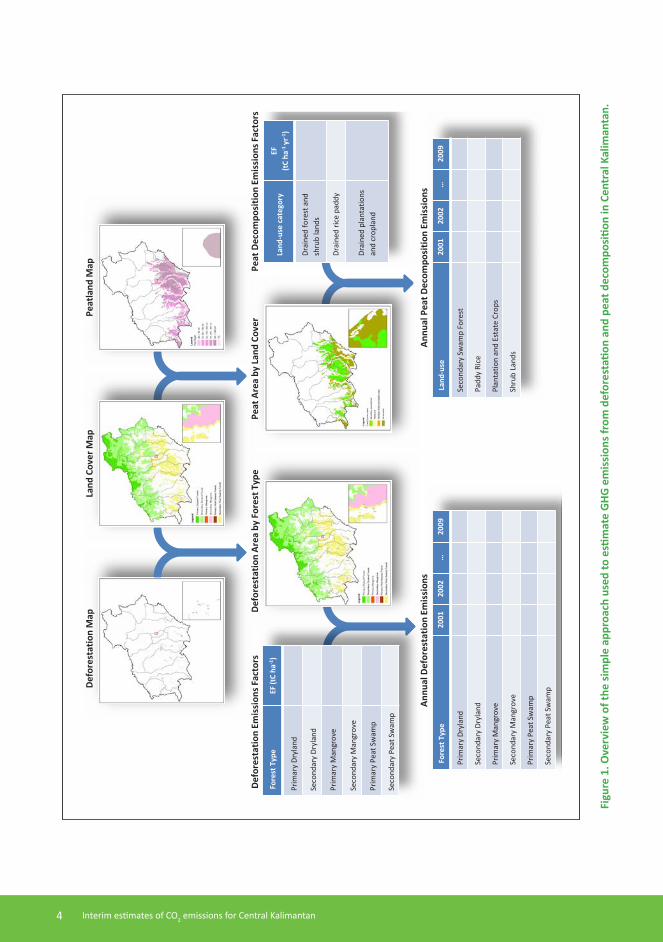
Figure 1 provides an overview of the approach used to produce these interim estimates of GHG emissions from deforestation and peat decomposition in Central Kalimantan between 2000 and 2009.
2. Methods
Interim estimates of CO2 emissions for Central Kalimantan4
Peat
land
Map
Peat
Are
a by
Lan
d Co
ver
Land
-use
cat
egor
y EF
(t
C ha
-1 y
r-1)
Drai
ned
fore
st a
nd
shru
b la
nds
Drai
ned
rice
padd
y
Drai
ned
plan
tatio
ns
and
crop
land
Defo
rest
atio
n Ar
ea b
y Fo
rest
Typ
e
Fore
st T
ype
EF (t
C ha
-1)
Prim
ary
Dryl
and
Seco
ndar
y Dr
ylan
d
Prim
ary
Man
grov
e
Seco
ndar
y M
angr
ove
Prim
ary
Peat
Sw
amp
Seco
ndar
y Pe
at S
wam
p
Defo
rest
atio
n Em
issi
ons F
acto
rs
Peat
Dec
ompo
sitio
n Em
issi
ons F
acto
rs
Land
Cov
er M
ap
Defo
rest
atio
n M
ap
Fore
st T
ype
2001
20
02
…
2009
Prim
ary
Dryl
and
Seco
ndar
y Dr
ylan
d
Prim
ary
Man
grov
e
Seco
ndar
y M
angr
ove
Prim
ary
Peat
Sw
amp
Seco
ndar
y Pe
at S
wam
p
Annu
al D
efor
esta
tion
Emis
sion
s
Land
-use
20
01
2002
…
20
09
Seco
ndar
y Sw
amp
Fore
st
Padd
y Ri
ce
Plan
tatio
n an
d Es
tate
Cro
ps
Shru
b La
nds
Annu
al P
eat D
ecom
posi
tion
Emis
sion
s
Figu
re 1
. Ove
rvie
w o
f the
sim
ple
appr
oach
use
d to
esti
mat
e G
HG e
mis
sion
s fro
m d
efor
esta
tion
and
peat
dec
ompo
sitio
n in
Cen
tral
Kal
iman
tan.
Interim estimates of CO2 emissions for Central Kalimantan 5
2.1 Emissions from deforestation
2.1.1 Calculation of forest area (Activity Data)
According to the emissions reporting requirements requested by the REDD+ Special Team, annual GHG emissions were calculated for deforestation of natural forests in Central Kalimantan. For the purpose of this analysis, deforestation was defined as the first detected clearing event in natural forest since the beginning of the time series (i.e. from 2000 up to 2009), regardless of whether forest was subsequently observed in the area or whether subsequent forest cover change was observed (i.e. subsequent clearing).
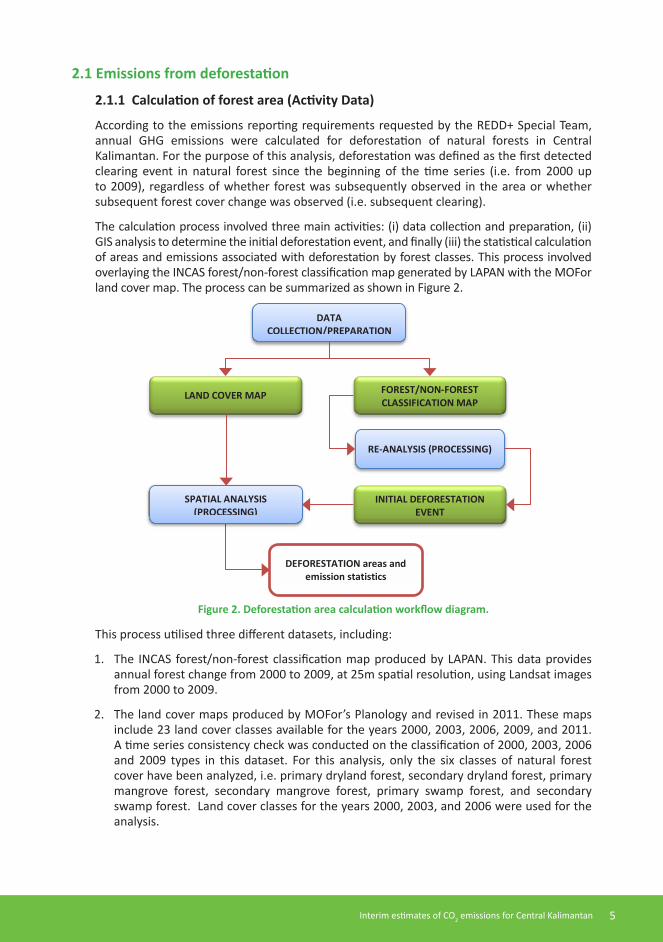
The calculation process involved three main activities: (i) data collection and preparation, (ii) GIS analysis to determine the initial deforestation event, and finally (iii) the statistical calculation of areas and emissions associated with deforestation by forest classes. This process involved overlaying the INCAS forest/non-forest classification map generated by LAPAN with the MOFor land cover map. The process can be summarized as shown in Figure 2.
Figure 2. Deforestation area calculation workflow diagram.
This process utilised three different datasets, including:
1. The INCAS forest/non-forest classification map produced by LAPAN. This data provides annual forest change from 2000 to 2009, at 25m spatial resolution, using Landsat images from 2000 to 2009.
2. The land cover maps produced by MOFor’s Planology and revised in 2011. These maps include 23 land cover classes available for the years 2000, 2003, 2006, 2009, and 2011. A time series consistency check was conducted on the classification of 2000, 2003, 2006 and 2009 types in this dataset. For this analysis, only the six classes of natural forest cover have been analyzed, i.e. primary dryland forest, secondary dryland forest, primary mangrove forest, secondary mangrove forest, primary swamp forest, and secondary swamp forest. Land cover classes for the years 2000, 2003, and 2006 were used for the analysis.
FOREST/NON-FOREST CLASSIFICATION MAP
RE-ANALYSIS (PROCESSING)
INITIAL DEFORESTATION EVENT
DEFORESTATION areas and emission statistics
LAND COVER MAP
DATA COLLECTION/PREPARATION
SPATIAL ANALYSIS (PROCESSING)
Interim estimates of CO2 emissions for Central Kalimantan6
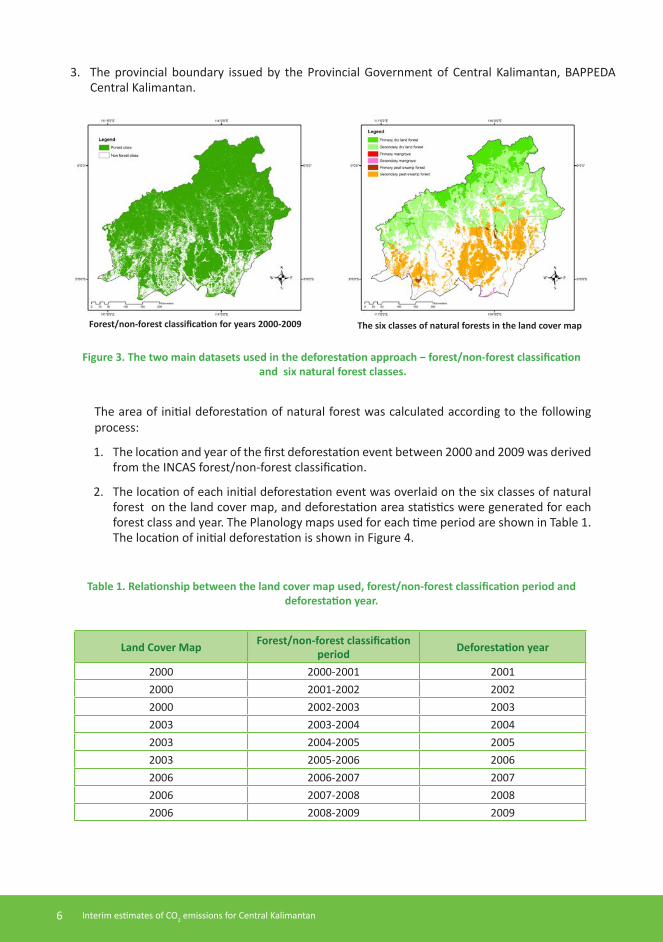
Figure 3. The two main datasets used in the deforestation approach − forest/non-forest classification and six natural forest classes.
The area of initial deforestation of natural forest was calculated according to the following process:
1. The location and year of the first deforestation event between 2000 and 2009 was derived from the INCAS forest/non-forest classification.
2. The location of each initial deforestation event was overlaid on the six classes of natural forest on the land cover map, and deforestation area statistics were generated for each forest class and year. The Planology maps used for each time period are shown in Table 1. The location of initial deforestation is shown in Figure 4.
Table 1. Relationship between the land cover map used, forest/non-forest classification period and deforestation year.
Land Cover Map Forest/non-forest classification period Deforestation year
2000 2000-2001 20012000 2001-2002 20022000 2002-2003 20032003 2003-2004 20042003 2004-2005 20052003 2005-2006 20062006 2006-2007 20072006 2007-2008 20082006 2008-2009 2009
Forest/non-forest classification for years 2000-2009 The six classes of natural forests in the land cover map
3. The provincial boundary issued by the Provincial Government of Central Kalimantan, BAPPEDA Central Kalimantan.
Interim estimates of CO2 emissions for Central Kalimantan 7
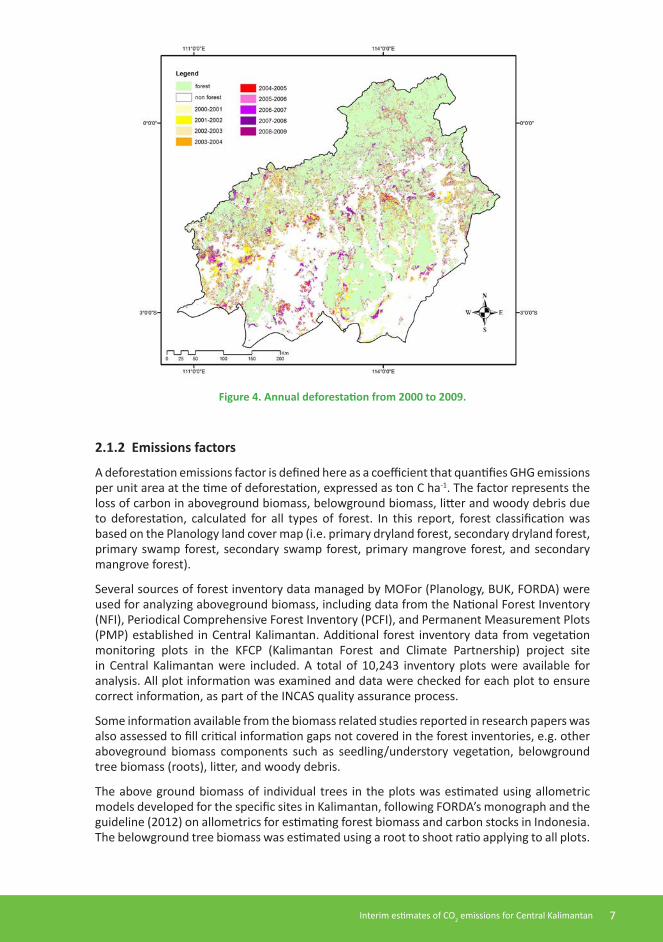
Figure 4. Annual deforestation from 2000 to 2009.
2.1.2 Emissions factors
A deforestation emissions factor is defined here as a coefficient that quantifies GHG emissions per unit area at the time of deforestation, expressed as ton C ha-1. The factor represents the loss of carbon in aboveground biomass, belowground biomass, litter and woody debris due to deforestation, calculated for all types of forest. In this report, forest classification was based on the Planology land cover map (i.e. primary dryland forest, secondary dryland forest, primary swamp forest, secondary swamp forest, primary mangrove forest, and secondary mangrove forest).
Several sources of forest inventory data managed by MOFor (Planology, BUK, FORDA) were used for analyzing aboveground biomass, including data from the National Forest Inventory (NFI), Periodical Comprehensive Forest Inventory (PCFI), and Permanent Measurement Plots (PMP) established in Central Kalimantan. Additional forest inventory data from vegetation monitoring plots in the KFCP (Kalimantan Forest and Climate Partnership) project site in Central Kalimantan were included. A total of 10,243 inventory plots were available for analysis. All plot information was examined and data were checked for each plot to ensure correct information, as part of the INCAS quality assurance process.
Some information available from the biomass related studies reported in research papers was also assessed to fill critical information gaps not covered in the forest inventories, e.g. other aboveground biomass components such as seedling/understory vegetation, belowground tree biomass (roots), litter, and woody debris.
The above ground biomass of individual trees in the plots was estimated using allometric models developed for the specific sites in Kalimantan, following FORDA’s monograph and the guideline (2012) on allometrics for estimating forest biomass and carbon stocks in Indonesia. The belowground tree biomass was estimated using a root to shoot ratio applying to all plots.
Interim estimates of CO2 emissions for Central Kalimantan8
Other unmeasured carbon pools were estimated using the relationships between other components and aboveground biomass based on previous research.
2.1.3 Deforestation Emissions Calculation
GHG emissions from deforestation are calculated by multiplying the relevant emissions factor by the area of deforestation for each natural forest type, and converting to CO2-equivalents by multiplying by 44/12.
Annual deforestation GHG emissions = emission factor X area (activity data) X (44/12)
Calculation of the annual GHG emissions from deforestation for the period of 2000 to 2009 was conducted using the above simple model. For this calculation, only the initial deforestation event was included. This analysis assumes that all above and below ground biomass, litter and woody debris are emitted immediately at the time of deforestation.
2.2 Emissions from peat decomposition
2.2.1 Peatland Area Data
For the purpose of this analysis, peatland is defined as ‘an area with an accumulation of partly decomposed organic matter, with ash content equal to or less than 35%, peat depth equal to or more than 50cm, and organic carbon content (by weight) of at least 12%’.
The area of peatland modelled is derived from the combination of the 2011 peatland map produced by the Ministry of Agriculture, and the 2000, 2003 and 2006 land cover maps revised in 2011 by MOFor Planology.
The land cover maps are the same as those used in the deforestation area calculations, providing consistency of area data between the peat decomposition and deforestation calculations (i.e. no overlapping areas). The map data and analysis methods are described in more detail in the deforestation area calculation section in 2.1.
The peatland map delineates areas of peat depth in six depth classes (<0.5m, 0.5 – 1.0m, 1.0m – 2.0m, 2.0m – 3.0m, >3.0m, unknown).
2.2.2 Peatland Area Calculation
In accordance with the peatland definition, areas with peat depth <0.5m were excluded from the analysis. Areas of unknown depth were included. Further work should be undertaken to assign peat depths to all peatland areas in the map.
The area of peatland modelled was calculated by overlaying the peatland map on the Planology land cover maps to derive the area of each land cover that occurs on peat for each year of the analysis. A sample of areas was manually checked to ensure correct intersection between the peat and land cover spatial data, as part of the INCAS quality assurance process.
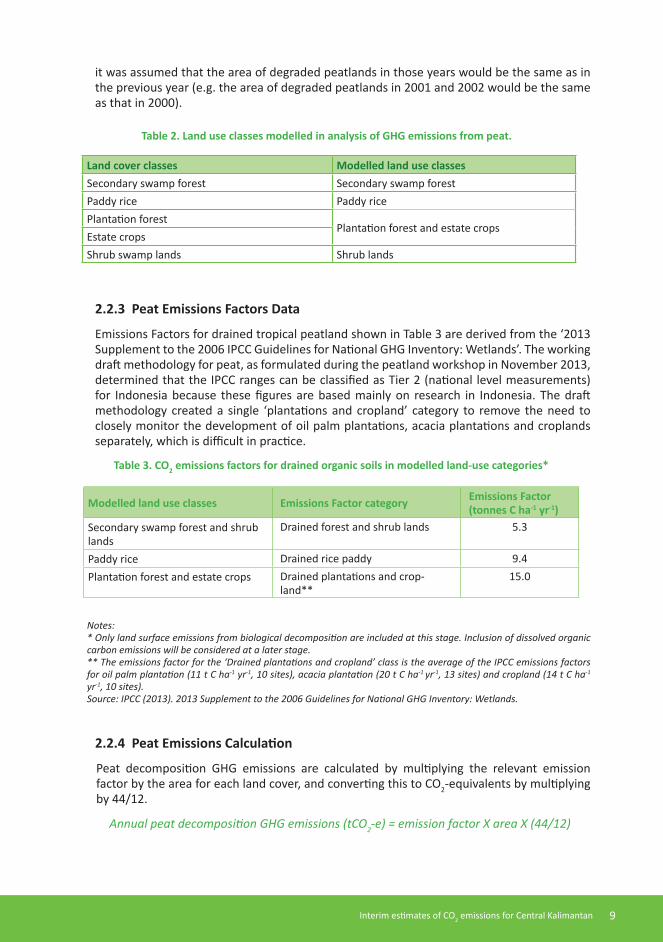
Land cover classes in the Planology maps that occur on peatland were aggregated into four land use classes for modelling, as shown in Table 2. Since the Planology maps were only available for years 2000, 2003, 2006 and 2009, for the years where no data was available,
Interim estimates of CO2 emissions for Central Kalimantan 9
2.2.3 Peat Emissions Factors Data
Emissions Factors for drained tropical peatland shown in Table 3 are derived from the ‘2013 Supplement to the 2006 IPCC Guidelines for National GHG Inventory: Wetlands’. The working draft methodology for peat, as formulated during the peatland workshop in November 2013, determined that the IPCC ranges can be classified as Tier 2 (national level measurements) for Indonesia because these figures are based mainly on research in Indonesia. The draft methodology created a single ‘plantations and cropland’ category to remove the need to closely monitor the development of oil palm plantations, acacia plantations and croplands separately, which is difficult in practice.
Table 3. CO2 emissions factors for drained organic soils in modelled land-use categories*
Modelled land use classes Emissions Factor category Emissions Factor (tonnes C ha-1 yr-1)
Secondary swamp forest and shrub lands
Drained forest and shrub lands 5.3
Paddy rice Drained rice paddy 9.4Plantation forest and estate crops Drained plantations and crop-
land**15.0
Notes: * Only land surface emissions from biological decomposition are included at this stage. Inclusion of dissolved organic carbon emissions will be considered at a later stage.** The emissions factor for the ‘Drained plantations and cropland’ class is the average of the IPCC emissions factors for oil palm plantation (11 t C ha-1 yr-1, 10 sites), acacia plantation (20 t C ha-1 yr-1, 13 sites) and cropland (14 t C ha-1 yr-1, 10 sites). Source: IPCC (2013). 2013 Supplement to the 2006 Guidelines for National GHG Inventory: Wetlands.
2.2.4 Peat Emissions Calculation
Peat decomposition GHG emissions are calculated by multiplying the relevant emission factor by the area for each land cover, and converting this to CO2-equivalents by multiplying by 44/12.
Annual peat decomposition GHG emissions (tCO2-e) = emission factor X area X (44/12)
Land cover classes Modelled land use classesSecondary swamp forest Secondary swamp forestPaddy rice Paddy ricePlantation forest
Plantation forest and estate cropsEstate cropsShrub swamp lands Shrub lands
Table 2. Land use classes modelled in analysis of GHG emissions from peat.
it was assumed that the area of degraded peatlands in those years would be the same as in the previous year (e.g. the area of degraded peatlands in 2001 and 2002 would be the same as that in 2000).
Interim estimates of CO2 emissions for Central Kalimantan10
Calculation of the annual peat decomposition emissions for the period 2000 to 2009 was conducted using the INCAS Peatland Model, a simple, event-driven Excel workbook designed to estimate GHG emissions from peat through decomposition and sub-surface fire. For this calculation, only peat decomposition was modelled.
Calculations were checked to ensure the correct emissions factors were applied to the correct areas as part of the INCAS quality assurance process. This analysis assumes that all disturbed peatlands will be drained and completely decomposed.
Interim estimates of CO2 emissions for Central Kalimantan 11
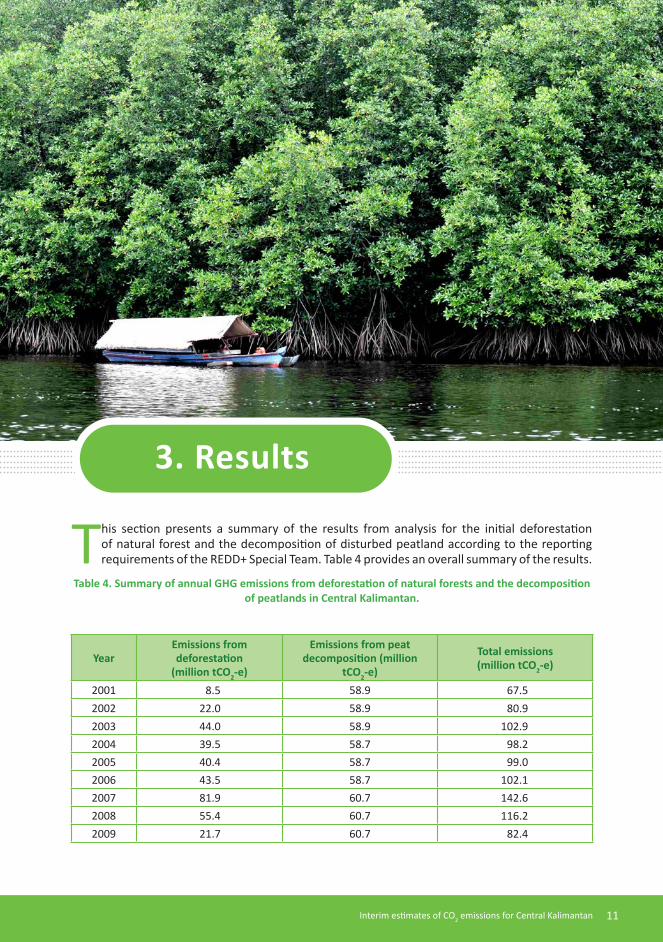
This section presents a summary of the results from analysis for the initial deforestation of natural forest and the decomposition of disturbed peatland according to the reporting requirements of the REDD+ Special Team. Table 4 provides an overall summary of the results.
Table 4. Summary of annual GHG emissions from deforestation of natural forests and the decomposition of peatlands in Central Kalimantan.
3. Results
YearEmissions from deforestation
(million tCO2-e)
Emissions from peat decomposition (million
tCO2-e)
Total emissions (million tCO2-e)
2001 8.5 58.9 67.52002 22.0 58.9 80.92003 44.0 58.9 102.92004 39.5 58.7 98.22005 40.4 58.7 99.02006 43.5 58.7 102.12007 81.9 60.7 142.62008 55.4 60.7 116.22009 21.7 60.7 82.4
Interim estimates of CO2 emissions for Central Kalimantan12
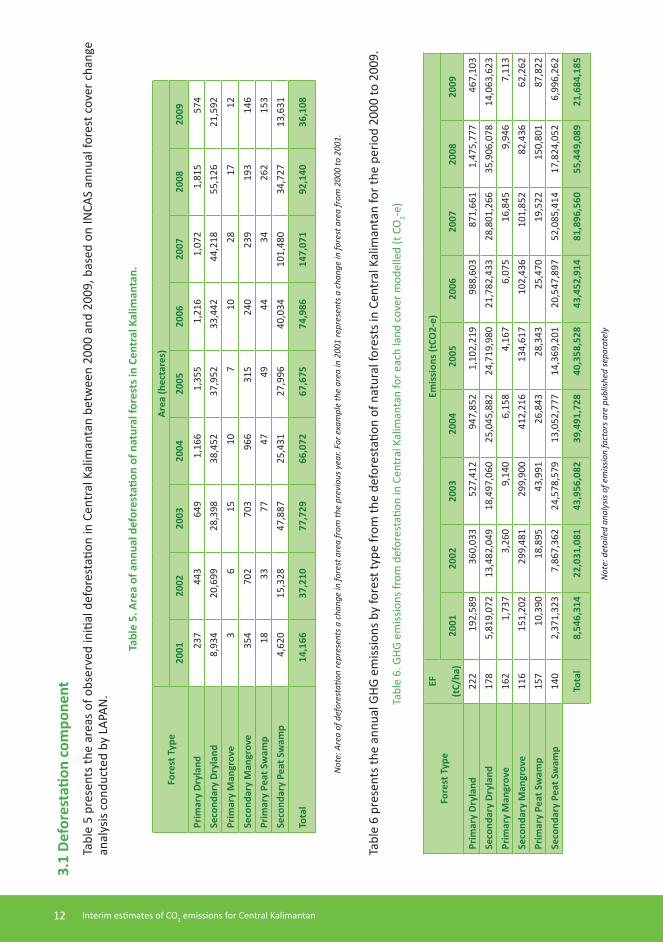
3.1
Defo
rest
ation
com
pone
ntTa
ble
5 pr
esen
ts th
e ar
eas
of o
bser
ved
initi
al d
efor
esta
tion
in C
entr
al K
alim
anta
n be
twee
n 20
00 a
nd 2
009,
bas
ed o
n IN
CAS
annu
al fo
rest
cov
er c
hang
e an
alys
is co
nduc
ted
by L
APAN
.
Tabl
e 5.
Are
a of
ann
ual d
efor
esta
tion
of n
atur
al fo
rest
s in
Cent
ral K
alim
anta
n.
Not
e: A
rea
of d
efor
esta
tion
repr
esen
ts a
cha
nge
in fo
rest
are
a fr
om th
e pr
evio
us y
ear.
For e
xam
ple
the
area
in 2
001
repr
esen
ts a
cha
nge
in fo
rest
are
a fr
om 2
000
to 2
001.
Tabl
e 6
pres
ents
the
annu
al G
HG e
miss
ions
by
fore
st ty
pe fr
om th
e de
fore
stati
on o
f nat
ural
fore
sts i
n Ce
ntra
l Kal
iman
tan
for t
he p
erio
d 20
00 to
200
9.
Tabl
e 6.
GHG
em
issio
ns fr
om d
efor
esta
tion
in C
entr
al K
alim
anta
n fo
r eac
h la
nd c
over
mod
elle
d (t
CO
2-e)
Fore
st T
ype
Area
(hec
tare
s)
2001
2002
2003
2004
2005
2006
2007
2008
2009
Prim
ary
Dryl
and
237
443
649
1,16
61,
355
1,21
61,
072
1,81
557
4Se
cond
ary
Dryl
and
8,93
420
,699
28,3
9838
,452
37,9
5233
,442
44,2
1855
,126
21,5
92
Prim
ary
Man
grov
e3
615
107
1028
1712
Seco
ndar
y M
angr
ove
354
702
703
966
315
240
239
193
146
Prim
ary
Peat
Sw
amp
1833
7747
4944
3426
215
3Se
cond
ary
Peat
Sw
amp
4,62
015
,328
47,8
8725
,431
27,9
9640
,034
101,
480
34,7
2713
,631
Tota
l14
,166
37,2
1077
,729
66,0
7267
,675
74,9
8614
7,07
192
,140
36,1
08
Fore
st T
ype
EF
(tC/
ha)
Emis
sion
s (tC
O2-
e)
2001
2002
2003
2004
2005
2006
2007
2008
2009
Prim
ary
Dryl
and
222
192,
589
360,
033
527,
412
947,
852
1,10
2,21
998
8,60
387
1,66
11,
475,
777
467,
103
Seco
ndar
y Dr
ylan
d17
85,
819,
072
13,4
82,0
4918
,497
,060
25,0
45,8
8224
,719
,980
21,7
82,4
3328
,801
,266
35,9
06,0
7814
,063
,623
Prim
ary
Man
grov
e16
21,
737
3,26
09,
140
6,15
84,
167
6,07
516
,845
9,94
67,
113
Seco
ndar
y M
angr
ove
116
151,
202
299,
481
299,
900
412,
216
134,
617
102,
436
101,
852
82,4
3662
,262
Prim
ary
Peat
Sw
amp
157
10,3
9018
,895
43,9
9126
,843
28,3
4325
,470
19,5
2215
0,80
187
,822
Seco
ndar
y Pe
at S
wam
p14
02,
371,
323
7,86
7,36
224
,578
,579
13,0
52,7
7714
,369
,201
20,5
47,8
9752
,085
,414
17,8
24,0
526,
996,
262
Tota
l8,
546,
314
22,0
31,0
8143
,956
,082
39,4
91,7
2840
,358
,528
43,4
52,9
1481
,896
,560
55,4
49,0
8921
,684
,185
Not
e: d
etai
led
anal
ysis
of e
miss
ion
fact
ors a
re p
ublis
hed
sepa
rate
ly
Interim estimates of CO2 emissions for Central Kalimantan 13
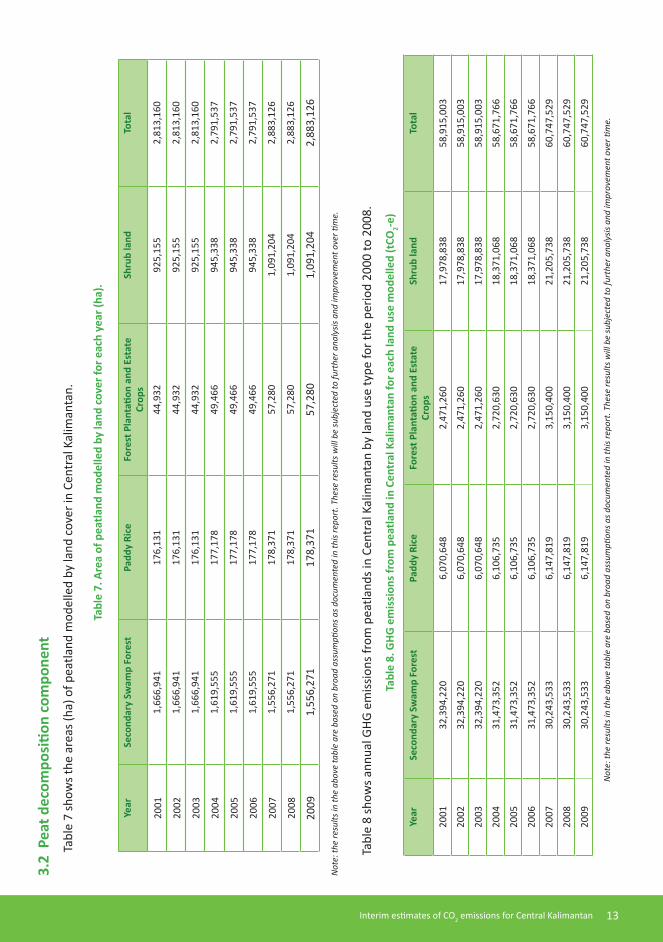
3.2
Pea
t dec
ompo
sitio
n co
mpo
nent
Tab
le 7
show
s the
are
as (h
a) o
f pea
tland
mod
elle
d by
land
cov
er in
Cen
tral
Kal
iman
tan.
Tabl
e 7.
Are
a of
pea
tland
mod
elle
d by
land
cov
er fo
r eac
h ye
ar (h
a).
Year
Seco
ndar
y Sw
amp
Fore
stPa
ddy
Rice
Fore
st P
lant
ation
and
Est
ate
Crop
sSh
rub
land
Tota
l
2001
1,66
6,94
117
6,13
144
,932
925,
155
2,81
3,16
0
2002
1,66
6,94
117
6,13
144
,932
925,
155
2,81
3,16
0
2003
1,66
6,94
117
6,13
144
,932
925,
155
2,81
3,16
0
2004
1,61
9,55
517
7,17
849
,466
945,
338
2,79
1,53
7
2005
1,61
9,55
517
7,17
849
,466
945,
338
2,79
1,53
7
2006
1,61
9,55
517
7,17
849
,466
945,
338
2,79
1,53
7
2007
1,55
6,27
117
8,37
157
,280
1,09
1,20
42,
883,
126
2008
1,55
6,27
117
8,37
157
,280
1,09
1,20
42,
883,
126
2009
1,55
6,27
117
8,37
157
,280
1,09
1,20
42,
883,
126
Tabl
e 8
show
s ann
ual G
HG e
miss
ions
from
pea
tland
s in
Cent
ral K
alim
anta
n by
land
use
type
for t
he p
erio
d 20
00 to
200
8.
Tabl
e 8.
GHG
em
issi
ons f
rom
pea
tland
in C
entr
al K
alim
anta
n fo
r eac
h la
nd u
se m
odel
led
(tCO
2-e)
Year
Seco
ndar
y Sw
amp
Fore
stPa
ddy
Rice
Fore
st P
lant
ation
and
Est
ate
Crop
sSh
rub
land
Tota
l
2001
32,3
94,2
206,
070,
648
2,47
1,26
017
,978
,838
58,9
15,0
03
2002
32,3
94,2
206,
070,
648
2,47
1,26
017
,978
,838
58,9
15,0
03
2003
32,3
94,2
206,
070,
648
2,47
1,26
017
,978
,838
58,9
15,0
03
2004
31,4
73,3
526,
106,
735
2,72
0,63
018
,371
,068
58,6
71,7
66
2005
31,4
73,3
526,
106,
735
2,72
0,63
018
,371
,068
58,6
71,7
66
2006
31,4
73,3
526,
106,
735
2,72
0,63
018
,371
,068
58,6
71,7
66
2007
30,2
43,5
336,
147,
819
3,15
0,40
021
,205
,738
60,7
47,5
29
2008
30,2
43,5
336,
147,
819
3,15
0,40
021
,205
,738
60,7
47,5
29
2009
30,2
43,5
336,
147,
819
3,15
0,40
021
,205
,738
60,7
47,5
29
Not
e: th
e re
sults
in th
e ab
ove
tabl
e ar
e ba
sed
on b
road
ass
umpti
ons a
s doc
umen
ted
in th
is re
port
. The
se re
sults
will
be
subj
ecte
d to
furt
her a
naly
sis a
nd im
prov
emen
t ove
r tim
e.
Not
e: th
e re
sults
in th
e ab
ove
tabl
e ar
e ba
sed
on b
road
ass
umpti
ons a
s doc
umen
ted
in th
is re
port
. The
se re
sults
will
be
subj
ecte
d to
furt
her a
naly
sis a
nd im
prov
emen
t ove
r tim
e.
Interim estimates of CO2 emissions for Central Kalimantan14
4. Discussion
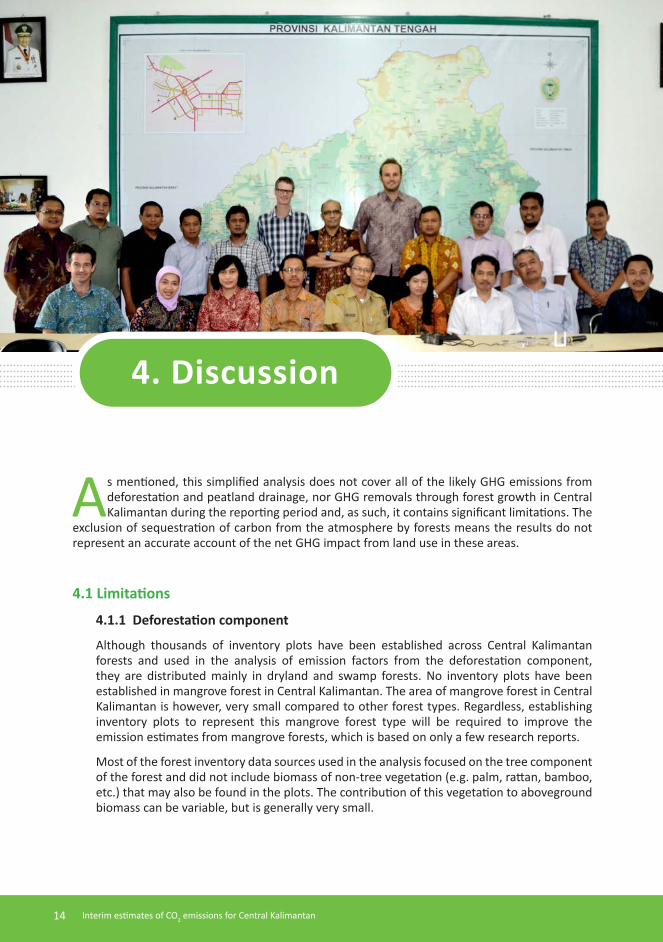
As mentioned, this simplified analysis does not cover all of the likely GHG emissions from deforestation and peatland drainage, nor GHG removals through forest growth in Central Kalimantan during the reporting period and, as such, it contains significant limitations. The
exclusion of sequestration of carbon from the atmosphere by forests means the results do not represent an accurate account of the net GHG impact from land use in these areas.
4.1 Limitations
4.1.1 Deforestation component
Although thousands of inventory plots have been established across Central Kalimantan forests and used in the analysis of emission factors from the deforestation component, they are distributed mainly in dryland and swamp forests. No inventory plots have been established in mangrove forest in Central Kalimantan. The area of mangrove forest in Central Kalimantan is however, very small compared to other forest types. Regardless, establishing inventory plots to represent this mangrove forest type will be required to improve the emission estimates from mangrove forests, which is based on only a few research reports.
Most of the forest inventory data sources used in the analysis focused on the tree component of the forest and did not include biomass of non-tree vegetation (e.g. palm, rattan, bamboo, etc.) that may also be found in the plots. The contribution of this vegetation to aboveground biomass can be variable, but is generally very small.
Interim estimates of CO2 emissions for Central Kalimantan 15
In terms of estimating the deforestation area, there are several limitations:
a. The definition of deforestation adopted for this interim account is “first detected clearing event in natural forest since the beginning of the available time series”. LAPAN will be processing additional imagery from 1990-1999 which will mean that the area of first change from forest to non-forest will be very different in future accounts.
b. After the automatic classification of forest/non-forest there is a need for a manual verification step. LAPAN is still working to improve the accuracy of the change events. The continuous improvement plan will also need to ensure the definition of deforestation is consistent with the REDD+ policy settings agreed at the 2013 Warsaw climate talks.
c. The GHG removals associated with regrowth on land are not included in this calculation.
4.1.2 Peat decomposition component
The peat decomposition analysis is constrained by incomplete data and gaps in scientific knowledge.
The peat map is missing peat depth data for 18% of the peat area. Some of this area may be less than 0.5m in depth and hence would not meet the definition of peatland adopted for this analysis. This could result in an overestimation of the area of peatland in the classes analysed, and hence an overestimation of peat decomposition emissions.
The land cover maps were produced every three years, not annually, meaning emissions factors may not be applied to the correct area in each year, e.g. if an area changes from one class to another (e.g. secondary swamp forest to paddy rice fields) in intervening years.
Emissions factors represent an average value for each land cover regardless of the timing and intensity of management events. It is known that peat decomposition rates vary over time according to climatic variables, principally rainfall, type of activities, and time since each activity. For example, emissions in the years immediately following clearing are believed to be significantly higher than the emission factors used in this analysis; however there is not yet scientific agreement on such values. Ongoing research is expected to improve understanding of GHG emissions from specific activity types and timing.
4.2 Improvement Plan A more detailed account of GHG emissions is already under development in the INCAS pilot system for Central Kalimantan. This will account for more observable GHG emissions and sinks using a modeled mass balance approach.
4.2.1 Deforestation component
A more detailed approach to calculating emissions from forests can be established in future GHG accounts. Such an account could include more forest types than the simple three biomass classes and two forest conditions modeled in this approach. An event-driven system can be developed which includes additional deforestation and reforestation events and accounts for both GHG emissions and removals. LAPAN has already generated
Interim estimates of CO2 emissions for Central Kalimantan16
annual forest cover change analysis, including forest loss and gain, to enable this. Forest cover change analysis will be further reviewed and attributed by forest experts with good knowledge of the on-ground forest estate.
A future system will not assume all emissions are released when forest cover change is first observed i.e. the ongoing decay of woody debris will be quantified.
Additionally, finer resolution data of rainfall, topography, soil type and climate will better represent forest type (biomass classes) and better capture the variability in forest biomass and hence carbon content across the forest estate. Consequently the magnitude of emissions and removals when forests are subject to change can be better estimated.
4.2.2 Peat decomposition component
Peat mapping, particularly peat depth, should be improved to confirm the areas meeting the peat definition. In addition, the peatland map should be combined with a ground water table map to indicate whether the peat area is drained or not.
Further research should be undertaken to relate peat emissions factors to specific land management events. The magnitude and duration of emissions should be defined for each type of event and initial site condition (e.g. forest type, forest condition, land use history).

Interim estimates of CO2 emissions for Central Kalimantan 17