Embed Size (px)
Citation preview
Integrating peatland and permafrost dynamics in dynamic vegetation model (LPJ-GUESS)
PhD Half time seminar review
Nitin Chaudhary PhD-Student
Department of Physical Geography and Ecosystem Science
Lund University Supervisors
Ben Smith and Paul Miller
Introduction
Dynamic global vegetation models (DGVMs) are considered an important platform to study past, present and future vegetation patterns together with associated biogeochemical cycles and climate feedbacks (Smith et al. 2001, Gerten et al. 2004, Beer et al. 2007, Sitch et al. 2008, Smith et al. 2011). However, very few attempts have been made to simulate peatlands using DGVMs (Wania et al. 2009a, 2009b, Kleinen et al. 2012). Peatlands are unique terrestrial ecosystems mostly present in northern latitudes. They are one of the biggest carbon sinks among terrestrial ecosystems. These ecosystems have accumulated carbon at a rate of around 20-30 g CO2-C m-2 yr-1 in the last 5000 to 10000 years. In total, they have approximately sequestered 200-550 PgC covering about 3.5 million km-2 areas (Gorham 1991, Turunen et al. 2002, Yu 2012). They are also one of the major sources of methane contributing significantly to the green house effect (IPCC, 2013).
Soils at or below 0°C for two or more years are considered permafrost soils. Majority of northern peatland areas coincide with low altitude permafrost. Presence or absence of permafrost has very different effects on peat accumulation and hydrology (IPCC, 2013). Permafrost not only changes the accumulation process by changing the above ground vegetation productivity but the decomposition processes is also altered affecting the carbon sequestration rate. According to an estimate in North America, permafrost peatlands store around 53.5 PgC while nonpermafrost peatlands store around 124.6 PgC with current accumulation rate 12.9 gC m-2 y-1 and 25.3 gC m-2 y-1 respectively (Bridgham et al. 2007, Wania et al. 2009a). In some peatland areas, permafrost impede drainage and accelerates peat accumulation while in others it leads to drier conditions reducing the carbon accumulation rates (Robinson and Moore 2000). In turn peat layers also influence permafrost dynamics by altering soil thermodynamics (Nicolsky et al. 2007).
There is a scientific consensus that the climate is likely to warm over northern regions in the coming century. Current climate models predict that the northern high latitudes where most of the peatlands and permafrost areas are situated could experience warming of more than 5°C by 2100(Christensen et al. 2007). The warm climate may remove the constraints on biological activity leading to higher productivity and decomposition rates. This shift in the balance between production and decomposition might be sufficient to turn these ecosystems presently acting as a net carbon sink (Clymo 1984, Frolking et al. 2002) into a carbon (CO2 and CH4) source (Wieder 2001, Ise et al. 2008, Fan et al. 2013). It is also highlighted that permafrost peatlands behave differently in changing climate conditions. Thawing of permafrost modifies hydrology and moisture balance of peat soil which could in turn changes the above ground vegetation composition and carbon balance of many northern peatlands (Christensen et al. 2004).
Many different models have been developed to understand and study the peatland dynamics. (Clymo 1984) developed a simple one-dimensional peat accumulation model and described the main processes and mechanisms involved in peatland growth and its development. This model became the central point for the future work in many peat growth studies. (Hilbert et al. 2000) also developed a theoretical annual step peat
growth model showing the interaction between peat accumulation and water table depth using two coupled non-linear differential equations. The model has the dynamic interaction between water and carbon cycle providing a simple representation of peat functioning on longer time scale by focusing on non-linear interactions. It showed that system could reach to equilibrium states where deep peat is associated with deeper water tables and shallow peat with shallower water tables. Using similar approach, (Frolking et al. 2010), developed an advanced Holocene peat model which combines the dynamic peat accumulation model (Hilbert et al. 2000) and peat decomposition model (Frolking et al. 2002). In this model, annually a peat layer/cohort deposit above the previously accumulated peat layers. Over the period of time, these layers loose mass through decomposition. Though the above models are detailed enough to capture the peat accumulation and decomposition processes quite robustly but they lack soil freezing-thawing scheme. Lately, (Wania et al. 2009a, 2009b), took another approach by including peatland functionality in dynamic vegetation model (LPJ-DGVM) with detailed soil freezing-thawing scheme. Among others, two new peatland specific plant functional types and inundation stress scheme are also incorporated in the model. However, the model used a simple two-layered (acrotelm and catotelm) approach to simulate the peatland dynamics. While these models improve our understanding about peatland dynamics and its functioning, some areas still require extensive research.
In the present study, we have incorporated the peatland functionality in the state-of-the-art dynamic vegetation model (LPJ-GUESS) in order to understand the long-term dynamics of northern peatland ecosystems and assess the effect of climate changes on peatland carbon balance. We implemented an individual cohort scheme to capture the dynamics of peat soils (Hilbert et al. 2000, Frolking et al. 2010) together with a robust soil freezing-thawing functionality (Wania et al. 2009a). This model also includes feedbacks of hydrology, peat properties and vegetation dynamics in order to understand how these feedbacks affect the peat growth in long time scale. This work gives a clear understanding of the origin, growth pattern and behaviour of peatlands, which would in turn shed light on the possible role of peatlands in global carbon balance in the future. Objectives
• To incorporate peatland initialization and dynamics, two-dimensional (2-D) peat microtopography and carbon accumulation and cycling functionality in the Arctic-enabled version of the dynamic vegetation model (LPJ-GUESS)
• To understand the long-term peat accumulation and peatland dynamics
• To investigate the vulnerability of high-latitude peatlands to climate change
• To determine the effects of microtopographic variations and a dynamic water
table on competitive interactions between peat forming plants
• To understand the consequences of above interactions on long-term peat accumulation and the behaviour of microtopographic structure
Model Overview and Development In the first two studies (Paper I and Paper II), we have updated the dynamic vegetation model LPJ-GUESS, now known as LPJ-GUESS Peatland. Due to the low computational cost, it has the ability to run on longer timescales covering glacial and interglacial periods. The model implements long-term peat accumulation and decomposition, peatland hydrology, soil thermal dynamics and freezing and thawing cycle. In general, these processes are crucial to understand the long-term peatland growth and development. The key formulations such as annual peat accumulation and decomposition functionalities follow (Hilbert et al. 2000, Frolking et al. 2010) and soil thawing-freezing functionality is inspired from (Wania et al. 2009a). With reasonable representation of soil hydrology and thermal dynamics of peat soils, our model realistically simulates plant productivity, decomposition rate and permafrost dynamics. LPJ-GUESS (wetland version)
LPJ-GUESS (Lund-Potsdam-Jena General Ecosystem Simulator; Smith et al 2001) is a process-based model of vegetation dynamics, physiological changes and biogeochemistry of terrestrial ecosystems. It simulates vegetation structure and composition in response to changing climate conditions and is optimized for regional and global applications. (Sitch et al. 2003; Smith et al. 2001 and Hickler et al. 2004, Smith et al. 2014). LPJ-GUESS follows mechanistic representation of biophysical and biogeochemical processes of Lund-Potsdam-Jena dynamic global vegetation model (LPJ-DGVM; Sitch et al. 2003; Gerten et al. 2004). However, LPJ-GUESS replaces the large area parameterization scheme of LPJ-DGVM, whereby vegetation processes are calculated in simpler and faster manner by averaging out several state variables over a large area, with more robust and mechanistic schemes of plant resource competition and woody plant population dynamics. Vegetation dynamics in the model arise from differential and stochastic rate of establishment, reproduction, mortality and disturbance among plant types in replicate patches for each simulated site (or grid cell). The biospheric vegetation is characterized as a composition of plant functional groups based on their physiognomic and morphological traits. The model includes 21 major plant functional groups of arctic, subarctic and high-boreal biomes. However, we have included only 4 PFTs – mosses, grasses and summer green and evergreen low shrubs in this study representing the major plant types of arctic peatlands. These plant groups have different parameterizations of physiological processes, for instance those relating to photosynthetic pathway, leaf thickness, allocation, phenology, and rooting depth. Detailed descriptions of plant functional groups are given in Smith et al. 2001, Sitch et al. 2003, Wolf et al (2008), Miller and Smith (2012), and Zhang et al. (2013). LPJ-GUESS version 2.1 has been further modified to incorporate the dynamic peatland functionality. It is developed from the peatland verison of LPJ-GUESS described in (McGuire et al. 2012) and references therein. The model is updated to simulate upland and peatland ecosystems (McGuire et al. 2012). It shares the soil thawing-freezing processes, peatland hydrology and methane emissions with LPJ DGVM by Wania et al 2010. In order to realistically simulate the soil thermal dynamics and hydrological changes,
we improved the standard LPJ double layer soil structure. Changes in these two important determinants provide much robust representation of arctic soil dynamics. In the new scheme, the soil column is divided in to four columns - a snow layer of variable thickness, a litter/peat layer of variable thickness, a mineral soil column with fixed depth of 2 m (with sublayers of thickness 0.1 m), and finally a “padding” column of depth 48 m (with thicker sublayers). These change simulating accurate arctic soil thermal dynamics. Insulation effects of snow, phase change in soil water, precipitation input and air temperature forcing are important determinants for daily soil temperature dynamics at different sublayers. Information about more processes and model structure can be found in (Smith et al. 2001, McGuire et al. 2012).
Litterfall Litterfall is characterized as fresh, undecomposed plant material mainly composed of dead plant debris such as wood, leaf, roots and seeds. Different plant types accumulate carbon in the litter pool at different rate according to their productivity. Except moss, litter originates from other plant types decompose at much faster rate. On the contrary, woody litter mass from shrubs and trees decomposes slowly because they are made up of hard cellulose and lignin. In the model, we allowed the fresh litter debris to decompose by surface forcing until the last day of the year. The decomposed litter carbon directly goes to the atmosphere while all the remaining litter mass is treated as an individual peat layer from the first day of the year which squeezes under the newly accumulating litter mass. Peat accumulation and decomposition Peat is partially decomposed litter produced by the vegetation. Peat accumulation starts when annual net primary productivity (NPP) is higher than the decomposition rate. This positive mass balance leads to an accumulation of several meters thick peat, separated into the acrotelm and the catotelm. They are two functionally distinct layers typical of most peatland areas. The boundary between these two layers is marked by the transition from the presence of living plant parts to the dead plant parts. Acrotelm is the top layer, which plays the main role in determining vegetation composition. The water table keeps on fluctuating in this layer making both aerated and anoxic conditions. Due to uneven wetness, litter decomposes aerobically as well as anaerobically in the acrotelm (Clymo 1991, Frokling 2002). The catotelm exists below the permanent annual water table position (WTP) and remains waterlogged throughout the year, creating anoxic conditions, which in turn attenuates the decomposition rate and promotes peat accumulation. This model implicitly divides the total peat column into two parts—acrotelm and catotelm—demarcated by annual WTP. Annually, plant biomass is deposited as a new layer over previously accumulated peat layers. Decomposition transforms the litter biomass in each layer into peat as time passes. The rate of change in peat mass is the total peat production minus total peat loss due to decomposition, modeled as: !"!"= A− K ∗M (1)
where M (kgC m-2) is the total peat mass, A is the total peat input (kgC m-2 y-1), and K is the decomposition rate (y-1). Peat height is derived from bulk density values of individual peat layers where 50% of the accumulated mass is considered as carbon mass. The decomposition process is simulated on a daily time step based on the
decomposability of litter type and peat physical properties. Differences in the peat decomposition rate between the plant types arise from their intrinsic properties and structure. This difference in their decomposability is represented by the initial decomposition rate (see Eq. 2) (Aerts et al. 1999, Frolking et al. 2001). The initial decomposition rates reduce over time using simplified first order reduction equation (Clymo et al. 1998, Frolking et al. 2001): k = k𝑜 (!𝑡
!𝑜 ) (2)
where ko is the initial decomposition, mo is the initial mass and mt is the mass remaining after some point in time (t). Peat water content and thermal dynamics simulated at different depths and have a multiplicative effect on daily decomposition rate (K) in each layer following (Lloyd and Taylor 1994, Ise et al. 2008) Eq. (3): K𝑖 = k𝑖 ∗ T𝑚 ∗W𝑚 (3) where ki is the decomposition rate of layer i and Tm and Wm are the temperature and moisture multipliers, respectively. Peat decomposition is higher when the peat water content is below the field capacity while decomposition rate decreases in very wet or dry conditions (Eq. 4 and 5). Thus, above field capacity,
Wm = 1.0− 1.0− 0.025 !!!opt!.!!!opt
!.! (4)
Below field capacity,
Wm = 1.0− !opt!!!opt
!.! (5)
where θ is the volumetric water content and θopt = 0.75, is the field capacity and optimum volumetric water content where Wm becomes 1.0. The temperature multiplier is exponentially related to the peat temperature (see Eq. 6) (Frolking 2002). We ceased the decomposition process in frozen conditions when fraction of ice content is greater than zero.
Tm =
0, Ti < Tmin and I > 0
!i−!min
!min , Tmin < Ti < 0°C
Q10𝑇𝑖10 Ti > 0°C
(6)
where Ti is the peat temperature in peat layer (i), Tmin = -4°C is the lowest temperature below which heterotrophic decomposition stops and I is the ice content in peat layer (i). In standard LPJ GUESS, mineral soil layers are subdivided into 20 sublayers to calculate soil temperature at different depths. In the present model, new peat layers are present on the top of these mineral soil layers. Since these individual peat layers are too thin to implement the heat diffusion equation (see Eq. 7), they are therefore, aggregated into number of sublayers. We start the calculation with 3 sublayers of equal depth and after every half a meter of peat accumulation a new sublayer is added. The soil temperature is calculated in these sublayers by numerically solving the heat diffusion equation using a Crank-Nicolson finite difference (see Eq. 7). Soil temperature is then updated daily in corresponding peat layers from these sublayers. Refer McGaurie 2012 and Wania et al 2009 for detailed description of soil temperature and thermal diffusion schemes.
!!!!= !
!!D z !!
!! (7)
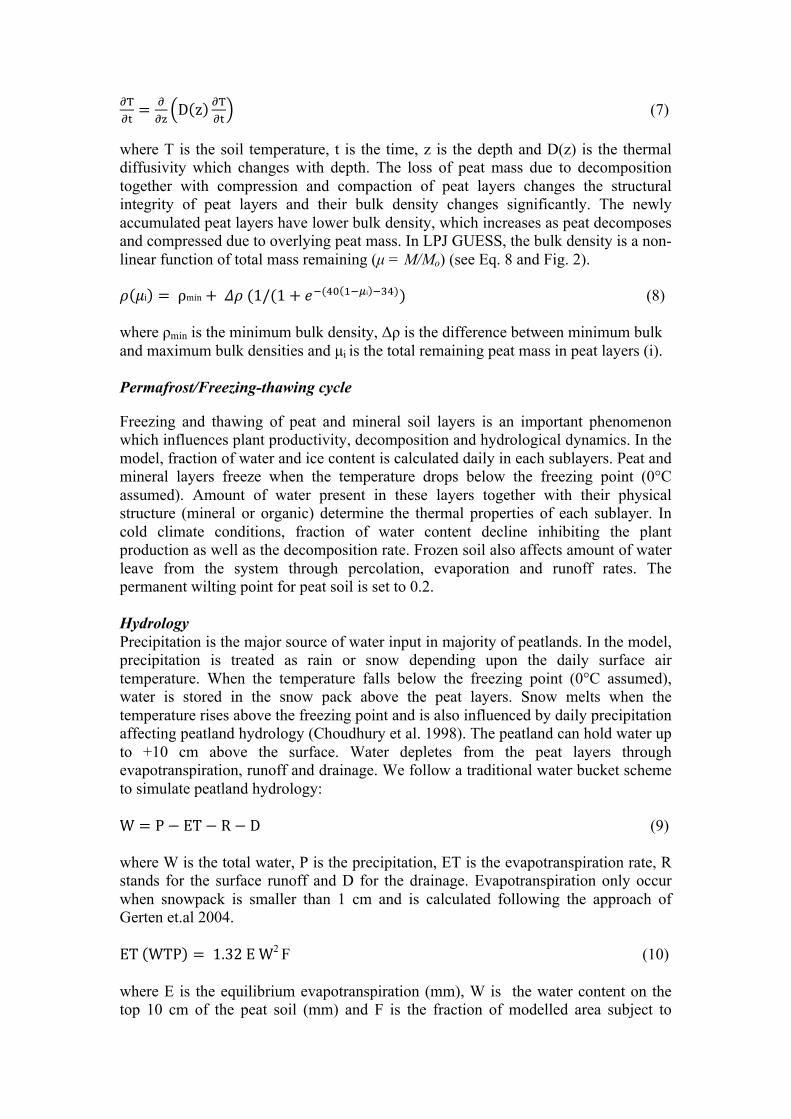
where T is the soil temperature, t is the time, z is the depth and D(z) is the thermal diffusivity which changes with depth. The loss of peat mass due to decomposition together with compression and compaction of peat layers changes the structural integrity of peat layers and their bulk density changes significantly. The newly accumulated peat layers have lower bulk density, which increases as peat decomposes and compressed due to overlying peat mass. In LPJ GUESS, the bulk density is a non-linear function of total mass remaining (µ = M/Mo) (see Eq. 8 and Fig. 2).
𝜌 𝜇i = ρmin+ 𝛥𝜌 (1/(1+ 𝑒!(!" !!!i !!")) (8) where ρmin is the minimum bulk density, Δρ is the difference between minimum bulk and maximum bulk densities and µi is the total remaining peat mass in peat layers (i). Permafrost/Freezing-thawing cycle
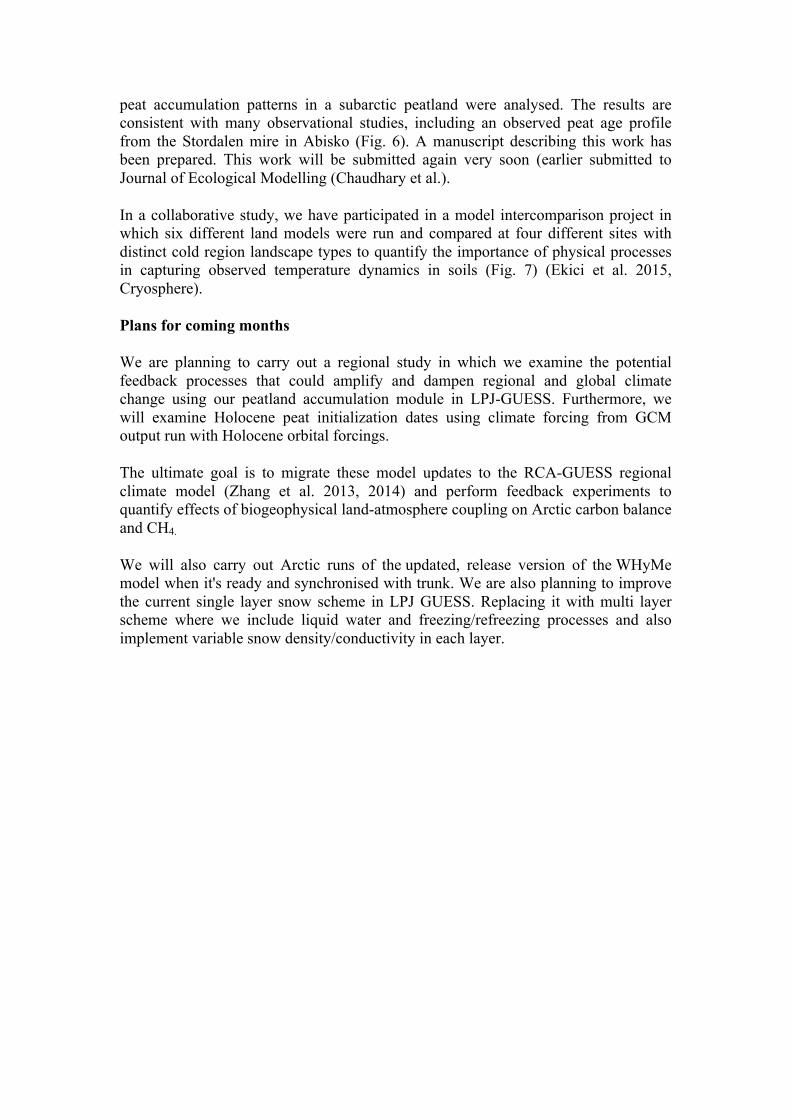
Freezing and thawing of peat and mineral soil layers is an important phenomenon which influences plant productivity, decomposition and hydrological dynamics. In the model, fraction of water and ice content is calculated daily in each sublayers. Peat and mineral layers freeze when the temperature drops below the freezing point (0°C assumed). Amount of water present in these layers together with their physical structure (mineral or organic) determine the thermal properties of each sublayer. In cold climate conditions, fraction of water content decline inhibiting the plant production as well as the decomposition rate. Frozen soil also affects amount of water leave from the system through percolation, evaporation and runoff rates. The permanent wilting point for peat soil is set to 0.2. Hydrology Precipitation is the major source of water input in majority of peatlands. In the model, precipitation is treated as rain or snow depending upon the daily surface air temperature. When the temperature falls below the freezing point (0°C assumed), water is stored in the snow pack above the peat layers. Snow melts when the temperature rises above the freezing point and is also influenced by daily precipitation affecting peatland hydrology (Choudhury et al. 1998). The peatland can hold water up to +10 cm above the surface. Water depletes from the peat layers through evapotranspiration, runoff and drainage. We follow a traditional water bucket scheme to simulate peatland hydrology: W = P− ET− R− D (9) where W is the total water, P is the precipitation, ET is the evapotranspiration rate, R stands for the surface runoff and D for the drainage. Evapotranspiration only occur when snowpack is smaller than 1 cm and is calculated following the approach of Gerten et.al 2004. ET WTP = 1.32 E W2 F (10) where E is the equilibrium evapotranspiration (mm), W is the water content on the top 10 cm of the peat soil (mm) and F is the fraction of modelled area subject to
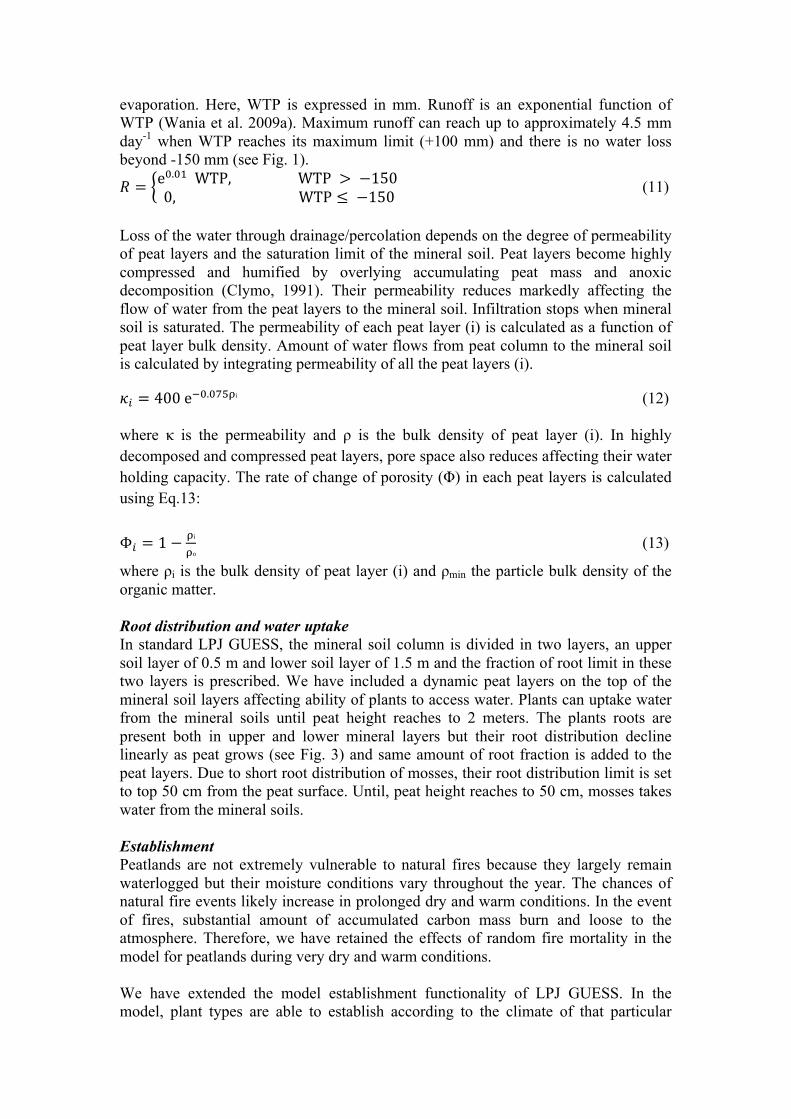
evaporation. Here, WTP is expressed in mm. Runoff is an exponential function of WTP (Wania et al. 2009a). Maximum runoff can reach up to approximately 4.5 mm day-1 when WTP reaches its maximum limit (+100 mm) and there is no water loss beyond -150 mm (see Fig. 1).
𝑅 = e!.!" WTP, WTP > −150 0, WTP ≤ −150 (11)
Loss of the water through drainage/percolation depends on the degree of permeability of peat layers and the saturation limit of the mineral soil. Peat layers become highly compressed and humified by overlying accumulating peat mass and anoxic decomposition (Clymo, 1991). Their permeability reduces markedly affecting the flow of water from the peat layers to the mineral soil. Infiltration stops when mineral soil is saturated. The permeability of each peat layer (i) is calculated as a function of peat layer bulk density. Amount of water flows from peat column to the mineral soil is calculated by integrating permeability of all the peat layers (i). 𝜅! = 400 e!!.!"#$i (12) where κ is the permeability and ρ is the bulk density of peat layer (i). In highly decomposed and compressed peat layers, pore space also reduces affecting their water holding capacity. The rate of change of porosity (Φ) in each peat layers is calculated using Eq.13: Φ! = 1− !i
!o (13)
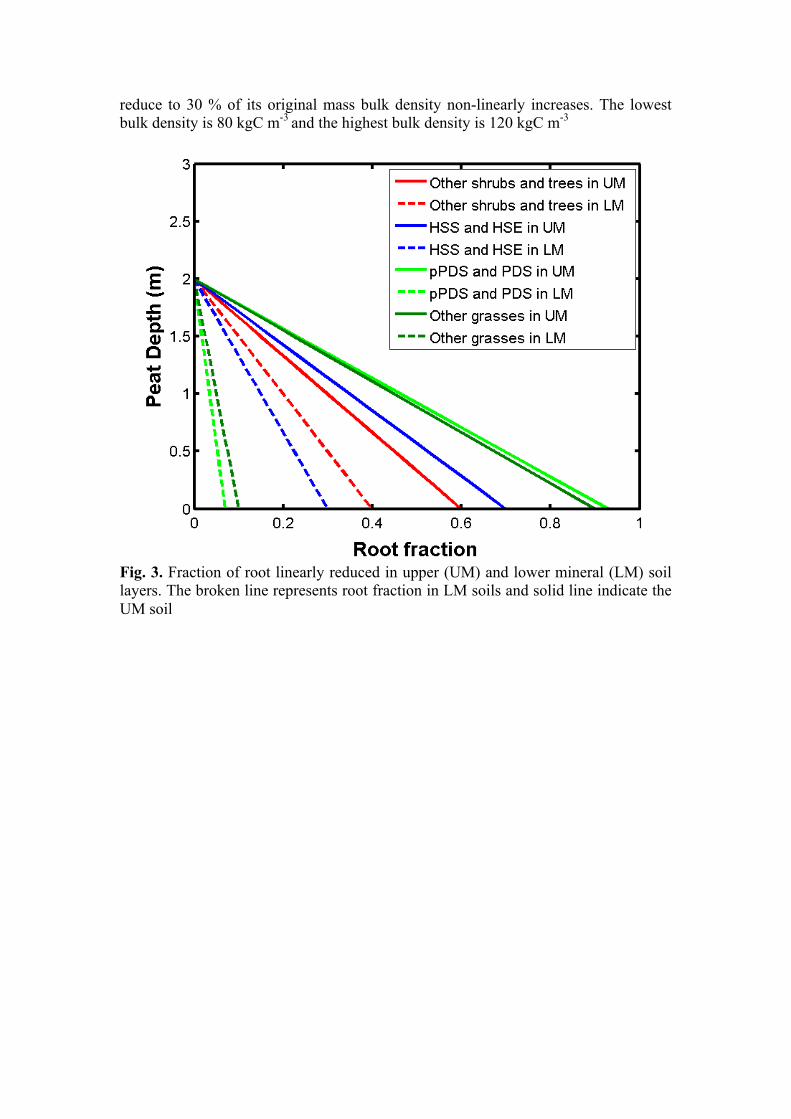
where ρi is the bulk density of peat layer (i) and ρmin the particle bulk density of the organic matter. Root distribution and water uptake In standard LPJ GUESS, the mineral soil column is divided in two layers, an upper soil layer of 0.5 m and lower soil layer of 1.5 m and the fraction of root limit in these two layers is prescribed. We have included a dynamic peat layers on the top of the mineral soil layers affecting ability of plants to access water. Plants can uptake water from the mineral soils until peat height reaches to 2 meters. The plants roots are present both in upper and lower mineral layers but their root distribution decline linearly as peat grows (see Fig. 3) and same amount of root fraction is added to the peat layers. Due to short root distribution of mosses, their root distribution limit is set to top 50 cm from the peat surface. Until, peat height reaches to 50 cm, mosses takes water from the mineral soils. Establishment Peatlands are not extremely vulnerable to natural fires because they largely remain waterlogged but their moisture conditions vary throughout the year. The chances of natural fire events likely increase in prolonged dry and warm conditions. In the event of fires, substantial amount of accumulated carbon mass burn and loose to the atmosphere. Therefore, we have retained the effects of random fire mortality in the model for peatlands during very dry and warm conditions. We have extended the model establishment functionality of LPJ GUESS. In the model, plant types are able to establish according to the climate of that particular
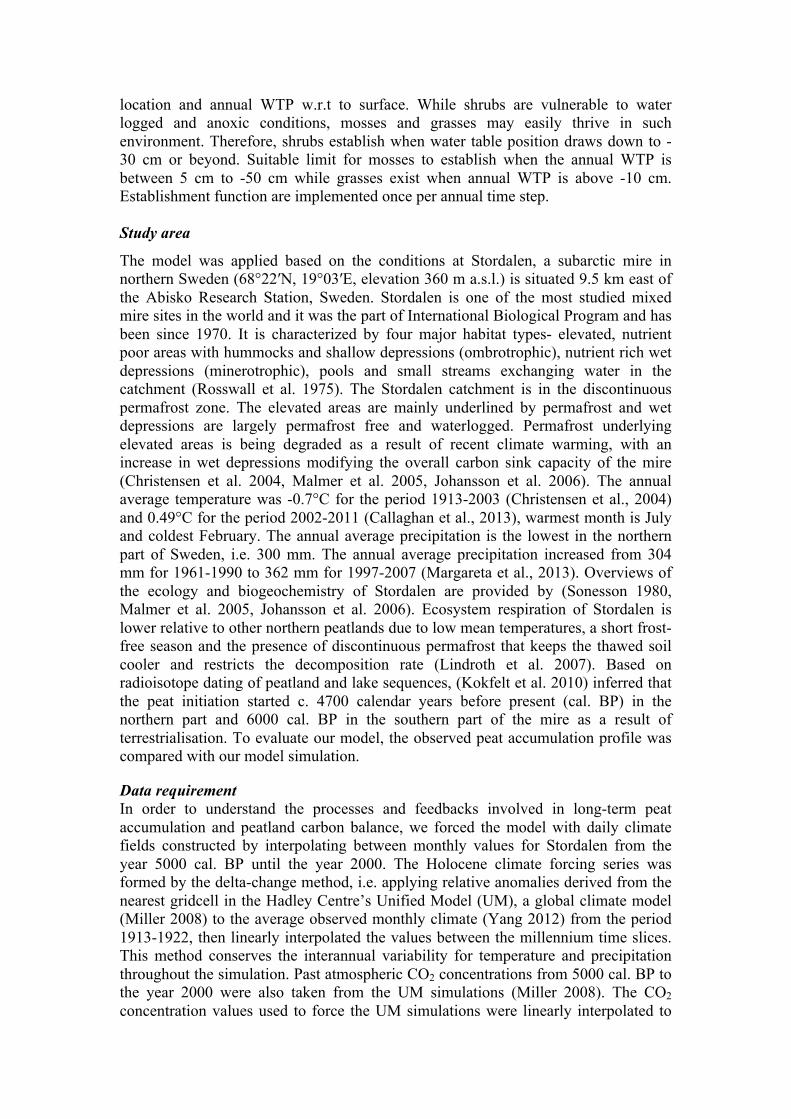
location and annual WTP w.r.t to surface. While shrubs are vulnerable to water logged and anoxic conditions, mosses and grasses may easily thrive in such environment. Therefore, shrubs establish when water table position draws down to -30 cm or beyond. Suitable limit for mosses to establish when the annual WTP is between 5 cm to -50 cm while grasses exist when annual WTP is above -10 cm. Establishment function are implemented once per annual time step. Study area
The model was applied based on the conditions at Stordalen, a subarctic mire in northern Sweden (68°22′N, 19°03′E, elevation 360 m a.s.l.) is situated 9.5 km east of the Abisko Research Station, Sweden. Stordalen is one of the most studied mixed mire sites in the world and it was the part of International Biological Program and has been since 1970. It is characterized by four major habitat types- elevated, nutrient poor areas with hummocks and shallow depressions (ombrotrophic), nutrient rich wet depressions (minerotrophic), pools and small streams exchanging water in the catchment (Rosswall et al. 1975). The Stordalen catchment is in the discontinuous permafrost zone. The elevated areas are mainly underlined by permafrost and wet depressions are largely permafrost free and waterlogged. Permafrost underlying elevated areas is being degraded as a result of recent climate warming, with an increase in wet depressions modifying the overall carbon sink capacity of the mire (Christensen et al. 2004, Malmer et al. 2005, Johansson et al. 2006). The annual average temperature was -0.7°C for the period 1913-2003 (Christensen et al., 2004) and 0.49°C for the period 2002-2011 (Callaghan et al., 2013), warmest month is July and coldest February. The annual average precipitation is the lowest in the northern part of Sweden, i.e. 300 mm. The annual average precipitation increased from 304 mm for 1961-1990 to 362 mm for 1997-2007 (Margareta et al., 2013). Overviews of the ecology and biogeochemistry of Stordalen are provided by (Sonesson 1980, Malmer et al. 2005, Johansson et al. 2006). Ecosystem respiration of Stordalen is lower relative to other northern peatlands due to low mean temperatures, a short frost-free season and the presence of discontinuous permafrost that keeps the thawed soil cooler and restricts the decomposition rate (Lindroth et al. 2007). Based on radioisotope dating of peatland and lake sequences, (Kokfelt et al. 2010) inferred that the peat initiation started c. 4700 calendar years before present (cal. BP) in the northern part and 6000 cal. BP in the southern part of the mire as a result of terrestrialisation. To evaluate our model, the observed peat accumulation profile was compared with our model simulation.
Data requirement In order to understand the processes and feedbacks involved in long-term peat accumulation and peatland carbon balance, we forced the model with daily climate fields constructed by interpolating between monthly values for Stordalen from the year 5000 cal. BP until the year 2000. The Holocene climate forcing series was formed by the delta-change method, i.e. applying relative anomalies derived from the nearest gridcell in the Hadley Centre’s Unified Model (UM), a global climate model (Miller 2008) to the average observed monthly climate (Yang 2012) from the period 1913-1922, then linearly interpolated the values between the millennium time slices. This method conserves the interannual variability for temperature and precipitation throughout the simulation. Past atmospheric CO2 concentrations from 5000 cal. BP to the year 2000 were also taken from the UM simulations (Miller 2008). The CO2 concentration values used to force the UM simulations were linearly interpolated to
an annually varying value between prescribed averages for each millennium. From 1901 to 2000 observed annual CO2 from atmospheric or ice core measurements were used. Monthly values of Holocene temperature were interpolated to daily values and monthly precipitation totals were distributed randomly among the number (minimum 10) of rainy days per month from the climate dataset. The vegetation model was initialised for 500 years from the bare ground using first 30 years of Holocene climate data to attain an approximate equilibrium of vegetation and carbon pools with respect to mid-Holocene climate. The model was then forced with continuous Holocene climate from the year 5000 cal. BP until the year 1912, after which the observed climate of the Stordalen site was used for the transient run until the year 2000. PublicationsandManuscriptsChaudhary, N., Miller, P., and Smith, B.: Integrating peatland and permafrost dynamics in a dynamic vegetation model (LPJ-GUESS) (in preparation) Chaudhary, N., Miller, P., and Smith, B.: Vulnerability of northern peatlands in changing climatic conditions (simulations completed) Chaudhary, N., Miller, P., and Smith, B.: Modelling the coupled dynamics of vegetation, hydrology and peat accumulation and their relation to microtopography in a subarctic peatland (manuscript) Ekici, A., Chadburn, S., Chaudhary, N., Hajdu, L. H., Marmy, A., Peng, S., Boike, J., Burke, E., Friend, A. D., Hauck, C., Krinner, G., Langer, M., Miller, P. A., and Beer, C.: Site-level model intercomparison of high latitude and high altitude soil thermal dynamics in tundra and barren landscapes, The Cryosphere, 9, 1343-1361, doi:10.5194/tc-9-1343-2015, 2015 (published) Summary of planned publications We have included improved peatland initialization and dynamics, two-dimensional (2-D) peat microtopography and carbon accumulation and cycling functionality in the Arctic-enabled version of the dynamic vegetation model (LPJ-GUESS). We have tested the model against an observed peat age profile from the Stordalen mire in Abisko and validated it with an observed peat age profile from Mer Bleue, a well-studied peatland site in Canada (Fig. 4). Simulated variables such as NEE, NPP, thaw depth, vegetation types and annual water table depth reflect local site observations. A transect study is planned where we’ll apply the present model over some selected points across a N-S transect to further evaluate the model. We have also done future RCP 2.6 and 8.5 experiments in order to investigate the vulnerability of high-latitude peatlands to climate change (Fig. 5). We have also developed simpler, stand-alone one-dimensional (1-D) peat accumulation and two-dimensional (2-D) peat microtopographical models. Using the 2-D model, the effects of microtopographic variations and vegetation dynamics on
peat accumulation patterns in a subarctic peatland were analysed. The results are consistent with many observational studies, including an observed peat age profile from the Stordalen mire in Abisko (Fig. 6). A manuscript describing this work has been prepared. This work will be submitted again very soon (earlier submitted to Journal of Ecological Modelling (Chaudhary et al.). In a collaborative study, we have participated in a model intercomparison project in which six different land models were run and compared at four different sites with distinct cold region landscape types to quantify the importance of physical processes in capturing observed temperature dynamics in soils (Fig. 7) (Ekici et al. 2015, Cryosphere). Plans for coming months We are planning to carry out a regional study in which we examine the potential feedback processes that could amplify and dampen regional and global climate change using our peatland accumulation module in LPJ-GUESS. Furthermore, we will examine Holocene peat initialization dates using climate forcing from GCM output run with Holocene orbital forcings. The ultimate goal is to migrate these model updates to the RCA-GUESS regional climate model (Zhang et al. 2013, 2014) and perform feedback experiments to quantify effects of biogeophysical land-atmosphere coupling on Arctic carbon balance and CH4.
We will also carry out Arctic runs of the updated, release version of the WHyMe model when it's ready and synchronised with trunk. We are also planning to improve the current single layer snow scheme in LPJ GUESS. Replacing it with multi layer scheme where we include liquid water and freezing/refreezing processes and also implement variable snow density/conductivity in each layer.
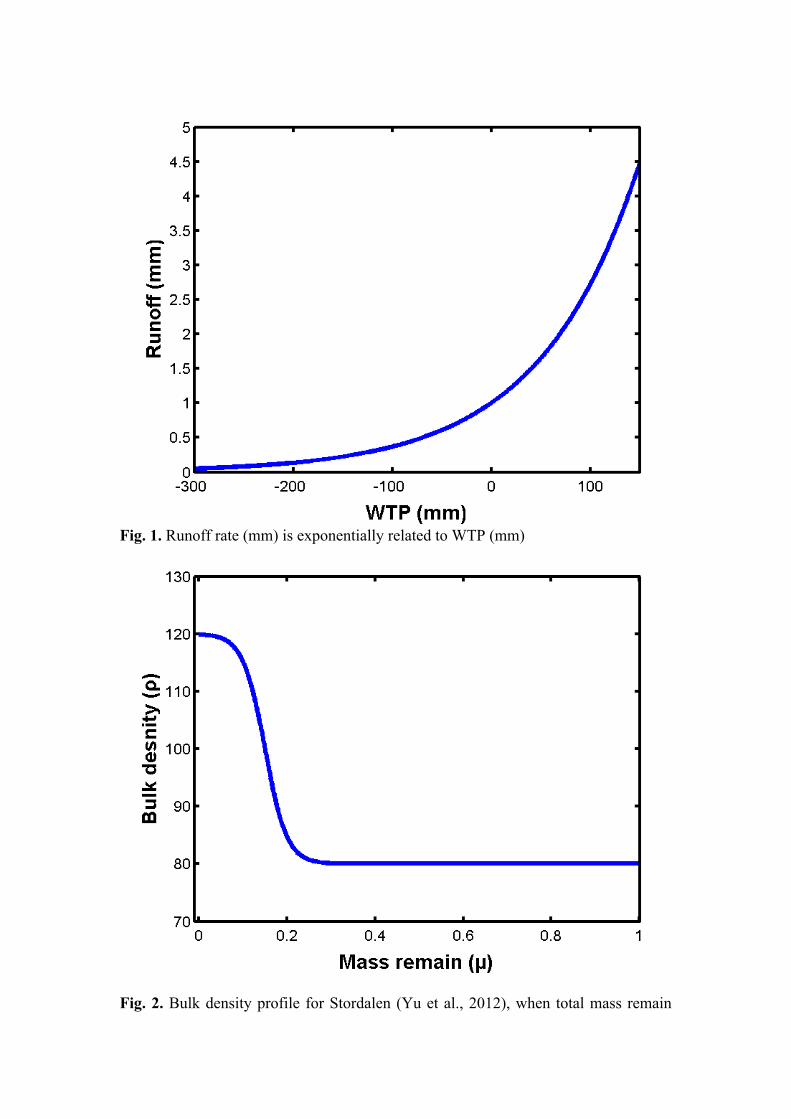
Fig. 1. Runoff rate (mm) is exponentially related to WTP (mm)
Fig. 2. Bulk density profile for Stordalen (Yu et al., 2012), when total mass remain
reduce to 30 % of its original mass bulk density non-linearly increases. The lowest bulk density is 80 kgC m-3 and the highest bulk density is 120 kgC m-3
Fig. 3. Fraction of root linearly reduced in upper (UM) and lower mineral (LM) soil layers. The broken line represents root fraction in LM soils and solid line indicate the UM soil
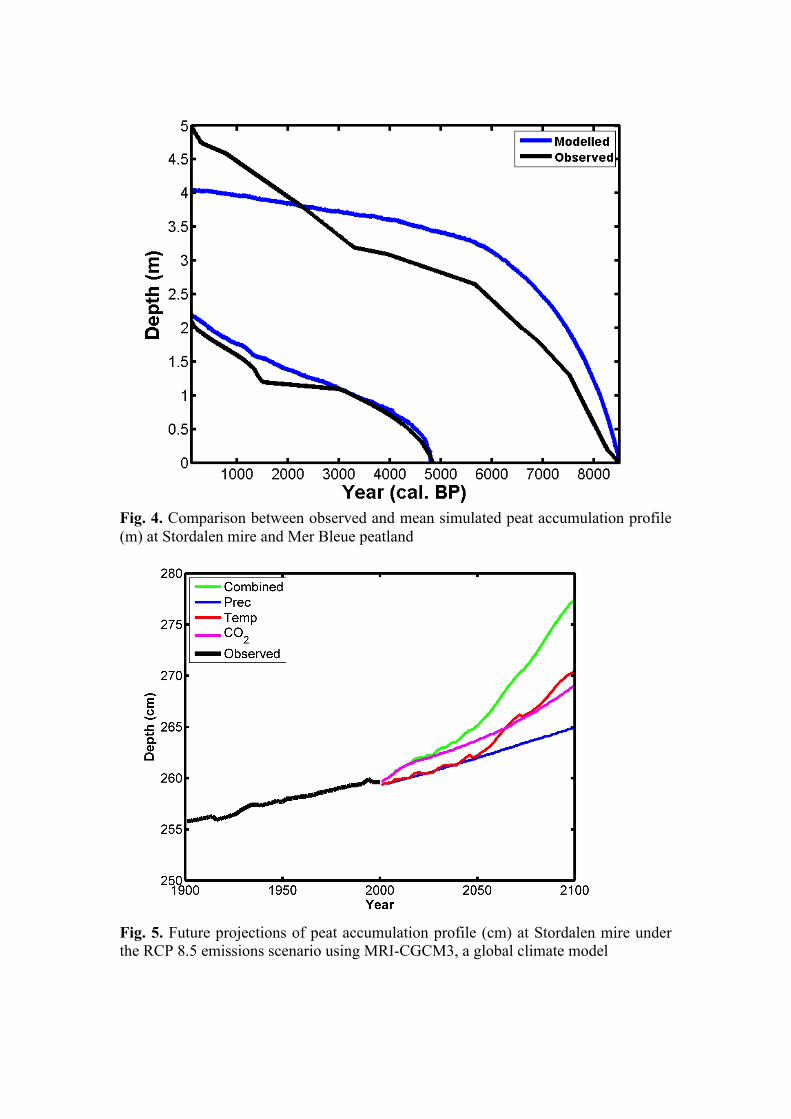
Fig. 4. Comparison between observed and mean simulated peat accumulation profile (m) at Stordalen mire and Mer Bleue peatland
Fig. 5. Future projections of peat accumulation profile (cm) at Stordalen mire under the RCP 8.5 emissions scenario using MRI-CGCM3, a global climate model
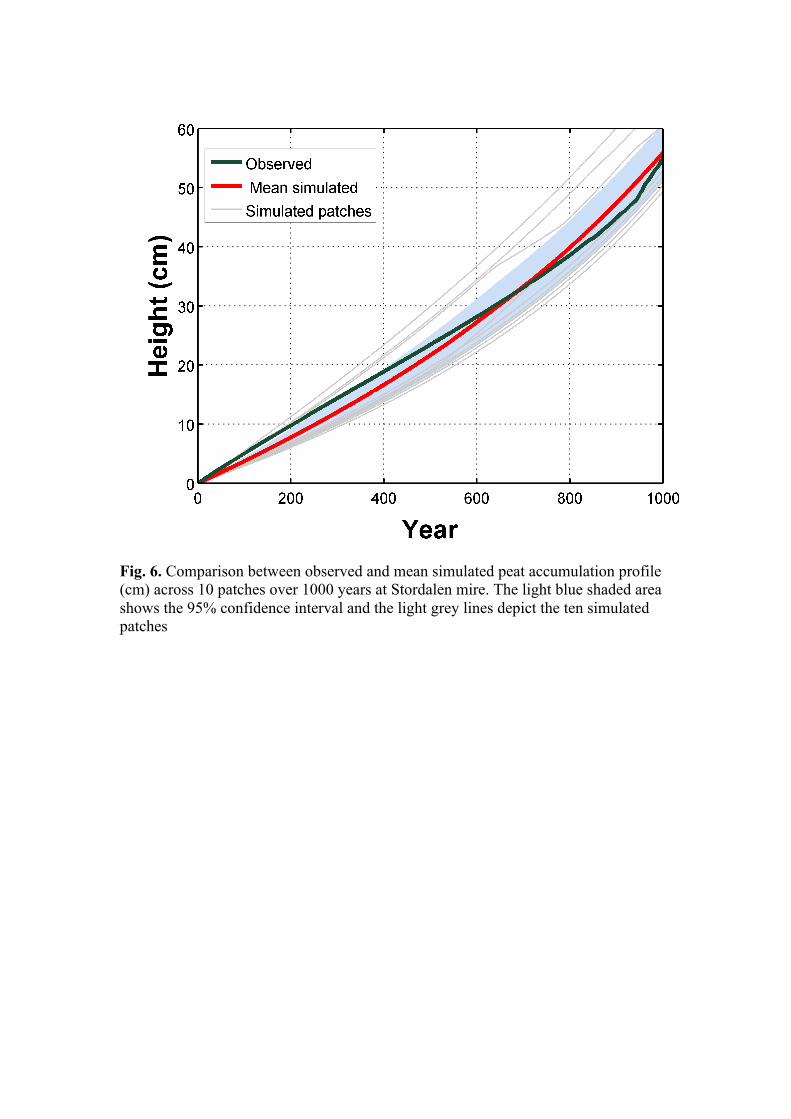
Fig. 6. Comparison between observed and mean simulated peat accumulation profile (cm) across 10 patches over 1000 years at Stordalen mire. The light blue shaded area shows the 95% confidence interval and the light grey lines depict the ten simulated patches
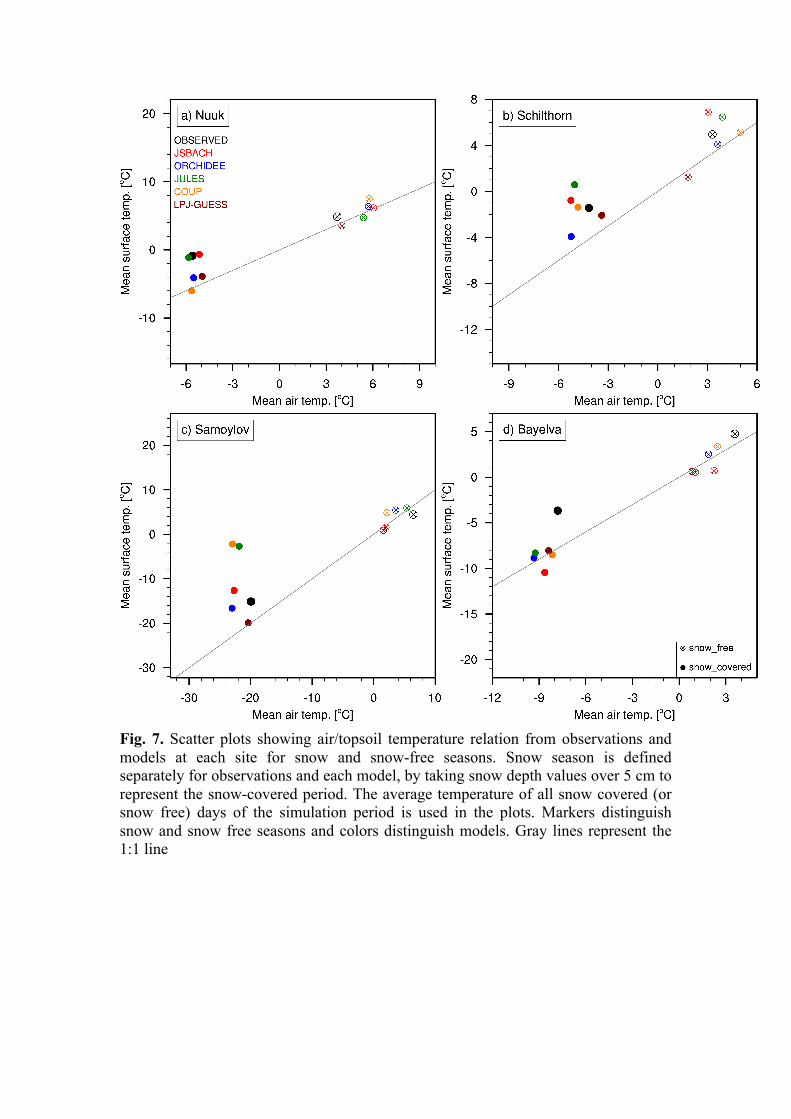
Fig. 7. Scatter plots showing air/topsoil temperature relation from observations and models at each site for snow and snow-free seasons. Snow season is defined separately for observations and each model, by taking snow depth values over 5 cm to represent the snow-covered period. The average temperature of all snow covered (or snow free) days of the simulation period is used in the plots. Markers distinguish snow and snow free seasons and colors distinguish models. Gray lines represent the 1:1 line
References:Aerts,R.,J.T.A.Verhoeven,andD.F.Whigham.1999.Plant-mediatedcontrolson
nutrientcyclingintemperatefensandbogs.Ecology80:2170-2181.Beer,C.,W.Lucht,D.Gerten,K.Thonicke,andC.Schmullius.2007.Effectsofsoil
freezingandthawingonvegetationcarbondensityinSiberia:AmodelinganalysiswiththeLund-Potsdam-JenaDynamicGlobalVegetationModel(LPJ-DGVM).GlobalBiogeochemicalCycles21:14.
Bridgham,S.D.,J.P.Megonigal,J.K.Keller,N.B.Bliss,andC.Trettin.2007.ThecarbonbalanceofNorthAmericanwetlands.EcologicalSocietyofAmericaAnnualMeetingAbstracts.
Choudhury,B.J.,N.E.DiGirolamo,J.Susskind,W.L.Darnell,S.K.Gupta,andG.Asrar.1998.Abiophysicalprocess-basedestimateofgloballandsurfaceevaporationusingsatelliteandancillarydata-II.Regionalandglobalpatternsofseasonalandannualvariations.JournalofHydrology205:186-204.
Christensen,J.H.,B.Hewitson,A.Busuioc,A.Chen,X.Gao,I.Held,R.Jones,R.K.Kolli,W.-T.Kwon,R.Laprise,V.MagañaRueda,L.Mearns,C.G.Menéndez,J.Räisänen,A.Rinke,A.Sarr,andP.Whetton.2007.RegionalClimateProjections.In:ClimateChange2007:ThePhysicalScienceBasis.ContributionofWorkingGroupItotheFourthAssessmentReportoftheIntergovernmentalPanelonClimateChange.[Solomon,S.,D.Qin,M.Manning,Z.Chen,M.Marquis,K.B.Averyt,M.TignorandH.L.Miller(eds.)].CambridgeUniversityPress,Cambridge,UnitedKingdomandNewYork,NY,USA.
Christensen,T.R.,T.R.Johansson,H.J.Akerman,M.Mastepanov,N.Malmer,T.Friborg,P.Crill,andB.H.Svensson.2004.Thawingsub-arcticpermafrost:Effectsonvegetationandmethaneemissions.GeophysicalResearchLetters31.
Clymo,R.S.1984.Thelimitstopeatboggrowth.PhilosophicalTransactionsoftheRoyalSocietyofLondonSeriesB-BiologicalSciences303:605-654.
Clymo,R.S.,J.Turunen,andK.Tolonen.1998.Carbonaccumulationinpeatland.Oikos81:368-388.
Fan,Z.S.,A.D.McGuire,M.R.Turetsky,J.W.Harden,J.M.Waddington,andE.S.Kane.2013.TheresponseofsoilorganiccarbonofarichfenpeatlandininteriorAlaskatoprojectedclimatechange.GlobalChangeBiology19:604-620.
Frolking,S.,N.T.Roulet,T.R.Moore,P.M.Lafleur,J.L.Bubier,andP.M.Crill.2002.ModelingseasonaltoannualcarbonbalanceofMerBleueBog,Ontario,Canada.GlobalBiogeochemicalCycles16.
Frolking,S.,N.T.Roulet,T.R.Moore,P.J.H.Richard,M.Lavoie,andS.D.Muller.2001.Modelingnorthernpeatlanddecompositionandpeataccumulation.Ecosystems4:479-498.
Frolking,S.,N.T.Roulet,E.Tuittila,J.L.Bubier,A.Quillet,J.Talbot,andP.J.H.Richard.2010.AnewmodelofHolocenepeatlandnetprimaryproduction,decomposition,waterbalance,andpeataccumulation.EarthSystemDynamics1:1-21.
Gerten,D.,S.Schaphoff,U.Haberlandt,W.Lucht,andS.Sitch.2004.Terrestrialvegetationandwaterbalance-hydrologicalevaluationofadynamicglobalvegetationmodel.JournalofHydrology286:249-270.
Gorham,E.1991.NorthernPeatlands-RoleintheCarbon-CycleandProbableResponsestoClimaticWarming.EcologicalApplications1:182-195.
Hilbert,D.W.,N.Roulet,andT.Moore.2000.Modellingandanalysisofpeatlandsasdynamicalsystems.JournalofEcology88:230-242.
Ise,T.,A.L.Dunn,S.C.Wofsy,andP.R.Moorcroft.2008.Highsensitivityofpeatdecompositiontoclimatechangethroughwater-tablefeedback.NatureGeoscience1:763-766.
Johansson,T.,N.Malmer,P.M.Crill,T.Friborg,J.H.Akerman,M.Mastepanov,andT.R.Christensen.2006.Decadalvegetationchangesinanorthernpeatland,greenhousegasfluxesandnetradiativeforcing.GlobalChangeBiology12:2352-2369.
Kleinen,T.,V.Brovkin,andR.J.Schuldt.2012.Adynamicmodelofwetlandextentandpeataccumulation:resultsfortheHolocene.Biogeosciences9:235-248.
Kokfelt,U.,N.Reuss,E.Struyf,M.Sonesson,M.Rundgren,G.Skog,P.Rosen,andD.Hammarlund.2010.Wetlanddevelopment,permafrosthistoryandnutrientcyclinginferredfromlateHolocenepeatandlakesedimentrecordsinsubarcticSweden.JournalofPaleolimnology44:327-342.
Lindroth,A.,M.Lund,M.Nilsson,M.Aurela,T.R.Christensen,T.Laurila,J.Rinne,T.Riutta,J.Sagerfors,L.Strom,J.P.Tuovinen,andT.Vesala.2007.EnvironmentalcontrolsontheCO2exchangeinnorthEuropeanmires.TellusSeriesB-ChemicalandPhysicalMeteorology59:812-825.
Lloyd,J.,andJ.A.Taylor.1994.OntheTemperature-DependenceofSoilRespiration.FunctionalEcology8:315-323.
Malmer,N.,T.Johansson,M.Olsrud,andT.R.Christensen.2005.Vegetation,climaticchangesandnetcarbonsequestrationinaNorth-Scandinaviansubarcticmireover30years.GlobalChangeBiology11:1895-1909.
McGuire,A.D.,T.R.Christensen,D.Hayes,A.Heroult,E.Euskirchen,J.S.Kimball,C.Koven,P.Lafleur,P.A.Miller,W.Oechel,P.Peylin,M.Williams,andY.Yi.2012.AnassessmentofthecarbonbalanceofArctictundra:comparisonsamongobservations,processmodels,andatmosphericinversions.Biogeosciences9:3185-3204.
Nicolsky,D.J.,V.E.Romanovsky,V.A.Alexeev,andD.M.Lawrence.2007.ImprovedmodelingofpermafrostdynamicsinaGCMland-surfacescheme.GeophysicalResearchLetters34:5.
Robinson,S.D.,andT.R.Moore.2000.Theinfluenceofpermafrostandfireuponcarbonaccumulationinhighborealpeatlands,NorthwestTerritories,Canada.ArcticAntarcticandAlpineResearch32:155-166.
Rosswall,T.,A.K.Veum,andL.Karenlampi.1975.Plantlitterdecompositionatfennoscandiantundrasites.
Sitch,S.,C.Huntingford,N.Gedney,P.E.Levy,M.Lomas,S.L.Piao,R.Betts,P.Ciais,P.Cox,P.Friedlingstein,C.D.Jones,I.C.Prentice,andF.I.Woodward.2008.Evaluationoftheterrestrialcarboncycle,futureplantgeographyandclimate-carboncyclefeedbacksusingfiveDynamicGlobalVegetationModels(DGVMs).GlobalChangeBiology14:2015-2039.
Smith,B.,I.C.Prentice,andM.T.Sykes.2001.Representationofvegetationdynamicsinthemodellingofterrestrialecosystems:comparingtwocontrastingapproacheswithinEuropeanclimatespace.GlobalEcologyandBiogeography10:621-637.
Smith,B.,P.Samuelsson,A.Wramneby,andM.Rummukainen.2011.Amodelofthecoupleddynamicsofclimate,vegetationandterrestrialecosystembiogeochemistryforregionalapplications.TellusSeriesa-DynamicMeteorologyandOceanography63:87-106.
Sonesson,M.1980.Ecologyofasubarcticmire.SwedishNaturalScienceResearchCouncil.,Stockholm,Sweden.
Turunen,J.,E.Tomppo,K.Tolonen,andA.Reinikainen.2002.EstimatingcarbonaccumulationratesofundrainedmiresinFinland-applicationtoborealandsubarcticregions.Holocene12:69-80.
Wania,R.,I.Ross,andI.C.Prentice.2009a.Integratingpeatlandsandpermafrostintoadynamicglobalvegetationmodel:1.Evaluationandsensitivityofphysicallandsurfaceprocesses.GlobalBiogeochemicalCycles23.
Wania,R.,I.Ross,andI.C.Prentice.2009b.Integratingpeatlandsandpermafrostintoadynamicglobalvegetationmodel:2.Evaluationandsensitivityofvegetationandcarboncycleprocesses.GlobalBiogeochemicalCycles23.
Wieder,R.K.2001.Past,present,andfuturepeatlandcarbonbalance:AnempiricalmodelbasedonPb-210-datedcores.EcologicalApplications11:327-342.
Yu,Z.C.2012.Northernpeatlandcarbonstocksanddynamics:areview.Biogeosciences9:4071-4085.
Zhang,W.,Miller,P.A.,Smith,B.,Wania,R.,Koenigk,T.&Döscher,R.2013.Tundrashrubificationandtree-lineadvanceamplifyarcticclimatewarming:resultsfromanindividual-baseddynamicvegetationmodel.EnvironmentalResearchLetters8:034023.
Zhang,W.,Jansson,C.,Miller,P.A.,Smith,B.,andSamuelsson,P.:BiogeophysicalfeedbacksenhancetheArcticterrestrialcarbonsinkinregionalEarthsystemdynamics,Biogeosciences,11,5503-5519,doi:10.5194/bg-11-5503-2014,2014.