Embed Size (px)
Citation preview
Intergenerational Transmission of Gender Attitudes:Evidence from India
Diva Dhar Tarun Jain Seema Jayachandran∗
Bill & Melinda Gates Foundation Indian School of Business Northwestern University
April 30, 2018
Abstract
This paper examines the intergenerational transmission of gender attitudes in India, a set-ting with severe discrimination against women and girls. We use survey data on genderattitudes (specifically, about the appropriate roles and rights of women and girls) collectedfrom nearly 5500 adolescents attending 314 schools in the state of Haryana, and their par-ents. We find that when a parent holds a more discriminatory attitude, his or her child isabout 11 percentage points more likely to hold the view. We find that parents hold greatersway over students’ gender attitudes than their peers do, and that mothers influence chil-dren’s gender attitudes more than fathers. Parental attitudes influence child attitudes morein Scheduled Caste communities and student gender attitudes are positively correlated withbehaviors such as interacting with children of the opposite gender.
Keywords: Gender discrimination, Attitude formation, Intergenerational transmission, India.JEL Codes: J12, J13, J16, O12.
∗Contact information: [email protected], [email protected] and [email protected]. Thepaper has benefitted from detailed comments from Shilpa Aggarwal, Sisir Debnath, Sonalde Desai, Ravinder Kaur,E. Somanathan and Rohini Somanathan and helpful feedback from seminar and conference audiences. We thankSuanna Oh, Lydia Kim, Alejandro Favela, Vrinda Kapoor, Vrinda Kapur, Niki Shrestha, Rachna Nag Chowdhuri,Anantika Singh and Priyanka Sarda for excellent research assistance. We are also grateful to the InternationalInitiative for Impact Evaluation and the International Growth Centre for funding the data collection. Jayachandranis also grateful for financial support from the National Science Foundation.
1 Introduction
Along many different dimensions, from life expectancy to educational attainment to decision-
making power in the household, gender gaps favoring men are larger in poorer countries (Jay-
achandran 2015). Data on stated attitudes about gender equality follow the same pattern, with
people in poorer countries more likely to endorse girls getting less education than boys and
believing that violence against women is sometimes justified. Even against this backdrop, India
stands out for its unequal opportunities and outcomes for women. The low status of women mat-
ters, both from a rights perspective and because of the potentially large economic consequences,
for example due to lower human capital investment in the next generation (Duflo 2012).
One explanation for India’s exceptionalism is that its religious and cultural institutions give
families economic incentives to have fewer girls and to invest less in them. For example, under
the system of patrilocal exogamy, girls join their husbands’ family when they marry, while
eldest sons provide for their parents and inherit the family land, providing incentives for parents
to favor sons (Deininger et al. 2013; Jain 2014).
However, economic rationales seem unable to fully explain the level of gender discrimi-
nation in India. Investments in girls’ health and education ought to have financial returns for
parents in the form of lower dowry payments. Yet, dowry levels in most communities have not
fallen despite major advances in women’s educational achievement. This suggests that in addi-
tion to incentives, preferences might be systematically different in India - in line with Becker
(1971)’s ‘taste for discrimination’. A preference-based explanation might explain, for example,
why Indians compared to other poor countries are more likely to agree that a university edu-
cation is more important for a boy compared to a girl (Jayachandran 2015). Insofar as these
preferences are deeply held and difficult to change through pro-girl policies such as financial
incentives to have daughters and to educate them (see, for example, Anukriti (2018)), they may
represent a significant challenge to erasing discrimination against women. At the same time,
understanding the process of attitude formation and transmission offers the possibility that re-
1
forming basic gender-equality attitudes can produce long-lasting improvements in outcomes for
women. Attitude formation among adolescents is particularly important to understand, since
they are still at an age where attitudes are malleable compared to adults, but mature enough to
reflect on complex moral questions (Kohlberg 1976).
Where do these preferences, or gender attitudes, come from? One line of research em-
phasizes the deep historical roots of gender attitudes. For example, they might be influenced
by religious doctrine (Psacharopoulos and Tzannatos 1989; Seguino 2011), political-economic
regimes (Giuliano 2017; Campa and Serafinelli 2017) as well as by the agricultural environment
faced by the first settled farming communities (Alesina et al. 2013) and stability of the environ-
ment across generations (Giuliano and Nunn 2017). Bisin and Verdier (2001) and Doepke and
Zilibotti (2017) argue that the parental transmission of cultural norms to their offspring can be
motivated by a form of paternalistic altruism.
Other work, mostly in the context of developed countries such as the United States, Britain,
the Netherlands and Australia, has focused on the transmission of attitudes from one generation
to another (Thornton et al. 1983; Glass et al. 1986; Moen et al. 1997; Ex and Janssens
1998; Kulik 2002; Fernandez 2007; Grosjean and Khattar 2017). Parents’ gender attitudes
and behaviors have been found to have a significant impact on their children’s fertility choices
(Fernandez and Fogli 2006; Fernandez and Fogli 2009), education (Patacchini and Zenou 2011),
household division of labor between men and women, and women’s participation in the labor
market (Cunningham 2001; Fernandez et al. 2004; Blau et al. 2011; Olivetti et al. 2013; Farre
and Vella 2013; Johnston et al. 2014).
The parent-child correlation of gender attitudes might differ in the social context of devel-
oping countries compared to Western societies for a number of reasons. For example, intergen-
erational transmission might be especially strong in South Asia because of residence in large
joint families and parents’ control over when and whom their children marry. The endogamous
Hindu caste system with its hereditary stratification, elaborate rules, rituals and sanctions is
also an important feature of Indian social structure. As a result of lower social (Munshi and
2
Rosenzweig 2009; Sankaran et al. 2017) and marital mobility (Munshi and Myaux 2006), in-
teraction primarily within social networks implies holding relatively un-diversified attitudes.
Thus, differences in social structure imply that the strength and consequences of intergenera-
tional transmission of gender attitudes in South Asia are potentially very different from what is
reported in the literature on Western societies.
Relatively little research examines the formation of gender attitudes in developing coun-
tries, including India, despite the severity of gender inequality in these settings. Notable excep-
tions are studies of how female leadership of village councils affects attitudes in India (Beaman
et al. 2009; Gangadharan et al. 2016) and raises aspirations (Beaman et al. 2012; Ghani et al.
2013) and how television influences female empowerment (Jensen and Oster 2009; La Ferrara
et al. 2012). We add to this literature by examining how intergenerational transmission plays a
role in the formation of gender attitudes in India. We examine whether parental gender attitudes
influence children’s and specifically girls’ aspirations for higher education, which can be an
important determinant of actual attainment.
Absent exogenous shocks or other means of definitively establishing causality, our esti-
mates are best interpreted as correlations between parent and child attitudes, with a rich set of
control variables and fixed effects allowing us to account for most of the obvious confounds
such as community attitudes and the family’s socioeconomic background.1 Specifically, our
sample comprises children from 314 schools in the Indian state of Haryana, plus their parents,
and we examine the correlation between children’s and parents’ attitudes, controlling for school
(i.e., village) fixed effects, as well as several household variables that might be correlated with
parental attitudes. The survey measures a wide range of gender attitudes regarding, for example,
education, working outside the home, and tolerance of violence.
Our main finding is that parent and child attitudes are strongly positively correlated, with
mothers having greater influence than fathers. On average, when a parent holds a more discrim-
inatory gender attitude, his or her child is 11 percentage points more likely to hold that attitude.
Mothers are more influential than fathers. There is also some suggestive evidence that mothers
3
have relatively more influence than fathers on their daughters than on their sons. We regard
these effect sizes as moderate. They point to the durability – but not complete persistence – of
gender attitudes over generations.
To benchmark the magnitude of these effect sizes, we also construct the average gender
index of the child’s peers, specifically classmates in the same school, grade, and of the same
gender, excluding herself or himself. We find that a students’ peers, collectively, and therefore
the broader classroom environment, exert a lower (and statistically insignificant) influence on
a child’s gender attitudes compared to the parents. Improving a parent’s gender attitudes by a
unit is associated with a greater progression in a child’s gender attitudes than improving each
of the child’s peers by one unit.
We then examine whether family characteristics are associated with stronger or weaker
transmission of gender attitudes between generations. We find that the intergenerational corre-
lation is stronger in Scheduled Caste families, possibly since they face greater social exclusion.
In addition, we find that the mother influences the children’s attitudes relatively less in families
with a working mother, compared to families with stay-at-home mothers. One might have ex-
pected the opposite pattern – that working mothers have more influence in shaping children’s
attitudes due to greater bargaining power and confidence. Mothers are also more influential
than both working and non-working fathers. Our finding suggests that parental time spent with
children might be an important channel for the transmission of gender attitudes, and offsets any
influence of bargaining power in this context.
Finally, we examine whether parental gender attitudes have consequences for their chil-
dren’s and specifically girls’ aspirations and behaviors. We do not find conclusive evidence that
parent gender attitudes influence girls’ intention to drop out of school earlier. However, we find
that student gender attitudes are associated with behaviors such as comfort in interacting with
the opposite gender.
4
2 Data
2.1 Sampling and data collection
We use data from a survey conducted between September 2013 and January 2014 covering
314 government secondary schools located in Rohtak, Sonepat, Panipat and Jhajjar districts of
Haryana. Adjacent to Delhi, these districts have some of the most male-skewed sex ratios in all
of India. We conducted in-school surveys of roughly 15,000 students who were in grades six
and seven at the time. For a 40% random sample of these students, we visited the household to
survey one of the parents, randomly choosing either the mother or the father.2
The survey was the first wave of a student-level panel dataset designed to evaluate a school-
based intervention (that aims to reduce students’ gender discriminatory attitudes through class-
room discussions about gender equality). Decisions about sample size and school and respon-
dent selection, among other considerations, were made based on the design of that evaluation to
reduce sample attrition from the panel and ensure sufficient power to evaluate the intervention.
From among the 607 government run secondary schools that offered grades six through nine in
the study districts, we focused on 347 schools with medium to high enrollment based on Dis-
trict Information System for Education (DISE) 2011 data, and with low dropoff in enrollment
between grades (as a proxy for attrition from the school). In villages with multiple schools,
only one school per village was randomly selected.3 We made initial visits to these 347 schools
and then narrowed the list to 314 schools; we excluded the other 33 because of chronically
low actual attendance, despite high official enrollment. The 314 schools form the sample used
in this study. Of these, 59 schools enroll only girls and 40 schools enroll only boys, with the
remaining 215 schools enrolling both boys and girls. Each school has an average of 84 students
per grade.4
To select students within schools for the sample, we randomly chose among those whose
parents gave consent for their child to participate in the study and who personally agreed to
5
participate, stratifying by gender and grade in the ratio Female 6th:Male 6th:Female 7th:Male
7th of 3:2:2:2. We surveyed more girls than boys because female enrollment is higher than
male enrollment in government schools, as discussed below. We sampled more grade 6 girls
than grade 7 girls because we expect lower attrition among them during our follow-up survey
waves. An additional criterion was that the student attended school on the survey day. Students
with chronically low school attendance or whose parents did not consent to the survey are
under-represented in the data (though the consent rate was not lower for girls, suggesting that
providing consent was not systematically related to parental gender attitudes).
One parent of a random 40% subsample of the surveyed students participated in a house-
hold survey. We selected at random whether to interview the father or the mother. Note that
because whether we interview the mother or father in a household in random, cross-household
comparisons are a valid way to identify how the influence of mothers’ attitudes differs from that
of fathers’. If after multiple visits and follow-up phone calls, we could not interview the selected
parent, we randomly chose a replacement household. The completion rate of the household sur-
vey was higher for mothers (89.6%) than for fathers (70.2%) because fathers were more often
away for work during the daytime hours when the survey was conducted. Our final dataset con-
sists of 2439 boys and 3044 girls, and 2379 fathers and 3104 mothers, corresponding to 5483
parent-child pairs.
2.2 Descriptive statistics
Table 1 summarizes some key variables for the sample. The average age for both boys and
girls is between 11 and 12 years. The mean age is about 35 years for mothers and 40 years
for fathers. What is striking is the difference in illiteracy between mothers (39.0%) and fathers
(16.4%), reflecting large differences in school enrollment between boys and girls in the previous
generation.
The table also reports differences in the number of other children in the household, with
girls growing up in larger households than boys, consistent with son-biased fertility stopping
6
rules. Girls’ siblings are also more likely to be boys, a pattern that could reflect, for instance,
fertility stopping rules based on gender, sex-selective abortions by their parents, or the neglect
of girls’ health.
Because of selection into government versus private schools, boys in government schools
are from systematically poorer families. Thus, despite growing up in smaller families, the boys
in our sample are more likely to have illiterate parents and are less likely to have a flush toilet
at home.
The survey included a number of questions on gender equity attitudes answered by both
students and parents, covering topics such as gender roles within the household and in public
life and whether girls and boys should have equal educational opportunities. We create a gen-
der index that aggregates the responses for the nine questions listed in Table 2, which are the
overlapping questions on the parent and student questionnaire. Surveyed parents and students
were asked if they agree with these nine statements. We create a binary variable that equals one
if the respondent answered “Agree” or “Strongly agree” (zero if “Disagree” or “Strongly dis-
agree”) if the statement was in favor of (opposed to) gender equality and female empowerment.
The gender index is the weighted average value of the nine binary variables, with weights con-
structed by normalizing the variables to have the same standard deviation and then recovering
the weights given by the inverse covariance matrix (Anderson 2008). A higher gender index
means more gender equitable views. We further normalize the student and parent indices to be
mean 0 with standard deviation 1 for the entire sample.5
The bottom of Table 2 shows the average Anderson weighted gender index for girls, boys,
mothers and fathers, along with the unweighted gender index and a gender index based on a
PCA. Fathers and mothers have relatively similar attitudes, with fathers being slightly more
gender equitable. However, among the adolescents, girls are considerably more gender equi-
table (+0.262) than boys their age (-0.327). Figure 1 shows the full distribution of the weighted
gender index variable, with girls’ gender index shifted to the right of boys’, while mothers’
distribution is shifted slightly to the left (less progressive) compared to fathers and much to
7
the left compared to girls. These summary statistics suggest that girls’ attitudes might become
less progressive over time, but we cannot conclude this definitively because the patterns could
reflect cohort effects rather than age effects.
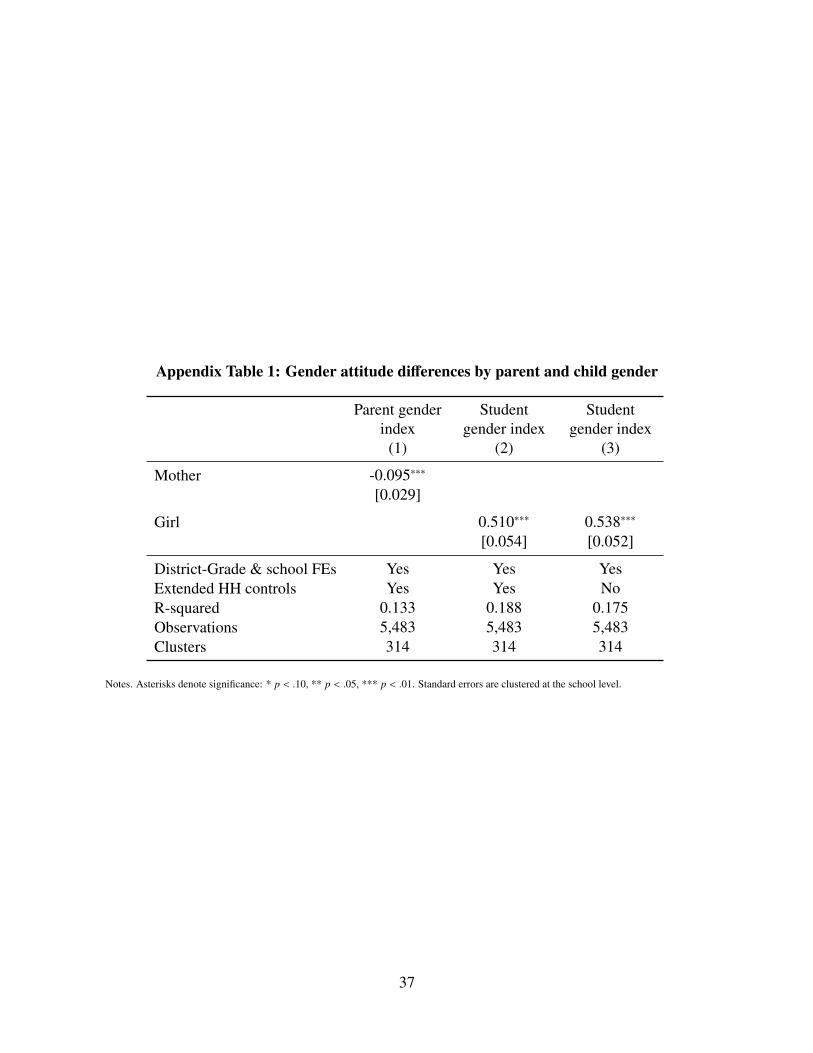
Columns 1 and 2 of Appendix Table 1, summarize the gender differences in attitudes in a
regression framework. The lower gender index (less progressive views) of mothers compared
to fathers is statistically significant, as is the higher index (more progressive attitudes) of girls
compared to boys (p < 0.01).
3 Empirical strategy
3.1 Average influence of parental attitudes on child attitudes
The goal of the empirical analysis is to measure the strength of the intergenerational trans-
mission of gender attitudes from parents to children. Our main specification to measure the
average relationship is as follows:
ChildGAigcsd = α1ParentGAigcsd + γs + δgcd + σXigcsd + εisd (1)
The outcome ChildGA is the gender attitude index or sub-index for student i of gender g in
class (i.e., grade) c in school s in district d. The standard errors allow for non-independence
(i.e., clustering) of the error term, εisd, at the school level.
The key regressor is the gender attitude index or sub-index of the surveyed parent, ParentGA.
One concern in interpreting α1 as a causal effect is that ParentGA might be correlated with gen-
der attitudes in the community. To control for community attitudes, we include school (i.e.,
village) fixed effects, γs. Thus, the comparisons are between students in the same school. Girls
and boys might be affected differently by community attitudes, so we also include district-grade-
gender fixed effects, δgcd; these also control for grade-specific characteristics that are common
across schools in the district, such as the school curriculum.6 Finally we include an extensive
8
set of household covariates, Xigcsd. These variables include indicators that represent housing
quality, the household having a toilet, electricity, and piped water, household size, father’s edu-
cational level, mother’s educational level, father’s work status, mother’s work status, Scheduled
Caste, Scheduled Tribe, radio ownership, television ownership, and others.
Definitively identifying the causal effect of parent attitudes on children is difficult. Shared
environmental characteristics might influence both parent and child attitudes and vary even
within a village (for example, by neighborhood). Our extensive set of household control vari-
ables, and the fact that our point estimates are stable when we add additional control variables
(as shown below) is suggestive of most shared environmental factors are being addressed.
Another concern is that the direction of causality could run from children to parents rather
than from parents to children. Econometrically, we have no solution to this problem, but we
would argue that parents are more likely to influence the views of their 11 to 12 year old children
than vice versa.
3.2 Heterogeneity by parent and child gender
Examining heterogeneity in the results helps to determine the pathways through which
transmission occurs. First, we examine heterogeneity in the parent’s gender by including the
main effect Mother and the interaction term Mother × ParentGA in equation (1). A positive
coefficient on the interaction term implies that mothers are more influential than fathers. We
also examine differences by parent gender combined with occupational status, for example, by
estimating the model separately for those with working mothers, working fathers, non-working
mothers and non-working mothers. Second, we examine heterogeneity by student gender by
estimating the model separately for boys and girls and then comparing the coefficients across
models.
We examine the relative influence of mothers compared to fathers, estimating the following
specification separately for boys and girls.
9
ChildGAicds = α1ParentGAicsd + α2ParentGAigcsd × Mothericsd
+α3Mothericsd + γs + σXicsd + δcd + εisd. (2)
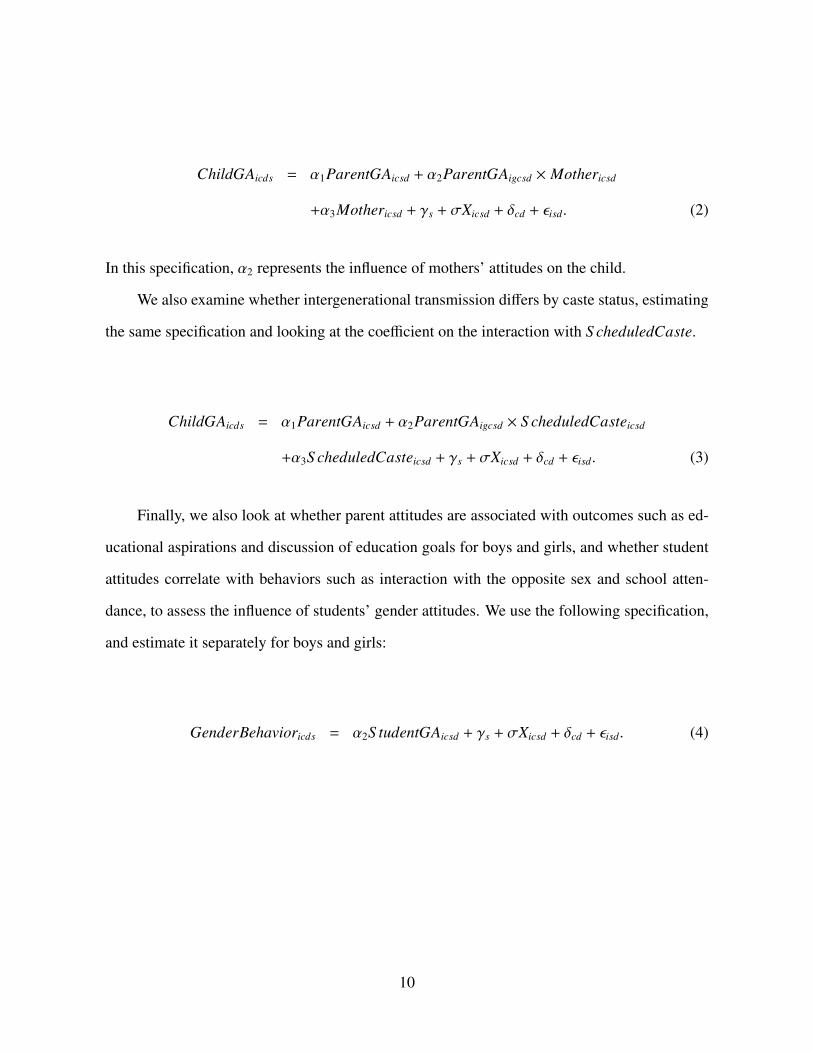
In this specification, α2 represents the influence of mothers’ attitudes on the child.
We also examine whether intergenerational transmission differs by caste status, estimating
the same specification and looking at the coefficient on the interaction with S cheduledCaste.
ChildGAicds = α1ParentGAicsd + α2ParentGAigcsd × S cheduledCasteicsd
+α3S cheduledCasteicsd + γs + σXicsd + δcd + εisd. (3)
Finally, we also look at whether parent attitudes are associated with outcomes such as ed-
ucational aspirations and discussion of education goals for boys and girls, and whether student
attitudes correlate with behaviors such as interaction with the opposite sex and school atten-
dance, to assess the influence of students’ gender attitudes. We use the following specification,
and estimate it separately for boys and girls:
GenderBehavioricds = α2S tudentGAicsd + γs + σXicsd + δcd + εisd. (4)
10
4 Results
4.1 Main results on the intergenerational transmission of gender atti-
tudes
Table 3 presents results on the intergenerational transmission of gender-equity attitudes
using the weighted index. Column 1 includes school and district-grade-gender fixed effects,
plus household covariates, specifically whether the house is pukka, has electricity, has a flush
toilet, has a non-flush toilet; whether the family owns the house; whether the father and mother
are illiterate, have finished primary school, and have finished middle school, whether they work
part-time or full-time; and whether the family belongs to a Scheduled Caste or Tribe. The effect
size of 0.11 implies that when a parent holds a more gender equitable view, his or her child is
11 percentage points more likely to hold that view.
Column 2 then adds additional controls such as whether the household has radio, televi-
sion, and tap water. The coefficient on parental gender attitudes remains stable (0.110, p <
0.01), which is suggestive that our set of control variables is capturing the environmental fac-
tors that jointly affect parents’ and children’s gender attitudes. This specification with “extended
household controls” is our preferred specification for the remainder of the paper.
Column 3 adds additional control variables that could affect children’s gender attitudes
but are also potentially endogenous because they are affected by the parents’ gender attitudes:
mother’s work status, family size, and the gender composition of children in the household.
Because we regard these extra variables as over-controlling, we use the specification in column
2 as our main specification. The main coefficient of interest on parent gender attitudes is 0.106
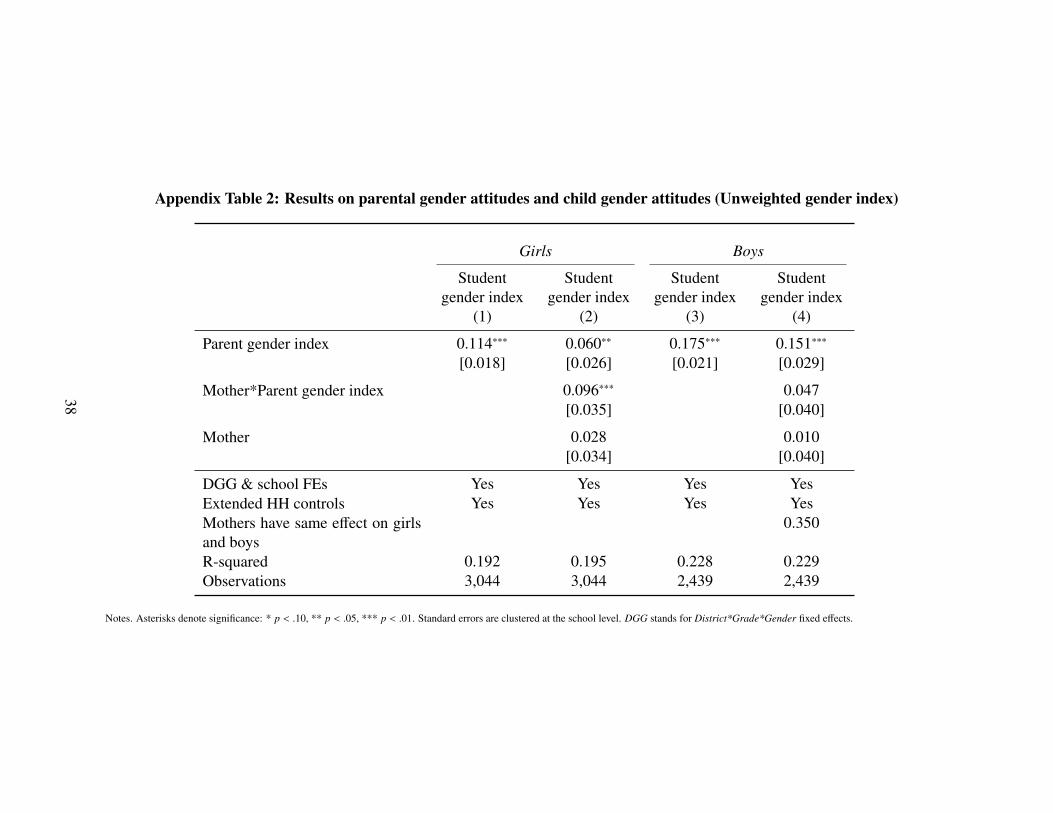
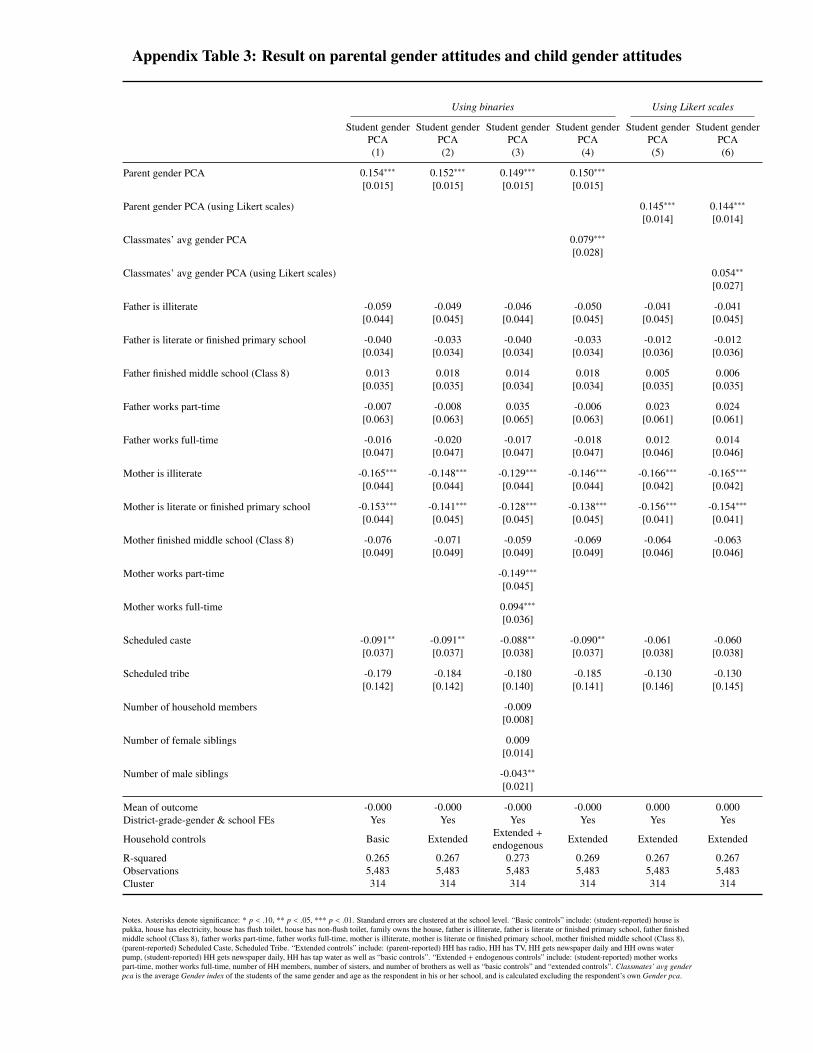
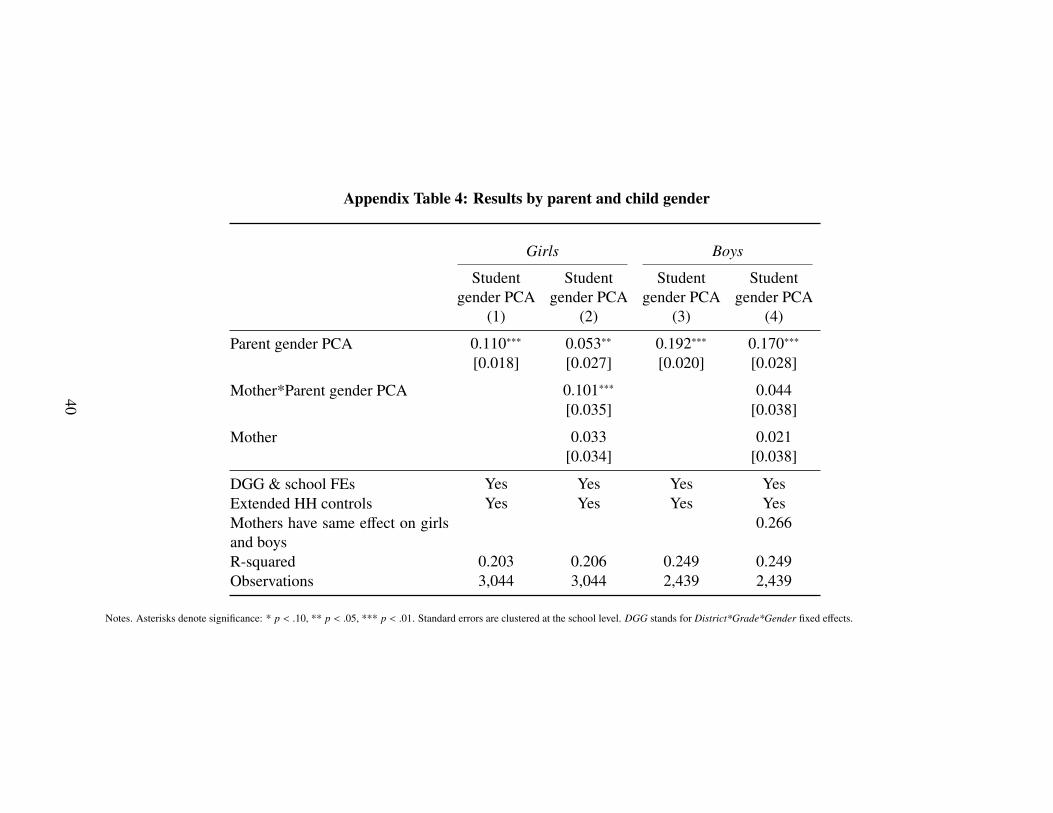
(p < 0.01), which is very close to that reported in column 2.7 This result is qualitatively robust
using the alternative unweighted gender index in Appendix Table 2 and PCA gender index in
Appendix Table 3.
Columns 5 and 6 of Table 3 present results from regressions that use a gender attitudes
11
index constructed by using all five values of the Likert scale for the individual questions (i.e.,
the response to each question is treated as a cardinal value from 1 to 5). These results also show
a positive and statistically significant correlation and corroborate our main finding.
Table 3 also reports the correlation of parental employment with student gender attitudes.
The coefficients relating father’s employment and education with gender attitudes are relatively
small in magnitude and statistically indistinguishable from the null. This is consistent with
fathers spending less time with their children, regardless of employment status. Mothers’ full-
time employment increases their children’s gender equitable views (+0.095, p < 0.01), perhaps
due to role-model effects or direct vertical socialization (Bisin and Verdier 2011; Fernandez
et al. 2004). In contrast, mother’s part-time employment seems to negatively influence student
gender attitudes (-0.147, p < 0.01) compared to no maternal employment. Other factors that
are negatively associated with students’ gender attitudes include mothers’ illiteracy (-0.116,
p < 0.05) and the number of male siblings (-0.052, p < 0.05). Consistent with lower social
mobility, a Scheduled Caste background lowers the student gender attitudes measure slightly
by -0.068 (p < 0.10).
Table 4 shows the main specification separately for each of the nine questions used to
create the index. Students’ attitudes are positively correlated with parent’s attitudes in all cases,
and statistically significant in most cases. The only insignificant coefficient is in response to
“Girls should be allowed to study as far as they want”, where there is very little variation in
responses for either students or their parents.
Peers and the classroom environment might also influence adolescents’ gender attitudes.
As a way of gauging whether the effect of parents’ attitudes is large or small, column 4 of Table
3 augments the specification in equation (1) with a measure of the average gender attitudes
in the child’s peer group. We define the peer group as the same-gender students in the same
grade in the school.8 The peer set is parsed by gender because most interaction is de facto
gender segregated, even in co-ed schools. Because the estimates control for school fixed effects,
the estimate of peer effects holds the school environment fixed, but there might be omitted
12
class-level factors (for example, teachers or textbooks). Thus, we interpret these coefficients
as representing the effect of the classroom environment, including peer effects, rather than the
pure effect of other students. In column 4 of Table 3, a unit increase in classmates’ average
gender index is associated with a 0.037 increase in a student’s gender index (p > 0.10), which
is not statistically significant. Given that the estimate for parent’s attitude is 0.11, we conclude
that parental attitudes matter more than the collective effect of all peers (plus the classroom
environment).
Though set in a developing country, our estimates are comparable to those obtained from
data from the Netherlands, the United States and Israel. For instance, using data from mother-
daughter pairs in the Netherlands, Ex and Janssens (1998) estimate a correlation between daugh-
ters’ and mothers’ attitudes about women’s roles as 0.25. Moen et al. (1997)’s study compared
women interviewed in upstate New York in 1956 and again in 1986, with their daughters in
1988, and report that a correlation of 0.22 (p < 0.001) between mothers’ gender role ideology
in the 1950s as well as the same mothers’ ideology in the 1980s with their daughters’ gender
role ideology as adults in 1980s. In many ways, it is surprising that the effect size in our context
is no larger than that found in Western societies; one might expect there to have been a larger
effect in India if children spend more time with their parents.9
Our findings also add to the existing evidence on the influence of mothers on sons versus
daughters. Studies such as Fernandez, Fogli, and Olivetti (2004) report a strong influence of
mothers on sons.10 We find (see below) that mothers have the same influence on daughters
as on sons, but that mothers might have more influence on daughters than sons, relative to
fathers. Limited mobility in India for both daughters and their mothers means that they spend
an especially large amount of time together.
4.2 Heterogeneity by parent and child gender
Table 5 examines heterogeneity by parent and child gender. We find a smaller coefficient
of parent attitudes on girls compared to boys. For example, the coefficient is 0.094 for girls in
13
column 1 compared to 0.126 for boys in column 3. The point estimates are, thus suggestive of
smaller effects for girls.
In column 2, we find evidence that mothers’ attitudes are more influential than fathers’
attitudes for girls. The interaction coefficient of 0.081 (p < 0.05) compared to the main effect
of 0.048 implies that the effect for girls may be largely driven by their mothers. The rela-
tively greater influence of mothers on their daughters is consistent with other studies that report
mothers having greater influence on daughters in vocational choices (Steele and Barling 1996),
political and religious socialization (Acock and Bengtson 1978) and gender attitudes (Smith
and Self 1980).
Mother-daughter pairs might have particularly strong transmission of attitudes as they
identify with their mothers, or alternatively, because they model and imitate their mothers (Boyd
1989). The point estimates also suggest that mothers have greater influence on their sons than
fathers do, although the coefficient is not statistically significant and is smaller than the mother
interaction term for girls (0.046, p > 0.10).
These patterns corroborate qualitative responses during focus group discussions with stu-
dents that were conducted in 15 schools. In these discussions, 75% of girls and 54% of boys
reported that the mother was the largest source of influence. In contrast, 17% of girls and 32%
of boys said their father is the most important influence.
This is consistent with the findings reported by Neisser (1967), who found that mother-
daughter relationships in the US are stronger when women are systematically excluded from
male recreational pursuits and when the mother and daughter live in families, rather than com-
munal units. These conditions of women’s exclusion exist in contemporary Haryana (Chowdhry
1994), and given limited mobility and social exclusion for women in India, mothers may spend
more time and exert significant influence on their children.
14
4.3 Attitudes related to education, employment and gender roles
Table 6 disaggregates the consolidated gender index into weighted sub-indices which de-
scribe different types of attitudes to further examine this relationship. We find that parents’
attitudes are more strongly correlated for attitudes towards traditional gender roles (+0.101,
p < 0.01), i.e., when a parent holds a more equitable view towards gender roles, the child is
more likely to share that view. The relationship is also positive and statistically significant for
attitudes towards education (+0.086, p < 0.01) and employment (+0.068, p < 0.01).
4.4 Heterogeneity by family characteristics
Examining heterogeneity by family characteristics helps illuminate the factors that facil-
itate or hinder the transmission of gender attitudes. We focus on two types of heterogeneity.
First, we examine the effect of caste differences, testing if attitude transmission is stronger
among castes lower in the social hierarchy. Second, the transmission might be weaker if parents
work, leaving little time for interaction with their children, or stronger if they gain status and
influence in the family by virtue of working. Hence, we test the effects of intergenerational
transfer by the employment status of mothers and fathers.
In Table 7, Scheduled Caste (SC) parents have significantly stronger gender attitude trans-
mission from parents to children compared to other parents. The coefficient on the interaction
term Parent gender index*Scheduled caste is 0.064 in column 2 and statistically significant at
the 10% level. One potential explanation is that SC households face relatively greater social
exclusion, and interact almost exclusively within caste networks (Chowdhry 1994). Therefore,
parents might spend more time with their children, while the influence of other communities is
muted.
Next, we examine differences in intergenerational transmission by parental employment
status. Mothers working outside the home might have less time to interact with their chil-
dren, lowering the strength of intergenerational transmission of attitudes.11 Conversely, work-
15
ing mothers might gain both confidence to speak their views as well as clout within the family.
In our sample, 37.6% of mothers work outside the home. The same dynamics might hold for
fathers, although in our sample, 91% of fathers work outside the home.
Table 8 reports the results from examining the heterogeneous effects of parental work
status. The coefficient associated with Mother*Parent gender index is large and positive for
non-working mothers (0.134, p < 0.01) but not so for working mothers (-0.061, p > 0.10).
This result is consistent with working mothers having less time to influence their children, and
also consistent with Milkie, Nomaguchi, and Denny (2015)’s finding using PSID data from the
United States that more engaged maternal time, rather than just the accessibility of the mother,
was more effective in positively influencing adolescent behavior. Meanwhile, the coefficients in
columns 6 and 8 reiterate that mothers are more influential than fathers, which is consistent with
fathers spending less time with children. This is true even when fathers do not work, perhaps
because they spend the time looking for work.
4.5 Association of attitudes with aspirations and behaviors
We next examine the association of these attitudes with aspirations and behaviors, for
both boys and girls. We examine whether parental gender attitudes seem to affect aspirations
for education and discussion of education goals.12 Table 9 examines whether parents’ gender
attitudes affect student desires to continue school beyond high school (grade 12). We find a
positive association between the parent gender index and girls’ plans for education (+0.026 in
column 2, p < 0.10). However, we find almost no evidence of a positive relationship with girls’
discussion of educational goals with parents (+0.006, in column 4, p > 0.10), and of a negative
relationship for boys’ education (-0.006 in column 6, p > 0.10) and discussion of educational
goals (-0.017 in column 8, p > 0.10). Since most of the estimates are not statistically significant,
conclusive statements are difficult to establish.
In Table 10 which examines the relationship between student attitudes and behavior, we
find that male and female students with more progressive gender attitudes report being more
16
comfortable with children of the opposite gender (0.036, p < 0.01 for girls; 0.019, p < 0.10 for
boys). We find almost no evidence of a positive association between the student gender index
and girls’ presence in school in the previous week (0.012, p > 0.10), and similarly for boy’s
absence (0.014, p > 0.10)
5 Conclusion
This paper examines the intergenerational transmission of attitudes toward gender equality
in the context of a developing country, and specifically one with especially large gender gaps in
outcomes. Using survey data that directly and simultaneously measured these attitudes among
school children and their parents in rural India, we find that child attitudes are influenced by
parents’ attitudes, especially mothers’. The effect sizes are moderate in size – parents are an
important factor shaping adolescents’ attitudes, but they transmit their views to their children
far from perfectly, and no more so that previous studies find in developed, Western countries.
We show that parental time with children is a potentially important channel through which
transmission occurs. We also find a link between students’ gender attitudes with their interaction
with children of the opposite sex, which underlines the potentially important role that gender
attitudes have on outcomes.
Our findings should be read with a few caveats. First, we do not address selection into
school attendance, and both the degree of gender-discriminatory attitudes and their intergen-
erational transmission might be very different in the (small minority of) families that hold ex-
tremely conservative views and do not allow their children, especially girls, to study through
grade six. Similarly, the degree of intergenerational transmission of gender attitudes might dif-
fer in other settings. Participants in our study in rural Haryana, which has one of the worst child
sex ratios in India, might simultaneously hold conservative gender views and be particularly
motivated to transmit those views to their children. Alternatively, the parents in our setting
might have attitudes so far out of step with the messages that their children are hearing through
17
mass media and elsewhere that their children emulate their views less in this context than others.
Second, while we examine the effect of parent attitudes on child attitudes during adoles-
cence, these might change as they get older. For instance, children may form their own opinions
with age and greater exposure to social attitudes outside home and school, which would weaken
the intergenerational correlation. Conversely, the correlation with parent attitudes might get
stronger with age, as teens outgrow a rebellious phase and return to the traditional beliefs held
in their families.
Third, while we examine the influence of parent attitudes on a number of proximate out-
comes, the data do not allow us to estimate the impact of parent attitudes on long term child
welfare measures such as educational achievement, occupational choice, marriage and fertility.
The role of parent attitudes might be mitigated once children are older, are financially indepen-
dent, and do not live with their parents.
Nonetheless, the findings suggest the importance of policies that address gender equal-
ity attitudes among both parents and children as an important pathway to improve women’s
outcomes in developing countries.
18
Notes1 Washington (2008) and Oswald and Powdthavee (2010) document that the presence of daughters in the
household changes voting behavior of legislator parents. However, they do not explore the role of children’s
attitudes on parent attitudes.
2 Budget constraints were the reason why only 40% of parents were chosen.
3 If these schools were adjacent to each other or shared a building, we considered them a single school.
4 The sampling procedure implies that the schools included in the study deviate from the universe of schools in
a number of ways. First, our survey does not cover the 731 private unaided schools which are disproportionately
in urban areas; thus, urban and wealthier students are underrepresented. Second, among government schools,
we excluded schools where grades six and seven had a combined average enrollment of less than 45 students; the
government schools in our sample have higher enrollment and are in larger villages than the universe of government
schools.
5We also present results for three other versions of the gender index: an unweighted index, an index based on
principal components (PCA), and an index that uses all five values of the Likert scale responses.
6 The results are also robust to including school-gender-grade fixed effects. The reason our main specification
does not include school-gender-grade fixed effects is that we also include peer gender attitudes in Table 3, and this
variable only varies at the school-gender-grade analysis.
7 One concern in interpreting the effect sizes reported in Table 3 is that since parental gender attitudes are
measured with error, the OLS coefficients could be biased. To help address measurement error, we also perform
instrumental variables (IV) regressions, in which the eight other parental attitude variables (eight instruments) are
used to predict the parent’s attitude for a particular question. With this IV approach, we find effect sizes that are
50 percent larger in magnitude than using OLS. The detailed results are available from the authors.
8 Most schools have one section per grade. We do not have data on which section the student is in in cases of
multiple sections per grade.
9 Other research papers examining the intergenerational transmission of gender attitudes and behavior include
Escriche, Olcina, and Sanchez (2004), Fernandez, Fogli, and Olivetti (2004), Martin et al. (2002), Smith and
Self (1980), Sholomskas and Axelrod (1986), Barak, Feldman, and Noy (1991) and Farre and Vella (2013). The
broader literature also examines the intergenerational transmission of cultural, ethnic, racial and other types of
social attitudes. Papers in this literature include Bisin and Verdier (2000) and Hoge, Petrillo, and Smith (1982)
who examine the intergenerational transmission of ethnic and religious traits in the United States, and Sinclair,
Dunn, and Lowery (2005) who examine the transmission of racial attitudes.
19
10Kulik (2002) reports a strong relationship between fathers’ and sons’ attitudes in Israel (0.42) that is greater
than the correlation patterns between mothers and daughters, and mothers and sons (0.34 and 0.31, respectively.
11 Such an explanation would be consistent with exchange theory, where a higher frequency of interaction with
children explains greater maternal influence (Homans 1974).
12 Fernandez (2013) develops a model where social attitudes on women’s labor force participation can determine
actual labor force participation.
20
ReferencesAcock, A. and V. Bengtson (1978). On the relative influence of mothers and fathers: A covariance
analysis of political and religious socialization. Journal of Marriage and Family 40(3), 519–530.
Alesina, A., P. Giuliano, and N. Nunn (2013). On the origins of gender roles: Women and the plough.Quarterly Journal of Economics 128(2), 469–530.
Anderson, M. (2008). Multiple inference and gender differences in the effects of early intervention:A reevaluation of the Abecedarian, Perry preschool, and early training projects. Journal of theAmerican Statistical Association 103(484), 1481–1495.
Anukriti, S. (2018). Financial incentives and the fertility-sex ratio trade-off. American Economic Jour-nal: Applied Economics 10(2), 27–57.
Barak, A., S. Feldman, and A. Noy (1991). Traditionality of children’s interests as related to theirparents’ gender stereotypes and traditionality of occupations. Sex Roles 24(7-8), 511–524.
Beaman, L., R. Chattopadhyay, E. Duflo, R. Pande, and P. Topalova (2009). Powerful women: Doesexposure reduce bias? Quarterly Journal of Economics 124(4), 1497–1540.
Beaman, L., E. Duflo, R. Pande, and P. Topalova (2012). Female leadership raises aspirations andeducational attainment for girls: A policy experiment in India. science 335(6068), 582–586.
Becker, G. (1971). The economics of discrimination. Chicago: University of Chicago Press.
Bisin, A. and T. Verdier (2000). “Beyond the melting pot”: Cultural transmission, marriage, and theevolution of ethnic and religious traits. Quarterly Journal of Economics 115(3), 955–988.
Bisin, A. and T. Verdier (2001). The economics of cultural transmission and the dynamics of prefer-ences. Journal of Economic Theory 97(2), 298–319.
Bisin, A. and T. Verdier (2011). The economics of cultural transmission and socialization. In Hand-book of Social Economics, Volume 1, pp. 339–416. Elsevier.
Blau, F., L. Kahn, and K. Papps (2011). Gender, source country characteristics, and labor marketassimilation among immigrants. Review of Economics and Statistics 93(1), 43–58.
Boyd, C. (1989). Mothers and daughters: A discussion of theory and research. Journal of Marriageand the Family 51(2), 291–301.
Campa, P. and M. Serafinelli (2017). Politico-economic regimes and attitudes: Female workers understate-socialism. Review of Economics and Statistics (forthcoming).
Chowdhry, P. (1994). The veiled women: Shifting gender equations in rural Haryana 1880-1990.Delhi: Oxford University Press.
Cunningham, M. (2001). The influence of parental attitudes and behaviors on children’s attitudestoward gender and household labor in early adulthood. Journal of Marriage and Family 63(1),111–122.
Deininger, K., A. Goyal, and H. Nagarajan (2013). Women’s inheritance rights and intergenerationaltransmission of resources in India. Journal of Human Resources 48(1), 114–141.
Doepke, M. and F. Zilibotti (2017). Parenting with style: Altruism and paternalism in intergenera-tional preference transmission. Econometrica 85(5), 1331–1372.
Duflo, E. (2012). Women empowerment and economic development. Journal of Economic Litera-ture 50(4), 1051–1079.
21
Escriche, L., G. Olcina, and R. Sanchez (2004). Gender discrimination and intergenerational trans-mission of preferences. Oxford Economic Papers 56(3), 485–511.
Ex, C. and J. Janssens (1998). Maternal influences on daughters’ gender role attitudes. SexRoles 38(3/4), 171–186.
Farre, L. and F. Vella (2013). The intergenerational transmission of gender role attitudes and its im-plications for female labour force participation. Economica 80(318), 219–247.
Fernandez, R. (2007). Women, work, and culture. Journal of European Economic Association 5(2-3),305–332.
Fernandez, R. (2013). Cultural change as learning: The evolution of female labor force participationover a century. American Economic Review 103(1), 472–500.
Fernandez, R. and A. Fogli (2006). Fertility: The role of culture and family experience. Journal ofEuropean Economic Association 4(2-3), 552–561.
Fernandez, R. and A. Fogli (2009). Culture: An empirical investigation of beliefs, work, and fertility.American Economic Journal: Macroeconomics 1(1), 146–177.
Fernandez, R., A. Fogli, and C. Olivetti (2004). Mothers and sons: Preference formation and femalelabor force dynamics. Quarterly Journal of Economics 119(4), 1249–1299.
Gangadharan, L., T. Jain, P. Maitra, and J. Vecci (2016). Social identity and governance: The behav-ioral response to female leaders. European Economic Review 90, 302–325.
Ghani, S., A. Mani, and S. O’Connell (2013). Can political empowerment help economic empower-ment? Women leaders and female labor force participation in India. World Bank Policy ResearchWorking Paper No. 6675.
Giuliano, P. (2017). Gender: An historical perspective. NBER Working Paper No. 23635.
Giuliano, P. and N. Nunn (2017). Understanding cultural persistence and change. NBER WorkingPaper No. 23617.
Glass, J., V. Bengtson, and C. Dunham (1986). Attitude similarity in three-generation families: So-cialization, status inheritance, or reciprocal influence? American Sociological Review 51(5), 685–698.
Greenwald, A., D. McGhee, and J. Schwartz (1998). Measuring individual differences in implicitcognition: The implicit association test. Journal of Personality and Social Psychology 74(6),1464.
Grosjean, P. and R. Khattar (2017). It’s raining men! Hallelujah? The long-run consequences ofmale-biased sex ratios. Review of Economic Studies (forthcoming).
Hoge, D., G. Petrillo, and E. Smith (1982). Transmission of religious and social values from parentsto teenage children. Journal of Marriage and Family 44(3), 569–580.
Homans, G. (1974). Social behavior: Its elementary forms. New York: Harcourt Brace Jovanovich.
Jain, T. (2014). Where there is a will: Fertility behavior and sex bias in large families. Journal ofHuman Resources 49(2), 393–423.
Jayachandran, S. (2015). The root causes of gender inequality in developing countries. Annual Reviewof Economics 7, 63–88.
Jensen, R. and E. Oster (2009). The power of TV: Cable television and women’s status in India.Quarterly Journal of Economics 124(3), 1057–1094.
22
Johnston, D., S. Schurer, and M. Shields (2014). Maternal gender role attitudes, human capital invest-ment, and labour supply of sons and daughters. Oxford Economic Papers 66(3), 631–659.
Kohlberg, L. (1976). Moral stages and moralization: The cognitive-developmental approach. InT. Lickona (Ed.), Moral development and behavior: Theory, research, and social issues, pp.31–53. New York: Holt, Rinehart and Winston.
Kulik, L. (2002). Like-sex versus opposite-sex effects in transmission of gender role ideology fromparents to adolescents in Israel. Journal of Youth and Adolescence 31(6), 451–457.
La Ferrara, E., A. Chong, and S. Duryea (2012). Soap operas and fertility: Evidence from brazil.American Economic Journal: Applied Economics 4(4), 1–31.
Martin, S., K. Moracco, J. Garro, A. Tsui, L. Kupper, J. Chase, and J. Campbell (2002). Domesticviolence across generations: Findings from northern India. International Journal of Epidemiol-ogy 31(3), 560–572.
Milkie, M., K. Nomaguchi, and K. Denny (2015). Does the amount of time mothers spend withchildren or adolescents matter? Journal of Marriage and Family 77(2), 355–372.
Moen, P., M. Erikson, and D. Dempster-McClain (1997). Their mother’s daughters? The intergen-erational transmission of gender attitudes in a world of changing roles. Journal of Marriage andFamily 59(2), 281–293.
Munshi, K. and J. Myaux (2006). Social norms and the fertility transition. Journal of DevelopmentEconomics 80(1), 1 – 38.
Munshi, K. and M. Rosenzweig (2009). Why is mobility in India so low? Social insurance, inequality,and growth. NBER Working Paper No. 14850.
Neisser, E. (1967). Mothers and daughters: A lifelong relationship. New York: Harper & Row.
Olivetti, C., E. Patacchini, and Y. Zenou (2013). Mothers, friends and gender identity. NBER WorkingPaper No. 19610.
Oswald, A. and N. Powdthavee (2010). Daughters and left-wing voting. Review of Economics andStatistics 92(2), 213–227.
Patacchini, E. and Y. Zenou (2011). Neighborhood effects and parental involvement in the intergener-ational transmission of education. Journal of Regional Science 51, 987–1013.
Psacharopoulos, G. and Z. Tzannatos (1989). Female labor force participation: An international per-spective. World Bank Research Observer 4(2), 187–201.
Sankaran, S., M. Sekerdej, and U. Von Hecker (2017). The role of Indian caste identity and casteinconsistent norms on status representation. Frontiers in Psychology 8, 487.
Seguino, S. (2011). Help or hindrance? Religion’s impact on gender inequality in attitudes and out-comes. World Development 39(8), 1308 – 1321.
Sholomskas, D. and R. Axelrod (1986). The influence of mother-daughter relationships on women’ssense of self and current role choices. Psychology of Women Quarterly 10(2), 171–182.
Sinclair, S., S. Dunn, and B. Lowery (2005). The relationship between parental racial attitudes andchildrens implicit prejudice. Journal of Experimental Social Psychology 41(3), 283–289.
Smith, M. and G. Self (1980). The congruence between mothers’ and daughters’ sex-role attitudes: Aresearch note. Journal of Marriage and the Family 42(1), 105–109.
23

Steele, J. and J. Barling (1996). Influence of maternal gender-role beliefs and role satisfaction ondaughters’ vocational interests. Sex Roles 34(9), 637–648.
Thornton, A., D. Alwin, and D. Camburn (1983). Causes and consequences of sex-role attitudes andattitude change. American Sociological Review 48(2), 211–227.
Washington, E. (2008). Female socialization: How daughters affect their legislator fathers’ voting onwomen’s issues. American Economic Review 98(1), 311–332.
24
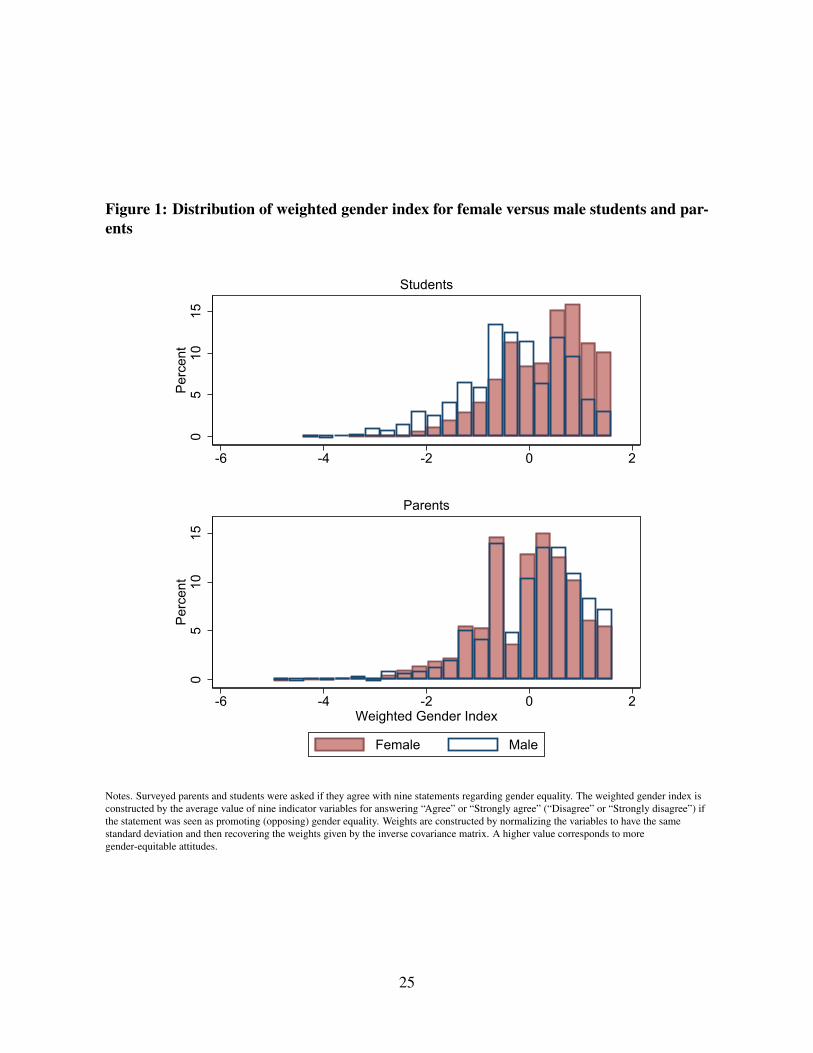
Figure 1: Distribution of weighted gender index for female versus male students and par-ents
05
1015
Per
cent
-6 -4 -2 0 2
Students
05
1015
Per
cent
-6 -4 -2 0 2Weighted Gender Index
Female Male
Parents
Notes. Surveyed parents and students were asked if they agree with nine statements regarding gender equality. The weighted gender index isconstructed by the average value of nine indicator variables for answering “Agree” or “Strongly agree” (“Disagree” or “Strongly disagree”) ifthe statement was seen as promoting (opposing) gender equality. Weights are constructed by normalizing the variables to have the samestandard deviation and then recovering the weights given by the inverse covariance matrix. A higher value corresponds to moregender-equitable attitudes.
25
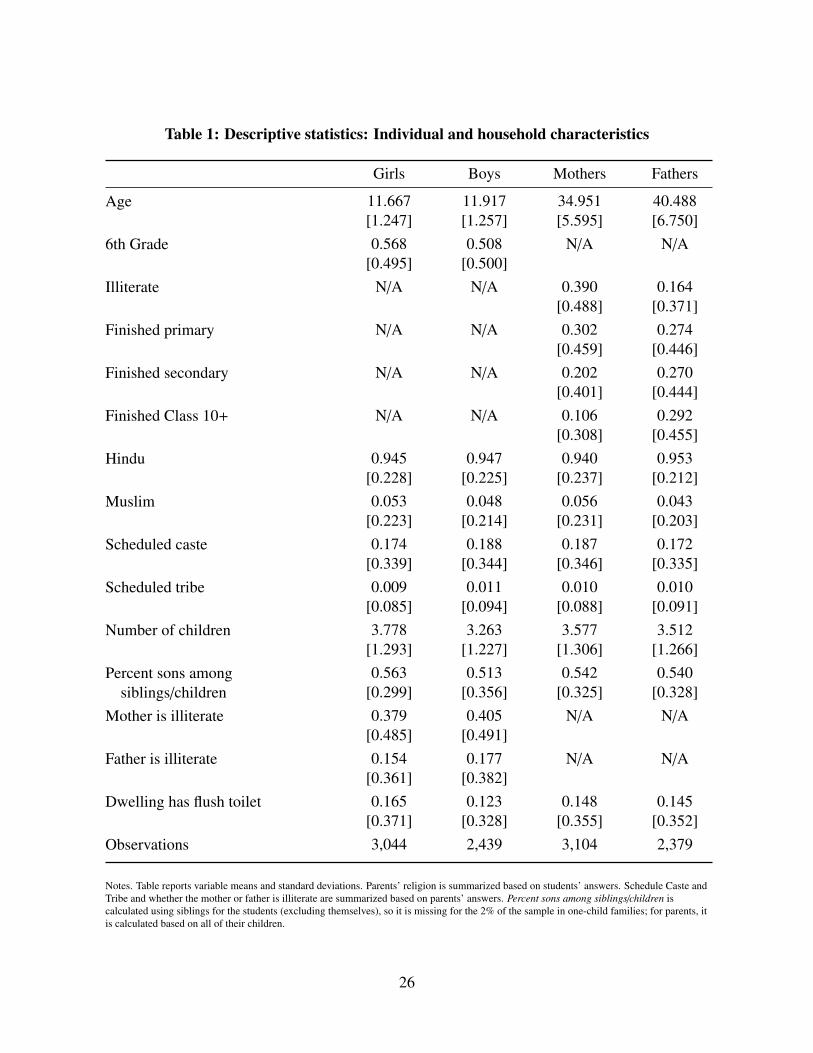
Table 1: Descriptive statistics: Individual and household characteristics
Girls Boys Mothers Fathers
Age 11.667 11.917 34.951 40.488[1.247] [1.257] [5.595] [6.750]
6th Grade 0.568 0.508 N/A N/A[0.495] [0.500]
Illiterate N/A N/A 0.390 0.164[0.488] [0.371]
Finished primary N/A N/A 0.302 0.274[0.459] [0.446]
Finished secondary N/A N/A 0.202 0.270[0.401] [0.444]
Finished Class 10+ N/A N/A 0.106 0.292[0.308] [0.455]
Hindu 0.945 0.947 0.940 0.953[0.228] [0.225] [0.237] [0.212]
Muslim 0.053 0.048 0.056 0.043[0.223] [0.214] [0.231] [0.203]
Scheduled caste 0.174 0.188 0.187 0.172[0.339] [0.344] [0.346] [0.335]
Scheduled tribe 0.009 0.011 0.010 0.010[0.085] [0.094] [0.088] [0.091]
Number of children 3.778 3.263 3.577 3.512[1.293] [1.227] [1.306] [1.266]
Percent sons among 0.563 0.513 0.542 0.540siblings/children [0.299] [0.356] [0.325] [0.328]
Mother is illiterate 0.379 0.405 N/A N/A[0.485] [0.491]
Father is illiterate 0.154 0.177 N/A N/A[0.361] [0.382]
Dwelling has flush toilet 0.165 0.123 0.148 0.145[0.371] [0.328] [0.355] [0.352]
Observations 3,044 2,439 3,104 2,379
Notes. Table reports variable means and standard deviations. Parents’ religion is summarized based on students’ answers. Schedule Caste andTribe and whether the mother or father is illiterate are summarized based on parents’ answers. Percent sons among siblings/children iscalculated using siblings for the students (excluding themselves), so it is missing for the 2% of the sample in one-child families; for parents, itis calculated based on all of their children.
26
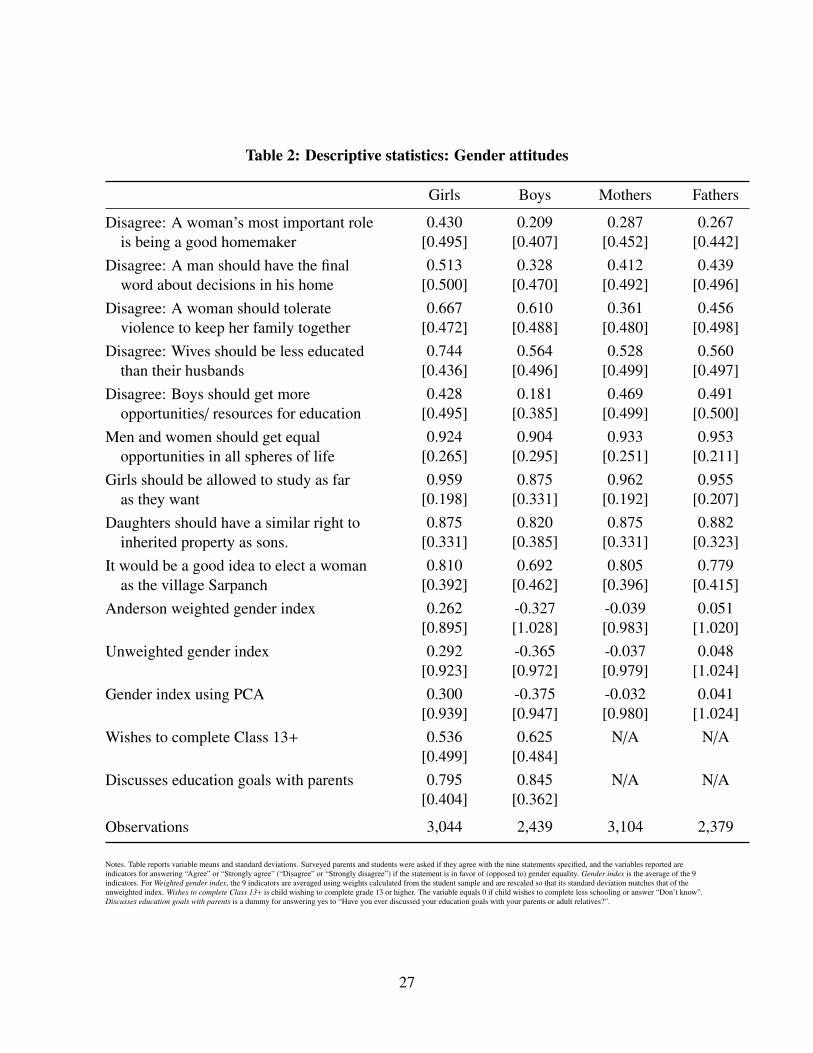
Table 2: Descriptive statistics: Gender attitudes
Girls Boys Mothers Fathers
Disagree: A woman’s most important role 0.430 0.209 0.287 0.267is being a good homemaker [0.495] [0.407] [0.452] [0.442]
Disagree: A man should have the final 0.513 0.328 0.412 0.439word about decisions in his home [0.500] [0.470] [0.492] [0.496]
Disagree: A woman should tolerate 0.667 0.610 0.361 0.456violence to keep her family together [0.472] [0.488] [0.480] [0.498]
Disagree: Wives should be less educated 0.744 0.564 0.528 0.560than their husbands [0.436] [0.496] [0.499] [0.497]
Disagree: Boys should get more 0.428 0.181 0.469 0.491opportunities/ resources for education [0.495] [0.385] [0.499] [0.500]
Men and women should get equal 0.924 0.904 0.933 0.953opportunities in all spheres of life [0.265] [0.295] [0.251] [0.211]
Girls should be allowed to study as far 0.959 0.875 0.962 0.955as they want [0.198] [0.331] [0.192] [0.207]
Daughters should have a similar right to 0.875 0.820 0.875 0.882inherited property as sons. [0.331] [0.385] [0.331] [0.323]
It would be a good idea to elect a woman 0.810 0.692 0.805 0.779as the village Sarpanch [0.392] [0.462] [0.396] [0.415]
Anderson weighted gender index 0.262 -0.327 -0.039 0.051[0.895] [1.028] [0.983] [1.020]
Unweighted gender index 0.292 -0.365 -0.037 0.048[0.923] [0.972] [0.979] [1.024]
Gender index using PCA 0.300 -0.375 -0.032 0.041[0.939] [0.947] [0.980] [1.024]
Wishes to complete Class 13+ 0.536 0.625 N/A N/A[0.499] [0.484]
Discusses education goals with parents 0.795 0.845 N/A N/A[0.404] [0.362]
Observations 3,044 2,439 3,104 2,379
Notes. Table reports variable means and standard deviations. Surveyed parents and students were asked if they agree with the nine statements specified, and the variables reported areindicators for answering “Agree” or “Strongly agree” (“Disagree” or “Strongly disagree”) if the statement is in favor of (opposed to) gender equality. Gender index is the average of the 9indicators. For Weighted gender index, the 9 indicators are averaged using weights calculated from the student sample and are rescaled so that its standard deviation matches that of theunweighted index. Wishes to complete Class 13+ is child wishing to complete grade 13 or higher. The variable equals 0 if child wishes to complete less schooling or answer “Don’t know”.Discusses education goals with parents is a dummy for answering yes to “Have you ever discussed your education goals with your parents or adult relatives?”.
27
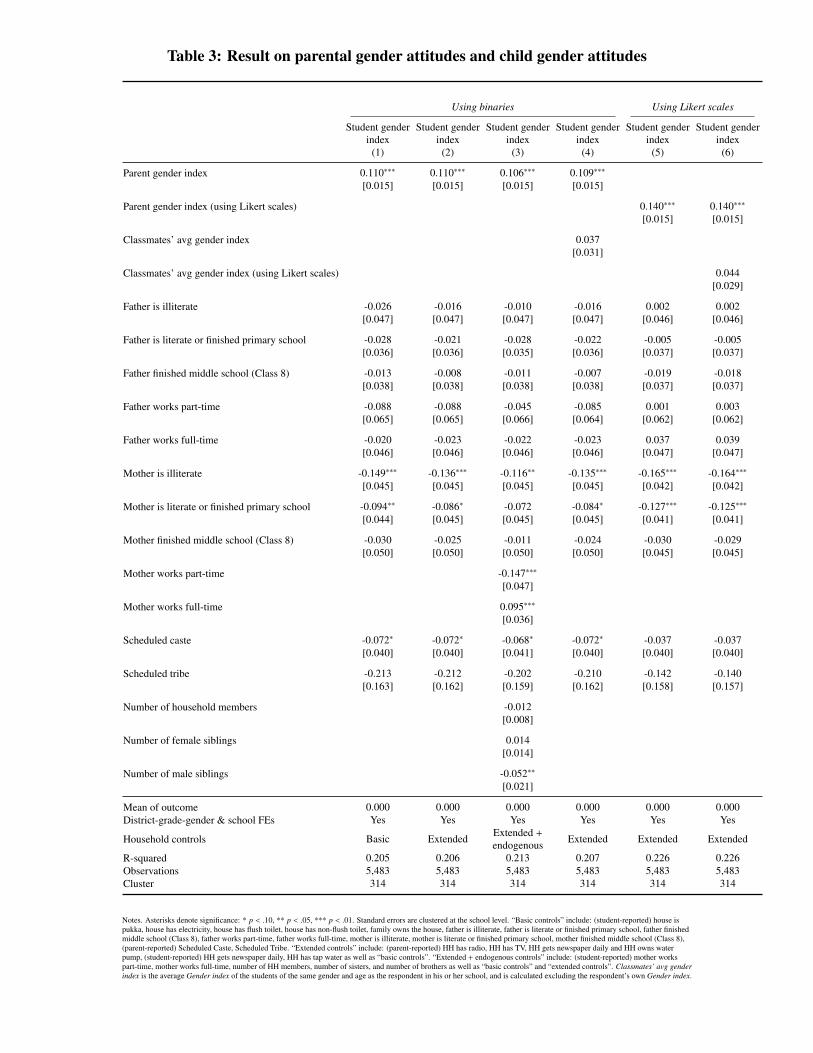
Table 3: Result on parental gender attitudes and child gender attitudes
Using binaries Using Likert scales
Student genderindex
Student genderindex
Student genderindex
Student genderindex
Student genderindex
Student genderindex
(1) (2) (3) (4) (5) (6)
Parent gender index 0.110∗∗∗ 0.110∗∗∗ 0.106∗∗∗ 0.109∗∗∗
[0.015] [0.015] [0.015] [0.015]
Parent gender index (using Likert scales) 0.140∗∗∗ 0.140∗∗∗
[0.015] [0.015]
Classmates’ avg gender index 0.037[0.031]
Classmates’ avg gender index (using Likert scales) 0.044[0.029]
Father is illiterate -0.026 -0.016 -0.010 -0.016 0.002 0.002[0.047] [0.047] [0.047] [0.047] [0.046] [0.046]
Father is literate or finished primary school -0.028 -0.021 -0.028 -0.022 -0.005 -0.005[0.036] [0.036] [0.035] [0.036] [0.037] [0.037]
Father finished middle school (Class 8) -0.013 -0.008 -0.011 -0.007 -0.019 -0.018[0.038] [0.038] [0.038] [0.038] [0.037] [0.037]
Father works part-time -0.088 -0.088 -0.045 -0.085 0.001 0.003[0.065] [0.065] [0.066] [0.064] [0.062] [0.062]
Father works full-time -0.020 -0.023 -0.022 -0.023 0.037 0.039[0.046] [0.046] [0.046] [0.046] [0.047] [0.047]
Mother is illiterate -0.149∗∗∗ -0.136∗∗∗ -0.116∗∗ -0.135∗∗∗ -0.165∗∗∗ -0.164∗∗∗
[0.045] [0.045] [0.045] [0.045] [0.042] [0.042]
Mother is literate or finished primary school -0.094∗∗ -0.086∗ -0.072 -0.084∗ -0.127∗∗∗ -0.125∗∗∗
[0.044] [0.045] [0.045] [0.045] [0.041] [0.041]
Mother finished middle school (Class 8) -0.030 -0.025 -0.011 -0.024 -0.030 -0.029[0.050] [0.050] [0.050] [0.050] [0.045] [0.045]
Mother works part-time -0.147∗∗∗
[0.047]
Mother works full-time 0.095∗∗∗
[0.036]
Scheduled caste -0.072∗ -0.072∗ -0.068∗ -0.072∗ -0.037 -0.037[0.040] [0.040] [0.041] [0.040] [0.040] [0.040]
Scheduled tribe -0.213 -0.212 -0.202 -0.210 -0.142 -0.140[0.163] [0.162] [0.159] [0.162] [0.158] [0.157]
Number of household members -0.012[0.008]
Number of female siblings 0.014[0.014]
Number of male siblings -0.052∗∗
[0.021]
Mean of outcome 0.000 0.000 0.000 0.000 0.000 0.000District-grade-gender & school FEs Yes Yes Yes Yes Yes Yes
Household controls Basic Extended Extended +
endogenous Extended Extended Extended
R-squared 0.205 0.206 0.213 0.207 0.226 0.226Observations 5,483 5,483 5,483 5,483 5,483 5,483Cluster 314 314 314 314 314 314
Notes. Asterisks denote significance: * p < .10, ** p < .05, *** p < .01. Standard errors are clustered at the school level. “Basic controls” include: (student-reported) house ispukka, house has electricity, house has flush toilet, house has non-flush toilet, family owns the house, father is illiterate, father is literate or finished primary school, father finishedmiddle school (Class 8), father works part-time, father works full-time, mother is illiterate, mother is literate or finished primary school, mother finished middle school (Class 8),(parent-reported) Scheduled Caste, Scheduled Tribe. “Extended controls” include: (parent-reported) HH has radio, HH has TV, HH gets newspaper daily and HH owns waterpump, (student-reported) HH gets newspaper daily, HH has tap water as well as “basic controls”. “Extended + endogenous controls” include: (student-reported) mother workspart-time, mother works full-time, number of HH members, number of sisters, and number of brothers as well as “basic controls” and “extended controls”. Classmates’ avg genderindex is the average Gender index of the students of the same gender and age as the respondent in his or her school, and is calculated excluding the respondent’s own Gender index.
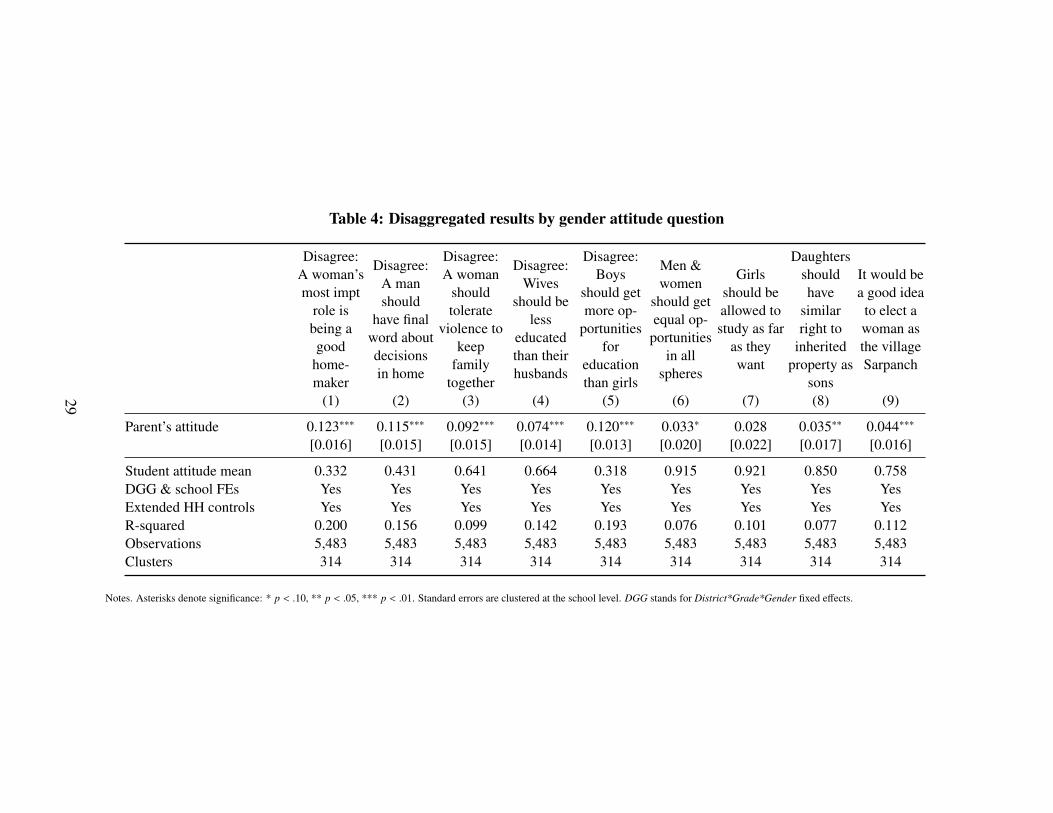
Table 4: Disaggregated results by gender attitude question
Disagree:A woman’smost impt
role isbeing agood
home-maker
Disagree:A manshould
have finalword aboutdecisionsin home
Disagree:A woman
shouldtolerate
violence tokeep
familytogether
Disagree:Wives
should beless
educatedthan theirhusbands
Disagree:Boys
should getmore op-
portunitiesfor
educationthan girls
Men &women
should getequal op-
portunitiesin all
spheres
Girlsshould beallowed tostudy as far
as theywant
Daughtersshouldhave
similarright to
inheritedproperty as
sons
It would bea good ideato elect awoman asthe villageSarpanch
(1) (2) (3) (4) (5) (6) (7) (8) (9)
Parent’s attitude 0.123∗∗∗ 0.115∗∗∗ 0.092∗∗∗ 0.074∗∗∗ 0.120∗∗∗ 0.033∗ 0.028 0.035∗∗ 0.044∗∗∗
[0.016] [0.015] [0.015] [0.014] [0.013] [0.020] [0.022] [0.017] [0.016]
Student attitude mean 0.332 0.431 0.641 0.664 0.318 0.915 0.921 0.850 0.758DGG & school FEs Yes Yes Yes Yes Yes Yes Yes Yes YesExtended HH controls Yes Yes Yes Yes Yes Yes Yes Yes YesR-squared 0.200 0.156 0.099 0.142 0.193 0.076 0.101 0.077 0.112Observations 5,483 5,483 5,483 5,483 5,483 5,483 5,483 5,483 5,483Clusters 314 314 314 314 314 314 314 314 314
Notes. Asterisks denote significance: * p < .10, ** p < .05, *** p < .01. Standard errors are clustered at the school level. DGG stands for District*Grade*Gender fixed effects.
29
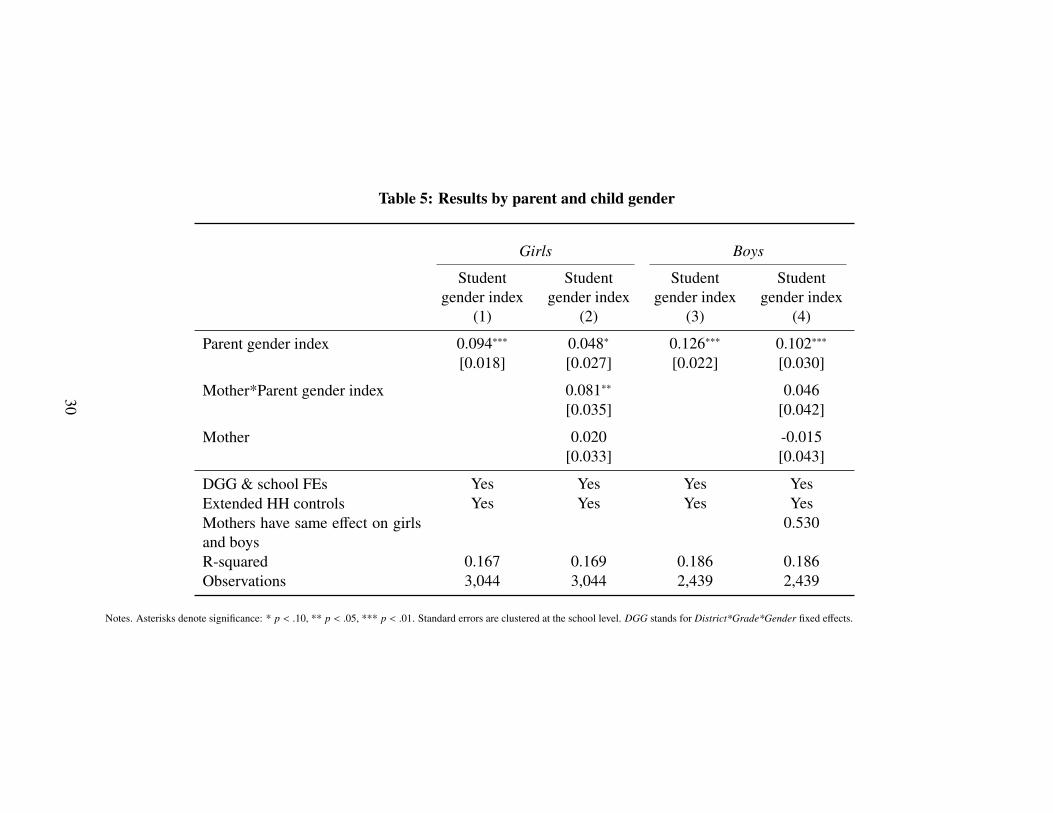
Table 5: Results by parent and child gender
Girls Boys
Studentgender index
Studentgender index
Studentgender index
Studentgender index
(1) (2) (3) (4)
Parent gender index 0.094∗∗∗ 0.048∗ 0.126∗∗∗ 0.102∗∗∗
[0.018] [0.027] [0.022] [0.030]
Mother*Parent gender index 0.081∗∗ 0.046[0.035] [0.042]
Mother 0.020 -0.015[0.033] [0.043]
DGG & school FEs Yes Yes Yes YesExtended HH controls Yes Yes Yes YesMothers have same effect on girlsand boys
0.530
R-squared 0.167 0.169 0.186 0.186Observations 3,044 3,044 2,439 2,439
Notes. Asterisks denote significance: * p < .10, ** p < .05, *** p < .01. Standard errors are clustered at the school level. DGG stands for District*Grade*Gender fixed effects.
30
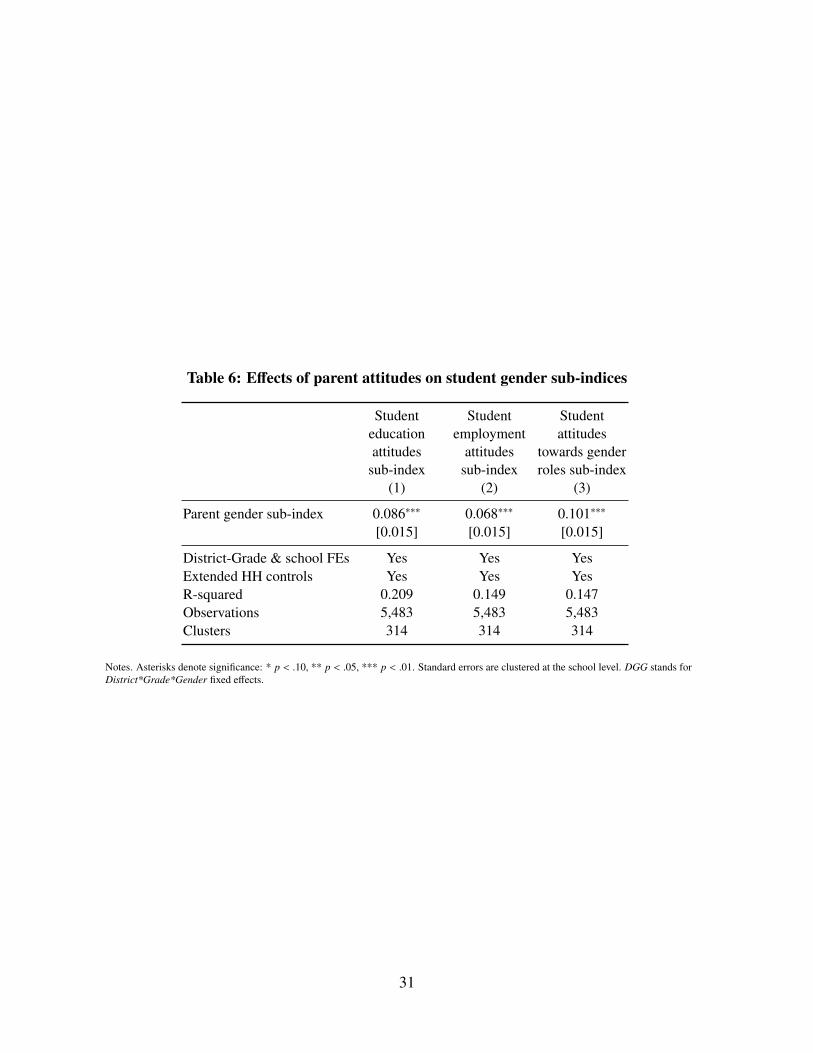
Table 6: Effects of parent attitudes on student gender sub-indices
Studenteducationattitudes
sub-index
Studentemployment
attitudessub-index
Studentattitudes
towards genderroles sub-index
(1) (2) (3)
Parent gender sub-index 0.086∗∗∗ 0.068∗∗∗ 0.101∗∗∗
[0.015] [0.015] [0.015]
District-Grade & school FEs Yes Yes YesExtended HH controls Yes Yes YesR-squared 0.209 0.149 0.147Observations 5,483 5,483 5,483Clusters 314 314 314
Notes. Asterisks denote significance: * p < .10, ** p < .05, *** p < .01. Standard errors are clustered at the school level. DGG stands forDistrict*Grade*Gender fixed effects.
31
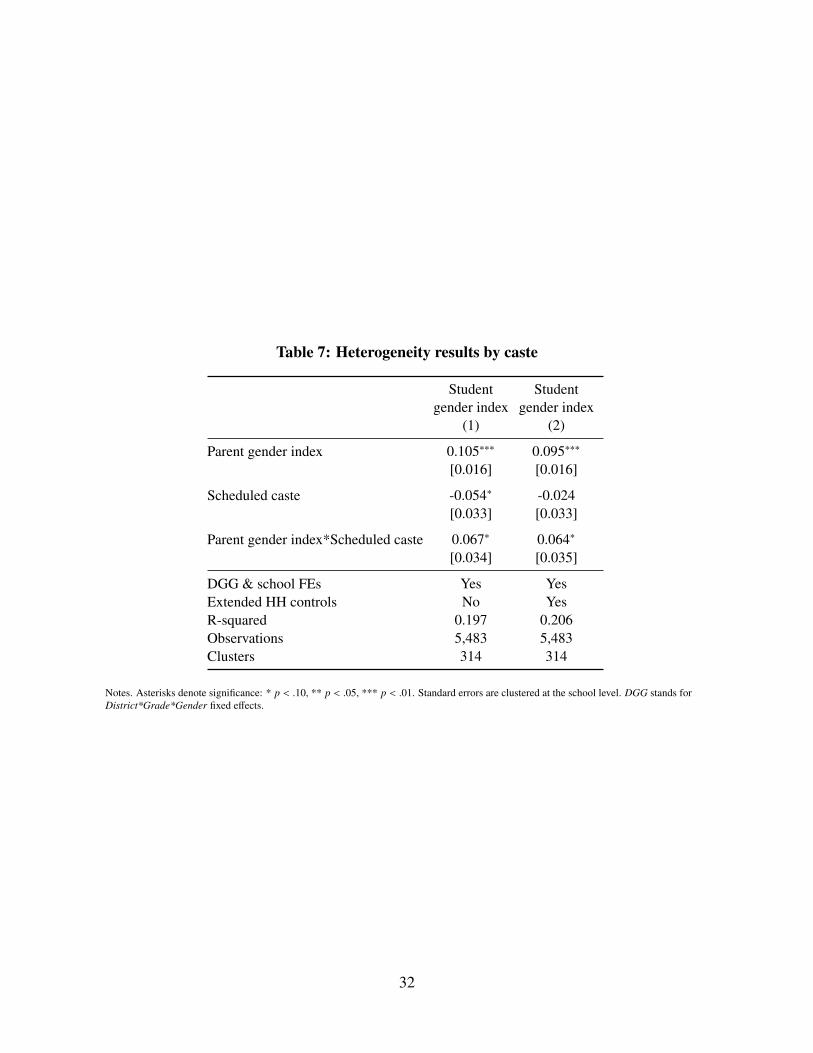
Table 7: Heterogeneity results by caste
Studentgender index
Studentgender index
(1) (2)
Parent gender index 0.105∗∗∗ 0.095∗∗∗
[0.016] [0.016]
Scheduled caste -0.054∗ -0.024[0.033] [0.033]
Parent gender index*Scheduled caste 0.067∗ 0.064∗
[0.034] [0.035]
DGG & school FEs Yes YesExtended HH controls No YesR-squared 0.197 0.206Observations 5,483 5,483Clusters 314 314
Notes. Asterisks denote significance: * p < .10, ** p < .05, *** p < .01. Standard errors are clustered at the school level. DGG stands forDistrict*Grade*Gender fixed effects.
32
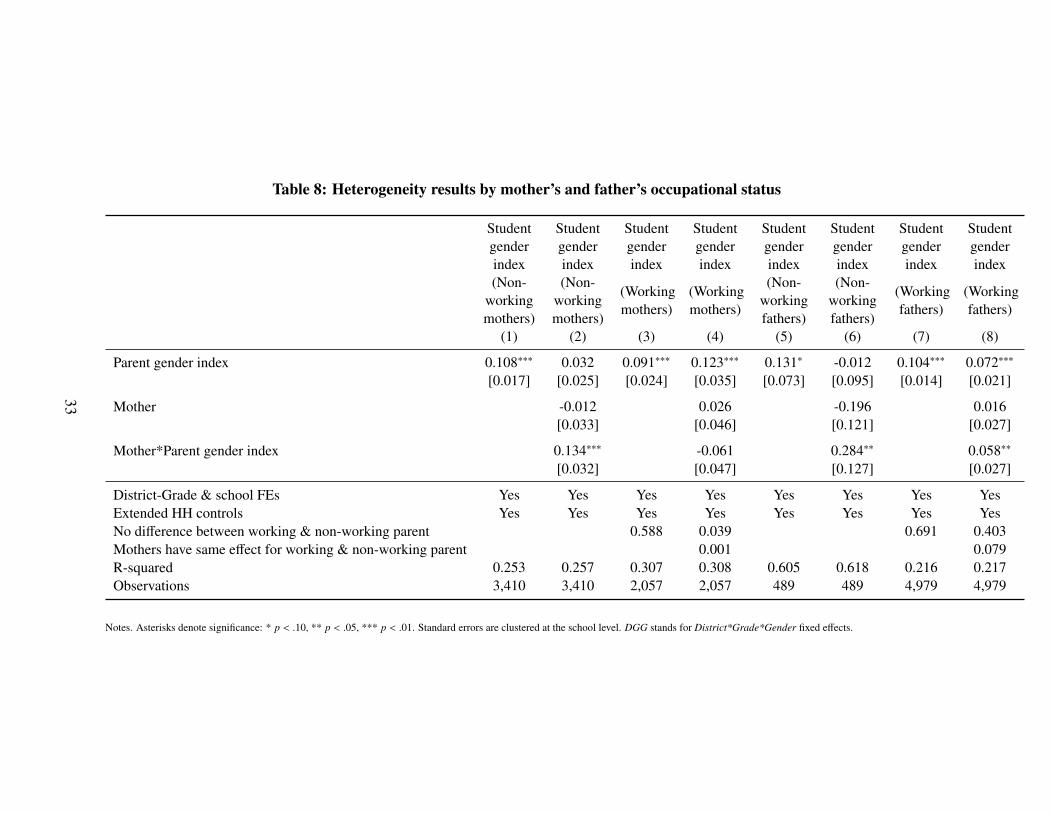
Table 8: Heterogeneity results by mother’s and father’s occupational status
Studentgenderindex
Studentgenderindex
Studentgenderindex
Studentgenderindex
Studentgenderindex
Studentgenderindex
Studentgenderindex
Studentgenderindex
(Non-workingmothers)
(Non-workingmothers)
(Workingmothers)
(Workingmothers)
(Non-workingfathers)
(Non-workingfathers)
(Workingfathers)
(Workingfathers)
(1) (2) (3) (4) (5) (6) (7) (8)
Parent gender index 0.108∗∗∗ 0.032 0.091∗∗∗ 0.123∗∗∗ 0.131∗ -0.012 0.104∗∗∗ 0.072∗∗∗
[0.017] [0.025] [0.024] [0.035] [0.073] [0.095] [0.014] [0.021]
Mother -0.012 0.026 -0.196 0.016[0.033] [0.046] [0.121] [0.027]
Mother*Parent gender index 0.134∗∗∗ -0.061 0.284∗∗ 0.058∗∗
[0.032] [0.047] [0.127] [0.027]
District-Grade & school FEs Yes Yes Yes Yes Yes Yes Yes YesExtended HH controls Yes Yes Yes Yes Yes Yes Yes YesNo difference between working & non-working parent 0.588 0.039 0.691 0.403Mothers have same effect for working & non-working parent 0.001 0.079R-squared 0.253 0.257 0.307 0.308 0.605 0.618 0.216 0.217Observations 3,410 3,410 2,057 2,057 489 489 4,979 4,979
Notes. Asterisks denote significance: * p < .10, ** p < .05, *** p < .01. Standard errors are clustered at the school level. DGG stands for District*Grade*Gender fixed effects.
33
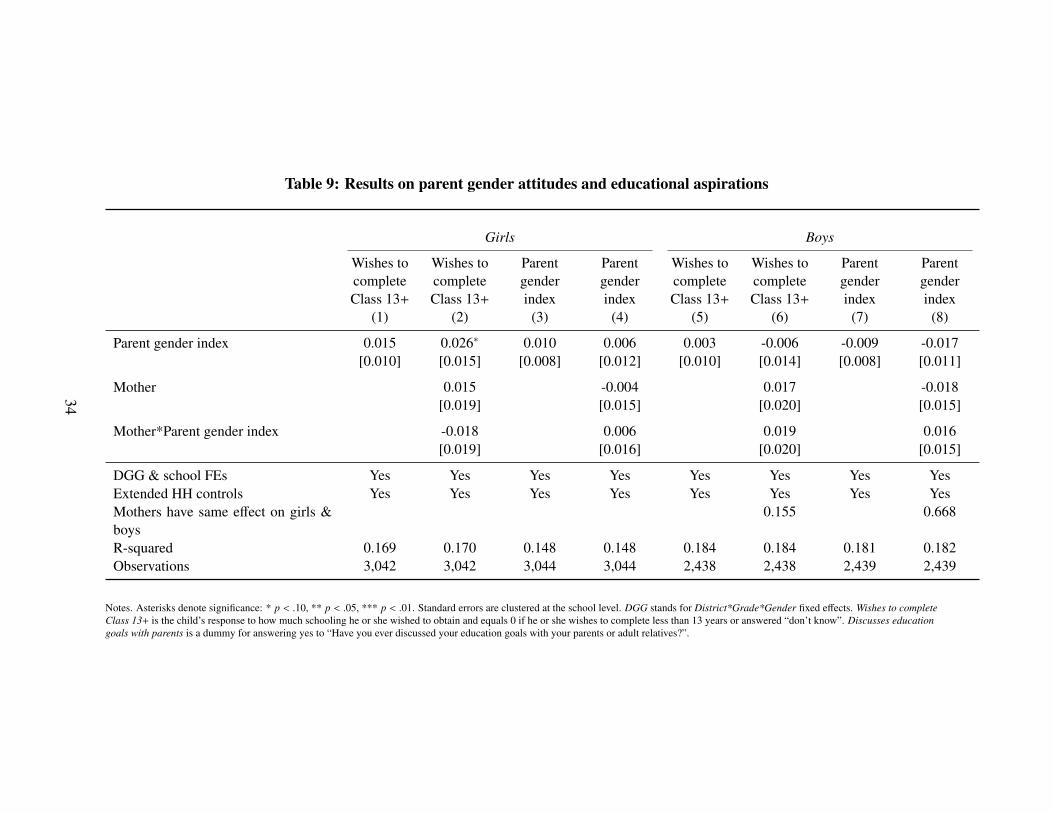
Table 9: Results on parent gender attitudes and educational aspirations
Girls Boys
Wishes tocompleteClass 13+
Wishes tocompleteClass 13+
Parentgenderindex
Parentgenderindex
Wishes tocompleteClass 13+
Wishes tocompleteClass 13+
Parentgenderindex
Parentgenderindex
(1) (2) (3) (4) (5) (6) (7) (8)
Parent gender index 0.015 0.026∗ 0.010 0.006 0.003 -0.006 -0.009 -0.017[0.010] [0.015] [0.008] [0.012] [0.010] [0.014] [0.008] [0.011]
Mother 0.015 -0.004 0.017 -0.018[0.019] [0.015] [0.020] [0.015]
Mother*Parent gender index -0.018 0.006 0.019 0.016[0.019] [0.016] [0.020] [0.015]
DGG & school FEs Yes Yes Yes Yes Yes Yes Yes YesExtended HH controls Yes Yes Yes Yes Yes Yes Yes YesMothers have same effect on girls &boys
0.155 0.668
R-squared 0.169 0.170 0.148 0.148 0.184 0.184 0.181 0.182Observations 3,042 3,042 3,044 3,044 2,438 2,438 2,439 2,439
Notes. Asterisks denote significance: * p < .10, ** p < .05, *** p < .01. Standard errors are clustered at the school level. DGG stands for District*Grade*Gender fixed effects. Wishes to completeClass 13+ is the child’s response to how much schooling he or she wished to obtain and equals 0 if he or she wishes to complete less than 13 years or answered “don’t know”. Discusses educationgoals with parents is a dummy for answering yes to “Have you ever discussed your education goals with your parents or adult relatives?”.
34
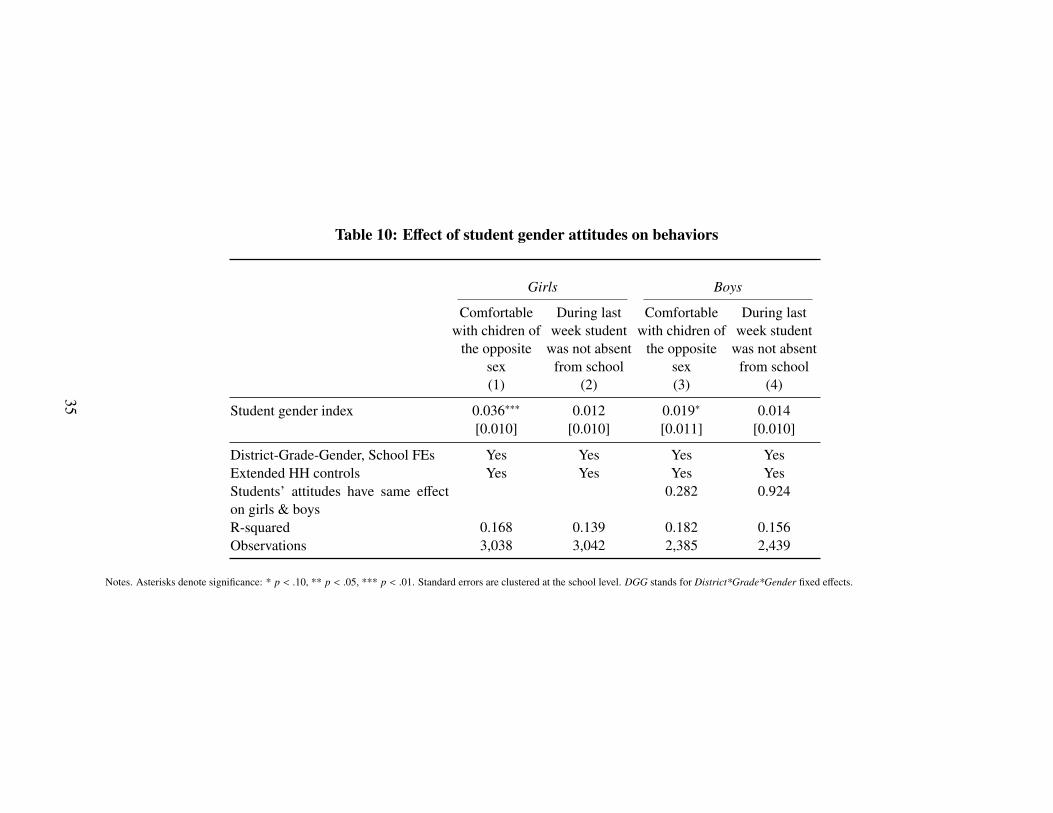
Table 10: Effect of student gender attitudes on behaviors
Girls Boys
Comfortablewith chidren of
the oppositesex
During lastweek student
was not absentfrom school
Comfortablewith chidren of
the oppositesex
During lastweek student
was not absentfrom school
(1) (2) (3) (4)
Student gender index 0.036∗∗∗ 0.012 0.019∗ 0.014[0.010] [0.010] [0.011] [0.010]
District-Grade-Gender, School FEs Yes Yes Yes YesExtended HH controls Yes Yes Yes YesStudents’ attitudes have same effecton girls & boys
0.282 0.924
R-squared 0.168 0.139 0.182 0.156Observations 3,038 3,042 2,385 2,439
Notes. Asterisks denote significance: * p < .10, ** p < .05, *** p < .01. Standard errors are clustered at the school level. DGG stands for District*Grade*Gender fixed effects.
35
Appendices
A Correlation between stated and revealed attitudesA concern with self-reported attitudes, of both children and parents, is strength with which they
represent underlying attitudes. This might happen, for instance, if respondents report to surveyors the
attitudes that they feel are socially desirable to please the surveyor or themselves. Therefore, we check
whether the gender attitudes index is a good proxy for underlying attitudes by correlating with two
alternate measures.
We investigate self-reported parent attitudes by correlating the parent gender attitude index with the
fraction of boys versus girls in the household, which is a revealed preference measure of gender attitudes.
Relatively more boys in the house could indicate more pro-boy attitudes, and vice versa. Appendix Table
5 shows that the parent gender index is negatively correlated with the fraction of sons in the household
(-0.055, p < 0.01), which implies that the gender attitudes index reflects underlying gender preferences.
To assess self-reported child attitudes, we draw on scores from an Implicit Association Test (IAT)
that was administered to a 40% subsample of students. The IAT is a computer-based psychometric tool
designed to detect the strength of automatic association between different ideas and concepts, in this
case between the target concepts of ‘male’ and ‘female’ with the attributes ‘good’ and ‘bad’.13 The
IAT is considered to be difficult to manipulate, and therefore useful for eliciting underlying attitudes
(Greenwald, McGhee, and Schwartz 1998). In the IAT that we administered, the D-measure represents
implicit preference for boys, with a greater (positive) score implying pro-boy attitudes. Appendix Table
6 shows that the D measure is negatively correlated with the student gender index (-0.098, p < 0.01),
suggesting that the gender equality attitudes captured by the gender index are also reflected in the IAT.
36
Appendix Table 1: Gender attitude differences by parent and child gender
Parent genderindex
Studentgender index
Studentgender index
(1) (2) (3)
Mother -0.095∗∗∗
[0.029]
Girl 0.510∗∗∗ 0.538∗∗∗
[0.054] [0.052]
District-Grade & school FEs Yes Yes YesExtended HH controls Yes Yes NoR-squared 0.133 0.188 0.175Observations 5,483 5,483 5,483Clusters 314 314 314
Notes. Asterisks denote significance: * p < .10, ** p < .05, *** p < .01. Standard errors are clustered at the school level.
37
Appendix Table 2: Results on parental gender attitudes and child gender attitudes (Unweighted gender index)
Girls Boys
Studentgender index
Studentgender index
Studentgender index
Studentgender index
(1) (2) (3) (4)
Parent gender index 0.114∗∗∗ 0.060∗∗ 0.175∗∗∗ 0.151∗∗∗
[0.018] [0.026] [0.021] [0.029]
Mother*Parent gender index 0.096∗∗∗ 0.047[0.035] [0.040]
Mother 0.028 0.010[0.034] [0.040]
DGG & school FEs Yes Yes Yes YesExtended HH controls Yes Yes Yes YesMothers have same effect on girlsand boys
0.350
R-squared 0.192 0.195 0.228 0.229Observations 3,044 3,044 2,439 2,439
Notes. Asterisks denote significance: * p < .10, ** p < .05, *** p < .01. Standard errors are clustered at the school level. DGG stands for District*Grade*Gender fixed effects.
38
Appendix Table 3: Result on parental gender attitudes and child gender attitudes
Using binaries Using Likert scales
Student genderPCA
Student genderPCA
Student genderPCA
Student genderPCA
Student genderPCA
Student genderPCA
(1) (2) (3) (4) (5) (6)
Parent gender PCA 0.154∗∗∗ 0.152∗∗∗ 0.149∗∗∗ 0.150∗∗∗
[0.015] [0.015] [0.015] [0.015]
Parent gender PCA (using Likert scales) 0.145∗∗∗ 0.144∗∗∗
[0.014] [0.014]
Classmates’ avg gender PCA 0.079∗∗∗
[0.028]
Classmates’ avg gender PCA (using Likert scales) 0.054∗∗
[0.027]
Father is illiterate -0.059 -0.049 -0.046 -0.050 -0.041 -0.041[0.044] [0.045] [0.044] [0.045] [0.045] [0.045]
Father is literate or finished primary school -0.040 -0.033 -0.040 -0.033 -0.012 -0.012[0.034] [0.034] [0.034] [0.034] [0.036] [0.036]
Father finished middle school (Class 8) 0.013 0.018 0.014 0.018 0.005 0.006[0.035] [0.035] [0.034] [0.034] [0.035] [0.035]
Father works part-time -0.007 -0.008 0.035 -0.006 0.023 0.024[0.063] [0.063] [0.065] [0.063] [0.061] [0.061]
Father works full-time -0.016 -0.020 -0.017 -0.018 0.012 0.014[0.047] [0.047] [0.047] [0.047] [0.046] [0.046]
Mother is illiterate -0.165∗∗∗ -0.148∗∗∗ -0.129∗∗∗ -0.146∗∗∗ -0.166∗∗∗ -0.165∗∗∗
[0.044] [0.044] [0.044] [0.044] [0.042] [0.042]
Mother is literate or finished primary school -0.153∗∗∗ -0.141∗∗∗ -0.128∗∗∗ -0.138∗∗∗ -0.156∗∗∗ -0.154∗∗∗
[0.044] [0.045] [0.045] [0.045] [0.041] [0.041]
Mother finished middle school (Class 8) -0.076 -0.071 -0.059 -0.069 -0.064 -0.063[0.049] [0.049] [0.049] [0.049] [0.046] [0.046]
Mother works part-time -0.149∗∗∗
[0.045]
Mother works full-time 0.094∗∗∗
[0.036]
Scheduled caste -0.091∗∗ -0.091∗∗ -0.088∗∗ -0.090∗∗ -0.061 -0.060[0.037] [0.037] [0.038] [0.037] [0.038] [0.038]
Scheduled tribe -0.179 -0.184 -0.180 -0.185 -0.130 -0.130[0.142] [0.142] [0.140] [0.141] [0.146] [0.145]
Number of household members -0.009[0.008]
Number of female siblings 0.009[0.014]
Number of male siblings -0.043∗∗
[0.021]
Mean of outcome -0.000 -0.000 -0.000 -0.000 0.000 0.000District-grade-gender & school FEs Yes Yes Yes Yes Yes Yes
Household controls Basic Extended Extended +
endogenous Extended Extended Extended
R-squared 0.265 0.267 0.273 0.269 0.267 0.267Observations 5,483 5,483 5,483 5,483 5,483 5,483Cluster 314 314 314 314 314 314
Notes. Asterisks denote significance: * p < .10, ** p < .05, *** p < .01. Standard errors are clustered at the school level. “Basic controls” include: (student-reported) house ispukka, house has electricity, house has flush toilet, house has non-flush toilet, family owns the house, father is illiterate, father is literate or finished primary school, father finishedmiddle school (Class 8), father works part-time, father works full-time, mother is illiterate, mother is literate or finished primary school, mother finished middle school (Class 8),(parent-reported) Scheduled Caste, Scheduled Tribe. “Extended controls” include: (parent-reported) HH has radio, HH has TV, HH gets newspaper daily and HH owns waterpump, (student-reported) HH gets newspaper daily, HH has tap water as well as “basic controls”. “Extended + endogenous controls” include: (student-reported) mother workspart-time, mother works full-time, number of HH members, number of sisters, and number of brothers as well as “basic controls” and “extended controls”. Classmates’ avg genderpca is the average Gender index of the students of the same gender and age as the respondent in his or her school, and is calculated excluding the respondent’s own Gender pca.
Appendix Table 4: Results by parent and child gender
Girls Boys
Studentgender PCA
Studentgender PCA
Studentgender PCA
Studentgender PCA
(1) (2) (3) (4)
Parent gender PCA 0.110∗∗∗ 0.053∗∗ 0.192∗∗∗ 0.170∗∗∗
[0.018] [0.027] [0.020] [0.028]
Mother*Parent gender PCA 0.101∗∗∗ 0.044[0.035] [0.038]
Mother 0.033 0.021[0.034] [0.038]
DGG & school FEs Yes Yes Yes YesExtended HH controls Yes Yes Yes YesMothers have same effect on girlsand boys
0.266
R-squared 0.203 0.206 0.249 0.249Observations 3,044 3,044 2,439 2,439
Notes. Asterisks denote significance: * p < .10, ** p < .05, *** p < .01. Standard errors are clustered at the school level. DGG stands for District*Grade*Gender fixed effects.
40
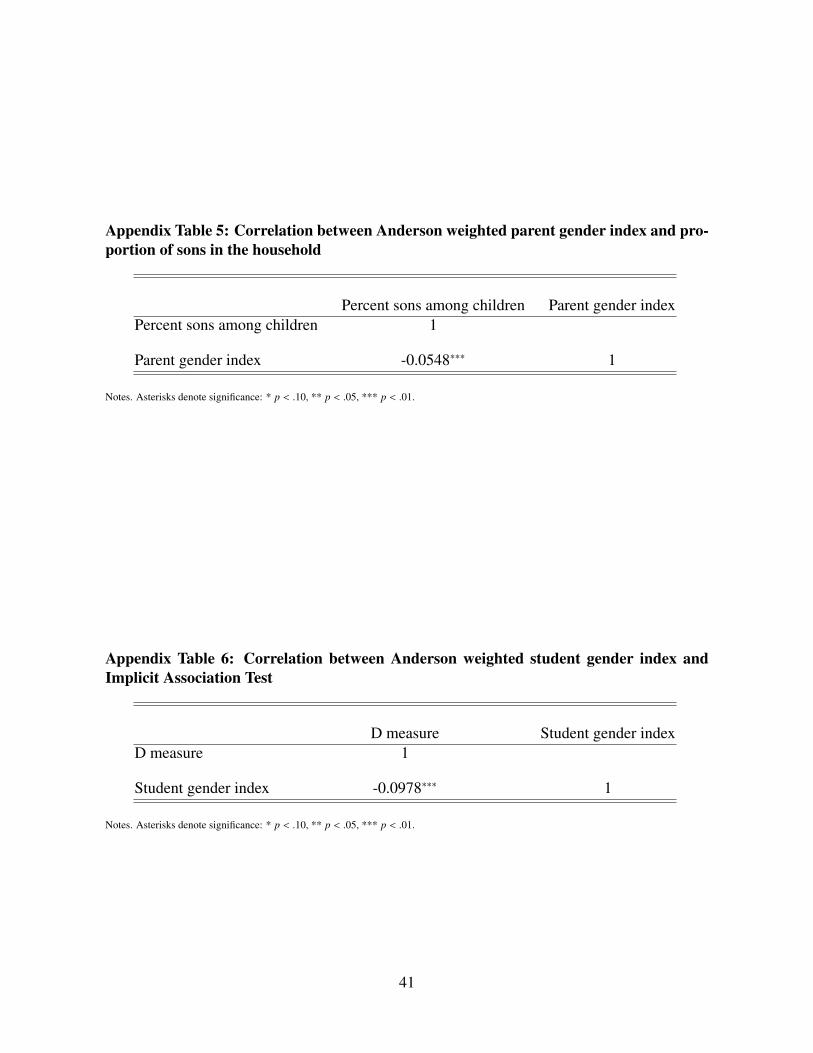
Appendix Table 5: Correlation between Anderson weighted parent gender index and pro-portion of sons in the household
Percent sons among children Parent gender indexPercent sons among children 1
Parent gender index -0.0548∗∗∗ 1
Notes. Asterisks denote significance: * p < .10, ** p < .05, *** p < .01.
Appendix Table 6: Correlation between Anderson weighted student gender index andImplicit Association Test
D measure Student gender indexD measure 1
Student gender index -0.0978∗∗∗ 1
Notes. Asterisks denote significance: * p < .10, ** p < .05, *** p < .01.
41