Embed Size (px)
Citation preview
Diagnostic Microbiology and Infectious Disease 75 (2013) 68–72
Contents lists available at SciVerse ScienceDirect
Diagnostic Microbiology and Infectious Disease
j ourna l homepage: www.e lsev ie r .com/ locate /d iagmicrob io
Mycobacteriology
Interferon gamma mRNA quantitative real-time polymerase chain reaction for thediagnosis of latent tuberculosis: a novel interferon gamma release assay☆
Sunghyun Kim a,1, Young Keun Kim b,1, Hyejon Lee c, Jang-Eun Cho c,d, Hyo Youl Kim b, Young Uh e,Young Mi Kim c, Hyunjung Kim c, Sang-Nae Cho c, Bo-Young Jeon a, Hyeyoung Lee a,⁎a Department of Biomedical Laboratory Science, College of Health Sciences, Yonsei University, Wonju, South Koreab Department of Internal Medicine, Yonsei University Wonju College of Medicine, Wonju, South Koreac Department of Microbiology, College of Medicine, Yonsei University, Seoul, South Koread Department of Biomedical Laboratory Science, Daegu Health College, Daegu, South Koreae Department of Laboratory Medicine, Yonsei University Wonju College of Medicine, Wonju, South Korea
☆ This study was supported by the Korea Science(KOSEF) grant funded by the Korean government (MES⁎ Corresponding author. Tel.: +82-33-760-2740; fax:
E-mail address: [email protected] (H. Lee).1 These authors contributed equally to this work.
0732-8893/$ – see front matter © 2013 Elsevier Inc. Alhttp://dx.doi.org/10.1016/j.diagmicrobio.2012.09.015
a b s t r a c t
a r t i c l e i n f oArticle history:Received 17 May 2012Received in revised form 13 September 2012Accepted 21 September 2012Available online 24 October 2012
Keywords:TuberculosisQFT-ITIFN-γ mRNA Real-time-PCRIFN-γ ELISA
The interferon gamma (IFN-γ) release assay (IGRA) is widely used as a diagnostic method for latenttuberculosis infection (LTBI). The QuantiFERON-TB Gold and QuantiFERON-TB Gold In-tube (QFT-IT) testsmeasure plasma IFN-γ levels using enzyme-linked immunosorbent assay (ELISA), and T-SPOT.TB countsIFN-γ–producing cells using enzyme-linked immunosorbent spot assay. IFN-γ mRNA was evaluated as anindicator of IGRA in comparison with QFT-IT IFN-γ ELISA in 46 subjects with active TB and in 73 at low risk forTB. Significant IFN-γ mRNA expression was detected from 30 min and peaked 4 h after stimulation with MTBantigens or mitogen. This was defined as the optimal time point for IFN-γ mRNA real-time polymerase chainreaction (PCR). The sensitivities of IFN-γ mRNA real-time PCR and IFN-γ ELISA were 84.8% (39/46) and 89.1%(41/46), respectively (no significant difference). Although the specificities of IFN-γ ELISA was 4.1% higherthan that of IFN-γ mRNA real-time PCR (60.3% versus 56.2%), the difference was not statistically significant.The overall agreement between IFN-γ mRNA real-time PCR and IFN-γ ELISA was 79.8% (kappa = 0.475).Whilst there was no difference in the performance of IFN-γ mRNA real-time PCR and IFN-γ ELISA, IFN-γmRNA real-time PCR was superior to IFN-γ ELISA in terms of the time required for detection of MTB infection.
and Engineering FoundationT) (no. 2011-0006125).+82-33-760-2561.
l rights reserved.
© 2013 Elsevier Inc. All rights reserved.
1. Introduction
Tuberculosis (TB) remains a major infectious disease, withapproximately 9.3 million new TB cases annually, leading to 1.7million deaths per year. Mycobacterium tuberculosis (MTB), a cause ofTB, infects one-third of the world's population (Lienhardt et al., 2012).The situation has been worsened by combination with humanimmunodeficiency virus infection and the appearance of multidrug-resistant or extended drug–resistant MTB strains (Kumar et al., 2012).
Control of TB depends largely on early detection and treatment ofactive TB cases. Smear microscopy and mycobacterial culture are thecurrently available diagnostic tests for active TB disease (Palomino,2012). Smear microscopy is rapid, but its sensitivity is poor. Culturingthe mycobacterium is the gold standard for TB diagnosis, but it takesseveral weeks to obtain the results. Screening and treatment of high-risk subjects with latent TB infection (LTBI) have been recognized as
an important control measure, especially in low-burden countries(Mazurek et al., 2010).
Until recent years, the tuberculin skin test (TST) has been the goldstandard for the diagnosis of LTBI (Pouchot et al., 1997). However, itshows cross-reactivity with bacille Calmette–Guérin (BCG) and manynontuberculous mycobacteria because the purified protein deriva-tives (PPD), a diagnostic reagent in the TST, share some antigens withBCG and several nontuberculous mycobacteria.
A recently introduced diagnostic method for LTBI is the interferongamma (IFN-γ) release assay (IGRA), which assesses the presence ofMTB infection by detecting the in vitro release of IFN-γ followingstimulation with MTB-specific antigens, such as early secretoryantigen target 6 (ESAT-6) and culture filtrate protein 10, frompreviously sensitized T cells (Shah et al., 2012). Three in vitro IGRAsare now commercially licensed and are globally available: Quanti-FERON-TB Gold (QFT-G) and QuantiFERON-TB Gold In-tube (QFT-IT)(Cellestis, Carnegie, Victoria, Australia), and the T-SPOT.TB test(T-SPOT, Oxford Immunotec, Oxford, UK). All have higher specificitiesand sensitivities than conventional TST (Chee et al., 2008). These IGRSsare similar in terms of the antigens used (ESAT-6 and CFP-10 for QFT-Gand T-SPOT; ESAT-6, CFP-10, and TB7.7 for QFT-IT) and incubationtime (overnight or 16–24 h). Themain differences between these tests
69S. Kim et al. / Diagnostic Microbiology and Infectious Disease 75 (2013) 68–72
lie in the techniques used for IFN-γ detection and the specimens used.QFT-G andQFT-IT use enzyme-linked immunosorbent assay (ELISA) todetect IFN-γ produced by immune cells in whole blood afterstimulation with MTB antigens (Detjen et al., 2007). In contrast,T-SPOT detect IFN-γ–producing cells among the mononuclear cellsthat respond to MTB antigens using enzyme-linked immunosorbentspot (ELISPOT) assay (Turtle et al., 2012). Of these assays, QFT-G andQFT-IT are widely used because sample preparation is convenient andELISA is more commonly used. Cytokine mRNA expression has alsobeenmeasured and correlateswell with cytokine protein level (Bibovaet al., 2012; Turtle et al., 2012). Moreover, mRNA expression can bemeasured at early time points, before synthesis of the protein hasbegun. To date, quantitation of IFN-γ mRNA expression has not beenused for the diagnosis of MTB infection. In the past few decades, withthe advent of new technologies in molecular biology, new molecularmethods have been introduced, such as polymerase chain reaction(PCR) and real-time PCR. Real-time PCR, in particular, has beenwidelyused to detect bacteria, viruses, toxins, and cytokines due to itsexcellent sensitivity and ability to provide quantitative data (Kvachet al., 2010; Uyttendaele et al., 2003).
In the present study, we applied IFN-γ mRNA quantitative real-time PCR as a novel IGRA and evaluated its usefulness for LTBI incomparison with the commercially available QTF-IT IFN-γ ELISA test.
2. Materials and methods
2.1. Study participants
From May 2010 to February 2011, a prospective clinical study wasundertaken at Yonsei University Wonju Christian Hospital, Wonju,Republic of Korea. All subjects provided written informed consent,and the study was approved by the Institutional Ethics Committee ofYonsei University Wonju College of Medicine (approval no. 2010-21).
Patientswith ahigh clinical suspicionof active TBwere recruited andprovided at least 2 sputum specimens on separate days, which wereanalyzed by acid-fast bacilli (AFB) microscopy using the Ziehl–Neelsenmethod and cultured in Löwenstein–Jensen medium. The presence ofMTB in positive culture samples was further confirmed using theAdvanSure TB/NTMreal-timePCRkit (LGLife Science, Seoul, Korea). Thepresence of active TB was defined by a positive sputum smearmicroscopy result and/or positivity for MTB in sputum culture and/oran abnormality suggestive of TB in chest X-ray. Healthy individualswithnormal chest radiographs, no knownhistory of contactwith TBpatients,and no symptoms of active TB were included as a group at low risk forTB. All participants underwent chest radiography and clinical exami-nation, and were questioned regarding their history of exposure to TBpatients. It was assumed that active TB subjects were infected withM. tuberculosis according toprevious studies (Mori et al., 2004; Lee et al.,2006), and AFB positive and/or culture-confirmed active TB subjectswere used as positive control for the QFT-IT test.
2.2. QuantiFERON-TB Gold In-tube
IGRA was performed using the QFT-IT test (Cellestis), according tothe manufacturer's instructions (Harada et al., 2008; Mori et al.,2004). Blood samples were collected in 3 QFT-IT collection tubes(nil, MTB antigens, and mitogen, which contain lithium heparin). TheQFT-IT collection tubes were processed within 2 h and incubated for24 h at 37 °C. Plasma was collected by centrifugation at 1500 rpm for5 min and stored at −80 °C until it was assayed.
2.3. IFN-γ ELISA assay
IFN-γ concentrations in plasma samples from each subject weredetermined using the QFT-IT ELISA test according to the procedureoutlined in the product insert. The ELISA assay was carried out by
trained staff at Yonsei University Wonju Christian Hospital, Wonju,Korea. The test results were interpreted using the QFT-IT ELISAsoftware (version no. 2.43; Cellestis), and the cut-offs for diagnosis inthe manufacturer's instructions were used. Mitogen stimulationserved as an intrinsic control for blood sample quality. An IFN-γconcentration of ≥0.35 IU/mL (after subtraction of nil control IFN-γ),following exposure to MTB antigens was, considered positive forQFT-IT; a concentration of b0.35 IU/mLwas considered negative. If theIFN-γ response to mitogen was b0.5 IU/mL higher than that for the nilcontrol, or N8 IU/mL higher than that for the nil control, the result wasdeemed indeterminate (Mori et al., 2004).
2.4. Total RNA isolation and reverse transcription
For IFN-γ mRNA real-time PCR, blood collection and incubationwere performed as for QFT-IT, according to the manufacturer'sinstructions (Mannhalter et al., 2000). Total RNA was isolated fromwhole blood using at scheduled time points TRIzol Reagent (Invitro-gen, Carlsbad, CA, USA), according to the manufacturer's instructions.Then, total RNA was incubated with deoxyribonuclease I from theAmplification Grade DNase I kit (Invitrogen) to give a final RNAconcentration of 100 ng/μL. Reverse transcription (RT) into cDNA wasperformed using the High Capacity cDNA Reverse Transcription Kitwith RNase Inhibitor (Applied Biosystems, Foster City, CA, USA) withrandom primers, according to the supplier's instructions. No productswere detected in control samples from which the reverse transcrip-tase was omitted.
2.5. Real-time PCR
Quantitative real-time PCR was performed using the TaqMansystem (Applied Biosystem). The expression levels of IFN-γ andinternal reference glyceraldehyde-3 phospate dehydrogenase(GAPDH) were measured by PCR using TaqMan expression assays.Real-time PCRwas carried outwith TaqManUniversal PCRMasterMixusing 3 μL of cDNA as the template in a total volume of 20 μL. Thethermal cycling conditionswere 10min at 95 °C, followed by 40 cyclesof 10 s at 95 °C and 30 s at 60 °C. All reactions were performed using anABI 7500 FAST Real-time PCR System (Applied Biosystems). Thesequences of the primers (10 pmol/μL) and probes (5 pmol/μL) usedto amplify the desired genes were as follows: IFN-γ: sense 5′-TGA ATGTCC AAC GCA AAG CA-3′, anti-sense 5′-CGA CCT CGA AAC AGC ATCTGA-3′, and probe 6FAM-CGC CAG CAG CTA AAA CAG GGA AGC G-BHQ1; GAPDH: sense 5′- CCA TCT TCC AGG AGC GAG ATC C-3′, anti-sense 5′-ATG GTG GTG AAG ACG CCA GTG-3′, and probe 6FAM-TCCACG ACG TAC TCA GCG CC-BHQ1. The standard curves for the targetand references genes indicated the efficacy of the method (N90%).Relative quantification was performed by the 2-DDCT method;relative expression was calculated as the ratio between the mean CT(threshold cycle) values of the target gene and reference gene(GAPDH) in each stimulated sample in relation to a reference sample(not stimulated) (Kubista et al., 2006).
2.6. Cut-off value determination for the study population
The optimal cut-off level for IFN-γ mRNA real-time PCR wascalculated by receiver operator characteristic (ROC) curve analysisusing data from 46 subjects with active TB and from 73 at low risk forTB. The sensitivity and specificity of the IFN-γ mRNA real-time PCRwere calculated from this cut-off value.
2.7. Statistical analysis
Data were analyzed using GraphPad Prism version 4.00 (GraphPadSoftware, San Diego, CA, USA). Sensitivities and specificities for MTB
90
120
150
Mitogenen r
atio
(R
)
A
2025
3030
60 MTB antigens
RN
A e
xpre
ssio
n
15
mR
70 S. Kim et al. / Diagnostic Microbiology and Infectious Disease 75 (2013) 68–72
infection, together with 95% confidence intervals (CIs), werecalculated as proportions of positive and negative cases amongpatients and control subjects, respectively. The values of theseparameters were compared using the z test. Agreement betweenthe 2 test modalities was testedwithMcNemar's test and expressed asthe kappa coefficient and overall agreement (proportion of casesgiving the same result in both tests). When comparing the mean ofIFN-γ measurements of both methods, and calculating the Pearson'scorrelation coefficient for them, the original values were logtransformed. Also, nonparametric statistics (Wilcoxon's ranked signtest and Spearman's ranked correlation coefficient) were employed.When testing for differences, a value of P b 0.05 was used as thecriterion for statistical significance.
Non 30 min 1 hr 2 hr 4 hr 6 hr 8 hr 10 hr 24 hr0
5
10
IFN
-γ
B
10
15 Mitogene
MTB antigens
2
5IF
N- γ
(IU
/ml)
1
Incubation time
3. Results
3.1. Baseline characteristics
The 119 screened subjects comprised 46 patients with active TBand 73 at low risk for TB (Table 1). The median age of the enrolledsubjects was 48 years (range 28–86 years) for the active TB patientsand 37 years (range 18–56 years) for those at low risk for TB. Themale-to-female ratios were 1.3:1 and 0.78:1 for the active TB patientsand subjects at low risk for TB, respectively. Of the 46 subjects in theactive TB group, 44 (86.9%) had culture- or AFB smear-confirmed TBand 2 (4.3%) had clinical TB. Of these 46 patients, 36 (78.3%) hadpulmonary TB and 10 (21.7%) had cervical tuberculous lymphade-nopathy. None of the subjects at low risk for TB was reported to haveany systemic disease affecting host immunity. The BCG vaccinationrates were 67.4% and 78.1% in the subjects with active TB and subjectsat low risk for TB, respectively.
Non 30 min 1 hr 2 hr 4 hr 6 hr 8 hr 10 hr 24 hr0
Incubation time
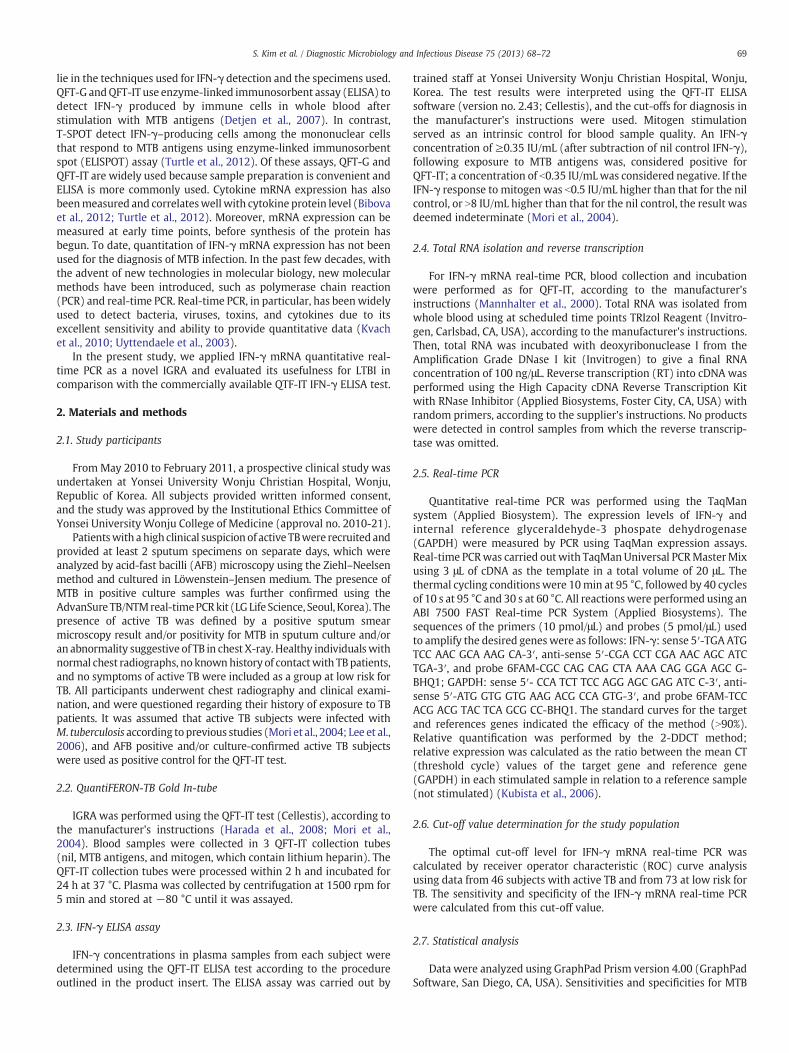
Fig. 1. The IFN-γ mRNA expression levels (A) and IFN-γ protein levels (B) in MTBantigen– and mitogen-stimulated samples of active tuberculosis (TB) patients. Bloodsamples fromactive TB patientswere collected inQFT-IT tubes and stimulatedwithMTBantigens andmitogen, and total RNA and plasmawere isolated at 30min and at 1, 2, 4, 6,8, 10, and 24 h after incubation. The IFN-γ mRNA expression levels and IFN-γ proteinlevels were measured using IFN-γ mRNA real-time PCR and IFN-γ ELISA, respectively.
3.2. Measurement of mRNA expression of IFN-γ cytokine
To measure IFN-γmRNA expression, whole blood samples from 7randomly selected TB patients (as a tentative positive control for MTBinfection) were collected in 3 QFT-IT tubes and total RNA was isolatedat 30 min and at 1, 2, 4, 6, 8, 10, and 24 h after incubation. Plasmasamples were also collected at the same time points to measure IFN-γprotein levels.
In the MTB antigen–stimulated samples, IFN-γ mRNA expressionwas detected from 30 min, increased up to 4 h, and was constantbetween 4 and 6 h (Fig. 1A). However, IFN-γ mRNA expressiondecreased after this time point. In the mitogen-stimulated samples,the expression of IFN-γ was higher than that in the MTB antigen–stimulated samples, but peaked at an earlier time point (2 h) andthen declined.
Plasma IFN-γ protein levels were significantly increased from 8 hin themitogen-stimulated samples and from 10 h in theMTB antigen–stimulated samples (Fig. 1B). There was no significant IFN-γmRNA orprotein in the nil control samples.
Based on the result, we propose that the optimal time point formeasurement of IFN-γ mRNA expression is at 4 h, becauseIFN-γmRNA expression was high in both MTB antigen–stimulatedsamples and in the mitogen-stimulated samples at this time point. In
Table 1Baseline characteristics of subjects.
Active TB Low risk for TB
No. of subjects 46 73Median age in years (range; IQR) 48 (28–86; 37.61) 37 (18–56; 26.48)M/F ratio 26:20 32:41BCG Vaccination 31 (67.4%) 57 (78.1%)
TB = Tuberculosis; IQR = interquartile range; M = male; F = female.
subsequent experiments, IFN-γ mRNA expression was measured at4 h and plasma IFN-γ protein levels was measured at 24 h.
3.3. IFN-γ mRNA expression and its cut-off point in subjects
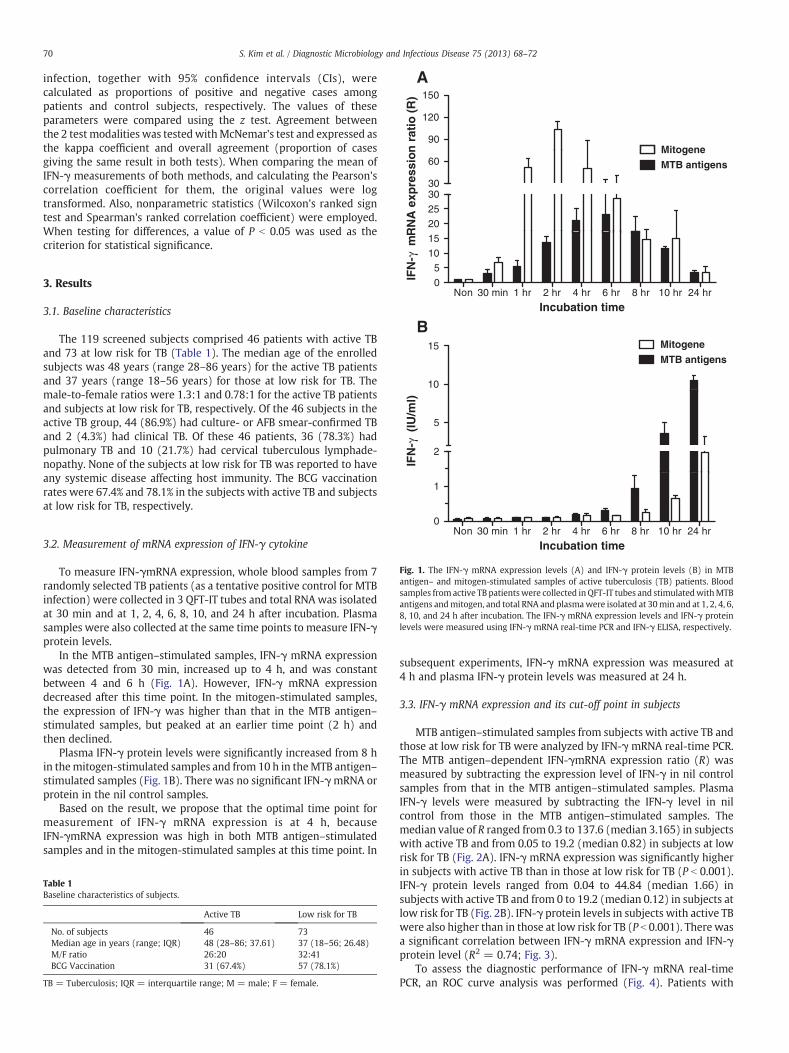
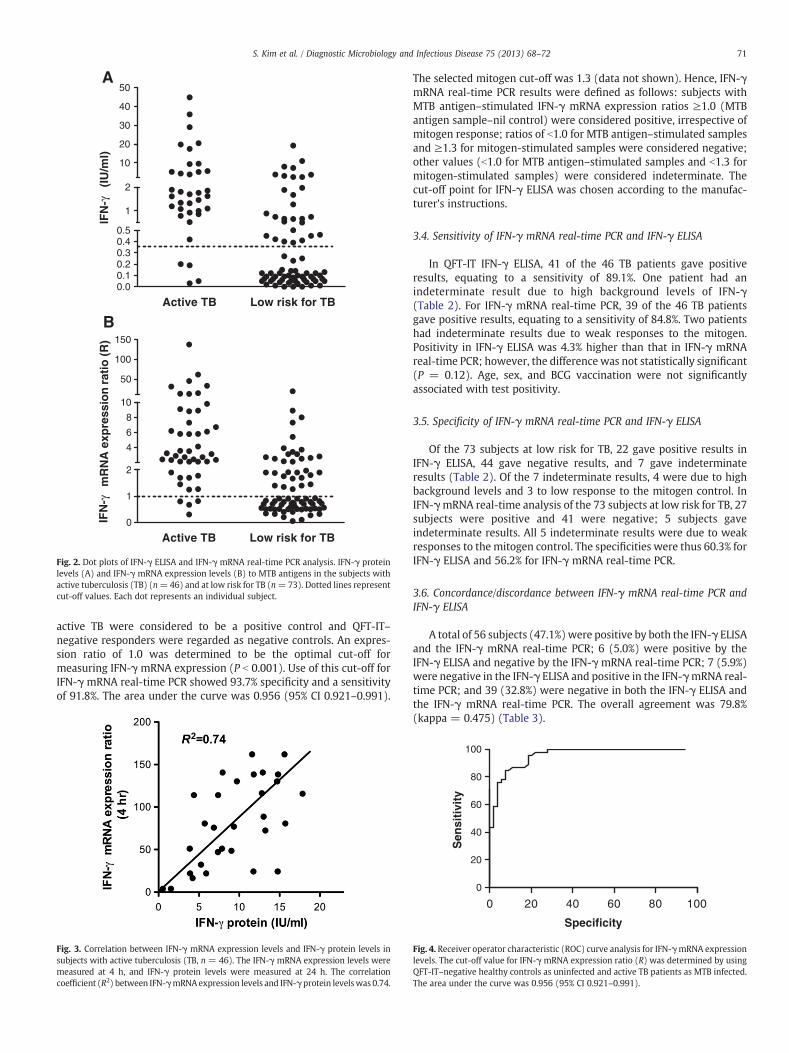
MTB antigen–stimulated samples from subjects with active TB andthose at low risk for TB were analyzed by IFN-γ mRNA real-time PCR.The MTB antigen–dependent IFN-γmRNA expression ratio (R) wasmeasured by subtracting the expression level of IFN-γ in nil controlsamples from that in the MTB antigen–stimulated samples. PlasmaIFN-γ levels were measured by subtracting the IFN-γ level in nilcontrol from those in the MTB antigen–stimulated samples. Themedian value of R ranged from 0.3 to 137.6 (median 3.165) in subjectswith active TB and from 0.05 to 19.2 (median 0.82) in subjects at lowrisk for TB (Fig. 2A). IFN-γ mRNA expression was significantly higherin subjects with active TB than in those at low risk for TB (P b 0.001).IFN-γ protein levels ranged from 0.04 to 44.84 (median 1.66) insubjects with active TB and from 0 to 19.2 (median 0.12) in subjects atlow risk for TB (Fig. 2B). IFN-γ protein levels in subjects with active TBwere also higher than in those at low risk for TB (P b 0.001). There wasa significant correlation between IFN-γ mRNA expression and IFN-γprotein level (R2 = 0.74; Fig. 3).
To assess the diagnostic performance of IFN-γ mRNA real-timePCR, an ROC curve analysis was performed (Fig. 4). Patients with
A
20
30
40
50
1
2
10
IFN
-γ (
IU/m
l)
Active TB Low risk for TB0.00.10.20.30.40.5
50
100
150
rati
o (
R)
B
2
4
6
8
10
Active TB Low risk for TB0
1
2
IFN
-γm
RN
A e
xpre
ssio
n
Fig. 2. Dot plots of IFN-γ ELISA and IFN-γ mRNA real-time PCR analysis. IFN-γ proteinlevels (A) and IFN-γ mRNA expression levels (B) to MTB antigens in the subjects withactive tuberculosis (TB) (n=46) and at low risk for TB (n=73). Dotted lines representcut-off values. Each dot represents an individual subject.
71S. Kim et al. / Diagnostic Microbiology and Infectious Disease 75 (2013) 68–72
active TB were considered to be a positive control and QFT-IT–negative responders were regarded as negative controls. An expres-sion ratio of 1.0 was determined to be the optimal cut-off formeasuring IFN-γ mRNA expression (P b 0.001). Use of this cut-off forIFN-γ mRNA real-time PCR showed 93.7% specificity and a sensitivityof 91.8%. The area under the curve was 0.956 (95% CI 0.921–0.991).
Fig. 3. Correlation between IFN-γ mRNA expression levels and IFN-γ protein levels insubjects with active tuberculosis (TB, n = 46). The IFN-γ mRNA expression levels weremeasured at 4 h, and IFN-γ protein levels were measured at 24 h. The correlationcoefficient (R2) between IFN-γmRNAexpression levels and IFN-γprotein levelswas 0.74.
The selected mitogen cut-off was 1.3 (data not shown). Hence, IFN-γmRNA real-time PCR results were defined as follows: subjects withMTB antigen–stimulated IFN-γ mRNA expression ratios ≥1.0 (MTBantigen sample–nil control) were considered positive, irrespective ofmitogen response; ratios of b1.0 for MTB antigen–stimulated samplesand ≥1.3 for mitogen-stimulated samples were considered negative;other values (b1.0 for MTB antigen–stimulated samples and b1.3 formitogen-stimulated samples) were considered indeterminate. Thecut-off point for IFN-γ ELISA was chosen according to the manufac-turer's instructions.
3.4. Sensitivity of IFN-γ mRNA real-time PCR and IFN-γ ELISA
In QFT-IT IFN-γ ELISA, 41 of the 46 TB patients gave positiveresults, equating to a sensitivity of 89.1%. One patient had anindeterminate result due to high background levels of IFN-γ(Table 2). For IFN-γ mRNA real-time PCR, 39 of the 46 TB patientsgave positive results, equating to a sensitivity of 84.8%. Two patientshad indeterminate results due to weak responses to the mitogen.Positivity in IFN-γ ELISA was 4.3% higher than that in IFN-γ mRNAreal-time PCR; however, the difference was not statistically significant(P = 0.12). Age, sex, and BCG vaccination were not significantlyassociated with test positivity.
3.5. Specificity of IFN-γ mRNA real-time PCR and IFN-γ ELISA
Of the 73 subjects at low risk for TB, 22 gave positive results inIFN-γ ELISA, 44 gave negative results, and 7 gave indeterminateresults (Table 2). Of the 7 indeterminate results, 4 were due to highbackground levels and 3 to low response to the mitogen control. InIFN-γmRNA real-time analysis of the 73 subjects at low risk for TB, 27subjects were positive and 41 were negative; 5 subjects gaveindeterminate results. All 5 indeterminate results were due to weakresponses to the mitogen control. The specificities were thus 60.3% forIFN-γ ELISA and 56.2% for IFN-γ mRNA real-time PCR.
3.6. Concordance/discordance between IFN-γ mRNA real-time PCR andIFN-γ ELISA
A total of 56 subjects (47.1%)were positive by both the IFN-γ ELISAand the IFN-γ mRNA real-time PCR; 6 (5.0%) were positive by theIFN-γ ELISA and negative by the IFN-γ mRNA real-time PCR; 7 (5.9%)were negative in the IFN-γ ELISA and positive in the IFN-γmRNA real-time PCR; and 39 (32.8%) were negative in both the IFN-γ ELISA andthe IFN-γ mRNA real-time PCR. The overall agreement was 79.8%(kappa = 0.475) (Table 3).
80
100
20
40
60
Sen
siti
vity
0 20 40 60 80 100
0
Specificity
Fig. 4. Receiver operator characteristic (ROC) curve analysis for IFN-γmRNA expressionlevels. The cut-off value for IFN-γ mRNA expression ratio (R) was determined by usingQFT-IT–negative healthy controls as uninfected and active TB patients as MTB infected.The area under the curve was 0.956 (95% CI 0.921–0.991).
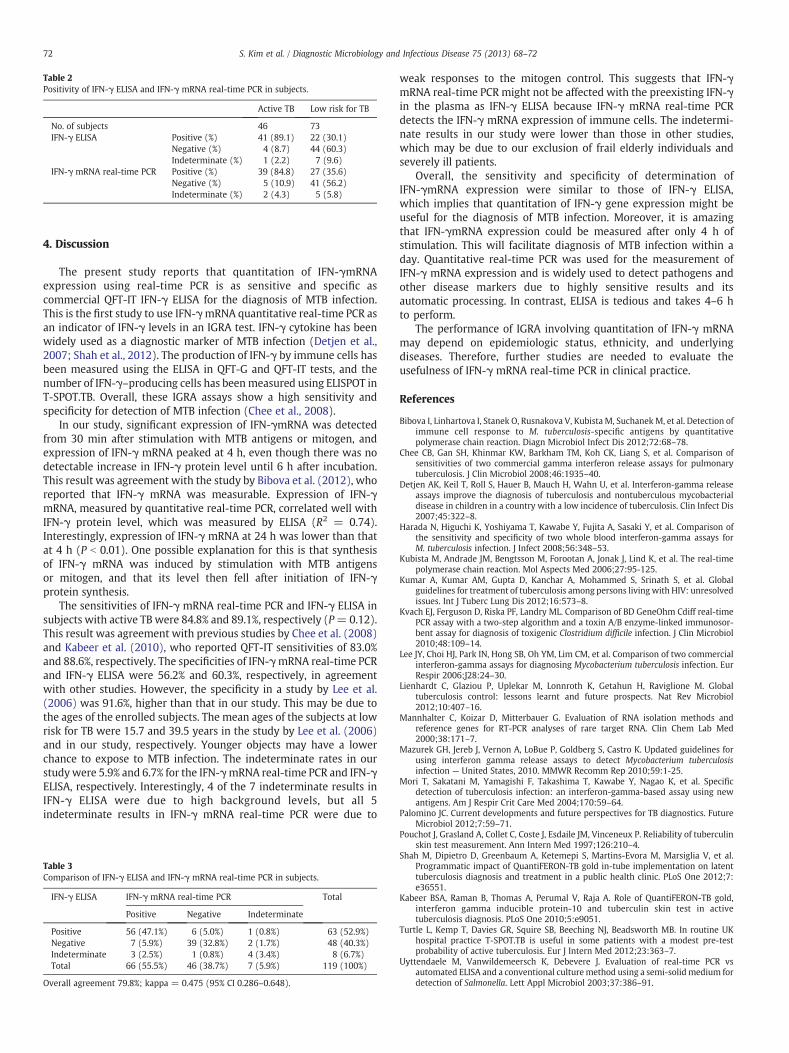
Table 2Positivity of IFN-γ ELISA and IFN-γ mRNA real-time PCR in subjects.
Active TB Low risk for TB
No. of subjects 46 73IFN-γ ELISA Positive (%) 41 (89.1) 22 (30.1)
Negative (%) 4 (8.7) 44 (60.3)Indeterminate (%) 1 (2.2) 7 (9.6)
IFN-γ mRNA real-time PCR Positive (%) 39 (84.8) 27 (35.6)Negative (%) 5 (10.9) 41 (56.2)Indeterminate (%) 2 (4.3) 5 (5.8)
72 S. Kim et al. / Diagnostic Microbiology and Infectious Disease 75 (2013) 68–72
4. Discussion
The present study reports that quantitation of IFN-γmRNAexpression using real-time PCR is as sensitive and specific ascommercial QFT-IT IFN-γ ELISA for the diagnosis of MTB infection.This is the first study to use IFN-γmRNA quantitative real-time PCR asan indicator of IFN-γ levels in an IGRA test. IFN-γ cytokine has beenwidely used as a diagnostic marker of MTB infection (Detjen et al.,2007; Shah et al., 2012). The production of IFN-γ by immune cells hasbeen measured using the ELISA in QFT-G and QFT-IT tests, and thenumber of IFN-γ–producing cells has beenmeasured using ELISPOT inT-SPOT.TB. Overall, these IGRA assays show a high sensitivity andspecificity for detection of MTB infection (Chee et al., 2008).
In our study, significant expression of IFN-γmRNA was detectedfrom 30 min after stimulation with MTB antigens or mitogen, andexpression of IFN-γ mRNA peaked at 4 h, even though there was nodetectable increase in IFN-γ protein level until 6 h after incubation.This result was agreement with the study by Bibova et al. (2012), whoreported that IFN-γ mRNA was measurable. Expression of IFN-γmRNA, measured by quantitative real-time PCR, correlated well withIFN-γ protein level, which was measured by ELISA (R2 = 0.74).Interestingly, expression of IFN-γ mRNA at 24 h was lower than thatat 4 h (P b 0.01). One possible explanation for this is that synthesisof IFN-γ mRNA was induced by stimulation with MTB antigensor mitogen, and that its level then fell after initiation of IFN-γprotein synthesis.
The sensitivities of IFN-γ mRNA real-time PCR and IFN-γ ELISA insubjects with active TB were 84.8% and 89.1%, respectively (P=0.12).This result was agreement with previous studies by Chee et al. (2008)and Kabeer et al. (2010), who reported QFT-IT sensitivities of 83.0%and 88.6%, respectively. The specificities of IFN-γmRNA real-time PCRand IFN-γ ELISA were 56.2% and 60.3%, respectively, in agreementwith other studies. However, the specificity in a study by Lee et al.(2006) was 91.6%, higher than that in our study. This may be due tothe ages of the enrolled subjects. The mean ages of the subjects at lowrisk for TB were 15.7 and 39.5 years in the study by Lee et al. (2006)and in our study, respectively. Younger objects may have a lowerchance to expose to MTB infection. The indeterminate rates in ourstudywere 5.9% and 6.7% for the IFN-γmRNA real-time PCR and IFN-γELISA, respectively. Interestingly, 4 of the 7 indeterminate results inIFN-γ ELISA were due to high background levels, but all 5indeterminate results in IFN-γ mRNA real-time PCR were due to
Table 3Comparison of IFN-γ ELISA and IFN-γ mRNA real-time PCR in subjects.
IFN-γ ELISA IFN-γ mRNA real-time PCR Total
Positive Negative Indeterminate
Positive 56 (47.1%) 6 (5.0%) 1 (0.8%) 63 (52.9%)Negative 7 (5.9%) 39 (32.8%) 2 (1.7%) 48 (40.3%)Indeterminate 3 (2.5%) 1 (0.8%) 4 (3.4%) 8 (6.7%)Total 66 (55.5%) 46 (38.7%) 7 (5.9%) 119 (100%)
Overall agreement 79.8%; kappa = 0.475 (95% CI 0.286–0.648).
weak responses to the mitogen control. This suggests that IFN-γmRNA real-time PCR might not be affected with the preexisting IFN-γin the plasma as IFN-γ ELISA because IFN-γ mRNA real-time PCRdetects the IFN-γ mRNA expression of immune cells. The indetermi-nate results in our study were lower than those in other studies,which may be due to our exclusion of frail elderly individuals andseverely ill patients.
Overall, the sensitivity and specificity of determination ofIFN-γmRNA expression were similar to those of IFN-γ ELISA,which implies that quantitation of IFN-γ gene expression might beuseful for the diagnosis of MTB infection. Moreover, it is amazingthat IFN-γmRNA expression could be measured after only 4 h ofstimulation. This will facilitate diagnosis of MTB infection within aday. Quantitative real-time PCR was used for the measurement ofIFN-γ mRNA expression and is widely used to detect pathogens andother disease markers due to highly sensitive results and itsautomatic processing. In contrast, ELISA is tedious and takes 4–6 hto perform.
The performance of IGRA involving quantitation of IFN-γ mRNAmay depend on epidemiologic status, ethnicity, and underlyingdiseases. Therefore, further studies are needed to evaluate theusefulness of IFN-γ mRNA real-time PCR in clinical practice.
References
Bibova I, Linhartova I, Stanek O, Rusnakova V, Kubista M, SuchanekM, et al. Detection ofimmune cell response to M. tuberculosis-specific antigens by quantitativepolymerase chain reaction. Diagn Microbiol Infect Dis 2012;72:68–78.
Chee CB, Gan SH, Khinmar KW, Barkham TM, Koh CK, Liang S, et al. Comparison ofsensitivities of two commercial gamma interferon release assays for pulmonarytuberculosis. J Clin Microbiol 2008;46:1935–40.
Detjen AK, Keil T, Roll S, Hauer B, Mauch H, Wahn U, et al. Interferon-gamma releaseassays improve the diagnosis of tuberculosis and nontuberculous mycobacterialdisease in children in a country with a low incidence of tuberculosis. Clin Infect Dis2007;45:322–8.
Harada N, Higuchi K, Yoshiyama T, Kawabe Y, Fujita A, Sasaki Y, et al. Comparison ofthe sensitivity and specificity of two whole blood interferon-gamma assays forM. tuberculosis infection. J Infect 2008;56:348–53.
Kubista M, Andrade JM, Bengtsson M, Forootan A, Jonak J, Lind K, et al. The real-timepolymerase chain reaction. Mol Aspects Med 2006;27:95-125.
Kumar A, Kumar AM, Gupta D, Kanchar A, Mohammed S, Srinath S, et al. Globalguidelines for treatment of tuberculosis among persons living with HIV: unresolvedissues. Int J Tuberc Lung Dis 2012;16:573–8.
Kvach EJ, Ferguson D, Riska PF, Landry ML. Comparison of BD GeneOhm Cdiff real-timePCR assay with a two-step algorithm and a toxin A/B enzyme-linked immunosor-bent assay for diagnosis of toxigenic Clostridium difficile infection. J Clin Microbiol2010;48:109–14.
Lee JY, Choi HJ, Park IN, Hong SB, Oh YM, Lim CM, et al. Comparison of two commercialinterferon-gamma assays for diagnosing Mycobacterium tuberculosis infection. EurRespir 2006;J28:24–30.
Lienhardt C, Glaziou P, Uplekar M, Lonnroth K, Getahun H, Raviglione M. Globaltuberculosis control: lessons learnt and future prospects. Nat Rev Microbiol2012;10:407–16.
Mannhalter C, Koizar D, Mitterbauer G. Evaluation of RNA isolation methods andreference genes for RT-PCR analyses of rare target RNA. Clin Chem Lab Med2000;38:171–7.
Mazurek GH, Jereb J, Vernon A, LoBue P, Goldberg S, Castro K. Updated guidelines forusing interferon gamma release assays to detect Mycobacterium tuberculosisinfection — United States, 2010. MMWR Recomm Rep 2010;59:1-25.
Mori T, Sakatani M, Yamagishi F, Takashima T, Kawabe Y, Nagao K, et al. Specificdetection of tuberculosis infection: an interferon-gamma-based assay using newantigens. Am J Respir Crit Care Med 2004;170:59–64.
Palomino JC. Current developments and future perspectives for TB diagnostics. FutureMicrobiol 2012;7:59–71.
Pouchot J, Grasland A, Collet C, Coste J, Esdaile JM, Vinceneux P. Reliability of tuberculinskin test measurement. Ann Intern Med 1997;126:210–4.
Shah M, Dipietro D, Greenbaum A, Ketemepi S, Martins-Evora M, Marsiglia V, et al.Programmatic impact of QuantiFERON-TB gold in-tube implementation on latenttuberculosis diagnosis and treatment in a public health clinic. PLoS One 2012;7:e36551.
Kabeer BSA, Raman B, Thomas A, Perumal V, Raja A. Role of QuantiFERON-TB gold,interferon gamma inducible protein-10 and tuberculin skin test in activetuberculosis diagnosis. PLoS One 2010;5:e9051.
Turtle L, Kemp T, Davies GR, Squire SB, Beeching NJ, Beadsworth MB. In routine UKhospital practice T-SPOT.TB is useful in some patients with a modest pre-testprobability of active tuberculosis. Eur J Intern Med 2012;23:363–7.
Uyttendaele M, Vanwildemeersch K, Debevere J. Evaluation of real-time PCR vsautomated ELISA and a conventional culturemethod using a semi-solid medium fordetection of Salmonella. Lett Appl Microbiol 2003;37:386–91.