Embed Size (px)
Citation preview
Division of Pharmaceutical Technology
Faculty of Pharmacy
University of Helsinki
Finland
Interfacial Phenomena in Pharmaceutical Low Moisture
Content Powder Processing
by
Henrik Ehlers
ACADEMIC DISSERTATION
To be presented, with the permission of the Faculty of Pharmacy of the University of
Helsinki, for public examination in Auditorium 1041 at Biocenter 2 (Viikinkaari 5 E) on
October 28th 2011, at 12.00 noon.
Helsinki 2011

Supervisors Professor Jouko Yliruusi
Division of Pharmaceutical Technology
Faculty of Pharmacy
University of Helsinki
Finland
Professor Jyrki Heinämäki
Department of Pharmacy
Faculty of Medicine
University of Tartu
Estonia
Reviewers Docent Pasi Merkku
Paroalho Community Pharmacy
Rauma
Finland
Dr. Karin Kogermann
Department of Pharmacy
Faculty of Medicine
University of Tartu
Estonia
Opponent Docent Eetu Räsänen
Hospital Pharmacy
South Karelia Health Care District
Finland
© Henrik Ehlers 2011
ISBN 978-952-10-7257-4 (Paperback)
ISBN 978-952-10-7258-1 (PDF)
ISSN 1799-7372
Helsinki University Printing House
Helsinki 2011
i
Abstract
Ehlers H., 2011. Interfacial Phenomena in Pharmaceutical Low Moisture Content
Powder Processing.
Dissertationes Biocentri Viikki Universitatis Helsingiensis, 21/2011, pp. 52
ISBN 978-952-10-7257-4 (Paperback), ISBN 978-952-10-7258-1 (PDF, http://ethesis.helsinki.fi),
ISSN 1799-7372
Powders are essential materials in the pharmaceutical industry, being involved in
majority of all drug manufacturing. Powder flow and particle size are central particle
properties addressed by means of particle engineering. The aim of the thesis was to gain
knowledge on powder processing with restricted liquid addition, with a primary focus on
particle coating and early granule growth. Furthermore, characterisation of this kind of
processes was performed.
A thin coating layer of hydroxypropyl methylcellulose was applied on individual
particles of ibuprofen in a fluidised bed top-spray process. The polymeric coating improved
the flow properties of the powder. The improvement was strongly related to relative humidity,
which can be seen as an indicator of a change in surface hydrophilicity caused by the coating.
The ibuprofen used in the present study had a d50 of 40 µm and thus belongs to the Geldart
group C powders, which can be considered as challenging materials in top-spray coating
processes.
Ibuprofen was similarly coated using a novel ultrasound-assisted coating method. The
results were in line with those obtained from powders coated in the fluidised bed process
mentioned above. It was found that the ultrasound-assisted method was capable of coating
single particles with a simple and robust setup.
Granule growth in a fluidised bed process was inhibited by feeding the liquid in pulses.
The results showed that the length of the pulsing cycles is of importance, and can be used to
adjust granule growth. Moreover, pulsed liquid feed was found to be of greater significance to
granule growth in high inlet air relative humidity. Liquid feed pulsing can thus be used as a
tool in particle size targeting in fluidised bed processes and in compensating for changes in
relative humidity of the inlet air.
The nozzle function of a two-fluid external mixing pneumatic nozzle, typical for small
scale pharmaceutical fluidised bed processes, was studied in situ in an ongoing fluidised bed
process with particle tracking velocimetry. It was found that the liquid droplets undergo
coalescence as they proceed away from the nozzle head. The coalescence was expected to
increase droplet speed, which was confirmed in the study. The spray turbulence was studied,
and the results showed turbulence caused by the event of atomisation and by the oppositely
directed fluidising air. It was concluded that particle tracking velocimetry is a suitable tool for
in situ spray characterisation.
The light transmission through dense particulate systems was found to carry
information on particle size and packing density as expected based on the theory of light
scattering by solids. It was possible to differentiate binary blends consisting of components
with differences in optical properties. Light transmission showed potential as a rapid, simple
and inexpensive tool in characterisation of particulate systems giving information on changes
in particle systems, which could be utilised in basic process diagnostics.
ii
Acknowledgements
This study was performed at the Division of Pharmaceutical Technology, Faculty of
Pharmacy, University of Helsinki during the years 2007-2011. I wish to express my gratitude
to all people involved in this project.
I express my deep and sincere gratitude to my supervisor professor Jouko Yliruusi for
his invaluable advice, guidance and support, and for believing in me throughout the course of
this work. I am deeply grateful to my other supervisor professor Jyrki Heinämäki for his
generous contribution to this work, including scientific insights, never-ending patience and
optimism as well as encouragement. Both of my supervisors have widened my outlook on
science, which I am very grateful for.
I am deeply grateful to all co-authors. Dr. Osmo Antikainen is acknowledged for
sharing his expertise and experience in data-analysis, experimental design and powder
technology. I also wish to express my sincere gratitude to Heikki Räikkönen for his
enthusiasm, encouragement and technical assistance, and for his commitment to improve the
quality of this work. Dr. Sari Airaksinen, Dr. Natalja Genina, Dr. Jussi Larjo, Juha Hatara,
Anchang Liu, professor Hongxiang Lou and professor Peep Veski are gratefully
acknowledged for their scientific contribution to this work. Professor Anne Juppo, Industrial
Pharmacy, Faculty of Pharmacy, University of Helsinki is gratefully acknowledged for
introducing me into the discipline on industrial pharmacy, for giving constructive comments
on this thesis and for her contagious positive attitude.
The Finnish Pharmaceutical Society, The Helsinki University Pharmacy and The
Finnish Cultural Foundation are gratefully acknowledged for financial support of this work.
I wish to extend my gratitude to the reviewers of this thesis, Docent Pasi Merkku and
Dr. Karin Kogermann for the prompt review process and the constructive comments to
improve the manuscript.
I express my sincere gratitude to all of my colleagues at the Division of Pharmaceutical
Technology at the University of Helsinki for their friendship, for contributing to a welcoming,
friendly and dynamic working atmosphere and for many fun-filled moments both within and
outside office hours. I am grateful to my colleagues at Åbo Akademi University for making me
feel welcome and for providing a friendly and joyous working atmosphere.
I am most deeply grateful to my family and all of my friends for the support and
encouragement during this project. I wish to thank my dear grandmothers Gudrun Ehlers
and Helvi Lappalainen for understanding and support. I wish to extend my sincere thanks to
my dear sisters Meeri and Laura Ehlers with spouses for all love and support, and for
reminding me of all the non-work-related aspects of life. I wish to express my most heartfelt
gratitude to my parents Sinikka and Mikael Ehlers for their loving support, patience and
encouraging upbringing.
My warmest thanks go to my beloved wife Pauliina, for her never-ending love, support,
words of encouragement and for sharing all the moments of joy and despair during this
project. This work is yours as much as it is mine.
Yours sincerely,
Henrik Ehlers

iii
To Pauliina
iv
Table of contents
Abstract ....................................................................................................... i
Acknowledgements .................................................................................... ii
Table of contents ....................................................................................... iv
List of original publications ....................................................................... vi
Abbreviations and symbols ...................................................................... vii
1 Introduction ........................................................................................ 1
2 Literature overview ............................................................................ 2
2.1 Particle systems .................................................................................................... 2 2.1.1 Definitions ................................................................................................... 2 2.1.2 Particle size and morphology ...................................................................... 2 2.1.3 Particle-particle interactions ....................................................................... 3 2.1.4 Powder flow ................................................................................................. 4
2.2 Interfacial phenomena ......................................................................................... 5 2.2.1 Van der Waals interaction ........................................................................... 5 2.2.2 Hydrogen bonding ....................................................................................... 5 2.2.3 Hydrophobicity and hydrophilicity ............................................................. 6 2.2.4 Surface free energy and surface tension ...................................................... 6 2.2.5 Contact angle, wetting and spreading ..........................................................7 2.2.6 Vapour sorption ........................................................................................... 8 2.2.7 Capillary condensation ................................................................................ 8
2.3 The heterogeneous nature of pharmaceutical surfaces ....................................... 9
2.4 Particle systems modification .............................................................................. 9 2.4.1 Particle surface engineering ........................................................................ 9 2.4.2 Wet coating .................................................................................................10 2.4.3 Dry coating .................................................................................................10 2.4.4 Particle size enlargement............................................................................ 11 2.4.5 Particle size reduction ................................................................................ 11
2.5 Fluidised bed powder processing ........................................................................ 11 2.5.1 Principle of action ....................................................................................... 11 2.5.2 Fluidisation ................................................................................................. 12 2.5.3 Spraying ...................................................................................................... 13 2.5.4 Drying ......................................................................................................... 13
2.6 Moisture in fluidised bed processes .................................................................... 14 2.6.1 Atomisation and droplet formation ........................................................... 14 2.6.2 Spray characterisation ................................................................................ 15 2.6.3 Droplet-particle impact and adhesion........................................................ 15 2.6.4 Liquid spreading and absorption ............................................................... 16 2.6.5 Coating and nucleation ............................................................................... 17 2.6.6 Granule growth ........................................................................................... 17 2.6.7 Interparticle forces in fluidisation .............................................................. 18
v
3 Aims of the study ............................................................................... 19
4 Experimental .................................................................................... 20
4.1 Materials (I-V) .................................................................................................... 20
4.2 Methods .............................................................................................................. 20 4.2.1 Fluid bed powder processor (I,III,IV) ....................................................... 20 4.2.2 Fluid bed coating (I) .................................................................................. 20 4.2.3 Fluid bed granulation (III) ......................................................................... 21 4.2.4 In situ fluid bed spray characterisation (IV) .............................................. 21 4.2.5 Ultrasound assisted powder coating (II) .................................................... 21 4.2.6 Measurement of flow properties (I,II) ....................................................... 21 4.2.7 Moisture content analysis (I-III) ............................................................... 22 4.2.8 Microscopy and image analysis (I) ............................................................ 22 4.2.9 Photometric particle size analysis (V) ....................................................... 22 4.2.10 Spatial Filtering Velocimetry (II,III) ......................................................... 22 4.2.11 Particle tracking velocimetry and droplet size analysis (IV) ..................... 23 4.2.12 X-ray powder diffractometry (I,II) ............................................................ 23 4.2.13 Scanning electron microscopy (I-III) ........................................................ 23 4.2.14 Atomic force microscopy (II) ..................................................................... 23 4.2.15 Light transmission analysis (V) ................................................................. 23 4.2.16 Experimental design (I,III,IV) .................................................................. 25 4.2.17 Data analysis and modelling (I,III,IV) ...................................................... 26
5 Results and discussion ....................................................................... 27
5.1 General remarks ................................................................................................. 27
5.2 Fluid bed powder thin-coating (I) ...................................................................... 28 5.2.1 General remarks ........................................................................................ 28 5.2.2 Flow properties .......................................................................................... 28 5.2.3 Particle morphology and solid state properties ........................................ 29 5.2.4 Effect of relative humidity on flow properties ........................................... 30
5.3 Ultrasound assisted powder thin-coating (II) .................................................... 31 5.3.1 Flow properties ........................................................................................... 31 5.3.2 Particle morphology and solid state properties ........................................ 32
5.4 Pulsed liquid feed fluidised bed processing (III) ............................................... 33 5.4.1 Data-analysis and modelling ..................................................................... 33 5.4.2 Effect of atomisation pressure on granule size ......................................... 34 5.4.3 Effect duty cycle on granule size ............................................................... 34 5.4.4 Effect of inlet air relative humidity on granule size .................................. 34
5.5 In situ spray characterisation (IV) ..................................................................... 35 5.5.1 Modelling ................................................................................................... 35 5.5.2 Sum of mass and droplet count ................................................................. 35 5.5.3 Droplet size ................................................................................................ 36 5.5.4 Droplet speed............................................................................................. 38 5.5.5 Turbulence ................................................................................................. 39
5.6 Light transmission (V) ....................................................................................... 40 5.6.1 Resolution and the effect of powder bed packing ..................................... 40 5.6.2 Correlation between particle size, composition and light transmission .... 41 5.6.3 Advantages of light transmission analysis ................................................ 43 5.6.4 Limitations of light transmission analysis ................................................ 43
6 Conclusions ...................................................................................... 44
References ............................................................................................... 45
vi
List of original publications
This thesis is based on the following publications, which are referred to in the text by
their respective roman numerals (I-V).
I Ehlers H.V., Räikkönen H., Antikainen O., Heinämäki J., Yliruusi J., 2009.
Improving flow properties of ibuprofen by fluidised bed particle thin-coating. Int. J.
Pharm. 368: 165-170.
II Genina N., Räikkönen H., Ehlers H., Heinämäki J., Veski P., Yliruusi J., 2010.
Thin-coating as an alternative approach to improve flow properties of ibuprofen
powder. Int. J. Pharm. 387: 65-70.
III Ehlers H., Liu A., Räikkönen H., Hatara J., Antikainen O., Airaksinen S.,
Heinämäki J., Lou H., Yliruusi J., 2009. Granule size control and targeting in
pulsed spray fluid bed granulation. Int. J. Pharm. 377: 9-15.
IV Ehlers H., Larjo J., Antikainen O., Räikkönen H., Heinämäki J., Yliruusi J., 2010.
In situ droplet size and speed determination in a fluid bed granulator. Int. J. Pharm.
391: 148-154.
V Ehlers H., Heinämäki J., Yliruusi J., 2011. Particle size and packing
characterisation by diffuse light permeation. Particuology, Submitted.
Reprinted with the kind permission of Elsevier B.V.
vii
Abbreviations and symbols
AFM Atomic force microscopy
DC Duty cycle
DLS Diode laser stroboscopy
HPMC Hydroxypropyl methylcellulose
MCC Microcrystalline cellulose
NIR Near-infrared spectroscopy
PTV Particle tracking velocimetry
R2 Goodness of fit
RH Relative humidity
RH0 Critical RH for deliquescence
Q2 Predictive power
SEM Scanning electron microscopy
SFV Spatial filtering velocimetry
A Surface area
a Droplet trajectory angle
aw Water activity
de Equivalence sphere diameter
d Diameter
g Gravitational acceleration
ΔH Latent heat of evaporation
hp Planck constant
ht Heat transfer coefficient
k Bolzmann constant
M Circularity
P Perimeter
Δp/H Pressure drop over a distance in the chamber
r Distance between interacting atoms or molecules
S Spreading coefficient
T Temperature
u Electric dipole moment
v Droplet velocity
va Electric adsorption frequency
dW/dt Change in mass of evaporated water over time
WA Work of adhesion
WC Work of cohesion
w(r) Interaction energy
x Ratio of true area and the projection area of a solid surface
α Electric polarizability
γ Interfacial energy or tension
ε0 Dielectric permittivity of vacuum
εmf Void fraction of the bed
θ Contact angle
λ Spreading coefficient
ρg Density of gas
ρs Density of solids
φS Solid fraction in contact with a droplet
Introduction
1
1 Introduction
In manufacturing pharmaceutical dosage forms the concepts Quality by Design and
Process Understanding have recently gained attention (Yu 2008). Both of these embrace the
idea of being able to produce high quality solid dosage forms by thoroughly knowing the
demands of processes, material properties and the interconnection between these, replacing
earlier empirical and heuristic approaches (Muzzio et al. 2002). The design of solid dosage
forms and their manufacturing processes are initiated from the particle level (Muzzio et al.
2002; Hamad et al. 2011). All of the following steps concern modifying particles by different
means to form an acceptable final product (Muzzio et al. 2002). To understand the behaviour
of a particle system, such as a powder, further down in the production chain, the basic
physicochemical properties of the particles need to be known and if necessary modified to fit
the requirements of the product or process. Consequently, good particle level engineering is a
prerequisite for efficient production of high quality solid dosage forms.
The traditional approach in manufacturing solid dosage forms is to enlarge the particle
size by granulation prior to tableting, to ensure sufficient flow and tablettability (Bolhuis and
Armstrong 2006; Yu 2008). As the industry currently has a more pronounced focus on cost
efficiency, direct compression has gained popularity subsequently increasing the demand for
powders with good flow and compression properties. Smaller particles have been shown to
give stronger tablets (Sun and Grant 2001), but also experience more pronounced cohesion
(Kendall and Stainton 2001). Modifying the particle characteristics to comply with process
and other demands is called particle engineering (Davies et al. 1998; Caruso 2001). Particle
properties addressed by means of particle engineering have been dusting, powder flow,
compressibility, segregation, dissolution, taste and smell, drug release, size, shape, density
and instability (Guignon et al. 2002; Hémati et al. 2003; Desai and Park 2005). Traditionally
solvents have been used in modifying the above mentioned properties (Bose and Bogner
2007). The use of organic solvents is, however, not problem free due to e.g. toxicity,
flammability and environmental reasons. In many cases water can be used to replace organic
solvents.
The free moisture within a particle system is the difference between added and
removed moisture (Abberger 2001). Moisture removal occurs through evaporation or by
absorption into the particles. The amount of free moisture greatly affects the process
behaviour in terms of e.g. particle size and cohesion, and thus also affects final product
quality. Water has a high latent heat of evaporation resulting in longer processing times and
higher processing temperatures, which is not favourable when processing heat or moisture
sensitive compounds or when aiming for cost efficiency (Bose and Bogner 2007). In addition,
atmospheric moisture and moisture sorption have a major effect on particle system
behaviour (Kontny and Zografi 1995). Taken together, there is a clearly defined need for
increased knowledge on low moisture particle systems modification, in order to be able to
produce powders with desirable attributes for direct compression. Currently new drug
molecules discovered within the pharmaceutical industry tend to be more potent, small in
particle size and poorly soluble, which further increases the demand for understanding of
particle level phenomena (Muzzio et al. 2002).
Particle systems modification can be performed with dry and wet methods (Stanley-
Wood 1990). Wet methods are e.g. fluidised bed coating and granulation and high-shear
granulation, and dry methods are e.g. hot melt extrusion, roller compaction and die
compaction. As modest amounts of water can be used in dry methods, wet methods with
restricted amounts of liquid additions can be distinguished from dry methods by referring to
them as low moisture content processes.
Literature overview
2
An interface is the boundary that separates different states of substance (Buckton
2000). These states are solid, liquid and vapour. The boundary between two like but
immiscible states (e.g. oil and water) is also defined as an interface. Physical and chemical
phenomena that occur on or at an interface are interfacial phenomena.
This thesis focuses on studying restriction of the use of moisture in wet coating and
agglomeration processes. In addition, characterisation of this kind of low moisture content
processes is discussed. The aim is to bring insight into the borderline between coating and
granule formation and taking advantage of interfacial phenomena on the particle surfaces in
order to produce particles with desired behaviour and size. Furthermore, the aim was to gain
knowledge on methods intended for increasing process understanding and process
monitoring.
2 Literature overview
2.1 Particle systems
2.1.1 Definitions
A particle is a single, coherent unit of solid matter with a defined and limited interface
to the media in which it exists (Hawkins 1990). The particle can be a single unit, such as one
crystal or particle, or consist of several primary particles adhered to each other forming an
aggregate or agglomerate. An aggregate is defined as several particles with faces tightly
adhered to each other, while agglomerates consist of more loosely adhered particles. The size
of particles can vary from only a few nanometres to several millimetres (Shekunov et al.
2007).
A particle system can be defined as a population of single particles confined within a
restricted volume or otherwise in close interaction with each other (Menon and Durian 1997),
of which powders are a typical example. Powders are by definition solids, although they can
show both fluid-like and gas-like properties, such as the ability to flow and become
compressed, respectively (Geldart 1990; Menon and Durian 1997). This versatility in
behaviour is essential in processing particular material into suitable dosage forms such as
tablets.
2.1.2 Particle size and morphology
Particle size affects numerous properties of pharmaceutical dosage forms, such as flow,
solubility and drug release (Shekunov et al. 2007). Particle size is dependent on which
measures are reported, e.g. Feret’s diameter, Martin’s diameter or different kinds of
equivalent sphere diameters (Hawkins 1990; Svarovski 1990; Kaye 1997; Shekunov et al.
2007). The choice of measure needs to be based on the desired functionality (Kaye 1997). The
particle size of a particle system is a combination of all individual particle sizes combined to
form a particle size distribution, giving information on particle size as a bulk property
(Svarovski 1990). In particle size distributions compromises need to be made due to the
heterogeneity of particle systems. Particle size analysis methods can be based on measuring
particle size as a bulk property, measuring anonymous particles as a part of a population or
measuring individual particles (Hawkins 1990).
There are several methods for particle size analysis (Svarovski 1990; Shekunov et al.
2007), of which image analysis, sieve analysis and methods based on light scattering are the
Literature overview
3
most common ones (Heng and Chan 1997). Microscopy with subsequent image analysis is
thought of as a suitable reference method (Shekunov et al. 2007). The number of particles
needed in image analysis is dependent on particle size distribution width (Anares et al. 1996).
Recently more automated photometric image analysis methods have been developed
(Sandler 2010).
Spatial filtering velocimetry (SFV) yields higher results than laser diffractometry, but
up to 100 µm lower results than sieve analysis (Närvänen et al. 2008; 2009). Still, the results
of SFV have been found to be reliable and logical. Image analysis has been reported to give
larger particle sizes than laser diffraction in air or liquid (Anares et al. 1996). These
differences rise from particle dispersion (Adi et al. 2007). Dispersion decreases particle size,
and the dispersion medium also affects the result. Dispersion is of more crucial importance
with cohesive powders.
Particle shape affects e.g. powder flow, packing (Hawkins 1990; Sandler and Wilson
2010) and distribution of surface charge (Führer 1996). Particle shape can be described
verbally or numerically with e.g. with particle form factor or elongation ratios (Hawkins 1990;
Heng and Chan 1997). Particle shape analysis is done from individual particles with suitable
optical methods, which can be considered to be labour intensive and time consuming (Heng
and Chan 1997).
2.1.3 Particle-particle interactions
Particle-particle interactions are present in all particle systems (Führer 1996). These
interactions determine particle system behaviour and properties to a large extent. Forces of
interaction between particles can be divided into permanent and fluctuating forces.
Permanent forces of interaction consist of gravitational and van der Waals forces
(Israelachvili 1992; Führer 1996). In addition, there are electrostatic and molecular
interactions. These can be either attractive or repulsive. Attraction between similar and
dissimilar surfaces is called cohesion and adhesion, respectively. Van der Waals interaction is
described briefly in section 2.2.1.
Cohesion describes the force required to separate two particles and is proportional to
particle diameter (Kendall and Stainton 2001). Cohesion originates from gravitational or
electrostatic forces, but most commonly from van der Waals interaction. Cohesion causes
aggregation. Aggregate formation and cohesion is of importance in all particle systems,
including e.g. powders and granules. Aggregate strength increases with stronger cohesion,
but packing, aggregate structure and particle size also affects the strength.
As particles are in contact, there is an exchange of electrons between the surfaces
(Führer 1996). This gives rise to temporary triboelectric charging of the surfaces. The charge
is not uniformly distributed; asperities have higher local values of charge. Surfaces can also
have permanent charges, which are independent of triboelectrification. Electric charges are
formed and charge transfer can occur as a result of triboelectrification whenever powder is
handled and there is interparticle interaction between dissimilar surfaces (Bailey 1984).
Small particles become charged more easily and charge transfer occurs easier from large
particles to small particles. Electrostatic interactions are dependent on the electrostatic
charges of the participating particles and the distance separating them (Führer 1996). The
electrostatic force decreases with the second power of the distance of separation.
Triboelectrical charging can be used as a tool for improving the quality and stability of
ordered mixtures, as oppositely charged particles attract (Staniforth and Rees 1982). Close
contact caused by triboelectric charging can also enhance the strength of van der Waals
interaction. Usually, though, electric charges need to be reduced to avoid spark formation
Literature overview
4
and explosions (Bailey 1984; Guardiola et al. 1996). In addition, electric charges are reduced
to minimise adhesion, in order to facilitate or even enable processing.
Increased relative humidity (RH) can dissipate charges or change their polarity (Bailey
1984). Moisture sorption isotherms can thus be used in predicting triboelectrification
behaviour, as electric charge has been found to correspond well with absorbed moisture
(Nomura et al. 2003; Rowley and Mackin 2003). Under a certain threshold, RH does not
affect charge (Guardiola et al. 1996). When a certain RH is exceeded electrification is strongly
reduced, and above a certain threshold no changes are to be obtained by further increases in
RH (Guardiola et al. 1996; Nomura et al. 2003; Räsänen et al. 2004). Interestingly, it has
been suggested that electric charging itself is not affected by RH, but more so the rate of
charge dissipation (Boland and Geldart 1972; Visser 1989).
Water on particle surfaces causes both molecular and capillary interaction. The
molecular interaction between the water molecules and particle surface and the water
molecules themselves are by hydrogen bonding (Israelachvili 1992; Führer 1996). When a
powder is wetted and two particles are in close contact, the free moisture forms liquid bridges
between the particles (Rumpf 1975; Führer 1996). The capillary pressure of the liquid bridge
is inversely dependent on the radii of the curvatures of interface and directly dependent on
the surface tension of the participating liquid, as described by the Laplace equation (Rumpf
1975).
Surface roughness of particles can both increase and decrease interparticle attraction
(Führer 1996). The mechanism of decreased interaction is governed by increasing distance of
separation between particles. If the surface roughness separates particles more than 1 micron
from each other van der Waals interaction can be neglected (Visser 1989). Surface roughness
might with certain geometries cause mechanical interlocking of particles resulting in
increased attraction (Führer et al. 1996).
The effective distance of all interparticle attraction forces mentioned above varies
(Führer 1996). Van der Waals forces range from 0.2 nm to 10 nm, and decrease to the sixth
power of the separating distance. Formation of liquid bridges demands close interaction, but
after formation the bridges can be stretched. Electrostatic interaction has the longest range of
effect of the forces mentioned.
2.1.4 Powder flow
Sufficient powder flow is demanded in order to be able to produce high-quality solid
dosage forms (Staniforth 2002b; Sinka et al. 2004). Powders have a natural tendency to
resist motion rising from electrostatic, van der Waals and moisture-related cohesive and
adhesive forces of interaction (Davies 2001). Other factors influencing powder flow are
particle size and size distribution, particle shape and surface texture (Geldart et al. 1984;
Staniforth 2002b; Genina et al. 2009; Sandler and Wilson 2010). Common approaches to
overcome poor flow properties are particle size enlargement by granulation or spray drying
as well as modifying particle surface and shape. Furthermore, RH can be used to alter
electrostatic interactions favouring particle flow. Flow properties can be quantified by
measuring shear or tensile strength, angle of repose, funnel discharge, avalanching behaviour
and flow through an orifice (Davies 2001; Staniforth 2002b; Schwedes 2003; European
Pharmacopoeia (Ph. Eur.) 2005; Faqih et al. 2006; Seppälä et al. 2010). The flow properties
can also be estimated by comparing bulk and tapped densities with Hausner indices and
Carr’s compressibility indices (Davies 2001).
RH affects powder flow properties, depending on the vapour sorption characteristics of
the powder (Faqih et al. 2007; Seppälä et al. 2010). Also interstitial air has been found to
Literature overview
5
impair powder flow (Sinka et al. 2004). Flow properties can also be affected by formulation
design; for instance increasing the amount of active pharmaceutical ingredient with poor flow
properties in a blend with cellulose impairs the flow properties of the blend (Soppela et al.
2010) and adding magnesium stearate has been reported to improve powder flow by
increasing hydrophobicity and reducing van der Waals interaction (Faqih et al. 2007). Also
polymer coatings have been used to improve powder flow (Fernández-Arévalo et al. 1990;
Holgado et al. 1996).
2.2 Interfacial phenomena
2.2.1 Van der Waals interaction
Van der Waals forces are present in all particulate and molecular systems, and participate in
all phenomena related to these (Israelachvili 1992). The interaction can be divided into
dipole-dipole or Keesom-interaction (Equation 1), dipole - non-polar or Debye interaction
(Equation 2) and non-polar interaction or London-dispersion interaction energies (Equation
3)
( )
( ) (1)
( ) ( )
(2)
( )
( )
(3)
in which T stands for temperature (K), u is the electric dipole moment, α is electric
polarizability, r is the distance between interacting atoms or molecules, k is the Boltzmann
constant, hp is the Planck constant, v is the electric adsorption frequency and ε0 is the
dielectric permittivity of vacuum.
The interaction of non-polar species is a result of random electron positioning causing
the formation of a temporary dipole, which induces a dipole moment in a neighbouring
molecule (Visser 1989; Israelachvili 1992). Van der Waals interaction extends to distances of
separation from 0.2 nm to 10 nm and it can be attractive or repulsive. If particle diameter is
less than 100 microns and the distance of separation is in the range of a few nanometers van
der Waals interaction will dominate over gravitational forces (Visser 1989). For flat or very
porous particles this holds true even for particle diameters over 100 µm. In liquid
environment van der Waals interaction is suppressed. It must be kept in mind, that on an
atomic and molecular level van der Waals interaction is relatively weak, but gains
significance in the interaction between surfaces.
2.2.2 Hydrogen bonding
Hydrogen atoms are very small, and when they are covalently bound to highly
electronegative atoms such as oxygen, nitrogen, fluoride or chloride, formation of hydrogen
bonds becomes possible (Israelachvili 1992). The hydrogen bond has features of both ionic or
covalent bonds and van der Waals interaction regarding the length and strength of the bond.
Hydrogen bonding is a typical interaction for systems containing any amount of water. The
Literature overview
6
bond can be formed inter- or intramolecularly, one-, two- or three-dimensionally and linearly
or in an angle.
2.2.3 Hydrophobicity and hydrophilicity
Hydrophobicity and hydrophilicity are molecular characteristics affecting solid/liquid
interfaces originating from hydrogen bonds (Israelachvili 1992). Hydrogen bonds are present
in water connecting water molecules to each other according to the polarity of the molecule.
When a non-polar molecule is introduced into an aqueous environment, there will be a loss of
hydrogen bonds unless the water molecules rearrange themselves to a more regular structure.
This would thermodynamically unfavourably decrease the entropy of the system, giving rise
to hydrophobicity. Hydrophilicity, on the other hand, is thought of as the ability of a
substance to associate itself with the hydrogen bond network of an aqueous environment.
The association disrupts the hydrogen bond network, increasing the entropy of the system.
Hydrophobic substances typically have high and hydrophilic substances have low contact
angles (θ) of water.
2.2.4 Surface free energy and surface tension
Molecules in a bulk substance are attracted to each other in all directions (Lambros and
Nicolaou 2003). Molecules on the surface are drawn to the sides and inwards towards the
bulk. This gives rise to surface or interfacial tension or energy, γ. The interfacial energy
consists of a polar ( ) and non-polar ( , dispersion) component expressed by Wu (1973) as
(4)
Surface tension resists mixing with other surfaces and aims to minimize the surface
area. Surface tension can be defined as the work demanded to create an area (Buckton 2000).
Surface free energy is the work demanded to expand the surface area (Israelachvili 1992:
Buckton 2000). The unit of surface tension is mNm-1 and the unit of surface free energy is
mJm-2, which in essence are equal. Work of cohesion and adhesion are defined as the work
needed to separate to like and un-like surfaces, respectively (Israelachvili 1992: Lambros and
Nicolau 2003). The work of cohesion and adhesion are given in Equations 5 and 6
(5)
(6)
in which subscripts 1 and 2 are two different substances (Lambros and Nicolaou 2003). In
the case of solid/liquid contacts (Buckton 2000) the work of adhesion is given as
( ) (7)
From these the interfacial energy between two unlike substances is derived in the Dupré-
equation (Israelachvili 1992).
(8)
in which and
are non-polar and polar components of the work of adhesion,
respectively (Rowe 1989). The overall work of adhesion is determined as
WOA= WA × S (9)
in which S is the contact surface area (Saleh and Guignon 2007).
Literature overview
7
2.2.5 Contact angle, wetting and spreading
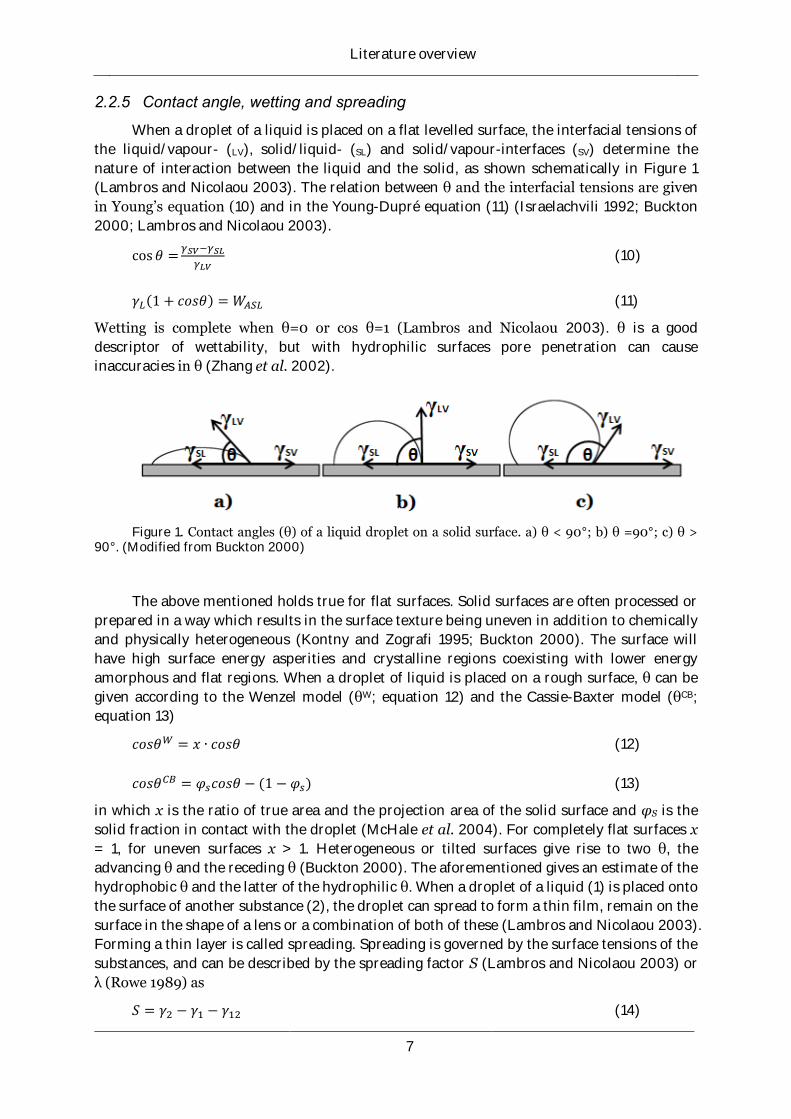
When a droplet of a liquid is placed on a flat levelled surface, the interfacial tensions of
the liquid/vapour- (LV), solid/liquid- (SL) and solid/vapour-interfaces (SV) determine the
nature of interaction between the liquid and the solid, as shown schematically in Figure 1
(Lambros and Nicolaou 2003). The relation between θ and the interfacial tensions are given
in Young’s equation (10) and in the Young-Dupré equation (11) (Israelachvili 1992; Buckton
2000; Lambros and Nicolaou 2003).
(10)
( ) (11)
Wetting is complete when θ=0 or cos θ=1 (Lambros and Nicolaou 2003). θ is a good
descriptor of wettability, but with hydrophilic surfaces pore penetration can cause
inaccuracies in θ (Zhang et al. 2002).
Figure 1. Contact angles (θ) of a liquid droplet on a solid surface. a) θ < 90°; b) θ =90°; c) θ >
90°. (Modified from Buckton 2000)
The above mentioned holds true for flat surfaces. Solid surfaces are often processed or
prepared in a way which results in the surface texture being uneven in addition to chemically
and physically heterogeneous (Kontny and Zografi 1995; Buckton 2000). The surface will
have high surface energy asperities and crystalline regions coexisting with lower energy
amorphous and flat regions. When a droplet of liquid is placed on a rough surface, θ can be
given according to the Wenzel model (θW; equation 12) and the Cassie-Baxter model (θCB;
equation 13)
(12)
( ) (13)
in which x is the ratio of true area and the projection area of the solid surface and φS is the
solid fraction in contact with the droplet (McHale et al. 2004). For completely flat surfaces x
= 1, for uneven surfaces x > 1. Heterogeneous or tilted surfaces give rise to two θ, the
advancing θ and the receding θ (Buckton 2000). The aforementioned gives an estimate of the
hydrophobic θ and the latter of the hydrophilic θ. When a droplet of a liquid (1) is placed onto
the surface of another substance (2), the droplet can spread to form a thin film, remain on the
surface in the shape of a lens or a combination of both of these (Lambros and Nicolaou 2003).
Forming a thin layer is called spreading. Spreading is governed by the surface tensions of the
substances, and can be described by the spreading factor S (Lambros and Nicolaou 2003) or
λ (Rowe 1989) as
(14)
Literature overview
8
or
(15)
When S > 0, WA > WC or spreading occurs (Rowe 1989; Zajic and Buckton 1990;
Iveson et al. 2001a, Lambros and Nicolaou 2003).
2.2.6 Vapour sorption
Adsorption is defined as uptake of one material onto the surface of another material
(Buckton 2000). In adsorption water molecules interact with the solid surface by hydrogen
bonding. Absorption refers to uptake of one material into the bulk of another material.
Absorption by liquid migration into pores is based on physical interactions between the solid
and the liquid (Denesuk et al. 1993; Iveson et al. 2001a). The term sorption denotes uptake in
general, including both adsorption and absorption (Buckton 2000).
Vapour sorption is the uptake of water from the atmosphere, which can be described by
adsorption-desorption isotherms (Kontny and Zografi 1995). In these the amount of water is
expressed as a function of water activity (wa). wa is the ratio of the vapour pressure of the
measured system and pure water. RH is defined as 100× wa. Vapour sorption isotherms give
information on the surface characteristics of the solid and on the nature of the solid/liquid-
interface. There are different models describing vapour sorption. The Langmuir adsorption
isotherm describes the volume of gas necessary to cover a solid surface with a monolayer of
adsorbent (Newman 1995). This model, however, has certain restrictions, based on which
Brunauer, Emmett and Teller (1938) derived their model for adsorption called the BET-
model, further developed by Guggenheim, Anderson and deBoer to extend over a wider range
of vapour pressures (Kontny and Zografi 1995).
Regarding crystalline solids, when the RH of the atmosphere is increased, vapour is
adsorbed on the surface of the solid (Kontny and Zografi 1995). With non-hydrates the
adsorption is dependent in surface polarity and area, and conversion to a corresponding
hydrate form can occur. When the critical RH is reached (RH0), the surface of the solid
begins to dissolve into the adsorbed liquid. As the RH is further increased, water vapour
condensates onto the liquid film diluting it and allowing further dissolution of solid. This
phenomenon is called deliquescence.
Hygroscopicity is a term describing substance ability to uptake moisture from the
atmosphere (Kontny and Zografi 1995; Byrn et al. 1999). Due to the relative nature of the
term hygroscopicity, RH0 is suggested as a more exact descriptor of the vapour sorption
behaviour (Byrn et al. 1999). Amorphous substances generally absorb more vapour than non-
hydrating crystalline solids, and exhibit more pronounced desorption hysteresis (Kontny and
Zografi 1995; Airaksinen et al. 2005). Vapour sorption causes variability in both chemical
and physical characteristics of powders.
2.2.7 Capillary condensation
Vapour sorption into curved surfaces and pores occurs already below vapour pressures
at which condensation occurs for flat surfaces (Israelachvili 1992; Kontny and Zografi 1995).
This is due to higher attraction between adsorbent molecules derived from surface curvature.
Capillary condensation increases with decreasing pore size. All phenomena that are affected
by RH are also affected by the amount of capillary condensation, and the effect of capillary
condensation is more pronounced with porous materials. Capillary condensation has been
shown to affect fluidisation behaviour and granule growth (D’Amore et al. 1979; Visser 1989).
Literature overview
9
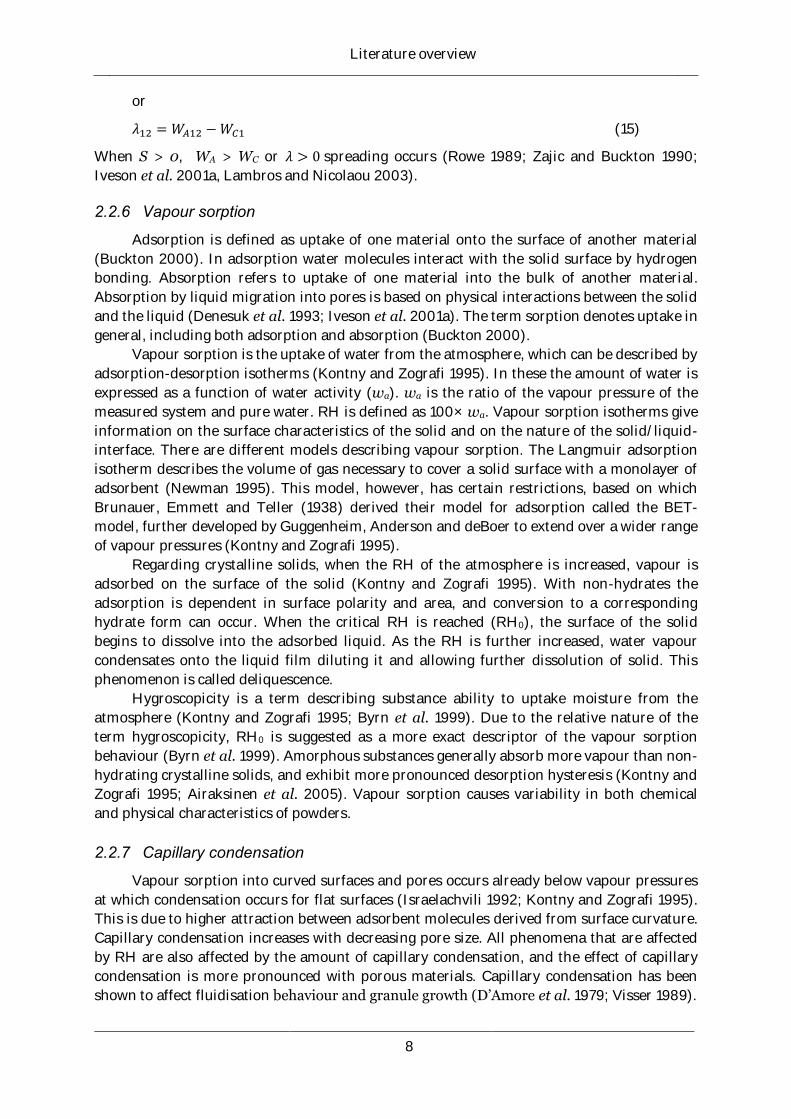
2.3 The heterogeneous nature of pharmaceutical surfaces
Pharmaceutical surfaces are in general heterogeneous due to variations in chemical and
physical properties (Israelachvili 1992; Kontny and Zografi 1995; Buckton 2000). These
variations are due to the processing history of the solid, including crystallisation (Buckton
2000). Considering the distribution of electrical charges within a particle, charge is
accumulated in crystalline regions (Füher 1996). When a particle is fully amorphous, electric
surface charges are evenly distributed. Surface roughness affects the surface properties to a
great extent. Asperities are often of a more crystalline nature (Buckton 2000), and electric
surface charges are accumulated in asperities. Even the particle shape affects the way electric
charges are distributed; irregularly shaped particles have an uneven distribution of charge
(Führer 1996). When a liquid droplet is placed on a solid surface, the θ might vary due to
surface heterogeneity (Israelichvili 2002). Examples of such are shown schematically in
Figure 2.
Figure 2. Variation in contact angle due to surface heterogeneity. a) Difference in contact angle
of two droplets on a solid surface caused by chemical or physical heterogeneity; b) Difference in contact angle of two droplets with a contact angle θ = 90° on a solid surface caused by surface roughness; c) Advancing and receding contact angles due to surface heterogeneity. (Modified from Israelachvili 2002).
Processing also affects the degree of crystallinity (Buckton 2000). Amorphous regions
usually occur at the particle surfaces as a result of processing, which results in surface
heterogeneity. It must also be kept in mind that in crystalline materials the chemical
properties of each crystal face will differ from each other. The properties of a surface are not
fixed; e.g. when a droplet of water is placed on a surface the surface molecules might
rearrange themselves to a more favourable configuration for solid/liquid-contact. This is
typical for amorphous materials.
2.4 Particle systems modification
2.4.1 Particle surface engineering
Particle engineering can be seen as controlling or modifying particle size and surface to
achieve a desired functionality of the particle (Davies et al. 1998; Caruso 2001). Particle
surface engineering is designing a particle surface with tailor-made properties (Davies et al.
1998). Coating is a simple example of surface engineering. Nanoengineering of surfaces can
be done by surface polymerization to achieve one or more thin polymeric layers, layer-by-
layer coating with cations, and anions, adhering bio-molecules onto surfaces or precipitation
of chemical reactions on surfaces (Caruso 2001). Crystallisation is a method of particle
surface engineering (Davies et al. 1998). Crystal habit can be modified by crystallisation in
presence of disrupting and blocking molecules or surfactants. Particles can also be designed
to have certain properties by co-crystallisation techniques with excipients, by spherical
crystallisation techniques (Remenar et al. 2003; Nokhodchi et al. 2007; Magshoodi et al.
Literature overview
10
2008) or simply by adjusting crystallisation supersaturation (Price et al. 2002). As an
example, improved flow, tablettability and dissolution of ibuprofen was achieved by
crystallisation with additives (Rasenack and Müller 2002a, b). Surface roughness has a
noticeable influence on interparticle interaction (Führer 1996). Surface roughness has been
modified with coating (Iida et al. 2005), mechanical processing in the presence of solvents
(Iida et al. 2003; Ferrari et al. 2004) and by treatment with fine mist (Genina et al. 2009). By
such treatments powder inhalation properties and powder flow can be improved (Kawashima
et al. 1998; Price et al. 2002; Young et al. 2002; Iida et al. 2004; Genina et al. 2009).
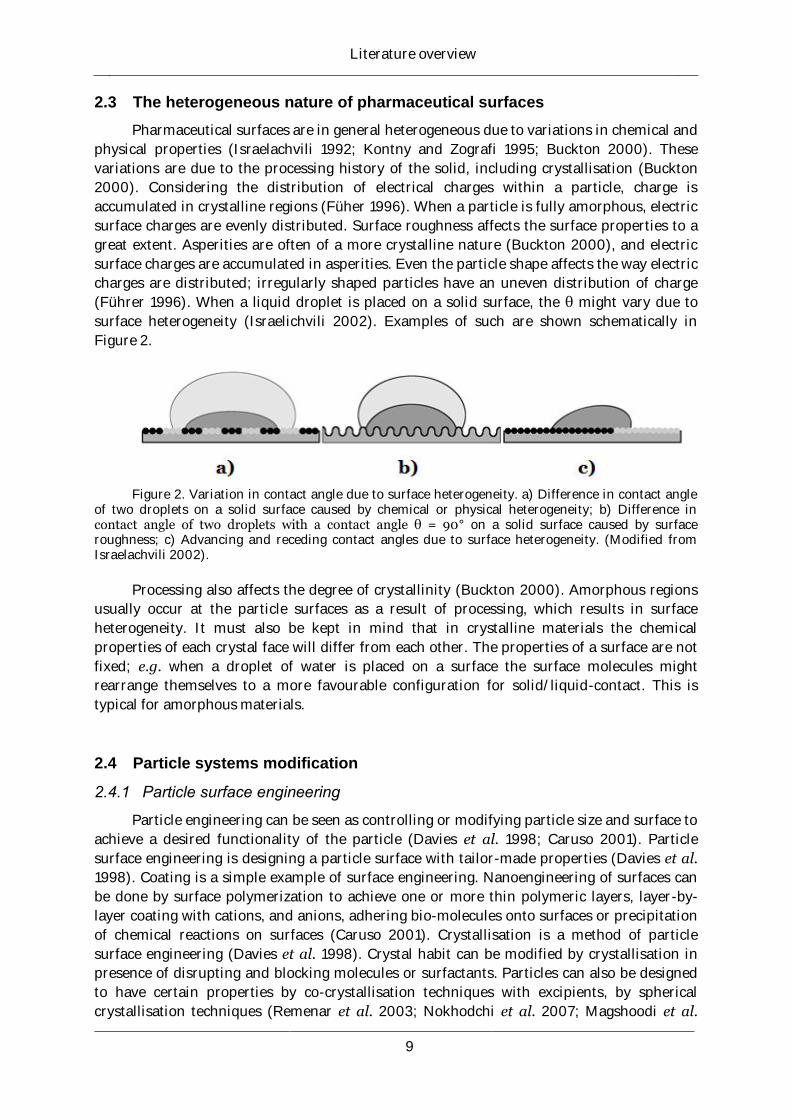
2.4.2 Wet coating
Particle coating, or microencapsulation, can be achieved by adding coating material in
liquid form to a particle system in small enough amounts to avoid agglomeration (Saleh et al.
1999). There are several methods for wet coating, such as spray drying, spray cooling,
fluidised bed processing, liposome formation or coacervation (Gibbs et al. 1999; Desai and
Park 2005). Microencapsulation can be performed by single-layer, multi-layer, multicore,
matrix and irregular shaped coating, as presented in Figure 3. Smaller particles can also be
attached to larger ones by means of wet coating (Beck et al. 2004). Microencapsulation by
spray drying is the most widely used microencapsulation method in the food industry due to
the ability to produce good quality particles (Desai and Park 2005). Microencapsulation by
spray-cooling is done with melted coating, and particle formation is performed through
droplet solidification instead of droplet evaporation, producing regular spheres with good
flow properties. Wet coating does not have to be restricted to individual particles; ordered
mixes can be stabilized into particle systems with good flow properties by coating in a
fluidised bed (Thiel and Nguyen 1984).
Figure 3. Schematics of types of microencapsulation. a) single-layer; b) multilayer; c) multicore;
d) stabilized ordered mix; e) irregular particle coating. White colour indicates core, dark gray coating and light gray carrier particle.
2.4.3 Dry coating
Surface engineering by dry coating aims for forming a protective barrier around the
particle and adding functional properties to the surface without the use of solvents (Davies et
al. 1998; Pfeffer et al 2001; Bose and Bogner 2007). Different methods of dry coating are
reviewed by Bose and Bogner (2007). Coating can be performed by compressing dry powder
around a suitable core, by precipitating coating material onto the cores from a supercritical
fluid, by adding melted coating material onto particle surfaces or by attracting smaller guest
particles onto the surface of host particles aiming to form a uniform layer of smaller particles
on the surface of larger host particles (Pfeffer et al. 2001; Bose and Bogner 2007). The
Literature overview
11
difference between dry particle coating and formation of ordered mixtures is the stronger
interaction between host and guest in dry coating (Pfeffer et al. 2001). Dry coatings can be
used to enhance flow, to modify drug release or change wettability. There are several reports
on dry coating to improve flow and fluidisation properties by e.g. coating with hydrophilic or
hydrophobic nanosized silica (e.g. Räsänen et al. 2004; Linsenbühler and Wirth 2005; Yang
et al. 2005).
2.4.4 Particle size enlargement
Particle size enlargement is a common way to improve handling characteristics of
particle systems (Stanley-Wood 1990). To increase particle size, smaller particles are adhered
to each other by inducing different kind of bonds between them. Size enlargement processes
can be divided into wet and dry methods. Particle size enlargement in wet methods is based
on mixing, liquid spraying, evaporation from particle surface, agglomeration, abrasion and
fragmentation (Hémati et al. 2003). Fluidised bed granulation, high-shear granulation and
spray drying are examples of wet size enlargement methods (Stanley-Wood 1990). In dry
methods the particles are adjoined by compressing them to form coherent structures with
subsequent breakage to suitable particle size. Dry methods might include the use of water in
modest amounts. Roller compaction, hot melt extrusion and die compaction are examples of
dry size enlargement methods.
2.4.5 Particle size reduction
Particle size reduction is performed to e.g. improve dissolution rate, alveolar drug
deposition or the physicochemical stability of drug preparations (Shekunov et al. 2007). To
reduce particle size, energy is demanded to break the structure of the particles (Staniforth
2002a). Only a small fraction of the energy directed to the system is responsible for the actual
size reduction; the majority of the energy is lost during the process. In size reduction
mechanic energy is directed to the particle to cause a fracture and propagate it through the
particle until particle structure failure occurs (Prior et al. 1990; Staniforth 2002a). This is
continued until the desired particle size distribution is obtained. There are numerous
methods of particle size reduction. Comprehensive knowledge on the demands of the process
and on the material behaviour under stress is needed for successful processing (Prior et al.
1990).
2.5 Fluidised bed powder processing
2.5.1 Principle of action
In fluidised bed processing particulate material is brought to a fluid-like state by
directing a stream of air through the powder bed from below, which causes mixing of the
powder (Parikh et al. 1997). When the powder is mixed liquid is sprayed onto the particles
usually with a pneumatic nozzle. Based on nozzle position fluidised bed processes can be
divided into top-spray, bottom-spray and tangential-spray processes. In bottom-spray
processes draft tubes can be used to direct the particle circulation. Such processes are called
Wurster spouted beds. When the particulate material has obtained the appropriate amount of
liquid the spray is terminated, after which the granules are dried in the fluidising air. Taken
together, mixing, spraying and drying are all performed in the same vessel with no
intermediate treatment or process interruptions.
Literature overview
12
Granule formation depends on binder addition rate, degree of atomisation,
temperature of fluidising air and nozzle position which affect wetting, liquid penetration and
evaporation (Davies and Gloor 1971). Variables affecting fluidised bed coating are equipment
design variables (chamber, nozzle, nozzle position, distributor plate), process variables (inlet
air temperature, velocity and RH, binder spray rate, atomisation pressure, batch size) and
product variables (solvent choice, coating material, coating solution, particle properties), of
which all affect particle circulation rates within the chamber (Cheng and Turton 2000a).
These all also determine the size of the wetting active, isothermal and heat transfer zones
(Jiménez et al. 2006). Wetting and agglomeration occurs in the wetting zone, in which the
temperature is low and moisture high. Wurster souted beds and top-spray fluidised beds
share certain features and can to some extent be compared to each other (Christensen and
Bertelsen 1997). The major difference between these is that Wurster spouted beds have a
pronounced, regular circulatory pattern and clearly defined bed regions.
2.5.2 Fluidisation
When gas is directed through a powder bed at low velocities, the air percolates through
the bed (Seville 2007). When increasing the velocity of the gas the powder bed expands and
the pressure drop over the bed decreases. At a certain point the particles are set into subtle
motion, as the pressure drop over the bed equals the weight of the bed as expressed in
Δp/H=(1-εmf)(ρs-ρg)g (16)
in which Δp/H is the pressure drop over a distance in the chamber, εmf is the void fraction of
the bed, g is gravitational acceleration and ρs and ρg are the densities of the particles and the
gas, respectively. The point where the pressure drop over the bed equals the mass of the
particle is called incipient fluidisation, and the gas velocity at which it occurs is called
minimum fluidisation velocity. The pressure drop does not increase when exceeding the
minimum fluidisation velocity. As the gas velocity is increased further, the bed shows
bubbling behaviour.
Fluidisation behaviour of powders has been classified into four categories by Geldart
(1973). Powders of Geldart group A are small, low density particles which are fluidisable, and
group B powders are slightly larger and dense. The behaviour characteristics which
determine to which of these a powder belongs is the velocity difference between incipient
fluidisation and bubbling bed. In group A the difference is large, during which the bed
expands. In group B the velocity difference between incipient fluidisation and bubbling bed is
small. Group D powders are large and dense and fluidise only with difficulty. Group C
powders are small and very low density particles experiencing strong cohesion. They react to
air by lifting as a plug or by passing the air through the powder bed in channels. They do not
fluidise easily without external assistance.
The particle motion caused by the fluidising air induces mixing and participates in
binder spreading. Mixing of powders in fluidised beds is not problem-free, as segregation has
been reported with a wide range of fluidising velocities (Hoffmann and Romp 1991; Bacelos
et al. 2007; Närvänen et al. 2009). When there is an increase in fluidising air velocity the
granule growth rate decreases due to more pronounced attrition and drying (Saleh et al.
1999). In addition, fast particle circulation rates favour mechanical distribution of the liquid
and reduce residual moisture in the final product (Litster 2003: Behzadi et al. 2005).
Literature overview
13
2.5.3 Spraying
A binder liquid is added to the powder to induce appropriate changes in particle
characteristics (Saleh et al. 1999). Binder spray rate needs to be determined based on the
evaporative capacity of the inlet air, coating tackiness and the particle circulation rate
(Dewettinck and Huyghebaert 1999). An increase in binder spray rate results in an increase
in agglomeration tendency when a critical threshold is passed and an uneven binder
distribution pronounces the agglomeration tendency (Becher and Schlünder 1998). With low
spray rates the droplet size distribution is more uniform (Chen et al. 2009). Increasing
binder spray rate results in an increase in granule size and decreased friability and porosity
(Davies and Gloor 1971). This is due to enhanced wetting and penetration and partly due to
increased droplet size (Davies and Gloor 1971; Chen et al. 2009). Increasing the amount of
binder added results in larger granules with higher residual moisture (Behzadi et al. 2005). It
has to be kept in mind that too low a spray rate results in spray drying of the liquid droplets
(Guignon et al. 2002).
2.5.4 Drying
There are two kinds of moisture in particles: free unbound water and pore water
(Abberger 2001; Wang et al. 2007). Drying of granules proceeds in stages (Hlinak and Saleki-
Gerhardt 2000; Wang et al. 2007). First the granules are heated followed by a period of
constant drying rate of free water (Wang et al. 2007). In these stages the drying is controlled
partly by heat and mass transfer between particle and the fluidising medium and heat
transfer from particle to liquid and partly by the differences in vapour pressure between air
and liquid (Guignon et al. 2002; Wang et al. 2007). The drying proceeds with liquid
migrating to the granule surface by means of diffusion to evaporate, during which the drying
rate is falling (Hlinak and Saleki-Gerhardt 2000; Wang et al. 2007). Finally the moisture
content reaches an equilibrium, which depends on process conditions, RH of the drying air
and vapour sorption properties of the granules (Hlinak and Saleki-Gerhardt 2000). The
drying rate can be expressed as
∙ ΔT (17)
in which dW/dt is the change in mass of evaporated water over time, ht is the heat transfer
coefficient, A is the surface area of the particle, ΔH is the latent heat of evaporation and ΔT is
the temperature difference between the drying air and product surface (Schæfer and Wørts
1978a). Taken together, inlet air RH, temperature and velocity affect drying (Guignon et al.
2002).
Bed temperature and outlet air humidity are indicators of granule moisture content
(Schæfer and Wørts 1977a; Schæfer and Wørts 1978a; Rantanen et al. 1998; Rantanen et al.
2001; Lipsanen et al. 2008). In addition, near-infrared (NIR) spectrometry can be used in
moisture content analysis in fluid bed drying (Frake et al. 1997; Rantanen et al. 2001).
Different drying end-point criteria have been used, such as fixed outlet air moisture content,
fixed drying time and specific outlet air temperature (Lipsanen 2008). A fixed bed
temperature difference between the onset and completion of drying has been implemented
and found superior to the above mentioned, especially with varying moisture content of the
inlet air (Schæfer and Wørts 1978a; Lipsanen et al. 2008).
More recently NIR-spectrometry has been used as a tool in granulation end point
determination (Frake et al. 1997; Rantanen et al. 2001). High inlet air humidity leads to a
Literature overview
14
higher bed temperature (Lipsanen et al. 2007; Wang et al. 2007), but also prolongs the
drying time (Wang et al. 2007). The particle size distribution of the dried mass affects drying
(Guignon et al. 2002). Large granules usually contain more water (Nieuwmeyer et al. 2008),
and drying time has been found to increase with increasing particle size (Wang et al. 2007).
During drying, the particle size decreases and the amount of fines increases, which is more
pronounced with high inlet air velocities (Nieuwmeyer et al. 2008). Granule moisture
content and formation of fines during drying correlate.
2.6 Moisture in fluidised bed processes
2.6.1 Atomisation and droplet formation
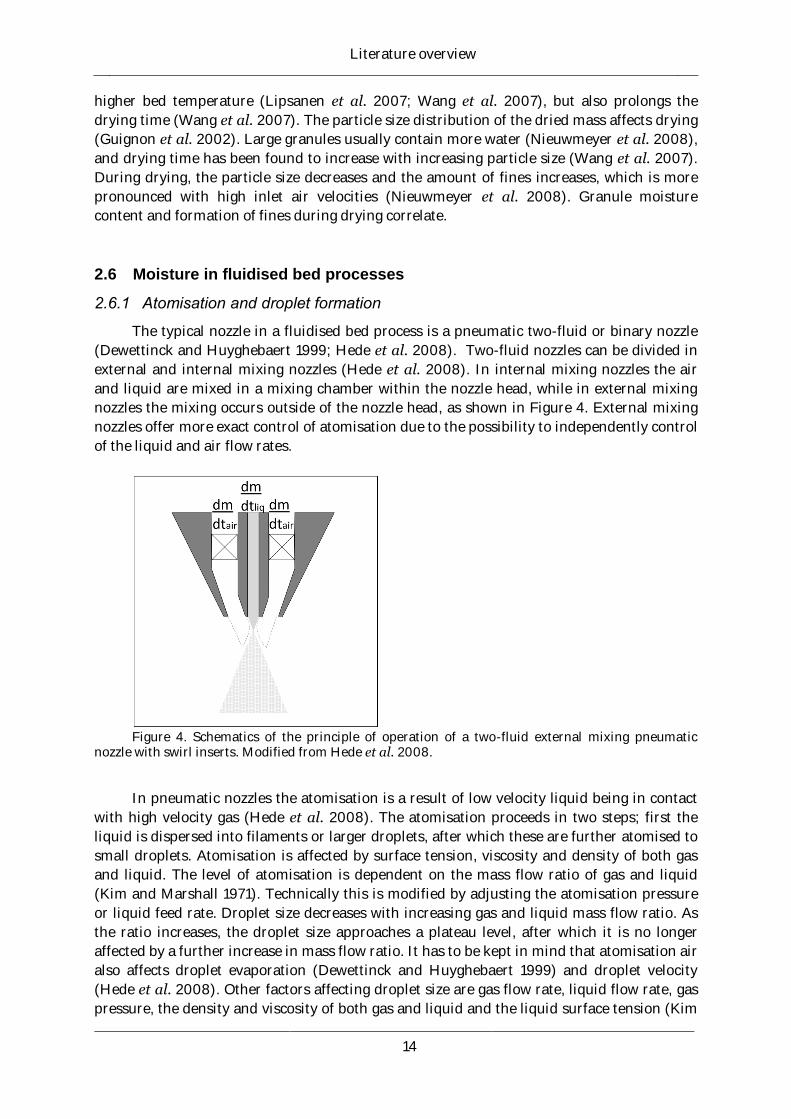
The typical nozzle in a fluidised bed process is a pneumatic two-fluid or binary nozzle
(Dewettinck and Huyghebaert 1999; Hede et al. 2008). Two-fluid nozzles can be divided in
external and internal mixing nozzles (Hede et al. 2008). In internal mixing nozzles the air
and liquid are mixed in a mixing chamber within the nozzle head, while in external mixing
nozzles the mixing occurs outside of the nozzle head, as shown in Figure 4. External mixing
nozzles offer more exact control of atomisation due to the possibility to independently control
of the liquid and air flow rates.
Figure 4. Schematics of the principle of operation of a two-fluid external mixing pneumatic
nozzle with swirl inserts. Modified from Hede et al. 2008.
In pneumatic nozzles the atomisation is a result of low velocity liquid being in contact
with high velocity gas (Hede et al. 2008). The atomisation proceeds in two steps; first the
liquid is dispersed into filaments or larger droplets, after which these are further atomised to
small droplets. Atomisation is affected by surface tension, viscosity and density of both gas
and liquid. The level of atomisation is dependent on the mass flow ratio of gas and liquid
(Kim and Marshall 1971). Technically this is modified by adjusting the atomisation pressure
or liquid feed rate. Droplet size decreases with increasing gas and liquid mass flow ratio. As
the ratio increases, the droplet size approaches a plateau level, after which it is no longer
affected by a further increase in mass flow ratio. It has to be kept in mind that atomisation air
also affects droplet evaporation (Dewettinck and Huyghebaert 1999) and droplet velocity
(Hede et al. 2008). Other factors affecting droplet size are gas flow rate, liquid flow rate, gas
pressure, the density and viscosity of both gas and liquid and the liquid surface tension (Kim
Literature overview
15
and Marshall 1971). Increased spray rate results in a more dense spray consisting of larger
droplets with wider and less uniform size distributions (Juslin et al. 1995a; Wan et al. 1995;
Müller and Kleinebudde 2007; Chen et al. 2009). Increased binder concentration, and thus
increased viscosity, leads to larger droplets with wider droplet size distribution (Kim and
Marshall 1971; Schæfer and Wørts 1977b; Juslin et al. 1995a,b; Müller and Kleinebudde 2007;
Chen et al. 2009).
2.6.2 Spray characterisation
Knowledge on nozzle function is an advantage in fluidised bed coating and
agglomeration (Hede et al. 2008), as nozzle height and spray width determines the wetted
area (Schæfer and Wørts 1977a) and droplet size has been found to correlate with granule
size by numerous authors (e.g. Schæfer and Wørts 1978b; Schaafsma et al. 1998; Schaafsma
et al. 2000). There has been several approaches to study the spray characteristics of nozzles,
such as laser diffractometry (Juslin et al. 1995a,b), laser Doppler anemometry (Müller and
Kleinebudde 2006,2007), particle tracking velocimetry (PTV; Rantanen et al. 1999) and
droplet collection into oil (Schæfer and Wørts 1977b) or cups (Schaafsma et al. 2006). Most
of the studies have been performed with the nozzle separated from the equipment in which it
functions; only a few studies have been performed in situ (e.g. Yuasa et al. 1999; Leclére et al.
2004).
Droplet formation is heterogeneous as a process, which results in a droplet size
distribution (Hede et al. 2008). There have been reports on both unimodal and bimodal
droplet size distributions (Juslin et al. 1995a; Yuasa et al. 1999), and usually the droplet size
with two-fluid nozzles lies between 10 and 100 µm (Guignon et al. 2002). Small droplets with
narrow size distribution promote uniform coating. It has to be kept in mind that all droplets
measured in spray characterisation do not participate in coating or granulation; it has been
suggested that only a small percentage (2-6%) of particles present in the spraying zone
receive coating due to “sheltering” by other particles (Cheng and Turton 2000b), and some
droplets undergo premature evaporation before droplet particle impact (Guignon et al. 2002).
2.6.3 Droplet-particle impact and adhesion
For granulation or coating to be possible, droplet particle impact with subsequent
droplet adhesion needs to occur (Link and Schlünder 1997). Particle droplet impact occurs in
the spray zone by four mechanisms: inertia, interception, diffusion, and field forces (Link and
Schlünder 1997; Guignon et al. 2002). Not all droplets undergo impact; some droplets are
prematurely dried before impact and in addition to this the particle circulation rate and spray
characteristics determine the probability of impact (Guignon et al. 2002). Impingement
efficiency can be described by the ratio of critical impact area to particle projection area,
which is dependent on particle and droplet size and velocity as well as solid-liquid interfacial
interaction (Link and Schlünder 1997; Panda et al. 2001). Upon impact the droplet can
become deposited, reflected, re-atomised, or it can coalesce or spread (Link and Schlünder
1997; Hardalupas et al. 1999). If both the solid and the liquid have high work of cohesion, the
contact area of the two is minimized (Iveson et al. 2001a).
Droplet adhesion is described by adhesion probability (Link and Schlünder 1997).
Adhesion probability is determined by the droplet momentum and liquid/solid-interfacial
phenomena (Link and Schlünder 1997; Guignon et al. 2002). There are different mechanisms
for adhesion after impact (Guignon et al. 2002). The mechanisms of adhesion are bond
formation (ionic or covalent), melting and resolidification, diffusion between droplet and
Literature overview
16
particle and chemical reactions. When γSL < γSV the surface energies are more favourable for
solid-liquid contact than solid-vapour contact (Denesuk et al. 1993). Reducing liquid
viscosity improves spreading, but reduces the critical velocity for reflection and counteracts
droplet coalescence (Guignon et al. 2002; Werner et al. 2007). Reducing surface tension
reduces the tendency to droplet reflection (Werner et al. 2007). The moisture content of the
surface and the bed temperature affects droplet adhesion by altering e.g. pore penetration
(Link and Schlünder 1997). Only the first coating layer has a liquid-particle interface, and
subsequent layer deposition is determined by liquid-dry film interface characteristics
(Donida et al. 2005).
2.6.4 Liquid spreading and absorption
In coating and granulation, good wettability and water entering pores are of
fundamental importance (Donida et al. 2005). If the powder does not absorb water the
process becomes more sensitive to process conditions (Schæfer and Wørts 1977a). After the
impact, droplet coalescence and spreading occurs (Guignon et al. 2002). When λ > 0, there
is formation of liquid bridges and subsequently strong and dense granules with low friability
(Planinšek et al. 2000; Iveson et al. 2001a; Bouffard et al. 2005). When λ > 0, the
resulting granules are weak and porous (Iveson et al. 2001a), or the solids might spread over
the liquid causing liquid filled hollow structures (Hapgood and Khanmohammadi 2009).
Liquid migrates into pores based on pore geometry, surface energies and liquid
viscosity (Denesuk et al. 1993; Iveson et al. 2001a). The droplet contact radius is more largely
determined by pore penetration than spreading, with the amount of pores participating being
the rate determining factor (Denesuk et al. 1993). Short penetration times are favoured by
small droplets, low viscosity, high porosity, large pores, low θ and high surface tension
(Hapgood et al. 2002). In addition, liquid penetration with a constant droplet radius and
decreasing θ favours rapid pore penetration (Denesuk et al. 1993).
Wettability assessment can be performed with single particles or bulk solids, which give
different information, as the wettability of bulk solids is affected by packing in addition to the
single particle properties (Hapgood et al. 2002; Lazghab et al. 2005). Changing a single
component in a powder mixture to a substance with better wettability even if present only in
a modest percentage leads to stronger granules (Jaiqeoba and Spring 1980). By studying the
liquid-solid interface phenomena, it is possible to predict the behaviour of the liquid in the
process (Zhang et al. 2002). Adding polymer to a solution decreases surface tension and
increases θ and binder viscosity (Schæfer and Wørts 1978b; Pont et al. 2001; Rajniak et al.
2007). Increased θ and lower surface tension decreases the granule size, granule growth rate
and coating efficiency (Iveson et al. 2001a; Pont 2001; Saleh and Guignon 2007). If the liquid
θ is very high, other wetting parameters can be negliged (Saleh and Guignon 2007).
Increased binder concentration has been found to increase granule size, growth rate
and porosity, and decrease final product density (Schæfer and Wørts 1978b,c; Rajniak et al.
2007). Increased polymer concentration also enlarges the droplet size, partly explaining the
gain in size (Rajniak et al. 2007). Liquid bridge strength decreases with decreasing surface
tension (Iveson et al. 2001a). Regarding the final product, increased binder concentration
leads to decreased granule friability and flow in addition to increased granule size, porosity
and tablet disintegration time (Davies and Gloor 1972). The increased tablet disintegration
time is due to increased porosity and impaired flow, causing problems in dye filling.
Literature overview
17
2.6.5 Coating and nucleation
Coating, nucleation, growth, and over-wetting are determined by maximum pore
saturation and deformation upon granule impact (Iveson and Litster 1998; Iveson et al.
2001b; Litster 2003). If there is large amounts of excess liquid in the process, or if the
droplets are much larger than the particles, an agglomeration will occur (Saleh et al. 1999). If
the droplet size is smaller than the particle or if there is rapid drying after droplet-particle
impact, the result is coating. Low bed temperatures favour granule growth and coating
efficiency (Schæfer and Wørts 1978a; Dewettinck and Huyghebaert 1998). Coating uniformity
is impaired in polydisperse systems as smaller particles receive more coating and larger
particles have faster rate of growth (Maronga and Wnukowski 2001).
If wet particles collide and the dispersive forces are not sufficient, agglomeration occurs
(Saleh et al. 1999). Several forces participate in the formation of granules, such as liquid
bridges, solid bridges, van der Waals forces, electrostatic forces and mechanic interlocking
(Reynolds et al. 2005). Nucleation is the formation of initial agglomerates (Iveson et al.
2001b). Nucleation is controlled by nucleation thermodynamics and efficient binder
distribution, and when the conditions for nucleation are beneficial, formation of nuclei
occurs rapidly (Schaafsma et al. 1998; Iveson et al. 2001b). Nucleation kinetics is
determined by liquid penetration into the bed (Hapgood et al. 2002). If pore saturation is
kept low enough, there will only be nucleation without further growth (Iveson et al. 1998,
Litster 2003).
For nucleation the θ and spreading coefficients are of importance, as good binder
distribution leads to even nucleation (Iveson et al. 2001a). Poor wetting or liquid penetration
into the powder bed results in uneven binder distribution, broadening the nuclei size
distribution (Hapgood et al. 2002). In fluidised bed processes the size of the nuclei is
dependent on droplet size (Iveson et al. 2001a). Drop controlled nucleation is the event of
one liquid droplet leading to one nucleus (Hapgood et al. 2002). Drop-controlled nucleation
demands rapid penetration of the droplet into the bed or effective mechanical dispersion of
the liquid (Litster 2003). Drop-controlled nucleation can be adjusted by adjusting droplet
penetration into the bed by formulation design or by modifying the process parameters
controlling droplet evaporation (Hapgood et al. 2002). Drop controlled nucleation leads to a
uniform size distribution of nuclei.
Several approaches to restrict granule growth in fluidised bed coating have been
reported. Increasing atomising gas velocity and lowering liquid flow rate reduces
agglomeration tendency (Becher and Schlünder 1997). Higher nozzle air velocity leads to
more uniform liquid deposition and thus more uniform granule growth. Wide particle size
distributions favour agglomeration tendency and by reducing attrition agglomeration
tendency can be suppressed (Guignon et al. 2002).
2.6.6 Granule growth
After nucleation the voids of the nuclei are saturated with water (Schaafsma et al. 1998).
Particle growth is dependent on plastic deformation during particle coalescence caused by
this local pore saturation (Schaafsma et al. 1998; Abberger 2001; Hapgood et al. 2003).
When pore saturation is complete there is free liquid on the surface to bind other particles
(Schaafsma et al. 1998). The process air evaporation efficiency depends on temperature of
the inlet air and absolute humidity of the inlet and outlet air (Dewettinck et al. 1998).
Agglomeration occurs when a critical evaporation efficiency is exceeded and there is
particle-particle interaction between wet particles (Dewettinck et al. 1998; Guignon et al.
Literature overview
18
2002). Granules are formed from one droplet, coalesced droplets or coalesced particles
(Schaafsma et al. 2000). Coalesence of droplets, nuclei and droplet-nuclei coalescence occurs
in the spray zone (Schaafsma et al. 2006). Following coalescence, water migrates to the pores
of the newly adhered particle driven by capillary pressure differences (Schaafsma et al. 1998).
The water migration is the rate limiting step in granule growth which is initially slow
followed by a gradual increase (Schaafsma et al. 1998; Jiménez et al. 2006).
Liquid feed rate and binder concentration affect granule growth rate (Jiménez et al.
2006; Hu et al. 2008). High amount of binder results in faster granule growth and larger
final granule size, although the increased viscosity reduces the amount of liquid penetration
(Bouffard et al. 2005). Binder available at the surface is of greater influence on granule
growth. Higher nozzle air velocity leads to more uniform liquid deposition and thus more
uniform granule growth (Becher and Schlünder 1997). Increased particle size decreases
particle growth rate (Saleh et al. 2003).
2.6.7 Interparticle forces in fluidisation
The interparticle forces causing cohesion mentioned in section 2.1.3 all affect the
fluidisation characteristics of particle systems (Visser 1989). In addition, sintering impairs
the quality of fluidisation (Seville et al. 2000). These are important to consider as improper
fluidisation might lead to impaired product quality. Adding liquid to a fluidised bed impairs
the fluidisation behaviour by forming liquid bridges and thus increasing particle cohesion
(Seville and Clift 1984; McLaughlin and Rhodes 2001; Forsyth et al. 2002, Bacelos et al.
2007). Increased amounts added and high liquid viscosity pronounces the fluidisation
impairment (McLaughlin and Rhodes 2001). Wider particle size distributions are more
affected by liquid content increase than monodisperse systems (Bacelos et al. 2007). Porous
materials are suggested to be able to retain more water without losing their fluidizability
(D’Amore et al. 1979). Electrostatic interactions are more pronounced with elevated
fluidising air velocity due to increased particle motion (Guardiola et al. 1996). Loss of electric
charges occurs due to conduction through the chamber wall or through moisture dissipating
the charge. Thus, fluidisation can be improved by increasing the inlet air RH. Still, in certain
cases increased RH impairs the fluidisation behaviour, as in the case of lactose in RH over 50%
(Schaafsma et al. 1999).
There have been different approaches to overcome the problems caused by high levels
of cohesion, such as using higher fluidising gas velocities (Zhou et al. 1999), aid of a magnetic
field (Guo et al. 2005), vibration or by large inert particles into the bed (Chen et al. 2008)
and adding fines, such as nanoparticles (Chen et al. 2008).
Aims of the study
19
3 Aims of the study
The aim of this thesis was to study coating and granulation of powders, and to
characterise the borderline between these by restricting the addition of moisture into the
particulate systems. In addition, the aim was to develop tools for characterising particle
systems modification processes.
More specifically, the aims of the present study were to:
improve the flow properties of poorly flowing ibuprofen by fluidised bed particle thin-
coating.
investigate the possibilities of using a novel ultrasound-assisted method for particle
thin-coating to achieve improved flow properties of ibuprofen.
control and restrict particle growth in a fluidised bed process by regulating
atomisation pressure and applying a pulsed liquid feed.
characterise the droplet and spray properties in situ in a fluidised bed process using
PTV coupled with diode laser stroboscopy (DLS).
study whether diffuse visible light transmitted through a dense powder bed carries
enough information on particle size and packing density of the sample for basic
process diagnostics.
Experimental
20
4 Experimental
4.1 Materials (I-V)
The materials used in the studies were ibuprofen (Ibuprofen 50, Boots Pharmaceuticals,
Nottingham, the United Kingdom), 2910-substituted hydroxypropyl methylcellulose (HPMC;
Methocel E5 Premium EV LP, Dow Chemical Company, Midland, USA), α-lactose
monohydrate (Pharmatose 200M, DMV, Veghel, The Netherlands), micronized anhydrous
caffeine (supplied by Orion Pharma, Espoo, Finland), anhydrous theophylline (supplied by
Orion Pharma, Espoo, Finland), polyvinylpyrrolidone (Kollidon® K25, BASF, Ludwigshafen,
Germany), Eudragit NE (Röhm GmbH & Co, KG, Pharma Polymers, Darmstadt, Germany),
microcrystalline cellulose (MCC) pellets (Cellets®, Syntapharm GmbH, Muelheim an der
Ruhr, Germany) and glass ballotini (Assistant Glasswarenfabrik, Karl Hecht GmbH & Co KG,
Sondheim, Germany and Jencons Ltd., Bedfordshire, England ).
4.2 Methods
4.2.1 Fluid bed powder processor (I,III,IV)
In studies I, III and IV the powder processing equipment used was an Aeromatic
STREA-1 laboratory scale fluidised bed powder processor (Aeromatic AG, Muttenz,
Switzerland) with a top-spray nozzle setup. The nozzle was a Schlick 970/7-1 pneumatic
external mixing two fluid nozzle (Düsen-Schlick GmbH, Untersiemau, Germany). The spray
angle width was set at position 3 on a scale of 1-5. The nozzle was mounted on an aluminium-
brass-tripod placed between the top of the chamber and the oscillating upper sieve. The
distance between the nozzle head and the perforated bottom plate was 340 mm. The powder
processor with instrumentation was connected to a PC and operated via InTouch–software
(Wonderware, Lake Forest, USA).
4.2.2 Fluid bed coating (I)
The coating liquid used was a 0.15 % (m/V) solution of HPMC. The ibuprofen powder
to be coated was sieved with a 1-mm sieve. The batch size was 300 g. The atomising pressure
was set to 0.5 bar and the air flow rate to 3.5 l/s, both empirically determined in preliminary
experiments.
All batches were processed in an ambient inlet air RH of 28±5 % measured with a
Vaisala HUMICAP® HMT100 humidity and temperature probe (Vaisala Oyj, Helsinki,
Finland). Before every experiment, the chamber was dried empty for 5 minutes with an inlet
air flow rate of 5 l/s and an inlet air temperature of 35 °C. The ibuprofen was mixed for six
minutes before initiating the spraying phase. During the mixing phase the inlet air flow rate
was increased from 2 l/s to 3.5 l/s by 0.5 l/s-increments every two minutes. To avoid
temperature peaks, the inlet air temperature was increased stepwise to the target
temperature.
The liquid feed rate and inlet air temperatures were varied between 0.42 g/min and
0.98 g/min and 20.9 °C and 49.1 °C, respectively, according to the experimental design
presented in section 4.2.16. The endpoint of the spraying phase was determined as the point
where a theoretical mass increase of 0.025 % was reached. The end point of the drying phase
was when the difference in RH between the inlet and outlet air was constant.
Experimental
21
4.2.3 Fluid bed granulation (III)
Prior to the granulations 100 g of anhydrous caffeine and 400 g lactose monohydrate
were sieved with a 1-mm sieve. Consequently, the batch size was 500 g. The binder liquid was
a 20 % (w/w) aqueous solution of polyvinyl pyrrolidone (Kollidon K-25). The duration of the
mixing phase was 2.5 minutes, during which the inlet air temperature was increased from
ambient room temperature to 40 °C, at which the spraying phase was performed. Controlling
the level of fluidisation was performed by keeping the pressure difference between below and
above the fluidisation chamber between 600 and 800 Pa. To achieve this, the air flow rates
were varied from 2 l/s to 12 l/s.
The spraying phase was performed by sequentially interrupted, i.e. pulsed, spray. The
spray was turned on and off in duty cycles (DC) consisting of equal parts of spray and lag
time. During the sequences with absence of spray the atomising pressure was kept constant
to avoid fluidisation irregularities. The liquid feed rate during the spray sequences was kept
at 2.5 g/min. As the target liquid consumption was 100 g, the spraying phase duration was 80
minutes, after which the drying phase was initiated and the inlet air temperature was
increased to 50 °C. The drying end-point criterion was a difference of 1 % in RH between inlet
and outlet air continuously for a full minute measured with a Vaisala HUMICAP® HMT100
humidity and temperature probe (Vaisala Oyj, Helsinki, Finland). The theophylline granules
were prepared in a fluidised bed granulator (Glatt WSG 5, Glatt GmbH, Binzen, Germany).
4.2.4 In situ fluid bed spray characterisation (IV)
To characterise the spray in a fluidised bed process in situ, process parameters
mimicking an actual process were chosen. Glass ballotini with a diameter 0f 10 mm were
placed in the chamber to function as an immobile heat reserving inlet air flow diffuser.
Purified water was used as spraying liquid. The inlet air temperature was set to 50 ˚C, the
inlet air flow was set at 6 l/s and the spray rate was kept at 2.5 g/min. As inlet air velocity and
temperature have been shown to affect droplet size, they were kept constant to isolate the
effect 0f atomisation pressure (Yuasa et al. 1996). The liquid temperature was at an ambient
21.6±0.4 ˚C. The images used in the spray characterisation were obtained through an
extension piece fitted into orifices drilled on the side of the chamber to avoid droplet
deposition on the imaging window. All orifices were air-insulated during measurement.
4.2.5 Ultrasound assisted powder coating (II)
120 g of ibuprofen powder was coated in an ultrasound assisted process with an
aqueous solution consisting of 0.15 % (m/V) HPMC. The coating solution was atomised with
a ultrasound nebulizer (Ultrasonic Nebulizer NE-U17, Ultra Air, Omron, Hoofddorp, The
Netherlands). The powder was transported to the ultrasonic mist by a vibratory feeder (Fritch
Laborette 24, Idar-Oberstein, Germany), and gravitationally deposited in a collector vessel.
This procedure was repeated to a total of 30 exposures to the ultrasonic mist. The powder in
the collector vessel was mixed at intervals by a stirrer (IKA®-Werke, RW 11 Basic, Staufen,
Germany) in order to prevent agglomeration. 20g samples were removed with an interval of
five full cycles. The setup is described in detail in Genina et al. 2009.
4.2.6 Measurement of flow properties (I,II)
The flow properties of ibuprofen in studies I and II were measured using an in-house
developed powder flow testing method especially designed for small amounts of poorly
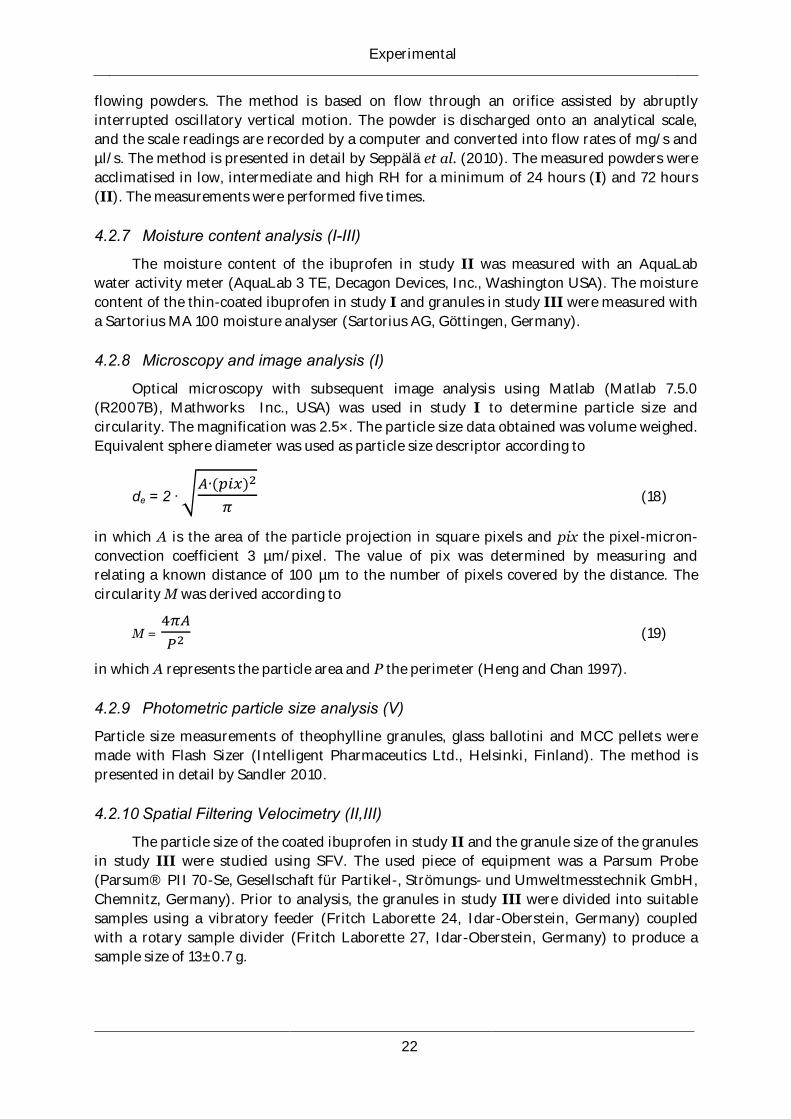
Experimental
22
flowing powders. The method is based on flow through an orifice assisted by abruptly
interrupted oscillatory vertical motion. The powder is discharged onto an analytical scale,
and the scale readings are recorded by a computer and converted into flow rates of mg/s and
µl/s. The method is presented in detail by Seppälä et al. (2010). The measured powders were
acclimatised in low, intermediate and high RH for a minimum of 24 hours (I) and 72 hours
(II). The measurements were performed five times.
4.2.7 Moisture content analysis (I-III)
The moisture content of the ibuprofen in study II was measured with an AquaLab
water activity meter (AquaLab 3 TE, Decagon Devices, Inc., Washington USA). The moisture
content of the thin-coated ibuprofen in study I and granules in study III were measured with
a Sartorius MA 100 moisture analyser (Sartorius AG, Göttingen, Germany).
4.2.8 Microscopy and image analysis (I)
Optical microscopy with subsequent image analysis using Matlab (Matlab 7.5.0
(R2007B), Mathworks Inc., USA) was used in study I to determine particle size and
circularity. The magnification was 2.5×. The particle size data obtained was volume weighed.
Equivalent sphere diameter was used as particle size descriptor according to
de = 2 ∙ √ ( )
(18)
in which A is the area of the particle projection in square pixels and pix the pixel-micron-
convection coefficient 3 µm/pixel. The value of pix was determined by measuring and
relating a known distance of 100 µm to the number of pixels covered by the distance. The
circularity M was derived according to
M =
(19)
in which A represents the particle area and P the perimeter (Heng and Chan 1997).
4.2.9 Photometric particle size analysis (V)
Particle size measurements of theophylline granules, glass ballotini and MCC pellets were
made with Flash Sizer (Intelligent Pharmaceutics Ltd., Helsinki, Finland). The method is
presented in detail by Sandler 2010.
4.2.10 Spatial Filtering Velocimetry (II,III)
The particle size of the coated ibuprofen in study II and the granule size of the granules
in study III were studied using SFV. The used piece of equipment was a Parsum Probe
(Parsum® PII 70-Se, Gesellschaft für Partikel-, Strömungs- und Umweltmesstechnik GmbH,
Chemnitz, Germany). Prior to analysis, the granules in study III were divided into suitable
samples using a vibratory feeder (Fritch Laborette 24, Idar-Oberstein, Germany) coupled
with a rotary sample divider (Fritch Laborette 27, Idar-Oberstein, Germany) to produce a
sample size of 13±0.7 g.
Experimental
23
4.2.11 Particle tracking velocimetry and droplet size analysis (IV)
Spray characteristics were measured using PTV and image analysis. Images were
obtained using a charge coupled device (CCD) (Lumenera, Ottawa, Canada) with an image
area of 9.3×6.95 mm (IV) and (V). The camera was positioned 170 mm from the vertical
central line of the spray. Each frame was exposed in triplicate by DLS (HiWatch, Oseir Ltd.,
Tampere, Finland). The DLS pulse duration was 100-200 and delay between pulses 50-80 µs.
The time-related parameters were chosen based on observed droplet speed.
PTV was performed using Osirec-software (Oseir Ltd., Tampere, Finland). Droplet size
data was obtained from the same images based on droplet diameter. Every measurement
consisted of 100 images. The lower limit of accurate measurement of the present setup was
18 µm. The method is presented more thoroughly by Larjo (2005).
4.2.12 X-ray powder diffractometry (I,II)
In studies I and II X-ray powder diffractometry was used (D8 Advance, Bruker AXS
GmbH, Karlsruhe, Germany) to exclude process induced changes in the studied material.
CuKα radiation and symmetric reflection mode (λ=1.54Å) with Göbel mirror optics was used.
The 2θ range was 5-40 ˚ with 0.05 ˚/s increments.
4.2.13 Scanning electron microscopy (I-III)
Scanning electron microscopy (SEM; Zeiss DSM 962, Carl Zeiss, Oberkochen, Germany)
was used to visualise particle size, morphology and surface morphology. The samples were
platinum coated by vacuum evaporation. Accelerated voltages of 8 kV (I and II) and 10 kV
(III) and magnifications of 200×, 2000× (I and II) and 500× (III) were used.
4.2.14 Atomic force microscopy (II)
An atomic force microscope (AFM; Autoprobe CP, Thermomicroscopes, Sunnivale,
California, USA) was used to study surface topography on an area of 5×5 µm. The AFM
measurements were performed in contact mode with a scanning rate of 0.5 Hz with a
cantilever with the spring constant 0.35 N/m. The measurements were performed in ambient
conditions. Based on the obtained data (n=6) the surface roughness parameter was
calculated.
4.2.15 Light transmission analysis (V)
Light transmission analysis was performed with a sample cuvette (15×15×100 mm)
placed between two diffusive lenses. The sample was illuminated with a light emitting diode
through a diffusive lens on the emitting side and the transmitted light was detected on the
opposite side of the sample through another diffusive lens. A phototransistor was used to
convert light to voltage proportionally to the intensity of the received light. The chamber was
slowly moved vertically between the illuminating and measuring heads and the light intensity
was recorded every 330 µm with tailor-made software (Hatara Consulting, Helsinki, Finland).
The apparatus for measuring the light transmission is shown schematically in Figure 5.
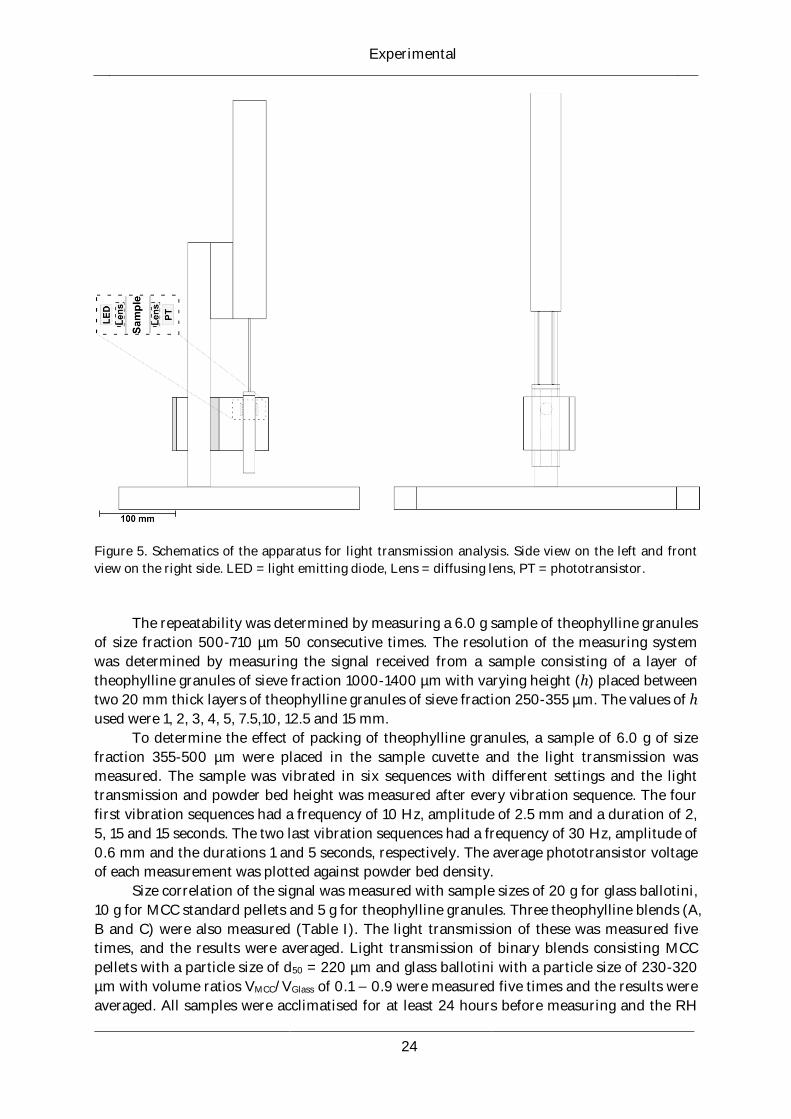
Experimental
24
Figure 5. Schematics of the apparatus for light transmission analysis. Side view on the left and front
view on the right side. LED = light emitting diode, Lens = diffusing lens, PT = phototransistor.
The repeatability was determined by measuring a 6.0 g sample of theophylline granules
of size fraction 500-710 µm 50 consecutive times. The resolution of the measuring system
was determined by measuring the signal received from a sample consisting of a layer of
theophylline granules of sieve fraction 1000-1400 µm with varying height (h) placed between
two 20 mm thick layers of theophylline granules of sieve fraction 250-355 µm. The values of h
used were 1, 2, 3, 4, 5, 7.5,10, 12.5 and 15 mm.
To determine the effect of packing of theophylline granules, a sample of 6.0 g of size
fraction 355-500 µm were placed in the sample cuvette and the light transmission was
measured. The sample was vibrated in six sequences with different settings and the light
transmission and powder bed height was measured after every vibration sequence. The four
first vibration sequences had a frequency of 10 Hz, amplitude of 2.5 mm and a duration of 2,
5, 15 and 15 seconds. The two last vibration sequences had a frequency of 30 Hz, amplitude of
0.6 mm and the durations 1 and 5 seconds, respectively. The average phototransistor voltage
of each measurement was plotted against powder bed density.
Size correlation of the signal was measured with sample sizes of 20 g for glass ballotini,
10 g for MCC standard pellets and 5 g for theophylline granules. Three theophylline blends (A,
B and C) were also measured (Table I). The light transmission of these was measured five
times, and the results were averaged. Light transmission of binary blends consisting MCC
pellets with a particle size of d50 = 220 µm and glass ballotini with a particle size of 230-320
µm with volume ratios VMCC/VGlass of 0.1 – 0.9 were measured five times and the results were
averaged. All samples were acclimatised for at least 24 hours before measuring and the RH
Experimental
25
(ambient) in the laboratory facilities during all measurements was 54 ± 4 % RH. The
obtained light intensity curves were refined further using MATLAB R2008a (Mathworks, Inc.,
Natick, MA, USA).
Table I. Compositions of three artificial distributions (A-C) of theophylline granules expressed in
grams (g). The percentage of fraction 180-250 µm for blends A, B and C are 8.3 %, 4.2 % and 0 %,
respectively.
Blend 180-250 µm 250-355µm 355-500µm 500-710µm
A 0.5 1.0 2.5 1.0
B 0.25 1.0 2.5 1.0
C 0 1.0 2.5 1.0
4.2.16 Experimental design (I,III,IV)
The experimental design in studies I, III, and IV was a full central composite design
constructed with MODDE 7 software (Umetrics Ab, Umeå, Sweden). The studied variables
and their ranges are presented in table II. The variable in study IV “distance from nozzle”
described in table II is shown in Figure 6 to alleviate visualisation of the chamber geometry.
Table II. The variables studied with full central composite design.
Study Variable Unit -α -1 0 +1 +α Explanation
I Inlet air temperature ˚C 21 25 35 45 49
Spray rate g/min 0.42 0.50 0.70 0.90 0.98
III Duty cycle length s 21 50 120 190 219
Atomisation pressure bar 0.42 0.50 0.70 0.90 0.98
Relative humidity % N/A N/A N/A N/A N/A Uncontrolled, added
retrospectively
IV Distance from nozzle mm 0 34 116 198 232 See Figure 6 for
schematics
Atomisation pressure bar 0.42 0.50 0.70 0.90 0.98
Relative humidity % N/A N/A N/A N/A N/A Uncontrolled, added
retrospectively
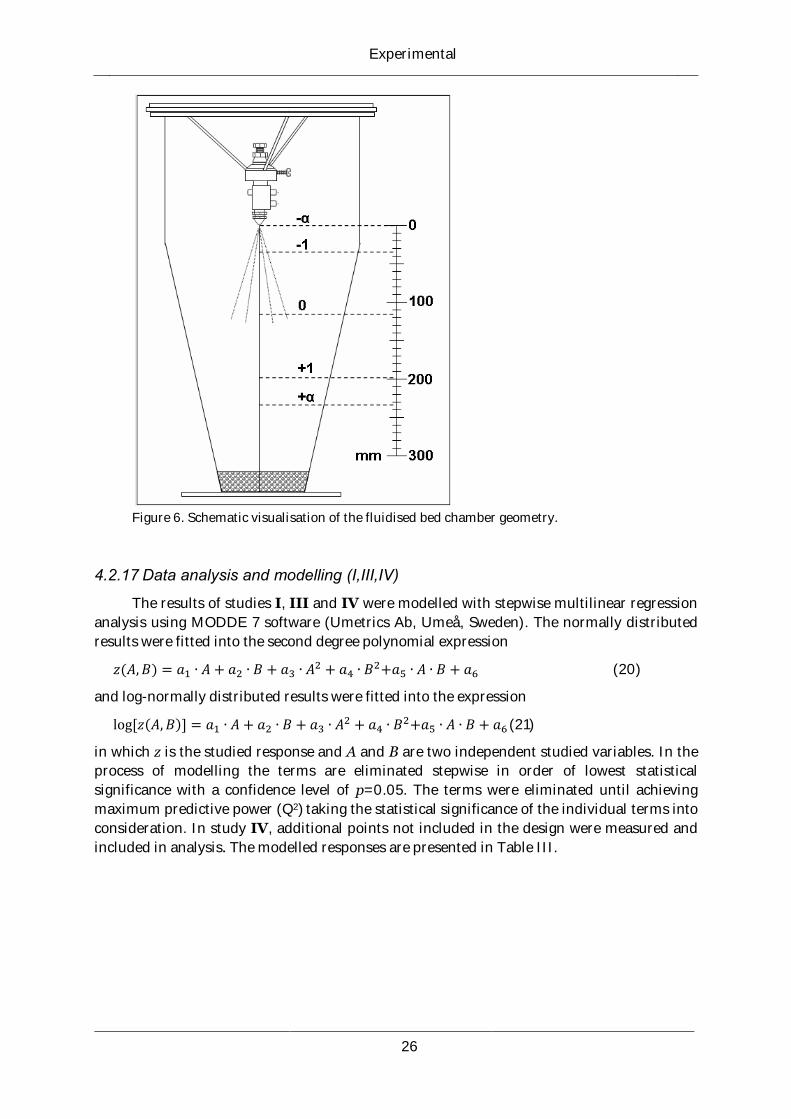
Experimental
26
Figure 6. Schematic visualisation of the fluidised bed chamber geometry.
4.2.17 Data analysis and modelling (I,III,IV)
The results of studies I, III and IV were modelled with stepwise multilinear regression
analysis using MODDE 7 software (Umetrics Ab, Umeå, Sweden). The normally distributed
results were fitted into the second degree polynomial expression
( ) (20)
and log-normally distributed results were fitted into the expression
( ) (21)
in which z is the studied response and A and B are two independent studied variables. In the
process of modelling the terms are eliminated stepwise in order of lowest statistical
significance with a confidence level of p=0.05. The terms were eliminated until achieving
maximum predictive power (Q2) taking the statistical significance of the individual terms into
consideration. In study IV, additional points not included in the design were measured and
included in analysis. The modelled responses are presented in Table III.
Results and discussion
27
Table III. The modelled responses in studies I, II and IV.
Study Response Unit Explanation
I flow rate mg/s
III d50 µm 50 % -fractile of granule size distribution
IV d10, d50, d90 µm 10, 50 and 90 % -fractiles of droplet size distribution
v10, v50, v90 m/s 10, 50 and 90 % -fractiles of droplet speed distribution
a10, a50, a90 degrees 10, 50 and 90 % -fractiles of droplet trajectory angle distribution
n N/A Droplet count
m fg sum of mass of droplets
The data obtained in the analysis of flow properties (I) was subjected to one-way
analysis of variance (ANOVA) with subsequent analysis by Tukey’s Multiple Comparisons
Test using GraphPadPrism Software (GraphPad Software Inc., California, USA).
5 Results and discussion
5.1 General remarks
This research clearly shows the possibilities of taking advantage of interfacial
phenomena in both processing of powders and also characterising these processes to achieve
thin coatings or restrict granule growth to nucleation. In addition to this, the research shows
that coating can be done with top-spray systems with small particles in contradiction to
previous reports in the literature (Dewettinck and Huyghebaert 1998). The research brings
new insight into the effects of pulsed liquid feed on granule growth, and shows that increased
inlet air RH does not always result in larger granules, as previously stated by e.g. Närvänen et
al. (2008).
The present thesis also applied the latest advanced technologies in spray
characterisation in situ in a fluidised bed process, and showed that in a process environment
droplet coalescence occurs. Droplet speed data was in contradiction to what has previously
been reported (Mueller and Kleinebudde 2007), but direct comparison to previous findings is
not possible as the present study is the first of its kind performed in situ. Light transmitted
through dense packed powder beds was found to be a promising tool in basic particle systems
characterisation, which has previously only been presented by implication.
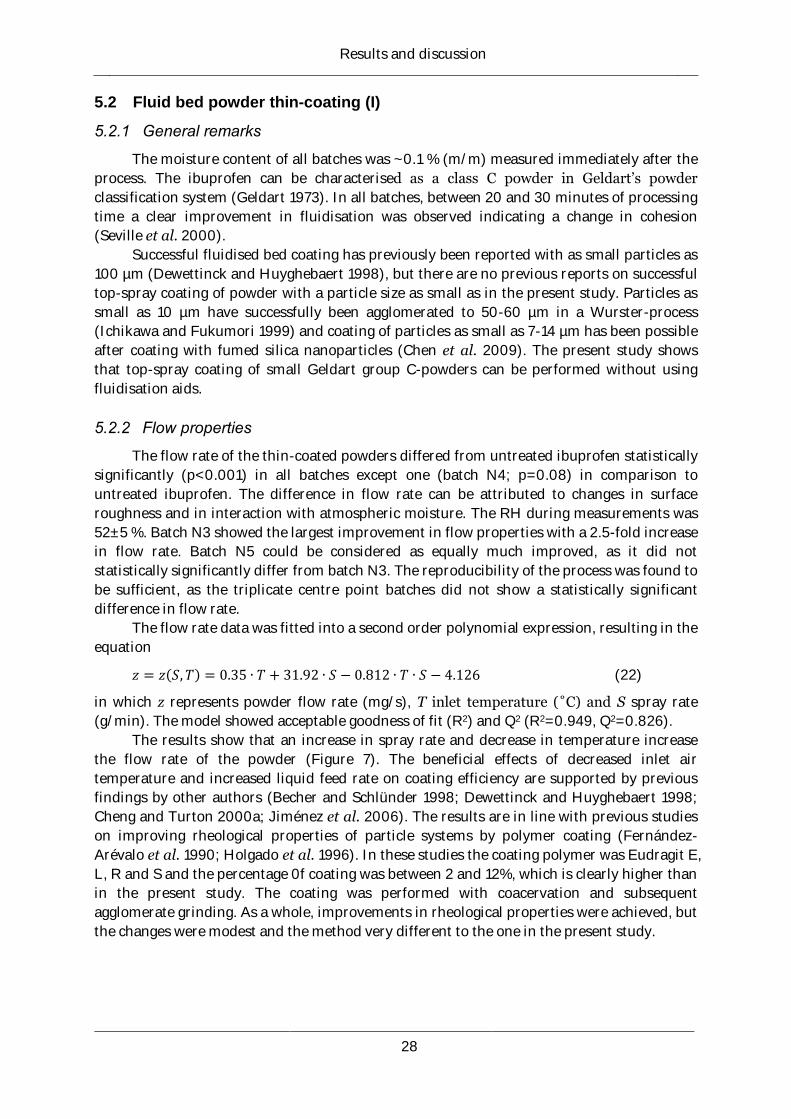
Results and discussion
28
5.2 Fluid bed powder thin-coating (I)
5.2.1 General remarks
The moisture content of all batches was ~0.1 % (m/m) measured immediately after the
process. The ibuprofen can be characterised as a class C powder in Geldart’s powder
classification system (Geldart 1973). In all batches, between 20 and 30 minutes of processing
time a clear improvement in fluidisation was observed indicating a change in cohesion
(Seville et al. 2000).
Successful fluidised bed coating has previously been reported with as small particles as
100 µm (Dewettinck and Huyghebaert 1998), but there are no previous reports on successful
top-spray coating of powder with a particle size as small as in the present study. Particles as
small as 10 µm have successfully been agglomerated to 50-60 µm in a Wurster-process
(Ichikawa and Fukumori 1999) and coating of particles as small as 7-14 µm has been possible
after coating with fumed silica nanoparticles (Chen et al. 2009). The present study shows
that top-spray coating of small Geldart group C-powders can be performed without using
fluidisation aids.
5.2.2 Flow properties
The flow rate of the thin-coated powders differed from untreated ibuprofen statistically
significantly (p<0.001) in all batches except one (batch N4; p=0.08) in comparison to
untreated ibuprofen. The difference in flow rate can be attributed to changes in surface
roughness and in interaction with atmospheric moisture. The RH during measurements was
52±5 %. Batch N3 showed the largest improvement in flow properties with a 2.5-fold increase
in flow rate. Batch N5 could be considered as equally much improved, as it did not
statistically significantly differ from batch N3. The reproducibility of the process was found to
be sufficient, as the triplicate centre point batches did not show a statistically significant
difference in flow rate.
The flow rate data was fitted into a second order polynomial expression, resulting in the
equation
( ) (22)
in which z represents powder flow rate (mg/s), T inlet temperature (˚C) and S spray rate
(g/min). The model showed acceptable goodness of fit (R2) and Q2 (R2=0.949, Q2=0.826).
The results show that an increase in spray rate and decrease in temperature increase
the flow rate of the powder (Figure 7). The beneficial effects of decreased inlet air
temperature and increased liquid feed rate on coating efficiency are supported by previous
findings by other authors (Becher and Schlünder 1998; Dewettinck and Huyghebaert 1998;
Cheng and Turton 2000a; Jiménez et al. 2006). The results are in line with previous studies
on improving rheological properties of particle systems by polymer coating (Fernández-
Arévalo et al. 1990; Holgado et al. 1996). In these studies the coating polymer was Eudragit E,
L, R and S and the percentage 0f coating was between 2 and 12%, which is clearly higher than
in the present study. The coating was performed with coacervation and subsequent
agglomerate grinding. As a whole, improvements in rheological properties were achieved, but
the changes were modest and the method very different to the one in the present study.
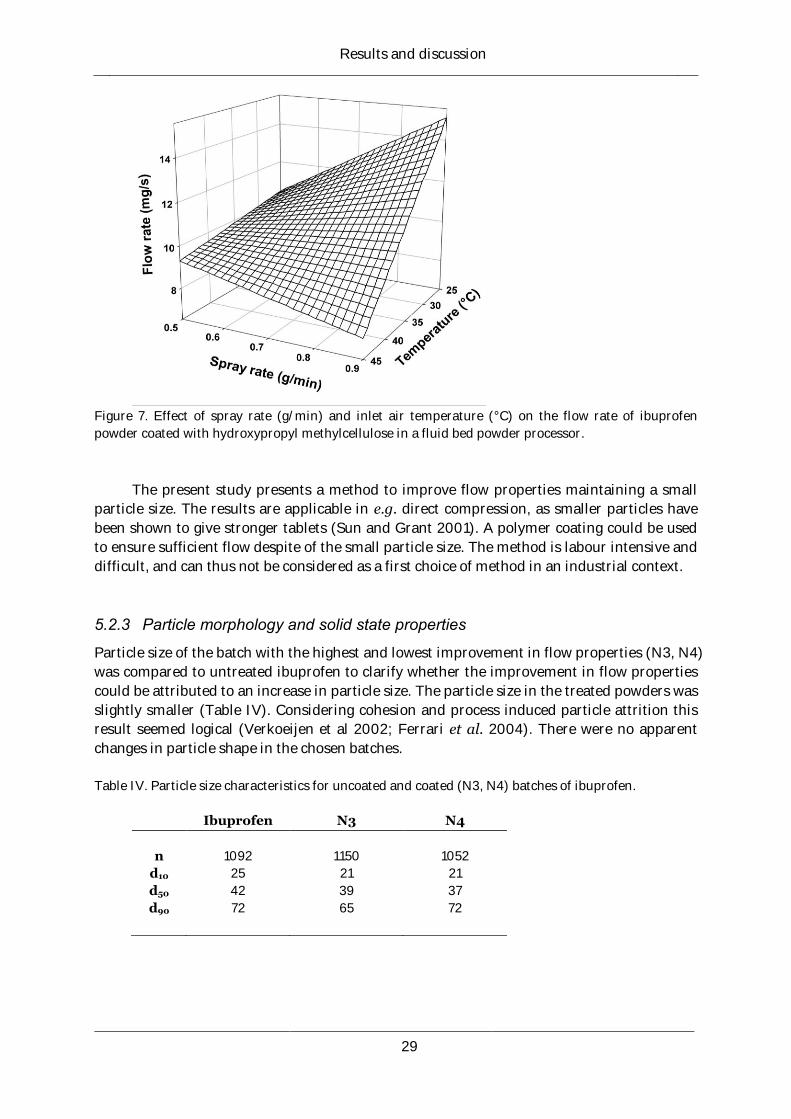
Results and discussion
29
Figure 7. Effect of spray rate (g/min) and inlet air temperature (°C) on the flow rate of ibuprofen
powder coated with hydroxypropyl methylcellulose in a fluid bed powder processor.
The present study presents a method to improve flow properties maintaining a small
particle size. The results are applicable in e.g. direct compression, as smaller particles have
been shown to give stronger tablets (Sun and Grant 2001). A polymer coating could be used
to ensure sufficient flow despite of the small particle size. The method is labour intensive and
difficult, and can thus not be considered as a first choice of method in an industrial context.
5.2.3 Particle morphology and solid state properties
Particle size of the batch with the highest and lowest improvement in flow properties (N3, N4)
was compared to untreated ibuprofen to clarify whether the improvement in flow properties
could be attributed to an increase in particle size. The particle size in the treated powders was
slightly smaller (Table IV). Considering cohesion and process induced particle attrition this
result seemed logical (Verkoeijen et al 2002; Ferrari et al. 2004). There were no apparent
changes in particle shape in the chosen batches.
Table IV. Particle size characteristics for uncoated and coated (N3, N4) batches of ibuprofen.
Ibuprofen N3 N4
n 1092 1150 1052
d10 25 21 21
d50 42 39 37
d90 72 65 72
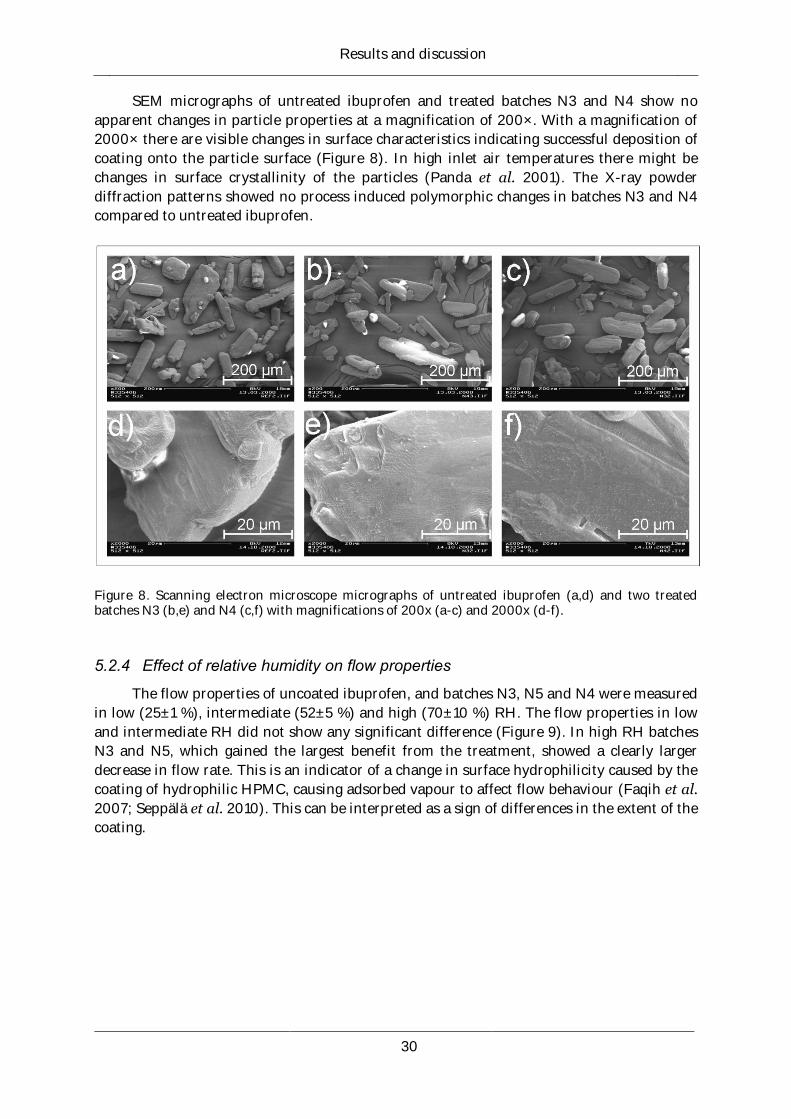
Results and discussion
30
SEM micrographs of untreated ibuprofen and treated batches N3 and N4 show no
apparent changes in particle properties at a magnification of 200×. With a magnification of
2000× there are visible changes in surface characteristics indicating successful deposition of
coating onto the particle surface (Figure 8). In high inlet air temperatures there might be
changes in surface crystallinity of the particles (Panda et al. 2001). The X-ray powder
diffraction patterns showed no process induced polymorphic changes in batches N3 and N4
compared to untreated ibuprofen.
Figure 8. Scanning electron microscope micrographs of untreated ibuprofen (a,d) and two treated batches N3 (b,e) and N4 (c,f) with magnifications of 200x (a-c) and 2000x (d-f).
5.2.4 Effect of relative humidity on flow properties
The flow properties of uncoated ibuprofen, and batches N3, N5 and N4 were measured
in low (25±1 %), intermediate (52±5 %) and high (70±10 %) RH. The flow properties in low
and intermediate RH did not show any significant difference (Figure 9). In high RH batches
N3 and N5, which gained the largest benefit from the treatment, showed a clearly larger
decrease in flow rate. This is an indicator of a change in surface hydrophilicity caused by the
coating of hydrophilic HPMC, causing adsorbed vapour to affect flow behaviour (Faqih et al.
2007; Seppälä et al. 2010). This can be interpreted as a sign of differences in the extent of the
coating.
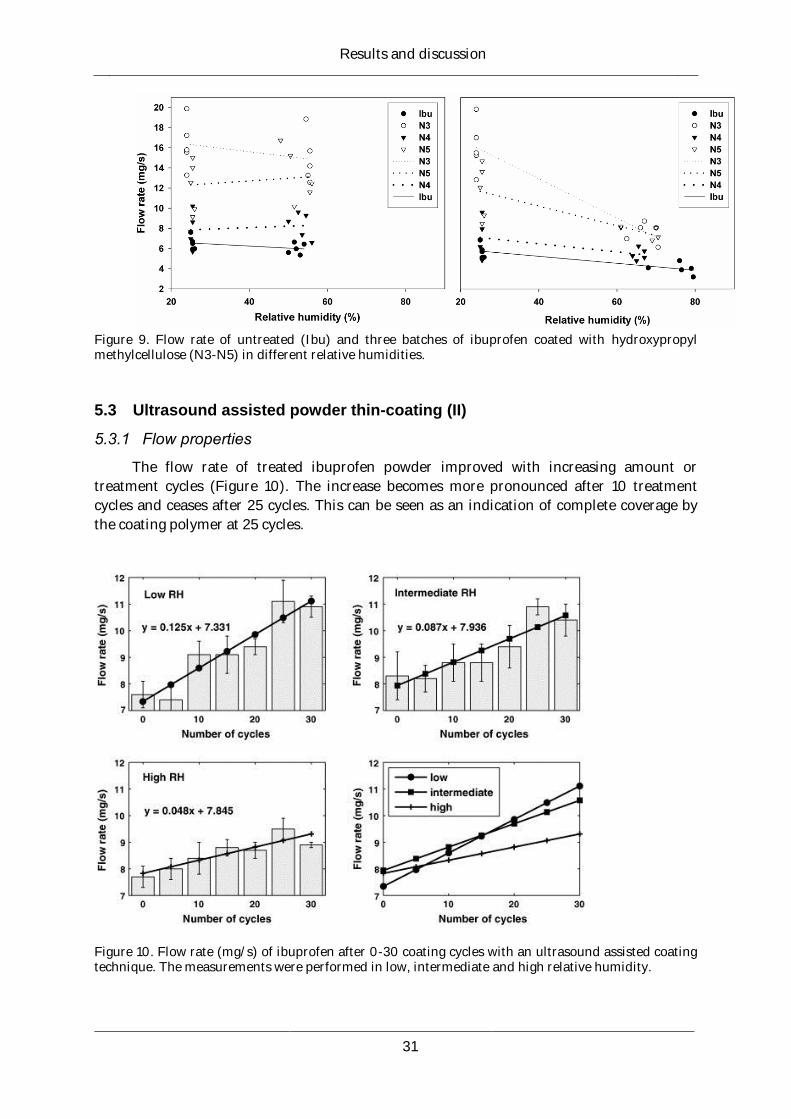
Results and discussion
31
Figure 9. Flow rate of untreated (Ibu) and three batches of ibuprofen coated with hydroxypropyl methylcellulose (N3-N5) in different relative humidities.
5.3 Ultrasound assisted powder thin-coating (II)
5.3.1 Flow properties
The flow rate of treated ibuprofen powder improved with increasing amount or
treatment cycles (Figure 10). The increase becomes more pronounced after 10 treatment
cycles and ceases after 25 cycles. This can be seen as an indication of complete coverage by
the coating polymer at 25 cycles.
Figure 10. Flow rate (mg/s) of ibuprofen after 0-30 coating cycles with an ultrasound assisted coating technique. The measurements were performed in low, intermediate and high relative humidity.
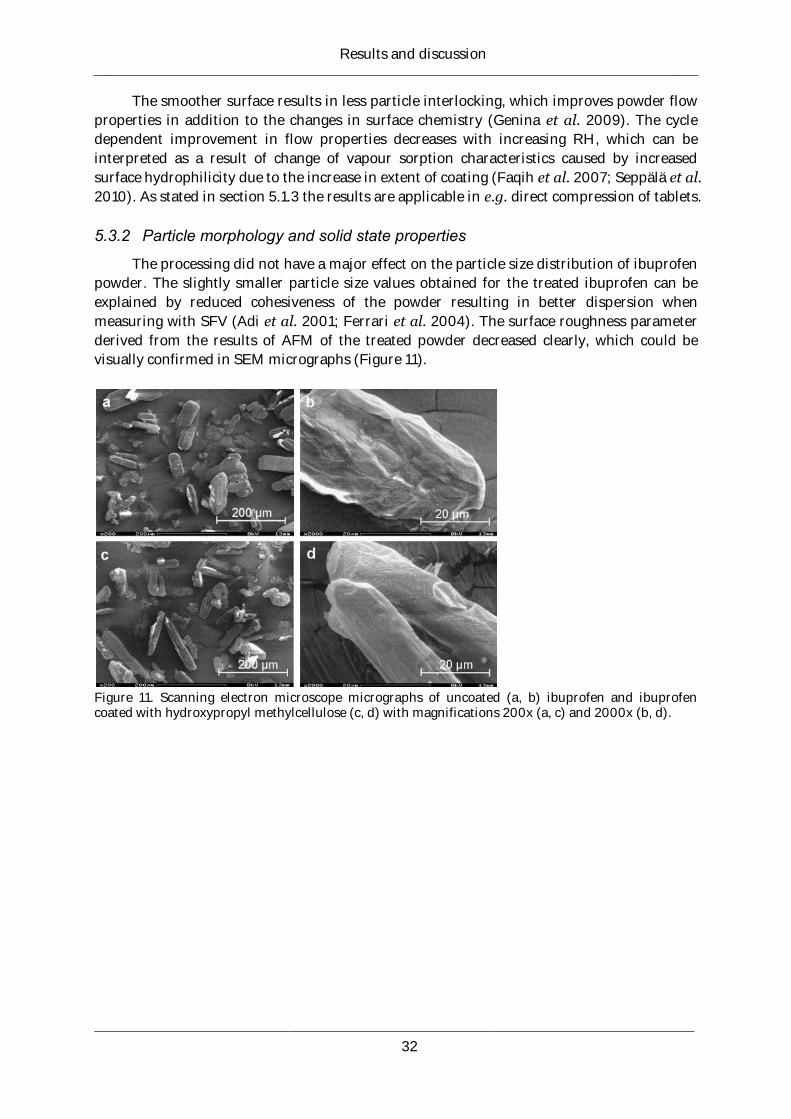
Results and discussion
32
The smoother surface results in less particle interlocking, which improves powder flow
properties in addition to the changes in surface chemistry (Genina et al. 2009). The cycle
dependent improvement in flow properties decreases with increasing RH, which can be
interpreted as a result of change of vapour sorption characteristics caused by increased
surface hydrophilicity due to the increase in extent of coating (Faqih et al. 2007; Seppälä et al.
2010). As stated in section 5.1.3 the results are applicable in e.g. direct compression of tablets.
5.3.2 Particle morphology and solid state properties
The processing did not have a major effect on the particle size distribution of ibuprofen
powder. The slightly smaller particle size values obtained for the treated ibuprofen can be
explained by reduced cohesiveness of the powder resulting in better dispersion when
measuring with SFV (Adi et al. 2001; Ferrari et al. 2004). The surface roughness parameter
derived from the results of AFM of the treated powder decreased clearly, which could be
visually confirmed in SEM micrographs (Figure 11).
Figure 11. Scanning electron microscope micrographs of uncoated (a, b) ibuprofen and ibuprofen coated with hydroxypropyl methylcellulose (c, d) with magnifications 200x (a, c) and 2000x (b, d).
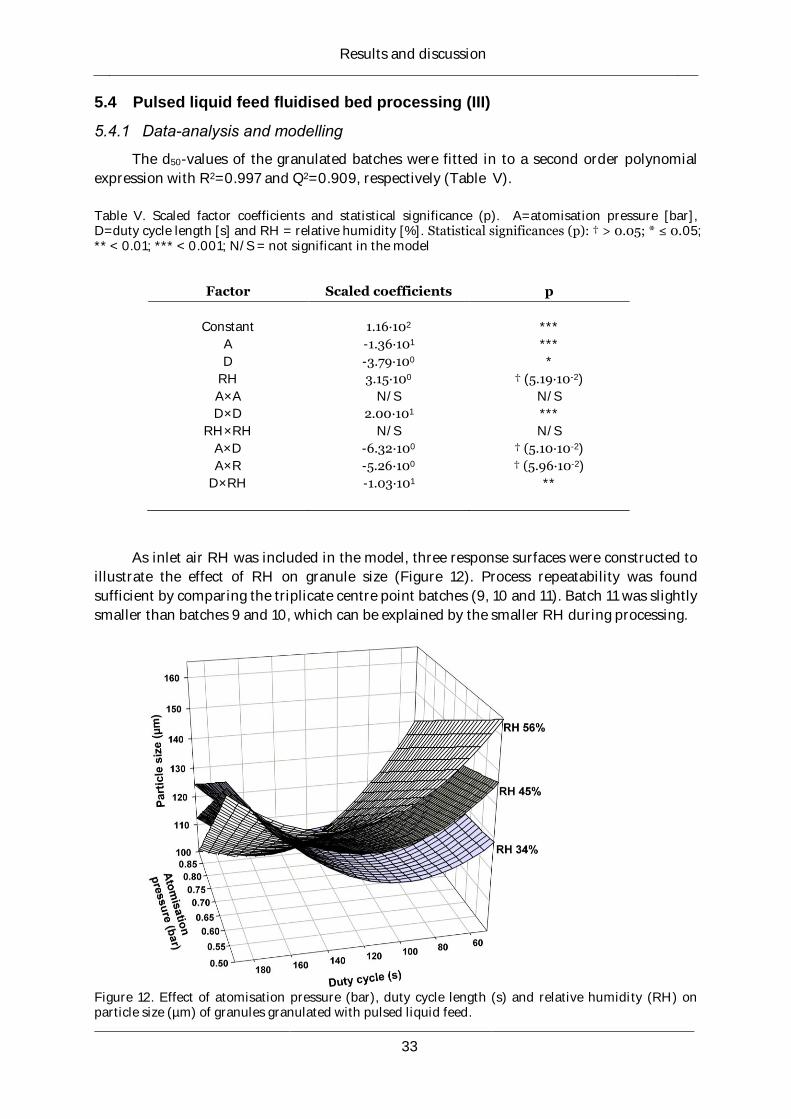
Results and discussion
33
5.4 Pulsed liquid feed fluidised bed processing (III)
5.4.1 Data-analysis and modelling
The d50-values of the granulated batches were fitted in to a second order polynomial
expression with R2=0.997 and Q2=0.909, respectively (Table V).
Table V. Scaled factor coefficients and statistical significance (p). A=atomisation pressure [bar], D=duty cycle length [s] and RH = relative humidity [%]. Statistical significances (p): † > 0.05; * ≤ 0.05; ** < 0.01; *** < 0.001; N/S = not significant in the model
Factor Scaled coefficients p
Constant 1.16∙102 ***
A -1.36∙101 ***
D -3.79∙100 *
RH 3.15∙100 † (5.19∙10-2)
A×A N/S N/S
D×D 2.00∙101 ***
RH×RH N/S N/S
A×D -6.32∙100 † (5.10∙10-2)
A×R -5.26∙100 † (5.96∙10-2)
D×RH -1.03∙101 **
As inlet air RH was included in the model, three response surfaces were constructed to
illustrate the effect of RH on granule size (Figure 12). Process repeatability was found
sufficient by comparing the triplicate centre point batches (9, 10 and 11). Batch 11 was slightly
smaller than batches 9 and 10, which can be explained by the smaller RH during processing.
Figure 12. Effect of atomisation pressure (bar), duty cycle length (s) and relative humidity (RH) on particle size (µm) of granules granulated with pulsed liquid feed.
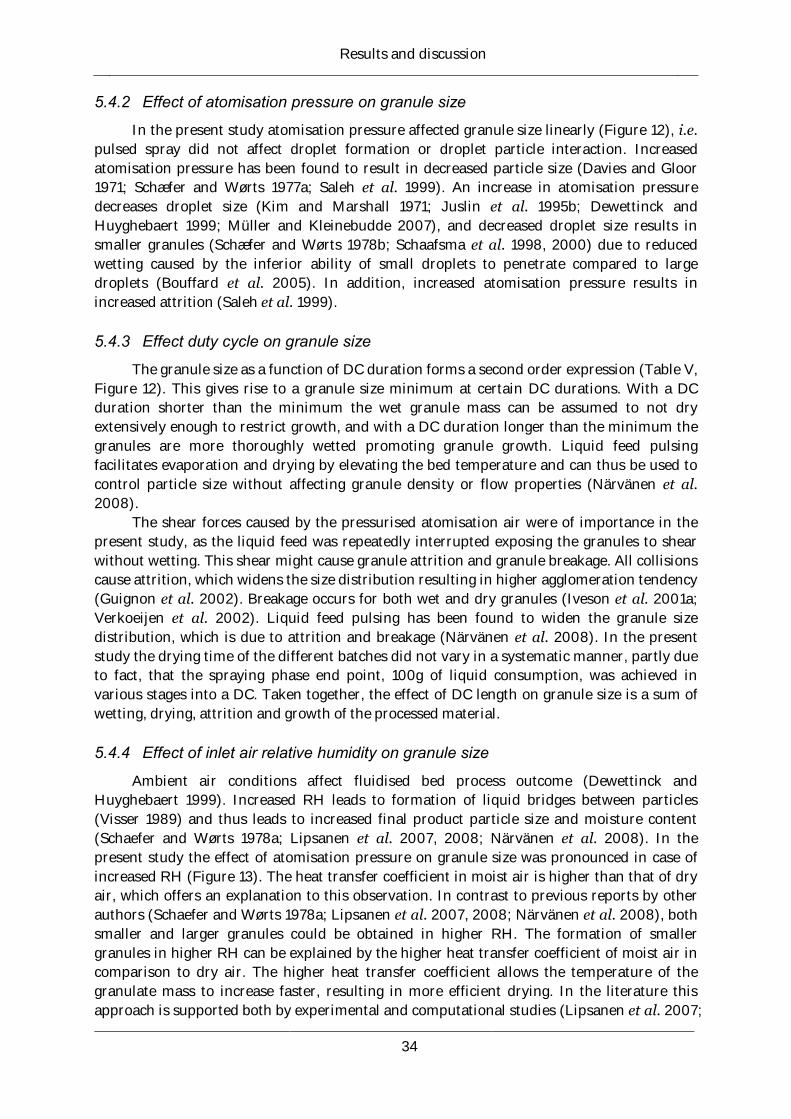
Results and discussion
34
5.4.2 Effect of atomisation pressure on granule size
In the present study atomisation pressure affected granule size linearly (Figure 12), i.e.
pulsed spray did not affect droplet formation or droplet particle interaction. Increased
atomisation pressure has been found to result in decreased particle size (Davies and Gloor
1971; Schæfer and Wørts 1977a; Saleh et al. 1999). An increase in atomisation pressure
decreases droplet size (Kim and Marshall 1971; Juslin et al. 1995b; Dewettinck and
Huyghebaert 1999; Müller and Kleinebudde 2007), and decreased droplet size results in
smaller granules (Schæfer and Wørts 1978b; Schaafsma et al. 1998, 2000) due to reduced
wetting caused by the inferior ability of small droplets to penetrate compared to large
droplets (Bouffard et al. 2005). In addition, increased atomisation pressure results in
increased attrition (Saleh et al. 1999).
5.4.3 Effect duty cycle on granule size
The granule size as a function of DC duration forms a second order expression (Table V,
Figure 12). This gives rise to a granule size minimum at certain DC durations. With a DC
duration shorter than the minimum the wet granule mass can be assumed to not dry
extensively enough to restrict growth, and with a DC duration longer than the minimum the
granules are more thoroughly wetted promoting granule growth. Liquid feed pulsing
facilitates evaporation and drying by elevating the bed temperature and can thus be used to
control particle size without affecting granule density or flow properties (Närvänen et al.
2008).
The shear forces caused by the pressurised atomisation air were of importance in the
present study, as the liquid feed was repeatedly interrupted exposing the granules to shear
without wetting. This shear might cause granule attrition and granule breakage. All collisions
cause attrition, which widens the size distribution resulting in higher agglomeration tendency
(Guignon et al. 2002). Breakage occurs for both wet and dry granules (Iveson et al. 2001a;
Verkoeijen et al. 2002). Liquid feed pulsing has been found to widen the granule size
distribution, which is due to attrition and breakage (Närvänen et al. 2008). In the present
study the drying time of the different batches did not vary in a systematic manner, partly due
to fact, that the spraying phase end point, 100g of liquid consumption, was achieved in
various stages into a DC. Taken together, the effect of DC length on granule size is a sum of
wetting, drying, attrition and growth of the processed material.
5.4.4 Effect of inlet air relative humidity on granule size
Ambient air conditions affect fluidised bed process outcome (Dewettinck and
Huyghebaert 1999). Increased RH leads to formation of liquid bridges between particles
(Visser 1989) and thus leads to increased final product particle size and moisture content
(Schaefer and Wørts 1978a; Lipsanen et al. 2007, 2008; Närvänen et al. 2008). In the
present study the effect of atomisation pressure on granule size was pronounced in case of
increased RH (Figure 13). The heat transfer coefficient in moist air is higher than that of dry
air, which offers an explanation to this observation. In contrast to previous reports by other
authors (Schaefer and Wørts 1978a; Lipsanen et al. 2007, 2008; Närvänen et al. 2008), both
smaller and larger granules could be obtained in higher RH. The formation of smaller
granules in higher RH can be explained by the higher heat transfer coefficient of moist air in
comparison to dry air. The higher heat transfer coefficient allows the temperature of the
granulate mass to increase faster, resulting in more efficient drying. In the literature this
approach is supported both by experimental and computational studies (Lipsanen et al. 2007;
Results and discussion
35
Wang et al. 2007). The pulsed liquid feed is essential in the presented approach, as increased
RH has been proven to increase drying time in more conventional processes (Wang et al.
2007). Higher RH is also known to decrease the amount of electrostatic interaction (Bailey
1984; Guardiola et al. 1996), which also contributes to regulating particle growth. Taken
together, the present study confirms that liquid feed pulsing can be used to regulate granule
growth and to compensate for changes in inlet air RH (Närvänen et al. 2008). In addition, it
strengthens the knowledge of the effects of RH on granule growth and brings further insight
into the possibilities of pulsed liquid feed in granule growth regulation.
Figure 13. Effect of atomisation pressure (bar), duty cycle length (s) and relative humidity (RH) on particle size (µm) of granules granulated with pulsed liquid feed.
5.5 In situ spray characterisation (IV)
5.5.1 Modelling
The results were fitted in a second order polynomial expression. Droplet size and
trajectory angle characteristics were normally distributed and droplet speed, droplet count
and sum of droplet mass were log-normally distributed. The results show that DLS coupled
with PTV is a suitable tool for measuring spray characteristics. Droplet velocity was not
modelled, but droplet speed, as the obtained images contain data only on droplet dislocation,
not direction of movement. For the same reason, droplet turbulence was modelled as
trajectory angle, i.e. the difference in direction of movement in comparison to the vertical
central axis of the spray.
5.5.2 Sum of mass and droplet count
The mass of the droplets was calculated and summed to give an estimate of the
moisture profile along the vertical central axis of the spray. The mass of the droplets gave
models with a R2=0.954 and Q2=0.919. The sum of masses decreases with increasing
atomisation pressure and distance from the nozzle (Figure 14), which is in accordance with
the literature (Mueller and Kleinebudde 2007). Implications of this has been found in
granule properties; when decreasing the nozzle height the granule size has been reported to
increase as friability decreases (Davies and Gloor 1971).
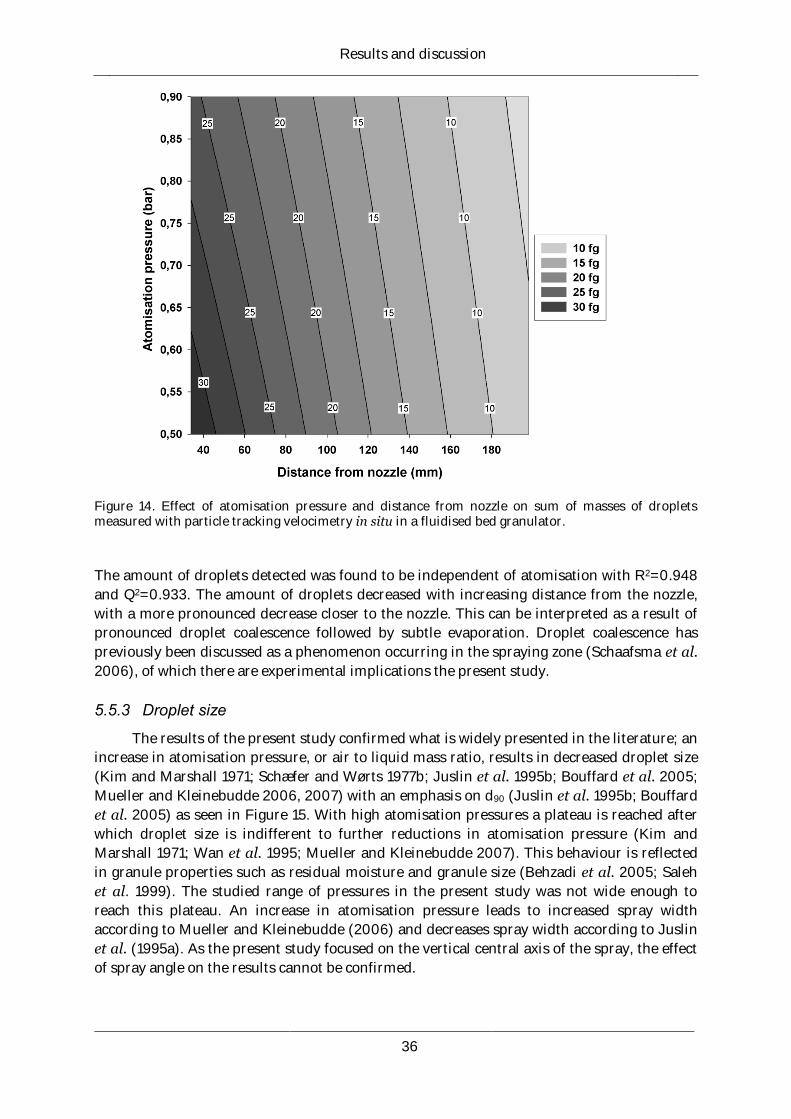
Results and discussion
36
Figure 14. Effect of atomisation pressure and distance from nozzle on sum of masses of droplets measured with particle tracking velocimetry in situ in a fluidised bed granulator.
The amount of droplets detected was found to be independent of atomisation with R2=0.948
and Q2=0.933. The amount of droplets decreased with increasing distance from the nozzle,
with a more pronounced decrease closer to the nozzle. This can be interpreted as a result of
pronounced droplet coalescence followed by subtle evaporation. Droplet coalescence has
previously been discussed as a phenomenon occurring in the spraying zone (Schaafsma et al.
2006), of which there are experimental implications the present study.
5.5.3 Droplet size
The results of the present study confirmed what is widely presented in the literature; an
increase in atomisation pressure, or air to liquid mass ratio, results in decreased droplet size
(Kim and Marshall 1971; Schæfer and Wørts 1977b; Juslin et al. 1995b; Bouffard et al. 2005;
Mueller and Kleinebudde 2006, 2007) with an emphasis on d90 (Juslin et al. 1995b; Bouffard
et al. 2005) as seen in Figure 15. With high atomisation pressures a plateau is reached after
which droplet size is indifferent to further reductions in atomisation pressure (Kim and
Marshall 1971; Wan et al. 1995; Mueller and Kleinebudde 2007). This behaviour is reflected
in granule properties such as residual moisture and granule size (Behzadi et al. 2005; Saleh
et al. 1999). The studied range of pressures in the present study was not wide enough to
reach this plateau. An increase in atomisation pressure leads to increased spray width
according to Mueller and Kleinebudde (2006) and decreases spray width according to Juslin
et al. (1995a). As the present study focused on the vertical central axis of the spray, the effect
of spray angle on the results cannot be confirmed.
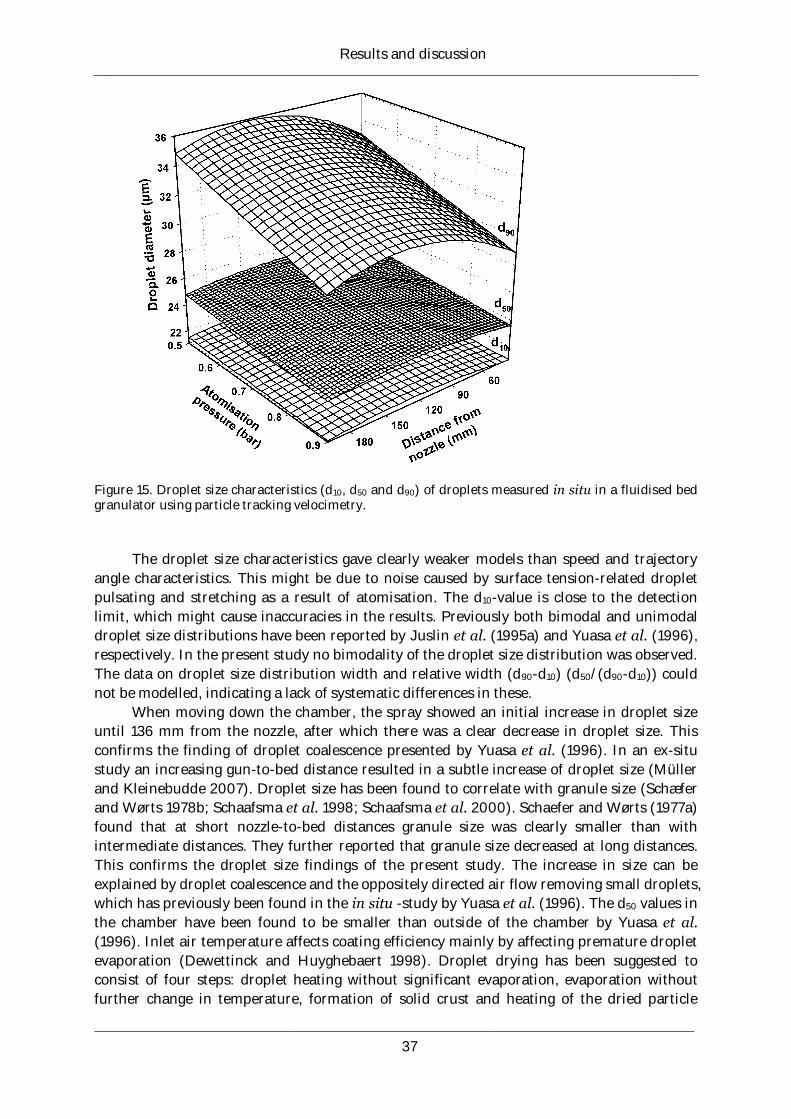
Results and discussion
37
Figure 15. Droplet size characteristics (d10, d50 and d90) of droplets measured in situ in a fluidised bed granulator using particle tracking velocimetry.
The droplet size characteristics gave clearly weaker models than speed and trajectory
angle characteristics. This might be due to noise caused by surface tension-related droplet
pulsating and stretching as a result of atomisation. The d10-value is close to the detection
limit, which might cause inaccuracies in the results. Previously both bimodal and unimodal
droplet size distributions have been reported by Juslin et al. (1995a) and Yuasa et al. (1996),
respectively. In the present study no bimodality of the droplet size distribution was observed.
The data on droplet size distribution width and relative width (d90-d10) (d50/(d90-d10)) could
not be modelled, indicating a lack of systematic differences in these.
When moving down the chamber, the spray showed an initial increase in droplet size
until 136 mm from the nozzle, after which there was a clear decrease in droplet size. This
confirms the finding of droplet coalescence presented by Yuasa et al. (1996). In an ex-situ
study an increasing gun-to-bed distance resulted in a subtle increase of droplet size (Müller
and Kleinebudde 2007). Droplet size has been found to correlate with granule size (Schæfer
and Wørts 1978b; Schaafsma et al. 1998; Schaafsma et al. 2000). Schaefer and Wørts (1977a)
found that at short nozzle-to-bed distances granule size was clearly smaller than with
intermediate distances. They further reported that granule size decreased at long distances.
This confirms the droplet size findings of the present study. The increase in size can be
explained by droplet coalescence and the oppositely directed air flow removing small droplets,
which has previously been found in the in situ -study by Yuasa et al. (1996). The d50 values in
the chamber have been found to be smaller than outside of the chamber by Yuasa et al.
(1996). Inlet air temperature affects coating efficiency mainly by affecting premature droplet
evaporation (Dewettinck and Huyghebaert 1998). Droplet drying has been suggested to
consist of four steps: droplet heating without significant evaporation, evaporation without
further change in temperature, formation of solid crust and heating of the dried particle
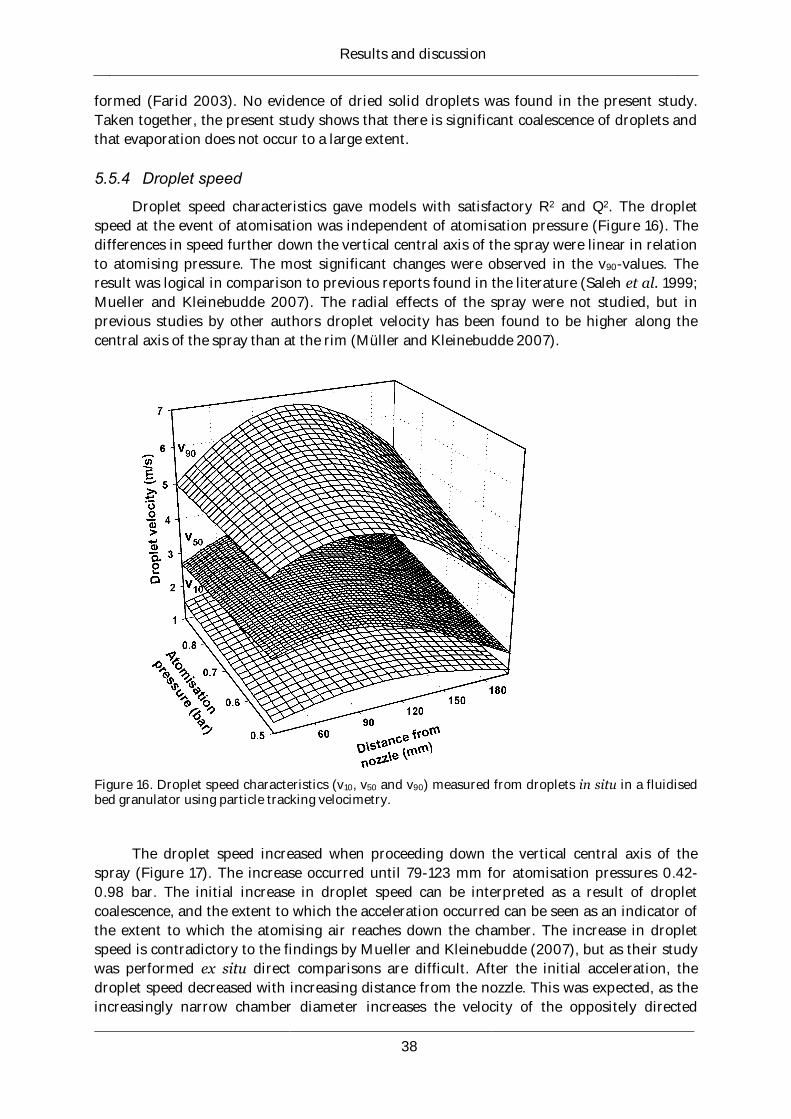
Results and discussion
38
formed (Farid 2003). No evidence of dried solid droplets was found in the present study.
Taken together, the present study shows that there is significant coalescence of droplets and
that evaporation does not occur to a large extent.
5.5.4 Droplet speed
Droplet speed characteristics gave models with satisfactory R2 and Q2. The droplet
speed at the event of atomisation was independent of atomisation pressure (Figure 16). The
differences in speed further down the vertical central axis of the spray were linear in relation
to atomising pressure. The most significant changes were observed in the v90-values. The
result was logical in comparison to previous reports found in the literature (Saleh et al. 1999;
Mueller and Kleinebudde 2007). The radial effects of the spray were not studied, but in
previous studies by other authors droplet velocity has been found to be higher along the
central axis of the spray than at the rim (Müller and Kleinebudde 2007).
Figure 16. Droplet speed characteristics (v10, v50 and v90) measured from droplets in situ in a fluidised bed granulator using particle tracking velocimetry.
The droplet speed increased when proceeding down the vertical central axis of the
spray (Figure 17). The increase occurred until 79-123 mm for atomisation pressures 0.42-
0.98 bar. The initial increase in droplet speed can be interpreted as a result of droplet
coalescence, and the extent to which the acceleration occurred can be seen as an indicator of
the extent to which the atomising air reaches down the chamber. The increase in droplet
speed is contradictory to the findings by Mueller and Kleinebudde (2007), but as their study
was performed ex situ direct comparisons are difficult. After the initial acceleration, the
droplet speed decreased with increasing distance from the nozzle. This was expected, as the
increasingly narrow chamber diameter increases the velocity of the oppositely directed
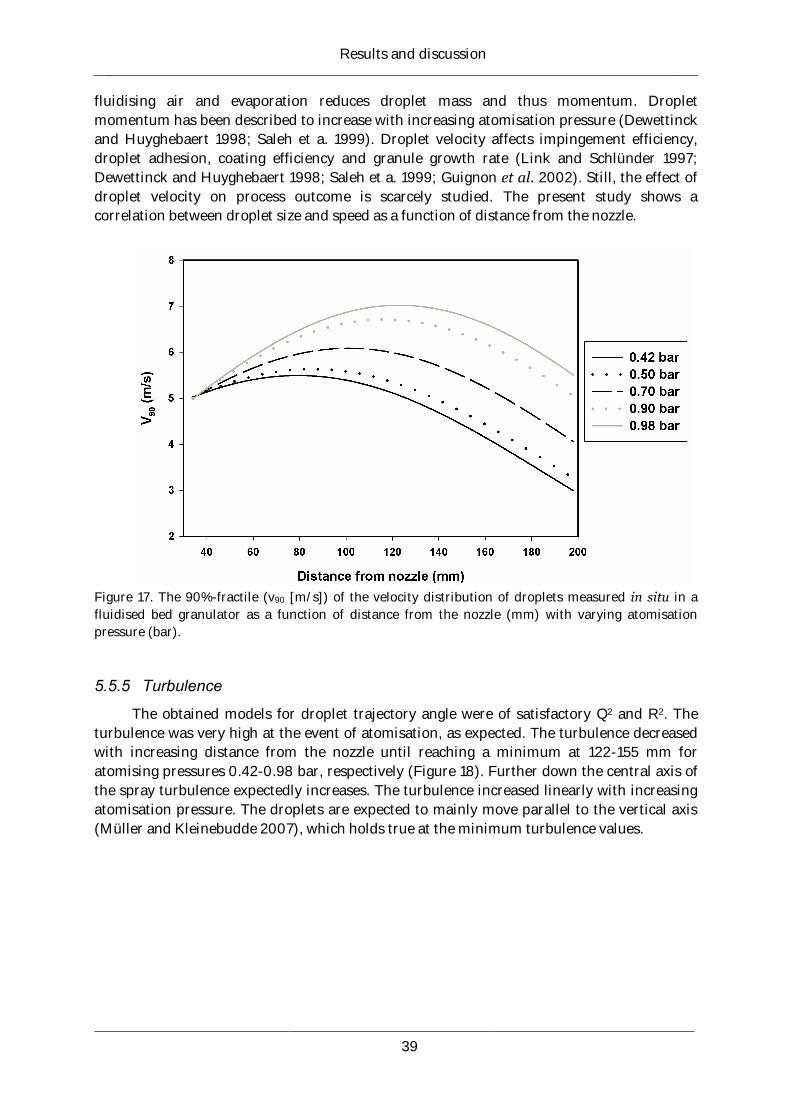
Results and discussion
39
fluidising air and evaporation reduces droplet mass and thus momentum. Droplet
momentum has been described to increase with increasing atomisation pressure (Dewettinck
and Huyghebaert 1998; Saleh et a. 1999). Droplet velocity affects impingement efficiency,
droplet adhesion, coating efficiency and granule growth rate (Link and Schlünder 1997;
Dewettinck and Huyghebaert 1998; Saleh et a. 1999; Guignon et al. 2002). Still, the effect of
droplet velocity on process outcome is scarcely studied. The present study shows a
correlation between droplet size and speed as a function of distance from the nozzle.
Figure 17. The 90%-fractile (v90 [m/s]) of the velocity distribution of droplets measured in situ in a
fluidised bed granulator as a function of distance from the nozzle (mm) with varying atomisation
pressure (bar).
5.5.5 Turbulence
The obtained models for droplet trajectory angle were of satisfactory Q2 and R2. The
turbulence was very high at the event of atomisation, as expected. The turbulence decreased
with increasing distance from the nozzle until reaching a minimum at 122-155 mm for
atomising pressures 0.42-0.98 bar, respectively (Figure 18). Further down the central axis of
the spray turbulence expectedly increases. The turbulence increased linearly with increasing
atomisation pressure. The droplets are expected to mainly move parallel to the vertical axis
(Müller and Kleinebudde 2007), which holds true at the minimum turbulence values.
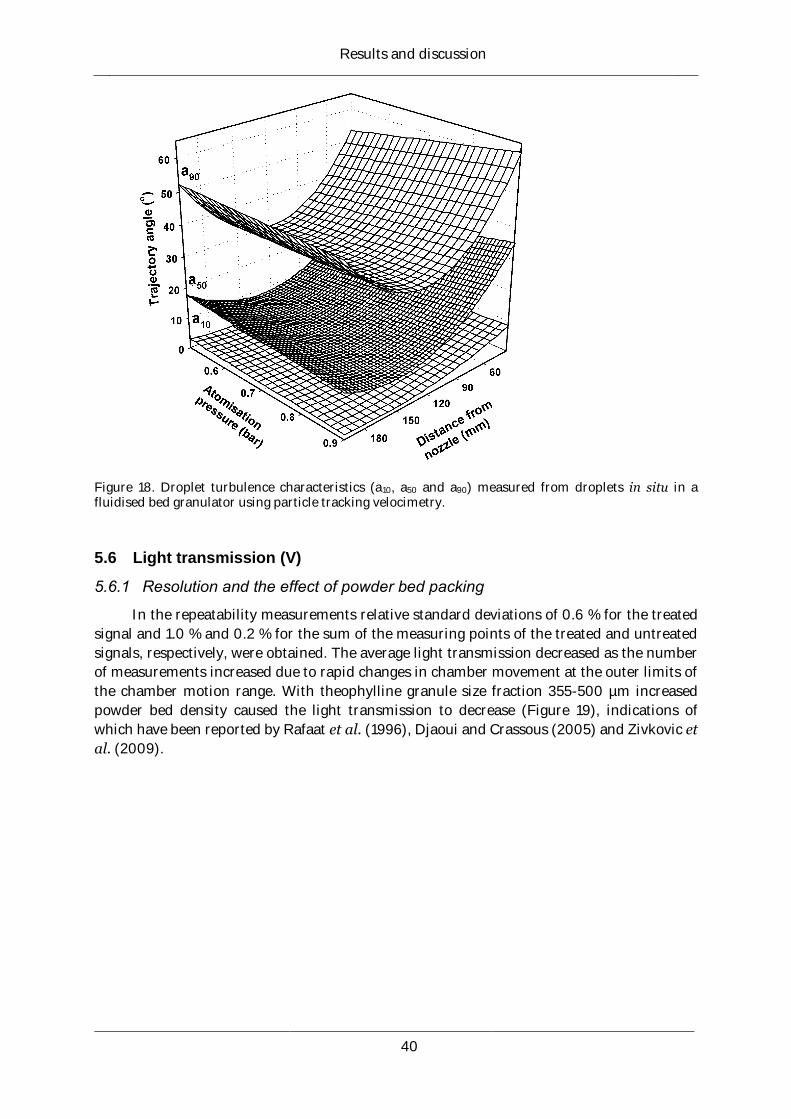
Results and discussion
40
Figure 18. Droplet turbulence characteristics (a10, a50 and a90) measured from droplets in situ in a fluidised bed granulator using particle tracking velocimetry.
5.6 Light transmission (V)
5.6.1 Resolution and the effect of powder bed packing
In the repeatability measurements relative standard deviations of 0.6 % for the treated
signal and 1.0 % and 0.2 % for the sum of the measuring points of the treated and untreated
signals, respectively, were obtained. The average light transmission decreased as the number
of measurements increased due to rapid changes in chamber movement at the outer limits of
the chamber motion range. With theophylline granule size fraction 355-500 µm increased
powder bed density caused the light transmission to decrease (Figure 19), indications of
which have been reported by Rafaat et al. (1996), Djaoui and Crassous (2005) and Zivkovic et
al. (2009).
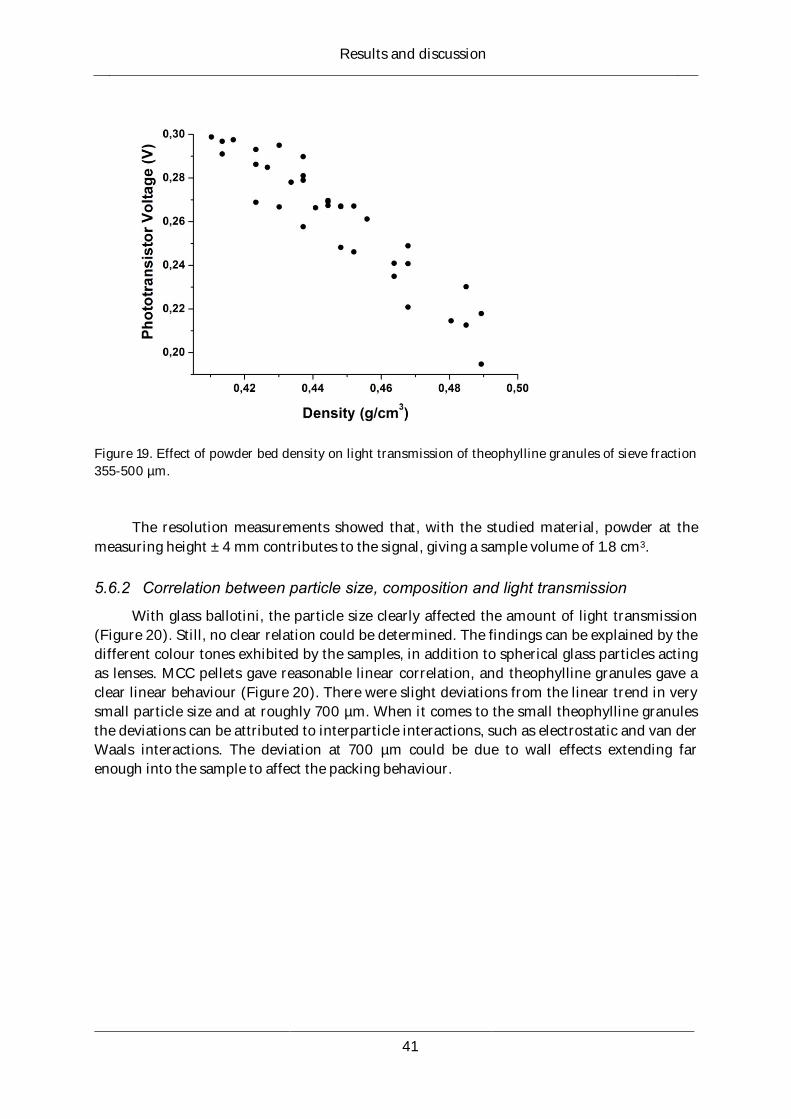
Results and discussion
41
Figure 19. Effect of powder bed density on light transmission of theophylline granules of sieve fraction
355-500 µm.
The resolution measurements showed that, with the studied material, powder at the
measuring height ± 4 mm contributes to the signal, giving a sample volume of 1.8 cm3.
5.6.2 Correlation between particle size, composition and light transmission
With glass ballotini, the particle size clearly affected the amount of light transmission
(Figure 20). Still, no clear relation could be determined. The findings can be explained by the
different colour tones exhibited by the samples, in addition to spherical glass particles acting
as lenses. MCC pellets gave reasonable linear correlation, and theophylline granules gave a
clear linear behaviour (Figure 20). There were slight deviations from the linear trend in very
small particle size and at roughly 700 µm. When it comes to the small theophylline granules
the deviations can be attributed to interparticle interactions, such as electrostatic and van der
Waals interactions. The deviation at 700 µm could be due to wall effects extending far
enough into the sample to affect the packing behaviour.
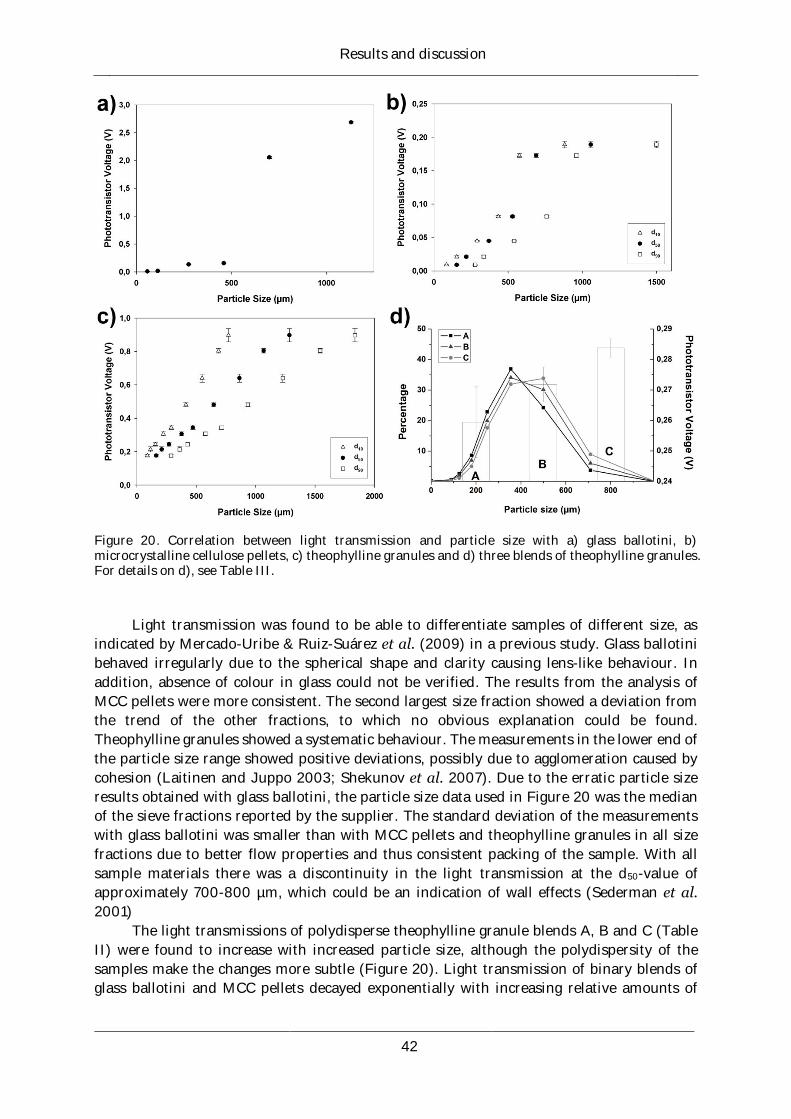
Results and discussion
42
Figure 20. Correlation between light transmission and particle size with a) glass ballotini, b) microcrystalline cellulose pellets, c) theophylline granules and d) three blends of theophylline granules. For details on d), see Table III.
Light transmission was found to be able to differentiate samples of different size, as
indicated by Mercado-Uribe & Ruiz-Suárez et al. (2009) in a previous study. Glass ballotini
behaved irregularly due to the spherical shape and clarity causing lens-like behaviour. In
addition, absence of colour in glass could not be verified. The results from the analysis of
MCC pellets were more consistent. The second largest size fraction showed a deviation from
the trend of the other fractions, to which no obvious explanation could be found.
Theophylline granules showed a systematic behaviour. The measurements in the lower end of
the particle size range showed positive deviations, possibly due to agglomeration caused by
cohesion (Laitinen and Juppo 2003; Shekunov et al. 2007). Due to the erratic particle size
results obtained with glass ballotini, the particle size data used in Figure 20 was the median
of the sieve fractions reported by the supplier. The standard deviation of the measurements
with glass ballotini was smaller than with MCC pellets and theophylline granules in all size
fractions due to better flow properties and thus consistent packing of the sample. With all
sample materials there was a discontinuity in the light transmission at the d50-value of
approximately 700-800 µm, which could be an indication of wall effects (Sederman et al.
2001)
The light transmissions of polydisperse theophylline granule blends A, B and C (Table
II) were found to increase with increased particle size, although the polydispersity of the
samples make the changes more subtle (Figure 20). Light transmission of binary blends of
glass ballotini and MCC pellets decayed exponentially with increasing relative amounts of
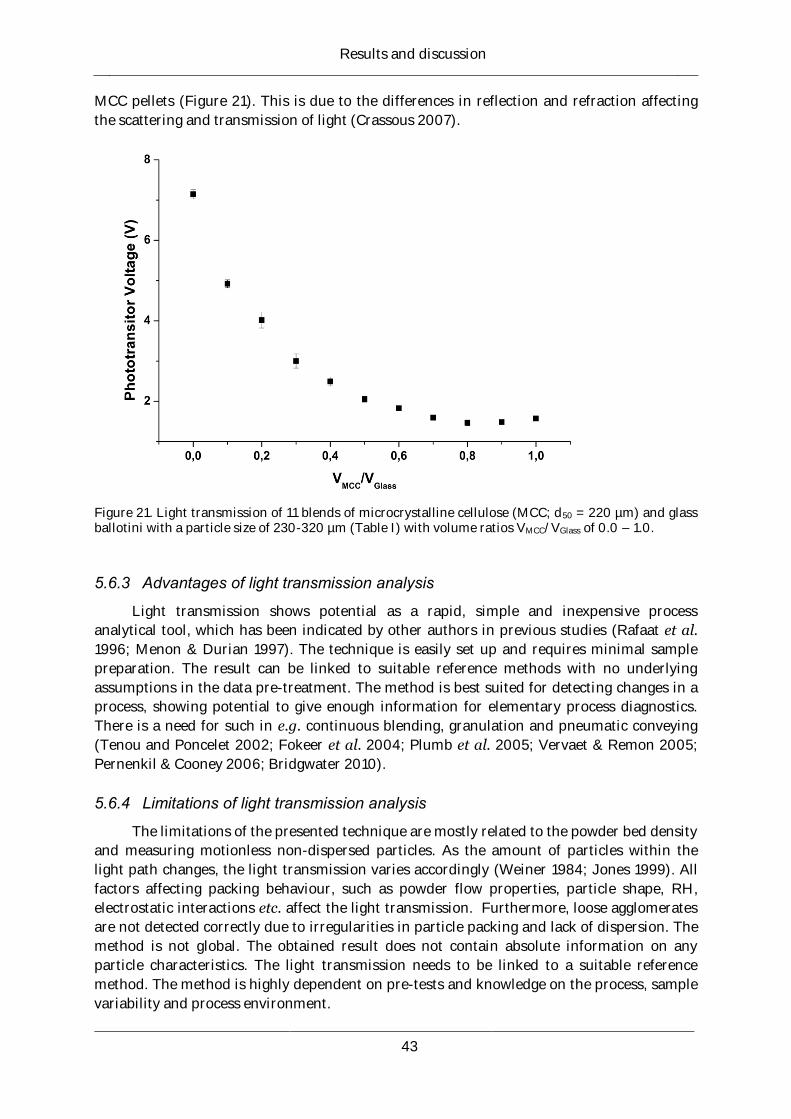
Results and discussion
43
MCC pellets (Figure 21). This is due to the differences in reflection and refraction affecting
the scattering and transmission of light (Crassous 2007).
Figure 21. Light transmission of 11 blends of microcrystalline cellulose (MCC; d50 = 220 µm) and glass ballotini with a particle size of 230-320 µm (Table I) with volume ratios VMCC/VGlass of 0.0 – 1.0.
5.6.3 Advantages of light transmission analysis
Light transmission shows potential as a rapid, simple and inexpensive process
analytical tool, which has been indicated by other authors in previous studies (Rafaat et al.
1996; Menon & Durian 1997). The technique is easily set up and requires minimal sample
preparation. The result can be linked to suitable reference methods with no underlying
assumptions in the data pre-treatment. The method is best suited for detecting changes in a
process, showing potential to give enough information for elementary process diagnostics.
There is a need for such in e.g. continuous blending, granulation and pneumatic conveying
(Tenou and Poncelet 2002; Fokeer et al. 2004; Plumb et al. 2005; Vervaet & Remon 2005;
Pernenkil & Cooney 2006; Bridgwater 2010).
5.6.4 Limitations of light transmission analysis
The limitations of the presented technique are mostly related to the powder bed density
and measuring motionless non-dispersed particles. As the amount of particles within the
light path changes, the light transmission varies accordingly (Weiner 1984; Jones 1999). All
factors affecting packing behaviour, such as powder flow properties, particle shape, RH,
electrostatic interactions etc. affect the light transmission. Furthermore, loose agglomerates
are not detected correctly due to irregularities in particle packing and lack of dispersion. The
method is not global. The obtained result does not contain absolute information on any
particle characteristics. The light transmission needs to be linked to a suitable reference
method. The method is highly dependent on pre-tests and knowledge on the process, sample
variability and process environment.
Conclusions
44
6 Conclusions
This research clearly showed that by taking advantage of knowledge on interfacial
phenomena in pharmaceutical particle modification processes the versatility of these
processes and the knowledge on them can be improved.
The present study showed that ibuprofen powder with a median diameter of 40 µm
belonging to the Geldart group C powders can successfully be coated in a fluidised bed with a
top-spray setup without using fluidisation aids, in contradiction to previous reports found in
the literature. The results also showed that the HPMC coating applied in a fluidised bed
process and with a novel ultrasound assisted coating process was able to change the surface
properties of the particles enabling statistically significantly improved powder flow. The
response to change in RH correlated with the improvement in flow properties, indicating
changes in surface hydrophilicity. Taken together, fluidised bed thin coating with HPMC can
be used as a flow enhancer of ibuprofen powder.
Granule growth in a fluidised bed process was restricted by applying pulsed liquid feed.
Previous studies with pulsed liquid feed have not concentrated on restriction of granule
growth to nucleation, but this study shows that with pulsed liquid feed the size enlargement
proceeded from formation of ordered mix to nucleation and early growth without undergoing
further granule growth. In high RH the effect of pulsed liquid feed increased. In partial
contradiction to previous studies, both smaller and larger granules were formed in high RH.
This can be explained by higher heat capacity of moist air, which enables a higher bed
temperature favouring liquid evaporation. Consequently, pulsed liquid feed can be used to
compensate for changes in RH of the inlet air.
PTV coupled with DLS was found to give process relevant information on spray
characteristics measured in situ in a fluidised bed process. The results show droplet
coalescence as the droplets proceed away from the nozzle head. Contradictory to previous
findings, the droplet speed initially increased with increasing distance to the nozzle. This can
be seen as further evidence of droplet coalescence. The measured droplet trajectory angles
showed where the droplet trajectories are most favourable for droplet particle impact in
addition to which extent the fluidising air reaches down the chamber.
In the present study diffuse visible light transmitted through a motionless powder bed
showed to carry information on the characteristics of the powder sample. Light transmission
showed to be a suitable method for basic particle systems characterisation in terms of particle
size, packing density and blend composition.
References
45
References
Abberger T., 2001. The effect of powder type, free moisture and deformation behaviour of
granules on the kinetics of fluid bed granulation. Eur. J. Pharm. Biopharm. 52: 327-336. Adi H., Larson I., Stewart P., 2007. Laser diffraction of cohesive lactose powders. Powder
Technol. 179: 90-94. Airaksinen S., Karjalainen M., Shevchenko A., Westermarck S., Leppänen E., Rantanen J.,
Yliruusi J., 2005. Physical stability of solid dosage formulations. J. Pharm. Sci. 94(10): 2147-2165.
Anares C., Réginault P., Rochet M.H., Chaillot B., Pourcelot Y., 1996. Particle-size distribution of a powder: Comparison of three analytical techniques. Int. J. Pharm. 144: 141-146.
Bacelos M.S., Passos M.L., Freire J.T., 2007. Effect of interparticle forces on the conical spouted bed behaviour of wet particles. Powder Technol. 174: 114-126.
Bailey A.G., 1984. Electrostatic phenomena during powder handling. Powder Technol. 37: 71-85.
Becher R-D., Schlünder E-U., 1997. Fluidised bed granulation: Gas flow, particle motion and moisture distribution. Chem. Eng. Proc. 36: 261-269.
Becher R-D., Schlünder E-U., 1998. Fluidised bed granulation: The importance of a drying zone for the particle growth mechanism. Chem. Eng. Proc. 37: 1-6.
Beck R.C.R., Pohlmann A.Z., Guterres S.S., 2004. Nanoparticle-coated microparticles: preparation and characterisation. J. Microencapsulation 21(5): 499-512.
Behzadi S.S., Klocker J., Hüttlin H., Wolschann P., Viernstein H., 2005. Validation of fluid bed granulation utilizing artificial neural network. Int. J. Pharm. 291: 139-148.
Boland D., Geldart D., 1972. Electrostatic charging in gas fluidised beds. Powder Technol. 5(5): 289-297.
Bolhuis G.K., Armstrong N.A., 2006. Exipients for direct compaction – an update. Pharm. Dev. Tech. 11: 111-124.
Bose S., Bogner R.H., 2007. Solventless pharmaceutical coating processes: a review. Pharm. Dev. Tech. 12: 115-131.
Bouffard J., Kaster M., Dumont H., 2005. Influence of process variable and physicochemical properties on the granulation mechanism of mannitol in a fluid bed top spray granulator. Drug Dev. Ind. Pharm. 31: 923-933.
Bridgwater J., 2010. Mixing of particles and powders: Where next? Particuology 8: 563-567. Brunauer S., Emmet P.H., Teller E., 1938. Adsorption of gases in multimolecular layers. J.
Am. Chem. Soc. 60: 309-319. Buckton G., 2000. Interfacial phenomena in drug delivery and targeting. Taylor and Francis
Ltd, UK. Byrn S.R., Pfeiffer R.R., Stowell J.G., 1999. Drugs as molecular solids. In: Solid-state
chemistry of drugs, 2nd Ed. SSCI, Inc., West LaFayette, Indiana, The United States, pp. 3-44.
Caruso F., 2001. Nanoengineering of particle surfaces. Adv. Mater. 13(1): 11-22. Chen Y., Yang J., Dave R.N., Pfeffer R., 2008. Fluidisation of coated group C powders. AIChE
J. 54(1): 104-121. Chen Y., Yang J., Mujamdar A., Dave R., 2009. Fluidised bed coating of cohesive Geldart
group C powders. Powder Technol. 189: 466-480. Cheng X.X., Turton R., 2000a. The prediction of variability occurring in fluidised bed coating
equipment I. The measurement of particle circulation rates in a bottom-spray fluidised bed coater. Pharm. Dev. Tech. 5(3): 311-322.
Cheng X.X., Turton R., 2000b. The prediction of variability occurring in fluidised bed coating equipment II. The role of non-uniform particle coverage as particles pass through the spray zone. Pharm. Dev. Tech. 5(3): 323-332.
Christensen N.F., Bertelsen P., 1997. Qualitative description of the Wurster-based fluid-bed coating process. Drug Dev. Ind. Pharm. 23(5): 451-463.
References
46
Crassous J., 2007. Diffusive wave spectroscopy of a random close packing of spheres. Eur. Phys. J. E - Soft Matter E 23: 145-152.
D’Amore M., Donsi G., Massimilla L., 1979. The influence of bed moisture on fluidisation characteristics on fine powders. Powder Technol. 23: 253-259.
Davies P., 2001. Oral solid dosage forms. In: Gibson M. (Ed.). Pharmaceutical formulation and preformulation. IHS Health Group, Englewood, The United States, pp. 379-458.
Davies W.L., Gloor W.T., 1971. Batch production of pharmaceutical granulations in a fluidised bed II. Effect of process variables on physical properties of final granulation. J. Pharm. Sci. 60(12): 1869-1874.
Davies W.L., Gloor W.T., 1972. Batch production of pharmaceutical granulations in a fluidised bed II. Effect of various binders and their concentrations on granulations and compressed tablets. J. Pharm. Sci. 61(4): 618-622.
Davies R., Schurr G.A., Meenan P., Nelson R.D., Bergna H.E., Brevett C.A.S., Goldbaum R.H., 1998. Engineered particle surfaces. Adv. Mater. 10(15): 1264-1270.
Denesuk M., Smith G.L., Zelinski B.J.J., Kreidl N.J., Uhlmann D.R., 1993. Capillary penetration of liquid droplets into porous materials. J. Colloid and Interface Sci. 158: 114-120.
Desai K.G.H., Park H.J., 2005. Recent developments in microencapsulation of food ingredients. Drying Technol. 23: 1361-1394.
Dewettinck K., Deroo L., Messens W., Huyghebaert A., 1998. Agglomeration tendency during top-spray fluidised bed coating with gums. Lebensm. Wiss. U. Technol. 31: 576-584.
Dewettinck K., Huyghebaert A., 1998. Top-spray fluidised bed coating: Effect of process variables on coating efficiency. Lebensm. Wiss. U. Technol. 31: 568-575.
Dewettinck K., Huyghebaert A., 1999. Fluidised bed coating in food technology. Trends in Food Sci. Technol. 10: 163-168.
Djaoui L., Crassous J., 2005. Probing creep motion in granular materials with light scattering. Granular matter 7: 185-190.
Donida M.W., Rocha S.C.S., Bartholomeu F., 2005. Influence of polymeric suspension characteristics on the particle coating in a spouted bed. Drying Technol. 23: 1811-1823.
European Pharmacopoeia. 5th edition, Council of Europe, Strasbourg, 2005. Volume 1, 2.9.16. Flowability, pp. 242-243.
Faqih A., Chaudhuri B., Alexander A.W., Davies C., Muzzio F.J., Tommassone M.S., 2006. An experimental/computational approach for examining unconfined cohesive powder flow. Int. J. Pharm. 324: 116-127.
Faqih A.M.N., Mehotra A., Hammond S.V., Muzzio F.J., 2007. Effect of moisture and magnesium stearate concentration on flow properties of cohesive granular material. Int. J. Pharm. 336: 338-345.
Farid M., 2003. A new approach to modelling of single droplet drying. Chem. Eng. Sci. 58: 2985-2993.
Fernández-Arevalo M., Vela M.T., Rabasco A.M., 1990. Rheological study of lactose coated with acrylic resins. Drug Dev. Ind. Pharm. 16(2): 295-313.
Ferrari F., Cocconi D., Bettini R., Giordano F., Santi P., Tobyn M., Price R., Young P., Caramella C., Colombo P., 2004. The surface roughness of lactose particles can be modulated using a high-shear mixer. AAPS PharmSciTech 5(4): Article 60.
Fokeer S., Kingman S., Lowndes I., Reynolds A., 2004. Characterisation of the cross-sectional particle concentration distribution in horizontal dilute flow conveying – a review. Chem. Eng. Proc. 43: 677-691.
Forsyth A.J., Hutton S., Rhodes M.J., 2002. Effect of cohesive interparticle force on the flow characteristics of granular material. Powder Technol. 126: 150-154.
Frake P., Greenhalgh D., Grierson S.M., Hempenstall J.M., Rudd D.R., 1997. Process control and endpoint determination of a fluid bed granulation by application of near-infra-red spectroscopy. Int. J. Pharm. 151: 75-80.
Führer C., 1996. Interparticulate attraction mechanisms. In: Alderborn G., Nyström C. (Ed): Pharmaceutical powder compaction technology. Marcel Dekker, Inc., New York, The United States, pp. 1-15.
Geldart D., 1973. Types of gas fluidisation. Powder Technol. 7: 285-292.
References
47
Geldart D., 1990. Powder processing – the overall view. In: Rhodes M. (Ed.). Principles of powder technology. John Wiley & Sons Ltd., Chichester, England. pp. 1-8.
Geldart D., Harnby N., Wong A.C., 1984. Fluidisation of cohesive powders. Powder Technol. 37: 25-37.
Genina N., Räikkönen H., Heinämäki J., Antikainen O., Siiriä S., Veski P., Yliruusi J., 2009. Effective modification of particle surface properties using ultrasonic water mist. AAPS PharmSciTech 10(1): 282-288.
Gibbs B.F., Kermasha S., Alli I., Mulligan C.N., 1999. Encapsulation in the food industry: a review. Int. J. Food Sci. Nutr. 50: 213-224.
Guardiola J., Rojo V., Ramos G., 1996. Influence of particle size, fluidising velocity and relative humidity on fluidised bed electrostatics. J. Electrostat. 37: 1-20.
Guignon B., Duquenoy A., Dumoulin E., 2002. Fluid bed encapsulation of particles: Principles and practice. Drying Technol. 20(2): 419-447.
Guo Q., Li Y., Wang M., Shen W., 2005. Fluidising behaviours for coating cohesive particles. Chem. Eng. Technol. 28(7): 752-756.
Hamad M.L., Bowman K., Smith N., Sheng X., Morris K.R., 2010. Multi-scale pharmaceutical process understanding: From particle to dosage form. Chem. Eng. Sci. 65(21): 5625-5638.
Hapgood K.P., Khanmohammadi B., 2009. Granulation of hydrophobic powders. Powder Technol. 189: 255-262.
Hapgood K.P., Litster J.D., Biggs J.R., Howes T., 2002. Drop penetration into porous powder beds. J. Colloid and Interface Sci. 253: 353-366.
Hapgood K.P., Litster J.D., Smith R., 2003. Nucleation regime map for liquid bound granules. AIChE J. 49(2): 350-361.
Hardalupas Y., Taylor A.M.K.P., Wilkins J.H., 1999. Experimental investigation of sub-millimetre droplet impingement onto spherical surfaces. Int. J. Heat and Fluid Flow 20: 477-485.
Hawkins A.E., 1990. Characterizing the single particle. In: Rhodes M. (Ed): Principles of powder technology. John Wiley & Sons Ltd., Chichester, England. pp. 9-34.
Hede P.D., Bach P., Jensen A.D., 2008. Two-fluid spray atomisation and pneumatic nozzles for fluid bed coating/agglomeration purposes: a review. Chem. Eng. Sci. 63: 3821-3842.
Hemati M., Cherif R., Saleh K., Pont V., 2003. Fluidised bed coating and granulation: influence of process-related variables and physicochemical properties on the growth kinetics. Powder Technol. 130: 18-34.
Heng P.W.S., Chan L.W., 1997. Drug substance and excipient characterisation. In: Parikh D.M. (Ed.). Handbook of pharmaceutical granulation technology. Marcel Dekker, Inc., New York, The United States, pp. 25-58.
Hlinak A.J., Saleki-Gerhardt A., 2000. An evaluation of fluid bed drying of aqueous granulation. Pharm. Dev. Tech. 5(1): 11-17.
Hoffmann A.C., Romp E.J., 1991. Segregation of fluidised powder of a continuous size distribution. Powder Technol. 66: 19 19-126.
Holgado M.A., Fernández-Hervás M.J., Alvarez-Fuentes J., Vela M.T., Rabasco A.M., Fini A., 1996. Characterisation of modified paracetamol by means of SEM and fractal analysis. Int. J. Pharm. 142: 143-151.
Hu X., Cunningham J.C., Winstead D., 2008. Study growth kinetics in fluidised bed granulation with at-line FBRM. Int. J. Pharm. 347:54-61.
Ichikawa H., Fukumori Y., 1999. Microagglomeration of pulverized pharmaceutical powders using the Wurster process I. Preparation of highly drug-incorporated, sub-sieve core particles for subsequent microencapsulation film coating. Int. J. Pharm 180: 195-210.
Iida K., Hayakawa Y., Okamoto H., Danjo K., Leuenberger H., 2003. Preparation of dry powder inhalation by surface treatment of lactose carrier particles. Chem. Pharm. Bull. 51(1): 1-5.
Iida K., Inagaki Y., Todo H., Okamoto H., Danjo K. Leuenberger H., 2004. Effects of surface processing of lactose carrier particles on dry inhalation properties of salbutamol sulfate. Chem. Pharm. Bull. 52(8): 938-942.
References
48
Iida K., Todo H., Okamoto H., Danjo K., Leuenberger H., 2005. Preparation of dry powder inhalation with lactose carrier particles surface-coated using a Wurster fluidised bed. Chem. Pharm. Bull. 53(4): 431-434.
Israelachvili J., 1992. Intermolecular & surface forces. 2nd Ed. Academic Press, London, UK. Iveson S.M., Litster J.D., 1998. Growth regime map for liquid-bound granules. AIChE J.
44(7): 1510-1518. Iveson S.M., Litster J.D., Hapgood K., Ennis B.J., 2001a. Nucleation, growth and breakage
phenomena in agitated wet granulation processes: a review. Powder Technol. 117: 3-39. Iveson S.M., Wauters P.A.L., Forrest S., Litster J.D., Meesters G.M.H., Scarlett B., 2001b.
Growth regime map for liquid bound granules: further development and experimental validation. Powder Technol. 117: 83-97.
Jaiyeoba K.T., Spring M.S., 1980. The granulation of ternary mixtures: the effect of the wettability of the powders. J. Pharm. Pharmacol. 32: 386-388.
Jiménez T., Turchiuli C., Dumoulin E., 2006. Particles agglomeration in a conical fluidised bed in relation with air temperature profiles. Chem. Eng. Sci. 61: 5954-5961.
Jones A.R., 1999. Light scattering for particle characterisation. Progress in Energy and Combustion Science 25: 1-53.
Juslin L., Antikainen O., Merkku P., Yliruusi J., 1995a. Droplet size measurement I: Effect of three independent variables on droplet size distribution and spray angle from a pneumatic nozzle. Int. J. Pharm. 123: 247-256.
Juslin L., Antikainen O., Merkku P., Yliruusi J., 1995b. Droplet size measurement II: Effect of three independent variables on parameters describing the droplet size distribution from a pneumatic nozzle studied by multilinear stepwise regression analysis. Int. J. Pharm. 123: 257-264.
Kawashima Y., Serigano T., Hino T., Yamamoto H., Takeuchi H., 1998. Effect of surface morphology of carrier lactose on dry powder inhalation property of pranlukast hydrate. Int. J. Pharm. 172: 179-188.
Kaye B.H., 1997. Particle size characterisation. In: Fayed M.E., Otten L. (Ed). Handbook of powder science & technology. 2nd Ed. Chapman & Hall, New York, The United States, pp. 1-34.
Kendall K., Stainton C., 2001. Adhesion and aggregation of fine particles. Powder Technol. 121: 223-229.
Kim K.Y., Marshall W.R., 1971. Drop size distribution from pneumatic atomizers. AIChE J. 17(3): 575-584.
Kontny M.J., Zografi G., 1995. Sorption of water by solids. In: Brittain H.G. (Ed): Physical characterisation of pharmaceutical solids. Marcel Dekker, Inc., New York, The United States, pp. 387-417.
Laitinen N., Juppo, A.M., 2003. Measurement of pharmaceutical particles using a time-of-flight particle sizer. Eur. J. Pharm. Biopharm. 55: 93-98.
Lambros M.P., Nicolaou S.H., 2003. Interfacial phenomena. In: Amiji M.M., Sandmann B.J. (Ed): Applied physical pharmacy. The McGraw-Hill Companies, Inc., New York, the United States, pp. 327-363.
Larjo J., 2005. High power diode lasers in spray process diagnostics. Proc. SPIE 5580, 455, doi:10.1117/12.567358.
Lazghab M., Saleh K., Pezron I., Guignon P., Komunjer L., 2005. Wettability assessment of finely divided solids. Powder Technol. 157: 79-91.
Leclére K., Briens C., Gauthier T., Bayle J., Guignon P., Bergougnou M., 2004. Experimental measurement of droplet vapourization kinetics in a fluidised bed. Chem. Eng. Proc. 43: 693-699.
Link K.C., Schlünder E-U., 1997. Fluidised bed spray granulation. Investigation of the coating process on a single sphere. Chem. Eng. Proc. 36: 443-457.
Linsenbühler M., Wirth K-E., 2005. An innovative dry powder coating process in non-polar liquids producing tailor-made microparticles. Powder Technol. 158: 3-20.
Lipsanen T., 2008. Process analytical technology approach on fluid bed granulation and drying – indentifying critical relationships and constructing the design space. Doctoral
References
49
thesis, Dissertationes bioscientiarium molecularium Universitatis Helsingiensis in Viikki, Helsinki, Finland.
Lipsanen T., Antikainen O., Räikkönen H., Airaksinen S., Yliruusi J., 2007. Novel description of design space for fluidised bed granulation. Int. J. Pharm. 345: 101-107.
Lipsanen T., Antikainen O., Räikkönen H., Airaksinen S., Yliruusi J., 2008. Effect of fluidisation activity on end-point detection of a fluid bed drying process. Int. J. Pharm. 357: 37-43.
Litster J.D., 2003. Scale-up of wet granulation processes: science not art. Powder Technol. 130: 35-40.
Magshoodi M., Taghizadeh O., Martin G.P., Nokhodchi A., 2008. Particle design of naproxen-disintegrant agglomerates for direct compression by a crystallo-co-agglomeration technique. Int. J. Pharm. 351: 45-54.
Maronga S.J., Wnukowski P., 2001. Growth kinetics in particle coating by top-spray fluidised bed systems. Adv. Powder. Technol. 12(3): 371-391.
McHale G., Shirtcliffe N.J., Newton M.I., 2004. Contact-angle hysteresis on super-hydrophobic surfaces. Langmuir 20: 10146-10149.
McLaughlin L.J., Rhodes M.J., 2001. Prediction of fluidised bed behaviour in the presence of liquid bridges. Powder Technol. 114: 213-223.
Menon N., Durian D.J., 1997. Diffusing-wave spectroscopy of dynamics in a three dimensional granular flow. Science 275: 1920-1922.
Mercado-Uribe H., Ruiz-Suárez J.C., 2009. Light transmission through dense packings of glass spheres. Revista Mexicana de Física 55(2): 130-133.
Mueller R., Kleinebudde P., 2006. Comparison of a laboratory and production spray gun in film coating: Effect of pattern air and nozzle diameter. Pharm. Dev. Tech. 11: 425-433.
Mueller R., Kleinebudde P., 2007. Comparison of a laboratory and production spray gun with respect to scale-up. AAPS PharmSciTech 8(1): article 3.
Muzzio F.J., Shinbrot T., Glasser B.J., 2002. Powder technology in the pharmaceutical industry: the need to catch up fast. Powder Technol. 124: 1-7.
Newman A.W., 1995. Micromeritics. In: Brittain H.G. (Ed.). Physical characterisation of pharmaceutical solids. Marcel Dekker, Inc., New York, The United States, pp. 253-280.
Nieuwmeyer F., van der Voort Maarschalk K., Vromans H., 2008. The consequences of granule heterogeneity towards breakage and attrition upon fluid bed drying. Eur. J. Pharm. Biopharm. 70: 402-408.
Nokhodchi A., Magshoodi M., Hassan-Zadeh D., Barzegar-Jaladi M., 2007. Preparation of agglomerated crystals for improving flowability and compactibility of poorly flowable and compactible drugs and excipients. Powder Technol. 175: 73-81.
Nomura T., Satoh T., Masuda H., 2003. The environment humidity effect on the tribo-charge of powders. Powder Technol. 135-136: 43-49.
Närvänen T., Lipsanen T., Antikainen O., Räikkönen H., Yliruusi J., 2008. Controlling granule size by granulation liquid feed pulsing. Int. J. Pharm 357: 132-138.
Närvänen T., Lipsanen T., Antikainen O., Räikkönen H., Yliruusi J., 2009. Gaining fluid bed process understanding by in-line particle size analysis. J. Pharm. Sci. 98(3): 1110-1117.
Panda R.C., Zank J., Martin H., 2001. Experimental investigation of droplet deposition on a single particle. Chem. Eng. J. 83: 1-5.
Parikh D.M., Bonck J.A., Mogavero M., 1997. Batch fluid bed granulation. In: Parikh D.M. (Ed.). Handbook of pharmaceutical granulation technology. Marcel Dekker, Inc., New York, The United States, pp. 228-302
Pernenkil L., Cooney, C.L., 2006. A review on the continuous blending of powders. Chem. Eng. Sci. 61: 720-742.
Pfeffer R., Dave R.N., Wei D., Ramlakhan M., 2001. Synthesis of engineered particulates with tailored properties using dry particle coating. Powder Technol. 117: 40-67.
Planinšek O., Pišek R., Trojak A., Srčič S., 2000. The utilisation of surface free-energy parameters for the selection of suitable binder in fluidised bed granulation. Int. J. Pharm. 207: 77-88.
Plumb K., 2005. Continuous processing in the pharmaceutical industry. Changing the mind set. Trans IChemE Part A Chemical Engineering Research and Design 83(A6): 730-738.
References
50
Pont V., Saleh K., Steinmetz D., Hémati M., 2001. Influence of the physicochemical properties on the growth of solid particles by granulation in fluidised bed. Powder Technol. 120: 97-104.
Price R., Young P.M., Edge S., Staniforth J.N., 2002. The influence of relative humidity on particulate interactions in carrier based powder inhaler formulators. Int. J. Pharm. 246: 47-59.
Prior H.H., Prem H., Rhodes M.J., 1990. Size reduction. In: Rhodes M. (Ed.). Principles of powder technology. John Wiley & Sons Ltd., Chichester, England. pp. 227-298.
Rafaat T., Hulin J.P., Herrmann H.J., 1996. Density waves in dry granular media falling through a vertical pipe. Phys.Rev. E, 53(5): 4345-4350.
Rajniak P., Manciacelli C., Chern R.T., Sepanek F., Farber L., Hill B.T., 2007. Experimental study of the binder properties on the granule morphology. Int. J. Pharm. 334: 92-102.
Rantanen J., Jørgensen A., Räsänen E., Luukkonen P., Airaksinen S., Raiman J., Hänninen K., Antikainen O., Yliruusi J., 2001. Process analysis of fluid bed granulation. AAPS PharmSciTech 2(4): Article 21.
Rantanen J., Lehtola S., Rämet P., Mannermaa J-P., Yliruusi J., 1998. On-line monitoring of moisture content in an instrumented fluidised bed granulator with a multichannel NIR moisture sensor. Powder Technol. 99: 163-170.
Rantanen P., Valkonen A., Cronhjort A., 1999. Measurement of a diesel spray with a normal size nozzle and a large scale model. Int. J. Heat and Fluid Flow 20: 545-551.
Rasenack N., Müller B.W., 2002a. Ibuprofen crystals with optimised properties. Int. J. Pharm. 245: 9-24.
Rasenack N., Müller B.W., 2002b. Properties of ibuprofen cystallized under various conditions: a comparative study. Drug Dev. Ind. Pharm. 28(9): 1077-1089.
Remenar J.F., Morisette S.L., Peterson M.L., Moulton B., MacPhee M.J., Guzman H.R., Almarsson Ö., 2003. Crystal engineering of novel cocrystals of triazole drug with 1,4-dicarboxylic acids. J. Am. Chem. Soc. 125: 8456-8457.
Reynolds G.K., Fu J.S., Cheong Y.S., Hounslow M.J., Salman A.D., 2005. Breakage in granulation: A review. Chem. Eng. Sci. 60: 3969-3992.
Rowe R.S., 1989. Binder-substrate interactions in granulation: a theoretical approach based on surface free energy and polarity. Int. J. Pharm. 52: 149-154.
Rowley G., Mackin L.A., 2003. The effect of moisture sorption on electrostatic charging of selected pharmaceutical excipient powders. Powder Technol. 135-136: 50-58.
Rumpf H., 1975. Particle Technology. Powder Technology Series. Chapman and Hall, London, UK.
Räsänen E., Rantanen J., Mannermaa J-P., Yliruusi J., 2004. The characterisation of fluidisation behavior using a novel multichamber microscale fluid bed. J. Pharm. Sci. 93(3): 780-791.
Saleh K., Cherif R., Hemati M., 1999. An experimental study of fluidised-bed coating: Influence of operating conditions on growth rate and mechanism. Adv. Powder Technol. 10(3): 255-277.
Saleh K., Guignon P., 2007. Influence of wetting parameters on particle growth in fluidised-bed coating and agglomeration processes. Part. Part. Syst. Charact. 24: 136-143.
Saleh K., Steinmetz D., Hémati M., 2003. Experimental study and modelling of fluidised bed coating and agglomeration. Powder Technol. 130: 116-123.
Sandler N., 2010. Photometric imaging in particle size measurement and surface visualization. Int. J. Pharm. In Press: doi:10.1016/j.ijpharm.2010.11.007.
Sandler N., Wilson D., 2010. Prediction of granule packing and flow behaviour based on particle size and shape analysis. J. Pharm. Sci. 99(2): 958-968.
Schaafsma S.H., Vonk P., Segers P., Kossen N.W.F., 1998. Description of agglomerate growth. Powder Technol. 97: 183-190.
Schaafsma S.H., Kossen N.W.F., Mos M.T., Blauw L., Hoffmann A.C., 1999. Effects and control of humidity and particle mixing in fluid bed granulation. AIChE J. 45(6): 1202-1210.
Schaafsma S.H., Vonk P., Kossen N.W.F., 2000. Fluidised bed agglomeration with a narrow droplet size distribution. Int. J. Pharm. 193: 175-187.
References
51
Schaafsma S.H., Vonk P., Kossen N.W.F., Hoffmann A.C., 2006a. A model for the spray zone in early stage fluidised bed granulation. AIChE J. 52(8): 2736-2741.
Schæfer T., Wørts O., 1977a. Control of fluidised bed granulation I. Effects of spray angle, nozzle height and starting material on granule size and size distribution. Arch. Pharm. Chemi, Sci. Ed. 5: 51-60.
Schæfer T., Wørts O., 1977b. Control of fluidised bed granulation II. Estimation of droplet size and atomised binder solutions. Arch. Pharm. Chemi, Sci. Ed. 5: 178-193.
Schæfer T., Wørts O., 1978a. Control of fluidised bed granulation III. Effects of inlet air temperature and liquid flow rate on granule size and size distribution. Control of moisture content of the granules on the drying phase. Arch. Pharm. Chemi, Sci. Ed. 6: 1-13.
Schæfer T., Wørts O., 1978b. Control of fluidised bed granulation IV. Effects of binder solution and atomisation on granule size and size distribution. Arch. Pharm. Chemi, Sci. Ed. 6: 14-25.
Schæfer T., Wørts O., 1978c. Control of fluidised bed granulation V. Factors affecting granule growth. Arch. Pharm. Chemi, Sci. Ed. 6: 69-82.
Schwedes J., 2003. Review on testers for measuring flow properties of bulk solids. Granular Matter 5: 1-43.
Sederman A.J., Alexander P., Gladden, L.F., 2001. Structure of packed beds probed by Magnetic Reconance Imaging. Powder Technol. 117: 255-269.
Seppälä K., Heinämäki J., Hatara J., Seppälä L., Yliruusi J., 2010. Development of a new method to get a reliable powder flow characteristics using only 1 to 2 g of powder. AAPS PharmSciTech 11(1): 402-408.
Seville J.P.K., 2007. Fluidisation of cohesive particles. In: Salman D.D., Hounslow M.J., Seville J.P.K. (Ed): Granulation. Handbook of powder technology, Vol. 11. Elsevier, Amsterdam, The Netherlands, pp.1041-1070.
Seville J.P.K., Clift R., 1984. The effect of thin liquid layers on fluidisation characteristics. Powder Technol. 37: 117-129.
Seville J.P.K., Willet C.D., Knight P.C., 2000. Interparticle forces in fluidisation: A review. Powder Technol. 113: 261-268.
Shekunov B.Y., Chattopadhyay P., Tong H.H.Y., Chow A.H.L., 2007. Particle size analysis in pharmaceutics: Principles, methods and applications. Pharm. Res. 24(2): 203-225.
Sinka I.C., Schneider L.C.R., Cocks A.C.F., 2004. Measurement of the flow properties of powder with special reference to die fill. Int. J. Pharm. 280: 27-38.
Soppela I., Airaksinen S., Murtomaa M., Tenho M., Hatara J., Räikkönen H., Yliruusi J., Sandler N., 2010. Investigation of the powder flow behaviour of binary mixtures of microcrystalline cellulose and paracetamol. J. Excipients and Food Chem. 1(1): 55-67.
Staniforth J., 2002a. Particle size reduction. In: Aulton M.E. (Ed): Pharmaceutics. The science of dosage form design, 2nd Ed. Churchill Livingstone, Edinburgh, UK, pp. 166-173.
Staniforth J., 2002b. Powder flow. In: Aulton M.E. (Ed): Pharmaceutics. The science of dosage form design, 2nd Ed. Churchill Livingstone, Edinburgh, UK, pp. 197-210.
Staniforth J.N., Rees J.E., 1982. Electrostatic charge interactions in ordered powder mixing. J. Pharm. Pharmacol. 34:69-76.
Stanley-Wood N.G., 1990. Size enlargement. In: Rhodes M. (Ed.). Principles of powder technology. John Wiley & Sons Ltd., Chichester, England. pp. 193-226.
Sun C., Grant D.J.W., 2001. Effects of initial particle size on the tableting properties of L-lysine monohydrochloride dihydrate powder. Int. J. Pharm. 215: 221-228.
Svarovsky L., 1990. Characterisation of powders. In: Rhodes M. (Ed.). Principles of powder technology. John Wiley & Sons Ltd., Chichester, England. pp. 35-70.
Thiel W.J., Nguyen L.T., 1984. Fluidised bed film coating of an ordered powder mixture to produce microencapsulated ordered units. J. Pharm. Pharmacol. 36: 145-152.
Tenou E., Poncelet D., 2002. Batch and continuous fluid bed coating – review of the state of the art. J. Food Eng. 53: 325-340.
Verkoeijen D., Meesters G.W.H., Vercoulen P.H.W., Scarlett B., 2002. Determining granule strength as a function of moisture content. Powder Technol. 124: 195-200.
Vervaet C., Remon J.P., 2005. Continuous granulation in the pharmaceutical industry. Chem. Eng. Sci.60: 3949-3957.
References
52
Visser J., 1989. Van der Waals and other cohesive forces affecting powder fluidisation. Powder Technol. 58: 1-10.
Wan L.S.C., Heng P.W.S., Liew C.U., 1995. The influence of liquid spray rate and atomising pressure on the size of droplets and spheroids. Int. J. Pharm. 118: 213-219.
Wang H.G., Dyatowski T., Senior P., Raghavan R.S., Yang W.Q., 2007. Modelling of batch fluidised drying of pharmaceutical granules. Chem. Eng. Sci. 62: 1524-1535.
Weiner B.B., 1984. Particle and droplet sizing using Fraunhofer diffraction. In: Elving P.J., Winefordner J.D., Kolthoff I.M. (Ed): Modern methods of particle size analysis. John Wiley & Sons, New York, pp. 135-172.
Werner S.R.L., Jones J.R., Paterson A.H.J., Archer R.H., Pearce D.L., 2007. Droplet impact and spreading: Droplet formulation effects. Chem. Eng. Sci. 62: 2336-2345.
Wu S., 1973. Polar and non-polar interactions in adhesion. J. Adhesion 5: 39-55. Yang J., Sliva A., Banerjee A., Dave R.N., Pfeffer R., 2005. Dry particle coating for improving
the flowability of cohesive powders. Powder Technol. 158: 21-33. Yu L.X., 2008. Pharmaceutical quality by design: Product and process development,
understanding and control. Pharm. Res. 25(4): 781-791. Yuasa H., Nakano T., Kanaya Y., 1996. Suppression of agglomeration in fluidised bed coating
II. Measurement of mist size in a fluidised bed chamber and effect of sodium chloride addition on mist size. Int. J. Pharm. 178: 1-10.
Young P.M., Cocconi D., Colombo P., Bettini R., Price R., Steele D.F., Tobyn M.J., 2002. Characterisation of a surface modified dry powder inhalation carrier prepared by “particle smoothing”. J. Pharm. Pharmacol. 54: 1339-1344.
Zajic L., Buckton G., 1990. The use of surface energy values to predict optimum binder selection for granulations. Int. J. Pharm. 59: 155-164.
Zhang D., Flory J.H., Panmai S., Batra U., Kaufman M.J., 2002. Wettability of pharmaceutical solids: Its measurement and influence on wet granulation. Colloids and surfaces A: Physicochem. Eng. Aspects 206: 547-554.
Zhou T., Li H., 1999. Effects of adding different size particles on fluidisation of cohesive particles. Powder Technol. 102: 215-220.
Zivkovic V., Biggs M.J., Glass D.H., Xie L, 2009. Particle dynamics and granular temperatures in dense fluidised beds as revealed by diffusing wave spectroscopy. Adv. Powder Technol. 20: 227-233.