Embed Size (px)
Citation preview

Interfacial Energetics of Protein Adsorption from Aqueous Buffer toSurfaces with Varying Hydrophilicity
Paul Cha,† Anandi Krishnan,‡ Vincent F. Fiore,‡ and Erwin A. Vogler*,§
Departments of Materials Science and Engineering and Bioengineering, Materials Research Institute, andHuck Institute of Life Sciences, The PennsylVania State UniVersity, UniVersity Park, PennsylVania 16802
ReceiVed October 23, 2007. In Final Form: NoVember 27, 2007
Adsorption isotherms constructed from time-and-concentration-dependent advancing contact anglesθa show thatthe profound biochemical diversity among ten different blood proteins with molecular weight spanning 10-1000 kDahas little discernible effect on the amount adsorbed from aqueous phosphate-buffered saline (PBS) solution after 1h contact with a particular test surface selected from the full range of observable water wettability (as quantified byPBS adhesion tensionτa
o ) γlvo cosθa
o; whereγlvo is the liquid-vapor interfacial tension andθa
o is the advancing PBScontact angle). The maximum advancing spreading pressure,Πa
max, determined from adsorption isotherms decreasessystematically withτa
o for methyl-terminated self-assembled monolayers (CH3 SAM, τo ) -15 mN/m), polystyrenespun-coated onto electronic-grade SiOx wafers (PS,τo ) 7.2 mN/m), aminopropyltriethoxysilane-treated SiOx surfaces(APTES,τo ) 42 mN/m), and fully water wettable SiOx (τo ) 72 mN/m). Likewise, the apparent Gibbs’ surface excess[Γsl - Γsv], which measures the difference in the amount of protein adsorbedΓ (mol/cm2) at solid-vapor (SV) andsolid-liquid (SL) interfaces, decreases withτo from maximal values measured on the CH3 SAM surface through zero(no protein adsorption in excess of bulk solution concentration) nearτo ) 30 mN/m (θa ) 65°). These latter resultscorroborate the conclusion drawn from independent studies that water is too strongly bound to surfaces withτo g30 mN/m to be displaced by adsorbing protein and that, as a consequence, protein does not accumulate within theinterfacial region of such surfaces at concentrations exceeding that of bulk solution ([Γsl - Γsv] ) 0 atτo ) 30 mN/m).Results are collectively interpreted to mean that water controls protein adsorption to surfaces and that the mechanismof protein adsorption can be understood from this perspective for a diverse set of proteins with very different aminoacid compositions.
1. Introduction
Many water-soluble biological macromolecules such asproteins are amphiphilic in nature and exhibit the surface-activeproperty of adsorption to interfaces. These so-called “biosur-factant” properties1 ultimately originate in the differentialinteractions of water with amphiphilic portions or domains onthe solvent-exposed surface of the macromolecule.2Biosurfactantadsorption is technically important because it mediates fouling.Fouling is a collection of phenomena by which working surfacesof devices, instruments, or machines in contact with naturalaqueous solutions become coated with a layer or layers ofadventitious contamination that compromises intended perfor-mance. Fouling has broad technologic importance with consider-able socioeconomic impact spanning environment, medicine,and transportation (e.g., occlusion of pipes and filters used incivil engineering, reduction in biosensor sensitivity, and resistanceto the flow of water across boat hulls, respectively). As aconsequence, protein adsorption continues to be a phenomenonof great practical importance and is of fundamental interest insurface science.
A full appreciation of the basic mechanisms underlying proteinadsorption from aqueous solution requires a complete mass andenergy “inventory” that accounts for the distribution of both
solvent (water) and solute (protein) molecules between interfacialand solution regions, as well as the energy expended in movingthese molecules from one region to another. Toward resolvingsuch an inventory for blood proteins of biomedical interest, wehave extensively applied tensiometry (contact angle and wettingmethods)3-12 and the solution-depletion method.13-16 In par-ticular, we have used time-and-concentration-dependent tensi-ometry to measure interfacial energetics of protein adsorption
* Author to whom correspondence should be addressed. [email protected].† Departments of Materials Science and Engineering.‡ Department of Bioengineering.§ Departments of Materials Science and Engineering and Bioengineering,
Materials Research Institute, and Huck Institute of Life Sciences.(1) Vogler, E. A. Interfacial Chemistry in Biomaterials Science. InWettability;
Berg, J., Ed.; Marcel Dekker: New York, 1993; Vol. 49, pp 184-250.(2) Yaminsky, V. V.; Vogler, E. A. Hydrophobic Hydration.Curr. Opin. Colloid
Interface Sci.2001, 6, 342-349.
(3) Krishnan, A.; Sturgeon, J.; Siedlecki, C. A.; Vogler, E. A. Scaled InterfacialActivity of Proteins at the Liquid-Vapor Interface.J. Biomed. Mat. Res.2004,68A, 544-557.
(4) Krishnan, A.; Siedlecki, C.; Vogler, E. A. Traube-Rule Interpretation ofProtein Adsorption to the Liquid-Vapor Interface.Langmuir2003, 19, 10342-10352.
(5) Krishnan, A.; Siedlecki, C. A.; Vogler, E. A. Mixology of Protein Solutionsand the Vroman Effect.Langmuir2004, 20 (12), 5071-5078.
(6) Krishnan, A.; Wilson, A.; Sturgeon, J.; Siedlecki, C. A.; Vogler, E. A.Liquid-Vapor Interfacial Tension of Blood Plasma, Serum and Purified ProteinConstituents Thereof.Biomaterials2005, 26, 3445-3453.
(7) Krishnan, A.; Liu, Y.-H.; Cha, P.; Allara, D. L.; Vogler, E. A. InterfacialEnergetics of Globular-Blood Protein Adsorption to a Hydrophobic Surface fromAqueous-Buffer Solution.J. R. Soc. Interface2006, 3, 283-301.
(8) Krishnan, A.; Liu, Y.-H.; Cha, P.; Allara, D. L.; Vogler, E. A. ScaledInterfacial Activity of Proteins at a Hydrophobic Solid/Aqueous-Buffer Interface.J. Biomed. Mater. Res.2005, 75A (2), 445-457.
(9) Krishnan, A.; Liu, Y.-H.; Cha, P.; Allara, D. L.; Vogler, E. A. InterfacialEnergetics of Blood Plasma and Serum Adsorption to a Hydrophobic Self-Assembled Monolayer Surface.Biomaterials2006, 27, 3187-3194.
(10) Vogler, E. A. Practical Use of Concentration-Dependent Contact Anglesas a Measure of Solid-Liquid Adsorption I: Theoretical Aspects.Langmuir1992,8, 2005-2012.
(11) Vogler, E. A. Practical Use of Concentration-Dependent Contact Anglesas a Measure of Solid-Liquid Adsorption II: Experimental Aspects.Langmuir1992, 8, 2013-2020.
(12) Vogler, E. A.; Martin, D. A.; Montgomery, D. B.; Graper, J. C.; Sugg,H. W. A Graphical Method for Predicting Protein and Surfactant AdsorptionProperties.Langmuir1993, 9, 497-507.
(13) Noh, H.; Vogler, E. A. Volumetric Interpretation of Protein Adsorption:Partition Coefficients, Interphase Volumes, and Free Energies of Adsorption toHydrophobic Surfaces.Biomaterials2006, 27, 5780-5793.
2553Langmuir2008,24, 2553-2563
10.1021/la703310k CCC: $40.75 © 2008 American Chemical SocietyPublished on Web 01/30/2008

to hydrophobic surfaces3-9 and interpreted these results in termsof amount adsorbed using standard Gibbsian surface thermo-dynamics.10,11 The depletion method, implemented with gelelectrophoresis as a separation and quantification tool, allowedus to quantify protein partition coefficients that measure adsorp-tion affinity for different surfaces,13,14as well as study adsorptioncompetition among a mixture of proteins for the same adsorbentsurface.15
This paper reports use of time-and-concentration-dependenttensiometry to measure interfacial energetics of protein adsorptionto surfaces spanning the full observable range of water wettability.Results confirm that Gibbsian surface thermodynamics can beused to model interfacial energetics deduced from advancingcontact angles under experimental conditions that avoid uncon-trolled protein deposition at the solid-vapor (SV) interface. Wefurther show that variation in the molecular structure of differentproteins has little discernible effect on the interfacial energeticsthat drives protein adsorption from aqueous solution.
2. Methods and Materials
Purified Proteins and Synthetic Surfactants.Table 1 compilespertinent details on proteins used in this work. Protein purity wascertified by the vendor to be no less than the respective values listedin column 4 of Table 1, as ascertained by electrophoresis (SDS-PAGE or IEP). Mass, concentration, and molecular weights suppliedwith purified proteins were accepted without further confirmation.Issues associated with protein purity, especially contamination withsurfactants, and the potential effect on measured interfacial tensionshave been discussed elsewhere.3 The single value given in Table 1(column 5) for physiological concentration of human proteins appliedin this work was middle of the range listed by Putnam17or Anderson.18
Serial dilutions of stock protein solutions (usually 10 mg/mL) wereperformed in 96-well microtiter plates (VWR) by (typically) 50:50dilution in phosphate buffered saline solution (PBS; 0.14 M NaCl,0.003 M KCl) prepared from powder (Sigma Aldrich) in distilled-deionized (18.2 MΩ-cm) water using procedures detailed in ref 3.Between 24-30 dilutions were prepared in this manner, covering
a dynamic range between 10-10% and 1% (w/v), taking care to mixeach dilution by repeated pipet aspiration and avoiding foaming ofconcentrated solutions. No attempt was made to correct for putativeprotein losses to pipet tips (Ranin Instruments) or microtiter platesused in this work.
Test Surfaces.Data for methyl-terminated self-assembled mono-layer surfaces (CH3 SAM) were taken from ref 7 and preparationprocedures are disclosed therein. Briefly, p-type⟨111⟩ electronic-grade silicon wafers (Montco Silicon Technologies, Inc., SpringCity, PA) were pre-cleaned in hot 1:4 H2O2 (30%)/H2SO4 followedby rinsing with distilled-deionized H2O and absolute ethanol.19-25
Gold-coated wafers were prepared by vapor deposition of chromiumand gold (99.99% purity) from resistively heated tungsten boatsonto clean 3-in-diameter silicon wafers at about 1× 10⁻⁸ Torr basepressure in a cryogenically pumped deposition chamber. The samplewas not allowed to rise above∼40°C during the evaporation. Filmthicknesses, monitored with a quartz crystal oscillator, were typically15 and 200 nm for chromium and gold, respectively. Chromium wasdeposited prior to gold to enhance adhesion to the substrate. Afterdeposition, the chamber was backfilled with research-grade nitrogen.Gold-coated samples were removed and immersed in 1 mM solutionsof 1-hexadecanethiol (CH3(CH2)15SH) in ethanol, contained in glassjars at ambient temperature, for at least 3 days. The alkanethiol(Aldrich Chemical Co., Milwaukee, WI) and ethanol (commercialreagent grade) were used as received, without further purification.Samples were stored in the thiol solution until use and were rinsedwith ethanol just prior to an experiment.
Polystyrene (PS) and aminopropyltriethoxysilane-treated (APTES)surfaces were prepared by spin-coating or silanization, respectively.
(14) Noh, H.; Vogler, E. A. Volumetric Interpretation of Protein Adsorption:Mass and Energy Balance for Albumin Adsorption to Particulate Adsorbents withIncrementally-Increasing Hydrophilicity.Biomaterials2006, 27, 5801-5812.
(15) Noh, H.; Vogler, E. A. Volumetric Interpretation of Protein Adsorption:Competition from Mixtures and the Vroman Effect.Biomaterials2007, 28, 405-422.
(16) Noh, H.; Vogler, E. A. Volumetric Interpretation of Protein Adsorption:Ion-Exchange Adsorbent Capacity, Protein pI, and Interaction Energetics.Biomaterials, 2006, in review.
(17) Putnam, F. W. Alpha, Beta, Gamma, Omega - The Roster of the PlasmaProteins. InThe Plasma Proteins: Structure, Function, and Genetic Control;Putnam, F. W., Ed.; Academic Press: New York, 1975; Vol. 1, pp 58-131.
(18) Anderson, N. L.; Anderson, N. G. The Human Plasma Proteome: History,Character, and Diagnostic Prospects.Mol. Cell. Proteomics2002, 1 (11), 845-867.
(19) Porter, M. D.; Bright, T. B.; Allara, D. L.; Chidseyi, C. E. D. SpontaneouslyOrganized Molecular Assemblies. 4. Structural Characterization of n-Alkyl ThiolMonolayers on Gold by Optical Ellipsometry, Infrared Spectroscopy, andElectrochemistry.J. Am. Chem. Soc1987, 109, 3559-3568.
(20) Nuzzo, R. G.; Dubois, L. H.; Allara, D. L. Fundamental Studies ofMicroscopic Wetting on Organic Surfaces 1. Formation and Structural Charac-terization of a Self Consistent Series of Polyfunctional Organic Monolayers.J.Am. Chem. Soc.1990, 112 (2), 558-569.
(21) Nuzzo, R. G.; Allara, D. L. Adsorption of bifunctional organic disulfideson gold surfaces.J. Am. Chem. Soc.1983, 105 (13), 4481.
(22) Nuzzo, R. G.; Fusco, F.; Allara, D. L. Spontaneously organized molecularassemblies. 3. Preparation and properties of solution adsorbed monolayers oforganic disulfides on gold surfaces.J. Am. Chem. Soc.1987, 109 (8), 2358.
(23) Nuzzo, R. G.; Dubois, L. H.; Allara, D. L. Fundamental studies ofmicroscopic wetting on organic surfaces. 1. Formation and structural characteriza-tion of a self-consistent series of polyfunctional organic monolayers.J. Am. Chem.Soc.1990, 112 (2), 558.
(24) Allara, D. L.; Nuzzo, R. G. Spontaneously Organized MolecularAssemblies. 2. Quantitative Infrared Spectroscopic Determination of EquilibriumStructures of Solution-Adsorbed n -Alkanoic Acids on an Oxidized AluminumSurface.Langmuir1985, 1 (1), 52-66.
(25) Nuzzo, R. G.; Fusco, F. A.; Allara, D. L. Spontaneously OrganizedMolecular Assemblies. 3. Preparation and Properties of Solution AdsorbedMonolayers of Organic Disulfides on Gold Surfaces.J. Am. Chem. Soc.1987,109, 2358-2368.
Table 1. Purified Proteins
name of protein(abbreviation)
molecularweight(kDa)
as-receivedform
(mg/mL)
[electrophoretic]purity/
biologic activity
physiologicconcentration(mg/100 mL)
[nominal value] vendor
human ubiquitin (Ub) 10.7 powder 98% 10-20 [15] Sigma-Aldrichhuman thrombin (FIIa) 35.6 powder 1411 NIH units/mg n/a Sigma-Aldrichhuman serum albumin
[fraction five] (FVHSA)66.3 powder 98% 3500-5500 [4500] Sigma-Aldrich
human prothrombin (FII) 72 powder 97% 5-10 [7.5] Enzyme Research Labs.human factor XII (FXII) 78 solution (2.1) 95% [4] Hematologic Technologieshuman immunoglobin-G (IgG) 160 powder 97% 800-1800 [1300] Sigma-Aldrichhuman fibrinogen (Fb) 340 powder 70% clottable protein 200-450 [325] Sigma-Aldrichhuman complement component
C1q (C1q)400 solution (1.1) single band by
immunoelectrophoresis10-25 [17.5] Sigma-Aldrich
humanR2-macroglobulin (R-mac) 725 powder 98% 150-350 [250] Sigma-Aldrichhuman immunoglobin-M (IgM) 1000 solution (1.7) single band by
immunoelectrophoresis60-250 [155] MP Biomedicals
2554 Langmuir, Vol. 24, No. 6, 2008 Cha et al.

Silicon wafers prepared as above were further oxidized by 12 minair plasma treatment (producing a surface referred to as SiOx). Athin PS layer was applied by spin-coating 1 mL of PS dissolved inreagent-grade toluene solution for 120 s at 5000 rpm in a spin-coating unit (Brewer Science, Inc., Rolla, MO). PS solution wasmade by dissolving bacteriological-grade PS culture dishes (Corning,Inc., Corning, NY) to a concentration of 80 mg/mL. Conformalcoatings were confirmed by visual inspection supplemented with“breath figures”.26-28 Profilometry (KLA-Tencor Corp., San Jose´,CA) further confirmed surface quality and demonstrated<10 nmroot-mean-square (rms) roughness. Atomic force microscopy (AFM)indicated a 0.24 nm rms roughness consistent with literature reports.29
APTES surfaces were prepared by immersing SiOxsurfaces (as above)in 10% APTES solution in absolute ethanol for 30 min followed by24 h cure at 110°C in a vacuum oven. APTES, ethanol, chloroform,and toluene were used as-received from the vendor (Aldrich ChemicalCo., Milwaukee, WI). Surfaces were used in tensiometric experimentsdirectly after preparation.
Tensiometry and Goniometry.Liquid-vapor (LV) interfacialtensions of protein solutions required by this work were measuredby pendant drop tensiometry (PDT) as described in refs 3 and 4.Tilting-plate goniometry (TPG) was performed using a commercialautomated goniometer (First Ten Angstroms Inc., Portsmouth, VA).The tilting-plate goniometer employed a Tecan liquid-handling robotto aspirate 12µL of protein solutions contained in a 96-well microtiterplate prepared by the serial-dilution protocol mentioned above. Therobot was used to reproducibly transfer the tip with fluid contentsinto a humidified (99+% RH) analysis chamber and dispense 10µLdrops of protein solution onto the surface of test substrata (see below)held within the focal plane of a magnifying camera. These and allother aspects of TPG were performed under computer control.Proprietary algorithms supplied by the vendor were used to deducecontact angles from drop images captured at a programmed rate bya frame grabber. Typically, 600 images were captured at a rate of1 image every 6 s following a 20 s delay to permit vibrations of theexpelled drop to dampen. Drop evaporation rates within thehumidified chamber deduced from computed-drop volumes (basedon image analysis) were observed to vary with solute concentration,generally ranging from approximately 25 nL/min for pure water to10 nL/min for solute solutions of>0.1% w/v. The impact of thisevaporation rate over the 60 min time frame of the experiment wasapparently negligible, as gauged from the behavior of purifiedsurfactants reported elsewhere.4,7 Precision ofθa was about(0.5°based on repeated measurement of the same drop. The analysischamber was thermostated to a lower limit of 25( 1 °C by meansof a computer-controlled resistive heater. The upper temperaturelimit was not controlled but rather floated with laboratory temperature,which occasionally drifted as high as 29°C during summer months.Thus, reportedθavalues were probably no more accurate than about1° on an intersample basis considering the small, but measurable,variation of water interfacial tension with temperature. This rangeof accuracy was deemed adequate to the conclusions of this reportwhich do not strongly depend on highly accurateθa that is difficultto achieve on a routine basis. Instead, veracity of arguments raisedherein depend more on a breadth of reliable measurements madeacross the general family of human proteins.
Test substrata were held on a rotating, tilting-plate platform drivenby stepper motors under computer control. Substrata were allowedto come to equilibrium within the sample-chamber environment forno less than 30 min before contact angle measurements were initiated.The platform was programmed to tilt at 1°/s from horizontal to 25°after the drop was deposited on the surface by the robot. The optimal
(incipient rolling) tilt angles were found to be 25° and 15° for solutionsof proteins and surfactants, respectively. The first 20 imagesmonitored evolution of the advancing angle. At the end of the 1 hθa measurement period, the platform was programmed to return tohorizontal and rotate 15° to the next analysis position along theperiphery of the semiconductor wafer. This process was repeatedfor all dilutions of the protein under study so that results reportedfor each protein were obtained on a single test surface, eliminatingthe possibility of substratum-to-substratum variation within reportedresults.
θa measurements by TPG employed in this work were verifiedagainst Wilhelmy-balance tensiometry (WBT) and found to agreewithin a percentage difference of 2.5( 1.9% for 50° < θa < 120°.30
Receding angles (θr) were shown to not be as reliable asθa and, asa consequence, onlyθa was analyzed in this work. It is worthwhilementioning in this context that WBT itself is inappropriate for studiesof protein adsorption at the SL interface (at least as applied herein)because (i) the technique requires thin plates that are difficult totwo-side coat with gold for thiol-SAM preparation, (ii) WBT generallyrequires high solution volumes (∼10 mL) that greatly exceedavailability of purified proteins, and (iii) the moving three-phaseline deposits solute (protein) at the SV interface making interpretationof the Gibbs’ surface excess parameter [Γsl - Γsv] highly ambiguous.1
Overall, we have found the tilting-plate method applicable tomeasuring adsorption, at least for hydrophobic and modestlyhydrophilic surfacesθa > 50°, and suitable for 1 h equilibrationtimes if a humidified chamber is used to control evaporation.10,11
However, it was observed that surfaces studied herein were slightlyunstable and subject to “hydration” that led to a systematic decreasein water/PBS contact angles with time. These hydration dynamicswere observed to be more pronounced on test surfaces that had beenincubated for long periods (>3 d) in the 100% RH atmosphere ofthe PDT analysis chamber (not shown). However, we do not believethis slight but apparently unavoidable attribute of surfaces supportedon silicon wafers negatively affects the veracity of conclusions basedon final, steady-stateΠa measurements made at∼1 h analysis time(see further below).
Theoretical Interpretation of Data. Adsorption of proteins wasobserved to affect liquid-vapor (LV) interfacial tensions andproduced concentration-dependent change in measured contact anglesθ, suggesting that either or both solid-vapor (SV) and solid-liquid(SL) tensions were likewise affected by protein adsorption. Contactangles were quantified using the Young equationτ ≡ γlv cosθ )γsv- γsl; whereτ is adhesion tension andγ the tension at the interfacedenoted by subscripts. Thus, contact angles were used to monitoradsorption to solid surfaces in accordance with refs 1, 10, and 11,and citations therein. Contact-angle isotherms monitored effects ofadsorption by plotting advancing contact anglesθa against lnCB
(see Figure 1 for examples); where bulk-phase concentrationsCB
range from 10-10% to 1% (w/v, see above). Contact-angle isothermswere sequentially interpreted in terms of adhesion-tension (τa vs lnCB) and spreading-pressure (Πa vs lnCB) isotherms, whereτa ≡ γlv
cosθa, Πa ) (τa - τao), γlv is the LV interfacial tension of the fluid
atCB, andτao is the adhesion tension of pure PBS buffer (γlv
o ) 71.97mN/m at 20°C). We monitored time dependence of all three isothermforms but herein interpreted only final measurements that achieveor approach steady state (a pseudo or “meso” equilibrium).31 Issuesassociated with steady-state adsorption and reversibility are takenup in the Discussion section.
Secure interpretation of measuredθa in terms ofτa depended onaccurate knowledge ofγlv at the bulk-phase surfactant concentrationin equilibrium with SL and LV interfaces. Thus, depletion of thebulk phase by solute adsorption might require, in some circumstances,correction of as-prepared bulk-solution concentrationCB. However,
(26) Bancroft, W. B. Breath Figures.Phil. Mag. 1892, 24 (5), 180-196.(27) Lee, Y.-L.; Chou, W.-S.; Chen, L.-H. The Adsorption and Nucleation of
Water Vapor on an Insoluble Spherical Solid Particle.Surf. Sci.1998, 414, 363-373.
(28) Frank, B.; Garoff, S. Temporal and Spatial Development of SurfactantSelf Assemblies Controlling Spreading of Surfactant Solutions.Langmuir1995,11, 4333-4340.
(29) Stange, T. G.; Mathew, R.; Evans, D. F. Scanning Tunneling Microscopyand Atomic Force Microscopy Characterization of Polystyrene Spin-Coated ontoSilicon Surfaces.Langmuir1992, 8, 920-926.
(30) Krishnan, A.; Liu, Y.-H.; Cha, P.; Allara, D. L.; Vogler, E. A. An Evaluationof Goniometric Methods.J. Colloid Interface Sci.2005, 43, 95-98.
(31) Tripp, B. C.; Magda, J. J.; Andrade, J. D. Adsorption of Globular Proteinsat the Air/Water Interface as Measured via Dynamic Surface Tension: Con-centration Dependence, Mass-Transfer Considerations, and Adsorption Kinetics.J. Colloid Interface Sci.1995, 173, 16-27.
Interfacial Energetics of Protein Adsorption Langmuir, Vol. 24, No. 6, 20082555
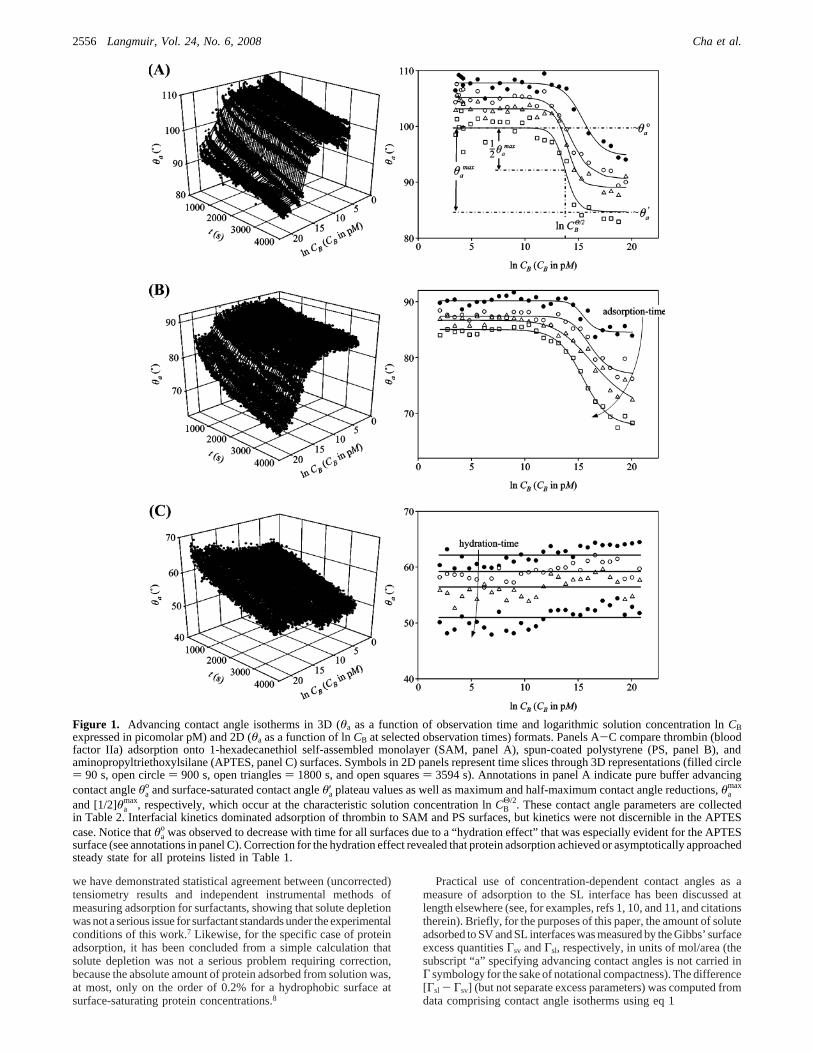
we have demonstrated statistical agreement between (uncorrected)tensiometry results and independent instrumental methods ofmeasuring adsorption for surfactants, showing that solute depletionwas not a serious issue for surfactant standards under the experimentalconditions of this work.7 Likewise, for the specific case of proteinadsorption, it has been concluded from a simple calculation thatsolute depletion was not a serious problem requiring correction,because the absolute amount of protein adsorbed from solution was,at most, only on the order of 0.2% for a hydrophobic surface atsurface-saturating protein concentrations.8
Practical use of concentration-dependent contact angles as ameasure of adsorption to the SL interface has been discussed atlength elsewhere (see, for examples, refs 1, 10, and 11, and citationstherein). Briefly, for the purposes of this paper, the amount of soluteadsorbed to SV and SL interfaces was measured by the Gibbs’ surfaceexcess quantitiesΓsv andΓsl, respectively, in units of mol/area (thesubscript “a” specifying advancing contact angles is not carried inΓ symbology for the sake of notational compactness). The difference[Γsl - Γsv] (but not separate excess parameters) was computed fromdata comprising contact angle isotherms using eq 1
Figure 1. Advancing contact angle isotherms in 3D (θa as a function of observation time and logarithmic solution concentration lnCBexpressed in picomolar pM) and 2D (θa as a function of lnCB at selected observation times) formats. Panels A-C compare thrombin (bloodfactor IIa) adsorption onto 1-hexadecanethiol self-assembled monolayer (SAM, panel A), spun-coated polystyrene (PS, panel B), andaminopropyltriethoxylsilane (APTES, panel C) surfaces. Symbols in 2D panels represent time slices through 3D representations (filled circle) 90 s, open circle) 900 s, open triangles) 1800 s, and open squares) 3594 s). Annotations in panel A indicate pure buffer advancingcontact angleθa
o and surface-saturated contact angleθ′a plateau values as well as maximum and half-maximum contact angle reductions,θamax
and [1/2]θamax, respectively, which occur at the characteristic solution concentration lnCB
Θ/2. These contact angle parameters are collectedin Table 2. Interfacial kinetics dominated adsorption of thrombin to SAM and PS surfaces, but kinetics were not discernible in the APTEScase. Notice thatθa
o was observed to decrease with time for all surfaces due to a “hydration effect” that was especially evident for the APTESsurface (see annotations in panel C). Correction for the hydration effect revealed that protein adsorption achieved or asymptotically approachedsteady state for all proteins listed in Table 1.
2556 Langmuir, Vol. 24, No. 6, 2008 Cha et al.

where dθa/d ln CB is the slope of a contact angle isotherm.Γlv )-1/RT(dγlv/d ln CB) is the surface excess at the LV interfacedetermined from separate measurement of concentration-dependentγlv of the solute under study.4 This form of the Gibbs’ adsorptionisotherm was appropriate for a single, isomerically pure non-ionizingsolute or a polyelectrolyte in swamping salt concentrations of buffersalts.4,32 It is also important to stress that [Γsl - Γsv] andΓlv valuesobtained without correcting concentrationCB for solute activity were“apparent” surface excess values that can substantially deviate fromthe authentic surface excess calculated from (dθa/dµ) and (dγlv/dµ);where µ is activity-corrected chemical potential.4,33,34 However,previous work suggests that the discrepancy between apparent andactual Γlv is roughly constant for the proteins of this study andapparent surface excess was about 60× larger than actual surfaceexcess,4,7 presumably because of the substantial nonideality ofcomplex polyelectrolytes. We thus assumed in this work that apparent[Γsl - Γsv] was also 60× larger than the actual, activity-correctedsurface excess because the ratio[(Γsl - Γsv)]/Γlv ≈ 1 forhydrophobic surfaces for whichΓsv≈ 0 (as discussed further below).Comparison of tensiometric and instrumental measures of adsorptionof surfactant standards confirms this factor.7
For surfaces exhibitingθa> 60° and under experimental conditionsthat avoid inadvertent mechanical deposition of solute at the (SV)interface, as through drop movement on the surface or evaporationfor examples, it has been shown thatΓsv ≈ 0 and [Γsl - Γsv] fΓsl.1,10,11Under the additional restrictions that (i) solute activities atSL and LV interfaces are approximately equal and (ii)Γsl ≈ Γlv, itcan be expected that[(Γsl - Γsv)]/Γlv ≈ 1. Experimental resultsconfirm that these stringent physical conditions prevail for LV andCH3 SAM surfaces, and it is therefore concluded that apparent [Γsl
- Γsv] ≈ Γsl for proteins reported herein adsorbing to hydrophobicsurfaces.7 However, solute adsorption to the SV interface becomesincreasingly pronounced with increasing hydrophilicity which caused[Γsl - Γsv] < 0, as further described in refs 10 and 11.
Computation and Data Representation.Computational, sta-tistical, and theoretical methods used in this work have been discussedin detail elsewhere.1,3,4,8,10,11Briefly, time-dependentθa data cor-responding to protein dilutions (see above) were recovered fromTPG files and correlated with concentrations, leading to a matrixof results with row values representing concentration and time (inseconds) as column values. It was generally observed thatθaisothermswere sigmoidal in shape when plotted on logarithmic-concentrationaxes,1,10 with well-defined low-concentration asymptoteθa
o andhigh-concentration asymptoteθ′a (see Figure 1). Successive non-linear least-squares fitting of a four-parameter logistic equation [θa
) (θao - θ′a)/1 + (ln CB
Θ/2/ln CB)M + θ′a] to contact angle isothermsdata for each time within the observation interval quantifiedparametersθa
o andθ′a with a measure of statistical uncertainty.1,10,11
Fitting also recovered a parameter measuring concentration-at-half-maximal-change inθa, ln CB
Θ/2 (whereΘ/2 ) 1/2Θmax andΘmax ≡θa
o - θ′a), as well as a parameterM that measured steepness of thesigmoidal curve. This multiparameter fitting to concentration-dependentθa data was a purely pragmatic strategy that permittedquantification of best-fit protein and surfactant characteristics butis not a theory-based analysis.1,3,4,6,10,11Three-dimensional (3D)representations of time-and-concentration-dependentθa data werecreated inSigma Plot(v9) from the data matrix discussed above andoverlain onto fitted mesh computed from least-squares fitting. Two-dimensional (2D) representations were created from the same datamatrices at selected observation times. Measuredθa were converted
to advancing adhesion tensionτa ) γlv cos θa for generalinterpretation;1 whereγlv was the interfacial tension of the contactangle fluid. Adhesion tensionsτa
o ) γlv cos θao (pure saline) and
τ′a ) γ′lv cosθ′a (at the minimum contact angle observedθ′a) werecomputed with fitted parametersγlv
o andγ′lv reported in refs 3 and4 for the proteins under investigation. Smoothed adhesion-tensionisotherms (τa vs ln CB) were computed from smoothedθa usingsmoothedγlv values computed from best-fit parameters reported inrefs 3 and 4. Likewise, smoothed spreading pressure isotherms(Πa vs ln CB) were computed from smoothedτa curves, whereΠa ≡ (τa - τa
o).
3. Results
Surface Stability. Pure PBS advancing contact anglesθao on
spun-coated polystyrene (PS) and aminopropyltriethoxysilane-treated (APTES) SiOx surfaces were observed to monotonicallydecrease with observation time, while PBS interfacial tensionγlv (measured by PDT) remained constant, as shown in Figure2 (compare open and closed circles). Specifically, it was observedthatθa
o of a pure PBS droplet on PS slowly decreased with timefrom the initial value of 91° < θa
o < 89° at t ) 0 to 86° < θao
< 84° at t ) 1 h. The range of reported results corresponds toall 10 PS surfaces analyzed during the course of this work. Asimilar effect was noticed on all 4 APTES surfaces analyzedduring the course of this work, although a wider range amongall 4 APTES surfaces att ) 0 was observed. A similarphenomenon was observed in the methyl-terminated SAM case.7
Constantγlv is strong evidence that the PBS used in contactangle measurements was not contaminated with surface-activesolute(s) that adsorb to surfaces. We are thus inclined to attributethis modest decrease in test-surface wettability with time to“surface hydration” in which water slowly permeates into thenear-surface region, increasing wettability of test surfaces.7
Surface hydration apparently affected time-dependent measure-ment of protein-solution contact angles because we observedthat the whole contact angle isotherm (θavs concentration) slowlyshifted lower with time (see Figure 1, annotation in panel B).Steady-state spreading pressureΠa isotherms effectively correctfor the SAM hydration effect in the adsorption measurement by
(32) Rosen, M. J.Surfactants and Interfacial Phenomena; Wiley: New York,1978; p xiv, 304.
(33) Frommer, M. A.; Miller, I. R. Adsorption of DNA at the Air-WaterInterface.J. Phys. Chem.1968, 72 (8), 2862-2866.
(34) Strey, R.; Vilsanen, Y.; Aratono, M.; Kratohvil, J. P.; Yin, Q.; Friberg,S. E. On the Necessity of Using Activities in the Gibbs Equation.J. Phys. Chem.B 1999, 103 (43), 9112-9116.
[Γsl - Γsv] ) -[γlv sin θa]
RT ( dθa
d ln CB) + [Γlv cosθa] (1)
Figure 2. Advancing contact anglesθao for pure phosphate-
buffered saline solution (PBS, left axis, closed circles) on spin-coated polystyrene (PS) decrease monotonically with observationtime due to a time-dependent “hydration” of the PS surface whileliquid-vapor interfacial tension (γlv
o , right axis, open circles)remains constant. Surface hydration also affectsθa adsorptionisotherms shown in Figure 1 (arrow-annotation, panel C). Rawadsorption kinetics of human blood factor XII (FXII, 20 mg mL-1)to PS (closed triangles) can be corrected for hydration effects (opentriangles) by subtracting reduction observed inθa
o, revealing thatadsorption comes to steady state within the 1 h observation window.
Interfacial Energetics of Protein Adsorption Langmuir, Vol. 24, No. 6, 20082557

normalizing to finalτao; that is to say time-dependent,Πa ) (τa
- τao) subtracts any time dependence inτa
o. A similar strategy wasapplied to analysis of protein adsorption kinetics, as furtherillustrated in Figure 2 (compare closed triangles and opentriangles). At any timet, reduction in pure PBS contact angledue to hydration (closed circles, Figure 2) was added to therecordedθa for a protein-containing solution (closed triangles)to “correct” observedθafor the hydration effect (open triangles).This correction procedure typically eliminated the long-termdownward drift inθa observed for protein-containing solutions(see filled triangles, Figure 2, for example), suggesting thatprotein-adsorption kinetics had, in fact, dampened within the 1h observation period; as had been generally observed foradsorption of these same proteins at the LV surface3-6,35 forwhich no such hydration phenomena occurs.
General Aspects of Adsorption Data.Figure 1 comparescontact-angle isotherms obtained for the proteolytic enzymethrombin (blood factors IIa, FIIa) adsorbing to methyl-terminatedSAM (previously reported in ref 7), PS, and APTES surfaces.Isotherms for all proteins listed in Table 1 were similar andapparently reached or asymptotically approached steady statewhen data were corrected for surface hydration as discussedabove. Adsorption kinetics were monitored only to verify thatsteady state was achieved and kinetics were not further analyzedin this work. The full-range effect onθa at steady state was lessthan about 20°, especially for APTES for which a definitiveaffect by adsorption was difficult to discern (panel C, Figure 1).
Table 2 compiles quantitative parameters derived from statisticalfitting of data that permits numerical comparison of adsorptionresults to PS and APTES surfaces. Contact angle parametersθa
o,θ′a, ln CB
Θ/2, andM listed in cols 2-5 of Table 2 are the meanfitted values corresponding to final 25θacurves recorded withinthe 60 min time frame of the TPG experiment. The listed erroris the standard deviation of this mean. Ubiquitin does not saturatethe interface, as previously observed for the CH3 SAM surface.Table 2 lists only the graphical estimates of the parameters (seeref 7 for more discussion).
Figure 3 traces sequential interpretation of steady-state (1 hdrop age), concentration-dependentθa data (panel A) in termsof concentration-dependent adhesion tensionτa (panel B) andspreading pressureΠa (panel C) for human serum albumin (FVHSA). Steady-state (equilibrium) spreading pressure isothermsΠa were used as the basis of comparison of protein adsorptionfor the compounds listed in Table 1. Corresponding adhesiontensionsτa
o andτ′a (Table 2, columns 6, 7) were computed fromθa
o and θ′a values, respectively, with uncertainty estimatescomputed by propagation of error inθa andγlv measurements(Materials and Methods). Maximum spreading pressureΠa
max≡(τ′a - τa
o) (column 8) was computed directly from aforemen-tionedτa values and associated uncertainty again estimated bypropagation of error. Adsorption of the four proteins listed inTable 2 to APTES (selected to span the entire molecular weightrange) verified that adsorption to this surface was effectively notmeasurable by contact angles (see Figure 1C). No data are listedin Table 2 for water-wettable SiOx surfaces, because both PBSand protein solutions spread with contact angle less than 10°,implying that no protein adsorbed to water-wettable surfaces, in
(35) Ariola, F.; Krishnan, A.; Vogler, E. A. Interfacial Rheology of BloodProteins Adsorbed to the Aqueous-Buffer/Air Interface.Biomaterials2006, 27,3404-3412.
Table 2. Steady-State Protein Adsorption Parameters
name of protein (abbreviation) θ°a (°) θ′a (°)ln CB
Θ/2
(PPT [pM])M
(dimensionless)τ°a
(mN m-1)τ′a
(mN m-1)Πa
max
(mN m-1)
Spin-Coated Polystyrene (PS) Surfacehuman ubiquitin (Ub)a 85.0( 0.3 63.3 21.5 [19.2] 6.3 12.9 6.6human thrombin (FIIa) 85.1( 0.3 65.2( 1.3 19.0( 0.3
[15.4( 0.3]-13.2( 2.0 6.2( 0.4 20.3( 1.0 14.0( 1.4
human serum albumin [fraction five] (FVHSA) 82.6( 0.7 57.0( 1.2 14.7( 0.3[10.6( 0.3]
-8.4( 1.4 9.2( 0.9 25.3( 0.8 16.1( 1.6
human prothrombin (FII) 84.3( 0.3 69.0( 0.5 16.9( 0.2[12.6( 0.2]
-21.8( 4.0 7.0( 0.4 15.8( 0.4 8.8( 0.7
human factor XII (FXII) 87.7( 0.3 66.3( 1.3 16.8( 0.3[12.5( 0.3]
-12.7( 2.1 2.8( 0.4 14.6( 0.7 11.8( 1.1
human immunoglobin-G (IgG) 83.6( 0.6 67.7( 1.2 16.2( 0.4[11.1( 0.4]
-11.1( 2.8 8.0( 0.7 19.5( 1.0 11.5( 1.7
human fibrinogen (Fb)prep. 1 83.1( 0.3 65.9( 0.4 16.3( 0.1
[10.5( 0.1]-21.7( 3.2 8.4( 0.4 19.4( 0.3 11.0( 0.7
prep. 2 84.0( 0.3 64.7( 0.4 15.5( 0.1[9.7 ( 0.1]
-19.5( 2.3 7.4( 0.4 20.4( 0.8 13.0( 1.2
human complement component C1q (C1q) 85.3( 0.3 66.1( 1.2 16.0( 0.3[10.0( 0.3]
-10.7( 1.5 5.9( 0.3 22.0( 1.0 16.1( 1.4
humanR2-macroglobulin (R-mac) 82.5( 0.3 67.1( 0.5 16.9( 0.2[10.3( 0.2]
-19.7( 3.0 9.3( 0.3 22.2( 0.4 12.9( 0.8
human immunoglobin-M (IgM) 82.8( 0.4 63.4( 0.9 14.4( 0.2[7.5 ( 0.3]
-10.6( 1.7 9.0( 0.5 22.6( 0.7 13.6( 1.2
Aminopropyltriethoxysilane-Treated (APTES) Surfacehuman thrombin (FIIa) 49.5( 0.2 52.7( 0.4 14.9( 0.2
[11.3( 0.2]54.8( 34.3 43.8( 0.2 31.3( 0.3 -12.4( 0.5
human serum albumin [fraction five] (FVHSA) 61.7( 0.4 54.3( 0.8 17.3( 1.1[13.1( 1.1]
-28.7( 0.8 27.1( 0.5 33.6( 0.4 6.6( 0.9
human complement component C1q (C1q) 52.9( 0.2 47.2( 0.5 11.0( 0.3[5.1 ( 0.3]
-5.6( 0.8 37.0( 0.4 43.2( 0.2 6.4( 0.6
human immunoglobin-M (IgM) 47.3( 0.1 53.7( 0.3 10.7( 0.1[3.8 ( 0.1]
22.5( 3.7 48.6( 0.2 29.9( 0.2 -18.6( 0.4
a Parameters are graphical estimates of fitted parameters. (See Results section.)
2558 Langmuir, Vol. 24, No. 6, 2008 Cha et al.

corroboration of previous studies.10-12,14 Otherwise, if proteinadsorbed to water-wetted SiOx surfaces, contact angles wouldbe expected to rise as a result of the accumulation of relativelyhydrophobic organic matter. Indeed, trace contamination ofhydrophilic surfaces is very easy to detect and can be troublesometo avoid.36
Figure 4 collectsΠa isotherms for selected proteins spanningthe molecular weight range 10< MW < 1000 kDa adsorbingto the PS surface. Only smoothed curves are shown for the sakeof clarity, but representativeθa,τa, andΠaisotherms with authenticdata are amply illustrated in Figures 1 and 3. The dynamic rangeof Πa≈ 20 mN/m was similar to that observed for these proteins
at the buffer-air3,4and CH3 SAM surface8,9andΠamaxfell within
a relatively narrow 5 mN/m band for the diverse set of proteinsstudied.4 Furthermore, the “Traube-rule-like” ordering of proteinadsorption observed at the LV interface4 was repeated at the SLinterface in that high-MW proteins reduceΠa to any arbitraryvalue at lower molarity than low-MW proteins, as suggested bythe horizontal arrow annotation on Figure 4.
Apparent Gibbs’ Surface Excess.Adsorption to the solid-liquid (SL) surface was interpreted in terms of the apparent Gibbs’excess parameter [Γsl - Γsv] computed using eq 1 applied tocontact-angle isotherms (see ref 7 for example calculations). Asnoted previously, the term “apparent” alerts the reader to the factthat casual application of Gibbs’ adsorption isotherm usingCB
instead of activity treats solutes (proteins and surfactants) asisomerically pure, non-ionized polyelectrolytes33 at infinitedilution with unit activity coefficients.34 Table 3 collects resultsfor proteins studied in this work. The averageΓlv ) 179( 27pmol/cm2 previously reported to be characteristic of the proteinslisted in Table 14 was used in calculation of [Γsl - Γsv] and[(Γsl
- Γsv)]/Γlv.Figure 5A shows the MW dependence of apparent [Γsl - Γsv]
adsorbing to the PS surface and compares these results toΓlv
(panel B; data from ref 4) for these proteins adsorbing to thebuffer-air surface, as well as the ratio[(Γsl - Γsv)]/Γlv (panelC). Figure 6 plots [Γsl - Γsv] (panel A) and[(Γsl - Γsv)]/Γlv(panel B) as a function of surface wettability, where the buffer-air surface is assigned an adhesion tension equal to-73 mN/mcorresponding to a hypothetical contact angle of 180° that wouldbe characteristic of a completely non-wetting surface. Note that[Γsl - Γsv] ) -Γlv for the fully wetted SiOx surface, which isthe θa f 0° limit on eq 1.10,11
4. Discussion
Adsorption Reversibility. One of the more contentious issuesin the protein-adsorption literature is reversibility of the proteinadsorption process. As a consequence, applicability of thermo-dynamic models such as Gibbs’ surface excess to tensiometricdata is frequently called into question. Needless to say perhaps,achievement of true thermodynamic equilibrium under experi-mental conditions such as those applied herein is not realisticallypossible because the semiclosed tensiometer chamber inevitablyallows slow evaporation of small droplets and is relatively crudelythermostatedsto say nothing of slow surface hydration effectsdiscussed in the preceding section. Indeed, the experimentallyobserved steady state achieved or asymptotically approached
(36) Ratner, B. D.; Rosen, J. J.; Hoffman, A. S.; Scharpen, L. R. An ESCAStudy of Surface Contaminants on Glass Substrates for Cell Adhesion.Proc. Int.Symp. Contam. Control1978, 4, 669-686.
Figure 3. Sequential interpretation of a steady-state (t ) 3600 s)contact angle isotherm for human serum albumin (FVHSA) adsorbingonto polystyrene (PS). Advancing contact angles (θa, panel A) areconverted into advancing adhesion tensions (τa, panel B) andadvancing spreading pressures (Πa, panel C). Smoothed curvesthrough the data are guides to the eye. Annotations identify low- andhigh-concentration asymptotes for contact angles (θa
o, θ′a), adhesiontensions (τa
o, τ′a), respectively, and maximum spreading pressure (Πa
max), used to characterize protein adsorption isotherms (Table 2).
Figure 4. Comparison of steady-state spreading pressure (Πa)isotherms for selected proteins spanning 3 orders of magnitude inmolecular weight (see Table 1) adsorbing to spun-coated polystyrene(PS). Smooth curves are guides to the eye. Molar concentrationscaling reveals a “Traube-like rule” ordering among diverse proteinssimilar to that observed for proteins adsorbed to the buffer/air andbuffer/SAM interfaces wherein molar concentration required to reacha specifiedΠa value decreased with increasing MW (see arrowannotation).
Interfacial Energetics of Protein Adsorption Langmuir, Vol. 24, No. 6, 20082559

within 1 h drop age in tensiometric experiments has been referredto as a “pseudo” or “meso” equilibrium,10,11 in recognition oflonger-term protein-denaturation effects that can include loss ofhigher-order structure and commensurate changes in molarvolume (see ref 37 and citations therein) that can slowly affectmeasured interfacial tensions. Thus, true thermodynamic equi-librium is a forgone conclusion. Rather, the practical issue athand is whether protein adsorption observed herein achieves asteady state that is due to a substantially reversible process thatcan be meaningfully modeled using propositions based onthermodynamic ideality.
Although adsorption reversibility is technically challengingto prove, it turns out that irreversible adsorption is quitestraightforward tounambiguously disproVe for those circum-stances in which this may occur, thereby eliminating irreversibleadsorption as an argument that can be sensibly made againstapplication of thermodynamics as an analysis tool. We haveshown that protein adsorption to many surface types is notinherently irreversible using the standard solution-depletionmethod of measuring adsorption supplemented with protein-adsorption competition studies.13-16 The basic idea behind thedepletion method is to measure the concentration of proteini insolution before and after contact with test particulate adsorbents.The depletion method is thus substantially free of experimentalartifacts, such as solute labeling, rinsing/drying, or complicatedinstrumentation. Using the depletion method under similarexperimental conditions applied in tensiometric studies discussedherein (adsorption from stagnant fluids), we have shown thatadsorption isotherms are linear with protein-solution concentra-tion, consistent with a simple Henry isotherm, with fractionalslope up to surface saturation.13,14,16Fractional slope means thatprotein distributes between solution and surface region in a mannerconsistent with reversible adsorption controlled by a modestpartition coefficient Pi over a broad concentration range.Otherwise, if protein adsorbed irreversibly or with very highavidity (i.e.,Pi f ∞), then the adsorbent would completely orsubstantially deplete the solution of protein, leading to unitaryslopes, because the measured solution depletion would equal theinitial solution concentration. Because this is not the case for a
wide variety of proteins adsorbing to surfaces spanning the fullrange of water wettability, including ion-exchange surfaces,16
we conclude that protein adsorption is not an inherentlyirreversible process. Specifically, we mean by this that, althoughprotein may irreversibly adsorb to some surfaces under certainexperimental conditions, we do not observe irreversible proteinadsorption to the surfaces studied herein under experimentalconditions applied. Furthermore, using protein adsorptioncompetition as a probe of irreversible adsorption, we havedemonstrated that proteinj can displace proteini adsorbed to abroad range of surfaces.5,15,16Displacement of proteini by proteinj is not possible if proteini is irreversibly adsorbed, corroboratingour conclusion that protein adsorption is not an inherentlyirreversible process.
More inferential lines of evidence supporting reversibleadsorption include:7
1. Concentration-dependentγlv andθa of proteins spanningthree decades in MW (referred to as “protein” or “proteins”below) were like those obtained with small-molecule surfactantsin that both followed expectations of Gibbs’ adsorption iso-therm10,11with a linear-like decrease inγlv andθa as a functionof concentration expressed on a logarithmic concentration axis.
2. Surface excess values (Γlv and [Γsl - Γsv]) computed fromGibbs’ isotherm for surfactant standards agreed with indepen-dent instrumental methods of analysis within experimentalerror, and surface excess values for proteins adsorbed to buffer-air and methyl-terminated SAM surfaces were statisticallyidentical.7
3. Concentration-dependentγlv andθacontinuously decreasedas a function of protein solution concentration, well past theconcentration required to fill the surface at theoretical monolayercoverage anticipated for irreversible adsorption.3-5,7-9
4. Proteins were observed to be weak surfactants1,38consistentwith weakly adsorbed compounds with a commensurately lowpartition coefficient deduced from concentration-dependentγlv
measurements.4Free energy of protein adsorption to hydrophobicsurfaces calculated from these partition coefficients were in goodagreement with values measured by hydrophobic interactionchromatography.13,39
(37) Birdi, K. S.Lipid and biopolymer monolayers at liquid interfaces; PlenumPress: New York, 1989; p x, 325.
(38) Vogler, E. A. Structure and Reactivity of Water at Biomaterial Surfaces.AdV. Colloid Interface Sci.1998, 74 (1-3), 69-117.
Table 3. Gibbs’ Surface Excess
apparent surface excessa (picomoles/cm2)
name of protein (abbreviation) [Γsl - Γsv] Γlv [(Γsl - Γsv)]/Γlv
Spin-Coated Polystyrene (PS) Surfacehuman ubiquitin (Ub)b 148 179( 27 0.8human thrombin (FIIa) 68.5( 23.4 0.4( 0.2human serum albumin [fraction five] (FVHSA) 77.7( 29.3 0.4( 0.3human prothrombin (FII) 128( 38 0.7( 0.4human factor XII (FXII) 123( 29 0.7( 0.3human immunoglobin-G (IgG) 68.1( 33.0 0.4( 0.3human fibrinogen (Fb)
prep. 1 184( 41 1.0( 0.5prep. 2 200( 32 1.1( 0.4
human complement component C1q (C1q) 89.8( 21.9 0.5( 0.2humanR 2-macroglobulin (R-mac) 116( 25 0.6( 0.3human immunoglobin-M (IgM) 100( 29 0.6( 0.3
Aminopropyltriethoxysilane-Treated (APTES) Surfacehuman thrombin (FIIa) -214( 61 179( 27 -1.2( 0.6human serum albumin [fraction five] (FVHSA) -4.2( 46.8 -0.0( 0.3human complement component C1q (C1q) 90.0( 1.1 0.5( 0.1human immunoglobin-M (IgM) -222( 27 -1.2( 0.1
a Apparent [Γsl - Γsv] or Γlv is computed without activity correction. (See Discussion section.)b Parameters are graphical estimates of fittedparameters. (See Results section.)
2560 Langmuir, Vol. 24, No. 6, 2008 Cha et al.

5. Protein adsorption to hydrophobic surfaces followed a“Traube-like” ordering wherein the molar concentration requiredto achieve an arbitrary spreading pressure decreased in regularprogression with MW.
6. Competitive-protein adsorption experiments at hydrophobicsurfaces demonstrate protein displacement that follows a mass-balance exchange predicated on reversible adsorption.5,15
These overlapping and independent lines of evidence40-44(seealso ref 38 for a review) supports application of Gibbsian surfacethermodynamics as a reasonable model to quantify concentration-
dependent interfacial tensions and contact angles as long as thenonideal behavior of polyelectrolyte adsorbents is borne in mindin the interpretation of apparent surface excess values.
Apparent Gibbs’ Surface Excess.Figure 5 compares theMW dependence of apparent [Γsl - Γsv] (panel A) for proteinsof Table 1 adsorbing to the PS surface toΓlv (panel B; data fromref 4) and the ratio[(Γsl - Γsv)]/Γlv (panel C). It is evident
(39) Chen, W.-Y.; H.-M. H. Lin, C.-C.; Lin, F.-Y.; Chan, Y.-C. Effect ofTemperature on Hydrophobic Interaction between Proteins and HydrophobicAdsorbents: Studies by Isothermal Titration Calorimetry and the van’t HoffEquation.Langmuir2003, 19 (22), 9395-9403.
(40) Kamyshny, A.; Lagerge, S.; Partyka, S.; Relkin, P.; Magdassi, S. Adsorptionof Native and Hydrophobized Human IgG onto Silica: Isotherms, Calorimetry,and Biological Activity.Langmuir2001, 17 (26), 8242 -8248.
(41) Brash, J. L. Protein Adsorption at the Solid-Solution Interface in Relationto Blood-Material Interactions. InACS Symposium Series; American ChemicalSociety: Washington, DC, 1987; Vol. 343, pp 490-506.
(42) Duinhoven, S.; Poort, R.; Voet, G. V. d.; Agterof, W.; Norde, W.; Lyklema,J. Driving Forces for Enzyme Adsorption at Solid-Liquid Interfaces. 1. The SerineProtease Savinase.J. Colloid Interface Sci.1995, 170, 340-350.
(43) Graham, D. E.; Phillips, M. C. Proteins at Liquid Interfaces.J. ColloidInterface Sci.1979, 70 (3), 415-426.
(44) Castillo, E.; Koenig, J.; Anderson, J. Protein Adsorption on HydrogelsII. Reversible and Irreversible Interactions Between Lysozyme and Soft ContactLens Surfaces.Biomaterials1985, 6, 338-345.
Figure 5. Apparent Gibbs’ surface excess for various proteins adsorbed to spin-coated polystyrene (PS) and buffer/air surface scaled byprotein molecular weight MW (error bars represent estimated 1σ confidence intervals derived from propagation of experimental error intotheoretical parameters). Gibbs’ surface excess parameters [Γsl - Γsv] (panel A, PS) andΓlv (panel B, buffer/air) reveal little statisticallydiscernable differences in the amount adsorbed to these surfaces among very different proteins spanning three orders of magnitude in MW.Panel C plots data as the ratio[(Γsl - Γsv)]/Γlv suggesting that approximately 35% less protein adsorbs to the PS surface than the buffer/airsurface (see Figure 6).
Interfacial Energetics of Protein Adsorption Langmuir, Vol. 24, No. 6, 20082561

from this data that the profound biochemical diversity amongthe broad range of proteins selected for study spanning nearlythree decades in MW had little measurable effect on the interfacialenergetics that controls the amount adsorbed to PS or LV surfacesfrom aqueous buffer solution.3,8 Adsorption to PS was similarto the methyl-terminated SAM surface in this regard.7 How-ever, the average [Γsl - Γsv] for the PS surface was about35% less than either the LV or CH3 SAM surface,7 presumablybecause PS was more hydrophilic (less hydrophobic), whichcommensurately reduced the overall driving force for proteinadsorption.
Figure 6A examines the relationship between protein adsorptionand surface wettability in greater detail by plotting the mean [Γsl
- Γsv] value for all proteins studied at each surface as a functionof water adhesion tension for CH3 SAM, PS, APTES, and fullywater-wettable SiOxsurfaces (see annotations for surface identity;error bars are the standard deviation of the mean; see Table 3).Figure 6C includes the LV case by plotting the ratio[(Γsl -Γsv)]/Γlv; where the ratio is unity by definition for the LV case(Figure 6B). It is evident from Figure 6 that surface excessgenerally decreased with surface wettability, passing through[Γsl - Γsv] ) 0 (no protein adsorbed ifΓsv ≈ 0) near a projectedsurface wettabilityτo ≈ 30 mN/m (θa ) 65°). This result is
consistent with the conclusion drawn from independent studies12,14
that water is too strongly bound to surfaces withτo g 30 mN/m(θa e 65°) to be displaced by adsorbing protein and that, as aconsequence, protein does not accumulate within the interfacialregion at concentrations exceeding that of bulk solution.38,45,46
It is further evident that [Γsl - Γsv] < 0 for surfaces withτo >30 mN/m (θa < 65°). Our interpretation is thatΓsv exceedsΓsl
on progressively hydrophilic surfaces because protein depositsat the SV interface by evaporation as drops spread thinly onhydrophilic surfaces. This process culminates withΓsv f Γlv asτo f 72 mN/m (θa f 0°), consistent with theoretical boundaryconditions on eq 1.10,11In general, the shape of the curve drawnthrough the data of Figure 6A,B is consistent with these boundaryconditions on eq 1, passing from maximal adsorption at the mosthydrophobic LV surface, through decreasing adsorption onincreasingly hydrophilic surfaces (methyl-terminated SAM andPS), to no measurable adsorption forτo g 30 mN/m surfaces.The “adsorption mapping method” is a much less labor-intensiveapproach to monitoring adsorption as a function of surface energythat leads to similar conclusions from data gathered using surfaceswith incrementally varied wetting properties.12
Adsorption is a complex process that has been measured andinterpreted in a number of different ways. No doubt thissignificantly contributes to the complexity of a contentiousprotein-adsorption literature that supports nearly every claimand counter claim (see ref 38 for more discussion). For example,protein adsorption is frequently construed to be an irreversibleprocess and protein remaining surface-bound after rinsing takento be an appropriate measure the amount adsorbed. Needless tosay perhaps, reliability of such “rinse-and-measure” methodsdepends on the veracity of the primary (sometimes preconceived)notion that adsorption is, in fact, irreversible. We report strongevidence herein that protein adsorption is not inherentlyirreversible. Consequently, our results are at variance with certainreports in the literature, especially those claiming proteinadsorption to water-wettable materials.1,38 Perhaps this discrep-ancy can be reconciled to some extent by emphasizing that Gibbs’adsorption isotherm measures adsorptionin excessof bulkconcentration, not the absolute amount of adsorbed protein. Thus,[Γsl - Γsv] e 0 should not be interpreted to mean that there isno protein within the interphase region of a surface. Rather, [Γsl
- Γsv] e 0 means there is no more protein at such a surface thanin the contacting bulk solution. Rinse-and-measure methods thatfail to remove all traces of bulk solution may, in fact, record thepresence of bound protein. Certainly, [Γsl - Γsv] < 0 should notbe interpreted as an SL interface significantly depleted in protein(Γsl < 0), because surface excess cannot be a large negativenumber.10,11
5. Conclusions
Concentration-dependent contact angles can be used to monitorprotein adsorption from aqueous-buffer solution to surfacesspanning the full range of water wetting characteristics. Adsorp-tion trends can be quantified from contact angles by the apparentGibbs’ surface excess parameter using as-prepared molar solutionconcentrations as a measure of solute chemical potential.However, estimation of absolute Gibbs’ excess quantities requirescorrection of apparent values by a factor of approximately 60to account for the nonideal chemical activity of proteins. ApparentGibbs’ surface excess varies by less than 25% for a broad range
(45) Vogler, E. A. Water and the Acute Biological Response to Surfaces.J.Biomater. Sci. Polym. Ed.1999, 10 (10), 1015-1045.
(46) Vogler, E. A. How Water Wets Biomaterials. InWater in BiomaterialsSurface Science; Morra, M., Ed.; John Wiley and Sons: New York, 2001; pp269-290.
Figure 6. Apparent Gibbs’ surface excess scaled as a function ofadsorbent surface water wettability (surface energy) as measured byPBS advancing adhesion tensionτa
o for proteins and surfaces usedin this study (see annotations for surface type; error bars representmean and standard deviation for all proteins listed in Tables 1 and2). Panel A shows that Gibbs’ surface excess parameter [Γsl - Γsv]decreases monotonically with increasing adsorbent-surface hydro-philicity, projecting [Γsl - Γsv] ) 0 nearτa
o ) 30 mN/m. Likewise,the ratio[(Γsl - Γsv)]/Γlv decreases from+1 to -1 (panel B) as[Γsl - Γsv] decreases from a maximum [Γsl - Γsv] ) Γlv at thehydrophobic SAM surface (τa
o ) -15 mN/m) to a minimum [Γsl -Γsv] ) -Γlv at the water-wetted (τa
o ) 73 mN/m) SiOx surfaces.Smoothed curves drawn through the data are guides to the eye.
2562 Langmuir, Vol. 24, No. 6, 2008 Cha et al.

of blood proteins spanning three decades in molecular weightadsorbing to any particular surface. This level of protein-to-protein variation cannot be confidently distinguished fromexperimental error in apparent surface excess. Thus, we concludethat the biochemical diversity among proteins studied has littleor no effect on the interfacial energetics that drives proteinadsorption from aqueous solution.3,4,6-9 Experiment shows thatprotein adsorption is not inherently irreversible and a variety ofevidence supports application of surface thermodynamics as amodeling tool to help understand energy balance in proteinadsorption.
Protein adsorption as measured by Gibbs’ excess decreaseswith increasing surface hydrophilicity to immeasurably smallvalues for surfaces exhibitingτo g 30 mN/m (θa e 65°). Theselatter results corroborate the conclusion drawn from independentstudies that water is too strongly bound to surfaces withτo g30 mN/m to be displaced by adsorbing protein and that, as aconsequence, protein does not accumulate within the interfacial
region of such surfaces at concentrations exceeding that of bulksolution ([Γsl - Γsv] ) 0 atτo ) 30 mN/m). Thus, it appears thatwater controls protein adsorption to surfaces and that themechanism of protein adsorption can be understood from thisperspective for a diverse set of proteins with very different aminoacid compositions.14
Acknowledgment. This work was supported, in part, by fromthe National Institute of Health PHS 2R01HL069965 and theAmerican Chemical Society Petroleum Research Fund grant#44523-AC5. Authors appreciate additional support from theMaterials Research Institute and Departments of Bioengineeringand Materials Science and Engineering, Penn State University.The authors appreciate the gracious assistance Mr. Nick Dellasand Professor Evangelos Manias with profilometry and atomicforce microscopy.
LA703310K
Interfacial Energetics of Protein Adsorption Langmuir, Vol. 24, No. 6, 20082563
![Geoffrey Bem Nyior, Sylvester Aondolumun Aye, Sesugh ...employed to improve fibre-polymer matrix interfacial bonding [14]. This treat-ment reduces the hydrophilicity of the fibres](https://img.pdfslide.us/doc/110x75/5f6d51431535c71b54587500/geoffrey-bem-nyior-sylvester-aondolumun-aye-sesugh-employed-to-improve-fibre-polymer.jpg)