Embed Size (px)
Citation preview

NSF /ENG-8507 2
P1387-148193
PMfSlEl REPORT NO. 85-4 DECEMBER 1985
INTERFACE SHEAR CAPACITY OF CONCRETE SURfACES USED IN STRENGTHENING STRUCTURES
By
Robert A. Bass
Ramon 1. Carrasquillo James O. Jirsa
Report on a Research Proiect Sponsored by
National Science Foundation Grant No. CEE-820120S
PHil M. FERGUSON STRUCTURAL ENGINEERING LABORATORY Department of Civil Engineering / Bureau of Engineering Research
The University of Texas at Austin

The contents of this report reflect the views of the authors who are responsible for the facts and accuracy of the data presented herein. The contents do not necessarily reflect the view or policies of the National Science Foundation. This report does not constitute a standard, specification, or regulation.
ii
Iv

'0272·'0' 1. ............. -- .... REPORT DOCUMEHTAnON II. IIUOWT NO. .
'AGE NSF/ENG-85072 P8817 .. 1 4 8 1 9 311S .. TIIte ...........
Interface Shear Capacity of Concrete Surfaces Used in Strengthening Structures
7. AulNr(u
R.A. Bass; R.L. Carrasquillo; J.O. Jirsa "~io"~-"""",,,_ University of Texas Phil M. Ferguson Structural Engineering Laboratory 10100 Burnet Road Austin, TX 78758
JZ. s.on-t ... Orpnlut .... Name .............
Directorate for Engineering (ENG) National Science Foundation 1800 G Street', N.W. Washington, DC 20550
~----------------------~---~-----.---------'IL ___ (Limit: 200 ~ --------._-
IL "-'*' o.te December 1985 ..
......... "' .. ~ ........ P}1FSEL '85-4
Ia. PN;ecclTeaIl/WMI UnIt .... . II. c.t.Kt(Q _ Qraftt{G) No.
(Q
(G) CEE8201205
,J4.
,- -----------1 Thirty-three push-off type specimens-were subjected to cyclic shear loading to study the effects of such variables as interface surface preparation, amount and depth of embedment of the interface· reinforcement, structural detailing of the concrete elements, and the compressive strength of both existing and-newly cast concrete elements on the shear capacity of reinforced concrete interfaces. Test results consisted of load-deformation relationships, maximum shear capacities, stress-slip envelopes, -and an evaluation of the failure mechanisms of the specimens. The shear stress-slip relationship for each specimen was determined for slip levels up to 0.5 in., and their peak and residual shear transfer capacities were evaluated. A comparison of the test results and,ACI 318-83 design strengths is presented to determine the ,effect of the depth of dowel embedment as it relates to the shear friction provisions of ACI. shear transfer capacity of reinforced concrete interfaces.
17. Document ... .,... .. ~
Structural engineering Shear properties Dowels Tests
............. /~T_
Earthquake engineeri~g
.. COSATI~/"'"
NTIS
Reinforced concrete Shear tests Maintenance Cyclic loads
... ,~ ... --11. ............
OI'TIONAL POItM Z72 (4-77) CF-"Y NTl5-U) ~., c.-fIl8fCe


INTERFACE SHEAR CAPACITY OF CONCRETE SURFACES USED
IN STRENGTHENING STRUCTURES
by
Robert A. Bass,
Ramon L. Carrasquillo,
and
James O. Jirsa
Report on a Research Project Sponsored by
National Science Foundation Grant No. CEE-8201205
Phil M. Ferguson Structural Engineering Laboratory Department of Civil Engineering BUREAU OF ENGINEERING RESEARCH
THE UNIVERSITY OF TEXAS AT AUSTIN
December 1985
, .. • t" /'
J)/
ACKNOWLEDGMENTS
The project was conducted as part of the Master of Science program of Mr. Robert A. Bass under the direction of Dr. Ramon L. Carrasquillo. Dr. James O. Jirsa directed the overall project. The valuable advice given by Loring Wyllie, Jr., Chris Poland, and John Dal Pino and others at H. J. Degenkolb Associates, with whom this proj ect was conducted jointly, is greated appreciated.
The authors would also Ii ke to express their sincere appreciation to all of the staff at the Ferguson Structural Engineering Laboratory whose advice and cooperation were invaluable to the completion of this research. The suggestions, encouragement, and a helping hand provided by Mr. Bass' fellow students, especially Mark Pavluvcik, Tim Overman, Kurt Swensson, Mike Newman, and Bill Gehrmann, is acknowledged.
iv
v
Chapter
2
3
4
CON TEN T S
INTRODUCTION ............................................. 1.1 1.2 1.3
Justification Objective Scope
........................................ ..............
LITERATURE REVIEW
2.1
2.2
Repair and Strengthening of Reinforced Concrete Structures Shear 2.2.1 2.2.2
Transfer Mechanisms Previous Research Summary · ......... .
• 0' •••••
. ........................ . EXPERIMENTAL PROGRAM ...................................... 3.1
3.2 3.3
3.4
Test Specimens · ..................................... . 3.1.1 Base Blocks (Existing Element) 3.1.2 Wing Walls (Strengthening Element) •••••••••••• 3.1.3 Interface Surface Preparation ••••••••••••••••• 3.1.4 Interface Reinforcement •••••••••••••••••••• 3.1.5 Materials and Quality Assurance ••••••••••••
3.1.5.1 Concrete · ........................ . 3.1.5.2 Steel Reinforcement 3.1.5.3 3.1.5.4 3.1.5.5 3.1.5.6
Test Frame
· ........................... . Formwork Drypack Mortar ....................... Epoxy ............................. Dowel Placement
Testing Procedures · ........ . ' .................. . 3.3.1 Preparation for Testing 3.3.2 Testing • ••••••••••••••••••••••••••••••••• 0 ••••
3.3.3 Instrumentation 3.3.4 Wing Wall Removal Data Acquisition
............................... •••••••••••••••••••••• 0" ••••
TEST RESULTS .............................................. 4.1 4.2 4.3 4.4
Load-Deformation Relationships Maximum Shear Capacities Stress Slip Envelopes ••••••••••••••• Failure Mechanisms
v
VI
Page
1 1 1
3
3 6 6
12
15
15 15 19 23 29 33 33 36 36 36 36 37 37 37 37 37 40 42 42
43
43 48 48 54
Chapter
5
6
DISCUSSION OF TEST RESULTS ••••••••••••••••••••••••••••••••
5.1 5.2 5.3 5.4 5.5
5.6 5.7 5.8
5.9
Introduction . It •••••••••••••••••••••••••••••••••••••••
Effect of Dowel Embedment •••••••••••••••••••••••••••• Effect of Base Block Concrete Compressive Strength •••
Interface Surface Preparation •••••••••••••• Structural Reinforcement Detailing ••••••••••
Effect Effect 5.5.1 5.5.2
Effect Effect Effect 5.8.1 5.8.2 5.8.3 5.8.4
of of Wing Wall Reinforcement ••••••••••••••••••••••• Base Block Reinforcement •••••••••••••••••••••• 5.5.2.1 Stirrup Spacing •••••••••••••••••••••• 5.5.2.2 Longitudinal Reinforcement ••••••••••• of Interface Reinforcement (No. of Dowels) of Wing Wall Width •••••••••••••••••••••••••••• of Casting Procedures ••••••••••••••••••••••••• Surface Bonding Agent ••••••••••••••••••••••••• Casting Position •••••••••••••••••••••••••••••• Concrete Vibration ........................... . Concrete Placement ..........•..••..••....•....
Comparison to ACI Shear Friction Provisions ••••••••••
CONCLUSIONS AND RECOMMENDATIONS •••••••••••••••••••••••••••
6.1 6.2 6.3 6.4
Summary •••••••••••••••• 0 •••••••••••••••••••••••••••••
Conclusions .................................. 0 •••••••
Design Implications ...............•................•. Further Research Needs •••••••••••••••••••••••••••••••
Page
59
59 59 61 63 65 65 65 65 65 67 67 69 69 69 71 71 71
77
77 77 78 79
REFERENC ES ••••••••••••••••••••••••••••• ~ • • • • • • • • • • • • • • • • • • • • • • • • • • • 81
vi

LIST OF TABLES
Table Page
3.1 Detai Is of Specimen 17
3.2 Concrete Mix Design 33
5.1 Specimen Design Strengths Using ACI 318-83 Shear Friction Provisions ••••••••••••••••••••••••••••••••• 73
5.2 Comparison of Measured and Computed Shear Capacity •.•••.•• 75
vii
\/UI
LIST OF FIGURES
Figure Page
2.1 Frame with columns strengthened by wing walls 5
2.2 Wing walls with dowel connections ......................... . 5
2.3 Shear-slip curves for various interface surface condi tions ............................................... . 7
2.4 Displacement along a cracked shear plane •••••••••••••••••• 7
2.5 Variation of shear strength with reinforcement parameter, pfy •••••••••.•••••••••••••••••••• 9
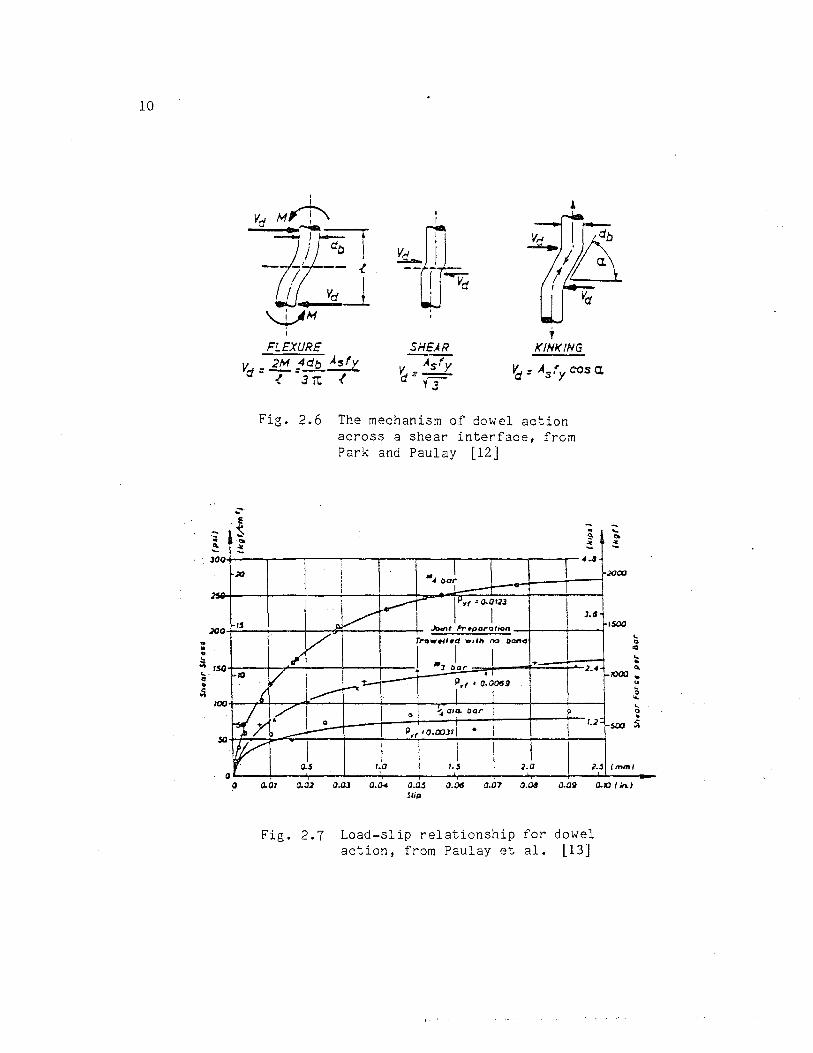
2.6 The mechanism of dowel action across a shear interface •••• 10
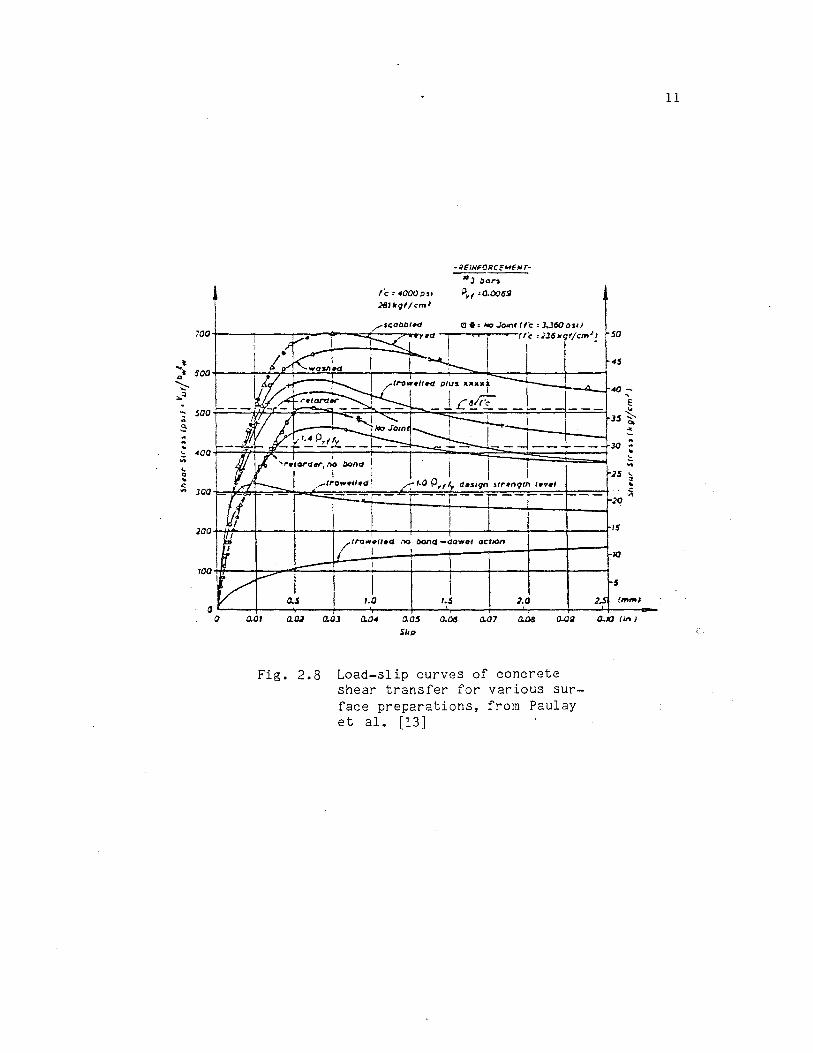
2.7 Load -s I ip relationsh ip for dowel act ion 10
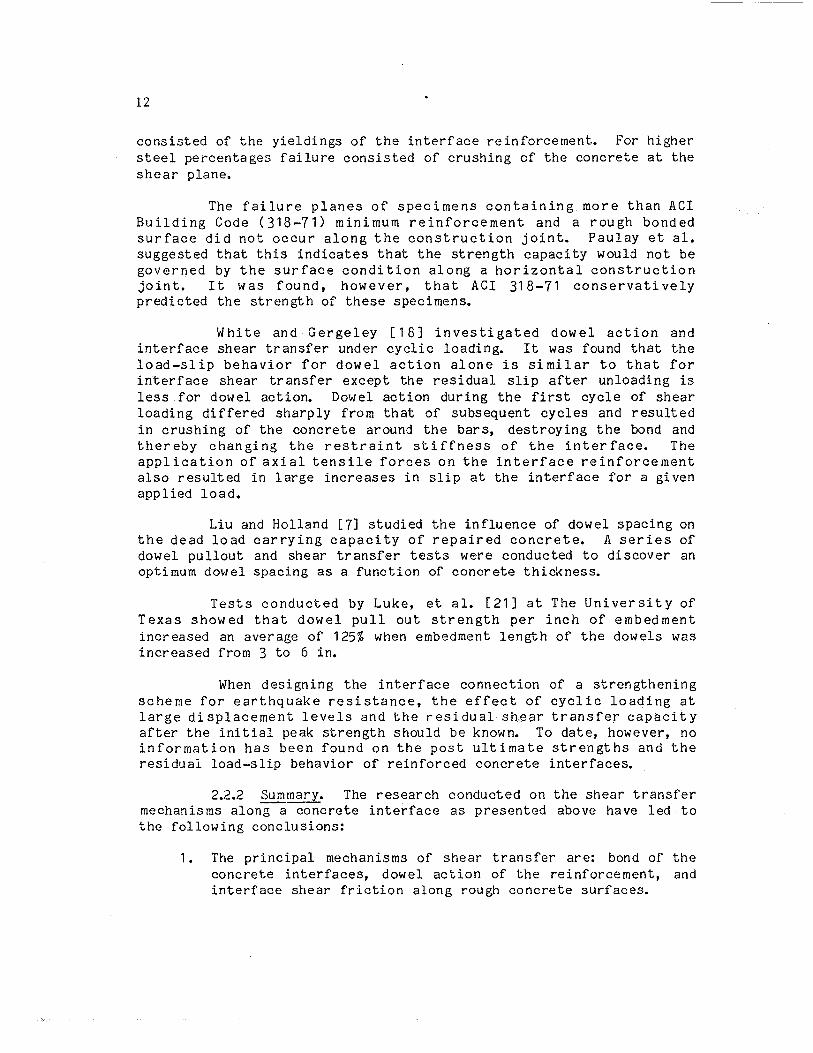
2.8 Load-slip curves of concrete shear transfer for various surface preparations ••••••••••••••••••••••••• 11
3.1 Test specimen dimensions •••••••••••••••••••••••••••••••••• 16
3.2 Typical test specimen before testing •••••••••••••••••••••• 16
3.3 Push off specimen details •••••••••••••••••••••••••••••••.• 18
3.4 Reinforcement details for base blocks 1-16,21-24 ••••••••• 20
3.5 Reinforcement details for base blocks 17-19 ••••••••••••••• 20
3.6 Reinforcement details for base block 20 ••••••••••••••••••• 20
3.7
3.8
3.9
3.10
3.11
3.12
3.13
Base block reinforcement •••••• II ••••••••••••••••••••••• • _ .•• 21
Base block reinforcement •••••••••• 0 ••••••••••••••••••••••• 21
Formwork insert details .................................. . 22
Wing wall reinforcement and formwork for shotcreted specimens .................................. 24
Wing wall reinforcement for 6-in. wide wing wall ••.•..•... 24
Wing wall reinforcement for horizontal casting position ••• 25
Wing wall reinforcement for vertical casting position ••••• 25 viii
Figure
3. 14
3.15
3.16
3.17
3.18
3.19
3.20
3.21
3.22
3.23
3.24
3.25
3.26
3.27
3.28
3.29
3.30
3.31
3.32
3.33
3.34
3.35
LIST OF FIGURES (continued)
Vertical casting position
Horizontal casting position ............................... Overhead casting position
~..,r in g wall formwork ........................................ Overhead casting position before drypacking •••••••••••••••
Untreated surface
Sandblasting operation
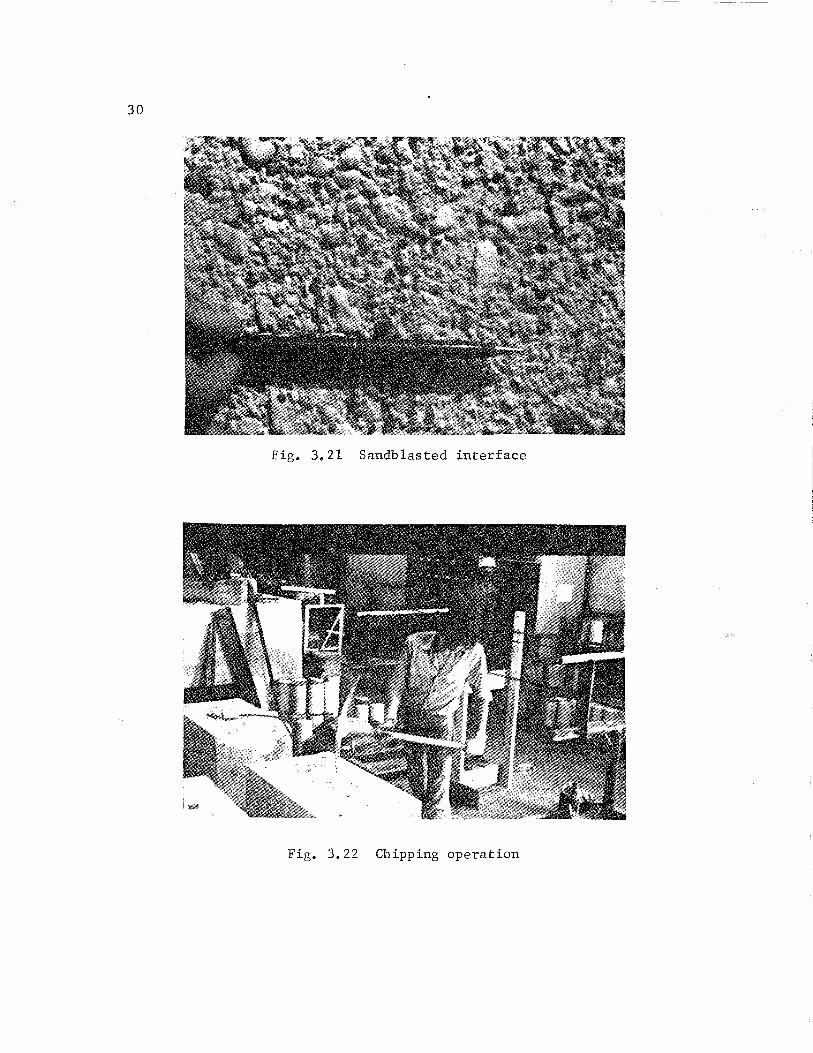
Sandblasted interface
Chipping operation
Chipped interface
Interface with shear keys
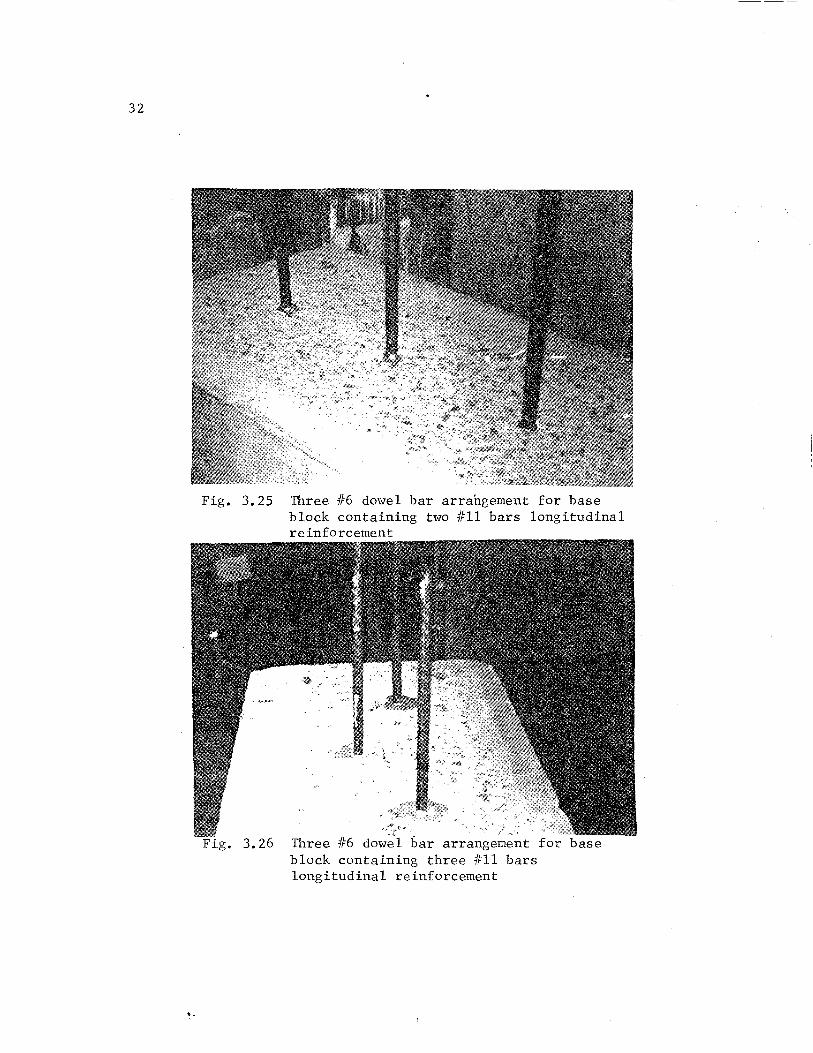
Three #6 dowel bar arrangement for base block containing two 1/11 bars longitudinal reinforcement
Three #6 dowel bar arrangement for base block containing three 1111 bars longitudinal reinforcement
Specimen casting operation ................................ Specimen casting operation
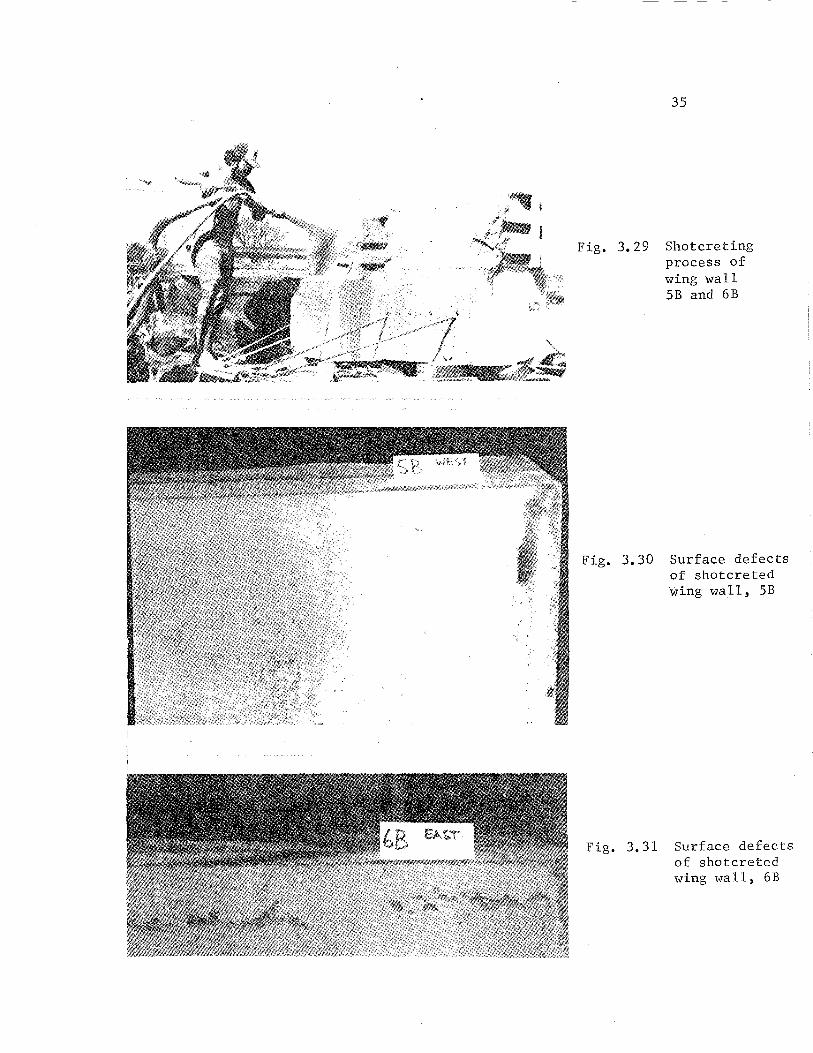
Shotcreting process of wing wall 58 and 68
Surface defects of shotcreted wing wall 58
Surface defects of shotcreted wing wall 68
Test fra me ................................................ Loading he ad assembly
Specimen in te st fra me ....................................
Displacement transducer locations
ix
;x
Page
26
26
26
27
27
28
28
30
30
31
31
32
32
34
34
35
35
35
38
39
39
41
LIST OF FIGURES (continued)
Figure Page
3.36 Horizontal and vertical displacement transducer connections, north or south end ••••••••••••••••••••••••••• 41
3.37 Horizontal displacement transducer connections, midsection ................................................ 41
4.1 Continuous load-slip relationship, Specimen 9A •••••••••••• 44
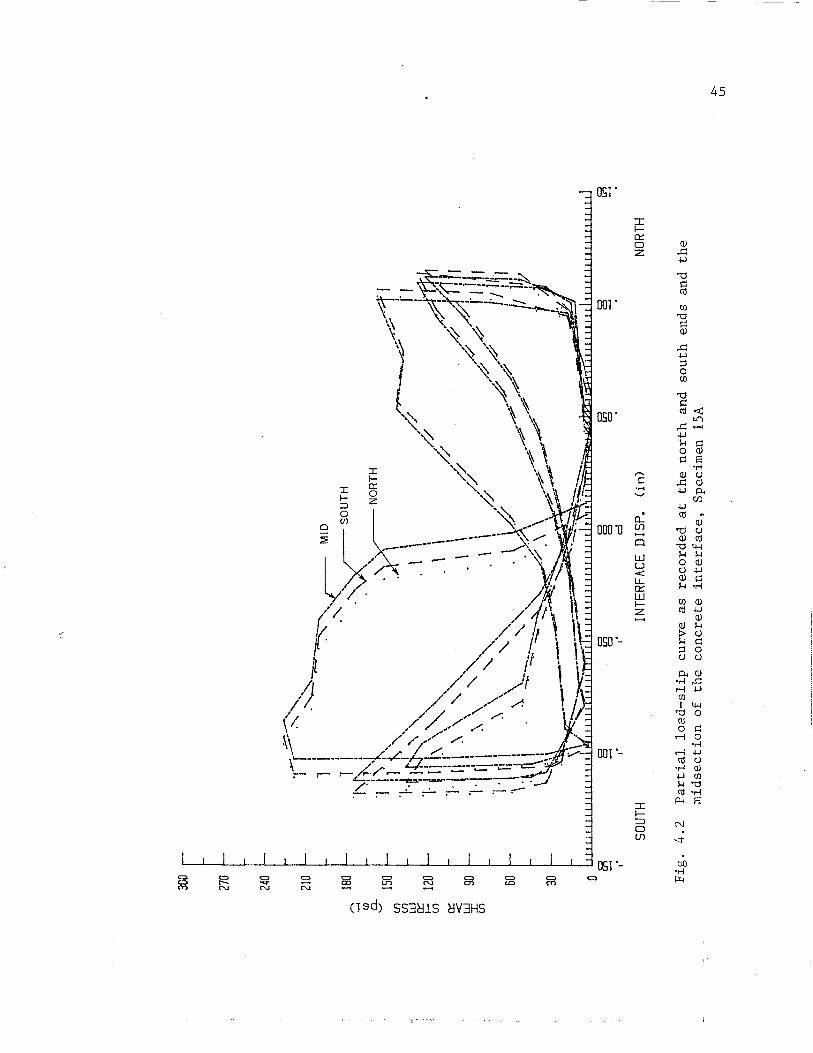
4.2 Partial load-slip curve as recorded at the north and south ends and the midsection of the concrete interface, Specimen 15A •••••••••• II ••••••••••••••••••••••••••••••••• II • 45
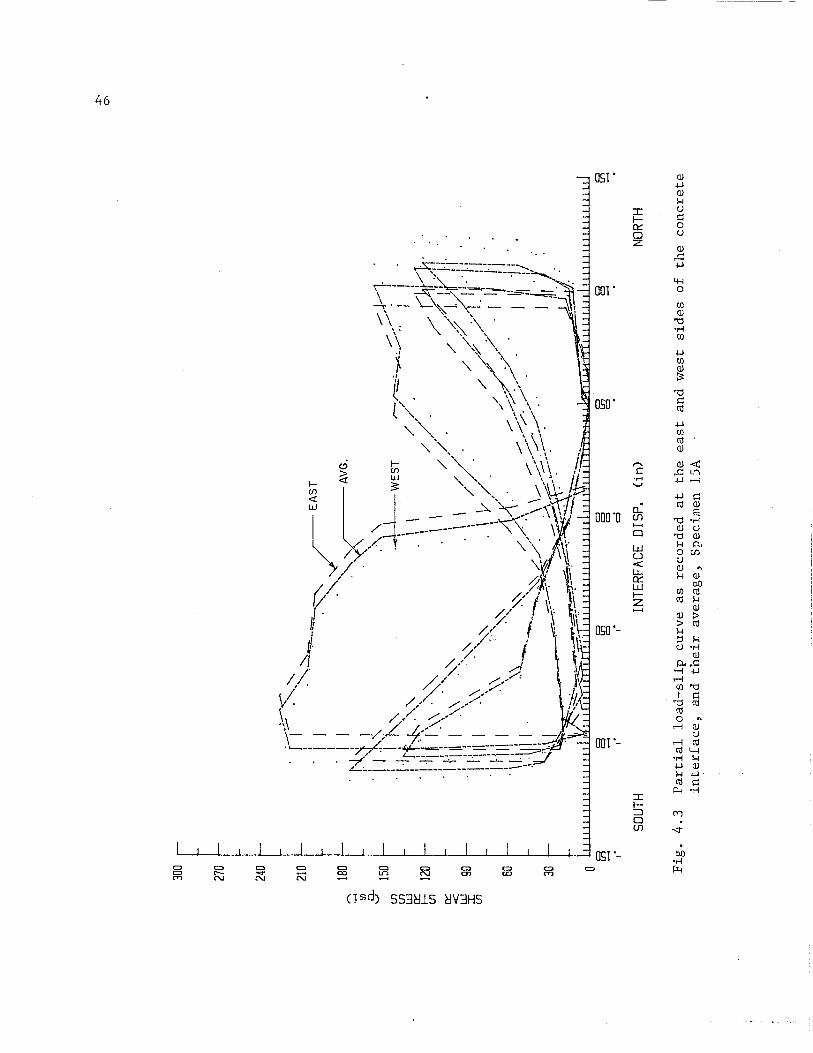
4.3 Partial load-slip curve as recorded at the east and west sides of the concrete interface, and their average, Specimen 15A •••••••••••••••••••••••••••••••••••••••••••••• 46
4.4
4.5
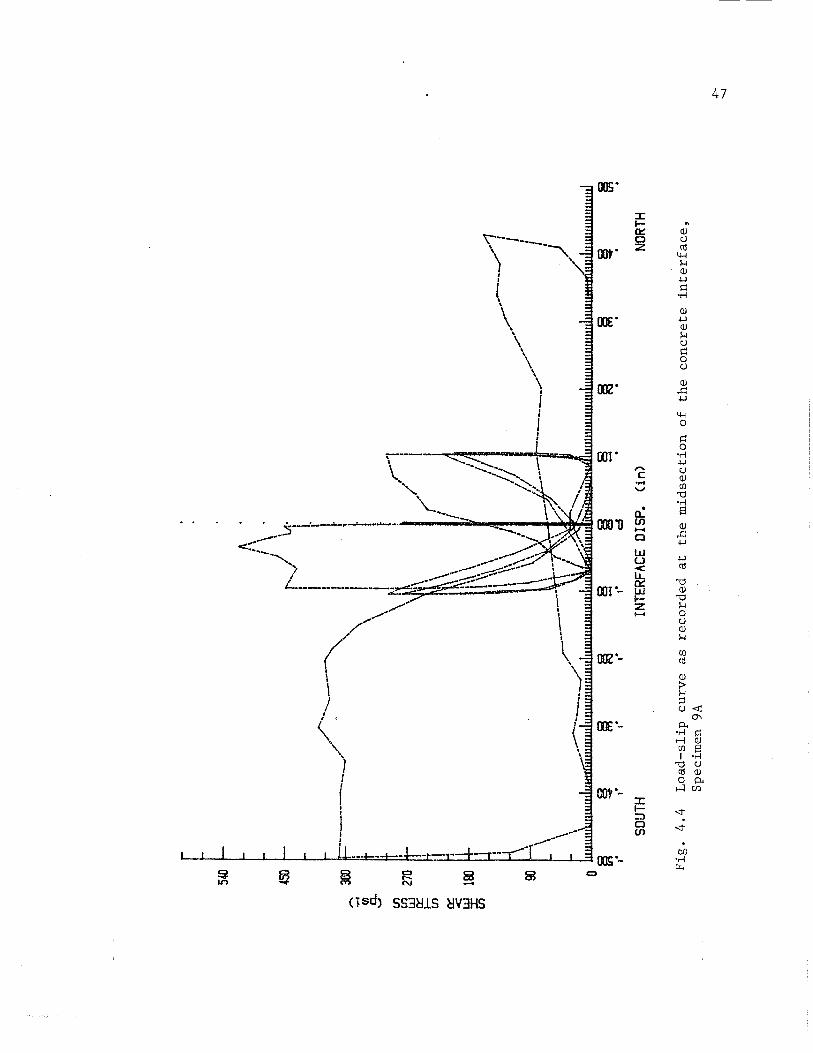
Load-slip curve as recorded at the midsection of the concrete interface, Specimen 9A ••••••••••••••••••••
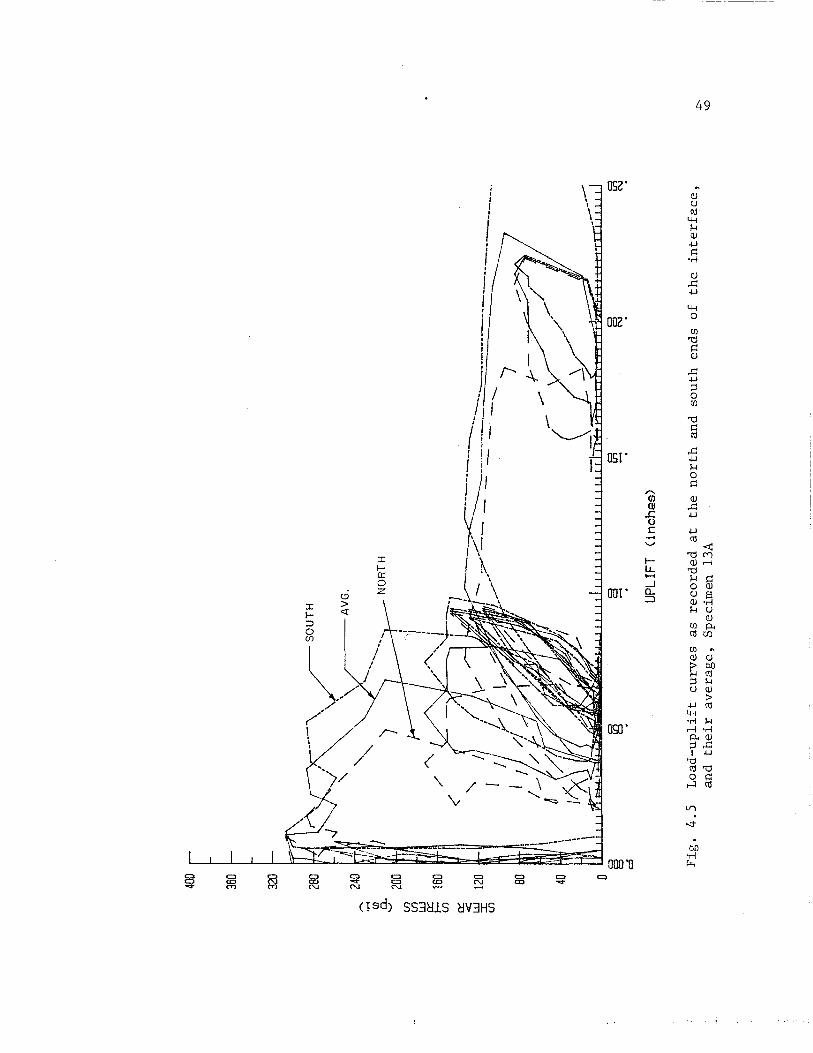
Load-uplift curves as recorded at the north and south ends of the interface, and their average, Speci men 13A
47
49
4.6 Load-uplift curve, average uplift at north and south ends, Specimen 9A ••••••••••••••••••••••••••••••••••••••••• 50
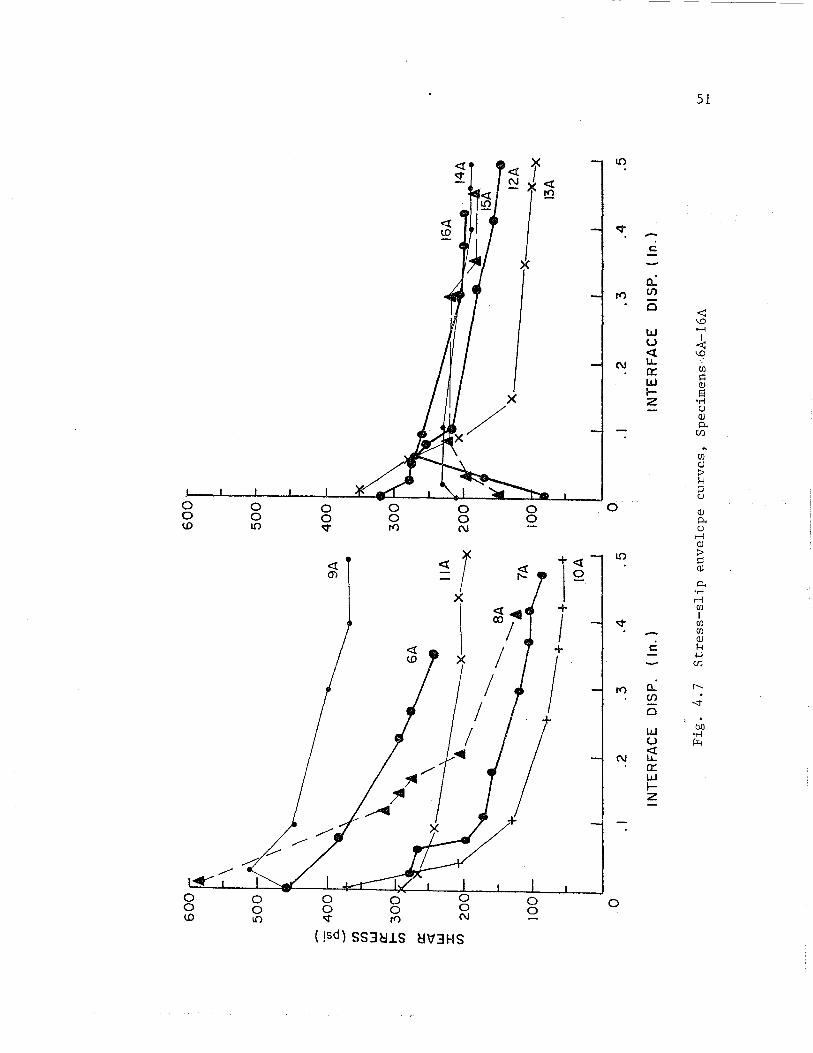
4.7 Stress-slip envelope curves, Specimens 6A-16A ••••••••••••• 51
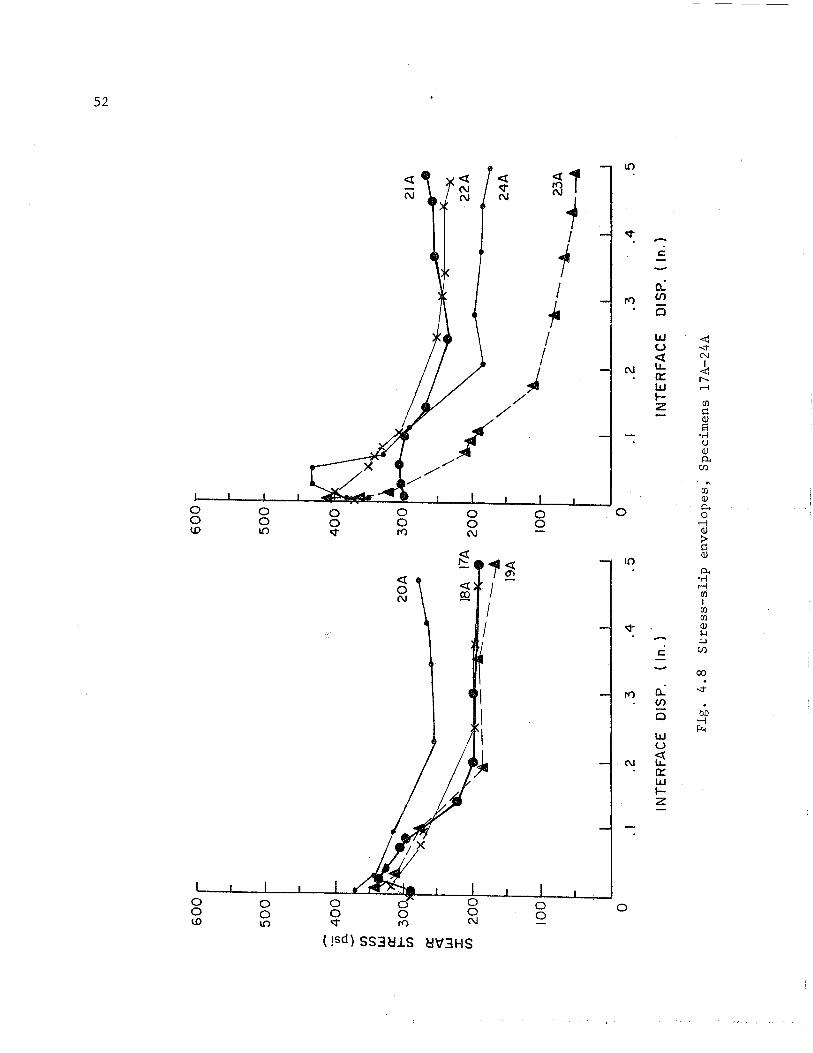
4.S Stress-slip envelopes, Specimen 17A-24A ••••••••••••••••••• 52
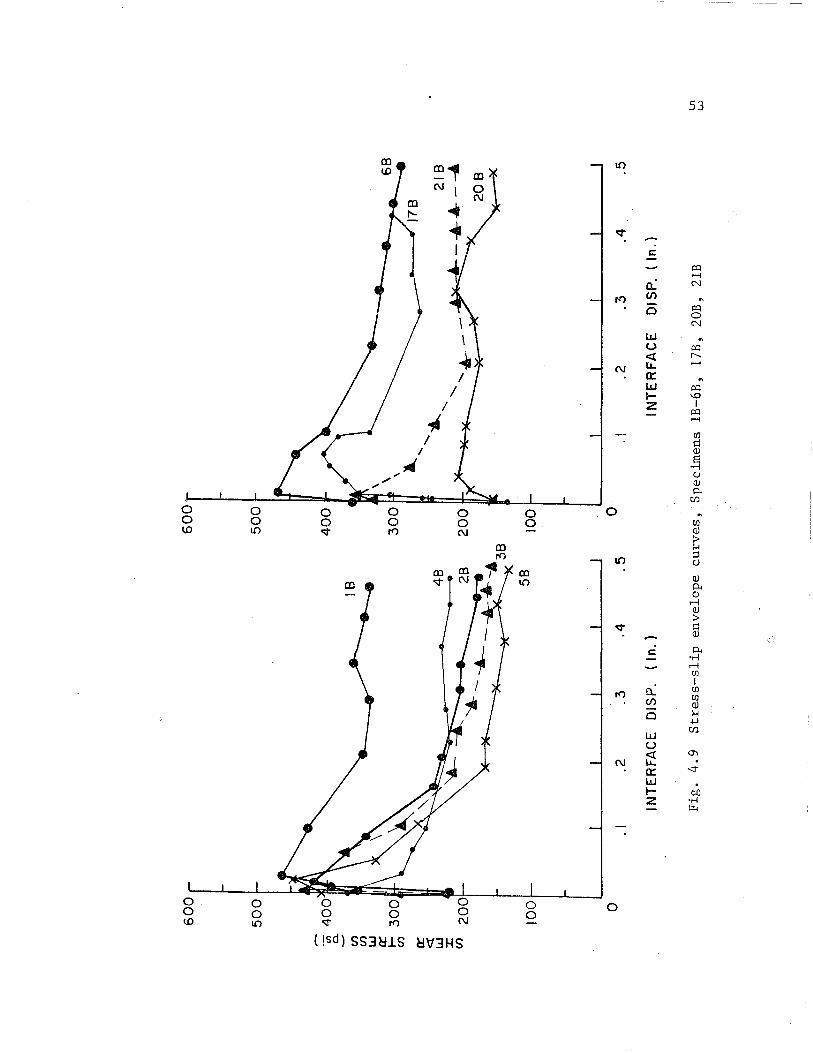
4.9 Stress-slip envelope curves, Specimens 18-6B, 17B, 20B, 21B •••• II ........ II................................. 53
4.10 Failure plane along wing wall 6A •••••••.••••••••••••••• ~ ••• 55
4.11 Failure plane along base block 17 A •••••••••••••••••••••••• 55
4.12 Crack patterns of Specimen 17B •••••••••••••••••••••••••••• 56
4.13 Crack patterns of Specimen SA ••••••••••••••••••••••••••••• 56
4.14 Crack patterns of Specimen 1B ••••••••••••••••••••••••••••• 57
4.15 Crack patterns of Specimen 1B ••••••••••••••••••••••••••••• 57
x
X , ,
LIST OF FIGURES (continued)
Figure Page
5.1 Effect of embedment, sandblasted surface on base .......... 60
5.2 Effect of concrete strength of base block and wing wall, 3 dowels, base stirrups @ 12 in. •••••••••••••••••••••••••• 62
5.3 Effect of interface surface preparation, 3 dowels, 6 in. embedment ••••••••••••••••••••••••••••••••• 0 ••••••••••••••• 64
5.4 Effect of reinforcement, 3 dowels, 6 in. embedment, base f~ < wall f~ ••••••••••••••••••••••••••••••••••••••••• 66
5.5 Effect of number of dowels, sandblasted, base stirrups @ 12 in. .................................................. 68
5.7 Effect of casting procedures, sandblasted, 3 dowel, 6 in. embedment, base stirrups @ 12 in • ••••••••••••••••••• 70
5.8 Effect of method of placement, sandblasted, 3 dowels, base stirrups @ 12 in ••••••••••••••••••••••••••• ~ ••••••••• 72
xi

C HAP T E R
INTRODUCTION
1.1 Justification
The repair and strengthening of buildings for improved seismic resistance is becoming an increasingly challenging task for design engineers who are looking for an economical alternative to the rapidly rising cost of new construction. Design recommendations applicable to the techniques utilized in repair and strengthening schemes for reinforced concrete structures generally are not found in current building codes. The design of a retrofitting system must be economically feasible and must not create new areas of weaknesses in the structur~ The engineer must check carefully all details in the existing structure and in the strengthening scheme to determine that the performance will meet the deSign objectives.
A particular strengthening scheme, such as an existing column strengthened by a cast-in-place wing wall connected by dowels, may involve the composite action of the structural elements. The interaction between the original and strengthening element, therefore, should be thoroughly understood by the engineer for a successful design.
1.2 Objecti ve
The main objective of the work described herein is to investigate the strength and load-deflection cl:aracteristics of the interface connection between new concrete cast against existing concrete. Jacketing of columns or infilling bays with cast-in-place walls are techniques commonly used in the repair and strengthening of existing reinforced concrete structures. The evaluation of these techniques is based on determination of the shear transfer capacity of the concrete interface between the two materials of different ages. The results from this study are intended to lead to design recommendations for use by design engineers in the repair and strengthening of existing structures.
1.3 Scope
An experimental program was designed to provide information on the interface shear capacities between new concrete cast against an existing concrete surface. Thirty-three full scale push-off type
1
2
specimens were designed, constructed and tested. Test variables included surface preparation, amount and depth of embedment of the interface reinforcement, reinforcement details in the new and existing concrete elements, and the compressive strength of both new and existing concrete elements. Testing consisted of repeated load cycles producing shear stresses along the plane of the concrete interface Deflections along and across the concrete interface at several locations were measured. The peak strength, the degradation of strength with repeated load cycles, and increasing deflections were observed. Special attention was given to determining the failure mechanism along the interface.

C HAP T E R 2
LITERATURE REVIEW
2.1 Repair and Strengthening of Reinforced Concrete Structures
A number of reports have been presented by Sugano, \"lyllie, and others [14,16,19,20] discussing the repair and strengthening of reinforced concrete structures for seismic resistance. Field observations of buildings that had been repaired a,1d strengthened and then subjected to later earthquakes have been reported by Wyllie and Dean [20]. Experimental programs have also been developed to study the effectiveness of various types of infilling and bracing techniques and beam column connections [16,17]. The state of the art in seismic strengthening of existing reinforced concrete buildings have been reviewed by Sugano [14] and developed into a guideline for the retrofitting of existing structures for use in Japan [15].
Different methods are currently being utilized for repairing and strengthening buildings for improved seismic resistance. While some of the techniques used are similar, the objectives of the design engineers using these techniques in repairing and in strengthening a structure are different. By repairing a damaged structure an attempt is made to return the structure to no less than its original strength and seismic resistance. When a building is strengthened, however, the objective is to improve its seismic resistance by increasing strength, stiffness, ductility, or all three.
There are three main reasons why the repair or strengthening of a building would be undertaken.
1. A building damaged in an earthquake may be repaired to restore its serviceability and possibly strengthened to improve its performance in future earthquakes.
2. An existing building may be strengthened to meet current seismic provisions if its usage or occupancy changes.
3. An owner's concern for the safety and protection of his investment might entice him to voluntarily strengthen a building.
It should be noted that while the strengthening of a building can improve its performance it is not a guarantee of a damage free building.
When undertaking the repair of a damaged structure, the causes and extent of the damage must be thoroughly assessed.
3

4
Determination of the structure's performance and the type of failure observed, whether it be shear, flexural, bar anchorage or any other type of failure, is essential to the selection of an adequate repair or strengthening scheme.
During the design of a strengthening scheme for a building, the engineer must consider both structural integrity and the user's needs. The foremost consideration by the design engineer would be the public's perception of and confidence in the strengthened building. The strengthening system's functional requirements must be met while keeping it aesthetically pleasing and economically feasible.
The strengthening system selected will provide increased strength and may also be used to increase the stiffness to reduce damage to nonstructural elements of the building. The strengthening technique must be examined to determine whether stiffness or strength discontinuities have been produced which could cause a failure in another element of the existing structure.
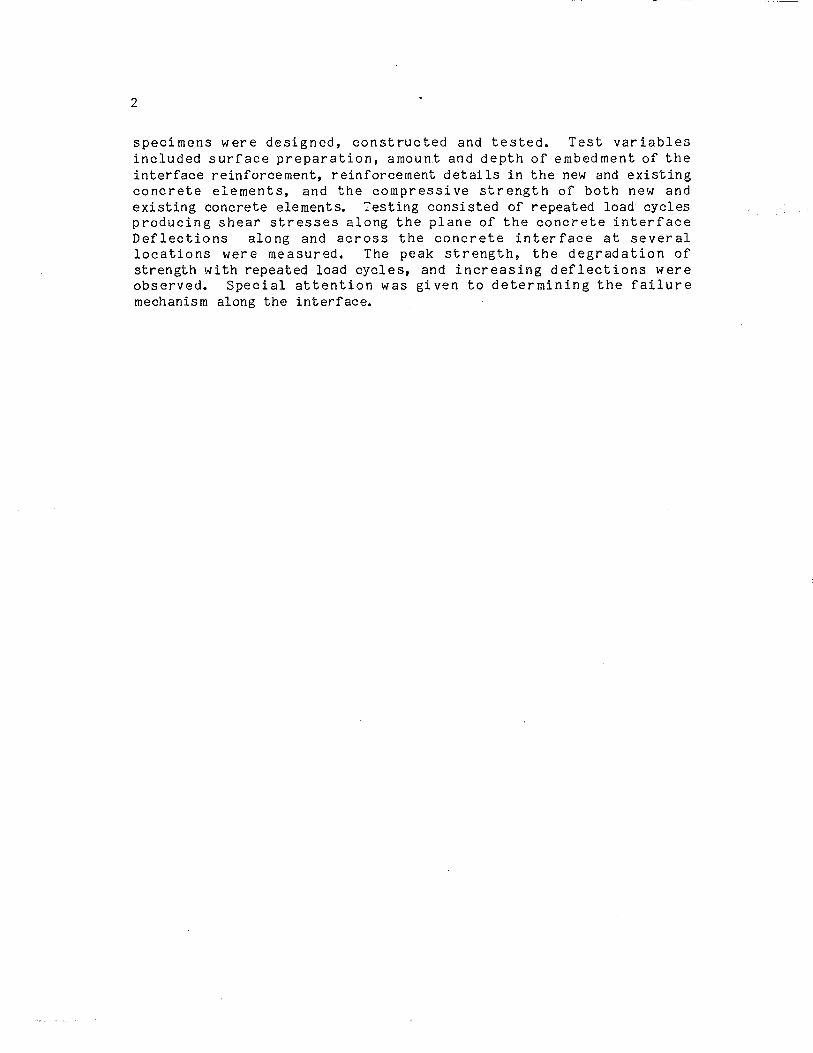
Epoxy injection of exi sting cracks and partial or complete replacement of a damaged member are commonly used techniques for the repair of a structure. Some of the techniques used to strengthen buildings include new cast-in-place or shotcreted infilled walls, the conversion of exi sting nonductile frames to an acceptable shear wall system, and the use of structural steel bracing. One such technique util izing wing walls to strengthen the columns of a reinforced concrete frame is shown in Fig. 2.1.
A successful repair and strengthening scheme, as reported by W Y 11 i e and Dean [2 0 ], w as use don 0 neb u i 1 din g who s e h 0 11 ow b 1 0 c k walls and reinforced concrete colum;,s were heavily damaged in an earthquake. The repair scheme cost about one-third of the cost of the original structure and included epoxy injection of cracks in damaged columns and construction of new reinforced concrete shear walls in elevator and stair wells. The repairs increased the stiffness and strength of the building and prevented major damage, and subsequent repair costs, from recurring when the building was subjected to a second earthquake a few years later.
Tests on di fferent strengthening schemes wree conducted by Sugano and Fujimara [15,16] on one-story reinforced concrete frames. It was found that frames where the colu mns were strengthened by wing walls, similar to the arrangement shown in Fig. 2.2, provided a significant increase in lateral load strength. The effect of the interface shear capacity at the wing wall connection, however, was not studied.
I Existing Beam D c
E ::J
&0 a u 0". C
.. - Addi tion Wi ng lola 11 s .... VI
X u.J
D
I
Fig. 2.1 Frame with columns strengthened by wing walls, from Sugano [15]
L D L
Dowel
I
I
Existing Col ullin Additional Wing Wall
(Cast-in-Place or) Precast Concrete'
Anchor Reinforcement (Connected by Screws)
Fig. 2.2 Wing walls with dowel connections, from Sugano [1~
5

6
2.2 Shear Transfer Mechanisms
For successful strengthening of reinforced concrete structures an understanding of the shear transfer mechanism across the interface between old and newly cast concrete is needed. A survey of the studies undertaken by many researchers to evaluate the effect of aggregate interlock, friction, and dowel action on the shear transfer mechanisms of a concrete interface is reviewed in the following section.
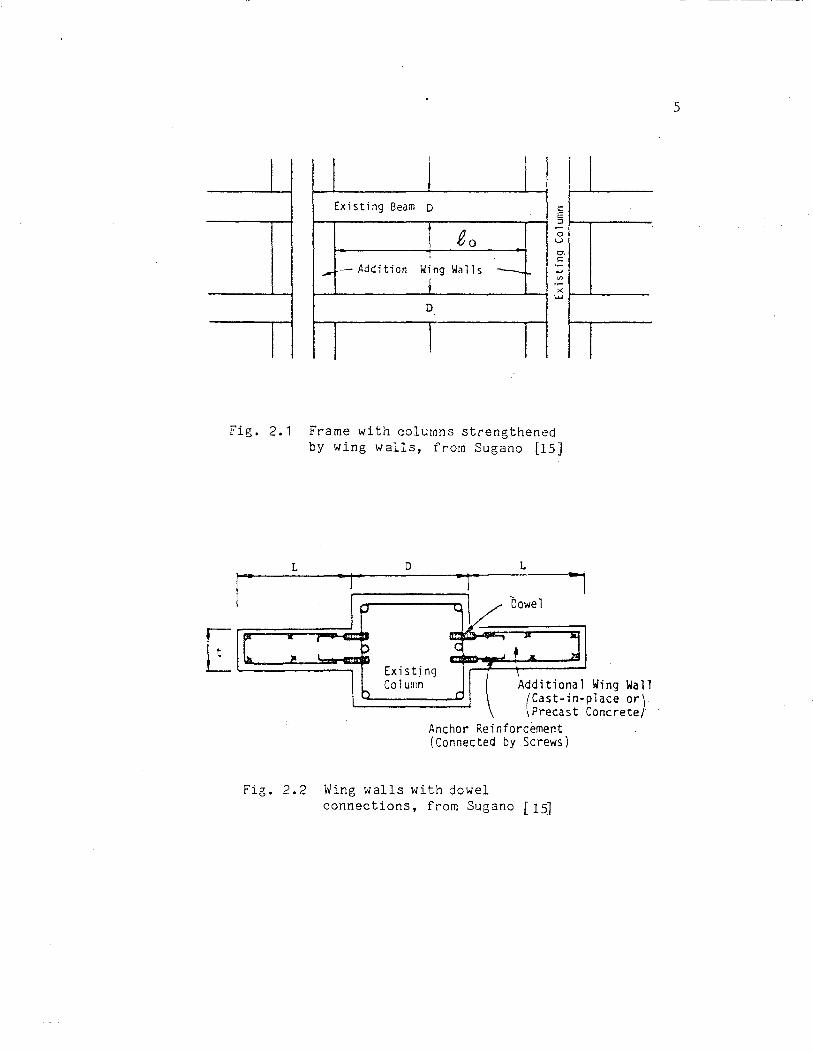
2.2.1 Previous Research. Research done by Hanson [6] in 1960 was one of the first comprehensive studies done using push-off type test specimens to evaluate shear stress-slip behavior of concrete interfaces with different surface preparations. The effect of the interface reinforcement and surface bonding was studied. These tests indicated maximum shear stresses would be increased when the interface surface preparation was varied from smooth and bonded to rough and bonded. Figure 2.3 shows the stress-slip curves reported in from this investigation.
The ACI Building Code requirements for reinforcement of concrete interfaces is based on a shear friction hypothesis presented by Birkeland and Birkeland in 1966. A shear load when applied across an interface will produce both parallel and perpendicular displacements at the shear plane as shown in Fig. 2.4. The perpendicular displacement produced when roughened surfaces slide across one another will result in axial tensile stresses in the reinforcement crossing the interface. These stresses will induce vertical compressi ve stresses on the concrete interface which will provide a frictional force that resists sliding. The ultimate shear capacity will be developed when the yield strength of the interface reinforcement is reached. The ACI Building Code (318-83) therefore gives the ultimate shear force across an interface as:
where Vn = nominal shear strength, lbs
Avf = area of shear friction reinforcement, in. 2
fy = specified yield strength of reinforcement, psi
t.L = coefficient of friction along the interface
The following values of the coefficient of friction are gi ven in ACI 318-83 for normal weight concrete:
60
0 I-
Sti
rru
p
Eff
ect
S
ub
tra
cte
d
For
A
ll C
urv
es
50
0
00
a.
c
40
0
If)
If)
(l)
if) .~ 3
00
'- o (l
)
.£:
if)
(l) en
o ~
20
0
>
<!
100 o
I
BO
ND
A
ND
/
RO
UG
HN
ES
S
BO
ND
A
ND
R
OU
GH
NE
SS
W
ITH
K
EY
.00
5
RO
UG
H
UN
BO
ND
ED
SM
OO
TH
B
ON
DE
D
J
.010
Slip
in
In
ches
015
02
0
Fig
. 2
.3
Sh
ear-
slip
cu
rves
fo
r v
ari
ou
s in
terf
ace su
rfa
ce
co
nd
itio
ns,
fr
om
Han
son
[6]
r
k -G
ener
al o
rien
tati
on o
f cr
ack
I II '
4r-
1 w
C
rack
wid
th
, i..~
t S
hear
d
isp
lace
me
nt
Fig
. 2
.4
Dis
pla
cem
ent
alo
ng
a
crac
ked
sh
ear
pla
ne,
fro
m
Par
k a
nd
Pau
lay
[1
2]
~

8
monolithic concrete 1.4
intentionally roughened surfaces 1.0
untreated surfaces 0.6
Tests conducted by Mast [9] showed that this shear friction theory was based on static ulti mate loads after cracking and is only valid when failure occurs by yielding of the reinforcement and therefore full development lengths should be provided on both sides of the interface. It was also shown that tensile forces across the interface affect the shear force that can be developed and that shear friction is not applicable to connections subjected to fatigue or where slip is highly critical.
Mattock et ale [10] have conducted several investigations into the shear strength of cracked and uncracked concrete interfaces. Some of the variables studied to establish their effect on the ultimate shear strength of interfaces included: (1) the concrete compressive strength, (2) yield strength of the reinforcement, (3) different percentages and arrangements of interface reinforcement, (4) existence of addi tional stresses, such as moments, along and across the interface, (5) construction joints, (6) aggregate type, and (7) the effect of cyclic loadin~
These tests demonstrated a di stinct difference in behavior between ini ti ally cracked and uncracked speci mens. In the uncracked specimens, a concrete strut transferred stresses between the small, inclined cracks that developed near the shear plane at high shear stresses and relatively small displacements along the interface. For initially cracked specimens relatively large displacements occurred along the interface at the maximum applied shear loads. It was found that specimens subjected to cyclic loading averaged 83% of the shear strength measured for monotonically loaded specimens. Figure 2.5 shows t.he effect of the a mount of reinforcement crossing the interface (Pfy) on the shear strength as establi shed by one of these studies.
The shear transfer mechanisms acroSS a horizontal construction joint were studied by Paulay, Park and Phillips [13]. Surface preparation and interface reiforcement percentage effects were tested by the application of monotonic and cyclic shear stresses along the construction joint. The mechanism of dowel action and the loadslip relationships for the dowel action of di fferent sized dowels is shown in Fi gs. 2.6 and 2.7, respecti vely. The load-s lip curves of concrete shear transfer for various surface preparations are shown in Fi g. 2.8. These tests showed that the maxi mum shear stress increased with an increase in surface roughness and the interface reinforcement percentag~ For low steel percentages, in the range of 0.31%, failure

Vu ,
(100) 1400
1200 (80)
1000
(GO) 800
o
Series 1 Initially Uncrocked
~ 0 '+-
"-Series 2 Initially Crocked on Sheer Plane
f~ """ 4000 psi (280kgf/cmt)
fy - 50 ksi (35 kgf/mmlf)
I , 8001 1000 11200
(GO) (sKJ)
psi (kgf lern')
Fig. 2.5 Variation of shear strength with reinforcement parameter, P fy, from Mattock et al. [10]
9
10
---~ JOO
200 . • .. ~ <.. .. .. ~
ISQ
/00
jQ
0
I
I
Vd M~
~ -i-"!.....f.--- ..(
__ J~_Vd_~
FLEXURE
I
T KINKING
Vd :: .2!:!.. ::4db Asfy .( 3rt .(
SHEAR
~:: Asfy
vT ~:: Asfy cos 0'.
.... '" :!
;}O
~
10
Fig. 2.6 The mechanism of dowel action across a shear interface, from Park and Paulay [12]
I -41)01 1_.-I
! t ~
I ; ~ -- I p.f : o.r2J
.~~ Joi:nt I'r.QGrotlOn
V' Tro.,~"'tI ..,,/11 no oantl
I I I L + -1 Oar
V . ____ - • j
r- P.,. a.~9 i I I
{y ~o I I <> '4 dl~ Oar p
I -...--- P" : 0.oo.J1 I • I
~ I j I I (1.5 I.!J 2.0
.. ~
'" -4.4
J.4
2.4
1.2
2.5
... '" ;!
2000
1500
<. Q
os .. .. Q.
iOOO .. .. ~ Q .... ~ <> .
sen :i
Imml
o 0.07 0.02 O.OJ 0-04 0.05 0.06 0.07 0.04 D.09 D.a:l I in.J Slip
Fig. 2.7 Load-slip relationship for dowel action, from Paulay et al. [13]
700
l "k 500 " '::::-""~
sao R
~ ~ .. .. !: 400
"" .. 0 .. " "" JOG
;00
100
0
If:: 4GOOpSl
26lk9f/~ml
-REINFORCE""€Nr
"3/lQrs
p. f : 0.0069
e., *> Joonf (If:: : J..Jt50 pSI) • , (If:: ,;36 kgf/cm') so
I -
-~-':""'_J-4(J -~
E ~~~~~~~~~~~~~~~~~~~~~~-=~~~~~~i=~~~JS~
0.
~~~~~~~FI ~~~-~~ I ;5 ~
d.Sl(ln ltrHl9'It t.v.' ..
~- - -ir-----t-----if---_--+, __ --+ __ 4.._---I;O ~
~~--+-----4_----4_----~----~----~----~I----_+----_+----_{ls
a 1.0 1.5 2.0
0.01 o.oJ a.07 a.a9
Fig. 2.8 Load-slip curves of concrete shear transfer for various surface preparations, from Paulay et al. [13]
5
il.JO lin)
11
12
consisted of the yieldings of the interface reinforcement. For higher steel percentages failure consisted of crushing of the concrete at the shear plane.
The failure planes of specimens containing more than ACI Building Code (318-71) minimum reinforcement and a rough bonded surface did not occur along the construction joint. Paulay et ale suggested that this indicates that the strength capacity would not be governed by the surface condition along a horizontal construction joint. It was found, however, that ACI 318-71 conservatively predicted the strength of these specimens.
White and Gergeley [18] investigated dowel action and interface shear transfer under cyclic loading. It was found that the load-slip behavior for dowel action alone is similar to that for interface shear transfer except the residual slip after unloading is less for dowel action. Dowel action during the first cycle of shear loading differed sharply from that of subsequent cycles and resulted in crushing of the concrete around the bars, destroying the bond and thereby changing the restraint stiffness of the interface. The application of axial tensile forces on the interface reinforcement also resulted in large increases in slip at the interface for a given applied load.
Liu and Holland [7] studied the influence of dowel spacing on the dead load carrying capacity of repaired concrete. A series of dowel pullout and shear transfer tests were conducted to discover an optimum dowel spacing as a function of concrete thickness.
Tests conducted by Luke, et ale [21] at The University of Texas showed that dowel pullout strength per inch of embedment increased an average of 125% when embedment length of the dowels was increased from 3 to 6 in.
When designing the interface connection of a strengthening scheme for earthquake resistance, the effect of cyclic loading at large displacement levels and the residual sh .. ear transfer capacity after the initial peak strength should be known. To date, however, no information has been found on the post ultimate strengths and the residual load-slip behavior of reinforced concrete interfaces.
2.2.2 Summary. The research conducted on the shear transfer mechanisms along a concrete interface as presented above have led to the following conclusions:
1. The principal mechanisms of shear transfer are: bond of the concrete interfaces, dowel action of the reinforcement, and interface shear friction along rough concrete surfaces.
13
2. Shear forces are initially transferred through ~ne uncracked interface by bond. Once a crack forms along or near the interface the shear forces are transferred by the combined action of aggregate interlock, friction, and dowel action.
3. The shear friction theory used in the ACI Building Code is a lower bound to the experimental data available from shear transfer tests.
C HAP T E R 3
EXPERIMENTAL PROGRAM
3.1 Test Specimens
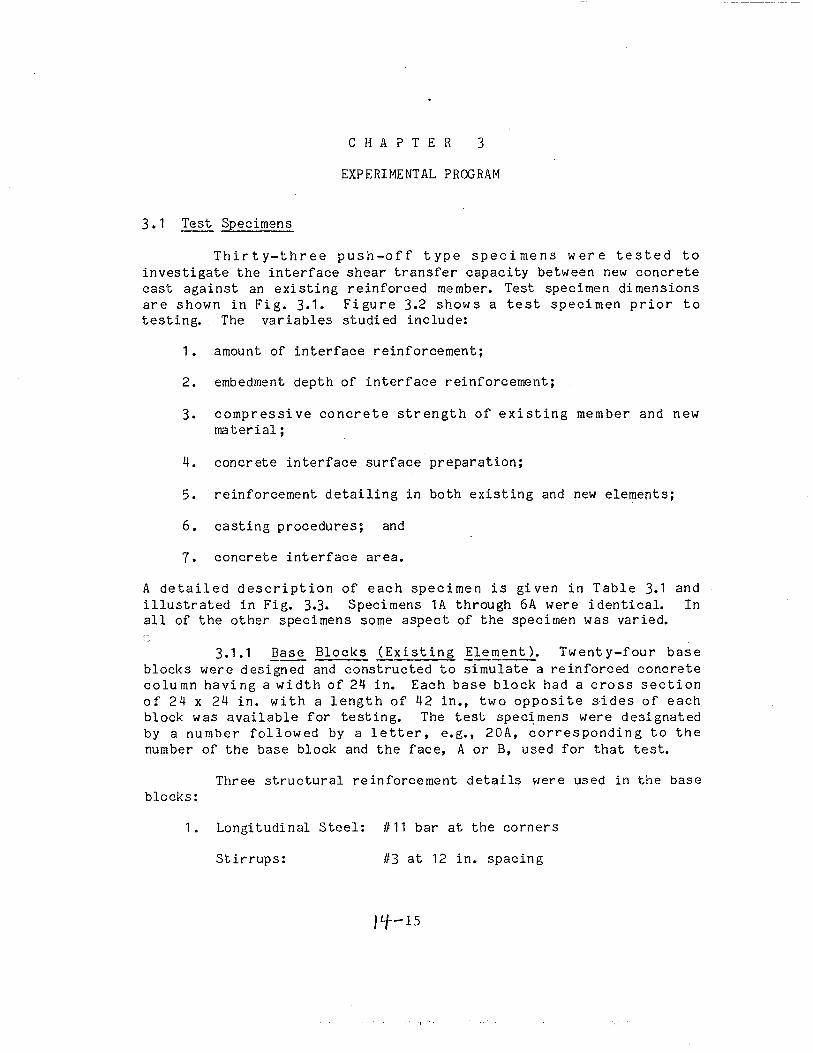
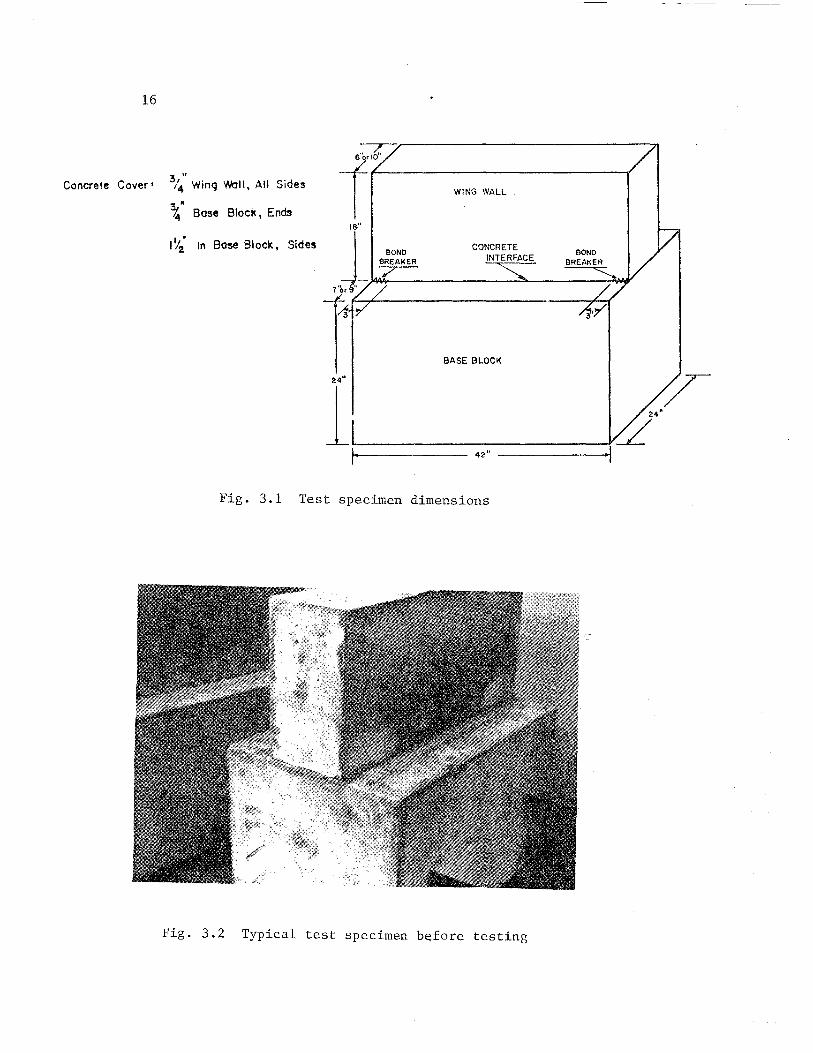
Thirty-three push-off type specimens were tested to investigate the interface shear transfer capacity between new concrete cast against an existing reinforced member. Test specimen dimensions are shown in Fig. 3.1. Figure 3.2 shows a test specimen prior to testing. The variables studied include:
1. amount of interface reinforcement;
2. embedment depth of interface reinforcement;
3. compressive concrete strength of existing member and new material;
4. concrete interface surface preparation;
5. reinforcement detailing in both existing and new elements;
6. casting procedures; and
7. concrete interface area.
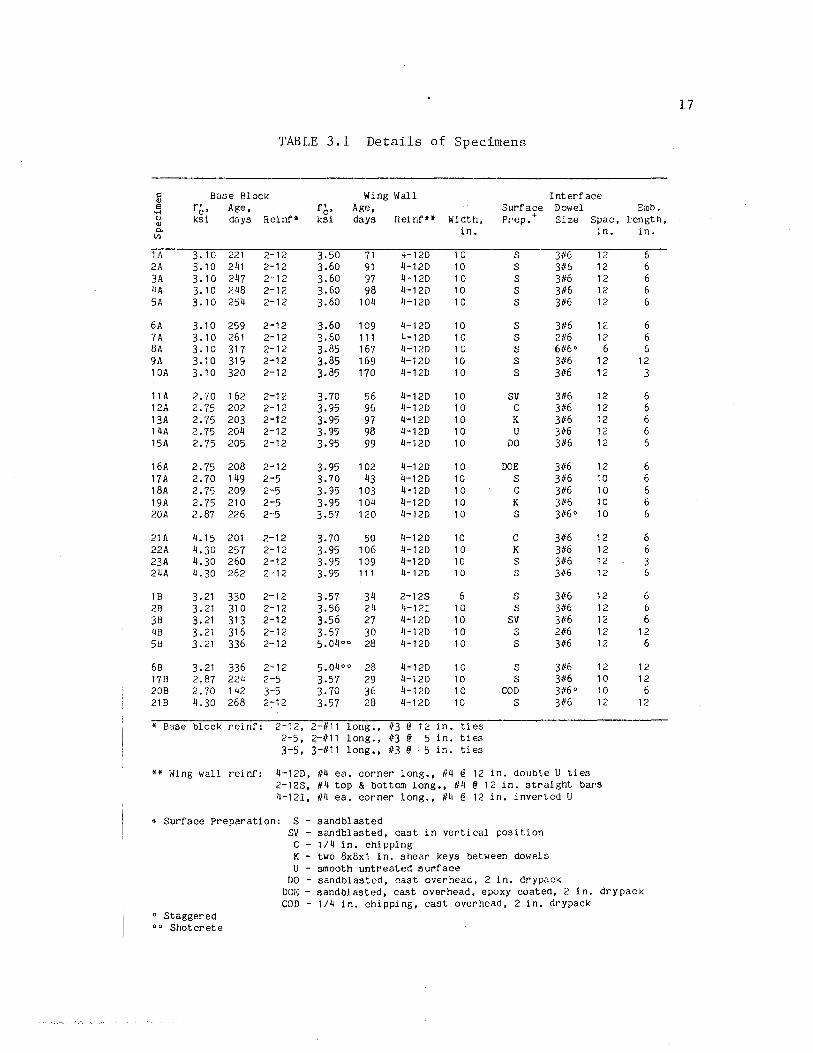
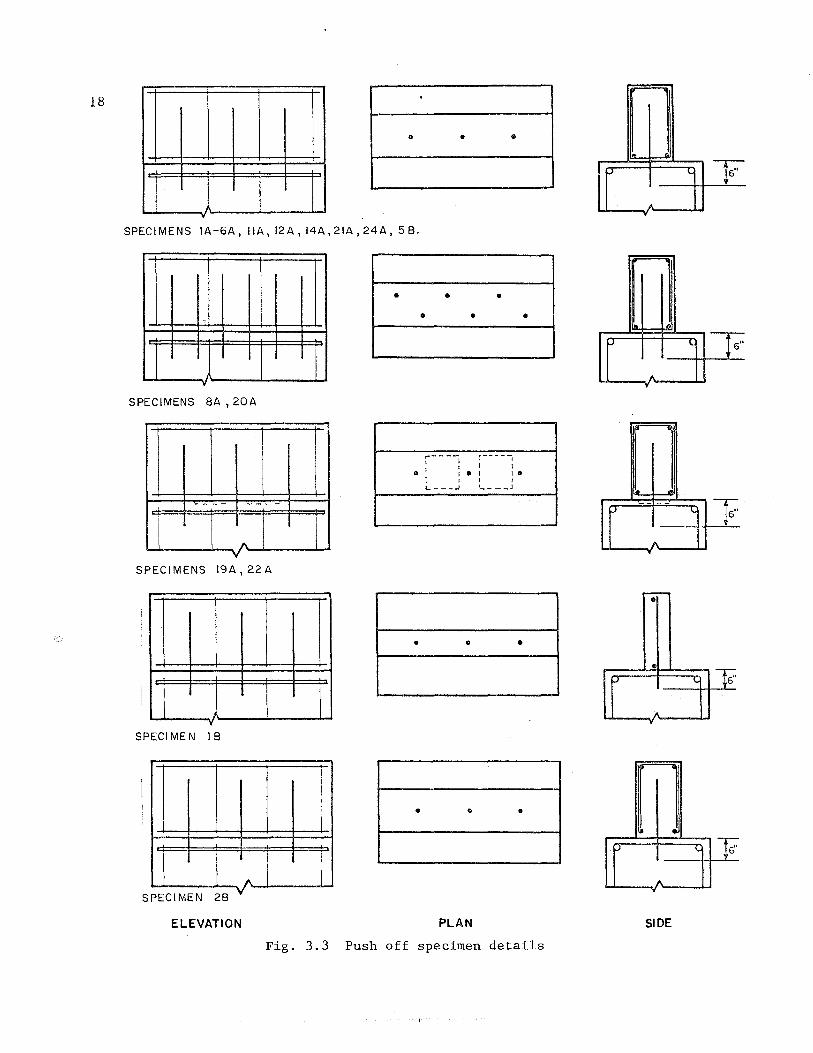
A detailed description of each specimen is given in Table 3.1 and illustrated in Fig. 3.3. Specimens 1A through 6A were identical. In all of the other specimens some aspect of the specimen was varied.
3.1.1 ~~ Blocks (Existing ~le~ent). Twenty-four base blocks were designed and constructed to simulate a reinforced concrete column having a width of 24 in. Each base block had a cross section of 24 x 24 in. with a length of 42 in., two opposite sides of each block was available for testing. The test specimens were designated by a number followed by a letter, e.g., 20A, corresponding to the number of the base block and the face, A or B, used for that test.
Three structural reinforcement details were used in the base blocks:
1. Longitudinal Steel: #11 bar at the corners
Stirrups: #3 at 12 in. spacing
Itt-IS
16
Concrete Cover' 3 .. 14 Wing 'Noll, All Sides
3 " ~ Bose Block. Ends
11;2" In Bose Block, Sides BOND
BREAKER
~
WING WALL
CONCRETE INTERFACE
SASE BLOCK
L-------------4-2-.. ~==~~~~-_-_-_-_-~~·1
Fig. 3.1 Test specimen dimensions
Fig. 3.2 Typical test specimen b~fore testing
---------
24"
(L
17
TABLE 3.1 Details of Specimens
~ Base Block Wing Wall Interf ace <lJ a fb' Age, fb, Age, Surface Dowel Emb. ..... () ksi days Rei nf* ksi days Reinf H Width, Prep. + Size Spac, length, <lJ 0. in. in. in. til
1A 3.10 221 2-12 3·50 71 4-12D 10 S 3116 12 6 2A 3.10 241 2-12 3.60 91 4-12D 10 S 3116 12 6 3A 3.10 247 2-12 3.60 97 4-12D 10 S 31/6 12 6 4A 3.10 248 2-12 3.60 98 4-12D 10 S 3116 12 6 5A 3.10 254 2-12 3.60 104 4-12D 10 S 3116 12 6
6A 3.10 259 2-12 3.60 109 4-12D 10 S 3116 12 6 7A 3.10 261 2-12 3.60 111 4-12D 10 S 2116 12 6 8A 3.10 317 2-12 3.85 167 4-12D 10 S 6116 0 6 6 9A 3.10 319 2-12 3.85 169 4-12D 10 S 3116 12 12 lOA 3.10 320 2-12 3.85 170 11-12D 10 S 3116 12 3
11A 2.70 162 2-12 3.70 56 4-12D 10 SV 3116 12 6 12A 2.75 202 2-12 3.95 96 11-12D 10 C 3116 12 6 13A 2.75 203 2-12 3.95 97 4-12D 10 K 3116 12 6 14A 2.75 204 2-12 3.95 98 11-12D 10 U 3116 12 6 15A 2.75 205 2-12 3.95 99 11-12D 10 DO 31/6 12 6
16A 2.75 208 2-12 3.95 102 4-12D 10 DOE 3116 12 6 17A 2.70 149 2-5 3·70 43 4-12D 10 S 3116 10 6 18A 2.75 209 2-5 3.95 103 4-12D 10 C 31/6 10 6 19A 2.75 210 2-5 3.95 104 4-12D 10 K 3116 10 6 20A 2.87 226 2-5 3.57 120 4-12D 10 S 3116 0 10 6
21A 4.15 201 2-12 3.70 50 4-12D 10 C 3116 12 6 22A 4.30 257 2-12 3.95 106 4-12D 10 K 3116 12 6 23A 4.30 260 2-12 3.95 109 4-12D 10 S 3116 12 3 24A 4.30 262 2-12 3.95 111 4-12D 10 S 3116 12 6
1B 3.21 330 2-12 3.57 34 2-12S 6 S 3116 12 6 2B 3.21 310 2-12 3.56 24 4-121 10 S 3116 12 6 38 3.21 313 2-12 3.56 27 4-12D 10 SV 3116 12 6 48 3.21 316 2-12 3.57 30 4-12D 10 S 2116 12 12 5B 3.21 336 2-12 5.04 00 28 4-12D 10 S 3116 12 6
68 3.21 336 2-12 5.04 00 28 4-12D 10 S 3116 12 12 17B 2.87 224 2-5 3·57 29 4-12D 10 S 3116 10 12 208 2.70 142 3-5 3.70 36 4-12D 10 COD 3116 0 10 6 218 4.30 268 2-:-12 3·57 28 4-12D 10 S 3116 12 12
* Base block reinf: 2-12, 2-1111 long., 1/3 @ 12 in. ti es 2-5, 2-1/11 long. , 113 @ 5 in. ti es 3-5, 3-1111 long., 113 @ 5 in. ti es
** Wing wall reinf: 4-12D, 114 ea. corner long., 114 @ 12 in. double U ties 2-12S, 114 top & bottom long., 114 @ 12 in. straight bars 4-121, 114 ea. corner long., 114 @ 12 in. inverted U
+ Surface preparation: S - sandblasted SV - sandblasted, cast in vertical position
C - 1/4 in. chipping K - two 8x8x1 in. shear keys between dowels U - smooth untreated surface
DO - sandblasted, cast overhead, 2 in. drypack DOE - sandblasted, cast overhead, epoxy coated, 2 in. dry pack COD - 1/4 in. chipping, cast overhead, 2 in. drypack
o Staggered 00 Shotcrete
18
• • ..
p- .... _I A
V
SPECIMENS lA-6A, IIA, 12A, 14A,2IA,24A, 58 .
• • • • • •
W ....--r;. A
V
SPECIMENS 8A, 20A
r-- - - I r - - - I
I I I I o I I • I 1 •
, I I I L ___ .J 1 ____ 1
- - -
I I SPECIMENS 19A,22A
I • • •
~:-
I
I
.. ~ p ....
\ 1\ v V
SPECIMEN 1 B
• .. • m ~ I ....~
A -y
SPECIMEN 28
ELEVATION PLAN SIDE
Fig. 3.3 Push off specimen details
19
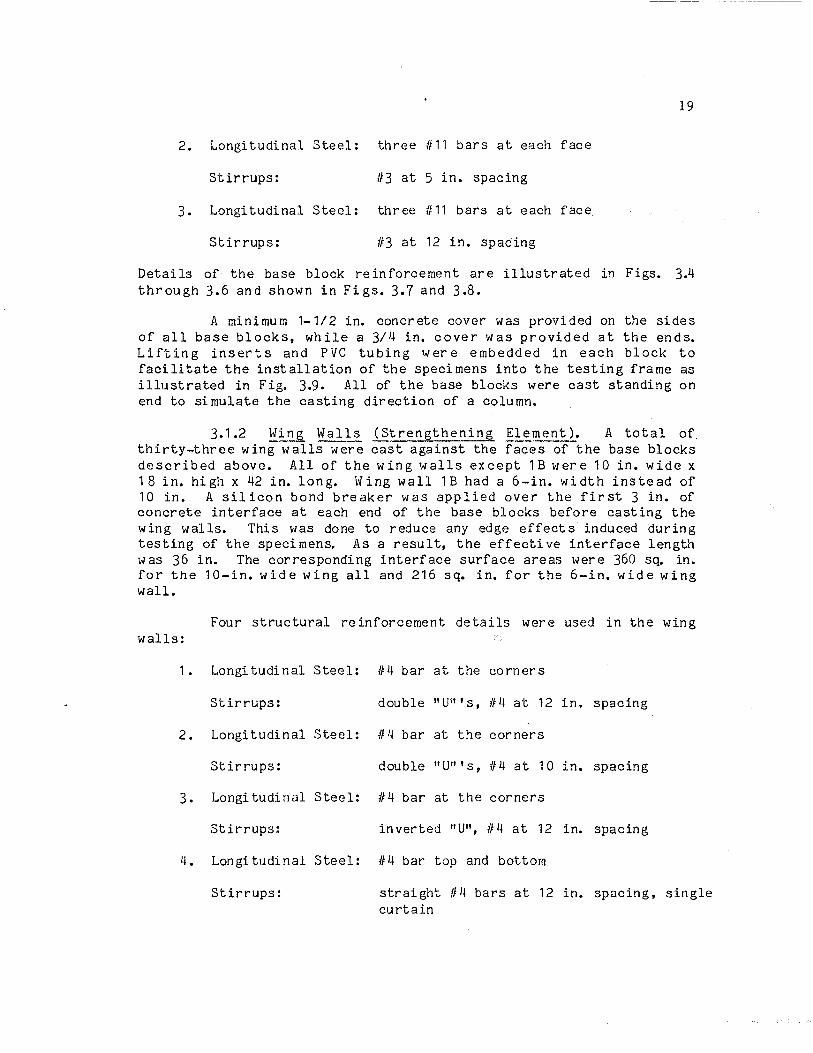
2. Longitudinal Steel: three 1111 bars at each face
Stirrups: 113 at 5 in. spacing
3. Longitudinal Steel: three 1111 bars at each face
Stirrups: 113 at 12 in. spacing
Details of the base block reinforcement are illustrated in Figs. 3.4 through 3.6 and shown in Figs. 3.7 and 3.8.
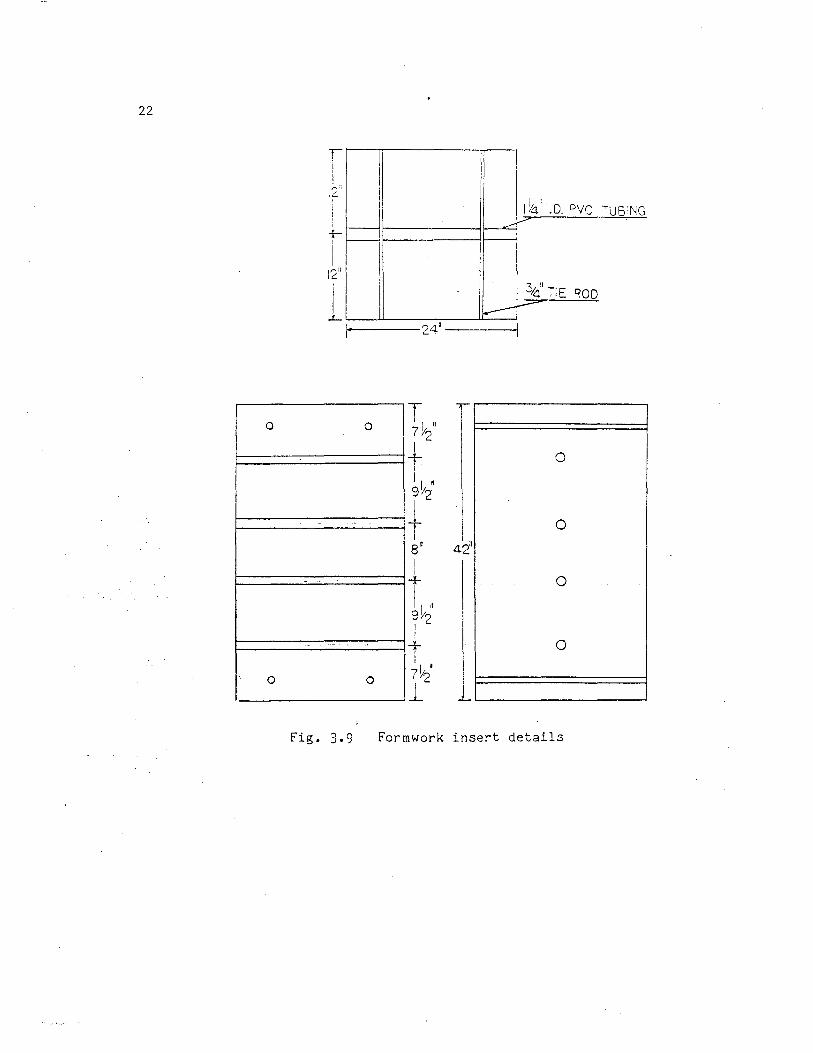
A minimum 1-1/2 in. concrete cover was provided on the sides of all base blocks, while a 3/4 in. cover was provided at the ends. Lifting inserts and PVC tubing were embedded in each block to facilitate the installation of the specimens into the testing frame as illustrated in Fig. 3.9. All of the base blocks were cast standing on end to simulate the casting direction of a column.
3.1.2 ~ing !i..~lls (Strengthening ~le!.l!ent ). A total of thirty-three wing walls were cast against the faces of the base blocks described above. All of the wing walls except 1B were 10 in. wide x 18 in. high x 42 in. long. \Hng wall lB had a 6-in. '..tidth instead of 10 in. A silicon bond breaker was applied over the first 3 in. of concrete interface at each end of the base blocks before casting the wing walls. This was done to reduce any edge effects induced during testing of the specimens. As a result, the effective interface length was 36 in. The corresponding interface surface areas were 360 s~ in. for the 10-in. wide wing all and 216 sq. in. for the 6-in. wide wing wall.
Four structural reinforcement details were used in the wing walls:
1. Longi tudinal Steel: 114 bar at the corners
Stirrups: double "U'" s, 114 at 12 in. spacing
2. Longitudinal Steel: 114 bar at the corners
Stirrups: double "U" 's, #4 at 10 in. spacing
3. Longi tudinal Steel: 114 bar at the corners
Stirrups: inverted "U", 114 at 12 in. spacing
4. Longi tudinal Steel: 114 bar top and bottom
Stirrups: straight 114 bars at 12 in. spacing, single curtain

20
II i: !
II : Ii'
~li '24"
I . I
1------24"-----"' Fig. 3.4 Reinforcement details for base
blocKs 1-16, 21-2Ll
T 12"
1 Ir
~ I :1
I I
I 24'1
#11
r L-______ ---1-L r~ ----24H'------l1
Fig. 3.5 Reinforcement details for base blocks 17 -1 9
-I L , ,
i t 24"
12" I
I i
i
I I
LL-________ --ll 1--1.----2411-----1/
Fig. 3.6
I ,
Reinforcement details for base block 20
i J
J
I I
I J
I ., I

21
Fig. 3. 7 Base block reinforcement
Fig. 3.8 Base block reinforcement
22
0
0
r I
,;'-':1 I~
i I +-
!
I 12"
I ..L.
\ i
I ~'I :.0. ?YC
1:--, I----..:::: V-
I--- I---
" 'I ~;IE ROD V--
~1'-------24!------~
0 T~ 7~2
r-
+ 0 I i I I ~ 9YZ
I t 8 11
I 0
2" 4 ! I
Till 9Y2 I
0
t. 0 7Y2
1
0
r....
Fig. 3.9 Formwork insert details
TUBiNG
23
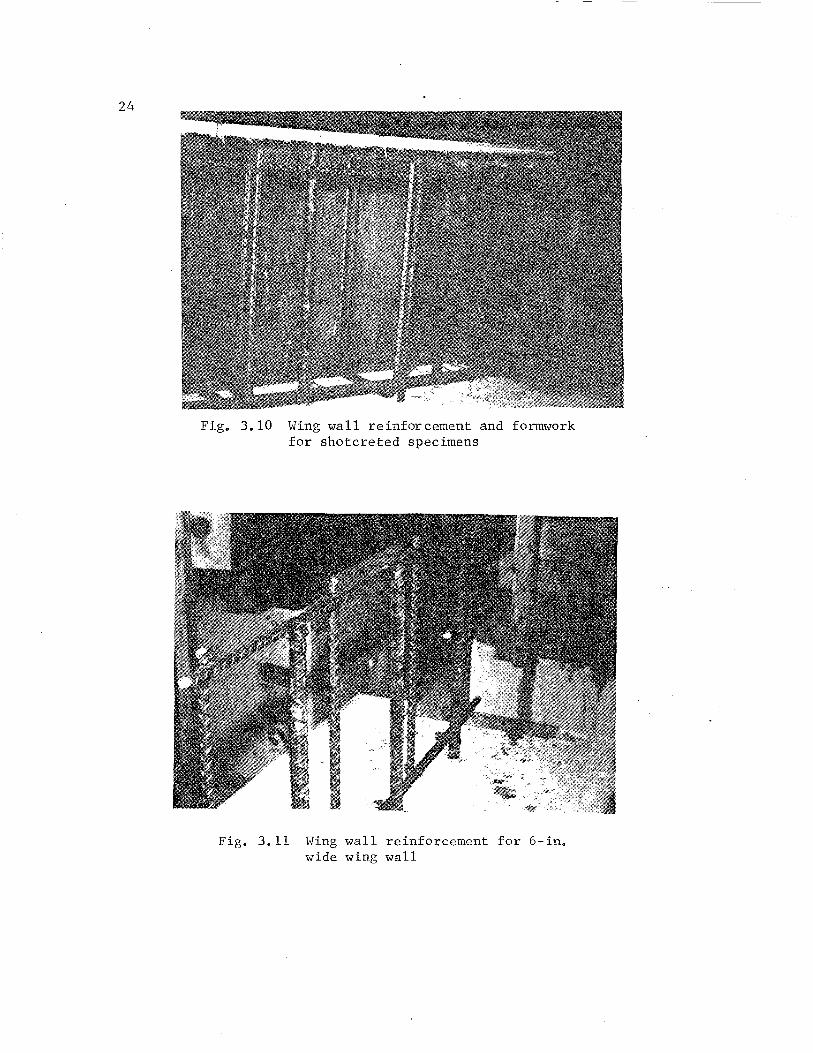
A mlnlmum concrete cover of 3/4 in. was provided for the reinforcement on all sides of the wing walls. The wing wall reinforcement details are illustrated in Fig. 3.3 and shown in Figs. 3.10 through 3.13.
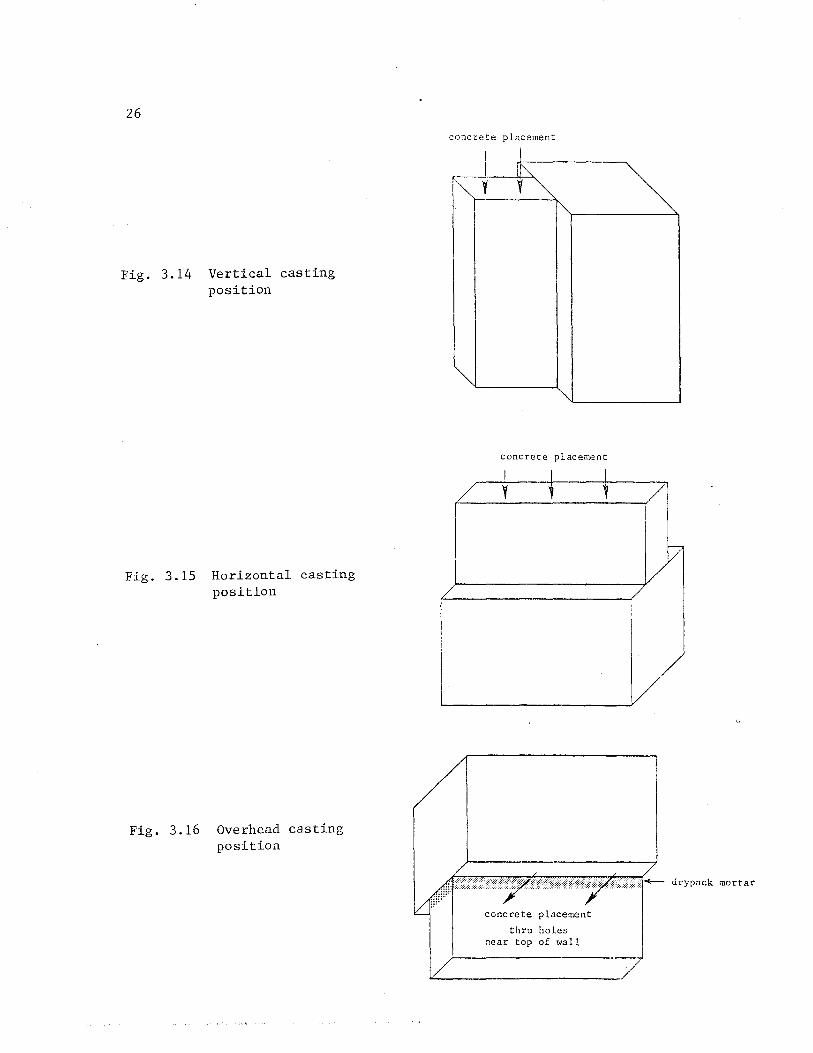
The wing walls were cast in vertical, horizontal, and overhead positions as shown in Figs. 3.14 through 3.16. Vertical casting position referred to the case where the wing walls were cast against the appropriate test side of the base block while the base block was standing vertically on end. This technique represents the case of a wing wall cast in place vertically against an existing column. Fig. 3.13 shows the setup used for this vertical casting position.
The horizontal casting position represented a horizontal construction joint. In this case the wing walls were cast against the appropriate test sides of the base blocks while the blocks provided the bottom side of the wing wall formwork. Wing walls before and after casting using this placement technique are shown in Fig. 3.17.
The overhead casting position refers to the case where the wing walls were cast with the base block elevated and the wing wall formwork suspended from the base block. Concrete was cast into the forms up to 2 in. from the interface of the base block. Five days after casting the 2 in. gap was then drypacked using a low water content mortar. This overhead casting represented the type of construction procedure needed to cast the upper portion of the infill wall. The overhead casting procedure is shown in Fig. 3.18.
Wing wall 11A had severe honeycombing of the concrete due to poor vibration during casting. This specimen was retained in the test program to examine the effects of poor vibration along the concrete interface.
3.1.3 !~~~~~~~~ ~~~~~ ~~~pa~~ti~~. Five concrete interface surface preparation techniques were studied, namely:
1. untreated, as cast;
2. heavily sandblasted;
3. chipped to 1/4 in. amplitudes;
4. shear keys; and
5. epoxy bonding agent.
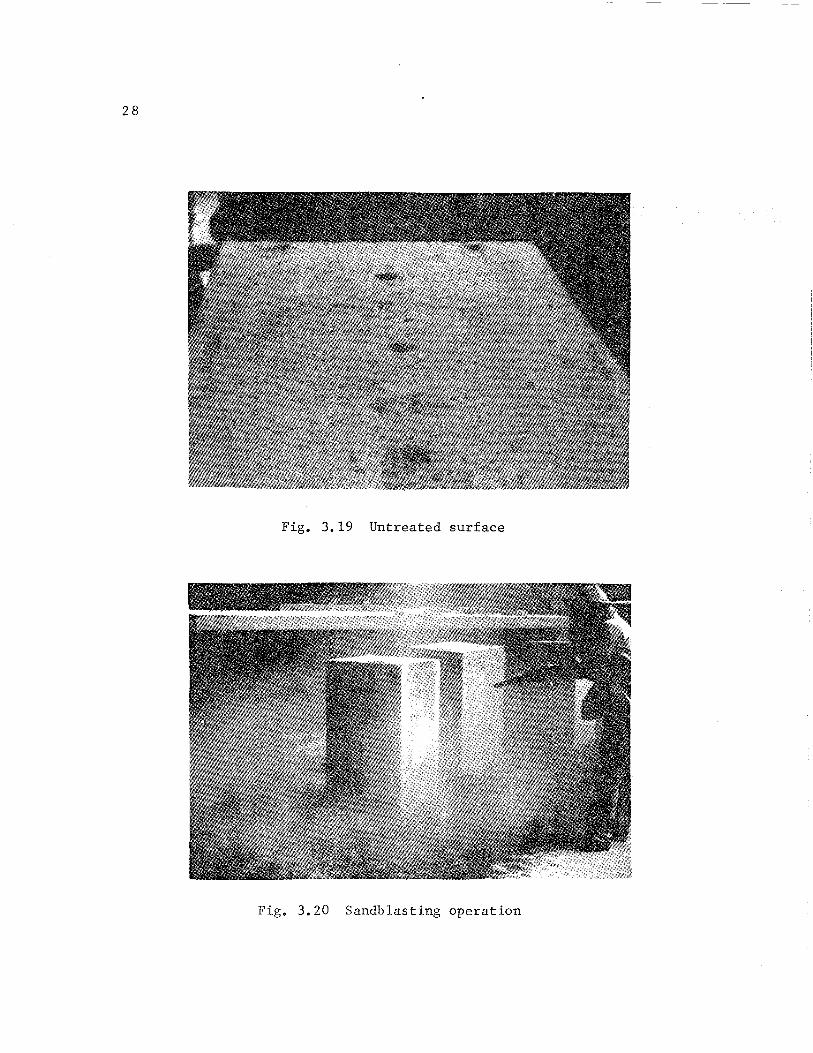
The original interface surface was formed by the casting of the base blocks in lightly oiled formwor~ The resulting surface was smooth with negligible roughness as is shown in Fig. 3.19.
24
Fig. 3.10 Wing wall reinforcement and formwork for shotcreted specimens
Fig. 3.11 Wing wall reinforcement for 6-in. wide wing wall
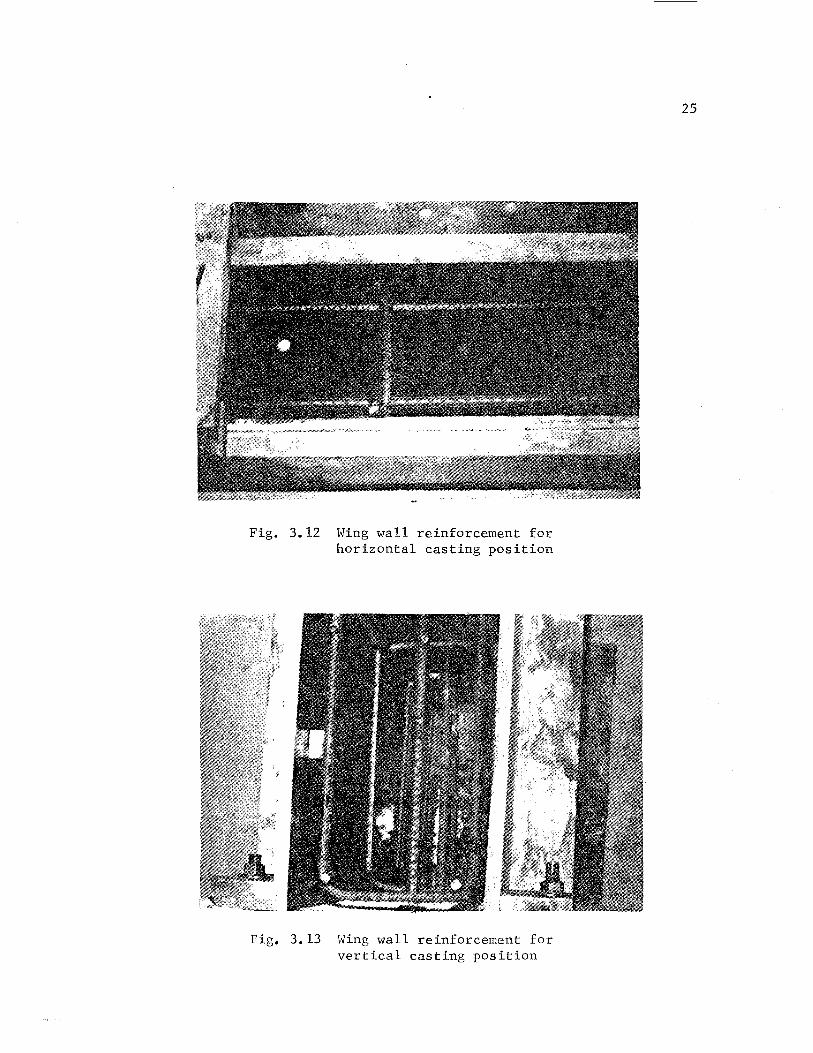
Fig. 3.12 Wing wall reinforcement for horizontal casting position
Fig. 3.13 Wing wall reinforcement for vertical casting position
25
26
Fig. 3.14 Vertical casting position
Fig. 3.15 Horizontal casting position
Fig. 3.16 Overhead casting position
concrete placement
~
~
~
~ ~
"'J
concrete placement
placement
holes of wall
~
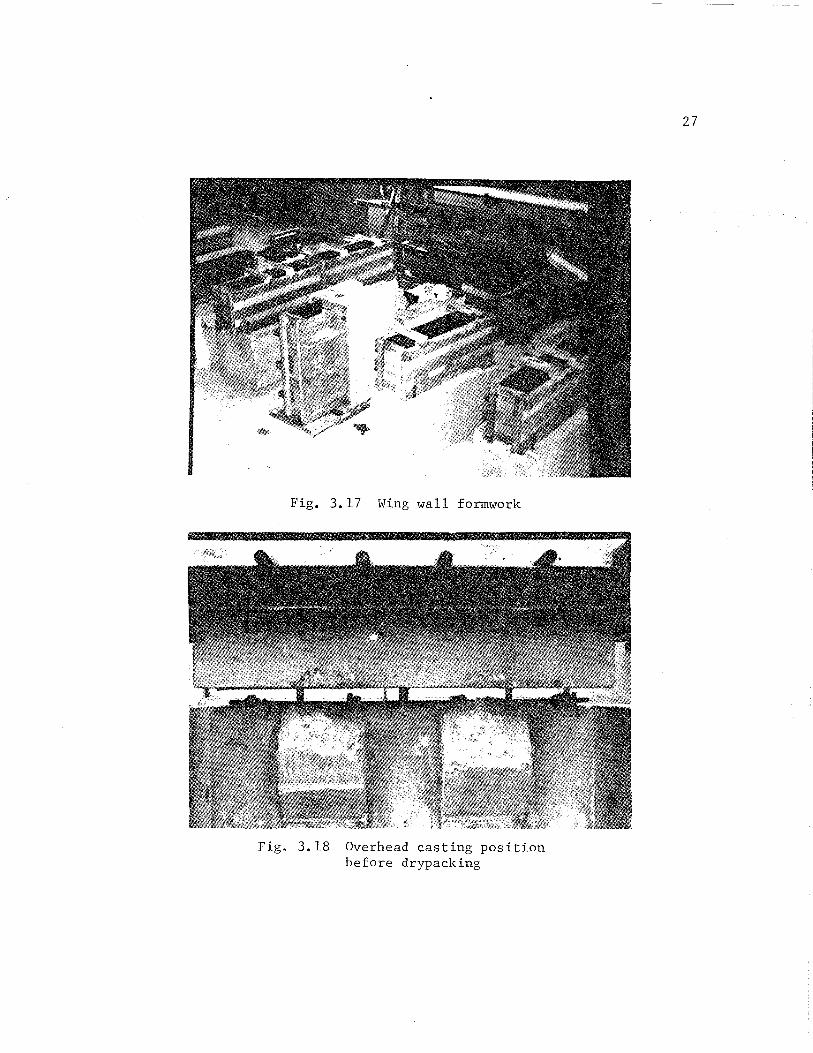
Fig. 3.17 Wing wall formwork
Fig. 3.18 Overhead casting position before drypacking
27
28
Fig. 3.19 Untreated surface
Fig. 3.20 Sandblasting operation

29
The heavy sandblasting resulted in exposure of the aggregate in the concrete along the interface and ampl itudes of surface roughness of about 1/8 in. The sandblasting operation was done by a commercial sandblasting company and is shown in Fig. 3.20. The resulting sandblasted interface is shown in Fig. 3.21.
Chipping to achieve 1/4 in. amplitudes in surface roughness was done by hand using a pick axe. The chipping operation and the resulting surface are shown in Figs. 3.22 and 3.23, respectively.
Two shear keys were cut into the base blocks along the interface using an electric jack hammer. The 8 in. x 8 in. keys were cut to a 1-in. depth. They were positioned midway between the locations of the dowels used for interface reinforcement. A completed shear key is shown in Fig. 3.24. The interface surface preparation for each speci men is detailed in Table 3.1.
Before drypacking of one of the overhead cast specimens 16A, the base block interface was coated with an epoxy bonding agent. The drypacking operation was completed within the pot life of the epox~
3.1.4 Interface Reinforcement. The reinforcement across the concrete interface consisted of 116 reinforcing bars used as dowels. The number, spacing, and embedment depth into the base blocks of these dowels varied with each specimen ranging from two to six dowels, 3 in. to 12 in. embedments, and 6 in. to 12 in. spacings. All of the dowels were e~tended to the full heighth of the wing walls to ensure that full development length was provided in the wing walls.
The steel crossing the interface area varied from Pv = 0.24% to 0.73%, where Pv is defined as the area of the reinforcing steel di vided by the effective interface.
The procedures followed to place the reinforcement dowels in the base blocks were identical to those followed by Luke [8]. An electric roto-hammer was used to drill a 1-in. diameter hole into the base block to a predetermined depth. Most of the holes were drilled down into the base block resting on a side. 'For specimen~ with vertically cast wing walls the holes were drilled horizontally into a block resting on one end.
The dowels were then bonded with epoxy into the base blocks following the epoxy manufacturer's recommendations. In nearly all of the specimens, the dowels were installed along the center line of the base blocks as shown in Fig. 3.25. The dowels in specimens 8A, 20A, and 20B were staggered 2 in. off center to either side as shown in Fi g. 3.26.
30
Fig. 3.21 Sandblasted interface
Fig. 3.22 Chipping operation

31
Fig. 3.23 Chipped interface
Fig. 3.24 Interface with shear keys
32
>.
Fig. 3.25 Three #6 dowel bar arrangement for base block containing two #11 bars longitudinal reinforcement
o 3.26 Three #6 dow~l bar arrangement block containing three #11 bars longitudinal reinforcement
33
3.1.5 Materials and Quality Assurance.
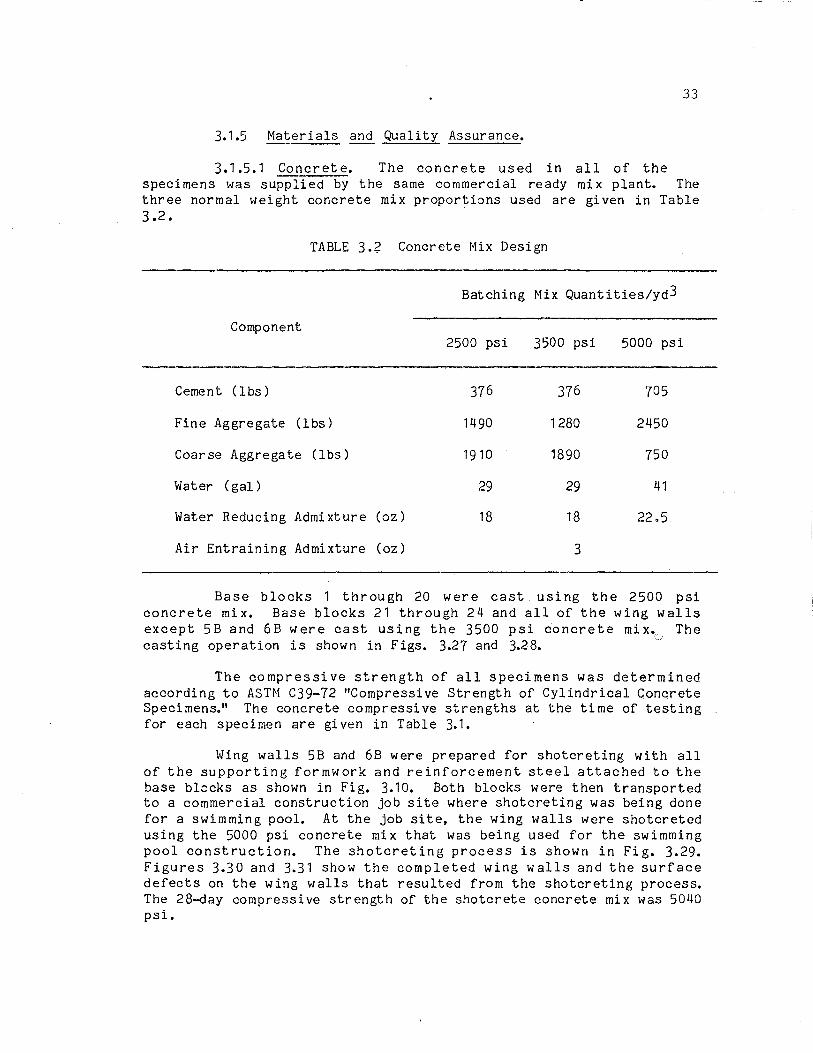
3.1.5.1 Concrete. The concrete used in all of the specimens was supplied by the same commercial ready mix plant. The three normal weight concrete mix proportions used are given in Table 3.2.
TABLE 3.? Concrete Mix Design
Batching Mix Quantities/yd3
Component 2500 psi 3500 psi 5000 psi
Cement Clbs) 376 376 705
Fine Aggregate (lbs) 1490 1280 2450
Coarse Aggregate (lbs) 1910 1890 750
Water (gal) 29 29 41
Water Reducing Admixture (oz) 18 18 22.5
Air Entraining Admixture (oz) 3
Base blocks 1 through 20 were cast using the 2500 psi concrete mix. Base blocks 21 through 24 and all of the wing walls except 5B and 6B were cast using the 3500 psi cioncrete mix~ The casting operation is shown in Figs. 3.27 and 3.28.
The compressi ve strength of all specimens was determined according to ASTH C39-72 "Compressive Strength of Cylindrical Concrete Specimen~" The concrete compressive strengths at the time of testing for each specimen are gi ven in Table 3.1.
Wing walls 5B and 6B were prepared for shotcreting with all of the supporting formwork and reinforcement steel attached to the base bl~cks as shown in Fig. 3.10. Both blocks were then transported to a commercial construction job site where shotcreting was being done for a swimming pool. At the job site, the wing walls were shotcreted using the 5000 psi concrete mix that was being used for the swimming pool construction. The shotcreting process is shown in Fig. 3.29. Figures 3.30 and 3.31 show the completed wing walls and the surface defects on the wing walls that resulted from the shotcreting process. The 28-day compressive strength of the shotcrete concrete mix was 5040 psi.

34
Fig. 3.27 Specimen casting operation
Fig. 3.28 Specimen casting operation
35
Fig. 3.29 Shotcreting process of wing wall 5B and 6B
Fig. 3.30 Surface defects of shotcreted wing wall, 5B
Fig. 3.31 Surface defects of shotcreted wing wall, 6B
36
3.1.5.2 Steel Reinforcement. Grade 60 deformed steel bars were used for all of the reinforcement including the interface dowels. All of the bars were cut and the reinforcing steel cages fabricated at the laborat ory.
3.1.5.3 For!!!work. All formwork was constructed using 3/4 in. exterior polywood with 2 in. x 4 in. bracing. All of the forms were lacquered and oiled prior to assembly. Forms were tied with 3/8 in. threaded rods.
3.1.5.4 Drypack Mortar. The drypack mortar used in the overhead casting position consisted of one part Type I portland cement and two parts fine aggregate by volume, with enough water added to make a solid dense mass sui table for the drypacking procedure. The mortar was mixed and placed by hand at the laboratory. The 90-day compressive strength of the drypack mix, as determined using two 2 x 4 in. cylinders was 3900 psi.
3.1.5.5 Epoxy. Two epoxies, Concresi ve 1001 LPL and Concresive 1411, furnished by Adhesive Engineering Company, were used in this study. Concresive 1001LPL is a two-component liquid epoxy bonding agent designed for application in warm environments and has a relatively long pot life. Concresive 1411 is a two-component paste epoxy bonding agent for general purpose bonding in warm environments. The liquid epoxy was used as a surface bonding agent for one overhead casting and to set dowels into the base blocks. The paste epoxy was used to set dowels into holes for specimens with an overhead or vertical casting positions.
To assure the quality of the epoxies after mixing, slant shear specimens were tested following the recommendations of AASHTO T237 for epoxy adhesive resin. Two slant shear cubes were prepared from each batch of epoxy mixed. One sampling of epoxy was taken immediately after mixing and one was taken from the remaining material after completion of the dowel installation.
The slant shear specimens were allowed full curing prior to testing as specified by the epoxy manufacturer. All of the slant shear specimens tested using either type of epoxy exceeded the manufacturers specification for slant shear strength of 5000 psi except for one paste epoxy specimen which failed at 4750 psi. This low test strength was considered acceptable because failure occurred in the concrete and did not involve the bonded epoxy plane.
A total of twelve scant shear specimens using Concresive 1001LPL were tested and gave an average strength of 8524 psi with a standard deviation of 1200 psi. A total of four specimens was tested using Concresive 1411 having an average slant shear strength of 7316 psi with a standard deviation of 1840 psi.

37
3.1.5.6 Dowel Placement. To ensure that the dowel placement procedures described in Section 3.1.4 were satisfactory, pullout tests on a sampling of the dowels were conducted prior to casting of the wing walls. The placement of the dowels was assumed to be of good quality if the dowels demonstrated linear elastic behavior when stressed up to loads of 40 to 50% of the maximum pullout strength as predicted by Luke [21 J.
3.2 Test Frame
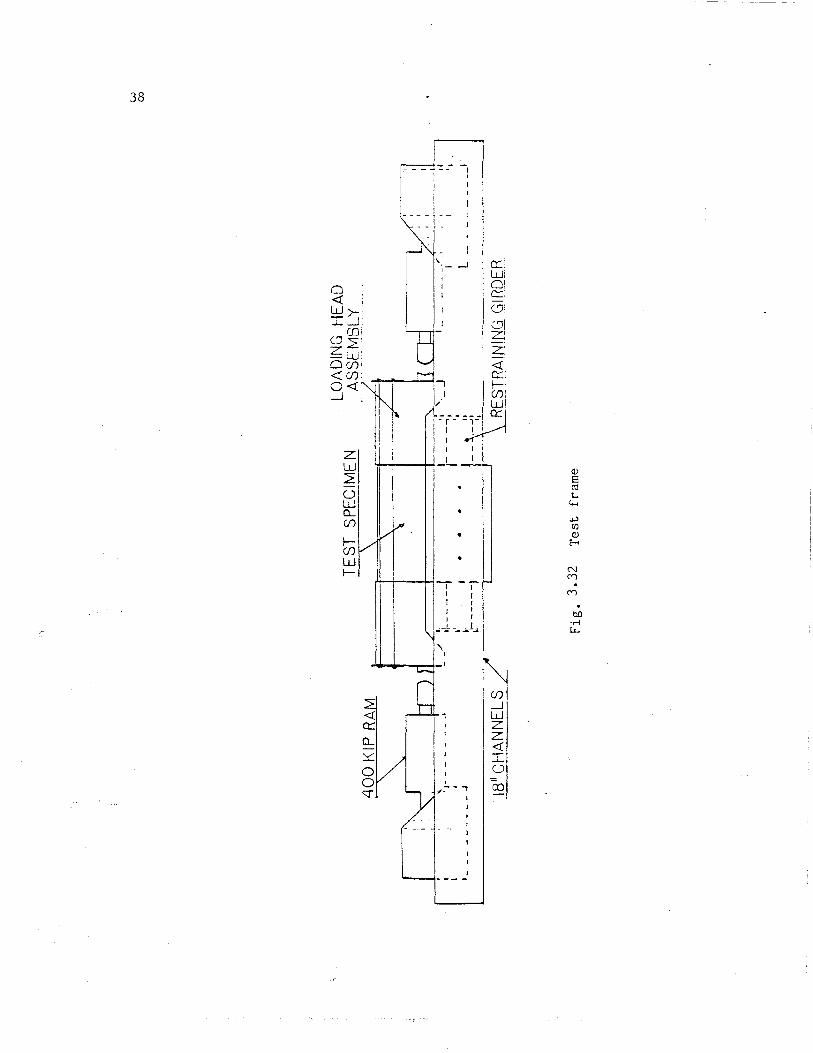
The testing frame and loading apparatus, illustrated in Fig. 3.32, were designed to ensure that the plane of loading during a test coincided with the concrete interface between the wing wall and base block of each specimen.
The basic frame was fabricated out of two 18-in. channels with 1-in. stiffeners. The channels were spaced at 24 in., the width of the base blocks. Two restraining girders were provided on either end of the test specimen to prevent any movement of the base block during testing. Two hydraulic rams with a load capacity of 400 kips positioned at both ends of the frame were used to load the specimen~ A loading head assembly was designed to allow the applied force to be evenly distributed over the end surface of the wing walls while maintaining the plane of loading along the concrete interface with minimal eccentricities. Figure 3.33 shows the loading head assembly, and the entire frame with a test specimen in place is shown in Fig. 3.34.
3.3 Testin~ Procedures
The following is a discussion of the procedures followed before, during and after testing of a specimen.
3.3.1 Preparation f£!::. Testing. The specimens were set into the frame assembly and secured in place by a small hydraulic ram to a level of about 35 psi. Pre-compressing the specimen in place assured no movement of the base block during testing.
The loading head assembly was then lowered into place and rested on top of the wing wall. The weight of this assembly induced a compressi ve force perpendicular to the interface of approximately 5 psi over the 10-in. wide wing walls and about 8 psi over the 6-in. wide wing wall. The gap between the loading head and the wing wall was th€~ sealed and filled with a fast setting cement. This resulted in uniform application of pressure against the wing wall during testing.
3.3.2 Testing. Test specimens 1 A through 5A were used to verify the performance of the testing and data acquisition equipment
LOA
DIN
G
HE
AD
rES SP
EC'M
E;5_
_ A§S
Efv
il3l"
Y.
k1I--
" l
' ,
, I
I I
~ )
11 /
I =
A-
cd
/~ ~t
).!
I.,
1'1
'-_
J
,_ _
--
---
, "
, .~ -
-'-
--t
1--
--..
, J
I I
• .
I ••
I. L
I I
I··
J II
_
__
__
__
_ _
::-----
-1 j-
-\-~
: I _
__
__
__
__
J 18
11 C
HA
NN
ELS
. _
__
__
==
----:J_
--\ RESIBAtNJt1~J~LRQEfl
Fig
. 3
.32
T
est
fr
ame
w
(Xl

39
Fig. 3.33 Loading head assembly
Fig. 3.34 Specimen in test frame

40
and to determine the loading rates to be used during testing. Specimens lA through 4A were subjected to r.epeated load cycles in one direction. Specimen 5A was subjected to alternate repeated load cycles in both directions. Based on the results of the first series of specimens, the load levels were established for testing the remaining specimens, as follows.
In general, each specimen was subjected to repeated load cycles based on applied load levels or average displacement of the wing wall along the interface measured at the midsection of the specimen. A total of ten load cycles was applied to most specimens. First, three cycles to a load level of 50 kips, which corresponded to a shear stress of 139 psi for the la-in. wing wall were applied. Second, three cycles at a level of 100 kips (stresses of 278 psi) were then applied, followed by three cycles at a load level corresponding to the level necessary for a wing wall displacement of approximately 0.1 in. in each loading direction. Finally, one cycle up to awing wall displacement value of approximately 0.5 in. in each direction was appl ied. The shear stresses which correspond to the 50 kip and 100 kip load levels for the 6-in. wide wing wall were 231 psi and 462 psi, respecti vely.
If the maximum shear stress capacity occurred at a load level less than 100 kips, loading continued directly on to the 0.1 in. displacement cycles.
3.3.3 Instrumentati~. Strain gages were placed on the center dowel of the interface reinforcement of Specimens 1A through 6A. These were positioned 1/2 in. and 1-1/2 in. above the concrete interface to investigate the streses being transferred through the interface reinforcement. The data collected from these strain gages were inconclusive. This, together with the disruption of the concrete bond tc the dowels in the area around the gages, resulted in the decision to discontinue their use in the main series of tests.
Load was monitored using pressure transducers. A total of 14 displacement transducers were used to monitor deformations across and along the interface. Two were used to control the movements of the hydraulic rams. Two were used to monitor the displacements of the loading head. Six were positioned to detect any displacements along the interface in the direction parallel to the plane of the interface and four were placed to detect any displacements between the wing wall and the base block perpendicular to the concrete interface.
Displacements were monitored on both sides of the interface at the ends and midsection to detect any rotation or uneven movements during testing. Positioning of the displacement transducers is shown in Figs. 3.35 through 3.37.

North
Fig. 3.35 Displacement transducer locations
Fig. 3.36
41
Horizontal and vertical displacement transducer connections, north or south end
Fig. 3.37 Horizontal displacement transducer connections, midsection
42
In this report any displacements along the concrete interface are referred to as slip and any displacements perpendicular to the interface are referred to as uplift.
3.3.4 Win& Wall Removal. Because both sides of some of the base blocks were needed for testing and to examine the failure plane of the specimens, it was necessary to remove the wing walls from the base blocks after testing. Cores were drilled through the wing walls close to the interface to cut through the interface reinforcement. The wing walls were then easily removed using an overhead crane since the bond between the wing wall and the base block was destroyed during testing.
3.4 Data Acquisition
The applied load-slip relationship at the midsection of the test specimen was continuously monitored and plotted during testing by a Hewlett Packard 3497A high speed data acquisition system. Data from the continuous plot was not stored but the application of load was frequently interrupted for approxi rna tely 20 to 50 seconds to record data from all instruments and to store the data on a permanent dis~ Because the stress-slip relationships had to be accurately reproduced at a later date, typically 200 data readings or scans were taken during the course of a test.
C HAP T E R 4
TEST RESULTS
4.1 Load-Deformation Relationships
The load-deformation relationships of the test specimens were recorded at ten locations along the concrete interface. During testing, loading was applied at the north end or the south end of the wing wall depending on the direction of the load cycle. Slips and uplifts were recorded at the north and south ends on both sides of the interface and slips were also recorded at the midsection on both sides of the interface.
A continuous plot of the load-slip relationship at the midsection of a specimen is shown in Fig. 4.1. Approximately 200 data readings including load and deformations at all instrumentation locations were taken during each test. Loading was interrupted during data recording and resulted in slight discrepancies between the load peaks on the continuous plots and those in the recorded data. In addition, this interruption in loading resulted in a drop in the applied load for a given deformation value. However, as shown in Fig. 4.1, upon continuation of loading the load-deformation behavior returned to previous values.
Figure 4.2 shows a portion of the stress-slip relationship between 0.1 in. interface displacement at the north end, south end, and the midsection of the interface. The curves were constructed by plotting the applied shear stress versus the average of the displacements recorded by the two displacement transducers placed on either side of the wing wall at these locations. The shear stress is the applied load divided by the interface area. In this comparison it is shown that the movement at the ends where loading occurs is more severe than that at the midsection. A portion of the stress-slip behavior of a specimen as recorded at the midsection on the west side, the east side, and the average of both is given in Fi~ 4.3. As shown in this figure, rotations and eccentricities were negligible.
An examination of these plots supports the use of the average relative displacements in analyzing the load-displacement behavior of all of the test specimen~ The load-slip behavior at the midsection would be more typical of a strengthening element with a long interface surface length, such as an infil1 wall in an existing structure.
A t y pic all 0 ad - dis pIa c e men t cur ve as r e cor d e d at the midsection of the specimen is shown in Fig. 4.4. Load-deformation curves for all of the test specimens are presented in Ref. 22.
43

44 \ \
DOZ·
~ OS! ' 0'1
0 <1l S
-r-! CJ <1l
rc~ am" p.. Cfl
~
p.. -r-!
~ ..c::
C CJJ
050· 0 0 .- -r-!
~ .w (J) Cd
r-I
~ 0 <1l -. H
.".'r._-.... - .. 000'0 w p.. -r-!
U r-I
Lt CJJ I
0:: r-c:J Cd W 0
OSU'- I- r-I Z
CJJ ;l 0 ;l 0
-r-!
om"- .w 0 0 u
,.....j
• -.::t \ OST '-, \ bO ,
-r-! I ~ " t
L I - OOZ'-
) . , , . l,.J . __ L _-1_1 . ../. .J.j. ._i .... .1 .
(sd!'>l) 0\10l
r-..
. .....
CJ)
CL
..
.."
(f)
(f)
W
0:::
I-
(f)
0::: < w
:r:
(f)
300
270
240
210
180
150
120 90
60
30 0 ~
SOU
TH
~--
... . (
-( .....
........
... ' ....
..... "
: .....
..... ~-
.,
/ ro
o':.
-~~ ~
MID
,
, ,
' ,"
.. ./
... ' !
" ......... r
-S
OU
TH
'\1
~ ,
' ,'\.
.Il"\
., 'j \''
k, ' ,
,\ 'X
--
NO
RT
H
"
. : 1
~ ''\
, .X
\
,/.~11
I"~
1''':''
, '
\ ,~-~"
, : I
N".
.' '\,
\
\ //
I I
,I'
t Ii 1\ '\
\"
. \
\ ,,
/J
/J'f,iJ
Il I·
(Ii
\ \
"''\,
'\
,,//
/.(~¥'
(II
'I I :
\" ''\
,\ \
//
,,~ #
: I:
I
.' q
\ \"
\ \\
,'/ /
,,/./ ~
j' I 'j
I I
' \
\ "
'\,
'//
4"",
" .'
n
. \
"-'""
\
" ~ /
~/
1'111 '
\'
\ \
" , \
J//
.' /Y
,: J
J 'rl
\ _'
_,
" '\
\/ .
.,.-
?"
,,4
?
II 11:
.
II -
---
' '
;':,.
, .-
?"
# 'l/
\
\ -,.
; ~~~,-~;:'\ '
\ .,~,'
, :
~. '"
l ~.
, ".-
?"
-"",
""''-
-t
-j
. ~~ _
__
_ ------
."
' ?;.,~
, 7
\\J '
~.
. --;;::::::::~,
~
..
_""-
' _
_
I .~~~......
-=
--
9 ~
=
\'
8 d
INTE
RFA
CE
DIS
P.
<in
)
~
=
9
NORT
H
Fig
. 4
.2
Part
ial
load
-sli
p
curv
e as
reco
rded
at
the n
ort
h a
nd
sou
th
end
s an
d
the
mid
secti
on
of
the
co
ncre
te in
terf
ace,
Sp
ecim
en
lSA
~
,!::o
Ln
'""'
......
(f) 0...
.....
Ul
Ul
w
n::
I-
Ul n::
<:
w
I Ul
300
270
240
210
180
150 1~ t
90
60
30 0 ~
.--~;--,.,,-.
r 1;"-
.-"--"
-i I
:"'
.:::::
:""'-
I -~~
'N!
I '~
,~EA
ST
i ,l~
''Y
< AV
G .:
I '
1 .
, .
1·/
' .,,~
\.
" ,1
1'
."
.' I .1
: , '*' .'
\:-.41
\
, I p
i'
' :
WE
ST
· i
I::
\ \ .
",
. \
\ ~/=
' --
-::
:,V
l .
· :i ~ I
\\'
"'\'\
\
\ /
/ //
. -,~'
:. i
i .
II·' ,
..
. ,
/'
.: Pi
I \~
''\::
. \
I //"
/' }1
f/h
· !fili
i \\
'-'::
: // .
/ /1
l(' ·/i·
:· II.
' :
\ '\'
\ .
\ v
' .
/ Y
"/
, : I
, ~II
" . ,
'
/ /
/1'
./'
.,. ,
.:-)_ _
1 y'
. /
/r' ,/ I
1/' .,
I,J ,
_.
'\'\
. '\
.
/ /'
/'
.,
: I
.~U~
---:
:~ /..,;
;/<\
\' ./
:::,
,-/(
//".
. I
II
1'/1
~ .
__ ~_~-'
\ -
_' ./
....
'.
I" .. ~--"
. ,'-
.'
I" '''
'"
_-'~' ",,
" <
,c::
:-,'
-/'.
.'
I 1/
//' 1.
<,,, ~-~~
. ,,-'
' :
~~:;6~~!5-~~ ,
,~~.
. I
~ 'JI
......
~~
/ ..
....
....
1
,~-'
..... \
,\ .. __ -::::
:-__ .
'iSA
..~ "
§
8 =
g ......
~
~
~
. "
c::i
SOUT
H IN
TER
FAC
E
DIS
P.
<in
) NO
RTH
Fig
. 4
.3
Part
ial
load
-sli
p
curv
e as
reco
rded
at
the east
an
d w
est
sid
es
of
the
co
ncre
te
inte
rface,
and
th
eir
av
era
ge,
Sp
ecim
en
lSA
~
0'\
540
450
,,3
60
~
CII c..
...,
tn
~270
a:::
I tn
a:::
< ~
100
U1
90 o~
I'
--------.
..... --, ,/
,~~-
----
""
/ C'
"
~
~
~
I'
" "
SOUT
H
8 .....
§ "
d
,..-
-'j
./
i (
I
i OJ
' ,/
1
' ,
I I
/ --~
, I II
"...--
' I
8 -
/ ,
" J
,,/
I -----./
)
~
~
,/
~
INTE
RFA
CE
DIS
P.
(in
) NO
RTH
Fig
. 4
.4
Lo
ad
-sli
p
curv
e as
reco
rded
at
the m
idse
cti
on
of
the
co
ncre
te in
terf
ace,
Sp
ecim
en
9A
~
.p
'-l
48
Figure 4.5 shows the variation in average uplifts as recorded at the north and south ends and the average uplift of both ends. These curves were constructed by plotting the applied shear stress versus the average reading of the displacement transducers placed perpendicular to the concrete interface on both sides of the wing walls at the north and south ends. As shown in this figure, the uplift recorded at any location is highly dependent on the direction of loading and caution should be used in trying to develop any specific conclusions from these perpendicular displacement curves.
A typical average perpendicular displacement curve for all four rC3dings is shown in Fig. 4.6. Similar curves for all of the specimens are presented in Ref. 22. The uplift data may provide an indication of the overall effectiveness of different surface preparation techniques and a correlation between the parallel deformation (slip) and perpendicular deformation (uplift) characteristics of the specimens, especially after failure of the bond between the structural elements. These curves, however, cannot be used to estimate potential crack widths because they are a function of the specific characteristics of the test specimens and the loading procedure used.
4.2 Maximum Shear Capacities
The maximum shear loads and stresses for each specimen are gi ven in Tables 3.1 a through 3.1 f. Loads were taken from the continuously recorded load-slip curves to provide the most accurate maximum shear capacity for use in analyzing the data.
4.3 Stress-Slip Envelopes
Stress-slip envelopes for all of the tests were plotted using midsection displacements. The peak load at each displacement level was used to construct a failure envelope showing the shear capacity of the specimen as a function of the displacement of the wing wall along the interface. Stress-slip envelopes for all specimens are presented in Figs. 4.7 through 4.9.
Occasionally, during a test a crack would develop between the supports of one or more of the displacement transducers resulting in inaccurate data. In that instance, the load-slip behavior at all of the instrumentation locations were examined to develop estimated values for the load degradation plots. Any estimated values are noted on the plots and shown as open circle data points.
400
360
320
280
---\\~ S
OU
TH
,......
240
\ /
AV
G.
\
• .-<
(J
) 0..
'-
-'
U1
U1
W
0::
l- U1
0::
<:
W
I U1
200
100 rl
/'
<'
120
I "- I
----
----
--..
...
--------_
.. _--
----
--....
--
------
------
-80
40
... -----...
--0
0 8 rg
9 §:!
~
Kl d
UP
LIF
T
<in
che
s)
Fig
. 4
.5
Lo
ad
-up
lift
cu
rves
as
re
cord
ed at
the n
ort
h a
nd
so
uth
en
ds
of
the in
terf
ace,
and
th
eir
av
era
ge,
Spe
cim
en
13A
.!O
-0

""'
.....
0 8- tI)
tI)
lIJ
~
tI)
0::
<
lJJ
:l:
tI)
540
450
360
210
180 90 o~
~ .
"
r--.
/\
/' \~ I
1 !
. I
I :
: I
I I
I I
• I
~ .
• i : , J : I ..
j : //
Jr
•
Kl -
UP
LIFT
(i
nch
es)
~ -
~
~
Fig
. 4
.6
Lo
ad
-up
lift
cu
rve,
aver
age
up
lift
at
no
rth
an
d
sou
th e
nd
s,
Sp
ecim
en
9A
VI o
--If..
- en en
La
J a:
.....
3
00
en
0:
: « LaJ
J: en
10
0\-
o
60
0
50
0
9A
4
00
~
---...
~ \\"
-....
......
6A
~14A
\ -
IIA
X~
"----
-.c 20
0f1\
~15A
1 x
-.... ....
....
....
..
..........
..........
..........
S
A
x-
-X
-X
~A
100~
13A
~~ --+
-+
-+
lO
A
.1
.2
.3
.4
.5
a .1
.2
.3
.4
.5
INT
ER
FA
CE
D
ISP
. (I
n.)
IN
TE
RF
AC
E
DIS
P.
(In
.)
Fig
. 4
.7
Str
ess-s
lip
en
vel
op
e cu
rves,
S
pec
imen
s.6
A-1
6A
V
1 ......
60
0
50
0
'iii
40
0
0.
U)
U) w
a::
t U) a::
<t w
J:
U)
10
0 o
.1
60
0
50
0
'\
40
0
20
A
ISA
17A
20
0
:...
..
»( .~-
~{.
'?---
---A
19A
100
.2
.3
.4
.5
o
INT
ER
FA
CE
D
ISP
. (I
n.)
.1
.2
,3
.4
INT
ER
FA
CE
D
ISP
. (I
n.)
Fig
. 4
.8
Str
ess-s
lip
en
velo
pes,
S
pec
imen
s 17
A-2
4A
21A
22
A
24
A .5
\.J1
N
60
0
50
0
'iii
40
01
11
-"
a.
(/)
CI)
LU
a::: t;
30
01
+ \
a:::
<:(
~ 200
~
10
0\-
o
60
0
50
0
"-4
00
'\. \
. \.
30
0
48
'A-
28
20
0
---4
--*-
~.-4
'X
38
58
100
.1
.2
.3
.4
.5
o .1
.2
.3
.4
INT
ER
FA
CE
D
ISP
. (I
n.)
IN
TE
RF
AC
E
DIS
P.
(In
.)
Fig
. 4
.9
Str
ess
-sli
p e
nv
elo
pe
curv
es,
Spe
cim
ens
IB-6
B,
17B
, 20
B,
21B
.5
\J1
Vol

54
4.4 Failure Mechanisms
The failure characteristics of the test specimens were examined to determine any correlation between the observed loaddeformation behavior of different repair or strengthening schemes and the observed failure mechanisms. The crack patterns were mapped for each specimen. Some wing walls were also removed after testing to examine the failure planes. Figures 4.10 through 4.15 show typical crack patterns and failure surfaces observed.
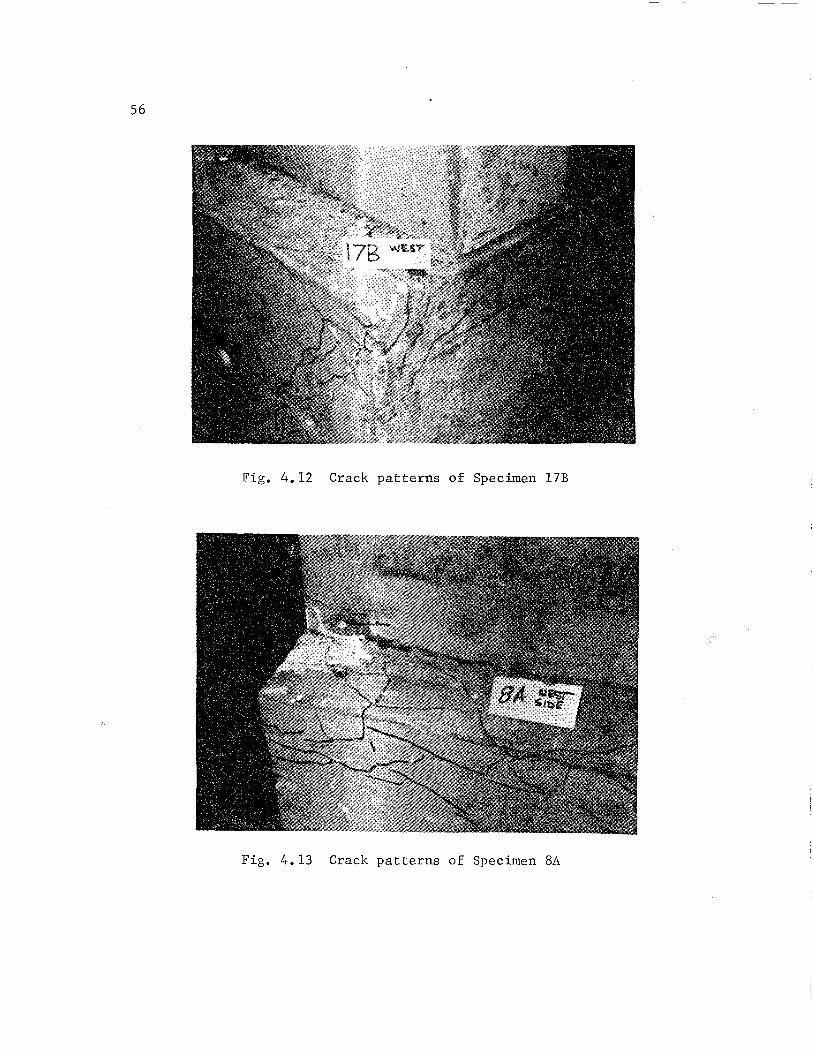
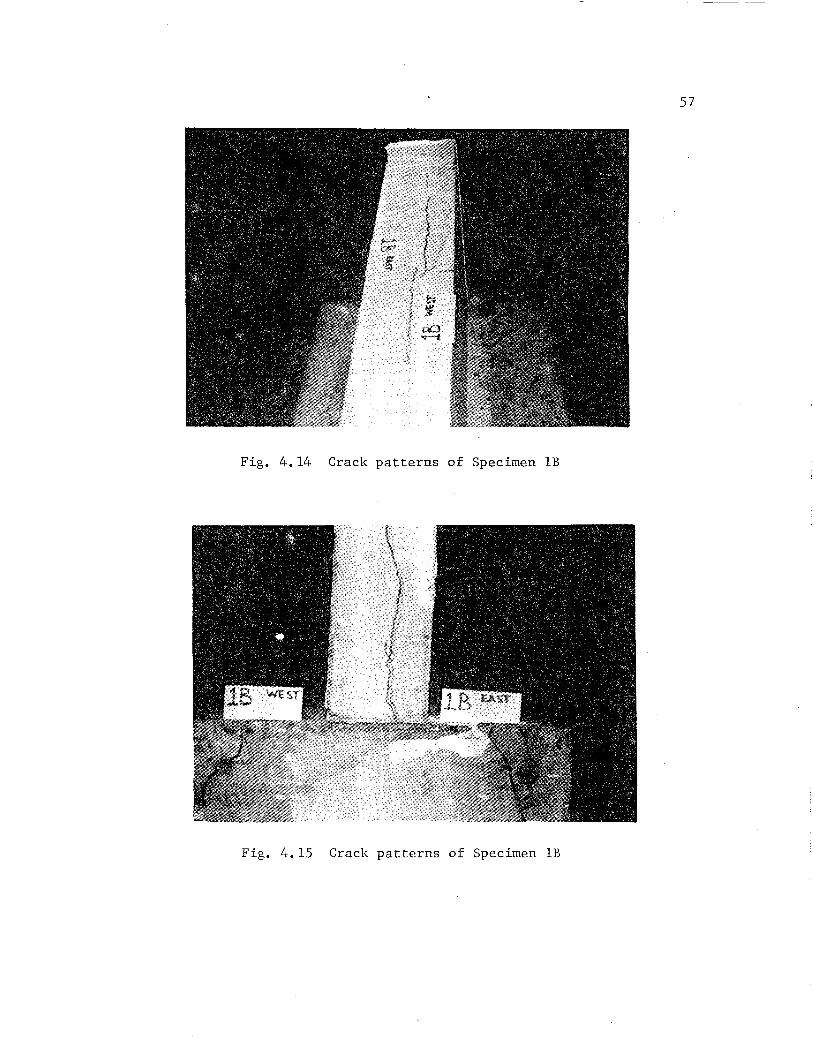
Cracks originating from the dowels and extending to the ends of the base blocks in a "V" pattern, as shown in Fig. 4.12, were common in all of the specimens except a few where the base block had a higher concrete compressive strength than the wing wall. Occasionally, cracks would develop in the base block between the dowel locations. Cracks in the wing walls were very rare except in the case of the 6-in. wide wing wall, as shown in Figs. 4.14 and 4.15. These crack patterns suggest that the proximi ty of the dowels to the ends and edges of the base block had a SUbstantial effect on the failure mechanism. A concrete element with a long interface surface length would not be expected to show this extensive cracking along its midsection due to the elimination of end effects. If the strengthening element is placed along the edge of the existing member the cracking would be expected to increase along that edge due to the decreased amount of concrete cover available to resist the induced stresses due to dowel action. The failure plane was always either along the concre te in terface 0 r within the concrete cover of the base block or a combination of both. It was noticed that the specimens with a sandblasted interface, 6-in. dowel embedment, and 12-in. stirrup spacing developed a much deeper failure plane as shown in Fig. 4.10 than that of a similar specimen with a 5-in. stirrup spacing in the base block, as shown in Fig. 4.11. The concrete around the dowels in the base block was frequently crushed due to the cyclic loading.

IN~
WA
LL
~"
Fig
. 4
.10
F
ail
ure
pla
ne
alo
ng
w
ing
wal
l 6A
F
ig.
4.1
1
Fail
ure
pla
ne
alo
ng
b
ase
blo
ck
l7A
V
1 V
1
56
Fig. 4.12 Crack patterns of Specimen 17B
Fig. 4.13 Crack patterns of Specimen SA
57
Fig. 4.14 Crack patterns of Specimen 1B
Fig. 4.15 Crack patterns of Specimen IB
C HAP T E R 5
DISCUSSION OF TEST RESULTS
5.1 Introduction
The systematic variation of parameters permitted examination of the effect of an individual parameter with all other variables held constant. In the following sections, stress-slip envelope curves will be used to compare results.
5.2 Effect of Dowel Embedment
A comparison of the stress-slip envelopes of specimens having different embedment lengths is presented in Fig. 5.1. Specimens with a 3-in. embedment reached peak shear stresses about 30% lower than those with 6 and 12-in. embedments. At high slip values, the short embedments exhibited even lower residual shear capacity. For specimens having a 3-in. embedment, over 50% 6f the strength was lost at a di splacement of 0.1 in. and 85% was lost at a di splacement of 0.5 in.
Figure 5.1b shows a specimen having a 12-in. embedment and strong base block which reached a 'peak capacity of only 83% of the peak capacity of an identical specimen with a 6-in. embedment. However, the 12-in. embedment specimen maintained a higher residual capacity after a slip of 0.2 in. than the 6-in. embedment specimen.
In general, for a wing wall of higher strength concrete than the base block, the greater the embedment the higher the shear capacity for any displacement values. For a stronger base block (Fig. 5.1b) the shear capacity for 6 and 12-in. embedments, while higher than that for 3-in. embedment, was comparable for most di splacement values.
Shotcreted wing walls showed a distinct difference in the stresses that could be maintained after the peak stress for the di fferent embedment lengths. As shown in Fig. 5.1c, the deeper the embedment, the higher the residual capacity. It is interesting to note that for shotcreted wing walls and weak base blocks the peak stresses for both the 6 and 12-in. embedment specimens were similar while in the cast-in-place wing walls, the peak stress attained using 12-in. embedments was higher than for the 6-in. embedments.
Specimens with a 12-in. embedment consistently maintained 60 to 70% of their peak shear capacities at a displacement of 0.5 in. regardless of other specimen variables. Specimens with a 6-in. embedment maintained between 20 and 55% of their peak capacities at 0.5-in. displacement. The higher residual capacity for the 12-in. embedments
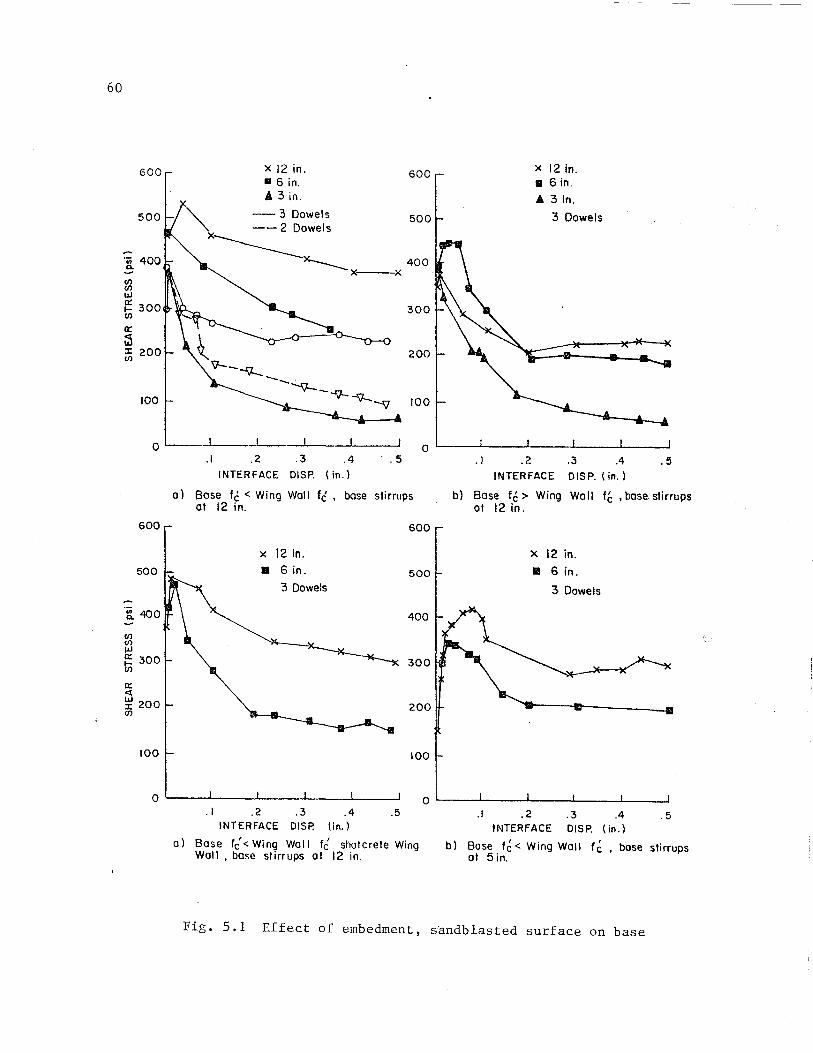
60
600 x 12 in. 600 X 12 in. • 6 in. a 6 in . A 3 in. A 3 in.
500
"" -- 3 Dowels 500 3 Dowels --2 Dowels
'in 400 x ________ X---..-. 400
0.. ~---x
en en w ~ 300 300 en 0:
i5 :t: 200 200 en
100 - 100
0 0 .1 .2 .3 .4 .5 .1 .2 .3 .4 .5
INTERFACE DISP. ( in.) INTERFACE DISP. (in.)
0) Bose fc < Wing Wall fc , bose stirrups b) Bose f6 > Wing Wall fc ,bose stirrups at 12 in. at 12 in.
600 600
x 12 in. x 12 in.
500 • 6 in . 500 • 6 in . 3 Dowels 3 Dowels
.~ 400 400
en en
~ ILl 0: 300 300 t;; 0: <t ~ 200 200 en
100 100
0 a .1 .2 .3 .4 .5 .1 .2 .3 .4 .5
INTERFACE DISP. lin. } INTERFACE DISP. (in. ) 0) Bose f~ < Wing Wall f~ shotcrete Wing b) Bose f~ < Wing Wall f~ , bose stirrups
Wall, bose stirrups at 12 in. 01 5in.
Fig. 5.1 Effect of embedment, sandblasted surface on base
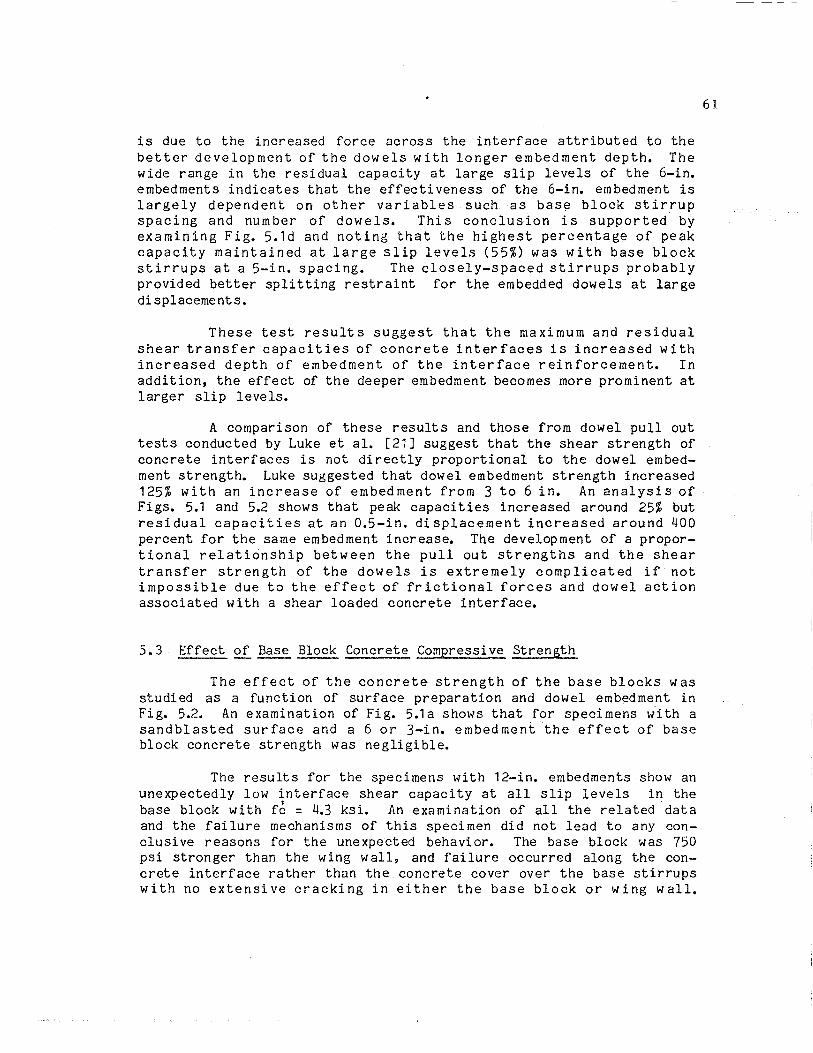
is due to the increased force across the interface attributed to the better development of the dowels with longer embedment depth. The wide range in the residual capacity at large slip levels of the 6-in. embedments indicates that the effectiveness of the 6-in. embedment is largely dependent on other variables such as base block stirrup spacing and number of dowels. This conclusion is supported by examining Fig. 5.1d and noting that the highest percentage of peak capacity maintained at large slip levels (55%) was with base block stirrups at a 5-in. spacing. The closely-spaced stirrups probably provided better splitting restraint for the embedded dowels at large di splacements.
These test results suggest that the maximum and residual shear transfer capaci ties of concrete inter faces is increased with increased depth of embedment of the interface reinforcement. In addition, the effect of the deeper embedment becomes more prominent at larger slip levels.
A comparison of these results and those from dowel pullout tests conducted by Luke et ala [21J suggest that the shear strength of concrete interfaces is not directly proportional to the dowel embedment strength. Luke suggested that dowel embedment strength increased 125% with an increase of embedment from 3 to 6 in. An analysis of Figs. 5.1 and 5.2 shows that peak capacities increased around 25% but residual capacities at an 0.5-in. di splacement increased around 400 percent for the same embedment increase. The development of a proportional relationship between the pUllout strengths and the shear transfer strength of the dowels is extremely complicated if not impossible due to the effect of frictional forces and dowel action associated with a shear loaded concrete interface.
5.3 Effect of Base Block Concrete Compressive Strength
The effect of the concrete strength of the base blocks was studied as a function of surface preparation and dowel embedment in Fig. 5.2. An examination of Fig. 5.1a shows that for specimens with a sandblasted surface and a 6 or 3-in. embedmen~the effect of base block concrete strength was negligible.
The results for the specimens with 12-in. embedments show an unexpectedly low interface shear capacity at all slip levels in the base block with f~ = 4.3 ksi. An examination of all the related data and the failure mechanisms of this specimen did not lead to any conclusi ve reasons for the unexpected behavior. The base block was 750 psi stronger than the wing wall, and failure occurred along the concrete interface rather than the concrete cover over the base stirrups with no extensive cracking in either the base block or wing wall.
61
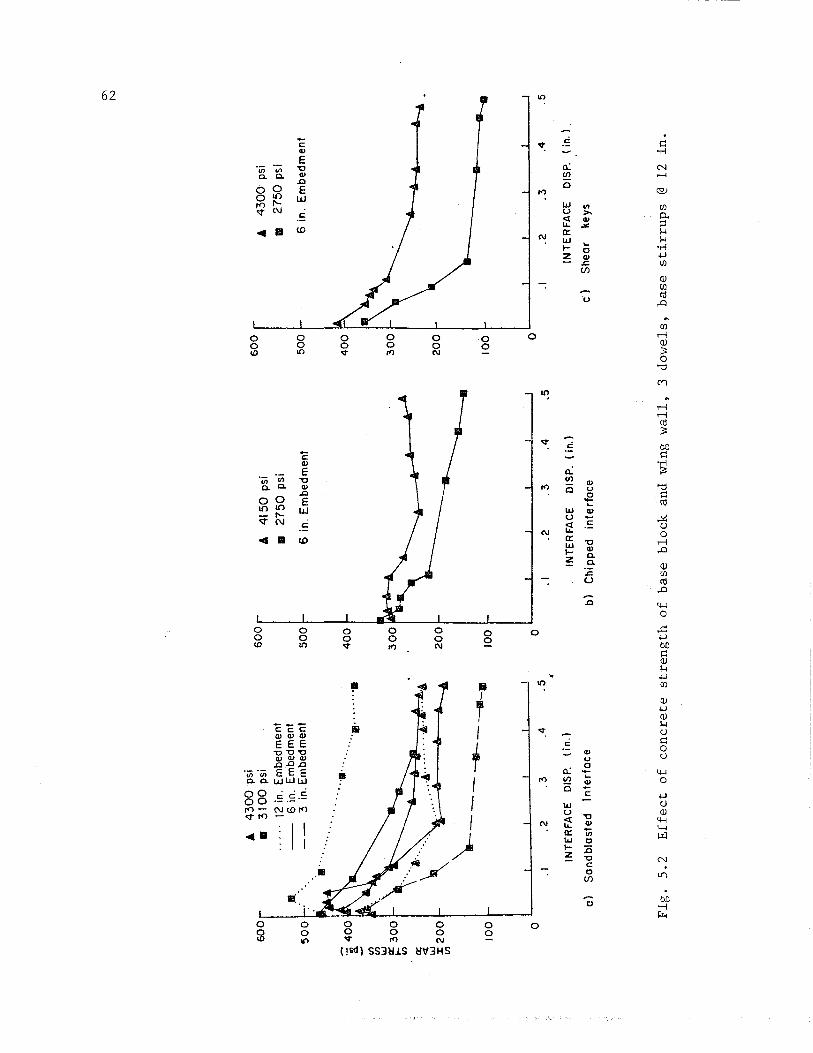
60
0
50
0
'8, 4
00
II)
II) w ~ 3
00
II
) a:
<t
w
x 2
00
ti
l
100
.. A
4
30
0 p
si
II
31
00
psi
..
.. ,
12 i
n. E
mbe
dmen
t 6
in.
Err
ibed
men
t 3
in.
Em
bedm
ent
•...
....
....
. .
..•...
...
'11
" ..
....
.
\l~.~ .
. ~ ... .,:
:, "
....
....
....
A
\-
--
----
--II
-II
I
o .3
.4
.5
.1
.2
INT
ER
FA
CE
D
ISP
. (i
n.)
0)
Sa
nd
bla
ste
d
Inte
rfa
ce
..
60
0
50
0
40
0
30
0
20
0
100
A
41
50
psi
II
2
75
0 p
si
6 in
. E
mbe
dmen
t
o ~--~----~----~----~----~
.1
.2
.3
.4
INT
ER
FA
CE
D
ISP
. (i
n.)
b)
Chi
pped
in
terf
ace
.5
60
0
50
0
40
0
30
0
20
0
100
A
43
00
psi
II
27
50
psi
6 in
. E
mb
ed
me
nt
0'\
N
o L
' __
--L
__
---J
I...
-__
..L
-__
...L
.. __
--I
.1 .2
.3
.4
INT
ER
FA
CE
D
ISP
. (i
n.)
C)
She
ar
keys
.5
Fig
. 5
.2
Eff
ect
of
co
ncre
te st
ren
gth
of
bas
e b
lock
an
d
win
g w
all
, 3
do
wel
s,
bas
e sti
rru
ps
@ 1
2 in
.
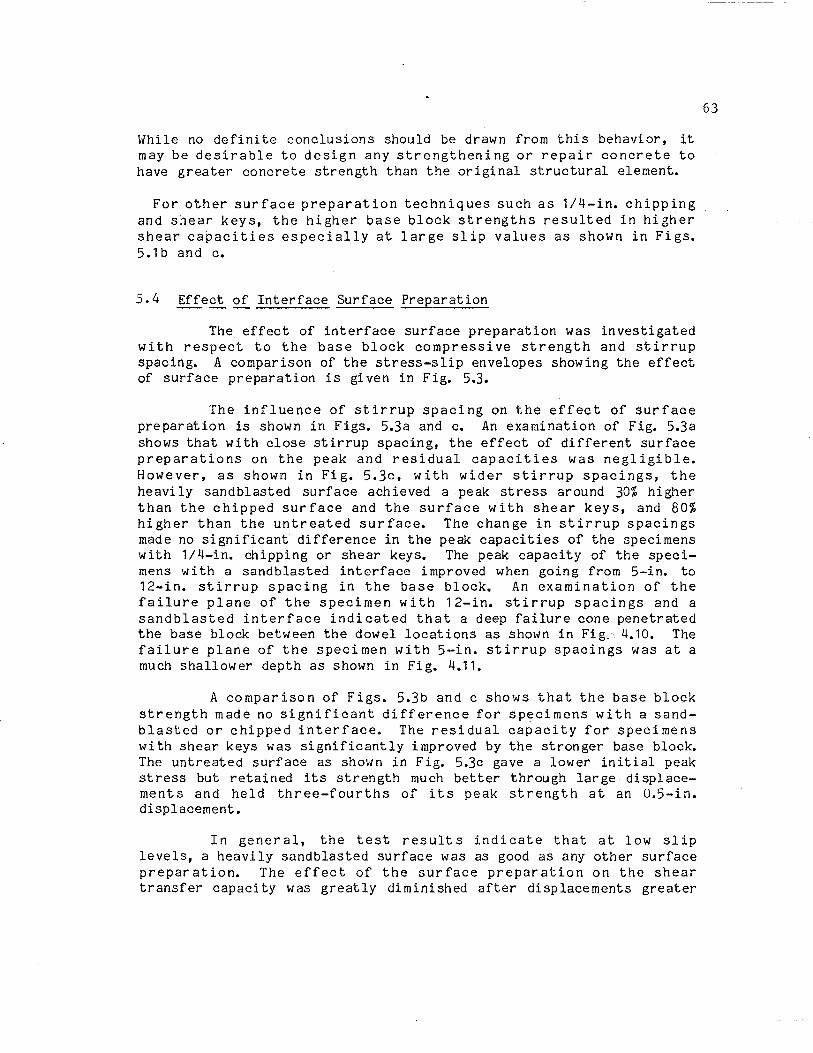
While no definite conclusions should be drawn from this behavior, it may be desirable to design any strengthening or repair concrete to have greater concrete strength than the original structural element.
For other surface preparation techniques such as 1/4-in. chipping and shear keys, the higher base block strengths resulted in higher shear capacities especially at large slip values as shown in Figs. 5.1b and c.
5.4 Effect of Interface Surface Preparation
The effect of interface surface preparation was investigated with respect to the base block compressive strength and stirrup spacing. A comparison of the stress-slip envelopes showing the effect of surface preparation is gi ven in Fig. 5.3.
The influence of stirrup spacing on the effect of surface preparation is shown in Figs. 5.3a and c. An examination of Fi~ 5.3a shows that with close stirrup spacing, the effect of different surface preparations on the peak and residual capacities was negligible. However, as shown in Fig. 5.3c, with wider stirrup spacings, the heavily sandblasted surface achieved a peak stress around 30% higher than the chipped surface and the surface with shear keys, and 80% higher than the untreated surface. The change in stirrup spacings made no significant difference in the peak capacities of the specimens with 1/4-in. chipping or shear keys. The peak capacity of the specimens with a sandblasted interface improved when going from 5-in. to 12-in. stirrup spacing in the base block. An examination of the failure plane of the specimen with 12-in. stirrup spacings and a sandblasted interface indicated that a deep failure cone penetrated the base block between the dowel locations as shown in Fig, 4.10. The failure plane of the specimen with 5-in. stirrup spacings was at a much shallower depth as shown in Fig. 4.11.
A comparison of Figs. 5.3b and c shows that the base block strength made no significant difference for sp~cimens with a sandblasted or chipped interface. The residual capacity for specimens with shear keys was significantly improved by the stronger base block. The untreated surface as shown in Fig. 5.30 gave a lower initial peak stress but retained its strength much better through large displacements and held three-fourths of its peak strength at an O.5-in. displacement.
In general, the test result s indicate that at low slip levels, a heavily sandblasted surface was as good as any other surface preparation. The effect of the surface preparation on the shear transfer capaci ty was greatly diminished after displacements greater
63
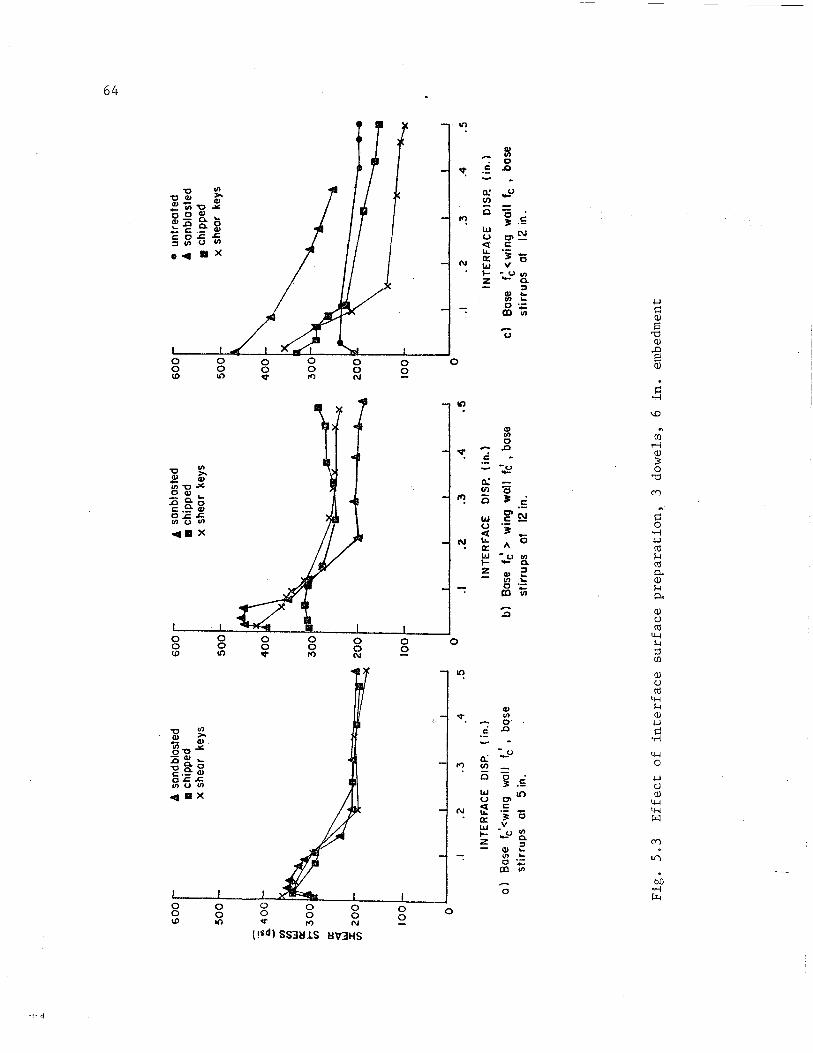
""
60
0 r-
A s
andb
last
ed
600 [
A s
an b
last
ed
600[
• u
ntr
ea
ted
•
chip
ped
• ch
ippe
d A
san
blas
ted
x sh
ear
keys
x
shea
r ke
ys
• ch
ippe
d
SOT
50
0
50
0
x sh
ear
keys
i40
0
CI)
C
I)
UJ a: t; 3
00
a: ~ ~ 2
00
r
1r
.. =
A i
ii z:
::::tt
:! 2
00
I --.
. \
--------
-. 1
00
l-1
00
r 10
°1
o .
I I
I °
0 .1
.2
.3
.4
.5
.1
.2
.3
.4
.5
.1 .2
.3
.4
.5
INT
ER
FA
CE
D
ISP
. (i
n.l
IN
TE
RF
AC
E
DIS
P.
(in
.)
INT
ER
FA
CE
O
ISP
. (i
n.)
a)
Bos
e fc
'<w
ing
wal
l fc
'.
bose
b
l B
ose
fc'
>
win
g w
oll
fc'
• bo
se
cl
Bos
e f~
< w
ing
wa
ll fc
•
bose
st
irru
ps
at
5 in
. st
irru
ps
at
12 i
n.
stir
rup
s of
12
in
.
Fig
. 5
.3
Eff
ect
of
inte
rface su
rface p
rep
ara
tio
n,
3 d
ow
els,
6
in.
embe
dmen
t
0\
+:-
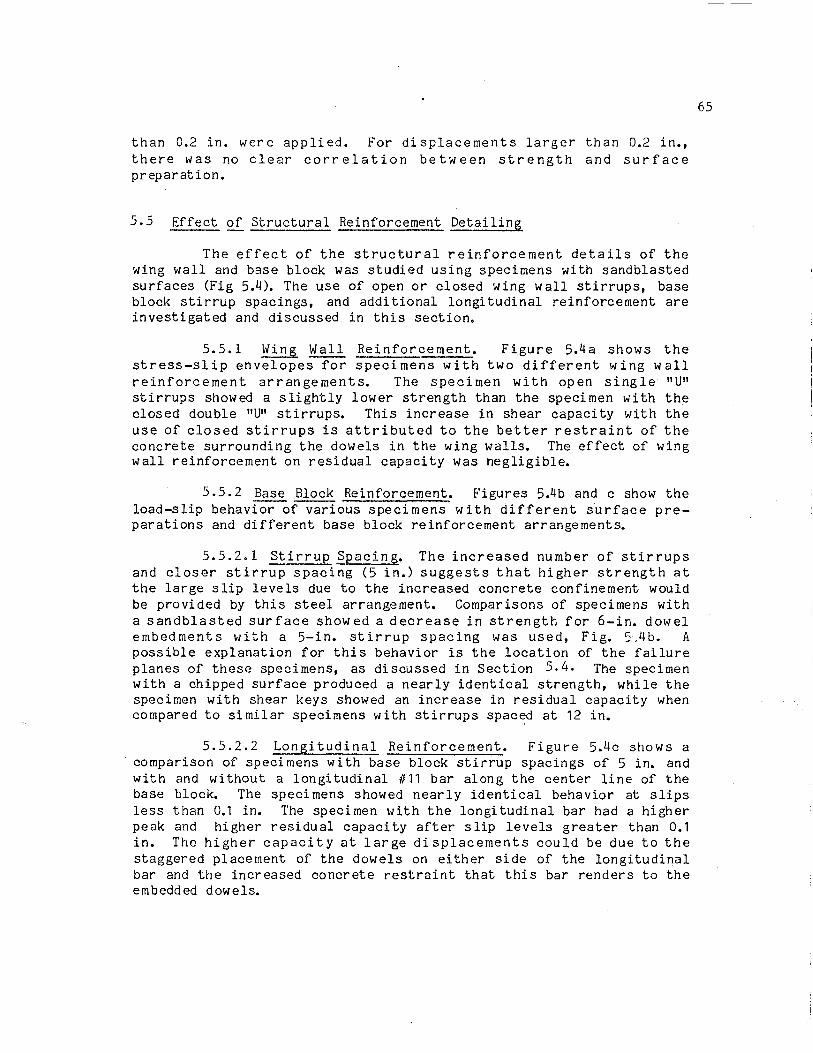
than 0.2 in. were applied. For di splacements larger than 0.2 in., there was no clear correlation between strength and surface prep a rat ion.
5.5 Effect of Structural Reinforcement Detailing
The effect of the structural reinforcement details of the wing wall and base block was studied using specimens with sandblasted surfaces (Fig 5.4). The use of open or closed wing wall stirrups, base block stirrup spacings, and addi tional longitudinal reinforcement are investigated and discussed in this section.
5.5.1 ~~ Wall Reinforcement. Figure 5.4a shows the stress-slip envelopes for specimens with two different wing wall reinforcement arrangements. The specimen with open single "U" stirrups showed a slightly lower strength than the specimen with the closed double "U" stirrups. This increase in shear capacity with the use of closed stirrups is attributed to the better restraint of the concrete surrounding the dowels in the wing walls. The effect of wing wall reinforcement on residual capacity was negligible.
5.5.2 Base Block Reinforcement. Figures 5Ab and c show the load-slip behavior of various specimens with different surface preparations and different base block reinforcement arrangements.
5.5.2.1 Stirrup Spacing. The increased number of stirrups and closer stirrup spacing (5 in.) suggests that higher strength at the large slip levels due to the increased concrete confinement would be provided by this steel arrangement. Comparisons of specimens with a sandblasted surface showed a decrease in strength for 6-in. dowel embedments with a 5-in. stirrup spacing was used, Fig. 5;4b. A possible explanation for this behavior is the location of the failure planes of these specimens, as di scussed in Section 5.4. The specimen with a chipped surface produced a nearly identical strength, while the specimen with shear keys showed an increase in residual capacity when compared to similar specimens with stirrups spaced at 12 in.
5.5.2.2 Longitudinal Reinforcement. Figure 5.4c shows a comparison of specimens with base block stirrup spacings of 5 in. and with and without a longitudinal #11 bar along the center line of the base block. The specimens showed nearly identical behavior at slips less than 0.1 in. The specimen with the longitudinal bar had a higher peak and higher residual capacity after slip levels greater than 0.1 in. The higher capacity at large displacements could be due to the staggered placement of the dowels on either side of the longitudinal bar and the increased concrete restraint that this bar renders to the embedded dowels.
65
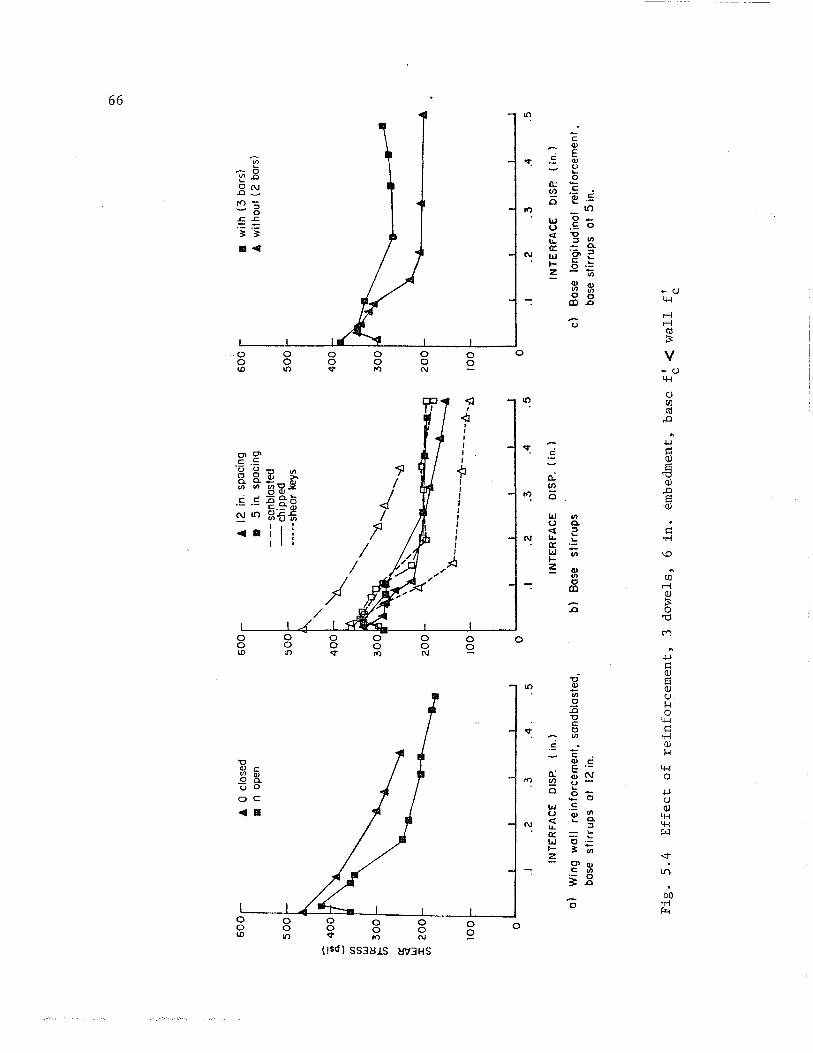
60
0r-
A
0 cl
osed
6
00
r A
12
in.
spa
cing
6
00
r ..
w
ith (
3 b
ars)
..
n o
pen
• 5
in.
spac
ing
A
with
out
(2 b
ars)
-
--
sanb
last
ed
50
0 f-
50
01
--
chip
ped
50
0
----
-sh
ea
r ke
ys
"-
rvvr
~ 400~
40
0
"-"
"'-cr
3
00
3
00
.
~""""'6,
30
0
Ii;
~ '.
\"
....... -
-6
w
:x:
20
0
tf)
--------
. 2
00
I-'-
\ ~=o-
..
c ....
. -n
2
00
10
0
loor
-u--
il
10
0
0 0
0 .1
.2
.3
.4.
.5
.1 .2
.3
.4
.5
.1
.2
.3
.4
INT
ER
FA
CE
D
ISP
. (
in.)
IN
TE
RF
AC
E
DIS
P.
(in
.)
INT
ER
FA
CE
D
ISP
. (i
n. 1
0)
Win
g w
all
rein
forc
em
en
t,
sand
blas
ted,
b
) B
ose
stir
rup
s c)
B
ose
lon
gitu
din
al
rein
forc
em
en
t.
bose
sti
rru
ps
at
12 i
n.
bose
st
irru
ps
at
5 in
.
Fig
. 5
.4
Eff
ect
of
rein
forc
emen
t,
3 d
ow
els,
6
in.
embe
dmen
t,
bas
e f~ <
wall
f~
.5 0
'\
0'\
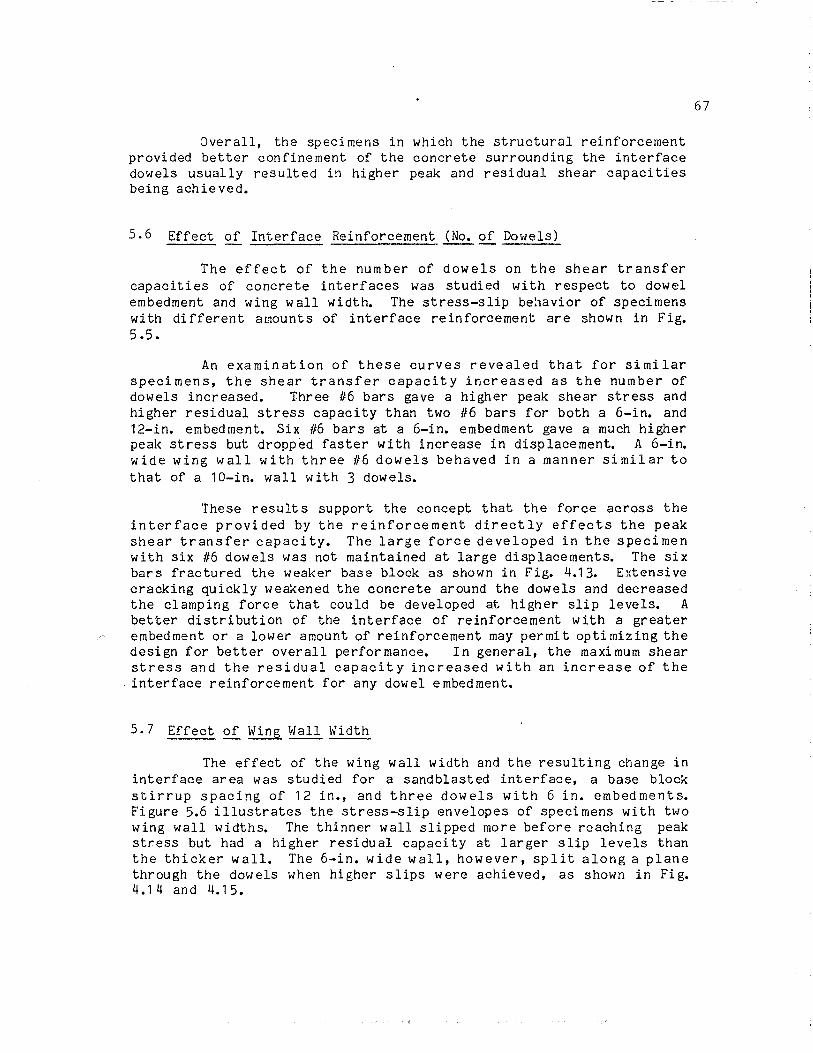
Overall, the specimens in which the structural reinforcement provided better confinement of the concrete surrounding the interface dowels usually resulted in higher peak and residual shear capacities being achieved.
5.6 Effect of Interface Reinforcement (No. of Dowels)
The effect of the number of dowels on the shear transfer capacities of concrete interfaces was studied with respect to dowel embedment and wing wall width. The stress-slip behavior of specimens with different amounts of interface reinforcement are shown in Fig. 5.5.
An examination of these curves revealed that for similar specimens, the shear transfer capacity increased as the number of dowels increased. Three #6 bars gave a higher peak shear stress and higher residual stress capacity than two #6 bars for both a 6-in. and 12-in. embedment. Six #6 bars at a 6-in. embedment gave a much higher peak stress but dropp~d faster with increase in displacemen~ A 6-i~ wide wing wall with three 116 dowels behaved in a manner similar to that of a 10-in. wall with 3 dowels.
These results support the concept that the force across the interface provided by the reinforcement directly effects the peak shear transfer capaci ty. The large force developed in the speci men with six #6 dowels was not maintained at large displacements. The six bars fractured the weaker base block as shown in Fig. 4.13. Extensive cracking quickly weakened the concrete around the dowels and decreased the clamping force that could be developed at higher slip levels. A better distribution of the interface of reinforcement with a greater embedment or a lower amount of reinforcement may permi t optimizing the design for better overall performance. In general, the maximum shear stress and the residual capacity increased with an increase of the interface reinforcement for any dowel embedment.
5.7 Effect of Wing Wall Width
The effect of the wing wall width and the resulting change in interface area was studied for a sandblasted interface, a base block stirrup spacing of 12 in., and three dowels with 6 in. embedments. Figure 5.6 illustrates the stress-slip envelopes of specimens with tlrlO wing wall widths. The thinner wall slipped more before reaching peak stress but had a higher residual capaci ty at larger slip levels than the thicker wall. The 6-in. wide wall, however, split along a plane through the dowels when higher slips were achieved, as shown in Fig. 4.14 and 4.15.
67
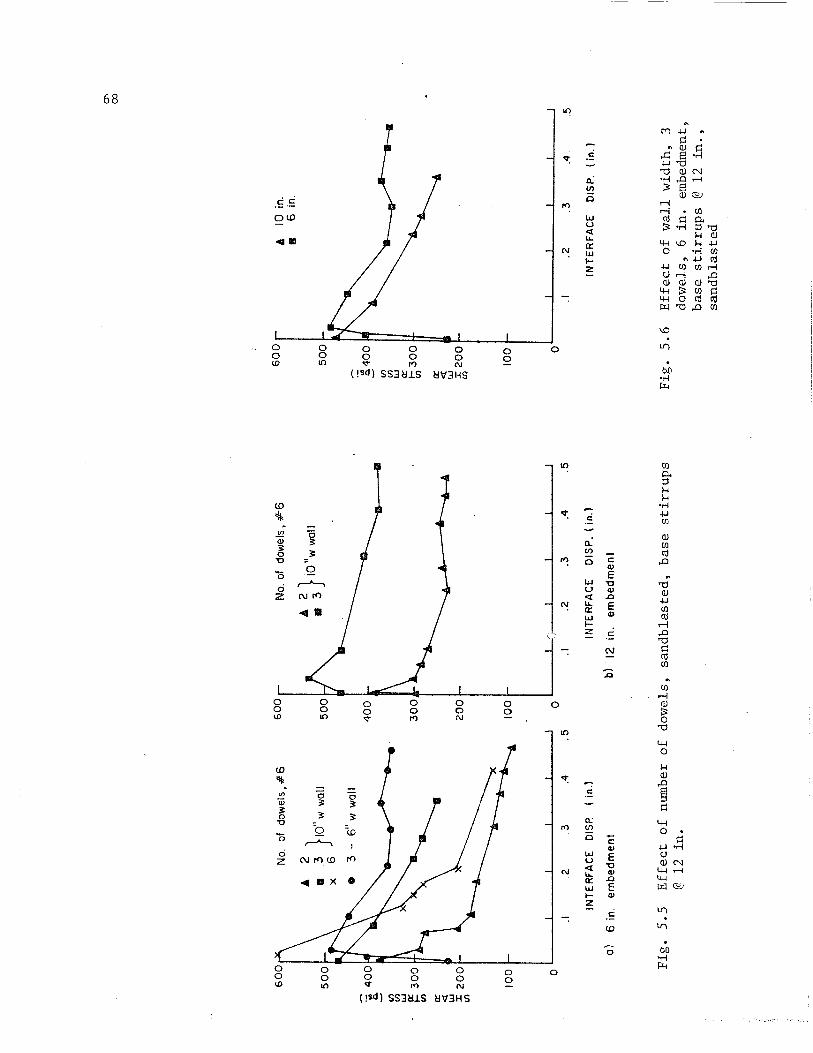
No.
of
do
wel
s, #
6
600~
No.
of
dow
els.
#-6
, 2
, 2}
"
50
0 ~_
\ II
~
}IO"W
wal
l 5
00
•
3 10
w
wal
l
x • 3
-6
" w
wal
l 4
00
~
(/)
~ --
. (/
) w e: 3
00
3
00
(/
) a::
<t w
I2
00
2
00
(/
)
10
0
10
0
a 0
.1 .2
.3
.4
.5
.1
.2
.3
.4
.5
INT
ER
FA
CE
O
ISP
(
in.)
IN
TE
RF
AC
E
DIS
P.
(in
.'
aJ
6 in
. e
mb
ed
me
nt
bl
12
in.
em
be
dm
en
t
Fig
. 5
.5
Eff
ect
of
num
ber
of
do
wel
s,
san
db
last
ed
, b
ase
stir
rup
s @
12
in.
60
0r
, 10
in.
a
6 in
.
50
0
~400
(/)
(/) w
a::
t;;3
00
a::
<t
W ~ 2
00
100 0
.1
.2
.3
.4
INT
ER
FA
CE
D
ISP
. (i
n. I
Fig
. 5
.6
Eff
ect
of
wall
wid
th,
3 d
ow
els,
6
in.
embe
dmen
t,
bas
e st
irru
ps
@ 1
2 in
.,
san
db
last
ed
.5 0
'\
00
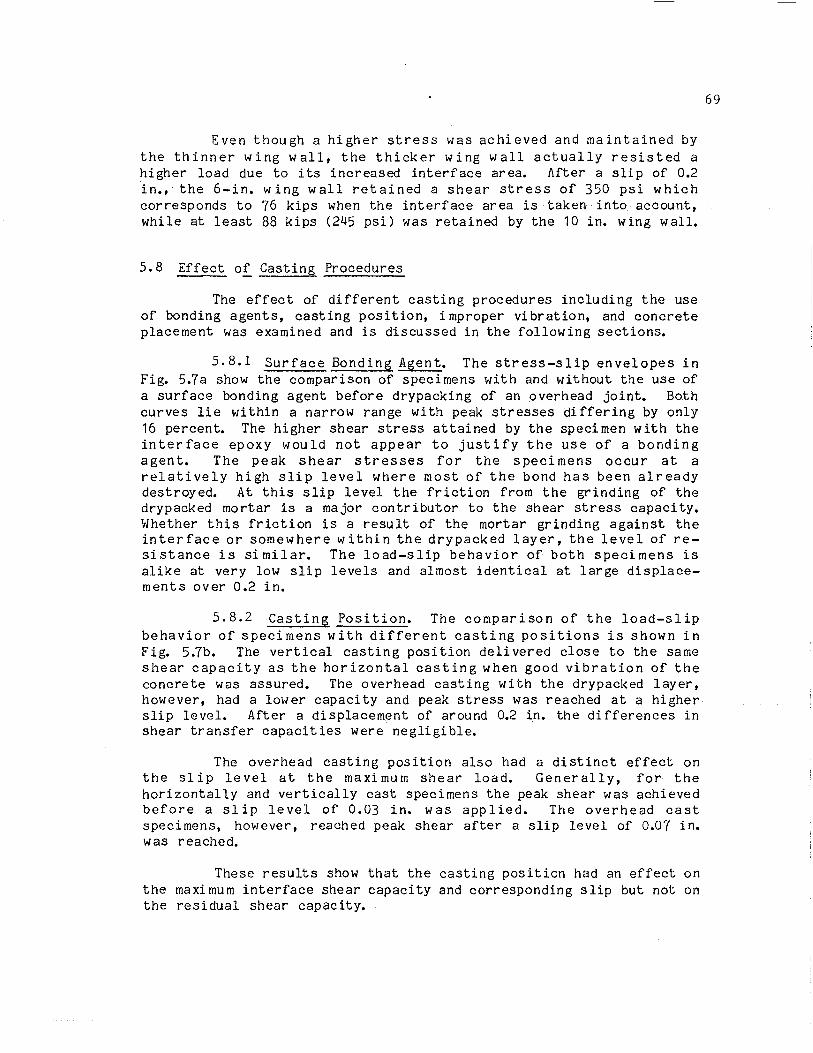
Even though a higher stress was achieved and maintained by the thinner wing wall, the thicker wing wall actually resisted a higher load due to its increased interface area. After a slip of 0.2 in., the 6-in. wing wall retained a shear stress of 350 psi which corresponds to 76 kips when the interface area is taken into account, while at least 88 kips (245 psi) was retained by the 10 in. wing wall.
5.8 Effect of Casting Procedures
The effect of different casting procedures including the use of bonding agents, casting position, improper vibration, and concrete placement was examined and is discussed in the following sections.
5.8.1 Surface Bondin& Agent. The stress-slip envelopes in Fig. 5.7a show the comparison of specimens with and without the use of a surface bonding agent before drypacking of an overhead joint. Both curves lie within a narrow range with peak stresses differing by only 16 percent. The higher shear stress attained by the specimen with the interface epoxy would not appear to justify the use of a bonding agent. The peak shear stresses for the specimens occur at a reI at i ve ly hi gh sli p level wher e most of the bond ha s been al ready destroyed. At this slip level the friction from the grinding of the drypacked mortar is a major contributor to the shear stress capacity. Whether this friction is a result of the mortar grinding against the interface or somewhere within the drypacked layer, the level of resistance is similar. The load-slip behavior of both specimens is alike at very low slip levels and almost identical at large displacements over 0.2 in.
5.8.2Castin& Position. The comparison of the load-slip behavior of specimens with different casting positions is shown in Fig. 5.7b. The vertical casting position delivered close to the same shear capacity as the horizontal casting when good vibration of the concrete was assured. The overhead casting with the drypacked layer, however, had a lower capacity and peak stress was reached at a higher slip level. After a displacement of around 0.2 in. the differences in shear transfer capacities were negligible.
The overhead casting position also had a distinct effect on the slip level at the maximum shear load. Generally, for the horizontally and vertically cast specimens the peak shear was achieved before a slip level of 0.03 in. was applied. The overhead cast specimens, however, reached peak shear after a slip level of 0.07 in. was reached.
These results show that the casting position had an effect on the maximum interface shear capacity and corresponding slip but not on the residual shear capacity.
69
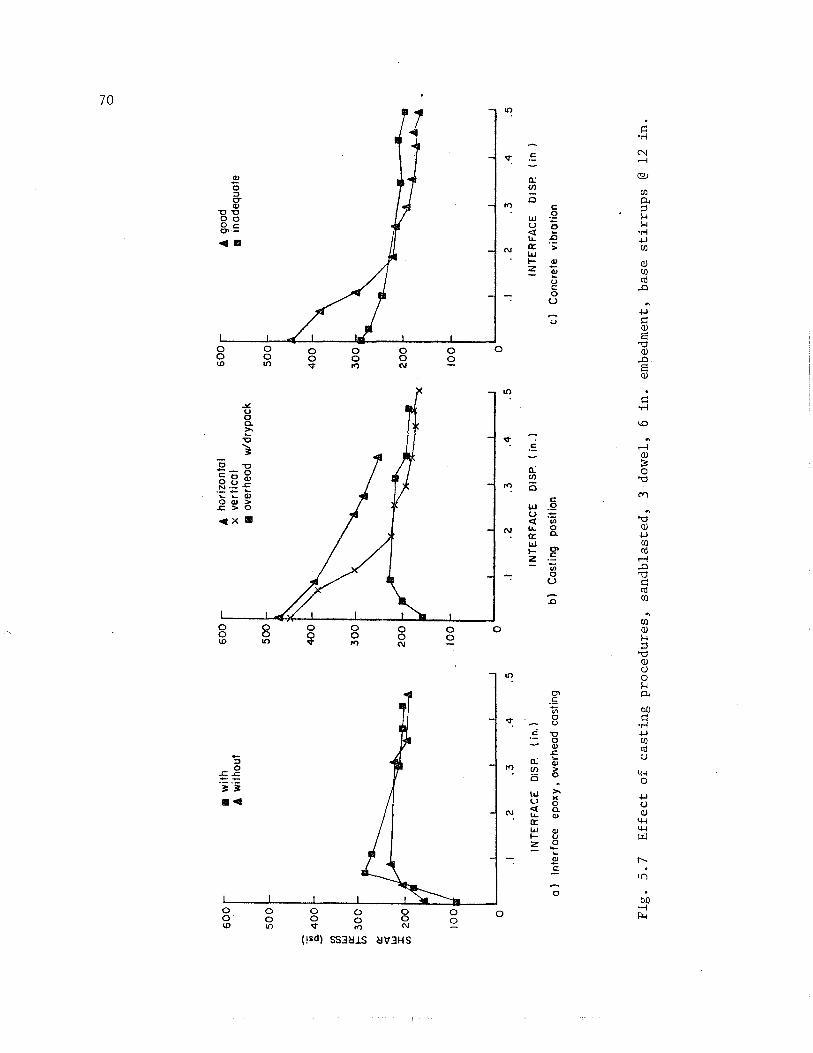
60
0r
II w
ith
6°T
A h
ori
zon
tal
60
0r
A go
od
A w
itho
ut
x ve
rtic
al
II
inad
equa
te
.. o
verh
ead
w/d
ryp
ack
50
0 I-
50
0
50
0
! 4
00
l-4
00
I-
"'-..':
'Il 4
00
12 w ~ 3
00
l-3
00
J-
" ....
........
3
00
cr
<X
W ~ 200
V ~
1!!
-8
20
0 t-
]I'
~"----
20
0
'i"
4
'oor
10
0
0 0
0 .1
.2
.3
.4
.5
.I .2
.3
.4
.5
.1
.2
.3
.4
INT
ER
FA
CE
D
ISP.
(
in.)
IN
TE
RF
AC
E
DIS
P.
(in
.)
INT
ER
FA
CE
D
ISP
. (i
n.)
a}
Inte
rfa
ce
ep
oxy
. ov
erhe
ad c
ostin
g b
) C
ostin
g po
sitio
n c)
C
oncr
ete
vib
rati
on
Fig
. 5
.7
Eff
ect
of
cast
ing
pro
ced
ure
s,
san
db
last
ed
, 3
do
wel
, 6
in.
embe
dmen
t,
bas
e st
irru
ps
@ 1
2 in
. .5 '-
I o
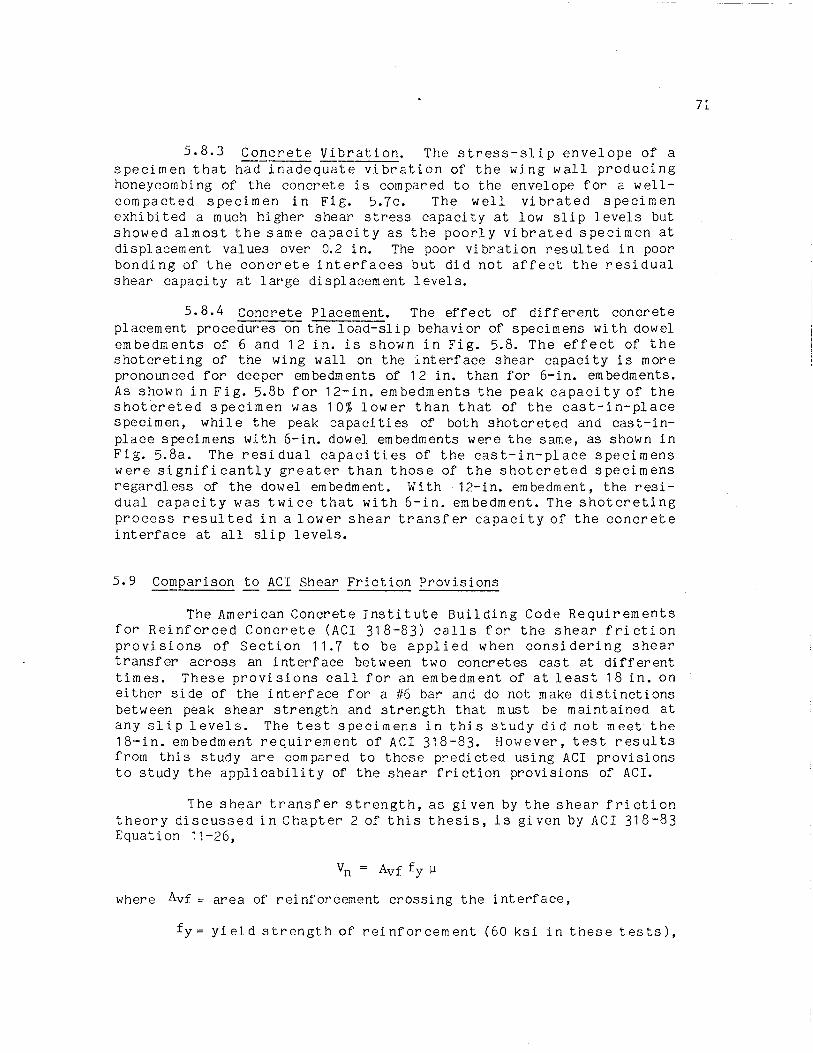
5.S.3 Concrete Vibration. The stress-slip envelope of a specimen that had inadequate vi bration of the wing wall producing honeycombing of the concrete is compared to the envelope for a wellcompacted specimen in Fig. 5.7c. The well vibrated specimen exhibited a much higher shear stress capacity at low slip levels but showed almost the same capacity as the poorly vibrated specimen at displacement values over 0.2 in. The poor vibration resulted in poor bonding of the concrete interfaces but did not affect the residual shear capacity at large displacement levels.
5.8.4 Concrete Placement. The effect of different concrete placement procedures on the load-slip behavior of specimens with dowel embedments of 6 and 12 in. is shown in Fig. 5.8. The effect of the shotcreting of the wing wall on the interface shear capacity is more pronounced for deeper embedments of 12 in. than for 6-in. em bedments. As shown in Fig. 5.8b for 12-in. embedments the peak capacity of the shotcreted specimen was 10% lower than that of the cast-in-place specimen, while the peak capaci ties of both shotcreted and cast-inplace specimens with 6-in. dowel embedments were the same, as shown in Fig.5.8a. The residual capacities of the cast-in-place specimens were significantly greater than those of the shotcreted specimens regardless of the dowel embedment. With 12-in. embedment, the residual capacity was twice that with 6-in. embedment. The shotcreting process resul ted in a lower shear transfer capaci ty of the concrete interface at all slip levels.
5.9 Comparison to ACI Shear Friction Provisions
The American Concrete Institute Building Code Requirements for Reinforced Concrete (ACI 318-83) calls for the shear friction provisions of Section 11.7 to be applied when considering shear transfer across an interface between two concretes cast at different times. These provisions call for an embedment of at least 18 in. on either side of the interface for a #6 bar and do not make distinctions between peak shear strength and strength that must be maintained at any slip levels. The test specimens in this study did not meet the 18-in. embedment requirement of ACI 318-83. However, test results from this study are compared to those predicted using ACI provlslons to study the applicability of the shear friction provisions of ACI.
The shear transfer strength, as given by the shear friction theory discussed in Chapter 2 of this thesis, is given by ACI 318-83 Equati on 11-26,
where Avf = area of reinforcement crossing the interface,
fy= yield strength of reinforcement (60 ksi in these tests),
71
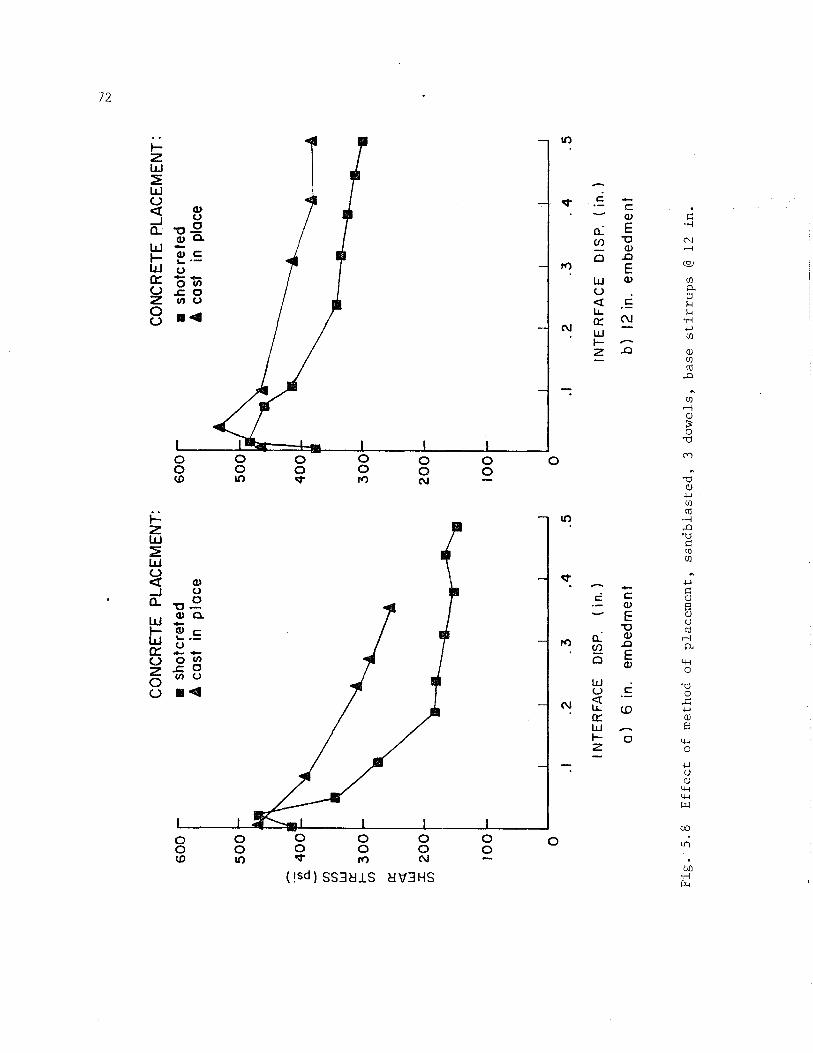
60
0
50
0
'(ii
400l
=-
\ '\A
0
-
(/)
(/)
W
0:: r-
30
0
(/)
0::
<l: w
~
20
0 t-
10
0
o .1
CO
NC
RE
TE
P
LAC
EM
EN
T:
• sh
otc
rete
d
• co
st
in
pla
ce
'\. .2
.3
.4
INT
ER
FA
CE
D
ISP
. (i
n. )
a)
6 in
. e
mb
ed
me
nt
.5
60
0
50
0
40
0
20
0
100 o
.1
CO
NC
RE
TE
PL
AC
EM
EN
T:
.. s
ho
tcre
ted
A
cos
t in
pl
ace
.2
.3
.4
INT
E R
FA
CE
D
ISP
. (i
n.)
b)
12 in
. e
mb
ed
me
nt
.5
Fig
. 5
.8
Eff
ect
of
met
ho
d
of
pla
cem
en
t,
san
db
last
ed
, 3
do
wel
s,
bas
e sti
rru
ps
@ 1
2 in
.
'-J
N
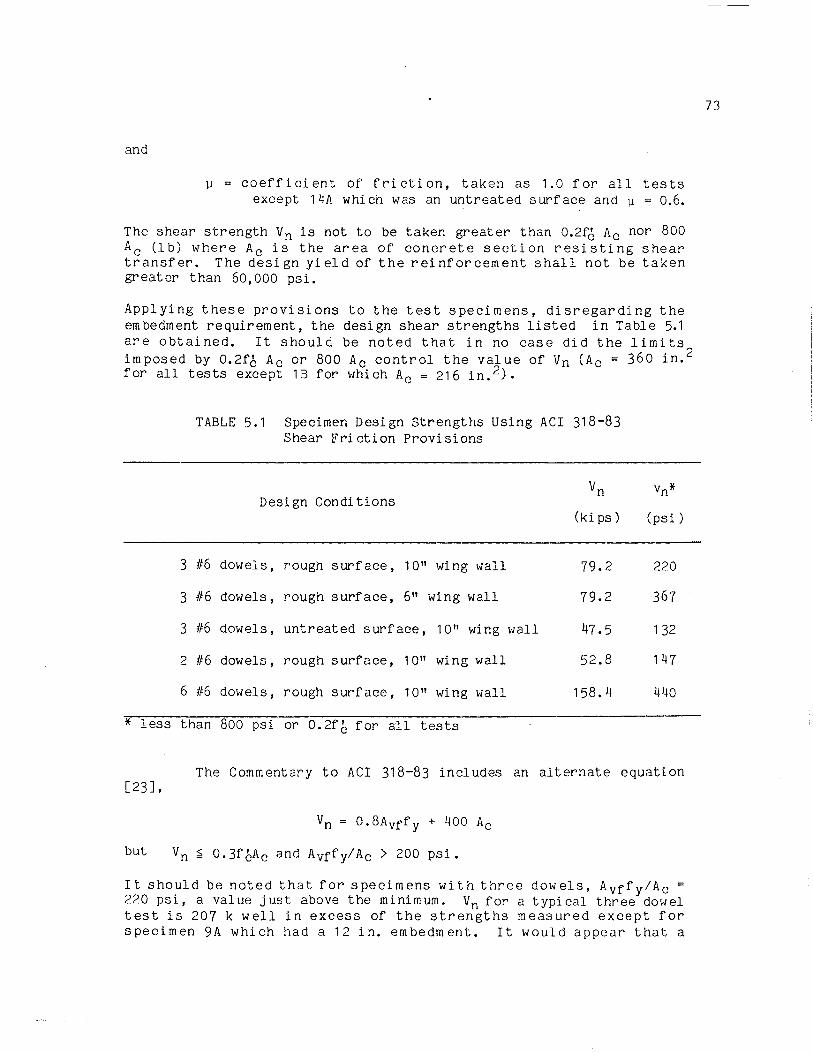
and
~ coefficient of friction, taken as 1.0 for all tests except 14A which was an untreated surface and ~ 0.6.
The shear strength V n is not to be taken greater than 0.2fc Ac nor 800 Ac (lb) where Ac is the area of concrete section resisting shear transfer. The design yield of the reinforcement shall not be taken greater than 60, 000 psi.
Applying these provisions to the test specimens, disregarding the em bedment requirement, the design shear strengths listed in Table 5.1 are obtained. It should be noted that in no case did the limits imposed by 0.2fc Ac or 800 Ac control the value of Vn (Ac = 360 in. 2
for all tests except lB for which Ac = 216 in. 2).
* less
TABLE 5.1 Specimen Design Strengths Using ACI 318-83 Shear Friction Provisions
Vn Design Conditions
(ki ps)
3 #6 dowels, rough surf ace, 10" wing wall 79.2
3 116 dowels, rough surface, 6" wing wall 79.2
3 116 dowels, untreated surface, 10" wing wall 47.5
2 #6 dowels, rough surface, 10" wing wall 52.8
6 #6 dowels, rough surface, 10" wing wall 158.4
than 800 psi or O. 2f c f or all tests
vn* (psi)
220
367
132
147
440
The Commentary to ACI 318-83 includes an alternate equation [23J.
Vn = 0.8Avff y + 400 Ac
but Vn ~ 0.3fcAc and AVffy/Ac > 200 pSi.
It should be noted that for specimens with three dowels, AVffy/Ac = 220 psi, a value just above the minimum. Vn for a typical three dowel test is 207 k well in excess of the strengths measured except for specimen 9A which had a 12 in. embedment. It would appear that a
73
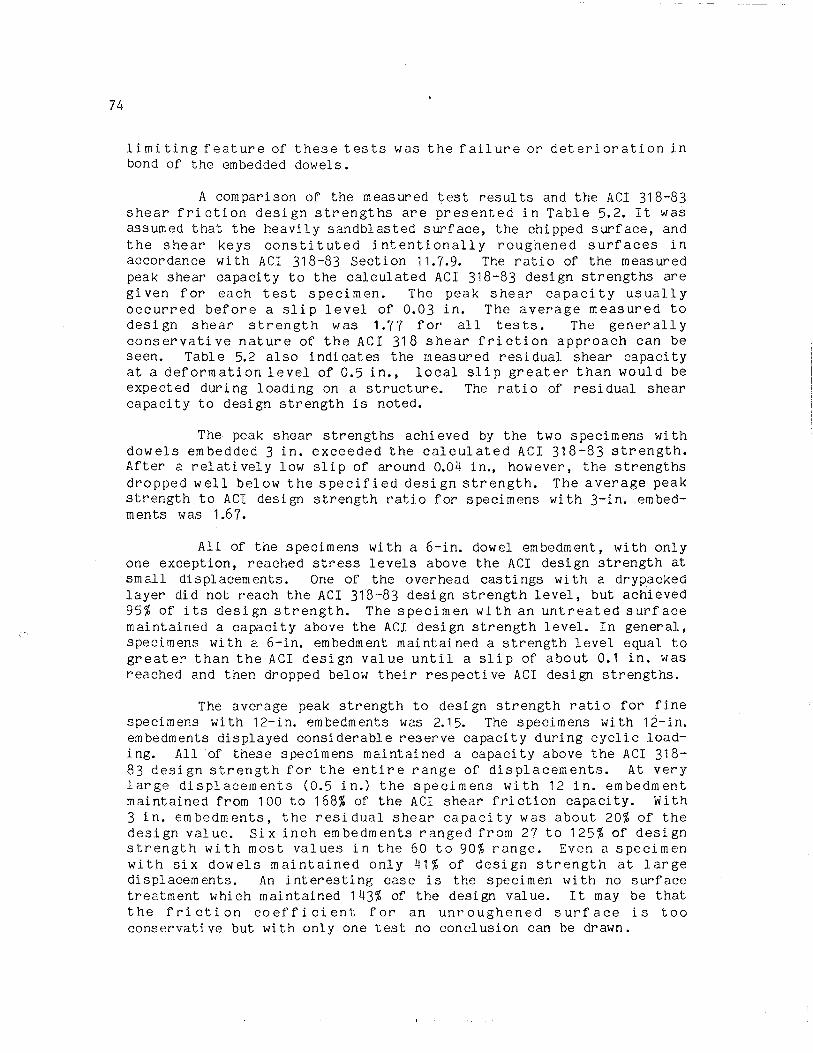
74
limiting feature of these tests was the failure or deterioration in bond of the embedded dowels.
A comparison of the measured test results and the ACI 318-83 shear fri ction desi gn strengths are presented in Table 5.2. It was assumed that the heavily sandblasted surface, the chipped surface, and the shear keys constituted intentionally roughened surfaces in accordance with ACI 318-83 Section 11.7.9. The ratio of the measured peak shear capacity to the calculated ACI 318-83 design strengths are gi ven for each test specimen. The peak shear capaci ty usuall y occurred before a slip level of 0.03 in. The average measured to design shear strength was 1.77 for all tests. The generally conservative nature of the ACI 318 shear friction approach can be seen. Table 5.2 also indicates the measured residual shear capacity at a deformation level of 0.5 in., local slip greater than would be expected during loading on a structure. The ratio of residual shear capacity to design strength is noted.
The peak shear strengths achieved by the two specimens wi th dowels embedded 3 in. exceeded the calculated ACI 318-83 strength. After a relatively low slip of around 0.04 in., however, the strengths dropped well below the specified design strength. The average peak strength to ACI design strength ratio for specimens with 3-in. embedments was 1.67.
All of the specimens with a 6-in. dowel embedment, with only one exception, reached stress levels above the ACI design strength at small displacements. One of the overhead castings wi th a drypacked layer did not reach the ACI 318-83 design strength level, but achieved 95% of its design strength. The specimen with an untreated surface maintained a capacity above the ACI design strength level. In general, specimens with a 6-in. embedment maintained a strength level equal to greater than the ACI design value until a slip of about 0.1 in. was reached and then dropped below their respective ACI design strengths.
The average peak strength to design strength ratio for fine specimens with 12-in. embedments was 2.15. The specimens with 12-in. em bedments displayed consi derabl e reserve capacity during cycli c loading. All of these specimens maintained a capacity above the ACI 318-83 design strength for the entire range of displacements. At very large displacements (0.5 in.) the specimens with 12 in. embedment maintained from 100 to 168% of the ACI shear friction capacity. With 3 in. embedments, the residual shear capaci ty was about 20% of the desi gn val ue. Si x inch em bedments ranged from 27 to 125% of desi gn strength with most values in the 60 to 90% range. Even a specimen with six dowels maintained only 41% of design strength at large displacements. An interesting case is the specimen wi th no surface treatment which maintained 143% of the design value. It may be that the friction coefficient for an unroughened surface is too conservative but with only one test no conclusion can be drawn.
75
TABLE 5.2 Comparison of Measured and Computed Shear Capacity
Emb., No. of f'* c •
Vn,k Vn.k V n meas. Vn,res Vn,res Specimen in. Dowels ksi meas. ACI Vn ACI meas., k VACI
1A 6 3 3.10B 145 79.2 1.83 2A 6 3 3.10B 153 79.2 1. 93 3A 6 3 3.10B 152 79.2 1. 92 4A 6 3 3.10B 165 79.2 2.08 5A 6 3 3.10B 150 79.2 1.89
6A 6 3 3.10B 165 79.2 2.08 81 1.02 7A 6 2 3.108 132 52.8 2.50 27 0.51 8A 6 6 3.10B 210 158.4 1. 33 41 0.26 9A 12 3 3.10B 190 79.2 2.40 133 1.68
lOA 3 3 3.10B 130 79.2 1.64 20 0.25
11 A 6 3 2.70B 104 79.2 1. 31 70 0.88 12A 6 3 2.75B 118 79.2 1. 49 54 0.68 13A 6 3 2.758 128 79.2 1.62 32 0.40 14A+ 6 3 2.75B 90 47.5 1.89 68 1. 43 15A** 6 3 2.758 88 79.2 1. 11 65 0.82
16A** 6 3 2.75B 105 79.2 1. 33 65 0.82 17A 6 3 2.70B 125 79.2 1.58 68 0.86 18A 6 3 2.75B 118 79.2 1. 49 67 0.85 19A 6 3 2.758 127 79.2 1.60 63 0.80 20A 6 3 2.878 134 79.2 1.69 99 1.25
21A 6 3 3.70W 115 79.2 1.45 97 1.22 22A 6 3 3.95W 148 79.2 1.87 81 1.02 23A 3 3 3.95W 135 79.2 1.20 20 0.25 24A 6 3 3.95W 160 79.2 2.02 63 0.80
18 6 3 3.218 102 79.2 1.29 75 0.95 2B 6 3 3.218 150 79.2 1.90 61 0.77 3B 6 3 3.218 162 79.2 2.05 58 0.73 48 12 2 3.218 137 52.8 2.59 79 1.50 5B 6 3 3.218 166 79.2 2.10 52 0.66
68 12 3 3.21B 172 79.2 2.17 103 1.30 17B 12 3 2.87B 151 79.2 1.90 103 1.30 208** 6 3 2.70B 75 79.2 0.95 59 0.74 21B 12 3 3.57W 132 79.2 1.67 79 1.00
Avg .. 1.77 o '" 0.38
* Base (B) or Wall (W) concrete strength, whichever is lower. ** Overhead casting with drypacked layer + Untreated surface
76
These comparisons suggest that when the design strengths as calculated by the ACI shear friction provisions are used, the ACI 318-83 requirement for development length may be conservative if the designer is concerned only about the peak capacity at low slip levels. For a 116 bar, the development length at yield is about 18 in. As shown in this study, a 3-in. embedment with a conventionally cast wing wall reached a strength in excess of the ACI design strength. The ACI embedment requirement may still be conservative if the residual capacity at larger slip levels is considered. All specimens with 12-in. dowel embedment exceeded the ACI design strength even at a slip level of 0.5 in.
C HAP T E R 6
CONCLUSIONS AND RECOMMENDATIONS
6.1 Summary
Based on the test results and discussions and the observations of the overall load-slip behaviors of the test specimens, the following can be summarized about reinforced concrete interfaces subjected to cyclic loading. Bond along the interface and mechanical interlock along the interface provides the major portion of the shear transfer strength until a slip level of around 0.2 in. is reached. For larger di splacements, dowel action and the residual frictional forces created by the clamping action of the dowel provide the major components of the shear transfer strength of the interface.
6.2 Conclusions
Based on the test results obtained in this program, the following conclusions are drawn:
1. An increase in the amount or embedment depth of the interface reinforcement resulted in an increase in the shear transfer capacity of a concrete interface;
2. A deeper embedment provided better development of the reinforcement and subsequently higher shear capacities at large slip levels;
3. Generally, an increase in the amount of' reinforcement crossing the interface resulted in higher shear capacities at large slip levels;
4. For deep surface preparation techniques, such as chipping to 1/4 in. amplitudes and 1-in. deep shear keys, higher base block conc re te strength r esu It ed in hi gher in ter face shear capaci ty. For sandblasted interfaces (shallower roughness), base block concrete strength had no significant effect on the interface shear capacity;
5. For similar specimens, a heavily sandblasted interface resulted in equal or higher interface shear capacities than any other surface preparation technique studied. For slip values in excesS of 0.2 in., the interface surface preparation had no significant effect on the residual interface shear capacity;
77
78
6. Reinforcement detailing in the wing wall and base block did not have a significant effect on the interface shear capaci ty;
7. Horizontal and vertical casting positions produced specimens which showed no significant difference in the peak or residual shear capacities as long as the concrete was cast directly against the interface and the concrete was well consolidated;
8. Overhead casting positions in which a drypack mortar was used res ul ted ina si gnif i cant reduction in the peak 'i nterf ace shear capacity and an increase in the slip at which it occurred, when compared to that of specimens cast against the interface. However, the effect of using a drypack was negligible on the residual interface shear capacity;
9. Shotcreting resulted in slightly lower interface shear capaci ti es than cast-in-place procedures;
10. The desi gn strength equation and the dowel embedment requirements of the ACI 318-83 shear fri ction provi sions were very conservative when applied to these tests.
6.3 Design Implications
Based on the preceeding discussions and conclusion, the following design implications have been drawn:
1. The strength of the concrete used in repair or strengthening of an existing structure should be at least equal to that of the concrete in the existing structure;
2. The reinforcement detailing of the strengthening element should be designed to provide good restraint against splitting in the concrete surrounding the interface reinforcement. The interface reinforcement should be well anchored in the existing element;
3. If the ACI 318-83 shear friction design strengths are used, the embedment of the interface reinforcement into the existing structure can be less than required to develop yield in a straight bar. In the specimens tested, embedments 1/3 to 1/6 of the required development length produced interface shear strengths in excess of the ACI design values.
6.4 Further Research Needs
The following recommendations for further research into the investigation of the shear transfer capaci ties of concrete interfaces are present ed:
1. Effect of dowel embedment length wi th respect to compressi ve concrete strength incl uding an examination of ACI recommended development length into the existing and strengthening elements;
2. Effect of the difference in concrete strengths between the struct ural el ements;
3. Effect of staggering the interface reinforcement along the center line of the strengthening el ement and of the distance between the edge of the existing concrete element and the interface reinforcement;
4. Effect of the use of a surface bonding agent on the concrete interface before conventional casting procedures.
79
REF ERE N C E S
1. American Concrete Institute, "Building Code Requirements for Reinforced Concrete, ACI 318-83," Detroit, Michigan, 1983.
2. American Concrete Institute, "Commentary on Building Code Requirements for Reinforced Concrete (ACI 318-83)," Detroit, Michigan
3. Anderson, A. R., "Composite Designs in Precast and Casti-in-Place Concrete," Progressive Architecture, V. 41, No.9, September 1960, pp.172-179.
4. Funk. R. R., "Shear Friction Transfer Mechanisms for Supports Attached to Concrete," Anchorage to Concrete Symposium, ACI Convention, Pheonix, Arizona, March 1984.
5. Gaston, J. R., and Kriz, L. B., "Connections in Precast Concrete Structures--Scarf Joints," Journal of the Prestressed Concrete Institute, V. 9, No.3, June 1964, pp:-37-59.
6. Hanson, N., "Precast-Prestressed Concrete Bridges. 2. Horizontal Shear Connections," Journal of the PCA Research and Development La b 0 rat 0 ri e s, V. 2, No.2, 1 9 6 0, p p • 3 8 ... 5 8.
7. Liu, T. C., and Holland, T. C., "Design of Dowels for Anchoring Replacement Concrete to Vertical Lock Walls," Technical Report SL-81-1, U.S. Army Engineer Waterways Experiment Station, Vicksburg, Mississippi, March 1981.
8. Luke, P., "Strength and Behavior of Rebar Dowels Epoxy Bonded in Hardened Concrete," Master's thesis, The University of Texas at Austin, May 1984.
9. Mast, R. F., "Auxiliary Reinforcement in Concrete Connections," Proceedings, ASCE, V. 94, ST6, June 1968, pp. 1485-1504.
10. Mattock, A. H., Hofbeck, J. F., and Ibrahim, I. 0., "Shear Transfer in Reinforced Concrete," ACI Journal,' Proceedings, V. 66, No.2, February 1969, pp. 119-128.-
11. Nilson, A. H., "Bond Stress-Slip Relations in Reinforced Concrete," Report No. 345, Cornell University, December 1971.
12. Park, R., and Paulay, T., "Reinforced Concrete Structures," Wiley & Sons, New York, 1975, pp. 319-329.
13. Paulay, T., Park, R., and Phillips, M. H., "Horizontal Construction Joints in Cast-in-Place Reinforced Concrete," Shear in Reinforced Concrete, Vol. 2, Special Publication SP-42, American Concrete Institute, Detroit, Michigan.
80-81
82
14. Sugano, S., "An Overview of the State-of-the Art in Seismic Strengthening of Existing Reinforced Concrete Buildings in Japan," Takenaka Technical Research B.eport, No. 25, April 1981.
15. Sugano, S., "G uideline for Seismic Retrofitting (Strengthening, Toughening, and/or Stiffening) Design of Existing Reinforced Concrete Buildings," Ministry of Construction, Japan, March 1977 (translated in English, 1980).
16. Sugano, S., and Fujimura, M., "Aseismic Strengthening of Existing Reinforced Concrete Buildings," 7WCEE, Istanbul, Turkey, 1980.
17. Townsend, W. H., Lee, D. L. N., and Hanson, R. D., "Inelastic Tests of Repaired Concrete Connections," ASCE National Structural Engineering Meeting, San Francisco, California, April 1973.
18. White, R. N., and G ergley, P., "Shear Transfer in Thick Walled Reinforced Concrete Structures under Seismic Loading," Report No. 75-10, Cornell University, December 1975.
19. Wyllie, L. A., Jr., "Strengthening Existing Concrete and Masonry Buildings for Seismic Resistance," 2nd Joint Meeting U.S.-Japan Program on Repair and Retrofit of Buildings and Lifelines, Tsukuba, Japan, May 1981.
20. Wyllie, L. A., Jr., and Dean, R. G., "Seismic Failures and Subsequent Performance after Repair," ASCE National Structural Engineering Convention, New Orleans, Louisiana, April 1975.
21. Luke, P. C. C., Chon, C., and Jirsa, J. 0., "Use of Epoxies for Grouting Reinforcing Bar Dowels in Concrete," PMFSEL Report No. 85-3, University of Texas at Austin, Sept. 1985.
22. Bass, R. A., "An Evaluation of the Interface Shear Capacity of Techniques U sed in Repair and Strengthening Reinforced Concrete Structures," M.S. Thesis, University of Texas at Austin, August 1984.
23. Mattock, A. H., "Shear Transfer in Concrete Having Reinforcement at an A ngle to the Shear Plane," Shear in Reinforced Concrete, SP-42, American Concrete Institute, Detroit, 1974.