Embed Size (px)
Citation preview

Department ofVeterans Affairs
Journal of Rehabilitation Research andDevelopment Vol . 34 No. 1, January 1997Pages 19–43
Interface pressures and shear stresses at thirteen socket sites ontwo persons with transtibial amputation
Joan E. Sanders, PhD; Dickson Lam; Alan J . Dralle, CP ; Ramona Okumura, CPCenter for Bioengineering and Department of Rehabilitation Medicine, University of Washington, Seattle, WA 98195
Abstract—Residual limb/prosthetic socket interface pressuresand shear stresses were measured at 13 sites on two subjectswith unilateral transtibial amputation (TTA) using total-contactpatellar-tendon-bearing prostheses . Maximal interface stressesduring stance phase for each of 13 transducer sites were deter-mined, then means for all steps calculated . Maximal pressureand resultant shear stress during stance phase were shown atanterior distal or mid-limb sites and the maxima occurred dur-ing the first 50% of stance phase . Anterior medial and lateralproximal sites showed their greatest pressure during the second50%. At lateral mid-limb and popliteal fossa sites, resultantshear stress directions suggest that soft tissue was displacedtoward the socket brim during weight-bearing . Results alsosuggest that skin across the distal tibial crest was in tension atthe times of the first and second peaks in the shank axial force-time curve in all sessions . Significant differences (p<0 .05) inmaximal stresses between sessions conducted >3 weeks apartwere apparent for both subjects.
Key words : interface mechanics, interface pressures, inter-face stress, lower-limb prosthetics, shear stress, transtibialamputation.
INTRODUCTION
Interface stresses are an important consideration infitting a prosthetic limb to a person with lower-limbamputation . Because soft tissues of the thigh and lowerleg are not accustomed to bearing the interface pressures
This material is based upon work supported by the National Institute ofChild and Human Development.Address all correspondence and requests for reprints to: Joan E . Sanders, PhD,Assistant Professor, Center for Bioengineering, Box 357962, University ofWashington, Seattle, WA 98195 ; email: [email protected] .washington.edu .
and shear stresses induced by a prosthesis, the tissues aresusceptible to pain, discomfort, and breakdown . Once tis-sue breakdown occurs, typically a period of reduced activ-ity is required . In severe cases, no prosthesis use is possi-ble, and surgical repair or modification of the residuallimb is necessary. To avoid breakdown, prostheses must bedesigned so that sensitive tissue regions receive lowerabsolute magnitude stresses ; more tolerant regions canreceive higher stresses . An important aspect of fitting is todesign a prosthesis that induces an interface pressure andshear stress distribution acceptable for tissue tolerance.
Several studies investigating interface stress distribu-tions on persons with lower limb amputation during walk-ing are described in the literature (1-15) . The identificationof patterns in the pressures and shear stresses that occur hasbeen of particular interest . For example, Appoldt searchedfor ranges of interface "tangential pressures" (a term all-inclusive for stresses tangent to the interface, whether ornot slip occurred) deemed significant to the comfort andemployment of above-knee suction sockets on personswith transfemoral amputation (3) . The utility of those datais to further understand the magnitudes of stresses residuallimb soft tissues must tolerate, identify trends in interfaceloading applicable to prosthetic design in a general sense,and provide a base for comparison with stresses producedby prosthesis modifications . Interface stress data are alsoused for evaluation of residual limb/socket finite element(FE) models (16-19), computer-based analysis tools thatcalculate interface stresses based on residual limb andprosthesis geometries and material properties as well as theloading conditions specified at the model boundaries (e .g .,ground reaction forces on the prosthesis during weight-bearing) . FE models have been used principally for inter-
19
20
Journal of Rehabilitation Research and Development Vol . 34 No . 1 1997
face stress sensitivity analysis to residual limb and pros-thesis characteristics (17,19—23).
The purpose of this research was to expand uponprevious interface stress studies to measure interfacepressures and shear stresses at more sites, 13, than previ-ously reported on subjects with transtibial amputation(TTA) walking with total contact patellar-tendon-bearing(PTB) prostheses . Consistency of the results with find-
s reported in the literature was evaluated, and newissues concerning interface stress mechanics wereaddressed . Five features were investigated for stancephase on the prosthetic limb for all steps in each session:
1. Interface stress magnitudes for each transducer site:(i) maximal stance phase pressure for the site, (ii)maximal stance phase resultant shear stress (RS) andthe corresponding resultant shear angle (RSang) forthe site, (iii) pressure and RS at the time of the firstpeak in the shank axial force-time curve (1st pk), and(iv) pressure and RS at the time of the second peakin the shank axial force-time curve (2nd pk);
2. Timings of the stance phase pressure and RS maxi-ma for each site;
3. RSang for each site during the time interval betweenthe 1st pk and 2nd pk (approximately mid-stancephase) ;
4. Waveform shape similarities and differences amongdifferent sites;
5. Temporal (session-to-session) changes in pressureand RS maxima at each site.
Throughout this article, a consistent reference frameis used for discussion of interface stress directions.Stresses applied to the transducers are presented asopposed to stresses applied to the residual limb . In thisstudy, transducers were mounted in the socket wall.When there is no slip at the residual limb/prosthetic sock-et interface, stresses applied to the transducers (socket)are equal in magnitude but opposite in direction to thoseapplied to the residual limb. When there is slip at theinterface, transducers measure the frictional stressbetween the residual limb and prosthetic socket.
METHODS
SubjectsTwo male subjects, TW and WP, with unilateral TTA
participated in this research . Both had amputations atleast 2 years prior to the study, having suffered traumaticinjuries (motor vehicle accidents) and had been receivingprosthetic care from the University of Washington
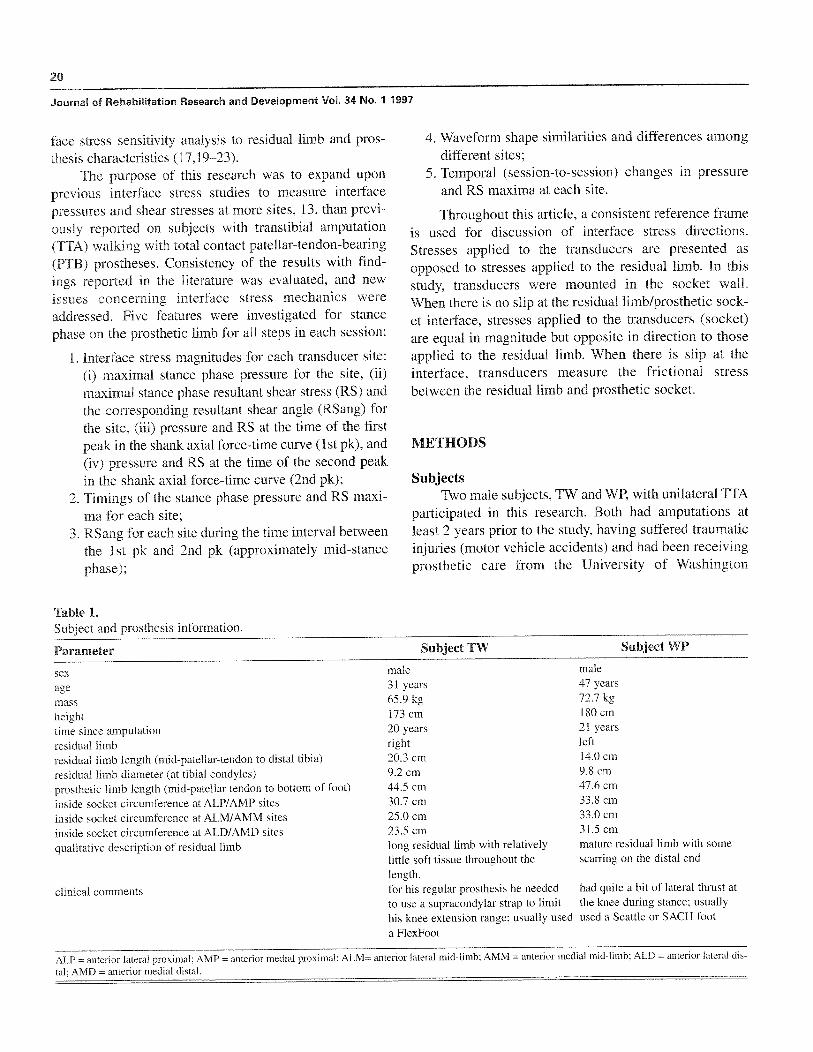
Table 1.Subject and prosthesis information.
Parameter
Subject TW
Subject WP
sexagemassheighttime since amputationresidual limbresidual limb length (mid-patellar-tendon to distal tibia)residual limb diameter (at tibial condyles)prosthetic limb length (mid-patellar tendon to bottom of foot)inside socket circumference at ALP/AMP sitesinside socket circumference at ALM/AMM sitesinside socket circumference at ALD/AMD sitesqualitative description of residual limb
clinical comments
male31 years65 .9 kg173 cm20 yearsright20.3 cm9 .2 cm44 .5 cm30 .7 cm25 .0 cm23 .5 cmlong residual limb with relativelylittle soft tissue throughout thelength.for his regular prosthesis he neededto use a supracondylar strap to limithis knee extension range ; usually useda FlexFoot
male47 years72.7 kg180 cm21 yearsleft14.0 cm9 .8 cm47.6 cm33 .8 cm33 .0 cm31 .5 cmmature residual limb with somescarring on the distal end
had quite a bit of lateral thrust atthe knee during stance ; usuallyused a Seattle or SACH foot
ALP = anterior lateral proximal ; AMP = anterior medial proxtali AMD = anterior medial distal .
al ; ALM= anterior lateral mid-limb ; AMM = anterior medial mid-limb ; ALD = anterior lateral dis-

21
SANDERS et al . Interface Pressures and Shear Stresses
Department of Rehabilitation Medicine for at least 2years .
The residual limbs of the two subjects had stronglycontrasting biomechanical features (Table 1) . TW had alonger residual limb than WP and much less soft tissuethrough the length. In addition, componentry of the nor-mal prostheses of the subjects were different : TW usual-ly wore a suprapatellar strap and used a FlexFoot TM ,while WP did not wear a strap and usually used aSeattleTM or SACH foot.
Instrumented ProsthesisProsthetic sockets used in the research were
designed and fabricated by a certified prosthetist (forWP) and by a student prosthetist under the supervisionof a certified prosthetist (for TW) . The sockets weremade and fit to the subjects approximately 10 monthsbefore the data reported here were collected for WP and4 months before for TW. The sockets were of PTBdesign and were standard PTB laminated polyesterapproximately 4 mm thick, designed and manufacturedusing traditional (as opposed to computer-aided) tech-niques . They were total contact sockets of laminatedacrylic resin using perlon and a nylon stockinet undervacuum and made from a plaster negative, hand modi-fied, and test-socket fitted . Static and dynamic align-ment were conducted using standard clinical techniques(24) until the fit was deemed acceptable by the subjectsand certified prosthetists . (Note that dynamic alignmentwas repeated after the prosthesis was instrumented .) Thetest prostheses were not used regularly by the subjects.
Sockets were instrumented with mounts bonded tothe outside to hold interface stress transducers (Figure 1).Interface stress transducers and signal conditioning cir-cuitry have been described in detail elsewhere (25,26).For the 13 transducer/signal conditioning units used inthis study, transducer RMS measurement errors (nonlin-earity determined from calibration test data) averaged3.90 ± 1.57 percent of the full-scale output (FSO) for thenormal direction (pressure) and 0 .22 -!- 0 .29 percent FSOfor the shear directions (horizontal and vertical shearstress) . Reference marks on the transducers, made duringcalibration testing, identified the stress directions . In thisarticle, the term "pressure" is used rather than "normalstress" to describe the force/surface area measurement inthe direction normal to the transducer surface . As in pre-vious investigations (12,15), it is assumed stresses areuniformly distributed over the sensor surface .
Poiycarbont mounts (mass 4,7 g each, internallythreaded with - 2
s per in-12.6 per - r) were posi-tioned in 12.7
diameter holes tt
le socketwall, affixed to the socket using epoxy (L '-460, Scotch-Weld, 3M, St . Paul, MN), a] 1 < re ' using a custom toolthat set their central axes peipt icuiar to the inner sur-face . Care was taken to position .2ounts only at relative-ly flat sites on the socket to minimize modification to theoriginal socket shape . Where the hole on the socket sur-face was not in one plane, epoxy was used on the insidesocket surface to smooth the edge between the mount andthe surrounding interface (Figure 1) . Thus, the insidesocket surface remained free of sharp edges . The epoxylayer was thicker at posterior sites than at anterior or lat-eral sites, though it was typically less than 1 mm.
(a)
(b)
Figure I.a. Side view of a transducer in a mount . The transducer was positionedflush with the interface. b . A transducer and mount viewed from insidethe socket. Epoxy was used to smooth the mount edge with the sur-rounding surface .
22
Journal of Rehabilitation Research and Development Vol . 34 No . 1 1997
Transducers were positioned in the mounts withtheir surfaces flush with the inner mount face, usinganother custom tool that covered the face of the mountinside the socket . A transducer was advanced into themount until it contacted the tool, a technique that result-ed in a repeatable transducer position within 10° of trans-ducer rotation in the mount. At the thread pitch used (12 .6threads per cm), the 10° error corresponded to 0.02 mmof axial translation, far less than the 1 .6 mm of transduc-er protrusion evaluated by Appoldt (27), shown to have aneffect on interface stress measurements . For each subject,the same transducers were used at the same sites at thesame axial positions in different sessions.
All sites were carefully checked to ensure that the6.35 mm diameter transducer did not contact the 7 .60 mmhole in the mount during full-scale shear loading . So thattransducer principal shear directions with respect to theshank axis could later be identified, reference marks weremade on the top outer edge of each mount. The prosthe-sis was mounted in a dividing head on a milling machineand a scribe tool placed in the collet to make the referencemarks, to ensure that marks were at the most proximallocation for each mount . The angles of the transducerprincipal shear axes with respect to the mount wererecorded using an angle scale between reference markson the transducers and those on the mounts.Measurements of the transducer principal shear direc-tions were accurate to within 2° of transducer rotation,which corresponded to 0 .004 mm of axial translation ofthe transducer in the mount. These measurements wereused to transform the shear stress data into referencedcoordinate systems . "Vertical shear stress" was in theplane of the interface in a direction longitudinal withrespect to the socket axis . "Horizontal shear stress" wasin the plane of the interface in a direction transverse to thesocket axis . A neoprene sleeve was used for suspensionby both subjects.
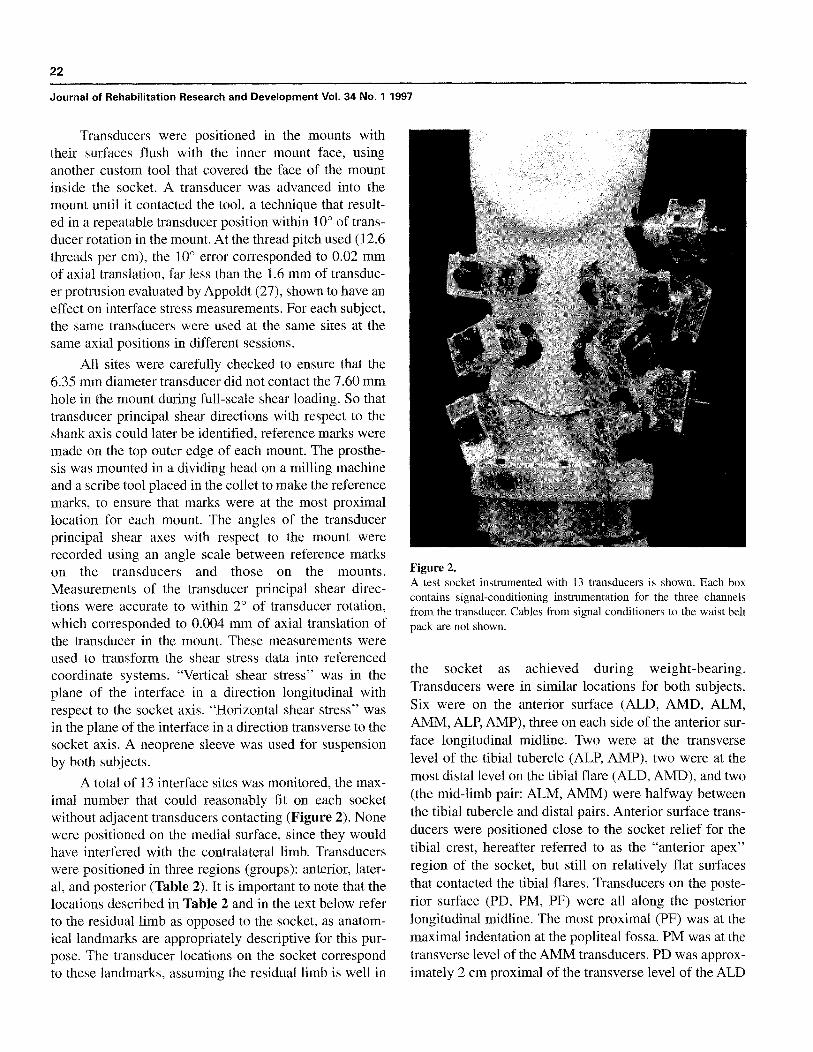
A total of 13 interface sites was monitored, the max-imal number that could reasonably fit on each socketwithout adjacent transducers contacting (Figure 2) . Nonewere positioned on the medial surface, since they wouldhave interfered with the contralateral limb . Transducerswere positioned in three regions (groups) : anterior, later-al, and posterior (Table 2). It is important to note that thelocations described in Table 2 and in the text below referto the residual limb as opposed to the socket, as anatom-ical landmarks are appropriately descriptive for this pur-pose. The transducer locations on the socket correspondto these landmarks, assuming the residual limb is well in
Figure 2.A test socket instrumented with 13 transducers is shown . Each boxcontains signal-conditioning instrumentation for the three channelsfrom the transducer. Cables from signal conditioners to the waist beltpack are not shown.
the socket as achieved during weight-bearing.Transducers were in similar locations for both subjects.Six were on the anterior surface (ALD, AMD, ALM,AMM, ALP, AMP), three on each side of the anterior sur-face longitudinal midline . Two were at the transverselevel of the tibial tubercle (ALP, AMP), two were at themost distal level on the tibial flare (ALD, AMD), and two(the mid-limb pair: ALM, AMM) were halfway betweenthe tibial tubercle and distal pairs . Anterior surface trans-ducers were positioned close to the socket relief for thetibial crest, hereafter referred to as the "anterior apex"region of the socket, but still on relatively flat surfacesthat contacted the tibial flares . Transducers on the poste-rior surface (PD, PM, PF) were all along the posteriorlongitudinal midline . The most proximal (PF) was at themaximal indentation at the popliteal fossa . PM was at thetransverse level of the AMM transducers . PD was approx-imately 2 cm proximal of the transverse level of the ALD

23
SANDERS et al . Interface Pressures and Shear Stresses
Table 2.Transducer locations.
GroupSite
Abbreviation
Site Name Transducer Location
distal residual limb, anterior tibial border,lateral sidedistal residual limb, anterior tibial border,medial sidemid, anterior tibial border, lateral sidemid, anterior tibial border, medial sideat the level of the tibial tubercle, lateral sideat the level of the tibial tubercle, medial side
lateral distal residual limbmidway between the lateral distal fibulaand distal calf (on the border between thelateral and posterior groups)fibular necklateral femoral epicondyle
distal calf, on the posterior longitudinalmidlinemid-calf, on the posterior longitudinal mid-linecenter of the popliteal fossa, on the posteri-or longitudinal midline
Anterior Group
ALD
anterior lateral distal
AMD
anterior medial distal
ALM
anterior lateral mid-limbAMM
anterior medial mid-limbALP
anterior lateral proximalAMP
anterior medial proximal
LD
lateral distalLPD
lateral-posterior distal
LM
lateral mid-limbLP
lateral proximal
PD
posterior distal
PM
posterior mid-limb
PF
popliteal fossa
Lateral Group
Posterior Group
and AMD transducers . It was positioned here because inpreliminary studies it was found that subjects typicallydid not bear load on the posterior surface at the transverselevel of the anterior distal (AD) transducers . For the lat-eral group (LD, LPD, LM, LP), LP was in the region ofthe lateral femoral condyle, on a line between the anteri-or proximal (AP) and PF transducers and on a socketmidline through the sagittal plane. LD was at the level ofa transverse plane halfway between the PD and PM sites,also on a socket midline through the sagittal plane . TheLPD site was at the border between the lateral and poste-rior groups, at the level of a transverse plane between theLD and PM sites . It was not on a socket midline in thesagittal plane but instead on the socket surface halfwaybetween the sagittal plane socket midline and the posteri-or midline. The LM transducer was in the fibular neckregion but was positioned at different sites for the twosubjects, 2 .0 cm distal to the fibular head on TW and 2.5cm posterior of the fibula at the transverse level of thefibular head on WP to avoid contact between adjacenttransducers . It should be noted that holes were made inthe neoprene sleeves to allow several transducers to bepositioned more proximally than described in previous
reports from our laboratory on other subjects (12,15).In data collection sessions, each subject wore a 5-ply
wool sock but no liner between the socket and the resid-ual limb. Thus, the transducers measured socket-sockinterface stresses, not stresses directly on the skin surface.Previously, Pelite TM was mounted on the end of eachtransducer and Pelite liners, but no socks, were worn bysubjects (12,15) . The basis for changing to the new con-figuration was a clinical concern . Donning a prosthesiswithout a sock but with a liner bonded to its inside sur-face was uncomfortable for the subjects and deemed anunacceptable tissue health risk here.
The prosthetic shank was also instrumented. Forcesand moments in the shank were measured using 20 strain-gages mounted on an aluminum pylon, and the data usedto identify heel contact and toe-off as well as timings of1st and 2nd pks . The instrumented shank was a slightmodification of that described previously (28) . Custom-designed tight-fit aluminum inserts epoxied in the ends ofthe pylon (necessary to ensure uniform hoop stress) weremore lightweight, and a ProteorTM alignment jig (Dun-Fillauer, Chattanooga, TN) was used to attach the shankto the prosthesis . A Seattle LightFootTM (size and stiff-

24
Journal of Rehabilitation Research and Development Vol . 34 No . 1 1997
ness established by the prosthetist and subject) was con-nected to the shank.
From the instrumented socket and shank, cables ranto a belt pack for multiplexing the 45 channels of data (39channels from the transducers, 6 from the shank) onto 3channels . A 58 m shielded cable carried the data from thebelt pack to an A/D board and computer for acquisitionand storage (NP-MIO-16, National Instruments, Austin,TX; 650 Centris, Apple Computer, Cupertino, CA) . Datawere collected at a 175 Hz sampling rate, a rate deter-mined appropriate from data analysis in previous investi-gations if high-frequency events in interface stress-timecurves are of interest (15) . The mass of the instrumentedprosthesis was 2 .32 kg, 0 .41 kg of which was the trans-ducers and 0 .36 kg of which was the pylon with insertconnectors . The mass of the belt pack was 1 .46 kg.
The instrumented prostheses were aligned using stan-dard clinical static and dynamic fitting techniques (24).After the "neutral" alignment was set by the prosthetists, atleast one preliminary session was conducted to allow thesubject to become accustomed to the instrumentation, tomake minor adjustments that the prosthetists deemed nec-essary, and to evaluate performance of the instrumentation.Da_ . i-om preliminary sessions are not included in therest Its . WP had three preliminary sessions during the 3-month period before the start of the study, and TW had one,approximately 1 month before the start of the study.
During their three or more trials, subjects walked upand down a 68 X 2 .1 m hallway at a self-selected speed.The data acquisition system was in a recess midwaydown the hall, thus the cable ' r= 7 - as not restrictive.Data were collected for 20 s in e :'a trial, during which
e the subject, starting from a standstill, walked thelength of the hallway between three-quarters to one andone-half times.
Post-processing was conducted to transform the datainto a socket-referenced coordinate system (as shown inFigure 3 and described below) . Steps were then seg-mented into stance and swing phase, based on a thresholdslope in the shank pylon axial force-time waveform . As inprevious studies (12), the threshold was 0 .63 N/msec forheel-contact and -0 .63 N/msec for toe-off . Steps at amuch slower speed than those of the rest of the trial (e .g .,while the subject turned around at the end of the hallway)were not included . Only the stance phase of gait was ana-lyzed further . The following information was determinedfor each step : maximal magnitudes of interface pressureand RS (and the corresponding RSang) at each transduc-er site and the percentage of stance phase that they
Figure 3.The coordinate system convention used throughout for shear stress.Shear stresses applied to the socket (as shown here) are positive insign . Shear stresses are in the plane of the interface with the RSangdefined counter-clockwise relative to the horizontal shear positiveaxis . An anterior lateral mid-limb site is shown.
occurred; interface pressures, RS, and RSang for all sitesat the times of the 1st pk and 2nd pk in the shank axialforce-time curves . T -tests at a level 0 .05 (p-value) testwere used to compare differences between sites and ses-sions discussed below . In addition, a custom computerprogram (using Matlab, MathWorks, Inc ., Natick, MA)was written to display stance phase interface stress-timecurves from multiple steps and multiple sites simultane-ously (sites and steps selected by the user) as well aspolar plots (r-O) of RS (r) and RSang (0), allowing visu-al inspection for similarities and differences in interfacestress-time curve shapes.
RESULTS
Interface stress data are presented such that stresseson the transducers (on the socket) are positive in sign."Shear stress" is the force measured by the transducer,whether or not slip occurs, divided by its surface area. Apositive horizontal shear stress is clockwise when view-ing the socket from above . Vertical shear stress is positivewhen directed distally . A pressure (normal stress) appliedfrom the residual limb toward the socket is positive insign . For the results presented below, typically RS andRSang are presented rather than horizontal and verticalshear stresses . RSs are the resultant of the horizontal and

25
SANDERS et al . Interface Pressures and Shear Stresses
vertical shear components, and the RSang is relative tothe horizontal shear axis (Figure 3) . Only data from thestance phase of gait are presented below. Swing phaseinterface stresses were less than maximal stance phasestresses at all sites on both subjects.
Two sessions were conducted on each subject, 21days apart for TW and 42 days apart for WP . They allwere conducted during morning hours : session TW812started at 10:04 a .m. ; TW92 at 10:32 a.m . ; WP1024 at10:21 a .m . ; and WP125 at 9 :20 a .m. After the TW92 datawere collected, the subject complained that he felt that hehad been "bottoming out" (residual limb contacted thedistal end of the socket in stance phase) during the walk-ing trials . As no powder transfer test between the residuallimb and the bottom of the socket was conducted, onlythe verbal description from the subject is available . Theprosthetists noted that WP's residual limb underwentshrinkage after the socket was fabricated . For both sub-jects, the prosthetists considered the fit sub-optimal butacceptable for short-term ambulation.
At least 23 steps on the prosthesis were collected atneutral alignment in each session . Stance phase durationswere 0 .69±0.03 s for TW812, 0 .72±0.05 s for TW92,0.90±0.04 s for WP1024, and 0.87±0.08 s for WP125.Stance phase durations as a percentage of step durationswere 61 .36±0.99 percent for TW812, 61 .53±1 .84 per-cent for TW92, 63 .12± 1 .04 percent for WP1024, and63.96± 1 .16 percent for WP125.
Some of the channels did not function properly insome of the sessions . They are shown as nonfunctional
(NF) in Tables 3-6 . NF channels were always the resultof a broken wire connection in the transducer or signal-conditioning box . Findings below are based on caseswhere transducers functioned and comparisons could bemade.
Pressure and Resultant Shear Stress MaximaMaximal interface pressures and RSs during stance
phase for all transducers were determined for each stepand the means and standard deviations (SD) for all stepsat each site in each session computed . Maximal stressesare considered in analysis because they are potentially themost traumatic to the tissues.
For all sessions, an anterior site always had the high-est mean maximal pressure and mean maximal RS, asshown in Tables 3a, 3c, and 3e. The LP site showed thelowest pressure maxima during stance phase in all ses-sions but not always the lowest RS maxima.
Significant (significance in all cases : p<0.05) stressdifferences were apparent for transducers within eachgroup (anterior, lateral, posterior) and between groups.For both pressure and RS for both subjects, maximalstresses were significantly greater at either AD transduc-er site compared with either AP site, as shown in Table3a . AMD pressure maxima were significantly higher thanALD pressure maxima in three of the four sessions . PMpressure maxima were significantly greater than PD pres-sure maxima, and RS maxima were significantly higherat PD sites than at PM locations (Table 3e) . Pressuremaxima at the PF site were significantly greater than
Table 3a.Peak interface stresses during stance phase : anterior region magnitudes.
Session Parameter ALD AMD ALM AMM ALP AMPTW812 PR 142.5 ± 12 .5 140 .0 ± 3 .4 103 .2±4.5 85 .5 ± 6 .5 17 .616.3 14 .1 ± 2 .3
RS 60.1±4.1 43 .3 2 .8 11 .5 ± 1 .2 11 .9 ± 1 .8 2.4 ± 0 .5 1 .6 ± 0.2RSang (8) 111 .7 ± 1 .4 92 .3 ± 3 .3 155 .4 ± 19 .5 87 .6 ± 49 .4 234 .6 ± 9 .1 28 .8 ± 24 .8
TW92 PR 212 .3 ± 18 .5 223 .8 ± 30 .0 99 .5±10.0 87 .3 ± 14 .3 NF 29 .2 ± 4 .0RS 48 .8 ± 5 .3 48 .3 ± 13 .4 9 .2 ± 1 .6 7 .1 ± 2 .2 2.6 ± 0 .5
RSang (8) 99 .0 ± 2 .4 94 .4 ± 4 .5 211 .1 ± 16 .8 314 .8 ± 68 .5 37 .6 ± 16 .8
WP1024 PR 99 .3 ± 8 .4 145 .1 ± 46 .4 107 .8 ± 0 .1 157 .7 ± 38 .9 NFRS 24 .4
2.8 66 .1 ± 10.1 23 .5 ± 2 .5 7 .4 ± 1 .5 NFRSang (8) 17.6 ± 3 .8 104 .6 ± 7.2 73 .5±10.5 150 .8±10.6 NF NF
WP125 PR 103 .0 ± 8 .4 132 .5 ± 25 .2 52.2
3 .0 155 .7 ± 18 .9 40 .6 ± 10 .2 54 .0 ± 5 .9RS 20.8±2.0 30.0 ± 4.6 28 .3
2 .2 16 .2 ± 3 .8 3 .6 ± 0 .5 8 .5 ± 0 .8RSang (8) 86 .3 ± 16 .4 143 .8 ± 6 .2 104.3 ± 2 .8 64 .1 ± 10 .1 13 .8 ± 42 .0 190 .1 ± 6 .0
Magnitudes are expressed in kPa, angles in degrees ; means ± SD for all steps in each session are shown . ALD = anterior lateral distal ; AMD = anterior medial dis-tal ; ALM = anterior lateral mid-limb ; AMM = anterior medial mid-limb ; ALP = anterior lateral proximal; AMP = anterior medial proximal ; PR = pressure ; RS =resultant shear stress ; RSang (8) = resultant shear angle at the time of peak RS ; NF = nonfunctional transducer.

26
Journal of Rehabilitation Research and Development Vol. 34 No. 1 1997
Table 3b.Peak interface stresses during stance phase : anterior region timings.
Session Parameter ALD AMD ALM AMM ALP AMP
TW812 PR 26 .4-"13 .0 27 .4 ± 5 .1 31 .1 ± 19.6 25 .9±1.3 91 .1 ± 0.8 86.1±16.1RS 23 .0 ± 2 .6 26 .5 ± 3 .0 64 .2±28.1 23 .6 ± 7 .4 91 .3 ± 1 .2 84 .4 ± 14 .5
TW92 PR 25 .2 ± 2.1 26 .0 ± 2 .3 26 .3 ± 10.1 25 .0 ± 2 .4 NF 85 .8 ± 3 .8RS 23 .9 ± 3 .6 25 .8 ± 15 .1 24 .3 ± 18 .8 28 .5-±24.8 NF 71 .0 ± 24 .9
WP1024 PR 34 .1 ± 3 .3 35 .0 ± 23 .5 50 .3 ± 22 .6 32.6 ± 2 .5 NF NFRS 34 .4 ± 2 .7 48 .5 ± 36.7 75 .2 ± 24 .3 23 .5 ± 13 .7 NF NF
WP125 PR 36.0"7 .9 27 .1 ± 5 .2 42.1±10.6 30 .8 ± 8 .4 74.4 ± 7 .8 75 .4 ± 9 .3RS 44 .2 ± 13 .9 29 .1±4.5 64.4±16.2 38 .3 ± 7 .4 41 .3 at. 16 .6 42 .5 ± 6.8
Timings are expressed in percentage of stance phase; means ± SD for all steps in each session are shown . ALD = anterior lateral distal; AMD = anterior medial dis-tal ; ALM = anterior lateral mid-limb ; AMM = anterior medial mid-limb ; ALP = anterior lateral proximal ; AMP = anterior medial proximal ; PR = pressure ; RS =resultant shear stress ; RSang (0) = resultant shear angle at the time of peak RS ; NF = nonfunctional transducer.
Table 3c.Peak interface stresses during stance phase : lateral region magnitudes.
Session Parameter LD LPD LM LP
TW812 PR 79 .8-±0.1 NF 63 .6 ± 5 .8 9 .6±0.9RS 17 .7 ± 1 .2 NF 9 .8 ± 0.8 3 .5 ± 0 .2
RSang (0) 140 .9 ± 4 .3 NF 204.9 ± 5 .4 289 .8 ± 11 .9
TW92 PR 180.7±18.6 90.0 ± 14 .4 64 .1 ± 5 .0 16 .8 ± 1 .9RS 4 .3 ± 0.6 5 .6 ± 0.9 8 .3 ± 0 .8 2 .5 It. 0 .4
RSang (0) 105 .9 ± 8 .9 73.1 ± 5 .8 215 .6 ± 4.7 272 .0 ± 76.3
WP1024 PR 87 .0 ± 5 .4 77 .9 ± 3 .7 54 .6 ± 5 .3 28 .3 ± 9 .2RS 6 .4 ± 1 .8 1 .5 ± 0.2 8 .2 ± 0 .3 5 .4 ± 1 .5
RSang (0) 81 .4 ± 11 .0 44 .7 ± 83 .6 265 .9 ± 1 .4 117 .2 ±- 7 .9
WP125 PR 97 .7 ± 4.6 87 .0 ± 6.8 62 .7±6.7 18 .2 ± 6 .4RS 5 .7 ± 1 .1 6.2 ± 1 .1 5 .0 ± 0.5 3 .2 ± 0 .6
RSang (0) 95 .3 ± 11 .6 121 .1 ± 4.1 288.8 ± 3 .9 123 .0 ± 32 .5
Magnitudes are expressed in kPa, angles in degrees ; means ± SD for all steps in each session are shown . LD = lateral distal ; LPD = lateral-posterior distal;LM = lateral mid-limb ; LP = lateral proximal ; PR = pressure ; RS = resultant shear stress ; RSang (0) = resultant shear angle at the time of peak RS ; NF = non-functional transducer.
Table 3d.Peak interface stresses during stance phase: lateral region timings.
Session Parameter LD LPD LM LP
TW812 PR 60 .4 ± 22 .7 NF 36.0 ± 22.9 65.9 ± 35 .8RS 62 .7 ± 27 .2 NF 72 .3 ± 18 .2 22 .8 ± 35 .7
TW92 PR 24 .9 ± 2 .7 25 .0 ± 10 .8 36 .6 ± 24 .6 42 .2 ± 34.9RS 94 .4 ± 9 .8 82 .9 ± 17 .3 59 .1 ± 23 .9 49 .5 ± 40.9
WP1024 PR 34 .3 ± 3 .4 33 .0 ± 2 .6 70.0 ± 16 .1 65 .3 ± 39 .5RS 77 .8 ± 16 .4 74 .2 ± 31 .5 30 .9 ± 2 .9 96 .3 ± 0 .4
WP125 PR 34 .4 ± 9 .4 32 .6 ± 9 .6 61 .7 ± 24 .8 50 .7 ± 33 .9RS 42.9±36.2 43 .4±22.7 31 .7 ± 7 .2 86 .0 ± 24 .0
Timings are expressed in percentage of stance phase ; means ± SD for all steps in each session are shown . LD = lateral distal; LPD = lateral-posterior distal;LM = lateral mid-limb ; LP = lateral proximal ; PR = pressure ; RS = resultant shear stress ; RSang (0) = resultant shear angle at the time of peak RS ; NF = non-functional transducer.

27
SANDERS et al . Interface Pressures and Shear Stresses
Table 3e.Peak interface stresses during stance phase : posterior region magnitudes.
Session Parameter PD PM PF
TW812 PR 54 .3 ± 4 .7 81 .7 ± 3 .9 114 .3 ± 12 .6RS 25 .7 ± 1 .7 5 .3 ± 1 .1 10.4 ± 1 .2
RSang (0) 101 .1 ± 0 .7 110 .4 ± 30 .5 212.8±4.7TW92 PR 72.7 ± 11 .4 96 .8
8 .4 105 .3 ± 13 .6RS 9 .5 ± 1 .7 NF 11 .0 ± 1 .1
RSang (0) 77 .2 ± 6 .0 NF 221 .4 ± 5 .7
WP1024 PR 59 .9 ± 2 .6 NF 43 .0 ± 6 .8RS 6 .5 ± 2 .6 NF 10 .7 ± 1 .2
RSang (0) 137 .3 ± 11 .9 NF 245 .5 ± 12 .6
WP125 PR 58 .0 ± 5 .8 88 .6 ± 6 .2 35 .0 ± 6 .0RS 7 .1 ± 0.6 5 .2 ± 0 .8 10 .5 ± 1 .0
RSang (0) 79 .4 ± 11 .5 123 .6 ± 26 .2 280 .0 ± 4.6Magnitudes are expressed in kPa, angles in degrees ; means ± SD for all steps in each session are shown . PD = posterior distal ; PM = posterior mid-limb ; PF =popliteal fossa; PR = pressure ; RS = resultant shear stress ; RSang (0) = resultant shear angle at the time of peak RS ; NF = nonfunctional transducer.
Table 3f.Peak interface stresses during stance phase : posterior region timings.
Session Parameter PD PM PFTW812 PR 31 .1 ± 16 .2 26 .5±11 .5 33 .0 ± 18 .7
RS 23 .0 ± 2.2 74 .1 ± 15 .4 36 .9 ± 17 .3
TW92 PR 28 .8 ± 12 .5 22 .4 ± 3 .8 34 .0 ± 20 .7RS 23 .1 ± 3 .7 NF 53 .5 ± 23 .1
WP1024 PR 34.0 ± 3 .5 NF 28 .0 ± 6 .3RS 48 .1 ± 18 .1 NF 27 .2 ± 2 .6
WP125 PR 33 .9 ± 7 .8 33 .9 ± 14 .5 22 .6±51RS 39 .3±13.7 85 .5 ± 30 .5 23 .4 ± 5 .0
Timings are expressed in percentage of stance phase ; means t SD for all steps in each session are shown. PD = posterior distal; PM = posterior mid-limb ; PF =popliteal fossa ; PR = pressure ; RS = resultant shear stress ; RSang (0) = resultant shear angle at the time of peak RS ; NF = nonfunctional transducer.
those at the PD site for TW but significantly less thanthose at the PD site for WP. Pressure and RS maxima atthe LP, LM, LD, and LPD sites were significantly lessthan those at either AD sites (Tables 3a and 3c).
Comparisons of sites in the lateral region with thosein the posterior region showed some trends, but they werenot consistent for all sessions . LD pressure maxima weresignificantly higher than PF pressure maxima for three ofthe four sessions (Tables 3c and 3e) . The RS maxima atLP, LM, and LD were lower than those at the PF site forthree of the four sessions (Table 3a, 3c, and 3e).
Timings of MaximaTimings of maximal interface pressures and timings
of maximal interface RS (and the corresponding RSang)were determined for each step, and the means and SD for
all steps at each site in each session computed . Timingsof maximal stance phase stresses were not simultaneouseverywhere (Tables 3b, 3d, and 3f) . Some sites achievedmaximal stresses during the first 50 percent of stance.The ALD, AMD, AMM, PD, PM, and PF sites demon-strated mean timings of maximal pressures during thefirst 50 percent of stance phase ; timings of the maximalpressures were after the 1st pk at all except the PF site forWP1024 and WP125 and the AMD site for WP125. RSmaxima were in the first 50 percent of stance phase at thefollowing sites for all sessions : ALD, AMD, AMM, andPD. The maxima occurred after the 1st pk at all except theAMM and PF sites in WP1024 and the AMD and PF sitesin WP125. The sites that achieved maximal pressure dur-ing the last 50 percent of stance were ALP and AMP. ThePM site achieved maximal RS during the last 50 percent
I

28
Journal of Rehabilitation Research and Development Vol . 34 No. 1 1997
AXPK1
AXPK2 -
ALD -
AMD -
ALM -
AMM -
ALP
PF -
0
0 .2
0 .4
0 .6
0 .8
1
Fraction of Stance Phase
Figure 4.Timings of stance phase pressure maxima for sessions WP1024 andWP125 . Bars represent a positive and negative standard deviationfrom the mean for all steps within a session.
of stance phase . Sites that showed large SD in Tables 3b,3d, and 3f had interface stress-time 'curves of less distinctmaxima than those with smaller SD.
There was not a gradual increase in the percent timeinto stance phase of interface stress maxima from ADsites to anterior mid-limb (AM) sites or AP sites . Therewere no significant differences between AD and AMmaxima timings (percentage into stance phase) for anysession. However, ALP and AMP pressure maximaoccurred significantly later than AD or AM pressure max-ima in all cases. Interestingly, there were differencesbetween medial and lateral sides at anterior locations forWP (Figure 4). ALM pressure and RS maxima occurredlater than AMM pressure and RS maxima respectively forboth sessions for WP.
Posteriorly, pressure maxima were approximatelysimultaneous throughout the region . Mean time percent-
ages into stance phase of pressure maxima for all posteri-or sites were within 11 .6 percent of stance phase of eachother for all posterior sites within each session . There wasnot a clear proximal-distal trend in timings of posteriorpressure or RS maxima.
Pressures and Shear Stresses at First Peak and SecondPeak in the Shank Axial Force-time Curve
It is important to note that for the stress magnituderesults discussed above and presented in Tables 3a, 3c,and 3e, stress maxima did not necessarily occur simulta-neously. As shown in Tables 3b, 3d, and 3f and as dis-cussed in the Timings of Maxima section above, timingsof the maximal stresses were different for the differentsites and directions . Though the maxima data provideuseful information, they do not provide a sense of thestress distribution at a single point in time . Thus, in thissection, pressures and RS at two time points, 1st pk and2nd pk, are considered because they are distinct events ina gait cycle, one early and one late in stance phase, atwhich high magnitude shank forces and moments occur.Maxima in shank force and moment data have been usedas analysis reference points by other investigators, forexample by committees developing standards for pros-thetic componentry (29) . Means and SD for all steps ineach session of timings of 1st pk and 2nd pk were com-puted. For TW, the 1st pk occurred 21 .8+ 1 .8 percentand 21.5±4.0 percent into stance phase for sessionTW812 and TW92 respectively ; the 2nd pk for the samesessions occurred at 77 .3±2.6 percent and 78 .7d:1 .1percent into stance phase respectively . For WP, the 1st pkoccurred at 31 .5±4.8 percent and 30 .7±6.9 percent intostance phase for WP1024 and WP125 respectively, whilethe 2nd pk for the same sessions occurred at 74 .2+9.0percent and 73 .4±9.0 percent into stance phase respec-tively.
Interface pressures and RS at the times of the 1st pkand 2nd pk for all transducers were determined for eachstep and the means and SD for all steps at each site ineach session determined . For each session, the sites thatexperienced the greatest stresses at the timings of the 1stpk (Tables 4a–c) were the same sites as those that expe-rienced maximal stresses independent of time . For TW atthe 1st pk, the highest pressures were at the ALD andAMD sites, while the highest RSs were at the ALD site.For WP at the 1st pk, the highest pressures were at theAMM site, while the highest RSs were at the AMD site(Tables 4a–c) . The interface pressure and RS magnitudesat the 1st pk were lower than the maxima independent of
AMP
LPD
LPM
WP-1024WP-126

29
SANDERS et al . Interface Pressures and Shear Stresses
Table 4a.Interface stresses at the time of the shank axial force first peak: anterior region magnitudes .
Session Parameter ALD AMD ALM AMM ALP
TW812 PR 1389±11 .7 135 .9-"8 .1 73 .6±-43 .8 80.4 ± 7 .5 2 .8 ± 2 .3RS 59 .3
4 .4 42 .2 ± 3 .3 10.9±-1 .2 11 .3±-2 .9 0 .7 ± 0 .3RSang(0) 111 .6± 1 .3 91 .7-'_-3 .2 159 .9±17.6 90.2±-37 .9 290 .3 ± 25 .4
TW92 PR 197 .2 ± 20 .8 200 .3± 27 .5 97 .8 ± 10 .5 83 .5 ± 15 .4 NFRS 47 .4 ± 5 .2 45 .2 ± 13 .1 89±1 .8 5 .1±3.5 NF
RSang (0) 98 .9 ± 2.3 92.7
4 .2 205 .9 ± 13 .5 322 .4 ± 60 .6 NF
WP1024 PR 97 .3 ± 8 .3 109 .4±48.9 107 .6±0.1 151 .9±41 .0RS 24 .1±-2.7 32 .9±17.7 21 .7 ± 3 .0 3 .6 ± 1 .4
RSang (0) 17 .1 ± 4 .1 140 .2 ± 16 .8 54.1±3.5 171 .5±41 .1
WP125 PR 98 .8 ± 9 .7 117 .5 ± 38 .1 46.3 ± 3 .9 147 .2±-26 .0 5 .0±5 .5RS 19 .4
1 .5 27 .7±-6 .9 24 .5 ± 2.4 14 .4 ± 4 .3 2 .5±0.9RSang (0) 73 .0 ± 11 .4 142.7 ± 7 .3 95 .1 ± 5 .2 59 .7 ± 13 .6 12 .4±-12 .6
"P
349 .2 ± 8 .8
28 .o±- 10 .36 .4 ± 1 .3
191.5±8.1
Magnitudes are expressed in kPa, angles in degrees ; means ± SD for all steps in each session are shown . ALD = anter
AMD = antital : ALM = anterior lateral mid-limb ; AMM = anterior medial mid-limb ; ALP = anterior lateral proximal ; AMP = antc,ior
proximal ; PR =
RS =resultant shear stress ; RSang (8) = resultant shear angle at the time of peak RS ; NF = nonfunctional transducer.
Table 4b.Interface stresses at the time of the shank axial force first peak : lateral region magnitudes.
Session Parameter LD LPD LM LP
TW812 PR 79 .5 ± 0 .1 NF 61 .3 ± 6 .1 4 .3 ± 1 .4RS 15 .1 ± 1 .3 NF 8 .2 ± 1 .0 2 .2 ± 0.3
RSang (0) 139 .2 ± 5 .4 NF 203 .5 ± 4 .6 286 .9 ± 13 .2
TW92 PR 173 .7 ± 19 .7 88 .4 ± 14 .0 61 .2±82 10.0±32RS 2 .2± 1 .0 2 .6 ± 1 .7 7 .2 ± 0 .9 1 .3 ± 0.6
RSang (0) 146 .7 ± 31 .7 96 .1 ± 26 .4 215 .8 ± 5 .1 204 .2 ± 74 .2
WP1024 PR 85 .6 ± 5 .4 77 .3 ± 3 .8 47 .7 ± 3 .6 3 .2 ± 0 .9RS 5 .6±1 .8 1 .0 ± 0.3 7 .9 ± 0 .4 0 .6 ± 0.2
RSang (0) 83 .0 ± 12 .2 309 .2 ± 24 .6 265 .2 ± 1 .6 138 .8 ± 33 .9
WP 125 PR 95 .7 ± 4 .9 86 .1 ± 7 .1 58 .2 ± 5 .4 6 .6 ± 2 .0RS 5 .0 ± 1 .3 5 .9 ± 1 .2 4 .7 ± 0 .7 0 .9 ± 0 .3
RSang (0) 107 .5 ± 10 .6 121 .0 ± 3 .8 288 .6 ± 3 .5 132 .6 ± 38 .9
Magnitudes are expressed in kPa, angles in degrees ; means ± SD for all steps in each session are shown . LD = lateral distal ; LPD = lateral-posterior distal ; LM =lateral mid-limb ; LP = lateral proximal ; PR = pressure; RS = resultant shear stress ; RSang (8) = resultant shear angle at the time of peak RS ; NF = nonfunctionaltransducer.
time (Tables 3a, 3c, and 3e) by 10 .5 percent or less for allsessions except WP1024 RS at the AMD site, which was50.2 percent lower.
For WP, from the 1st pk to the 2nd pk, there weremedial-to-lateral shifts of the site of greatest pressureand RS. For WP1024, the site of greatest pressure shift-ed from AMM to ALM, while the greatest RS shiftedfrom AMD to ALM. For WPI25, the site of greatestpressure shifted from AMM to ALD, while the site ofgreatest RS shifted from AMD to ALM (Tables 5a-c).Thus, the results reflect the subject's lateral thrust at
mid-stance . TW did not show this medial-to-lateral shiftpattern.
For proximal sites in the anterior and lateral groups(ALP, AMP, LP), mean RSs at the 2nd pk were greaterthan those at the 1st pk, except at the LP site in WPI25.It should be noted, however, that RSs at the LP site inWPI25 were very low: 0.9±0.3 kPa at the 1st pk and0.8 ±0.4 kPa at the 2nd pk . In all sessions, for three ante-rior (ALD, AMD, AMM) and three posterior sites (PD,PM, PF), mean pressures at the 2nd pk were less thanthose at the 1st pk.

34
Journal of Rehabilitation Research and Development Vol . 34 No . 1 1997
ANTERIOR GROUP
LATERAL GROUP
POSTERIOR GROUP
Anterior Medial Proximal (AMP)
Anterior Lateral Proximal (ALP)
Lateral Proximal (LP)
Popliteal Fossa (PF)
33d
tst pk
33d
AIFAti12kPa 6kPa~
ied SkPa
2 .5
0' n
Ilea
7kPa
d lltg.kit6a12 kPa
Lateral Mid-limb (LM) Posterior Mid-limb (PM)Anterior Medial Mid-limb (AMM)
Anterior Lateral Mid-limb (ALM)
50
Anterior Medial Distal (AMD) Anterior Lateral Distal (ALD)
Lateral Distal (LD)
Posterior Distal (PD)
Figure 5.Resultant shear stresses during stance phase for the anterior group (six sites, left side of figure), lateral group (three sites, central part of figure),and posterior group (three sites, right side of figure) . Results are from a step during session TW812 . Data are presented as polar plots where theradii are resultant shear stress magnitudes, and the angles are resultant shear stress directions.
Resultant Shear Stress DirectionsRS directions are referenced to the horizontal
shear axis as RSang in (Figure 3) . Resultant sheardirections changed over the course of stance phase, asshown in Figure 5 . This figure illustrates the complexRS direction changes that can take place over one step.RS magnitudes and directions at the 1st pk can be dras-tically different from those at the 2nd pk at the samesite .
At the 1st pk and 2nd pk and the interval in between,RSs at distal sites (PD, LD, AMD, and ALD) were direct-ed more distally than proximally (0° < resultant shearangle <180°) for all steps in all sessions (Figure 6a—dand Figure 7a—d) . RSang of 0° and 180° indicate a RS inthe transverse plane, and a RSang of 90° indicates a RS inthe sagittal or frontal plane (depending on transducerlocation) and directed distally . Mean RSang at the 1st pkfor all steps in each session are given in Tables 4a—c .

31
SANDERS et al . Interface Pressures and Shear Stresses
Table 4c.Interface stresses at the time of the shank axial force first peak: posterior region magnitudes.
Session Parameter PD
PM PFTW812 PR 51 .9 ± 4 .7 79.9 ± 3 .8 104 .2 ± 13 .2
RS 25 .4 ± 1 .7 2 .1 ± 0 .9 9 .4 ± 1 .1RSang (0) 100 .9 ± 0 .8 161 .1 ± 43 .0 207 .2 ± 1 .9
TW92 PR 69 .4 ± 11 .4 95 .7 ± 8 .2 96 .2±13.8RS 9 .1 ± 1 .5 NF 9 .6 ± 1 .2
RSang (0) 78 .0 ± 6 .0 NF 216 .4-!-8 .1
WP1024 PR 59 .2 ± 2 .5 NF 34 .7-!-8 .1RS 6.3-!-2 .7 NF 9 .4 -!- 1 .3
RSang (0) 139 .5 ± 10 .0 NF 245 .6 ± 11 .9WP125 PR 57 .1 ± 6 .0 87 .5 ± 6 .4 28 .3 ± 6 .6
RS 6 .9 ± 0 .7 3 .9 ± 1 .1 9 .2 ± 1 .4RSang (0) 79 .0 ± 12 .2 164 .0-!-26 .6 282.1 ± 5 .7
Magnitudes are expressed in kPa, angles in degrees ; means ± SD for all steps in each session are shown . PD = posterior distal; PM = posterior mid-limb ; PF =popliteal fossa ; PR = pressure ; RS = resultant shear stress ; RSang (0) = resultant shear angle at the time of peak RS ; NF = nonfunctional transducer.
Table 5a.Interface stresses at the time of the shank axial force second peak : anterior region magnitudes.
Session Parameter ALD AMD ALM AMM ALP AMPTW812 PR 55.8 ± 13 .3 82 .6 ± 7 .3 78 .5±33.0 28 .1 ± 10 .8 3 .5±3 .3 4 .8±1 .6
RS 29 .4 ± 4 .4 18 .3 ± 4.5 11 .0 ± 1 .4 2 .9 It. 1 .2 0 .7 ± 0 .3 0 .9 ± 0.3RSang (0) 101 .5 ± 5 .1 79.2 ± 9 .6 152 .0 ± 14 .2 92 .0 ± 26 .6 306 .1 ± 36 .4 90.6±25.4
TW92 PR 137 .1 ± 8 .6 119 .0 ± 19 .3 82 .2 ± 7 .6 47 .1-!-10 .6 NF 19 .1 ± 8 .3RS 31 .0 ± 3 .4 27 .2-!- 11 .9 8 .2 ± 1 .3 3 .0 ± 2 .1 NF 2.3 ± 0 .5
RSang (0) 93 .0 ± 2 .1 89 .2 ± 5 .1 196 .0±17.5 358 .3 ± 72.8 NF 40.4±11.6WP1024 PR 87 .1 ± 8 .2 34 .3 ± 28 .7 107 .6 ± 0 .1 41 .2 ± 12 .8 NF NF
RS 15 .3 ± 4.2 18 .8 ± 15 .9 22 .2 ± 2 .4 5 .5±1 .6 NF NFRSang (0) 35 .6 ± 13 .6 126 .5 ± 41 .0 76 .9 ± 7 .1 140 .0 ± 7 .2 NF NF
WP125 PR 91 .3-!-10 .9 40 .7 ± 19 .3 47 .1±3.3 71 .1 ± 24 .1 35 .6 ± 11 .2 50.2 ± 6 .0RS 18 .3 ± 2 .2 11 .2 ± 5 .5 26 .8 ± 2 .3 10 .5 ± 4.1 2 .8 ± 0.7 7 .4 ± 1 .0
RSang (0) 88 .6 ± 9 .1 139 .1 ± 9 .0 103 .8
4 .7 87 .2±11 .7 75 .1±37.6 178 .2 ± 19.2Magnitudes are expressed in kPa, angles in degrees ; means ± SD for all steps in each session are shown . ALD = anterior lateral distal ; AMD = anterior medial dis-tal ; ALM = anterior lateral mid-limb ; AMM = anterior medial mid-limb ; ALP = anterior lateral proximal ; AMP = anterior medial proximal ; PR = pressure ; RS =resultant shear stress ; RSang (0) = resultant shear angle at the time of peak RS ; NF = nonfunctional transducer.
Those for the 2nd pk are given in Tables 5a-c. At theALD site in all sessions, mean RSang at the 2nd pk weredirected more distally than those at the 1st pk . Angulardifferences in mean RSang at the 1st pk compared withthe 2nd pk at the ALD site were : 10.1° (TW812), 5 .9°(TW92), 18 .5° (WP1024), and 15 .6° (WP125).
At the 1st pk and 2nd pk and the interval betweenthem, RS directions at most of the proximal sites in thelateral and posterior groups were directed more proxi-mally than distally. For the stance phase interval betweenthe peaks, mean RS directions at LM and PF sites in allsessions were between 180° and 360° . RSang of 180° and
360° indicate a RS in the transverse plane, and a RSangof 270° indicates a RS in the sagittal or frontal plane(depending on transducer location), directed proximally.Mean RSang at the LM, PF, and LP sites are shown inTables 4b,c, and 5b,c . LP sites on TW showed RSangsthat were more proximally directed than distally directed.For WP, RSangs at the LP site were directed distally inboth sessions.
RSs at AD sites were directed toward the apex of thesocket in some but not all sessions . Mean ALD and meanAMD RSs at the 1st pk were directed toward the socketapex in all sessions for WP but for TW mean AMD, RSs

32
Journal of Rehabilitation Research and Development Vol . 34 No . 1 1997
Table 5b.Interface stresses at the time of the shank axial force second peak : lateral region magnitudes.
Session Parameter LD LPD LM LP
TW812 PR 79.6±0.1 NF 55 .8-!-6 .9 1.6±0.8
RS 17 .4 ± 1 .3 NF 9 .6-!-0 .8 2 .9±0 .1RSang (0) 139 .8 ± 3.5 NF 204.7 ± 5 .2 298 .7 ± 4 .0
TW92 PR 113 .6±8.0 73 .8 ± 9 .6 57 .6 ± 2 .7 10 .5 ± 4 .2RS 2 .8 ± 1 .0 4 .8 ± 1 .4 7 .8-!-0.7 1 .5±0.6
RSang (0) 99 .6 ± 16 .6 72 .5 ± 9 .1 217 .4±3.5 357 .7 ± 15 .3
WP1024 PR 75 .5 ± 5 .6 69 .1±4.0 50.6 ± 7 .1 8 .7±3.2
RS 6 .0 ± 1 .8 0 .8 ± 0 .4 4 .9 ± 0 .7 1 .4 ± 0 .6
RSang (0) 81 .2 ± 11 .2 318.6±29.1 261 .1 ± 2 .5 77.2±24.2
WP125 PR 89 .6-!-4 .9 80 .6±6.4 60 .1 ± 8 .0 12 .6-±3 .7
RS 4 .9 ± 1 .4 5 .9 ± 1 .0 3 .0 ± 0 .8 0 .8 ± 0 .4RSang (0) 105 .2 ± 10 .4 121 .1±2.9 279 .1 ± 4 .5 71 .8 ± 68 .1
Magnitudes are expressed in kPa, angles in degrees ; means ± SD for all steps in each session are shown . PR = pressure; RS = resultant shea stress ; RSang (0) =resultant shear angle at the time of peak RS : NF = nonfunctional transducer.
Table 5c.Interface stresses at the time of the shank axial force second peak : posterior region magnitudes.
Session Parameter PD PM PF
TW812 PR 47 .4 ± 3.5 70.3±5.3 85 .0 ± 10 .0RS 11 .4 ± 1 .8 5 .2 ± 1 .2 8 .4 ± 0 .9
RSang (0) 98 .2 ± 3 .4 106 .4± 12.2 218 .1 ± 4 .3
TW92 PR 60 .6 ± 7 .2 79 .3 ± 5 .1 88 .1-±13 .9RS 4 .3 ± 1 .1 NF 10 .4 ± 1 .3
RSang (0) 72.8 ± 6 .3 NF 221 .6 ± 6 .5
WP1024 PR 52 .9 ± 2 .8 NF 20 .1 Jr. 2 .9
RS 6 .2 ± 2 .4 NF 4 .8-!-0 .6RSang (0) 135 .6 ± 11 .3 NF 244 .9 ± 11 .3
WP125 PR 53 .5 ± 5 .3 82 .7
6 .8 19 .5 ± 2 .1
RS 6 .7 ± 0.6 3 .8 -!- 1 .1 6 .9±-0 .5RSang (0) 79 .8 ± 11.3 158 .9-!-27 .8 287 .6 ± 4 .0
Magnitudes are expressed in kPa, angles in degrees; means ± SD for all steps in each session are shown . PD = posterior distal; PM = posterior mid-limb; PF =popliteal fossa ; PR = pressure ; RS = resultant shear stress ; RSang (0) = resultant shear angle at the time of peak RS ; NF = nonfunctional transducer.
at the 1st pk were directed 1 .7° to 2.7° off the vertical
(vertical is 90°) and directed away from the socket apex(Table 4a) . At the 2nd pk, all ALD and AMD sites had
mean RSs directed toward the apex of the socket in allsessions.
Though at the 1st pk, anterior RS directions were not
always consistently toward the apex of the socket as inprevious interface shear stress studies on persons with
TTA (12,15), further analysis of the data suggests that theskin was still loaded in tension at AD sites . Consider thedifferences in horizontal shear stresses between the ALD
and AMD sites at the times of the I st pk and 2nd pks :
means and SD for all steps in each session are shown in
Table 6a. In all sessions, differences in horizontal shearstress between adjacent anterior sites indicate the skin
was in tension across the tibial crest at AD locations . It is
important to note that the magnitudes represent only thedifferences in shear stresses in the transverse plane (dif-
ferences in horizontal shear stress) between two measure-ment sites on the socket, not necessarily the tension in theskin, since skin between the two transducer sites was not
isolated from surrounding skin. The point here is that thedata indicate the skin was in tension across the tibial crest
at distal locations.

33
SANDERS et al . Interface Pressures and Shear Stresses
(a)
WP-1024ANTERIOR
LATERAL
POSTERIOR
(b)
WP-125
ANTERIOR
LATERAL
POSTERIOR
(c)
(d)
TW-92TW-812
POSTERIOR aLATERAL ANTERIO POSTERIOR LATERAL
96(I0)
699)
Figure 6.Interface stress maxima (means for all steps in each session) at the time of the shank axial force first peak . Pressures (in kPa) are shown next tothe arrows ; resultant shear stresses (in kPa) are in parentheses . Arrows indicate resultant shear stress directions . Sites at which transducers did notfunction properly are shown with open circles. a: Session TW812 . b : Session TW92 . c : Session WP1024 . d : Session WP125.
Table 6aHorizontal shear stress differences at anterior distal sites atthe time of the shank axial force first and second peaks.
Session1st pk
Lateral/Medial2nd pk
Lateral/Medial
TW812 +20.5 ± 3 .1 +9 .0 ± 2 .7TW92 +4.8 ± 2 .6 +1 .4 ± 3 .1WP1024 +45 .1 ± 10 .3 +18 .2 ± 8 .1WP125 +27 .7 ± 8 .9 +8 .7 ± 5 .7
Resultant shear stress differences in kPa between adjacent anterior sites for allsteps in each session . Means ± SD are calculated at the time of the shank axialforce first and second peaks. A `+' indicates tension, a `—' compression,between sites .
For the vertical direction, the data indicate that in mostcases the skin was not in tension between adjacent anteriorsites (Table 6b) . Differences in vertical shear stresses at the1st pk and 2nd pk usually did not indicate tension butinstead indicated compression in the plane of the skinbetween sites . Exceptions were between the mid-limb anddistal transducers on the anterior lateral side for WP1024and WP125 and between the mid-limb and proximal sitesfor TW92 . Skin between the mid-limb and distal transduc-er sites was in tension during the 1st pk and 2nd pk and theinterval between them for all steps in those sessions . Again,it is important to note that the magnitudes represent only thedifferences in vertical shear stresses between adjacent trans-

34
Journal of Rehabilitation Research and Development Vol . 34 No . 1 1997
Table 6b.Vertical shear stress differences at anterior sites at the time of the shank axial force first and second peaks.
1st pk
2nd pkMid-Limb/Distal
Mid-Limb/Proximal
Mid-Limb/Distal
Mid-Limb/Proximal
Session
Lateral
Medial
Lateral
Medial
Lateral
Medial
Lateral
Medial
TW812
-51.3±6.4 -31.5 ± 5.6 -4.4±3.4
TW92
-50 .9 ± 5.2 -48.7 ± 11 .1
NF
WP1024
+10.3"3.5 -21.5}17.7
NF
WP125
+6 .1 ± 2.4 -4.0 ± 5.9 -23.8 ± 2 .2
-10.5 4.2
-23.3"5.8 -15 .2 ± 4 .9
-5.7±2.7 -1 .9 ± 1 .2
+3.5 ± 4 .9
-33 .3 ± 5 .6 -28.4-!-10 .8
NF
+2 .7 ± 3 .2
NF
+13.3±3.4 -13.7 ± 16 .1
NF
NF
-13.4 ± 4 .3
+7 .9 ± 2 .7
+3 .0 ± 2 .1
-23 .8 ± 2.6 -10.1 ± 5 .3
Resultant shear stress differences in kPa between adjacent anterior sites for all steps in each session . Means ± SD are calculated at the time of the 1st pk and the2nd pk. A `+' indicates tension, a `—' compression, between sites . NF = nonfunctioning transducer.
ducer sites, not necessarily the magnitude of tension (orcompression) in the skin. Thus, the data suggest that hori-zontal tension occurred at the AD end of the residual limbin all sessions ; vertical tension occurred between sites onthe anterior surface in only a few selected cases.
Waveform ShapesPressures at different posterior sites were similar in
shape to each other, as noted in previous investigations (30).Though magnitudes at different sites varied, the waveformshapes when normalized were very similar (Figure 8a).The ratios between the pressures achieved at the 1st pk andthose at the 2nd pk were higher at the PF site than at the PDsite in three of the four sessions . Ratios at the PF sites were1 .23, 1 .09, 1 .73, and 1 .45, and ratios at the PD sites were1 .09, 1 .15, 1.12, and 1 .07 for sessions TW812, TW92,WP1024, and WP125, respectively. Except at the mostproximal site, pressure-time curves in the lateral regionwere also similar in shape to each other and were similar tothose at the posterior sites (Figure 8b) . RSs, however, didnot show consistently-shaped waveforms at sites within agroup. An example is shown in Figure 9.
At AM and AD sites, there were typically "loadingdelays" between heel contact and the time the interfacestresses began to increase (Figure 9) . This trend wasnoted previously at anterior sites on other subjects (15).Loading delays were typically less than 15 percent ofstance phase in duration and tended to occur only in theanterior region.
Temporal ChangesFor each subject, mean interface stresses in one session
were compared with those from the other session . For alltransducers that functioned properly in both sessions foreach subject, mean maximal stance phase pressures weresignificantly different at all sites except some mid-limb
sites for TW (ALM, AMM, and LM) and some mid-limband distal sites for WP (AMM, ALD, AMD, and PD;Figures 10a—d) . The significant differences in mean max-imal pressures in kPa for all steps between TW92 andTW812 were : ALD +69.8, AMD +83 .8, AMP +15 .1,LD + 100 .9, LP +7 .2, PD + 18 .4, PM + 15.1, and PF-9.0; the significant differences between WP125 andWP1024 were : ALM -55 .6, LD +10.7, LPD +9 .1, LM+8.1, LP -10.1, and PF -8 .0. For RS maxima, all sitesshowed significant differences between sessions for TWexcept PF; for WP, LD, PF, and PD locations were theonly sites that did not show significant differences . Thesignificant differences in mean maximal RS in kPa for allsteps between TW92 and TW812 were: ALD -11 .3,AMD +5 .0, ALM -2 .3, AMM -4.8, AMP +1 .0, LD-13.4, LM -1 .5, LP -1 .0, PD -16.2 . The mean maxi-mal RS differences between WP125 and WP1024 were:ALD -3.6, AMD -36.1, ALM +4 .8, AMM +8 .8, LPD+4.7, LM -3 .2, LP -2.2 . In addition, at the times of the1st pk and 2nd pk and the interval between them, RSs atALM, AMM, AMP, LM, and PF sites were more proxi-mally directed for TW92 than for TW812 (Figure 6a andb, and Figure 7a and b).
It is interesting to consider the trends in maximalinterface stress magnitudes for the two sessions . For TW,all distal pressures were significantly higher in sessionTW92 than in TW812, consistent with his complainingthat he was "bottoming out" during TW92 . In general,mean stance phase pressure maxima were higher, andmean RS maxima were lower in magnitude in TW92.
For WP, session differences occurred but trendswere not as consistent as in TW. Mean maximal pressuresin the lateral group at LM, LPD, and LD sites wereincreased (8, 9, and 11 kPa, respectively) for WP125compared with WP1024, and AM mean maximal RSswere increased (9 and 5 kPa at the AMM and ALM sites,
35
SANDERS et al . Interface Pressures and Shear Stresses
(a)
(b)
WP1024ANTERIOR
LATERALWP125LATERAL POSTERIORANTERIOR
(c)
(d)
TW812POSTERIOR
LATERA ANTERIOR
54(1)
TW92
LATERAL
ANTERIORPOSTERIOR
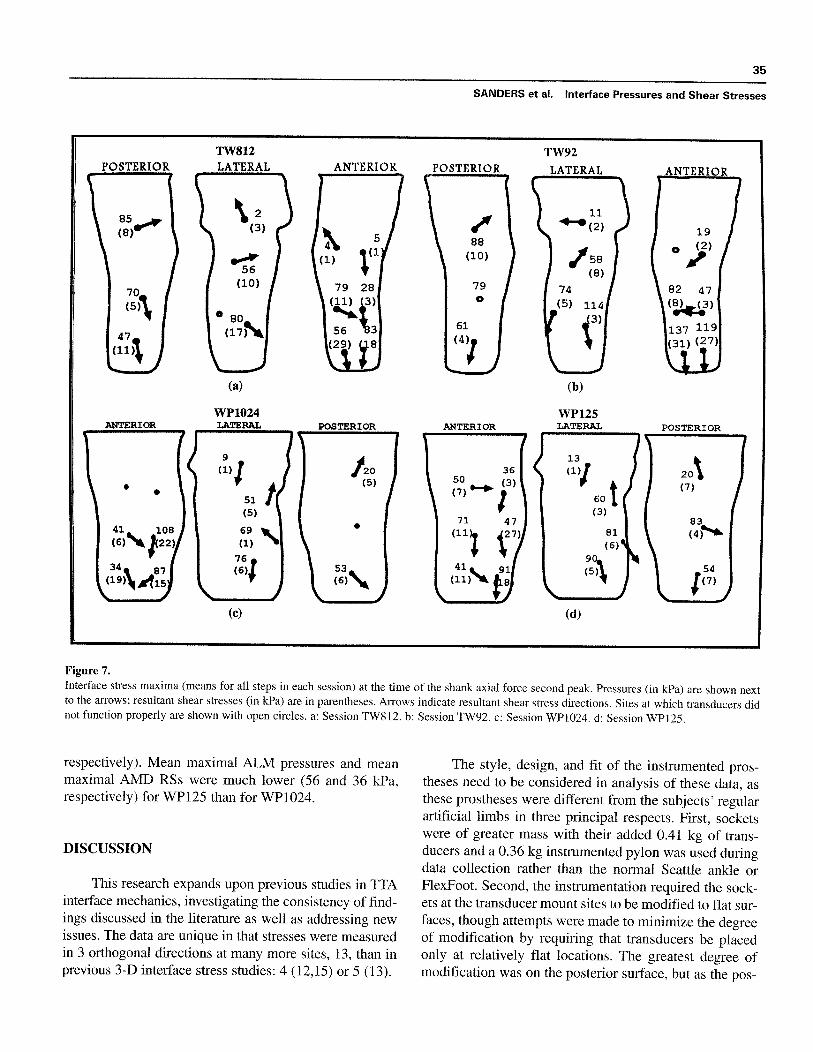
Figure 7.Interface stress maxima (means for all steps in each session) at the time of the shank axial force second peak . Pressures (in kPa) are shown nextto the arrows ; resultant shear stresses (in kPa) are in parentheses . Arrows indicate resultant shear stress directions . Sites at which transducers didnot function properly are shown with open circles . a : Session TW812 . b : Session TW92 . c : Session WP1024 . d: Session WP125.
respectively) . Mean maximal ALM pressures and meanmaximal AMD RSs were much lower (56 and 36 kPa,respectively) for WP125 than for WP1024.
DISCUSSION
This research expands upon previous studies in TTAinterface mechanics, investigating the consistency of find-ings discussed in the literature as well as addressing newissues . The data are unique in that stresses were measuredin 3 orthogonal directions at many more sites, 13, than inprevious 3-D interface stress studies : 4 (12,15) or 5 (13) .
The style, design, and fit of the instrumented pros-theses need to be considered in analysis of these data, asthese prostheses were different from the subjects' regularartificial limbs in three principal respects . First, socketswere of greater mass with their added 0 .41 kg of trans-ducers and a 0.36 kg instrumented pylon was used duringdata collection rather than the normal Seattle ankle orFlexFoot . Second, the instrumentation required the sock-ets at the transducer mount sites to be modified to flat sur-faces, though attempts were made to minimize the degreeof modification by requiring that transducers be placedonly at relatively flat locations . The greatest degree ofmodification was on the posterior surface, but as the pos-
36
Journal of Rehabilitation Research and Development Vol . 34 No . 1 1997
0
0 .2
0 .4
0 .6
0 .8
Fraction of Stance Phase
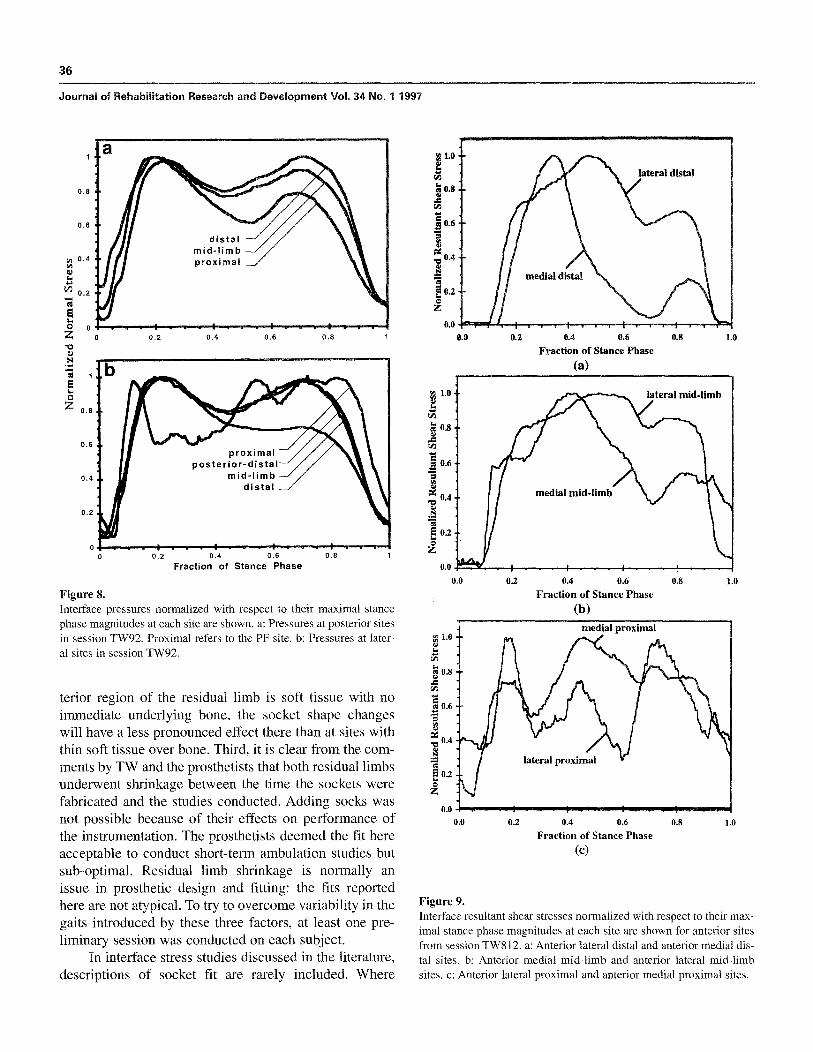
Figure 8.Interface pressures normalized with respect to their maximal stancephase magnitudes at each site are shown . a : Pressures at posterior sitesin session TW92. Proximal refers to the PF site. b : Pressures at later-al sites in session TW92.
tenor region of the residual limb is soft tissue with noimmediate underlying bone, the socket shape changeswill have a less pronounced effect there than at sites withthin soft tissue over bone . Third, it is clear from the com-ments by TW and the prosthetists that both residual limbsunderwent shrinkage between the time the sockets werefabricated and the studies conducted . Adding socks wasnot possible because of their effects on performance ofthe instrumentation . The prosthetists deemed the fit hereacceptable to conduct short-term ambulation studies butsub-optimal . Residual limb shrinkage is normally anissue in prosthetic design and fitting : the fits reportedhere are not atypical . To try to overcome variability in thegaits introduced by these three factors, at least one pre-liminary session was conducted on each subject.
In interface stress studies discussed in the literature,descriptions of socket fit are rarely included . Where
Figure 9.Interface resultant shear stresses normalized with respect to their max-imal stance phase magnitudes at each site are shown for anterior sitesfrom session TW812 . a : Anterior lateral distal and anterior medial dis-tal sites . b : Anterior medial mid-limb and anterior lateral mid-limbsites . c : Anterior lateral proximal and anterior medial proximal sites.
0.4
0.6Fraction of Stance Phase
a)
0 .2
0 .4
0 .6
0 .8
Fraction of Stance Phase(b)
0 .0 1 .0
1 .00.8
0 .4
0.6
Fraction of Stance Phase(C)
0.8 1 .0

37
SANDERS et al . Interface Pressures and Shear Stresses
Normal Stress : TW-92 vs . TW-812
Resultant Shear Stress : TW-92 vs . TW-812
(a)
Normal Stress : WP-125 vs. WP-1012
(b
Resultant Shear Stress : WP-125 vs . WP-1012
(c)
(d)
POSTERIOR
015 kPalower
18 kPahigher
POSTERIOR
LATERALLATERAL ANTERIOR
09 kPalower
1 kPalower
0
2kPa0 lower
13 kPalower
0
Figure 10.Peak stance phase interface stresses for different sessions are compared . A filled circle indicates a significantly higher stress ; an open circle indi-cates a significantly lower stress . NS = no significant difference . a: Pressures in session TW92 are compared with those in session TW812 . b:resultant shear stresses in session TW92 are compared with those in session TW812 . c : Pressures in session WP125 are compared with those insession WP1024 . d : resultant shear stresses in session WP125 are compared with those in session WP1024.
transducers were taped onto the residual limbs or sockets,no socket modification was necessary (4–9,14) ; presum-ably subjects used their regular acceptably fitting pros-theses . Winarski (11) explains that his subjects were inthe process of being fitted. Where transducers weremounted in new socket walls, Appoldt (1–3) andBielefeldt (10) state that the sockets were "well-fitting." Appoldt made duplicates of the subjects' regularsockets for use in his studies and Williams (13) made anew socket specifically for the study. Sanders (12,15)required new sockets slightly smaller than normal sinceno socks were worn in the studies.
It is important to recognize that some transducersdid not function properly in some sessions . The described
stress comparisons among sites hold for all collecteddata, but this limitation in completeness of the data setsmust be recognized.
Pressure and Shear Stress MagnitudesMaxima and Magnitudes at the First Peak and SecondPeak in the Shank Axial Force-time Curve
The maximal interface pressures and RSs at a siteare the greatest stresses to which the tissues are subjectedduring the stance phase of walking. Thus, with all otherfactors being equal, they are the stresses that pose thegreatest risk of damage to tissues at the transducer sitesduring ambulation. The finding in this study that AD orAM sites received greater stresses than those at the level

38
Journal of Rehabilitation Research and Development Vol. 34 No. 1 1997
of the tibial condyles is consistent with Pearson's resultson 10 subjects with TTA, using PTB prostheses at neutralalignment (8) . In our previous investigations, however,PM and LM sites experienced greater pressures and RSthan the AD (30) . It is expected that the high AD and AMpressures reported here are in part a reflection of residuallimb shrinkage . A loose socket tends to concentratestresses anterior distally.
Though the trends in the distribution of stresses atanterior sites here are similar to those reported inPearson's study, his interface pressure measurementswere of larger magnitude than those presented here or inprevious studies from our laboratory on other subjects(12) . Pearson reported that stance phase pressure maximaat the AD site averaged 289±194 kPa . At the lateral tib-ial condyle site, pressures averaged 122± 100 kPa ; at themedial tibial condyle site, they averaged 50±40 kPa (8).In our previous study, pressure maxima at AP sites rangedfrom 30.9 kPa to 103 .2 kPa while those at AD locationsranged from 53 .4 kPa to 139.5 kPa (12) . In the presentstudy, pressure maxima at AD and AM sites ranged from52.2 kPa to 223 .8 kPa while those at AP sites ranged from14.1 kPa to 54 .0 kPa . Though differences between thesestudies may have been due simply to subject differences(note that SD for pressure maxima in Pearson's studywere quite large), there are two other explanations to con-sider . First, Pearson measured specifically at sites expect-ed to be high load-bearing locations, not restricting trans-ducer location to flat sites as done here . Thus, the pres-sures may have simply been greater at those selectedsites . Second, he used KuliteTM disk-shaped sensors, 3 .18mm in diameter, 0 .76 mm thick, placed between the skinand liner, with the attached cables exiting at the socketbrim. As shown in a transducer evaluation study byPatterson (31) stiff sensors, even if very thin, tend to besusceptible to error when sandwiched at an interface (i .e .,when no recession is made for the transducer) . The sen-sor protrudes into the skin, tending to concentrate stress-es at its edge and distorting the uniformity of the stressdistribution on its surface . Thus, presence of the sensordistorts the measurement of interest . The stress distortionproblem tends to be worse (more error) at thin skin sitesover bone (e .g ., AD over the tibial flares) than at softunderlying tissue locations (e .g ., PM). Thus, Pearson'shigh pressures and large SDs may have been due, in part,to an instrumentation limitation.
Pressure and RS maxima reported here did not differsubstantially from our previous studies using a differentinterface/transducer configuration : holes cut in Pelite lin-
ers bonded to the inside socket surfaces, with Pelite disksattached to the ends of the transducers . Thus, skin-linerstresses were measured without socks (12,15) . In the pre-sent study, sock-socket interface stresses were measured;no liner was worn . A reduction of RS magnitudes wouldbe expected in this study because the coefficient of fric-tion between sock and transducer is lower than thatbetween skin and Pelite . In addition, the sock provides in-plane tension, reducing the tension in the skin . A converseargument, however, is that because there is no liner tohelp distribute the shear stresses, RSs are expected to behigher. Results show that RS magnitude with the Peliteconfiguration ranged from 5 .0 kPa to 40 .7 kPa (12) whilethose here ranged from 1 .5 kPa to 66 .1 kPa . Because theranges are similar, it is possible that these two factors didnot have significant effect or countered each other to pro-duce minimal net change ; alternatively, the differences insocket designs and quality of fit between the two groupsof subjects countered either or both effects.
Interface stresses at the 1st and 2nd pks provide asense of the distribution of stress at two points in time instance phase . Stresses were not at their maxima duringthe 1st pk, but were close, within 10 .5 percent at all sitesexcept the RS at the AMD site for WP 1024, which was50.2 percent lower. Thus, it should be recognized in pros-thetic FE analysis that modeling stresses at the time of the1st pk is not necessarily modeling the time of highestinterface stresses at all sites.
WP's medial-to-lateral shift of the site of peak pres-sure and RS on the anterior surface from the 1st pk to the2nd pk reflects his lateral thrust at mid-stance noted bythe prosthetists (Table 1) . This might also be indicative ofa loose socket, since stresses tended to be concentrateddistally on the lateral surface.
Timings of PeaksTimings of interface stress maxima are one of sever-
al factors important to residual limb tissue mechanics . Therelative magnitudes and directions of interface stressesaffect the pressure and shear stress gradients and tensionin the plane of the skin. High pressure and shear stressgradients and in-plane tension are expected to be moredamaging to skin than an equivalent force uniformly dis-tributed with no tension . The lack of simultaneous tim-ings of stance phase interface stress maxima at all sites inthe same step have been reported by Pearson (8) andSanders (15) ; however, because so few sites were moni-tored in those studies, few statements concerning stressdistributions could be made.
39
SANDERS et al . Interface Pressures and Shear Stresses
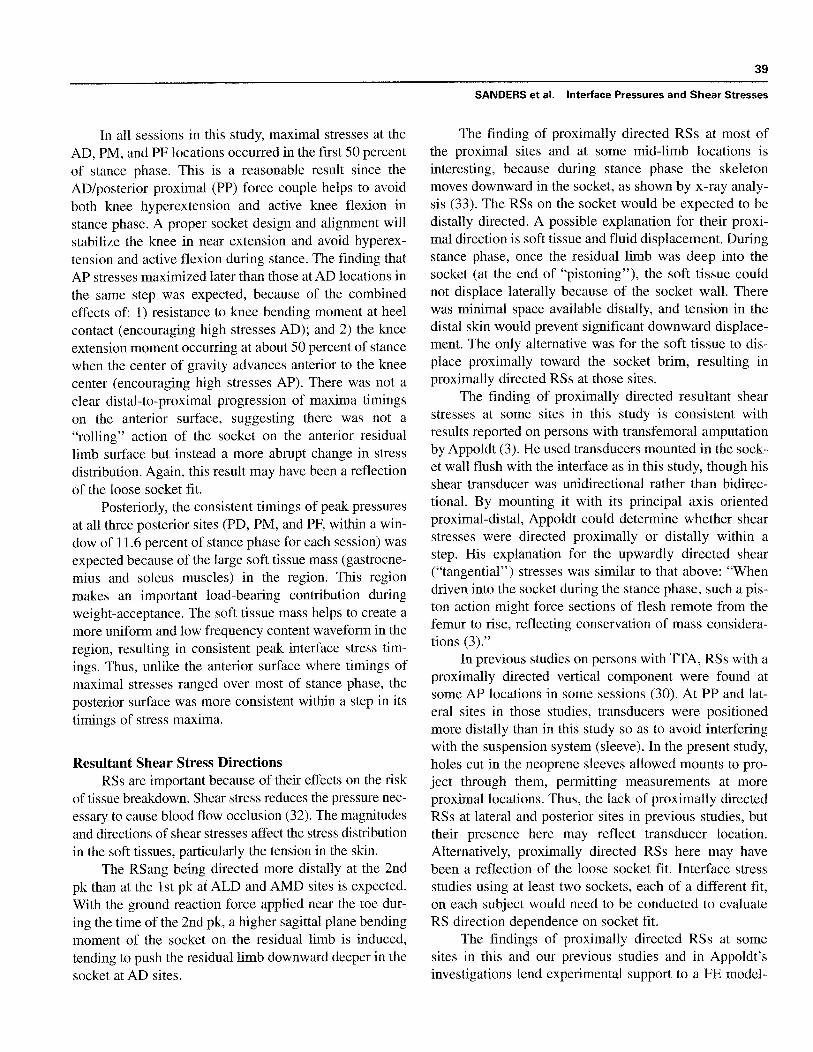
In all sessions in this study, maximal stresses at theAD, PM, and PF locations occurred in the first 50 percentof stance phase . This is a reasonable result since theAD/posterior proximal (PP) force couple helps to avoidboth knee hyperextension and active knee flexion instance phase . A proper socket design and alignment willstabilize the knee in near extension and avoid hyperex-tension and active flexion during stance. The finding thatAP stresses maximized later than those at AD locations inthe same step was expected, because of the combinedeffects of: 1) resistance to knee bending moment at heelcontact (encouraging high stresses AD) ; and 2) the kneeextension moment occurring at about 50 percent of stancewhen the center of gravity advances anterior to the kneecenter (encouraging high stresses AP) . There was not aclear distal-to-proximal progression of maxima timingson the anterior surface, suggesting there was not a"rolling" action of the socket on the anterior residuallimb surface but instead a more abrupt change in stressdistribution . Again, this result may have been a reflectionof the loose socket fit.
Posteriorly, the consistent timings of peak pressuresat all three posterior sites (PD, PM, and PF, within a win-dow of 11 .6 percent of stance phase for each session) wasexpected because of the large soft tissue mass (gastrocne-mius and soleus muscles) in the region . This regionmakes an important load-bearing contribution duringweight-acceptance. The soft tissue mass helps to create amore uniform and low frequency content waveform in theregion, resulting in consistent peak interface stress tim-ings. Thus, unlike the anterior surface where timings ofmaximal stresses ranged over most of stance phase, theposterior surface was more consistent within a step in itstimings of stress maxima.
Resultant Shear Stress DirectionsRSs are important because of their effects on the risk
of tissue breakdown. Shear stress reduces the pressure nec-essary to cause blood flow occlusion (32) . The magnitudesand directions of shear stresses affect the stress distributionin the soft tissues, particularly the tension in the skin.
The RSang being directed more distally at the 2ndpk than at the 1st pk at ALD and AMD sites is expected.With the ground reaction force applied near the toe dur-ing the time of the 2nd pk, a higher sagittal plane bendingmoment of the socket on the residual limb is induced,tending to push the residual limb downward deeper in thesocket at AD sites .
The finding of proximally directed RS s at most ofthe proximal sites and at some mid-limb locations isinteresting, because during stance phase the skeletonmoves downward in the socket, as shown by x-ray analy-sis (33) . The RSs on the socket would be expected to bedistally directed . A possible explanation for their proxi-mal direction is soft tissue and fluid displacement. Duringstance phase, once the residual limb was deep into thesocket (at the end of "pistoning"), the soft tissue couldnot displace laterally because of the socket wall. Therewas minimal space available distally, and tension in thedistal skin would prevent significant downward displace-ment . The only alternative was for the soft tissue to dis-place proximally toward the socket brim, resulting inproximally directed RSs at those sites.
The finding of proximally directed resultant shearstresses at some sites in this study is consistent withresults reported on persons with transfemoral amputationby Appoldt (3) . He used transducers mounted in the sock-et wall flush with the interface as in this study, though hisshear transducer was unidirectional rather than bidirec-tional . By mounting it with its principal axis orientedproximal-distal, Appoldt could determine whether shearstresses were directed proximally or distally within astep. His explanation for the upwardly directed shear("tangential") stresses was similar to that above : "Whendriven into the socket during the stance phase, such a pis-ton action might force sections of flesh remote from thefemur to rise, reflecting conservation of mass considera-tions (3) ."
In previous studies on persons with TTA, RSs with aproximally directed vertical component were found atsome AP locations in some sessions (30) . At PP and lat-eral sites in those studies, transducers were positionedmore distally than in this study so as to avoid interferingwith the suspension system (sleeve) . In the present study,holes cut in the neoprene sleeves allowed mounts to pro-ject through them, permitting measurements at moreproximal locations . Thus, the lack of proximally directedRSs at lateral and posterior sites in previous studies, buttheir presence here may reflect transducer location.Alternatively, proximally directed RSs here may havebeen a reflection of the loose socket fit . Interface stressstudies using at least two sockets, each of a different fit,on each subject would need to be conducted to evaluateRS direction dependence on socket fit.
The findings of proximally directed RSs at somesites in this and our previous studies and in Appoldt'sinvestigations lend experimental support to a FE model-

40
Journal of Rehabilitation Research and Development Vol . 34 No. 1 1997
ing issue raised by Vannah (34) on the resistance to exter-nal load offered by `narrow containment' of the soft tis-sue . Narrow containment occurs when a narrow layer ofsoft tissue is constrained between two similarly shaped,relatively rigid surfaces, as between the bone and socketin lower limb prostheses . The spacing between the sur-faces is narrow in relation to their overall dimensions . Ifthe tissue was assumed isotropic, incompressible, and lin-early elastic, FE analysis indicated that under compres-sion it "flows" out of the containment toward the freeedge—in the case of a prosthetic socket, toward the prox-imal brim—inducing shear stresses near the free edgedirected outward . This result is consistent with proximalRS directions measured in this study . The degree ofbulging and the magnitude of the reaction forces wereshown to be very sensitive to the Poisson's ratio used inthe FE model to control the near incompressibility of thesoft tissue . Vannah suggests that, in addition to theaccepted mechanisms of soft tissue compression anddirect load transfer to tolerant areas, the shear stressesresulting from near incompressibility may also contributeresistance to external loads.
In previous studies of subjects with TTA, interfaceRSs were directed toward the apex of the socket at mostof the anterior sites (12) . Data from three subjects showedhorizontal shear stresses (interface shear stress in a trans-verse plane) on the transducers at AD regions that tendedto be so directed . This result was a reasonable finding,since the tibia was forced into the apex during most ofstance phase by the AP force applied at the base of thesocket (measured by an instrumented pylon) . Thus, thesocket was forced posteriorly relative to the residual limb;this is likely to put the skin over the crest of the tibia intension (in the plane of the skin).
At AD locations in this study, consistent with previ-ous findings, the differences in RSs across the tibial crestsuggest that skin tension was induced between AMD andALD sites . Skin tension is important because of its role inskin breakdown, particularly when skin mobility isdiminished by scars or grafts . Shear stresses in oppositedirections at sites less than 5 cm apart have also beenreported by Appoldt (3) and their potential importance totension in the flesh and pain identified. Tension will stressthe fibrous components of the dermis as well as intercel-lular connections in the epidermis . Tibial extension con-tributes toward AD skin tension by moving the distal tibiaanteriorly relative to the socket. The proximal tibia, how-ever, is much closer to the center of rotation at the knee;thus, tibial extension contributes relatively little to thrust-
ing the tibia anteriorly at AP locations . This may help toexplain why tension was consistently observed at all ADsites but not at all AP ones.
Calculations of differences in vertical shear stressesbetween adjacent sites in this study suggest in-plane com-pression, as opposed to in-plane tension, was induced inthe proximal-distal direction at most anterior sites . In-plane compression, unless pinching occurs, is not partic-ularly threatening to the skin . However, for anteriorregions that did show tension in the vertical direction (apositive difference in vertical shear stress), as well as inthe horizontal direction (a positive difference in horizon-tal shear stress) within a local region, biaxial loading,which is a threatening skin loading configuration, isinduced. Skin under tension will absorb less energy inthat direction before failure if there is tension in theorthogonal direction in the plane of the skin. Carefullyconducted biaxial loading studies on excised rat skin byLanir (35) demonstrated this result . The biaxial loadingcondition noted here in some sessions may have been dueto an improper socket fit occurring as a result of residuallimb shrinkage . A well-controlled study investigatingsocket shape change effects on interface stresses wouldneed to be conducted to evaluate effects of fit on interfacestress distributions and the occurrence of in-plane biaxialloading.
Waveform ShapesThe shapes of interface stress waveforms can have
important implications for dynamic analysis of the resid-ual limb and socket, particularly FE modeling . Waveformshape results may provide some insight into assumptionsregarding FE model material property specifications.Assumptions that reduce the complexity of the models,and thus computational requirements, without sacrificingquality are important to identify . Posterior interface pres-sure waveforms at different locations during the samestep tended to be of similar shape (though not necessari-ly of similar magnitude) . Similarly, pressure-time wave-forms in the lateral group (except at the LP site) tended tobe similar in shape to each other. Anterior group RS-timeplots, however, differed substantially from each other.The anterior surface has a relatively thin soft tissue layerover the bone, making local interface stress results high-ly sensitive to the geometries, differences between thebone and the socket, and alignment of the bone relative tothe socket, while the posterior and lateral regions havethicker soft tissue layers over bone, making local inter-face stress results less sensitive to these features . Thus,
41
SANDERS et al . Interface Pressures and Shear Stresses
FE model specifications on the anterior surface, particu-larly the geometries of the socket and bone, will likelyneed to be more accurately specified than those on theposterior and lateral surfaces.
Temporal ChangesTemporal interface stress changes are important
because they affect the consistency of fit of the prosthe-sis . Consistent with previous findings (2,30), results hereindicate that substantial changes in stresses occurredfrom one session to the next, provided sessions weremore than a few days apart. Appoldt explains that forshort leg-off times (on the order of a few minutes), nosignificant change in walking pressure was obtained as aspecific function of the donning-doffing process (2) . Ourunpublished results from previous investigations suggestthe same; sometimes the leg needed to be removed forshort times to adjust the instrumentation, and we foundno significant differences in steps before or after theinterruption . In both studies, each subject used the sameprosthesis with the same number of socks and same align-ment in the different sessions for which the differentstress magnitudes occurred . Thus, differences betweensessions were not due to prosthesis modifications . Bothinvestigators suggested residual limb volume changeswere principal reasons for interface stress magnitudechanges between sessions (2,30). Gait kinematics mayalso have changed.
It should be noted, however, that some investigatorsfound substantial pressure changes from different trialsconducted less than a few days apart (6), citing repro-ducibility as a problem in achieving consistent measure-ments, though it is not clear whether comparisons werefrom steps conducted minutes or hours apart. Theresearchers state that "the exact location of the stump inthe socket varies slightly each time the limb is put on" andoffer this as a principal reason for the lack of consistency.They also cite variations in gait, variations in the compo-sition of the residual limb, and the type of suspension assources of temporal variations . We expect that becausethese investigators taped transducers to the skin ratherthan mounting them to the socket wall, an importantsource of variability was instrumentation-related . Thehigh sensitivity of measurements to positioning when norecession is made to accommodate the stiff transducer hasbeen demonstrated and discussed above (31) . We expect inthe present study that residual limb geometry, materialproperty changes, and possibly gait kinematics were theprincipal sources of the temporal changes for sessions
conducted more than a few days apart.Prosthetic socket design and alignment must accom-
modate differences in residual limb shape and materialproperties as well as changes in gait kinematics, a conceptthat is recognized clinically and is a feature that stronglycontributes to the complexity of prosthetic design. Addingor removing socks and using flexible sockets are twomeans used clinically to try to reduce the detrimentaleffects of residual limb changes on socket comfort and fit.In the results presented here, these accommodations werenot made, but instead, the same socket and same numberof socks used in different sessions and the interface stressdifferences between sessions were compared . In both sub-jects, there was a mild trend of increased pressure coupledwith decreased RS. This is a reasonable finding in that if asocket provided substantial pressure support, it wouldincrease the total contact surface area and reduce the RS.This concept has been suggested in FE analysis conduct-ed by Reynolds (21).
CONCLUSIONS
Principal conclusions from this study investigatinginterface pressures and shear stresses at 13 sites on twosubjects with TTA are summarized below:
1. For both pressure and RS, anterior sites (distal ormid-limb) were the dominantly loaded of all sitestested. Lowest pressures and RSs were typically atLP sites.
2. AD pressures and RSs were consistently higher thanthose at AP, and the timings of maximal pressures atAD sites were significantly earlier than those at theAP sites in the same session.
3. LD pressures were typically higher than PF pres-sures . LP, LM, and LD RS maxima were typically oflower magnitude than those at the PF site.
4. In each session, mean time percentages into stancephase of pressure maxima for all posterior siteswere within 11.6 percent of stance phase of eachother.
5. Within a session, the sites of highest pressure andRS at the 1st pk were the same sites that experiencedmaximal pressures and RSs independent of stancephase time . Pressures and RSs at the 1st pk werewithin 10 .6 percent of the maximal pressures andRSs independent of time except RS at the AMD sitein one session (WP1024) .

42
Journal of Rehabilitation Research and Development Vol . 34 No . 1 1997
6. RSs at ALD, AMD, LD, and PD sites were directedmore distally than proximally (i .e ., 0° < RSang <180°) . RS at LM, PF, and some LP sites were direct-ed more proximally than distally (i .e ., 180° < RSang< 360°).
7. Differences in horizontal shear stress between ALDand AMD sites were always greater than zero, indi-cating skin tension across the tibial crest at ADlocations . Differences in vertical shear stressbetween adjacent sites on the anterior surface weretypically less than zero, reflecting in-plane com-pression in the skin in a proximal-distal direction;they were greater than zero in only a few selectedcases.
8. Pressure-time curves were typically similar to eachother in the posterior group, though their magni-tudes were different . RS-time curves in the anteriorgroup were typically not similar in shape to eachother.
9. Differences in stress magnitudes between sessionsconducted on the same subject (sessions more than20 days apart) were apparent. In both subjects, therewas a trend of increased pressure coupled withdecreased RSs.
ACKNOWLEDGMENTS
Assistance in data collection, processing, and presentationby Russell Reed, David Berglund, Glenn Hwaung, and SantoshZachariah is gratefully acknowledged.
REFERENCES
1. Appoldt FA, Bennett L . A preliminary report on dynamic sock-et pressures . Bull Prosthet Res 1967 :10-8 :20-55.
2. Appoldt FA, Bennett L, Contini R. Stump-socket pressure inlower extremity prostheses . J Biomech 1968 :1 :247-57.
3. Appoldt FA, Bennett L, Contini R . Tangential pressure measure-ment in above-knee suction sockets . Bull Prosthet Res 1970 :10-
13 :70-86.4. Leavitt LA, Peterson CR, Canzoneri J, Paz R, Muilenburg AL,
Rhyne VT. Quantitative method to measure the relationshipbetween prosthetic gait and the forces produced at the stump-socket interface . Am J Phys Med 1970:49(3) :192-203.
5. Sonck WA, Cockrell JL, Koepke GH . Effect of liner materialson interface pressures in below-knee prostheses . Arch PhysMed Rehabil 1970 :51 :666-9.
6. Rae JW, Cockrell JL . Interface pressure and stress distributionin prosthetic fitting . Bull Prosthet Res 1971 :10-15 :64-111.
7. Leavitt LA, Zuniga EN, Calvert JC, Canzoneri J, Peterson CR .
Gait analysis and tissue-socket interface pressures in above-knee amputees. Southern Med J 1972 :65(10) :1197-207.
8. Pearson JR, Holmgren G, March L, Oberg K. Pressures in crit-ical regions of the below-knee patellar-tendon-bearing prosthe-sis . Bull Prosthet Res 1973 :10-19 :52-76.
9. Pearson JR, Grevsten S, Almby B, Marsh L. Pressure variationin the below-knee patellar tendon bearing suction socket pros-thesis . J Biomech 1974 :7 :487-96.
10. Bielefeldt A, Schreck HJ . The altered alignment influence onabove-knee prosthesis socket pressure distribution. Int SerBiomech 1979 :3(A) :387-93.
11. Winarski DJ, Pearson JR . Least-squares matrix correlationsbetween stump stresses and prosthesis loads for below-kneeamputees . J Biomech Eng 1987 :109 :238-46.
12. Sanders JE, Daly CH, Burgess EM . Interface shear stresses dur-ing ambulation with a below-knee prosthetic limb . J Rehabil
Res Dev 1992 :29(4) :1-8.13. Williams RB, Porter D, Roberts VC, Regan JF. Triaxial force
transducer for investigating stresses at the stump/socket inter-face . Med Biol Eng Comput 1992 :30 :89-96.
14. Engsberg JR, Springer MJ, Harder JA. Quantifying interfacepressures in below-knee amputee sockets . J Assoc ChildProsthet Orthot Clin 1992 :27(3) :81-8.
15. Sanders JE, Daly CH, Burgess EM . Clinical measurement ofnormal and shear stresses on a transtibial residual limb : charac-
teristics of waveform shapes during walking . Prosthet OrthotInt 1993 :17(1) :38-48.
16. Steege JW, Childress DS . Finite element prediction of pressure atthe below-knee socket interface . In : Report of ISPO Workshop onCAD/CAM in Prosthetics and Orthotics, Seattle, WA, 1988 :71-82.
17. Silver-Thorn MB . Prediction and experimental verification ofresidual limb/prosthetic socket interface pressures for below-knee amputees (Dissertation) . Evanston, IL : Northwestern
University, 1991.18. Brennan JM, Childress DS . Finite element and experimental
investigation of above-knee amputee limb/prosthesis systems : a
comparative study. Adv Bioeng, ASME WAM, 1991 :BED-20 :547-50.
19. Sanders JE, Daly CH . Normal and shear stresses on a residuallimb in a prosthetic socket during ambulation : comparison offinite element results with experimental measurements . JRehabil Res Dev 1993 :30(2) :191-204.
20. Quesada P, Skinner HB . Analysis of a below-knee patellar ten-
don-bearing prosthesis : a finite element study. J Rehabil Res
Dev 1991 :28(3) :1-12.21. Reynolds DP, Lord M . Interface load analysis for computer-
aided design of below-knee prosthetic sockets . Med Biol EngComput 1992 :30 :419-26.
22. Zhang M, Lord M, Turner-Smith AR, Roberts VC . Developmentof a non-linear finite element modelling of the below-knee pros-thetic socket interface. Med Eng Phys 1995 :17(8) :559-66.
23. Steege JW, Childress DS . Analysis of trans-tibial prosthetic gaitusing the finite element technique . In : Proceedings of the 21stAnnual Meeting and Scientific Symposium AAOP, NewOrleans, 1995 :13-4.
24. Radcliffe CW, Foort J . The patellar-tendon-bearing below-kneeprosthesis . Biomechanics Laboratory, University of California,Berkeley, 1961 .

SANDERS et al .
Interface Pressures and Shear Stresses
25 . Sanders JE, Daly CH. Measurement of stresses in three orthog- 31 . Patterson RP, Fisher SV. The accuracy of electrical transducers
onal directions at the residual limblprosthetic socket interface.IEEE Trans Rehabil Eng 1993 :1(2) :79-85 .
for the measurement of pressure applied to the skin . IEEE TransBiomed Eng 1979 :26 :450-6.
26 . Sanders JE, Smith LM, Spelman FA . A small and lightweight 32 . Bennett L, Kavner D, Lee BK, Trainor FA . Shear vs pressure as
three-channel signal-conditioning unit for strain-gage transduc-ers . J Rehabil Res Dev 1995 :32(3) :210-3 .
causative factors in skin blood flow occlusion. Arch Phys MedRehabil 1979 :60 :309-14.
27 . Appoldt FA, Bennett L, Contini R. Socket pressure as a func- 33 . Burgess EM, Moore AJ . A study of interface pressures in the
tion of pressure transducer protrusion . Bull Prosthet Res
1969 :10-11 :236-49 .
below-knee prosthesis (physiological suspension : an interimreport) . Bull Prosthet Res, Fall 1977 :10-28 :58-70.
28 . Sanders JE, Daly CH, Cummings WR, Reed RD, Marks RJ II . 34 . Vannah WM . Indentor tests and finite element modelling of
A measurement device to assist amputee prosthetic fitting . J
Clin Eng 1994:19(1) :63-71 .
bulk muscular tissue in vivo (Dissertation) . Evanston, IL:Northwestern University, 1990
29 . Technical Committee 168, International Organization for 35 . Lanir Y, Fung YC. Two-dimensional mechanical properties of
30 .
Standardization (ISO) . Prosthetics : structural testing of lowerlimb prostheses, 1994.Sanders JE. Ambulation with a prosthetic limb : mechanical
rabbit skin : II. experimental results . J Biomech 1974:7 :171-82.
stresses in amputated limb tissues (Dissertation) . Seattle, WA:
University of Washington, 1991 .