Embed Size (px)
Citation preview
Comprehensive Summaries of Uppsala Dissertationsfrom the Faculty of Science and Technology 1033
Interface Defeat and Penetration:Two Modes of Interaction
between Metallic Projectiles andCeramic Targets
BY
PATRIK LUNDBERG
ACTA UNIVERSITATIS UPSALIENSISUPPSALA 2004
53 p
PREFACEThis work was carried out at the Swedish Defence Research Agency FOI (former FOA), Weapons and Protection Division, as part of the research on long-rod projectiles and armour. The work was funded by the Swedish Armed Forces (Paper IV was also supported by the Army Research Labora-tory (USA) through US Naval Regional Contracting Centre).
I would like to express my gratitude to Bengt Lundberg, Professor of Solid Mechanics at Uppsala University and Associated Director of Research at FOI, for his guidance during the course of this work, and to René Ren-ström and Lars Westerling for their will to share their knowledge at any time. Special thanks are due to Lars Holmberg, who has supported me since the first day we met. I would also like to thank those who have assisted me in the laboratory, in particular Olof Andersson, Bengt Carlsson, Urban Hjelm, Jonas Irwing, Bruno Nilsson and Melker Skoglund.
Finally, I would like to thank my family: my wife Karin and my sons Martin, Jonas and Emil, who managed to cope with me during this period.
October 2004
Patrik Lundberg

LIST OF PAPERS This thesis comprises a survey of the following papers:
I. P. Lundberg, L. Westerling and B. Lundberg, Influence of scale on the penetration of tungsten rods into steel-backed alumina targets. Int. J. Impact Engng 18(4), 403–416 (1996).
II. P. Lundberg, R. Renström and B. Lundberg, Impact of metallic projec-tiles on ceramic targets: transition between interface defeat and penetra-tion. Int. J. Impact Engng 24, 259–275 (2000).
III. L. Westerling, P. Lundberg and B. Lundberg, Tungsten long rod pene-tration into confined cylinders of boron carbide at and above ordnance velocities. Int. J. Impact Engng 25, 703-714 (2001).
IV. P. Lundberg, B. Lundberg, Transition between interface defeat and penetration for tungsten projectiles and four silicon carbide materials. Int. J. Impact Engng (in press).
V. P. Lundberg, R. Renström, B. Lundberg, Impact of conical tungsten projectiles on flat silicon carbide targets: transition from interface defeat to penetration. Int. J. Impact Engng (submitted).
The author’s main contributions to these papers are as follows:
I. Planning, major part of experimental work and evaluation, part of writ-ing.
II. Planning, major part of experimental work and evaluation, part of writ-ing.
III. Planning, major part of experimental work, evaluation and writing. IV. Planning, major part of experimental work, evaluation and writing. V. Planning, major part of experimental work, modelling, evaluation and
writing.

CONTENTS
1. INTRODUCTION ......................................................................................9
2. METHODS AND MATERIALS..............................................................132.1. Experimental techniques ...................................................................132.2. Determination of velocities ...............................................................152.3. Projectile and target materials ...........................................................182.4. Modelling and analyses .....................................................................20
3. TRANSITION VELOCITY VERSUS MATERIAL PROPERTIES .......273.1. Experimental details ..........................................................................273.2. Yield strength of target material........................................................283.3. Fracture toughness of target material ................................................313.4. Influence of confinement...................................................................323.5. Density of projectile material ............................................................333.6. Discussion .........................................................................................34
4. TRANSITION VELOCITY VERSUS PROJECTILE GEOMETRY ......374.1. Experimental details ..........................................................................384.2. Results ...............................................................................................384.3. Discussion .........................................................................................41
5. INFLUENCE OF SCALE ON PENETRATION .....................................435.1. Replica scaling ..................................................................................435.2. Experimental details ..........................................................................455.3. Results ...............................................................................................465.4. Discussion .........................................................................................48
6. CONCLUSIONS.......................................................................................49
REFERENCES .............................................................................................51
NOTATION
a radius of original projectile at target surface E elastic modulus H Vickers hardness K bulk modulus
IcK fracture toughness L length P penetration p surface pressure
0p maximum surface pressure *0p maximum surface pressure at transition
r radius t time u penetration velocity
0v impact velocity IY0v critical velocity related to incipient plastic yield FY0v critical velocity related to full plastic yield ID0v critical velocity related to incipient damage FD0v critical velocity related to full damage SF0v critical velocity related to surface failure *0v transition velocity Poisson’s ratio cone angle density
Y yield strength Y shear yield strength
Subscriptsc ceramic f final p projectile t target
INTERFACE DEFEAT AND PENETRATION 9
1. INTRODUCTION Long-rod projectiles made of tungsten heavy alloys (WHA) or depleted ura-nium (DU) constitute a major threat against the next generation of modern fighting vehicles. Since the weight and space are highly constrained for these vehicles, highly weight-efficient armour solutions must be used to protect against long-rod projectiles. The introduction of sensor-activated armour systems in combination with non-homogenous base armour designs like layered and spaced armours, and the use of new light armour materials, open for such development.
Ceramics constitute an important group of light armour materials. They exhibit some of the highest strengths measured for engineering materials. Strong directional bonds and an inherent resistance to dislocation movement result in an intrinsic strength which is an appreciable fraction of the theoreti-cal strength [1, 2]. The high strengths of ceramics in combination with their low densities enable the design of weight-efficient armour systems with high protection capability against long-rod projectiles.
The penetration process of long-rod projectiles in ceramics has been stud-ied extensively over the last decade, both at ordnance impact velocities using the direct impact technique, e.g. [3-7], and at higher impact velocities by Subramanian et al. [8] and later by Orphal el al. [9-12] using the reverse impact technique. A compilation of some current research as well as earlier work is given in [13].
A major drawback of ceramics as armour materials is their brittle behav-iour, which is due to their inability to accommodate plastic strains. This brit-tleness facilitates nucleation, propagation and coalescence of micro-cracks and may lead to a heavily damaged and comminuted material in front of a penetrating projectile. A phenomenological description of the fracturing process due to impact and penetration is given by Shockey et al. [14].
In order to suppress damage, different devices for load distribution and at-tenuation, including shrink-fitted or hot-pressed confinements, have been tested. In this way it has been possible to design thick ceramic armour sys-tems capable of defeating long-rod projectiles on the surface of the ceramic. This capability, named interface defeat, signifies that the projectile material is forced to flow radially outwards on the surface of the ceramic material without penetrating significantly. This phenomenon was systematically stud-ied and first reported by Hauver el al. [15, 16] and later by Rapacki et al.[17].
10 PATRIK LUNDBERG
Different matters concerning interface defeat have been dealt with in sub-sequent studies. Thus, e.g. Lundberg et al. [18] studied the possibility to maintain interface defeat for longer interaction times. LaSalvia et al. [19] developed a micro-mechanical model in order to predict the influence of ceramic microstructure on the performance of the ceramic material with respect to interface defeat, and Holmquist and Johnson modelled the target response during interface defeat and penetration, including effects of con-finement and pre-stress [20-22].
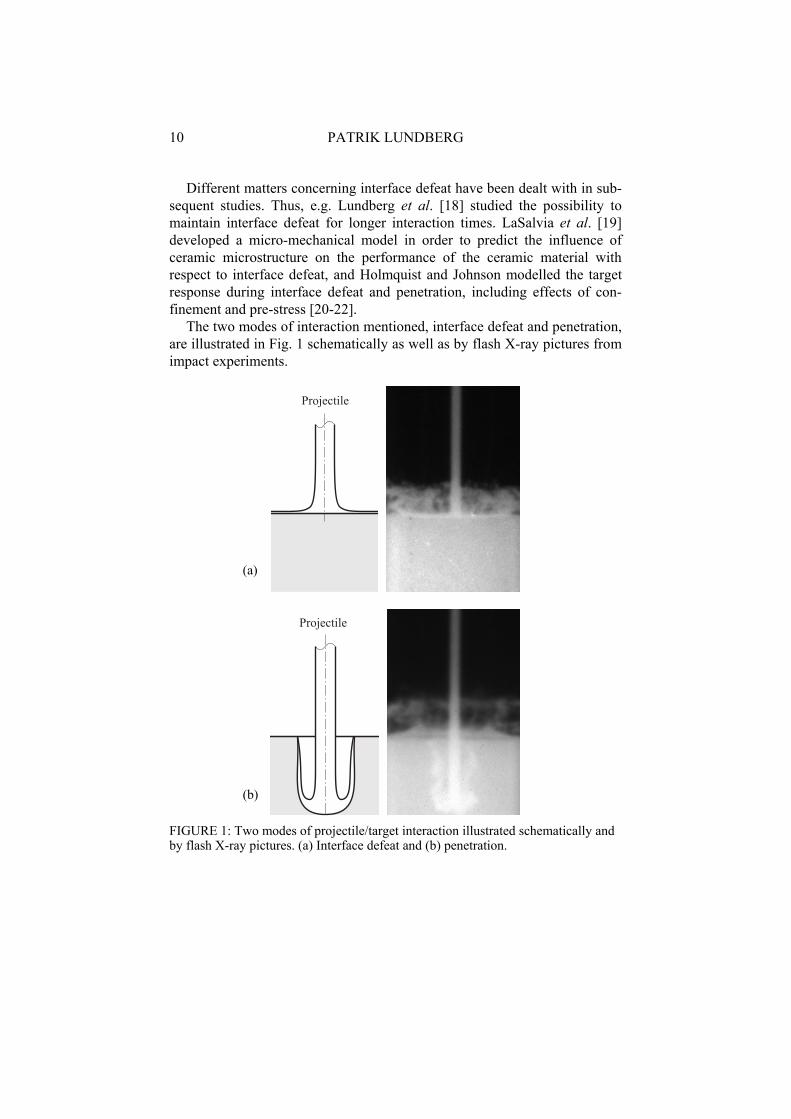
The two modes of interaction mentioned, interface defeat and penetration, are illustrated in Fig. 1 schematically as well as by flash X-ray pictures from impact experiments.
Projectile
Projectile
FIGURE 1: Two modes of projectile/target interaction illustrated schematically and by flash X-ray pictures. (a) Interface defeat and (b) penetration.
(a)
(b)
INTERFACE DEFEAT AND PENETRATION 11
An important quantity for designers of armours and producers of ceramic materials is the transition velocity, defined as the impact velocity at which interface defeat no longer can be maintained and penetration starts. Below this velocity, the ceramic behaves as extremely strong (with high protection capability against long-rod projectiles), while above it behaves as signifi-cantly weakened. It is believed that this transition is related to the collapse of a damage domain in the ceramic material in front of the projectile. This col-lapse occurs when the surface pressure generated by the projectile exceeds a critical value. Evidence of a damage domain has been found by examining impacted targets from interface defeat experiments [16].
The aim of this work was (i) to estimate the transition velocity at normal impact for different combinations of projectiles and ceramic targets and (ii) to identify critical velocities which may serve as upper and lower bounds to the transition velocity, especially those related to the material properties of the projectile and the target. The aim was also (iii) to assess the applicability of replica scaling to the interaction of projectiles and ceramic targets. The results should be of use to the development of weight-efficient armour sys-tems.
In Papers II and III, the transition velocity was studied for different types of ceramic materials (boron carbide, silicon carbide, titanium diboride and Syndie) and in Paper IV it was estimated for one type of ceramic material (four grades of silicon carbide).
As the surface pressure generated by the projectile under conditions of in-terface defeat depends on the density, the strength and the velocity of the projectile [23] as well as on its shape, it can be expected that for a given target, the transition velocities will be different for projectiles made of dif-ferent materials or having different geometries. Therefore, the influence of the properties of the projectile on the transition velocity was examined in Papers II and V. In Paper II, use was made of two different projectile mate-rials, a tungsten heavy alloy and molybdenum, with large difference in den-sity. In Paper V, the transition velocity was estimated for a conical projectile and compared with that for a cylindrical projectile.
In order to model the transition from interface defeat to penetration it is necessary to determine the surface pressure generated by the flowing projec-tile material and the resulting target response. In Paper II, the influence of the strength of the ceramic material on the transition velocity was studied using two models, viz., one for the surface pressure during interface defeat and one for the yield conditions in the ceramic material.
For more detailed modelling of the ceramic material with regard to inter-face defeat and penetration, the constitutive model used must be able to han-dle both the initially intact material and the highly damaged material that will develop during the interaction with the projectile. Several such models exist, e.g. [24-27], and in this work the constitutive models JH1 and JH2 by Johnson and Holmquist [24, 26] were used to model the response of the ce-
12 PATRIK LUNDBERG
ramic material. JH1 was used in Paper V under assumed conditions of inter-face defeat and JH2 was used in Papers I and III to model penetration.
In Papers I-V, the penetration process was studied by means of flash X-ray technique. This technique makes it possible to follow the course of events in detail and therefore provides a more fundamental link between experiments and model than, e.g. depth-of-penetration (DoP) tests [28]. Be-cause of limitations of the amount of target material that can be penetrated by the X-rays, the impact experiments were performed in a reduced scale. Scaling laws like replica scaling are therefore essential when test results from small-scale experiments are to be applied in larger scale. Replica scal-ing signifies that the geometrical dimensions are scaled uniformly, while the materials and the impact velocities are kept the same.
The validity of replica scaling has been investigated experimentally by several authors. It has been questioned by some authors, e.g. [29, 30], but supported by others, e.g. [31, 32]. Also Paper I, which deals with scaling of long rod-projectile penetration into ceramic targets, supports the validity of replica scaling. In this paper use was made of tungsten projectiles and un-confined alumina targets.
In Section 2, the experimental methods and modelling tools used in Pa-pers I-V are briefly presented, and short accounts are given for the target and projectile materials. In Sections 3 to 5, Papers I-V are summarised. Finally, conclusions are presented in Section 6.
INTERFACE DEFEAT AND PENETRATION 13
2. METHODS AND MATERIALS
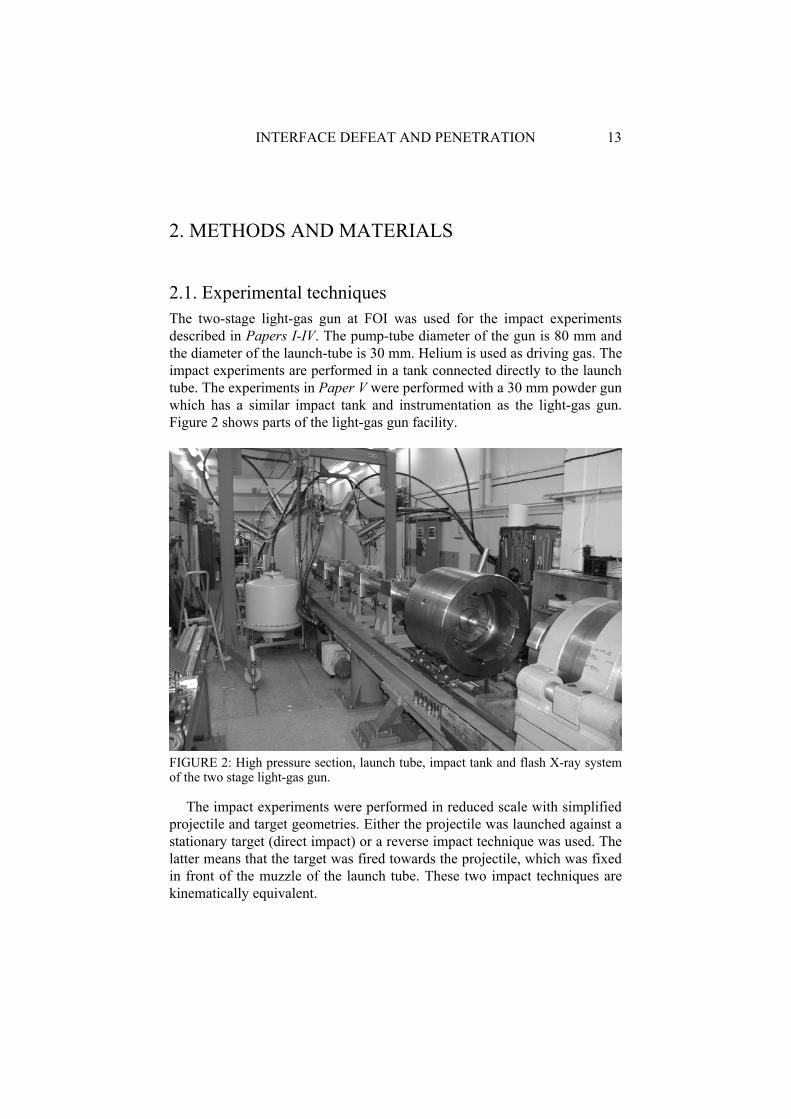
2.1. Experimental techniques The two-stage light-gas gun at FOI was used for the impact experiments described in Papers I-IV. The pump-tube diameter of the gun is 80 mm and the diameter of the launch-tube is 30 mm. Helium is used as driving gas. The impact experiments are performed in a tank connected directly to the launch tube. The experiments in Paper V were performed with a 30 mm powder gun which has a similar impact tank and instrumentation as the light-gas gun. Figure 2 shows parts of the light-gas gun facility.
FIGURE 2: High pressure section, launch tube, impact tank and flash X-ray system of the two stage light-gas gun.
The impact experiments were performed in reduced scale with simplified projectile and target geometries. Either the projectile was launched against a stationary target (direct impact) or a reverse impact technique was used. The latter means that the target was fired towards the projectile, which was fixed in front of the muzzle of the launch tube. These two impact techniques are kinematically equivalent.
14 PATRIK LUNDBERG
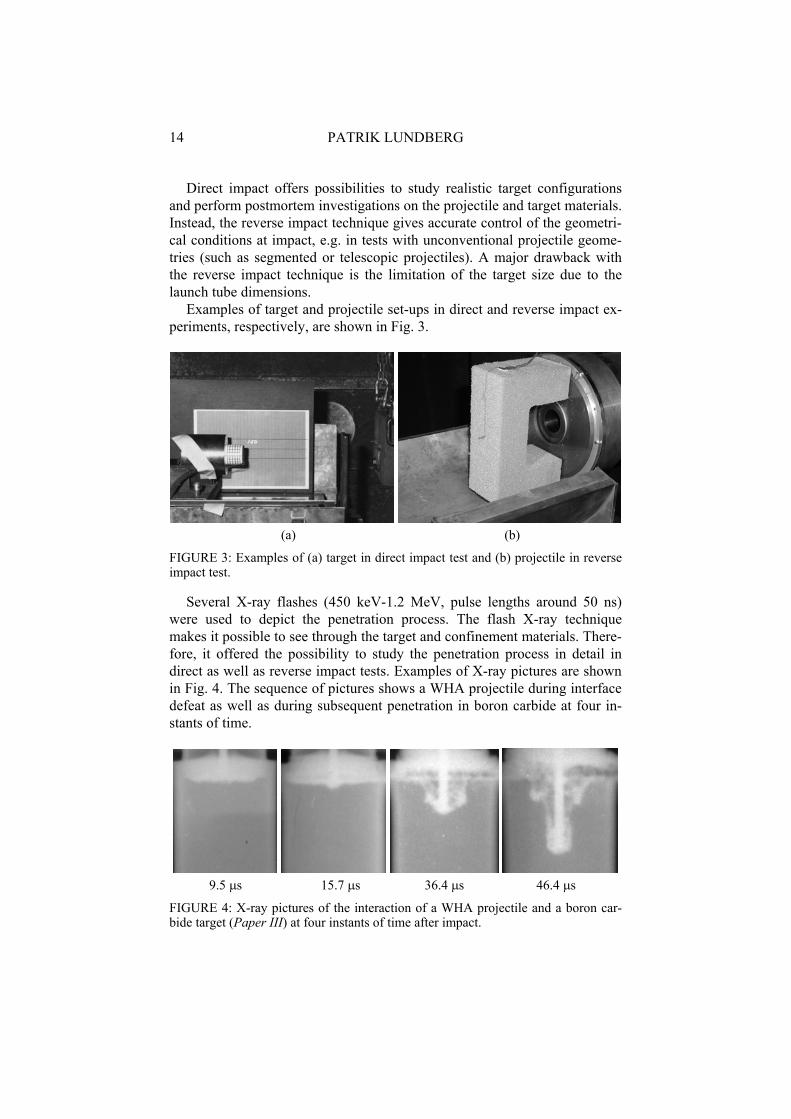
Direct impact offers possibilities to study realistic target configurations and perform postmortem investigations on the projectile and target materials. Instead, the reverse impact technique gives accurate control of the geometri-cal conditions at impact, e.g. in tests with unconventional projectile geome-tries (such as segmented or telescopic projectiles). A major drawback with the reverse impact technique is the limitation of the target size due to the launch tube dimensions.
Examples of target and projectile set-ups in direct and reverse impact ex-periments, respectively, are shown in Fig. 3.
(a) (b)
FIGURE 3: Examples of (a) target in direct impact test and (b) projectile in reverse impact test.
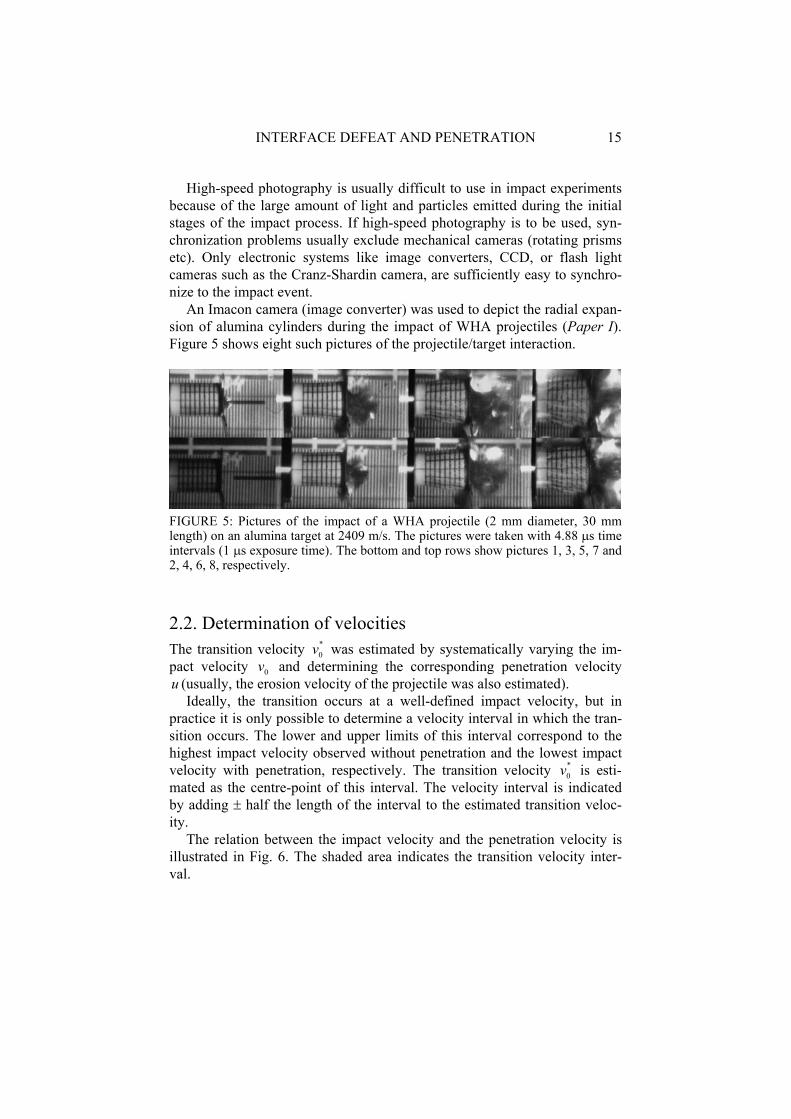
Several X-ray flashes (450 keV-1.2 MeV, pulse lengths around 50 ns) were used to depict the penetration process. The flash X-ray technique makes it possible to see through the target and confinement materials. There-fore, it offered the possibility to study the penetration process in detail in direct as well as reverse impact tests. Examples of X-ray pictures are shown in Fig. 4. The sequence of pictures shows a WHA projectile during interface defeat as well as during subsequent penetration in boron carbide at four in-stants of time.
9.5 s 15.7 s 36.4 s 46.4 s
FIGURE 4: X-ray pictures of the interaction of a WHA projectile and a boron car-bide target (Paper III) at four instants of time after impact.
INTERFACE DEFEAT AND PENETRATION 15
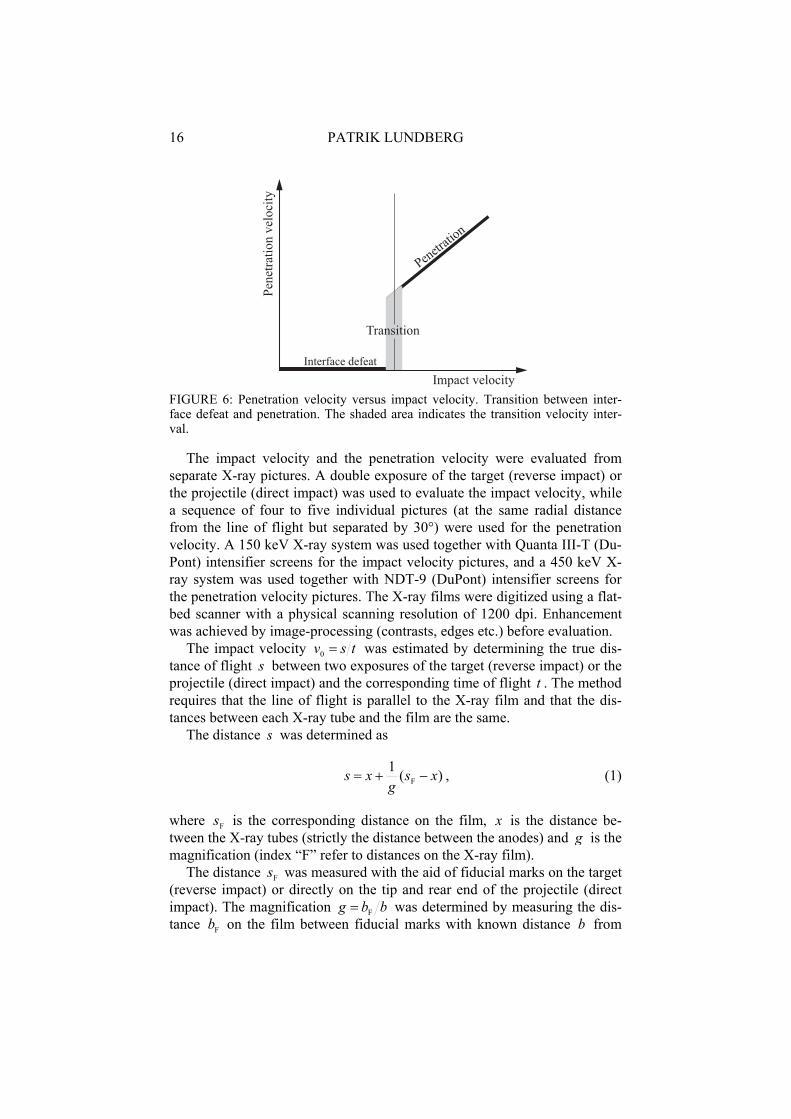
High-speed photography is usually difficult to use in impact experiments because of the large amount of light and particles emitted during the initial stages of the impact process. If high-speed photography is to be used, syn-chronization problems usually exclude mechanical cameras (rotating prisms etc). Only electronic systems like image converters, CCD, or flash light cameras such as the Cranz-Shardin camera, are sufficiently easy to synchro-nize to the impact event.
An Imacon camera (image converter) was used to depict the radial expan-sion of alumina cylinders during the impact of WHA projectiles (Paper I). Figure 5 shows eight such pictures of the projectile/target interaction.
FIGURE 5: Pictures of the impact of a WHA projectile (2 mm diameter, 30 mm length) on an alumina target at 2409 m/s. The pictures were taken with 4.88 s time intervals (1 s exposure time). The bottom and top rows show pictures 1, 3, 5, 7 and 2, 4, 6, 8, respectively.
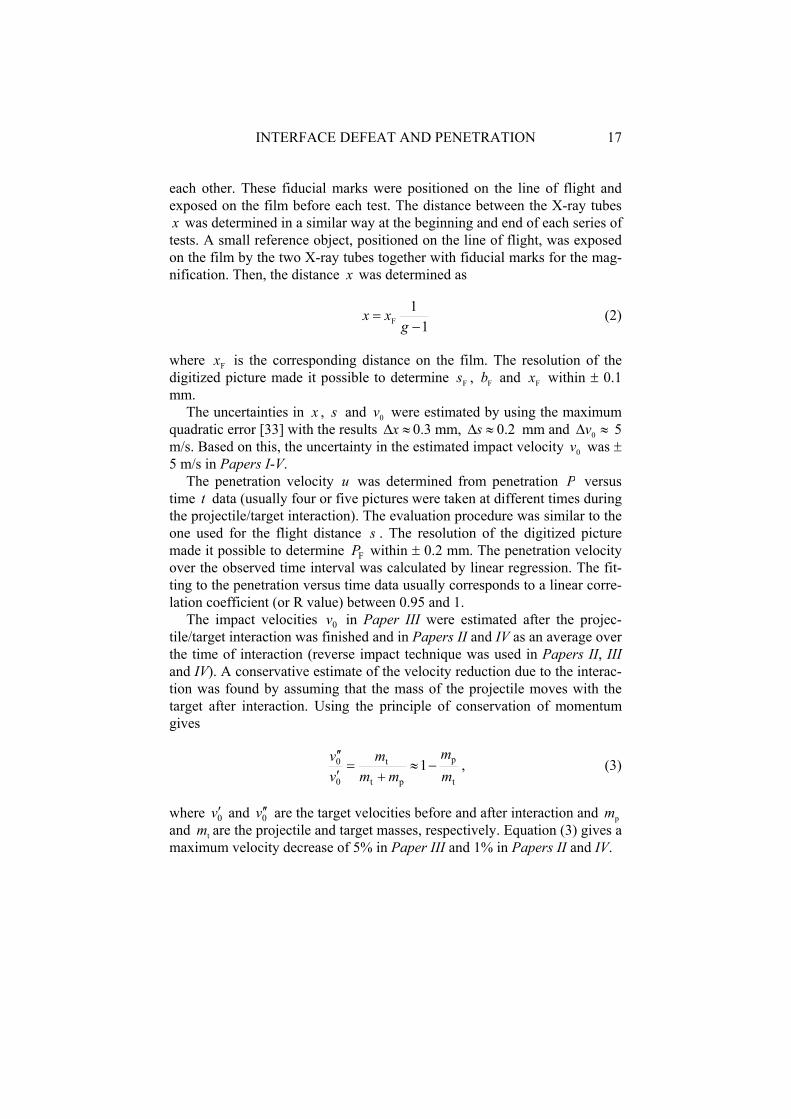
2.2. Determination of velocities The transition velocity *
0v was estimated by systematically varying the im-pact velocity 0v and determining the corresponding penetration velocity u (usually, the erosion velocity of the projectile was also estimated).
Ideally, the transition occurs at a well-defined impact velocity, but in practice it is only possible to determine a velocity interval in which the tran-sition occurs. The lower and upper limits of this interval correspond to the highest impact velocity observed without penetration and the lowest impact velocity with penetration, respectively. The transition velocity *
0v is esti-mated as the centre-point of this interval. The velocity interval is indicated by adding half the length of the interval to the estimated transition veloc-ity.
The relation between the impact velocity and the penetration velocity is illustrated in Fig. 6. The shaded area indicates the transition velocity inter-val.
16 PATRIK LUNDBERG
FIGURE 6: Penetration velocity versus impact velocity. Transition between inter-face defeat and penetration. The shaded area indicates the transition velocity inter-val.
The impact velocity and the penetration velocity were evaluated from separate X-ray pictures. A double exposure of the target (reverse impact) or the projectile (direct impact) was used to evaluate the impact velocity, while a sequence of four to five individual pictures (at the same radial distance from the line of flight but separated by 30 ) were used for the penetration velocity. A 150 keV X-ray system was used together with Quanta III-T (Du-Pont) intensifier screens for the impact velocity pictures, and a 450 keV X-ray system was used together with NDT-9 (DuPont) intensifier screens for the penetration velocity pictures. The X-ray films were digitized using a flat-bed scanner with a physical scanning resolution of 1200 dpi. Enhancement was achieved by image-processing (contrasts, edges etc.) before evaluation.
The impact velocity tsv0 was estimated by determining the true dis-tance of flight s between two exposures of the target (reverse impact) or the projectile (direct impact) and the corresponding time of flight t . The method requires that the line of flight is parallel to the X-ray film and that the dis-tances between each X-ray tube and the film are the same.
The distance s was determined as
)(1F xs
gxs , (1)
where Fs is the corresponding distance on the film, x is the distance be-tween the X-ray tubes (strictly the distance between the anodes) and g is the magnification (index “F” refer to distances on the X-ray film).
The distance Fs was measured with the aid of fiducial marks on the target (reverse impact) or directly on the tip and rear end of the projectile (direct impact). The magnification bbg F was determined by measuring the dis-tance Fb on the film between fiducial marks with known distance b from
INTERFACE DEFEAT AND PENETRATION 17
each other. These fiducial marks were positioned on the line of flight and exposed on the film before each test. The distance between the X-ray tubes x was determined in a similar way at the beginning and end of each series of tests. A small reference object, positioned on the line of flight, was exposed on the film by the two X-ray tubes together with fiducial marks for the mag-nification. Then, the distance x was determined as
11
F gxx (2)
where Fx is the corresponding distance on the film. The resolution of the digitized picture made it possible to determine Fs , Fb and Fx within 0.1 mm.
The uncertainties in x , s and 0v were estimated by using the maximum quadratic error [33] with the results x 0.3 mm, 2.0s mm and 0v 5 m/s. Based on this, the uncertainty in the estimated impact velocity 0v was 5 m/s in Papers I-V.
The penetration velocity u was determined from penetration P versus time t data (usually four or five pictures were taken at different times during the projectile/target interaction). The evaluation procedure was similar to the one used for the flight distance s . The resolution of the digitized picture made it possible to determine FP within 0.2 mm. The penetration velocity over the observed time interval was calculated by linear regression. The fit-ting to the penetration versus time data usually corresponds to a linear corre-lation coefficient (or R value) between 0.95 and 1.
The impact velocities 0v in Paper III were estimated after the projec-tile/target interaction was finished and in Papers II and IV as an average over the time of interaction (reverse impact technique was used in Papers II, IIIand IV). A conservative estimate of the velocity reduction due to the interac-tion was found by assuming that the mass of the projectile moves with the target after interaction. Using the principle of conservation of momentum gives
t
p
pt
t
0
0 1mm
mmm
vv , (3)
where 0v and 0v are the target velocities before and after interaction and pmand tm are the projectile and target masses, respectively. Equation (3) gives a maximum velocity decrease of 5% in Paper III and 1% in Papers II and IV.
18 PATRIK LUNDBERG
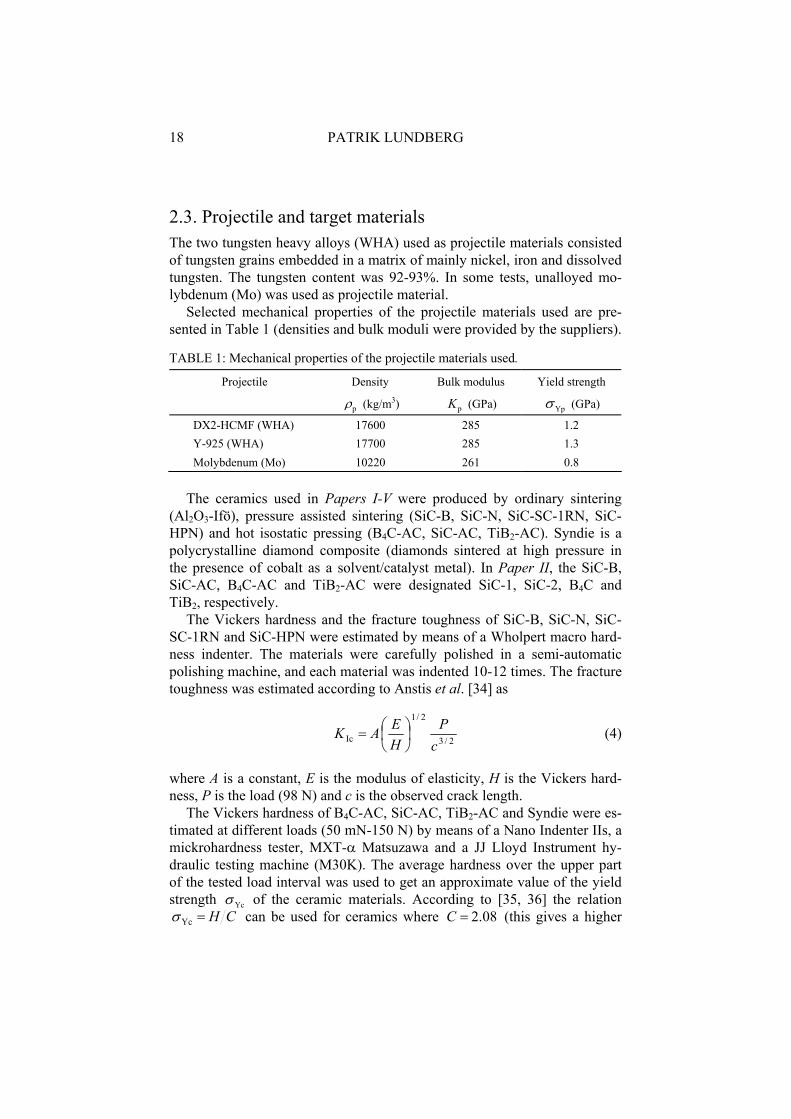
2.3. Projectile and target materials The two tungsten heavy alloys (WHA) used as projectile materials consisted of tungsten grains embedded in a matrix of mainly nickel, iron and dissolved tungsten. The tungsten content was 92-93%. In some tests, unalloyed mo-lybdenum (Mo) was used as projectile material.
Selected mechanical properties of the projectile materials used are pre-sented in Table 1 (densities and bulk moduli were provided by the suppliers).
TABLE 1: Mechanical properties of the projectile materials used.
Projectile Density Bulk modulus Yield strength
p (kg/m3) pK (GPa) Yp (GPa)
DX2-HCMF (WHA) 17600 285 1.2 Y-925 (WHA) 17700 285 1.3 Molybdenum (Mo) 10220 261 0.8
The ceramics used in Papers I-V were produced by ordinary sintering (Al2O3-Ifö), pressure assisted sintering (SiC-B, SiC-N, SiC-SC-1RN, SiC-HPN) and hot isostatic pressing (B4C-AC, SiC-AC, TiB2-AC). Syndie is a polycrystalline diamond composite (diamonds sintered at high pressure in the presence of cobalt as a solvent/catalyst metal). In Paper II, the SiC-B, SiC-AC, B4C-AC and TiB2-AC were designated SiC-1, SiC-2, B4C and TiB2, respectively.
The Vickers hardness and the fracture toughness of SiC-B, SiC-N, SiC-SC-1RN and SiC-HPN were estimated by means of a Wholpert macro hard-ness indenter. The materials were carefully polished in a semi-automatic polishing machine, and each material was indented 10-12 times. The fracture toughness was estimated according to Anstis et al. [34] as
2/3
2/1
Ic cP
HEAK (4)
where A is a constant, E is the modulus of elasticity, H is the Vickers hard-ness, P is the load (98 N) and c is the observed crack length.
The Vickers hardness of B4C-AC, SiC-AC, TiB2-AC and Syndie were es-timated at different loads (50 mN-150 N) by means of a Nano Indenter IIs, a mickrohardness tester, MXT- Matsuzawa and a JJ Lloyd Instrument hy-draulic testing machine (M30K). The average hardness over the upper part of the tested load interval was used to get an approximate value of the yield strength Yc of the ceramic materials. According to [35, 36] the relation
CHYc can be used for ceramics where 08.2C (this gives a higher
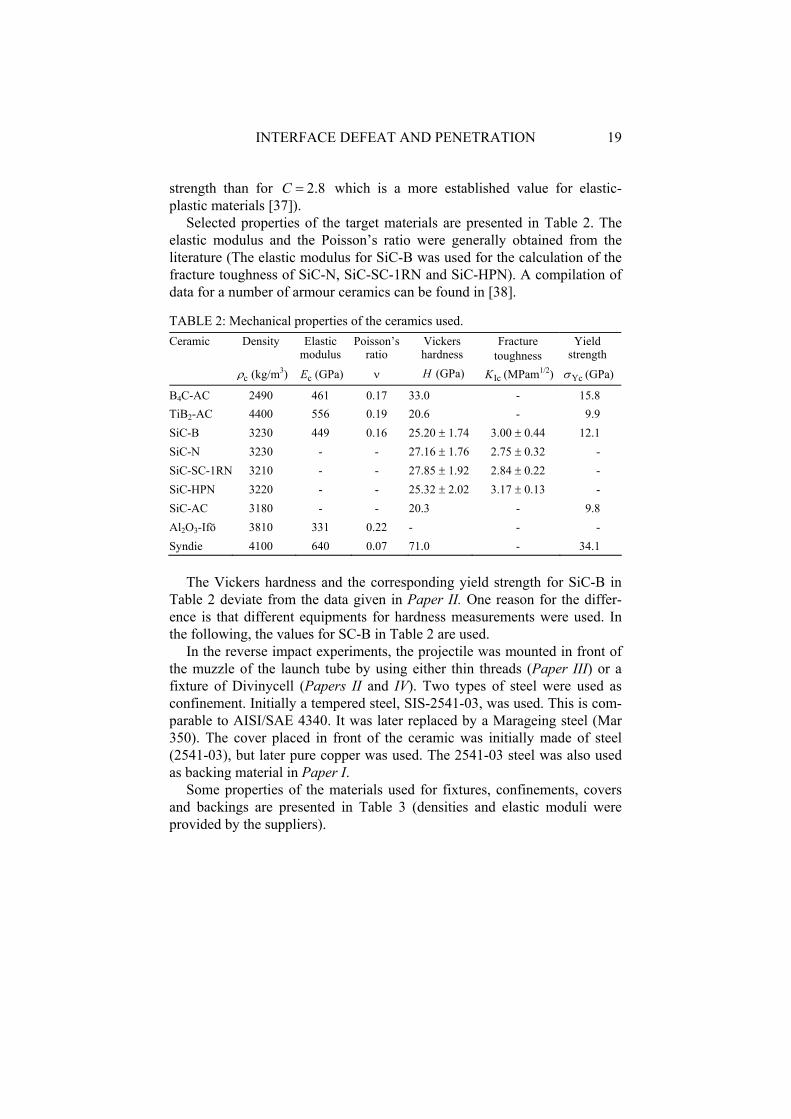
INTERFACE DEFEAT AND PENETRATION 19
strength than for 8.2C which is a more established value for elastic-plastic materials [37]).
Selected properties of the target materials are presented in Table 2. The elastic modulus and the Poisson’s ratio were generally obtained from the literature (The elastic modulus for SiC-B was used for the calculation of the fracture toughness of SiC-N, SiC-SC-1RN and SiC-HPN). A compilation of data for a number of armour ceramics can be found in [38].
TABLE 2: Mechanical properties of the ceramics used. Ceramic Density Elastic
modulusPoisson’s
ratioVickers hardness
Fracture toughness
Yieldstrength
c (kg/m3) cE (GPa) H (GPa) IcK (MPam1/2) Yc (GPa)
B4C-AC 2490 461 0.17 33.0 - 15.8 TiB2-AC 4400 556 0.19 20.6 - 9.9 SiC-B 3230 449 0.16 25.20 1.74 3.00 0.44 12.1 SiC-N 3230 - - 27.16 1.76 2.75 0.32 - SiC-SC-1RN 3210 - - 27.85 1.92 2.84 0.22 - SiC-HPN 3220 - - 25.32 2.02 3.17 0.13 - SiC-AC 3180 - - 20.3 - 9.8 Al2O3-Ifö 3810 331 0.22 - - - Syndie 4100 640 0.07 71.0 - 34.1
The Vickers hardness and the corresponding yield strength for SiC-B in Table 2 deviate from the data given in Paper II. One reason for the differ-ence is that different equipments for hardness measurements were used. In the following, the values for SC-B in Table 2 are used.
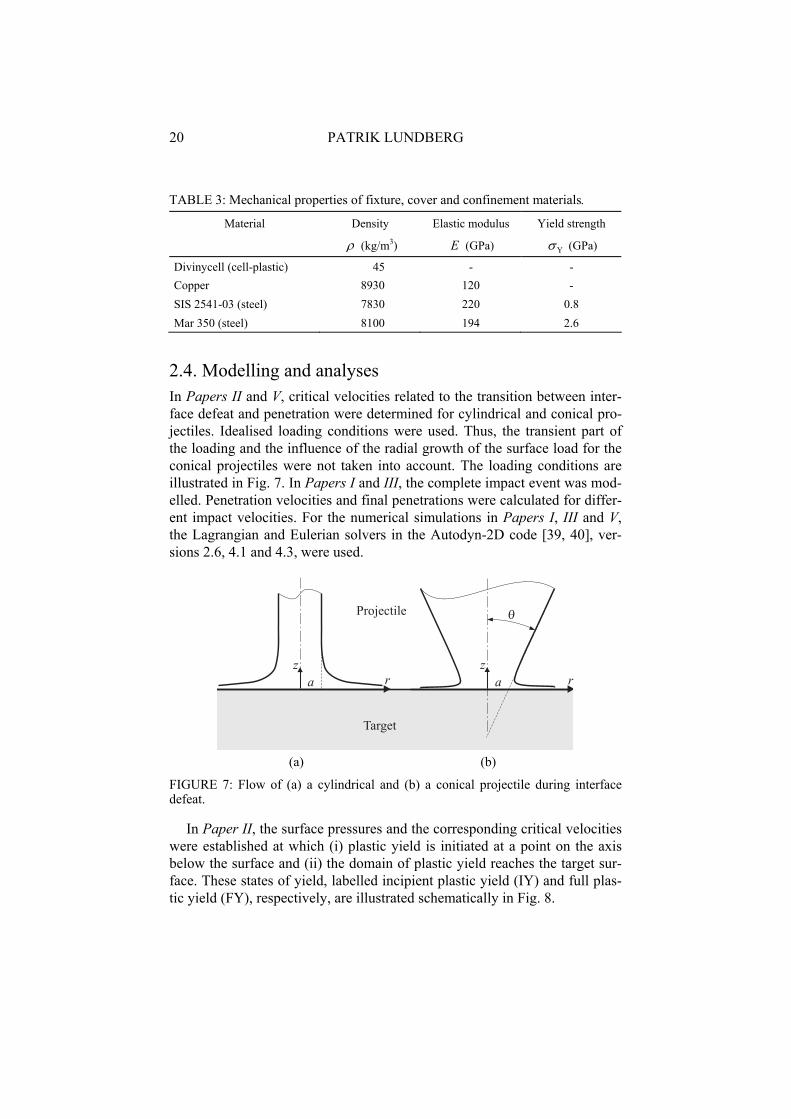
In the reverse impact experiments, the projectile was mounted in front of the muzzle of the launch tube by using either thin threads (Paper III) or a fixture of Divinycell (Papers II and IV). Two types of steel were used as confinement. Initially a tempered steel, SIS-2541-03, was used. This is com-parable to AISI/SAE 4340. It was later replaced by a Marageing steel (Mar350). The cover placed in front of the ceramic was initially made of steel (2541-03), but later pure copper was used. The 2541-03 steel was also used as backing material in Paper I.
Some properties of the materials used for fixtures, confinements, covers and backings are presented in Table 3 (densities and elastic moduli were provided by the suppliers).
20 PATRIK LUNDBERG
TABLE 3: Mechanical properties of fixture, cover and confinement materials.
Material Density Elastic modulus Yield strength
(kg/m3) E (GPa) Y (GPa)
Divinycell (cell-plastic) 45 - - Copper 8930 120 - SIS 2541-03 (steel) 7830 220 0.8 Mar 350 (steel) 8100 194 2.6
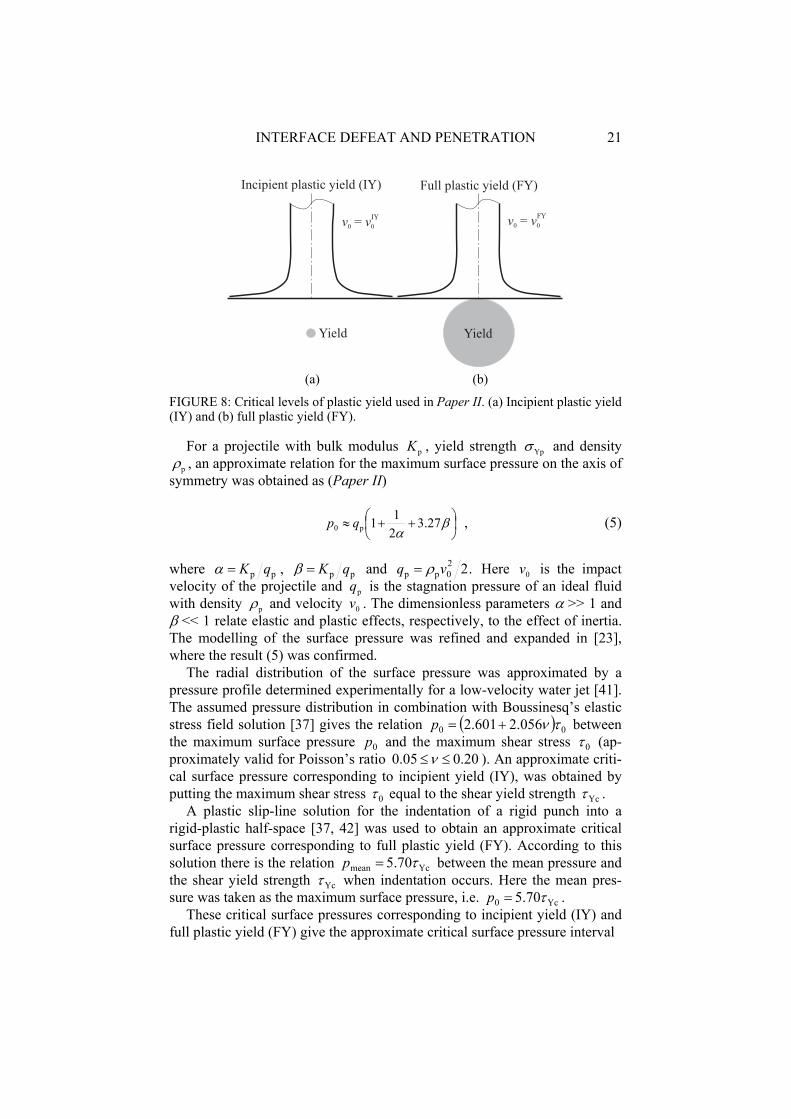
2.4. Modelling and analyses In Papers II and V, critical velocities related to the transition between inter-face defeat and penetration were determined for cylindrical and conical pro-jectiles. Idealised loading conditions were used. Thus, the transient part of the loading and the influence of the radial growth of the surface load for the conical projectiles were not taken into account. The loading conditions are illustrated in Fig. 7. In Papers I and III, the complete impact event was mod-elled. Penetration velocities and final penetrations were calculated for differ-ent impact velocities. For the numerical simulations in Papers I, III and V,the Lagrangian and Eulerian solvers in the Autodyn-2D code [39, 40], ver-sions 2.6, 4.1 and 4.3, were used.
(a) (b)
FIGURE 7: Flow of (a) a cylindrical and (b) a conical projectile during interface defeat.
In Paper II, the surface pressures and the corresponding critical velocities were established at which (i) plastic yield is initiated at a point on the axis below the surface and (ii) the domain of plastic yield reaches the target sur-face. These states of yield, labelled incipient plastic yield (IY) and full plas-tic yield (FY), respectively, are illustrated schematically in Fig. 8.
INTERFACE DEFEAT AND PENETRATION 21
(a) (b)
FIGURE 8: Critical levels of plastic yield used in Paper II. (a) Incipient plastic yield (IY) and (b) full plastic yield (FY).
For a projectile with bulk modulus pK , yield strength Yp and density p , an approximate relation for the maximum surface pressure on the axis of
symmetry was obtained as (Paper II)
27.3211p0 qp , (5)
where pp qK , pp qK and .220pp vq Here 0v is the impact
velocity of the projectile and pq is the stagnation pressure of an ideal fluid with density p and velocity 0v . The dimensionless parameters >> 1 and
<< 1 relate elastic and plastic effects, respectively, to the effect of inertia. The modelling of the surface pressure was refined and expanded in [23], where the result (5) was confirmed.
The radial distribution of the surface pressure was approximated by a pressure profile determined experimentally for a low-velocity water jet [41]. The assumed pressure distribution in combination with Boussinesq’s elastic stress field solution [37] gives the relation 00 056.2601.2p between the maximum surface pressure 0p and the maximum shear stress 0 (ap-proximately valid for Poisson’s ratio 20.005.0 ). An approximate criti-cal surface pressure corresponding to incipient yield (IY), was obtained by putting the maximum shear stress 0 equal to the shear yield strength Yc .
A plastic slip-line solution for the indentation of a rigid punch into a rigid-plastic half-space [37, 42] was used to obtain an approximate critical surface pressure corresponding to full plastic yield (FY). According to this solution there is the relation Ycmean 70.5p between the mean pressure and the shear yield strength Yc when indentation occurs. Here the mean pres-sure was taken as the maximum surface pressure, i.e. Yc0 70.5p .
These critical surface pressures corresponding to incipient yield (IY) and full plastic yield (FY) give the approximate critical surface pressure interval
22 PATRIK LUNDBERG
Yc0Yc 85.203.130.1 p , (6)
where YcYc 2 is the yield strength in uniaxial compression according to Tresca’s hypothesis and is Poisson’s ratio of the ceramic. As relation (5) provides a relation between the maximum surface pressure 0p and the im-pact velocity 0v , this relation and inequalities (6) give a critical velocity interval also for the impact velocity 0v . The yield conditions at the critical velocities IY
0v and FY0v are illustrated in Fig. 8.
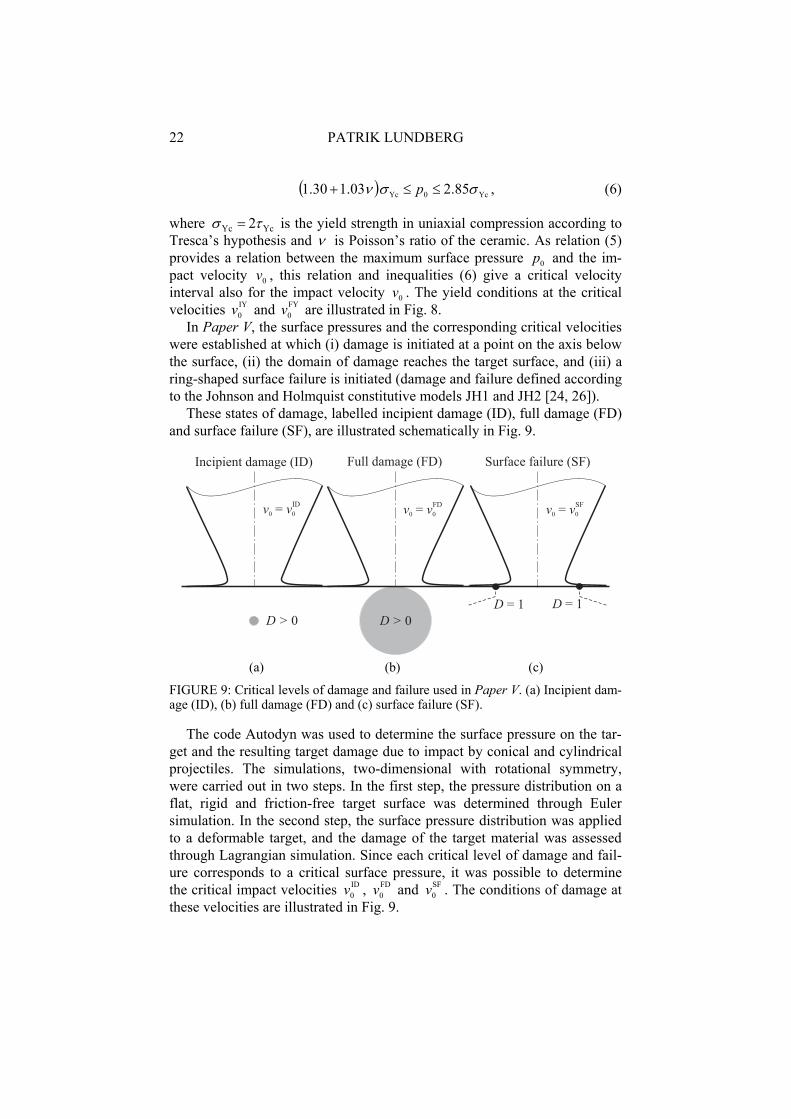
In Paper V, the surface pressures and the corresponding critical velocities were established at which (i) damage is initiated at a point on the axis below the surface, (ii) the domain of damage reaches the target surface, and (iii) a ring-shaped surface failure is initiated (damage and failure defined according to the Johnson and Holmquist constitutive models JH1 and JH2 [24, 26]).
These states of damage, labelled incipient damage (ID), full damage (FD) and surface failure (SF), are illustrated schematically in Fig. 9.
(a) (b) (c)
FIGURE 9: Critical levels of damage and failure used in Paper V. (a) Incipient dam-age (ID), (b) full damage (FD) and (c) surface failure (SF).
The code Autodyn was used to determine the surface pressure on the tar-get and the resulting target damage due to impact by conical and cylindrical projectiles. The simulations, two-dimensional with rotational symmetry, were carried out in two steps. In the first step, the pressure distribution on a flat, rigid and friction-free target surface was determined through Euler simulation. In the second step, the surface pressure distribution was applied to a deformable target, and the damage of the target material was assessed through Lagrangian simulation. Since each critical level of damage and fail-ure corresponds to a critical surface pressure, it was possible to determine the critical impact velocities ID
0v , FD0v and SF
0v . The conditions of damage at these velocities are illustrated in Fig. 9.
INTERFACE DEFEAT AND PENETRATION 23
The Johnson and Cook (JC) constitutive model [43] was used for the pro-jectile (Papers I, III and V), the confinement (Paper III) and the backing materials (Paper I). For this model, the yield stress
mn TCBA H0
ppY 1ln1 (7)
is a function of the plastic strain p , the plastic strain rate p and the tem-perature T through the homologous temperature 0m0H TTTTT ,where 0T and mT are the reference and the melting temperatures, respec-tively. The parameter A is the static yield stress, B and n represent strain hardening, C is the strain rate sensitivity, and m represents thermal soften-ing. The Mie-Gruneisen equation of state (named “shock” in Autodyn) was used for the WHA materials and a linear equation of state was used for the steel. The JC parameters used in the simulations were taken from [43, 44] and are shown in Table 4 (the density for DX2-HCMF was provided by the supplier).
TABLE 4: Parameters for WHA and steel used in the JC constitutive model.
Parameters Notation DX2-HCMF Y-925 2541-03 Density (kg/m3) 0 17600 17700 7830 Shear modulus (GPa) G 160 160 81.8 Bulk modulus (GPa) K - - 159 Bulk sound speed (m/s) 0c 4029 4029 - Slope in ps UU diagram S 1.237 1.237 - Grüneisen coefficient 1.54 1.54 - Static yield limit (GPa) A 1.506 0.631 0.792 Strain hardening modulus (GPa) B 0.177 1.258 0.51 Strain hardening exponent n 0.12 0.092 0.26 Coefficient of strain rate C 0.016 0.014 0.014 Thermal softening exponent m 1.0 0.94 1.03 Melt temperature (K) mT 1723 1723 1793 Reference temperature (K) 0T 300 300 300 Strain rate threshold (1/s) 0 1.0 1.0 1.0 Specific heat (J/KgK) VC 134 134 477
The Johnson and Holmquist (JH) constitutive models JH1 and JH2 [24, 26] were used for the ceramic materials. The JH1 model was used for silicon carbide (Paper V), and the JH2 model was used for alumina (Paper I) and boron carbide (Paper III).
24 PATRIK LUNDBERG
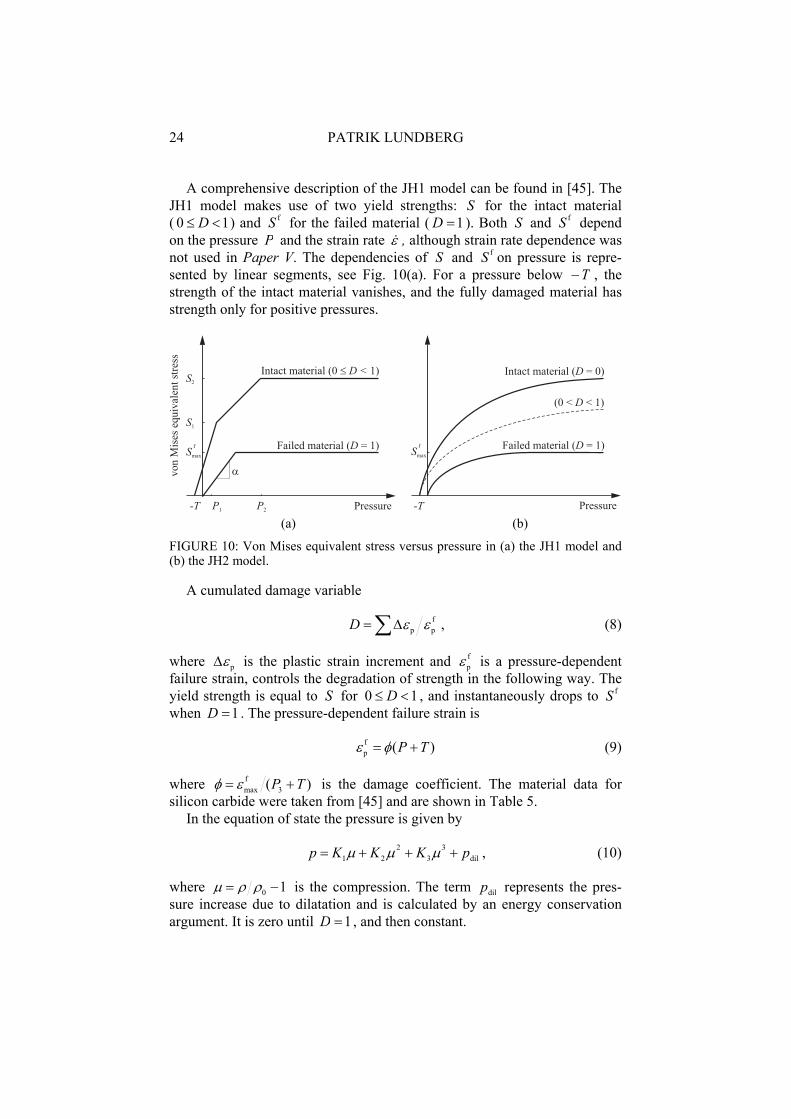
A comprehensive description of the JH1 model can be found in [45]. The JH1 model makes use of two yield strengths: S for the intact material ( 10 D ) and fS for the failed material ( 1D ). Both S and fS depend on the pressure P and the strain rate , although strain rate dependence was not used in Paper V. The dependencies of S and fS on pressure is repre-sented by linear segments, see Fig. 10(a). For a pressure below T , the strength of the intact material vanishes, and the fully damaged material has strength only for positive pressures.
(a) (b)
FIGURE 10: Von Mises equivalent stress versus pressure in (a) the JH1 model and (b) the JH2 model.
A cumulated damage variable
fppD , (8)
where p is the plastic strain increment and fp is a pressure-dependent
failure strain, controls the degradation of strength in the following way. The yield strength is equal to S for 10 D , and instantaneously drops to fSwhen 1D . The pressure-dependent failure strain is
)(fp TP (9)
where )( 3fmax TP is the damage coefficient. The material data for
silicon carbide were taken from [45] and are shown in Table 5. In the equation of state the pressure is given by
dil3
32
21 pKKKp , (10)
where 10 is the compression. The term dilp represents the pres-sure increase due to dilatation and is calculated by an energy conservation argument. It is zero until 1D , and then constant.
INTERFACE DEFEAT AND PENETRATION 25
TABLE 5: Material data for silicon carbide used in the JH1 constitutive model.
Parameter Notation SiC-B Density (kg/m3) 0 3215 Bulk modulus (GPa) 1K 220 Shear modulus (GPa) G 193 Modulus of elasticity (GPa) E 449Tensile strength (GPa) T 0.75Intact strength coefficient (GPa) S1 7.1Intact strength coefficient (GPa) P1 2.5Intact strength coefficient (GPa) S2 12.2Intact strength coefficient (GPa) P2 10.0Strain rate coefficient C 0.0Failed strength coefficient (GPa) f
maxS 1.3Failed strength coefficient 0.40Pressure coefficient (GPa) K2 361Pressure coefficient (GPa) K3 0Bulking factor 1.0Damage coefficient (1/GPa) 0.012Damage coefficient f
max 1.2Damage coefficent (GPa) P3 99.75
A comprehensive description of the JH2 model can be found in [46]. The JH2 model uses a similar method to handle the intact and fully damaged materials as JH1 but the yield strengths are represented by analytical expres-sions instead of linear segments. The yield strengths for intact and fully damaged materials are given by
0HELHELi ln1, C
ppTAp
N
(11)
and
0HELHELf ln1, C
ppBp
M
, (12)
respectively. Here A, N, C, B and M are dimensionless parameters, T > 0 is the negative of the pressure below which the strength of the intact material vanishes, and 0 is the threshold strain rate for strain rate effects. For the failed material ( 1D ), the strength vanishes for negative pressures and is truncated so that it does not exceed f
maxS . The pressure dependencies of i
26 PATRIK LUNDBERG
and f are illustrated in Fig. 10(b). Instead of instantaneously degrading the strength when 1D , as in JH1, the strength in JH2 decreases gradually as the damage cumulates. For the partly damaged material, the yield stress is given by
fi1,, DDpD , (13)
where D is the damage parameter. The damage is again calculated according to equation (8) where the pressure-dependent failure strain is now given by
2
HEL1
fp
D
ppTDp , (14)
where D1 and D2 are dimensionless parameters. The same equation of state is used in JH2 as in JH1, viz., equation (10).
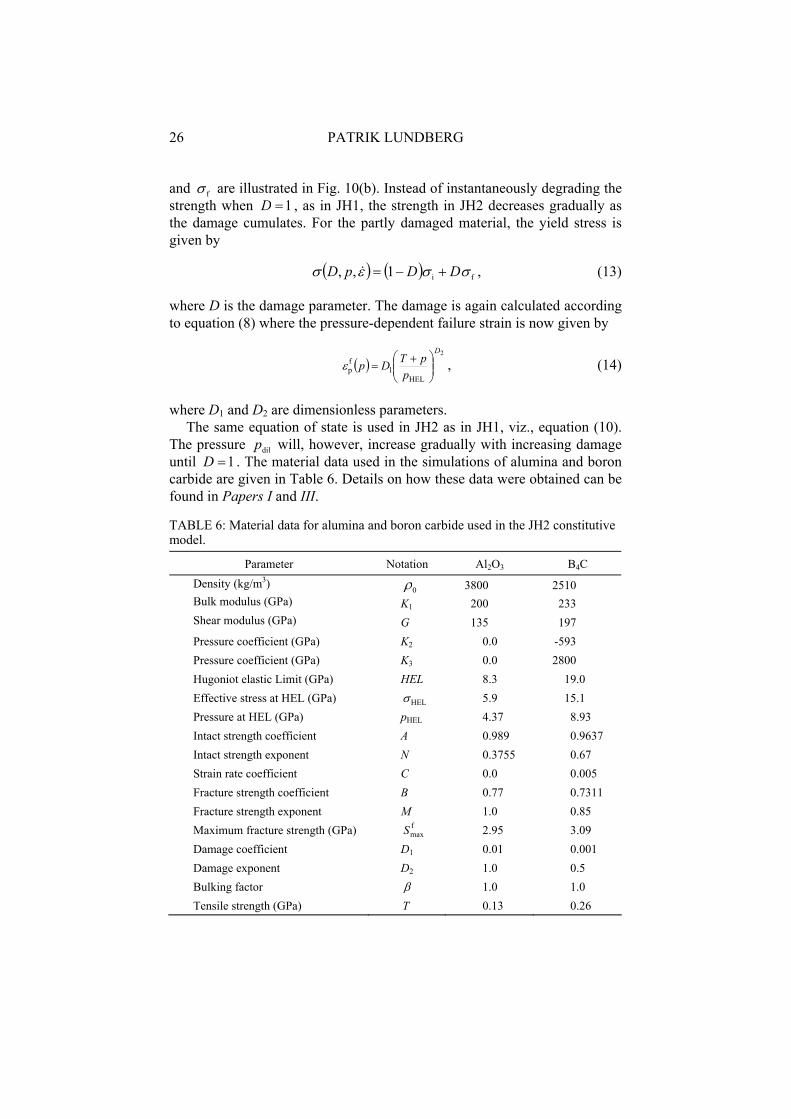
The pressure dilp will, however, increase gradually with increasing damage until 1D . The material data used in the simulations of alumina and boron carbide are given in Table 6. Details on how these data were obtained can be found in Papers I and III.
TABLE 6: Material data for alumina and boron carbide used in the JH2 constitutive model.
Parameter Notation Al2O3 B4CDensity (kg/m3) 0 3800 2510 Bulk modulus (GPa) K1 200 233 Shear modulus (GPa) G 135 197 Pressure coefficient (GPa) K2 0.0 -593 Pressure coefficient (GPa) K3 0.0 2800 Hugoniot elastic Limit (GPa) HEL 8.3 19.0 Effective stress at HEL (GPa) HEL 5.9 15.1 Pressure at HEL (GPa) pHEL 4.37 8.93 Intact strength coefficient A 0.989 0.9637 Intact strength exponent N 0.3755 0.67 Strain rate coefficient C 0.0 0.005 Fracture strength coefficient B 0.77 0.7311 Fracture strength exponent M 1.0 0.85 Maximum fracture strength (GPa) f
maxS 2.95 3.09 Damage coefficient D1 0.01 0.001 Damage exponent D2 1.0 0.5 Bulking factor 1.0 1.0 Tensile strength (GPa) T 0.13 0.26
INTERFACE DEFEAT AND PENETRATION 27
3. TRANSITION VELOCITY VERSUS MATERIAL PROPERTIES
3.1. Experimental details Three different target designs were used for the impact experiments pre-sented in Papers II-IV. All targets consisted of a ceramic cylinder confined in a tube or cup made of steel. A cover made of either steel or copper was mounted in front of the ceramic. A back plug made of steel was also used. The ceramic cylinders were cut from larger samples (plates) and ground to cylindrical shape. They were shrink-fitted into the confining tube in order to generate a moderate pre-stress.
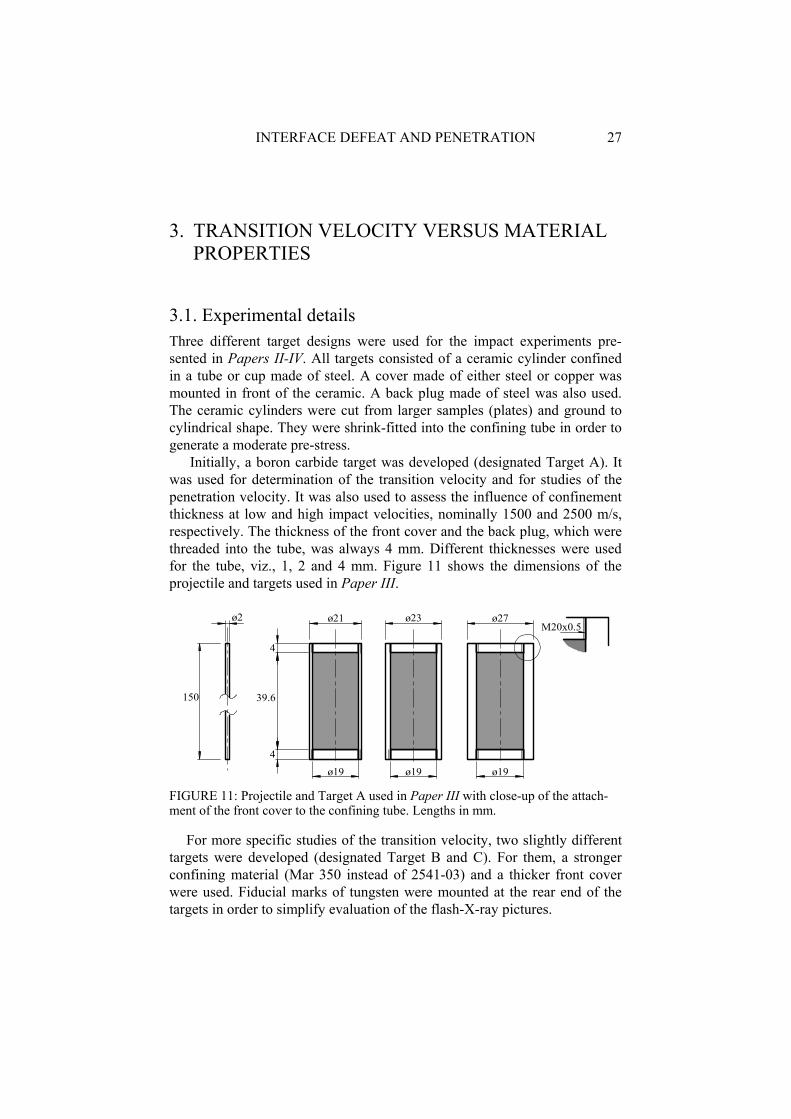
Initially, a boron carbide target was developed (designated Target A). It was used for determination of the transition velocity and for studies of the penetration velocity. It was also used to assess the influence of confinement thickness at low and high impact velocities, nominally 1500 and 2500 m/s, respectively. The thickness of the front cover and the back plug, which were threaded into the tube, was always 4 mm. Different thicknesses were used for the tube, viz., 1, 2 and 4 mm. Figure 11 shows the dimensions of the projectile and targets used in Paper III.
ø2 ø21
ø19
M20x0.5ø23 ø27
39.6
4
4
150
ø19 ø19
FIGURE 11: Projectile and Target A used in Paper III with close-up of the attach-ment of the front cover to the confining tube. Lengths in mm.
For more specific studies of the transition velocity, two slightly different targets were developed (designated Target B and C). For them, a stronger confining material (Mar 350 instead of 2541-03) and a thicker front cover were used. Fiducial marks of tungsten were mounted at the rear end of the targets in order to simplify evaluation of the flash-X-ray pictures.
28 PATRIK LUNDBERG
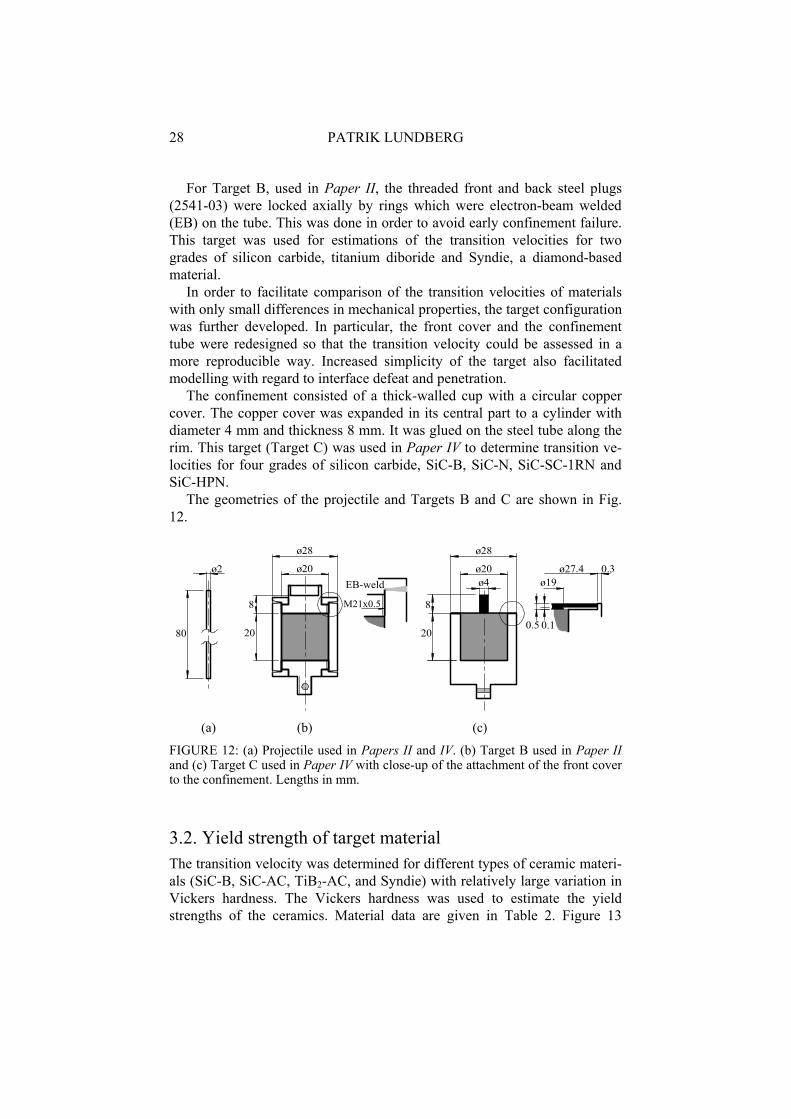
For Target B, used in Paper II, the threaded front and back steel plugs (2541-03) were locked axially by rings which were electron-beam welded (EB) on the tube. This was done in order to avoid early confinement failure. This target was used for estimations of the transition velocities for two grades of silicon carbide, titanium diboride and Syndie, a diamond-based material.
In order to facilitate comparison of the transition velocities of materials with only small differences in mechanical properties, the target configuration was further developed. In particular, the front cover and the confinement tube were redesigned so that the transition velocity could be assessed in a more reproducible way. Increased simplicity of the target also facilitated modelling with regard to interface defeat and penetration.
The confinement consisted of a thick-walled cup with a circular copper cover. The copper cover was expanded in its central part to a cylinder with diameter 4 mm and thickness 8 mm. It was glued on the steel tube along the rim. This target (Target C) was used in Paper IV to determine transition ve-locities for four grades of silicon carbide, SiC-B, SiC-N, SiC-SC-1RN and SiC-HPN.
The geometries of the projectile and Targets B and C are shown in Fig. 12.
ø2
80
ø28
ø20ø4
0.3ø27.4ø19
0.10.5
ø28
ø20
M21x0.5
EB-weld
20
8
20
8
(a) (b) (c)
FIGURE 12: (a) Projectile used in Papers II and IV. (b) Target B used in Paper IIand (c) Target C used in Paper IV with close-up of the attachment of the front cover to the confinement. Lengths in mm.
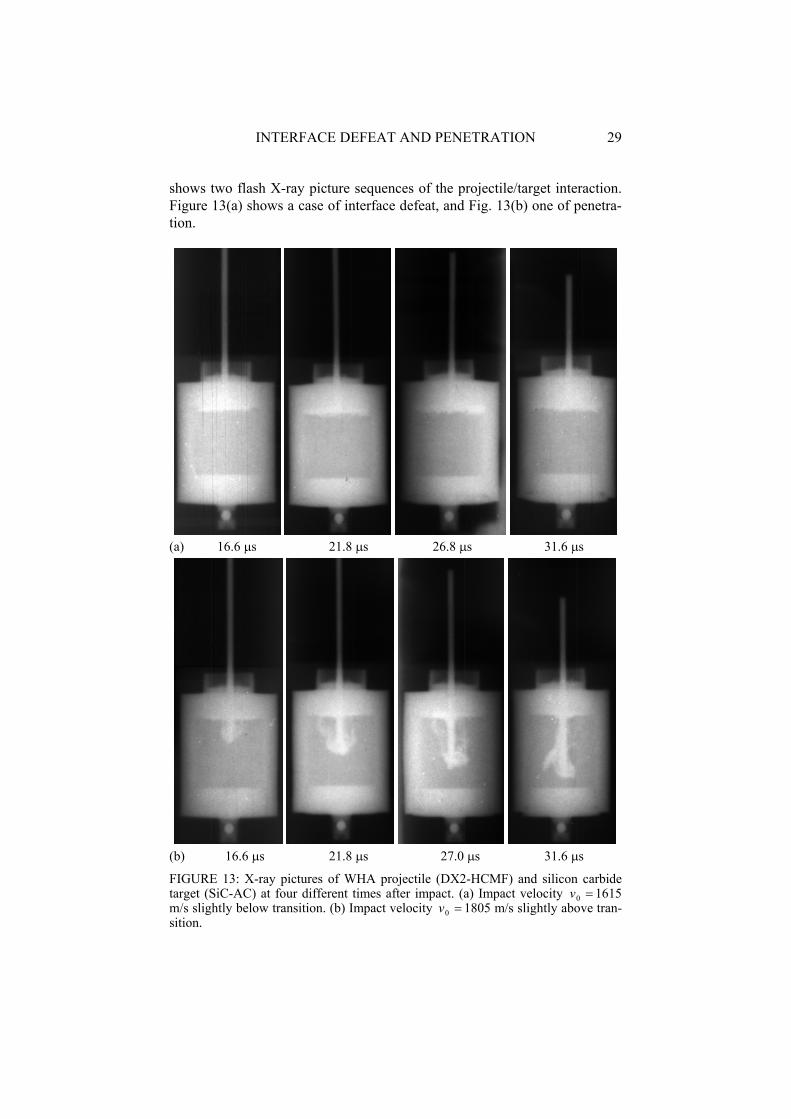
3.2. Yield strength of target material The transition velocity was determined for different types of ceramic materi-als (SiC-B, SiC-AC, TiB2-AC, and Syndie) with relatively large variation in Vickers hardness. The Vickers hardness was used to estimate the yield strengths of the ceramics. Material data are given in Table 2. Figure 13
INTERFACE DEFEAT AND PENETRATION 29
shows two flash X-ray picture sequences of the projectile/target interaction. Figure 13(a) shows a case of interface defeat, and Fig. 13(b) one of penetra-tion.
(a) 16.6 s 21.8 s 26.8 s 31.6 s
(b) 16.6 s 21.8 s 27.0 s 31.6 s
FIGURE 13: X-ray pictures of WHA projectile (DX2-HCMF) and silicon carbide target (SiC-AC) at four different times after impact. (a) Impact velocity 0v 1615 m/s slightly below transition. (b) Impact velocity 0v 1805 m/s slightly above tran-sition.
30 PATRIK LUNDBERG
The estimated transition velocities *0v are shown in Table 7 together with
the estimated yield strengths.
TABLE 7: Transition velocities for different ceramics (Target B) together with esti-mated yield strengths of the ceramics. The ends of the velocity intervals represent the highest velocity without penetration (-) and the lowest velocity with penetration (+).
Projectile/target materials Transition velocity Yield strength Paper *0v (m/s) Yc (GPa)
DX2-HCMF/SiC-B 1675 30 12.1 Paper II DX2-HCMF/SiC-AC 1665 50 9.8 - DX2-HCMF/TiB2-AC 1505 40 9.9 - DX2-HCMF/Syndie 2110 100 34.1 -
Figure 14 shows the transition velocities determined from the impact ex-periments together with critical velocities corresponding to incipient yield (IY) and full plastic yield (FY). The critical velocities were determined from equation (5) and inequalities (6). The lower curve corresponds to Poisson’s ratio 07.0 .
v0IY
v (m
/s)
v0FY
Syndie
SiC-AC SiC-B = 0.07 (Syndie)
1000
1500
2000
2500
3000
5 10 15 20 25 30 35 40Yc (GPa)
TiB2-AC
FIGURE 14: Transition velocity *0v from impact tests and critical velocities IY
0v ,FY0v versus target yield strength Yc (solid curves). The ends of the error bars repre-
sent the highest velocity without penetration ( ) and the lowest velocity with pene-tration ( ), respectively.
INTERFACE DEFEAT AND PENETRATION 31
3.3. Fracture toughness of target material The transition velocity was determined for four grades of silicon carbide having relative small variations in hardness and toughness. The estimated transition velocities *
0v are given in Table 8 together with the Vickers hard-ness H and the fracture toughness IcK (normalised to these quantities for SiC-B). Transition velocities are plotted versus normalised hardness and toughness in Fig. 15.
TABLE 8: Transition velocities for different silicon carbides (Target C) together with hardness and fracture toughness of the ceramics. The ends of the velocity inter-vals represent the highest velocity without penetration (-) and the lowest velocity with penetration (+).
Projectile/target materials Transition velocity Hardness Fracture toughness Paper *0v (m/s) BSiCHH BSiCIcIc KK
Y-925/SiC-B 1549 19 1.00 0.07 1.00 0.15 Paper IV Y-925/SiC-N 1507 5 1.08 0.07 0.92 0.11 -Y-925/SiC-SC-1RN 1526 25 1.11 0.08 0.95 0.07 -Y-925/SiC-HPN 1625 12 1.00 0.08 1.06 0.04 -
SiC-N
SiC-SC-1RN
SiC-B
SiC-HPN
0.9 0.95 1 1.05 1.1 1.15 1.21500
1525
1550
1575
1600
1625
1650
H/H(SiC-B)
v(m
/s)
0.9 0.95 1 1.05 1.1500
525
550
575
600
625
650
KIc/KIc(SiC-B)
SiC-SC-1RN
SiC-B
SiC-HPN
SiC-N
(a) (b)
FIGURE 15: Transition velocity *0v versus (a) Vickers hardness H and (b) fracture
toughness IcK . The lower and upper limits correspond to the highest velocity with-out penetration ( ) and the lowest velocity with penetration ( ), respectively. The left and right limits correspond to the standard deviation in hardness and fracture toughness.
32 PATRIK LUNDBERG
3.4. Influence of confinement The transition velocity for one grade of silicon carbide (SiC-B) was deter-mined with two different target designs (Targets B and C in Fig. 12) repre-senting different confinement conditions. The estimated transition velocities
*0v are given in Tables 7 and 8 and indicated as shaded areas in Fig. 16. The
dashed curves in the figure are based on Tate’s model [47].
0
500
1000
1000 1500 2000
u (m
/s)
v0 (m/s)
10.8 GPaR-Y = 6.8 GPa
Target BTarget C
FIGURE 16: Penetration velocity u versus impact velocity 0v in SiC-B for Target B ( ) and Target C ( ). The shaded areas indicate transition regions. Dashed curves are based on Tate’s model.
The influence of tube thickness on transition velocity and penetration ve-locity was studied for boron carbide. The target is shown in Fig. 11.
Figure 17 shows penetration velocity versus impact velocity from both impact experiments and simulations (for tube thickness = 2 mm). The transi-tion velocity is indicated with a shaded area. The dashed curve in the figure is based on Tate’s model.
INTERFACE DEFEAT AND PENETRATION 33
0
500
1000
1500
500 1000 1500 2000 2500
u (m
/s)
v0 (m/s)
R-Y = 4.2 GPa
FIGURE 17: Penetration velocity u versus impact velocity 0v for B4C and 2 mm confinement with ( ) and without ( ) damage evolution (simulations) and corre-sponding experimental results for B4C with 1 ( ), 2 ( ) and 4 mm ( ) tube thick-ness. The shaded area indicates transition region. Dashed curve is based on Tate’s model.
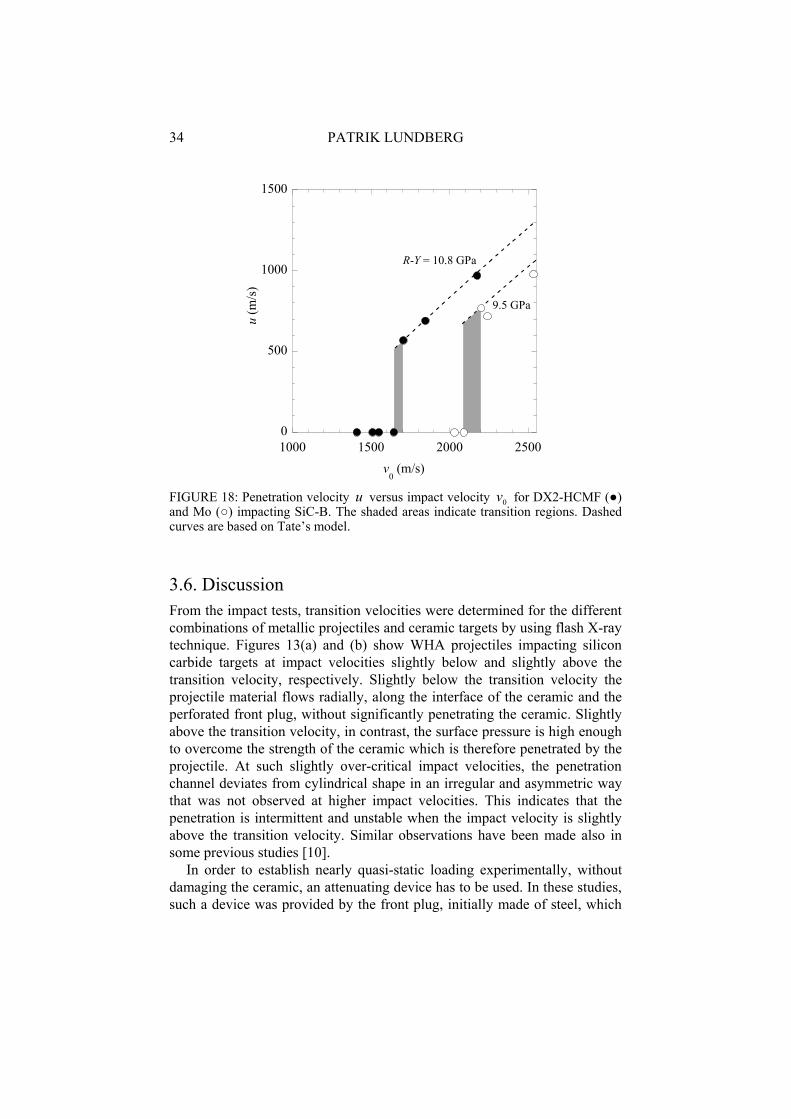
3.5. Density of projectile material Target B in Fig. 12 was used to study the influence of material properties of the projectile on the transition velocity. Two different projectile materials, a tungsten heavy alloy and molybdenum, with densities 17600 kg/m3 and 10220 kg/m3, respectively, were used. Observed intervals for the transition velocities are presented in Table 9 and shown in Fig. 18 together with esti-mated penetration velocities.
TABLE 9: Transition velocities for two combinations of projectile and target. The ends of intervals represent the highest velocity without penetration (-) and the lowest velocity with penetration (+).
Projectile/target materials Density Transition velocity Paper
p (kg/m3) *0v (m/s)
DX2-HCMF/SiC-B 17600 1675 30 Paper II Mo/SiC-B 10220 2145 55 -
34 PATRIK LUNDBERG
0
500
1000
1500
1000 1500 2000 2500
u (m
/s)
v0 (m/s)
R-Y = 10.8 GPa
9.5 GPa
FIGURE 18: Penetration velocity u versus impact velocity 0v for DX2-HCMF ( )and Mo ( ) impacting SiC-B. The shaded areas indicate transition regions. Dashed curves are based on Tate’s model.
3.6. Discussion From the impact tests, transition velocities were determined for the different combinations of metallic projectiles and ceramic targets by using flash X-ray technique. Figures 13(a) and (b) show WHA projectiles impacting silicon carbide targets at impact velocities slightly below and slightly above the transition velocity, respectively. Slightly below the transition velocity the projectile material flows radially, along the interface of the ceramic and the perforated front plug, without significantly penetrating the ceramic. Slightly above the transition velocity, in contrast, the surface pressure is high enough to overcome the strength of the ceramic which is therefore penetrated by the projectile. At such slightly over-critical impact velocities, the penetration channel deviates from cylindrical shape in an irregular and asymmetric way that was not observed at higher impact velocities. This indicates that the penetration is intermittent and unstable when the impact velocity is slightly above the transition velocity. Similar observations have been made also in some previous studies [10].
In order to establish nearly quasi-static loading experimentally, without damaging the ceramic, an attenuating device has to be used. In these studies, such a device was provided by the front plug, initially made of steel, which
INTERFACE DEFEAT AND PENETRATION 35
had such thickness that it considerably reduced the initial transient load on the surface of the ceramic.
Like the steel cover, the copper cover served to reduce the initial effect of impact by establishing erosion of the projectile before the latter reached the ceramic surface. During this process and the ensuing radial flow of the pro-jectile material, the copper cover was eroded so that the projectile material was left unsupported on the target surface. The results in Paper IV show that after radial flow had been established, it continued steadily for a long time. This observation agrees with previous findings [18].
Under conditions of interface defeat, a certain deformation of the surface of the ceramic target can be expected to occur due to the high surface pres-sure. One effect of the surface deflection is the generation of radial tensile stresses at the surface of the ceramic. These tensile stresses were reduced in the experimental tests due to the confining action of the tightly shrink-fitted steel tube. The confinement also counteracted the effect of the radial shear load due to friction at the interface of target and projectile.
Each of the ceramic materials tested showed a distinct transition from in-terface defeat to penetration that indicates the presence of some type of ma-terial instability. Possibly, there exists a unique transition velocity for each combination of projectile, target material and target configuration. This is supported by the tests with SiC-N where the maximum velocity observed for interface defeat was 1512 m/s and the minimum velocity observed for pene-tration was 1502 m/s. Here, the overlap of 10 m/s corresponds to the esti-mated inaccuracy of 5 m/s in the velocity measurements.
In Section 2.4, the surface pressures and the corresponding critical veloci-ties were established at which (i) plastic yield is initiated at a point on the axis below the surface and (ii) the domain of plastic yield reaches the target surface. These states of yield, labelled incipient plastic yield (IY) and full plastic yield (FY) are shown as lower and upper critical velocities in Fig. 14. It is noted that the estimated transition velocities generally appear near these critical velocities.
In Fig. 15(a), SiC-N shows the lowest transition velocity, slightly above 1500 m/s, and SiC-HPN the highest, slightly above 1600 m/s. As the target configurations and impact conditions were the same in these tests, the differ-ence between these transition velocities should depend on the mechanical properties of the two ceramic materials. Furthermore, as the maximum sur-face pressure 0p produced by the projectile during interface defeat is ap-proximately proportional to the square of the impact velocity 0v according to equation (5), i.e. 2
00 vp , the 8% higher transition velocity for SiC-HPN than for SiC-N corresponds to a 16% higher maximum surface pressure. If the transition velocity *
0v and the corresponding maximum surface pressure *0p are related to the shear yield strength Yc of the ceramic material
through 2*
0*0Yc vp as proposed in Paper II, the strength of SiC-HPN
would be expected to be about 16% higher than that of SiC-N. As can be
36 PATRIK LUNDBERG
seen in Fig. 15(a), however, the ranking in terms of hardness of the ceramic materials is not the same as that in terms of transition velocity. Actually, the hardness of SiC-HPN is 7% lower than that of SiC-N. This indicates that hardness alone, which reflects the shear yield strength, is not sufficient for estimation of the relative performances of ceramic materials in terms of tran-sition velocities. It follows that the transition velocity cannot be controlled by plastic flow alone.
Figure 15(b) shows the transition velocity versus fracture toughness. Here, an increase in transition velocity corresponds to an increase in fracture toughness, although the uncertainty in fracture toughness is large. The maximum surface pressure is 16% and the fracture toughness 15% higher for SiC-HPN than for SiC-N. This observation indicates that, under the prevail-ing conditions, fracture may have had more influence than plastic flow on the transition from interface defeat to penetration. As a consequence, the observed transition velocities may not be the maximum ones achievable. By suppression of the initiation and propagation of cracks through increase of the confining pressure, it may be possible to increase the transition veloci-ties.
The influence of confining pressure may be one reason for the difference in transition velocity between the two SiC-B targets used in Fig. 16. The target designs are shown in Fig. 12. The main difference between the two targets is the front cover. Target B, with a front cover (and back plug) welded to the confining tube, gives 8% higher transition velocity compared to Target C using the copper cover. Figure 16 shows that also the penetration velocity depends on the target configuration. The more confined target gives a higher penetration resistance relative to the target with a copper cover, especially at high impact velocity. Similar effects of confinement on the transition and penetration velocities have been indicated in modelling work by Holmquist et al. [21, 22].
The apparent effect of confinement on transition and penetration veloci-ties for silicon carbide is not observed in the impact experiments on boron carbide. The experimental results in Fig. 17 indicate that the influence of confinement thickness on the transition velocity is small. The same is ob-served for the penetration velocity, especially at high impact velocities.
The influence of the material properties of the projectile on the transition and penetration velocities is shown in Fig. 18. The transition velocity inter-vals determined for a DX2-HCMF projectile and a Mo projectile impacting SiC-B are indicated with grey zones. The assumption that the transition from interface defeat to penetration occurs at a critical surface pressure gives
*WHA
*Mo pp . Use of equation (5) and data in Table 1 for DX2-HCMF and
Mo then gives the relation between transition velocities as *WHA
*Mo vv 1.34
( 18001600 *WHAv m/s). This agrees reasonably well with the experi-
mental result 28.1*WHA
*Mo vv .
INTERFACE DEFEAT AND PENETRATION 37
In Figs. 16 to 18, Tate’s relation [47]
RuYuv 2t
2p 2
1)(21 (15)
between penetration velocity u and impact velocity v has been used to esti-mate the target penetration resistance R . In this relation, p and Y are the density and yield stress of the projectile, and t is the density of the target. With the assumption that the projectile strength is constant and equal to Y 2 GPa at the high strain rates at hand, the target penetration resistance Rvaries between 6.2 (boron carbide) and 12.8 GPa (silicon carbide) depending on the ceramic material and the confining technique used. The tests with WHA and Mo projectiles (see Fig. 18) gave nearly the same value of the penetration resistance for SiC-B, around 12 GPa.
The penetration velocity in boron carbide evaluated from simulations us-ing the JH2 model with damage evolution (black triangles) agrees reasona-bly well with the experimental results (open triangles) for impact velocities above the transition region, see Fig. 17. However, the results of simulation do not show the strong variation of penetration velocity in the transition re-gion that can be observed in the experimental results. Therefore, simulations with damage evolution suspended were performed for some impact veloci-ties below the transition region. The results of these simulations (grey trian-gles) show low penetration velocities in accordance with the experimental tests.
4. TRANSITION VELOCITY VERSUS PROJECTILE GEOMETRY
In order to assess the influence of conical shape of a tungsten projectile on the transition velocity, experimental tests with conical and cylindrical WHA projectiles impacting silicon carbide targets were performed together with numerical simulations using the Autodyn code.
The simulations were run in two steps. In the first, the surface pressures on the target were determined for different impact velocities under assumed condition of interface defeat. In the second, these surface pressures were applied to the target in order to obtain critical states of damage and failure related to the transition between interface defeat and penetration, see Fig. 9.
The JC and JH1 constitutive models were used for tungsten (Y925) and silicon carbide (SiC-B), respectively. The models are described in Section 2.4, and the material data used are given in Tables 4 and 5.
38 PATRIK LUNDBERG
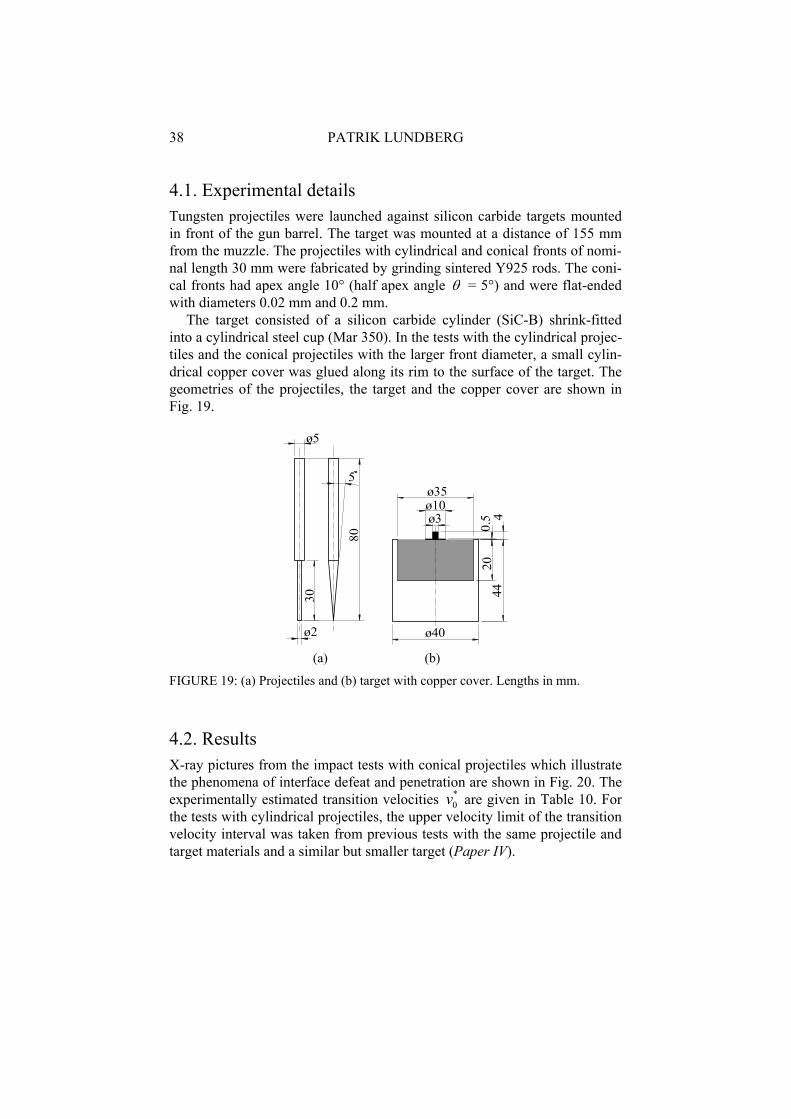
4.1. Experimental details Tungsten projectiles were launched against silicon carbide targets mounted in front of the gun barrel. The target was mounted at a distance of 155 mm from the muzzle. The projectiles with cylindrical and conical fronts of nomi-nal length 30 mm were fabricated by grinding sintered Y925 rods. The coni-cal fronts had apex angle 10° (half apex angle = 5°) and were flat-ended with diameters 0.02 mm and 0.2 mm.
The target consisted of a silicon carbide cylinder (SiC-B) shrink-fitted into a cylindrical steel cup (Mar 350). In the tests with the cylindrical projec-tiles and the conical projectiles with the larger front diameter, a small cylin-drical copper cover was glued along its rim to the surface of the target. The geometries of the projectiles, the target and the copper cover are shown in Fig. 19.
30
80
ø2
5
ø40
4420
ø3ø10ø35
0.5 4
ø5
(a) (b)
FIGURE 19: (a) Projectiles and (b) target with copper cover. Lengths in mm.
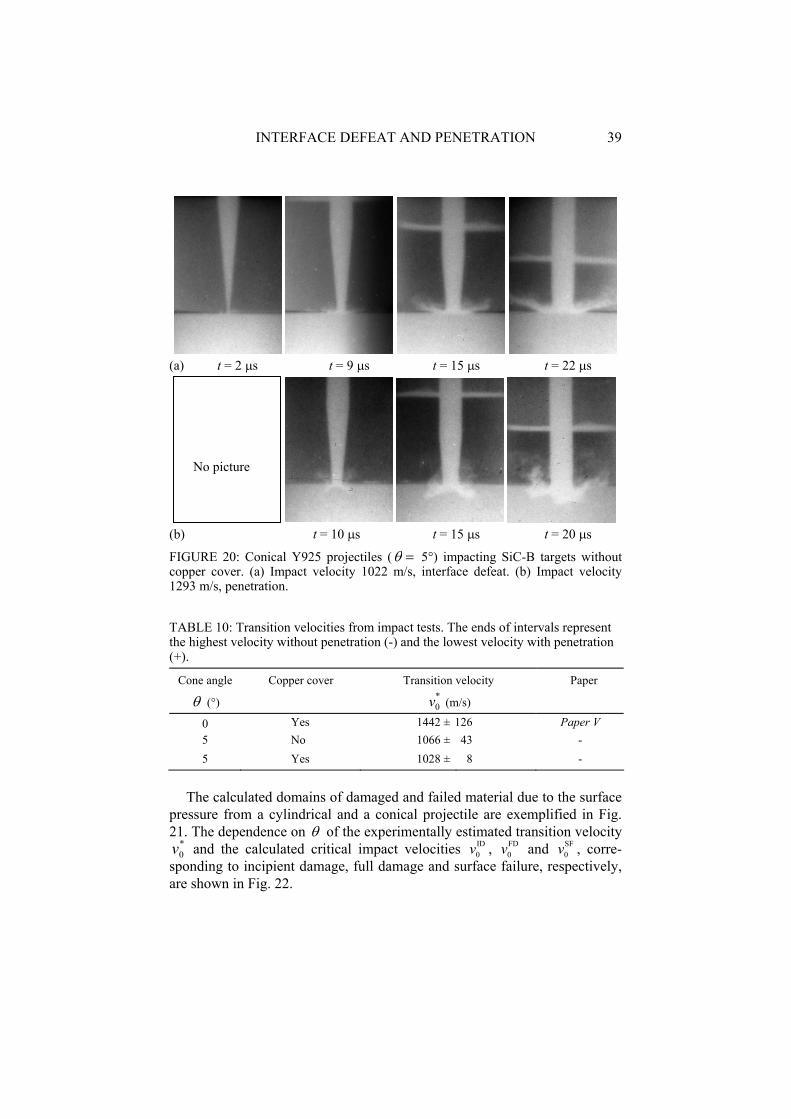
4.2. Results X-ray pictures from the impact tests with conical projectiles which illustrate the phenomena of interface defeat and penetration are shown in Fig. 20. The experimentally estimated transition velocities *
0v are given in Table 10. For the tests with cylindrical projectiles, the upper velocity limit of the transition velocity interval was taken from previous tests with the same projectile and target materials and a similar but smaller target (Paper IV).
INTERFACE DEFEAT AND PENETRATION 39
(a) t = 2 s t = 9 s t = 15 s t = 22 s
(b) t = 10 s t = 15 s t = 20 s
FIGURE 20: Conical Y925 projectiles ( 5 ) impacting SiC-B targets without copper cover. (a) Impact velocity 1022 m/s, interface defeat. (b) Impact velocity 1293 m/s, penetration.
TABLE 10: Transition velocities from impact tests. The ends of intervals represent the highest velocity without penetration (-) and the lowest velocity with penetration (+).
Cone angle Copper cover Transition velocity Paper
( ) *0v (m/s)
0 Yes 1442 ± 126 Paper V 5 No 1066 ± 43 - 5 Yes 1028 ± 8 -
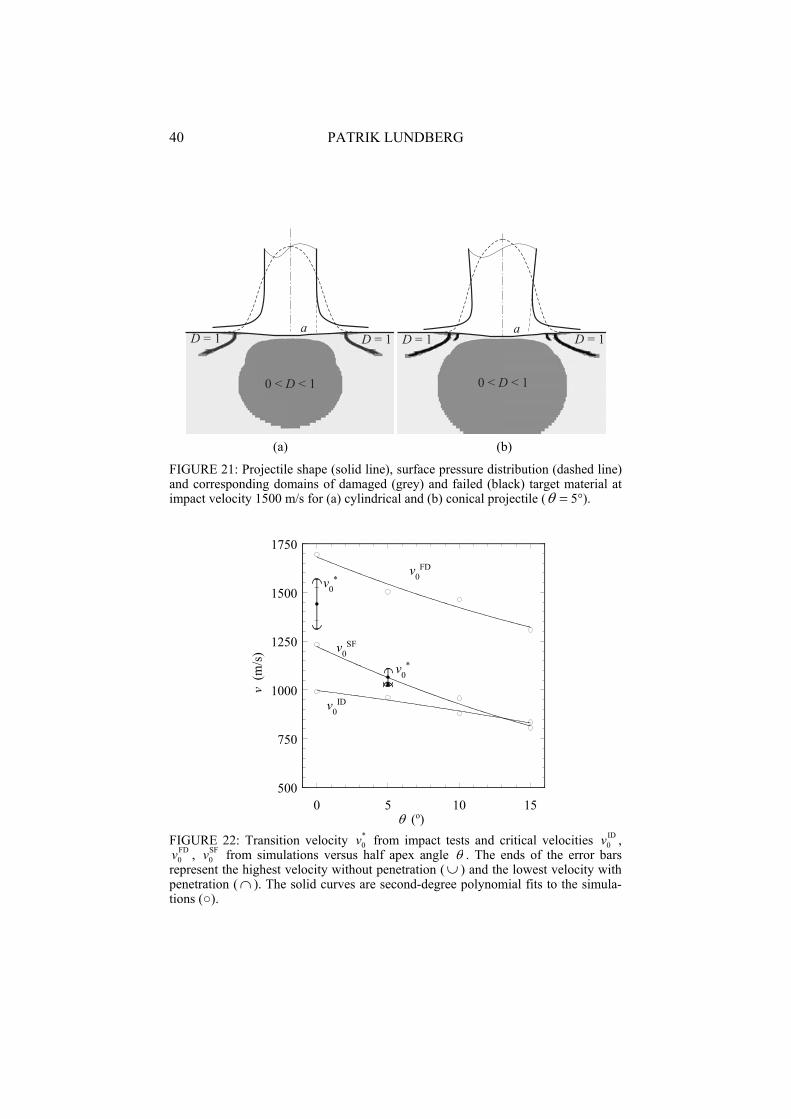
The calculated domains of damaged and failed material due to the surface pressure from a cylindrical and a conical projectile are exemplified in Fig. 21. The dependence on of the experimentally estimated transition velocity
*0v and the calculated critical impact velocities ID
0v , FD0v and SF
0v , corre-sponding to incipient damage, full damage and surface failure, respectively, are shown in Fig. 22.
No picture
40 PATRIK LUNDBERG
a
D = 1D = 1
0 < < 1D
(a) (b)
FIGURE 21: Projectile shape (solid line), surface pressure distribution (dashed line) and corresponding domains of damaged (grey) and failed (black) target material at impact velocity 1500 m/s for (a) cylindrical and (b) conical projectile ( 5 ).
500
750
1000
1250
1500
1750
0 5 10 15(o)
v (m
/s)
v0ID
v0SF
v0FD
v0*
v0*
FIGURE 22: Transition velocity *0v from impact tests and critical velocities ID
0v ,FD0v , SF
0v from simulations versus half apex angle . The ends of the error bars represent the highest velocity without penetration ( ) and the lowest velocity with penetration ( ). The solid curves are second-degree polynomial fits to the simula-tions ( ).
INTERFACE DEFEAT AND PENETRATION 41
4.3. Discussion The upper limit of the estimated transition velocity interval from interface defeat to penetration for the cylindrical projectile was taken from Paper IV.As a lower radial confining pressure (less than one third of the pressure in the previous study) and a smaller copper cover were used here, it is likely that this upper limit is not too low.
The copper covers were used in order to reduce the initial effect of impact by establishing erosion before the projectiles reached the target surfaces. The use of smaller cover size relative to the projectile radius than in the previous tests (Paper IV) may have resulted in less erosion of the projectile, higher tip velocity and higher stress transmitted to the target surface at a given impact velocity. This may have increased the surface damage and reduced the tran-sition velocity in the case of cylindrical projectiles.
In the tests with conical projectiles, the size of the copper cover was large compared to the initial diameter of the projectile tip. This means that the initial loading of the target surface was smoother than in the tests with cylin-drical projectiles. Yet, the transition velocity for conical projectiles and cop-per-covered targets was significantly lower than that for the cylindrical pro-jectiles and the same kind of targets. For the conical projectiles, the copper cover had little effect on the transition velocity. This indicates that the dif-ference in transient load due to the cover had little significance.
Above the transition velocity, the mode of initial penetration of the coni-cal projectile differed markedly from that usually seen for a cylindrical pro-jectile. The penetration occurred along a surface crack, which qualitatively corresponds to the surface failure observed in the simulations (Fig. 21). This can be seen in Fig. 20(b), where the exposures at 10 and 15 s indicate that the angle of the crack relative to the target surface is 30-35°. In the last ex-posure, at 20 s, the projectile material had penetrated along the crack to a depth of 2-4 mm. This type of cone-shaped surface cracks is a result of the radial stretching of the target surface in the vicinity of the loaded area.
The simulations of the projectile load show that the amplitude of the sur-face pressure is almost independent of time for conical as well as for cylin-drical projectiles. For a conical projectile, under conditions of self-similar flow, the load grows radially so that the dimensionless surface pressure ver-sus dimensionless radius is approximately independent of time.
Because of difficulties in solving the complete problem of interaction of projectile and target, the damage of the target was determined for an ideal-ised quasi-static loading. Neither the initial transient part of the loading nor the radial growth of the load for conical projectiles was taken into account. It is believed that these simplifications did not introduce significant errors, especially when comparing with the tests in which copper covers were used. Details of the simulations of the target can be found in Paper V.
42 PATRIK LUNDBERG
The calculated damage of the target material is shown in Fig. 21 for (a) a cylindrical ( 0 ) and (b) a conical ( 5 ) projectile with the same effec-tive radius a 1 mm and impact velocity 1500 m/s. The projectiles give rise to similar damage, viz., a domain of damaged material just below the target surface and a cone-shaped zone of failed material at the surface. The domain of damaged material and the cone-shaped zone of failed material for the cylindrical projectile correspond qualitatively to findings in targets from interface defeat experiments [16].
The decrease of the critical velocities ID0v , FD
0v and SF0v with increasing
half apex angle observed in Fig. 22 is mainly an effect of the increase in the maximum surface pressure with this angle. For the cylindrical projectile ( 0°), the magnitudes of these velocities and the transition velocity *
0v are related as ID
0v 990 m/s < SF0v 1230 m/s < 1442*
0v m/s < FD0v 1690 m/s.
For the conical projectile ( = 5°) and copper-covered target, they are related as ID
0v 960 m/s < SF0v 1030 m/s 1028*
0v m/s < FD0v 1500 m/s. Thus,
for the conical projectile the transition velocity is much lower relative to the three critical velocities than that for the cylindrical projectile, and it is close to the critical velocity SF
0v associated with the formation of surface failure observed both in the experimental tests and in the simulations. This means that the difference in transition velocity between the cylindrical and the conical projectile is too large to be explained by the increased surface pres-sure alone.
The main reason for the different modes of penetration of cylindrical and conical projectiles, and the large difference in transition velocity, is believed to be the radial growth of the surface load from the conical projectile. This growth has the effect that cone-shaped surface cracks are exposed to the radial flow of projectile material under rising surface pressure. Therefore, when the pressure is sufficiently high, projectile material penetrates into the crack as seen in the experimental tests. Similar flow of projectile material into large surface cracks might occur also for cylindrical projectiles in the case of yawed impact.
INTERFACE DEFEAT AND PENETRATION 43
5. INFLUENCE OF SCALE ON PENETRATION As the impact experiments in Papers II-V are performed in reduced scale (relative to a full calibre projectile), scaling laws are important when test results from small-scale experiments are to be translated to full scale. Usu-ally, replica-scaling is used, by which we mean that the geometrical dimen-sions are scaled uniformly, while the materials and the impact velocities are kept the same.
This section deals with the validity of replica scaling for penetration of long-rod projectiles into ceramic targets. Simple projectile and target geome-tries, which allow proper scaling of all geometrical dimensions, were stud-ied. Thus, the projectiles were flat-ended smooth cylindrical tungsten rods and the targets were unconfined alumina cylinders with cylindrical steel backings. The impact tests were carried out in three different scales (change of length scale with a factor of 5) and for two impact velocities, viz., 1500 and 2500 m/s. Autodyn was used for simulation of the penetration process in one of the scales, with projectile of length 75 mm. The material models (JC and JH2) are described in Section 2.4. Parameters are shown in Table 4 for DX2-HCMF and 2541-03 and in Table 6 for alumina.
5.1. Replica scaling The validity of replica scaling in projectile penetration processes has been subjected to several studies. Magness and Leonard [29] reported improved projectile performance with increased scale (change of scale with a factor of 2) for depleted uranium and tungsten projectiles penetrating different steel targets. Anderson et al. [30] found a similar trend in scaled impact experi-ments with ceramic targets (change of scale with a factor of 4). In contrast, Lundberg et al. [31, 32] studied replica scaling for tungsten projectiles pene-trating homogenous steel targets (change of scale with a factor of 30) and oblique plates (change of scale with a factor of 2) but found no significant influence of scale.
There may be several reasons for lack of scaling which are of a practical nature. For example, some geometrical details may not be fully considered, and the impact conditions may be difficult to reproduce in small scale. Also, the material properties may be size-dependent due to the manufacturing process. A more fundamental reason is that some material properties, such as fracture toughness and characteristic strain rate are kept constant in replica scaling.
44 PATRIK LUNDBERG
In order to establish dimensionless parameters, all lengths, velocities and densities were normalized to those of the projectile ( pL , 0v , p , respec-tively). Other reference quantities were taken as the temperature of the pro-jectile pT and products of powers of pL , 0v , p , see column 2 in Table 11. In [48], dimensional analysis was carried out for a similar problem.
TABLE 11: Replica scale factors for essential quantities.
Quantity Reference quantity Replica scale factor
*x *scalefull
*model xx
Length (m) *LVelocity (m/s) *v 1 Density (Kg/m3) * 1 Temperature (K) *T 1 Time (s) 1** )(vLMass (kg) 3** )(L 3
Strain 1 1 Strain rate (1/s) *1*)( vL
1
Stress (Pa) 2** )(v 1 Stress intensity (Pam1/2) 21*2** )()( Lv
21
Specific heat (J/kg K) 1*2* )()( Tv 1
The response function describing the dimensionless penetration *LP as a function of dimensionless time *tt can be expressed as
P,** ttf
LP , (16)
where P is a vector containing the dimensionless parameters (pi-terms) rele-vant for the problem. Proper scaling prevails if all dimensionless parameters are the same in full scale as in the model (reduced scale).
In replica modeling, the scale factors for velocity, density and temperature are equal to unity, and the scale factor for length is . The scale factors for these four basic reference quantities are given in column 3 of Table 11 to-gether with those for some other important reference quantities.
As can be seen, strain rate and stress intensity scale as 1 and 21 , re-spectively. For proper scaling, the characteristic strain rate and fracture toughness of the materials used in the model should therefore be higher and lower, respectively, than in the full scale.
INTERFACE DEFEAT AND PENETRATION 45
In this study, where replica scaling is used, these quantities are the same in all three scales (the same materials). If these quantities (or some other parameters which may have been overlooked) are significant, a deviation in the response *LP versus *tt between the different scales should be ob-served.
5.2. Experimental details Twelve impact tests were carried out by firing tungsten projectiles with lengths pL = 30, 75 and 150 mm and length-to-diameter ratio pp DL 15 at nominal impact velocities 1500 and 2500 m/s into ceramic targets. Each target consisted of an alumina (Al2O3-Ifö) cylinder glued on a steel backing (SIS 2541-03). Photographs of the alumina cylinders and the tungsten pro-jectiles for the 1500 m/s tests are shown in Fig. 23.
FIGURE 23: Alumina targets and tungsten projectiles for 1500 m/s tests.
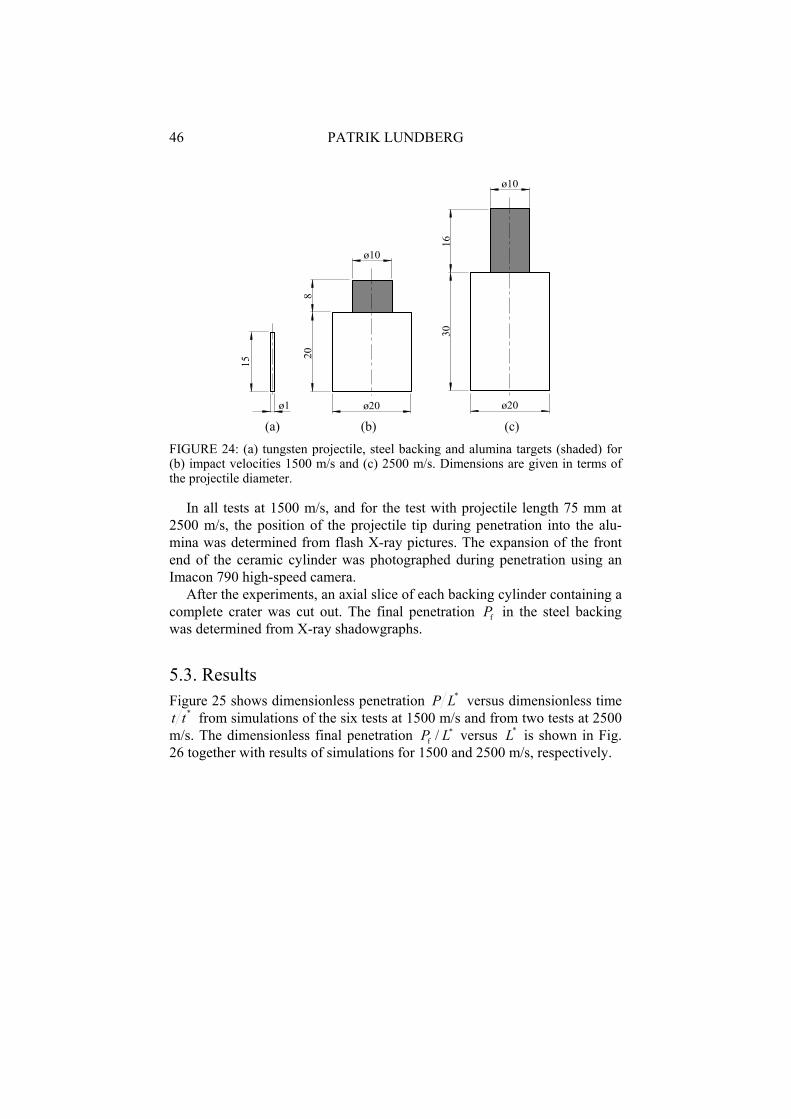
The dimensions of the targets (ceramics and backings) and projectiles given in terms of the projectile diameter are shown in Fig. 24.
46 PATRIK LUNDBERG
ø10
ø20ø20
ø10
ø1
208
3016
15
(a) (b) (c)
FIGURE 24: (a) tungsten projectile, steel backing and alumina targets (shaded) for (b) impact velocities 1500 m/s and (c) 2500 m/s. Dimensions are given in terms of the projectile diameter.
In all tests at 1500 m/s, and for the test with projectile length 75 mm at 2500 m/s, the position of the projectile tip during penetration into the alu-mina was determined from flash X-ray pictures. The expansion of the front end of the ceramic cylinder was photographed during penetration using an Imacon 790 high-speed camera.
After the experiments, an axial slice of each backing cylinder containing a complete crater was cut out. The final penetration fP in the steel backing was determined from X-ray shadowgraphs.
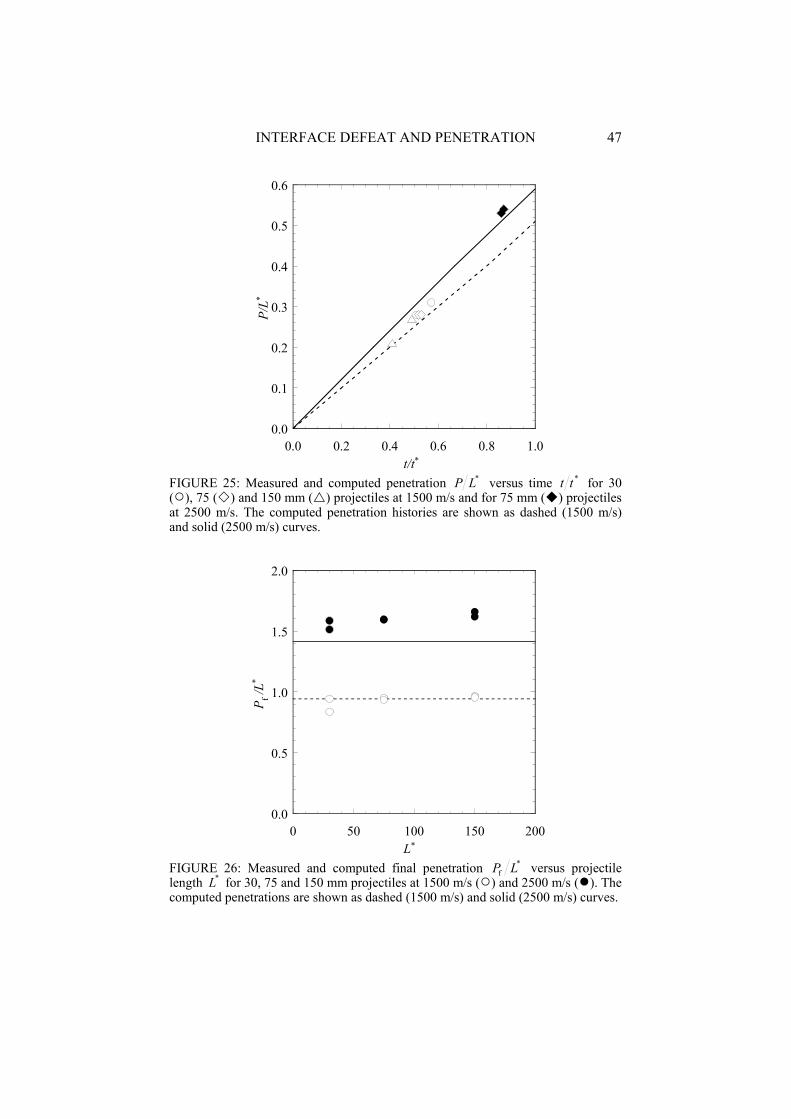
5.3. ResultsFigure 25 shows dimensionless penetration *LP versus dimensionless time
*tt from simulations of the six tests at 1500 m/s and from two tests at 2500 m/s. The dimensionless final penetration LP /f versus *L is shown in Fig. 26 together with results of simulations for 1500 and 2500 m/s, respectively.
INTERFACE DEFEAT AND PENETRATION 47
0.0
0.1
0.2
0.3
0.4
0.5
0.6
0.0 0.2 0.4 0.6 0.8 1.0t/t*
P/L*
FIGURE 25: Measured and computed penetration *LP versus time *tt for 30 ( ), 75 ( ) and 150 mm ( ) projectiles at 1500 m/s and for 75 mm ( ) projectiles at 2500 m/s. The computed penetration histories are shown as dashed (1500 m/s) and solid (2500 m/s) curves.
0.0
0.5
1.0
1.5
2.0
0 50 100 150 200L*
P f/L
*
FIGURE 26: Measured and computed final penetration *f LP versus projectile
length *L for 30, 75 and 150 mm projectiles at 1500 m/s ( ) and 2500 m/s ( ). The computed penetrations are shown as dashed (1500 m/s) and solid (2500 m/s) curves.
48 PATRIK LUNDBERG
5.4. Discussion In Fig. 25, the dimensionless penetrations *LP versus dimensionless time
*tt from the six tests at 1500 m/s seem to fall on a single curve, which sup-ports the validity of replica scaling. The numerical simulations show an ap-proximately linear dependence of *LP on *tt , corresponding to an ap-proximately constant penetration velocity. The experimental points at both 1500 and 2500 m/s are slightly above the results of simulations.
The dependence of the dimensionless final penetration LP /f on the length scale, expressed in terms of projectile length *L , is shown in Fig. 26. If replica modelling is valid, LP /f for each impact velocity should not de-pend on *L . Such independence seems to prevail with fairly good approxi-mation, regardless of the slight scatter in impact velocity and angle of attack. Possibly, there is a slight increase in the final dimensionless penetration
LP /f with *L . Linear regression suggests 3.5 and 2.4% increase in LP /f
as *L changes by a factor of two at 1500 and 2500 m/s, respectively. The computed final penetration agrees well with the measured ones at the lower impact velocity, but the simulations underestimate the final penetration at the higher impact velocity.
As the intention was not to model scale effects, a strain-rate independent constitutive model was used for alumina, and the simulations were per-formed for one geometrical scale only. However, the models for tungsten and steel are strain rate dependent, from which it follows that the computa-tional model is not perfectly invariant under replica scaling. In order to esti-mate the influence of strain rate, the simulations were repeated with the strain rate parameter C = 0 in the JC model, equation (7). The influence on the normalized penetrations shown in Figs. 25 and 26 was less than 1.2%.
INTERFACE DEFEAT AND PENETRATION 49
6. CONCLUSIONS Each of the ceramic materials tested showed a distinct transition from inter-face defeat to penetration. Possibly, there exists a unique transition velocity for each combination of projectile, target material and target configuration. This is supported by the tests with SiC-N where the transition velocity inter-val corresponds to the estimated inaccuracy in the velocity measurements. Tests with different projectile materials (WHA and Mo) indicate that the transition occurs at a critical surface pressure. Use of equation (5) gives the relation between transition velocities as *
WHA*Mo vv 1.34 which agrees rea-
sonably well with the experimental result 28.1*WHA
*Mo vv .
Critical velocities were established by using two models, viz., one for the surface pressure during interface defeat and one of the response of the ce-ramic target. The critical velocities correspond to critical surface pressures at which (i) plastic yield is initiated at a point on the axis below the surface (incipient plastic yield) and (ii) the domain of plastic yield reaches the target surface (full plastic yield). It is noted that the estimated transition velocities for different types of ceramics (silicon carbide, titanium diboride and Syn-die) generally appear near these critical velocities (Fig. 14). The ceramic material with the highest hardness, Syndie, shows the highest transition ve-locity, 2110 m/s.
For one type of ceramic material (four grades of silicon carbide), the ranking in terms of hardness is not the same as that in terms of transition velocity (Fig. 15(a)). This indicates that hardness alone, which reflects the shear yield strength, is not sufficient for estimation of the relative perform-ances of ceramic materials in terms of transition velocities. It follows that the transition velocity cannot be controlled by plastic flow alone. Figure 15(b) shows that an increase in transition velocity corresponds to an increase in fracture toughness, although the uncertainty in fracture toughness measure-ments is large. This observation indicates that, under the prevailing condi-tions, fracture may have had more influence than plastic flow on the transi-tion from interface defeat to penetration. As a consequence, the observed transition velocities may not be the maximum ones achievable. By suppres-sion of the initiation and propagation of cracks through increase of the con-fining pressure, it may be possible to increase the transition velocities. A slight increase in transition velocity as well as in penetration resistance due to increased confinement was observed in the tests with silicon carbide (SiC-B) but not with boron carbide (B4C-AC).
50 PATRIK LUNDBERG
For a conical projectile, at impact velocities above the transition velocity, the mode of initial penetration differed markedly from that usually seen for a cylindrical projectile. The penetration occured along a surface crack and the transition velocity was lower than the transition velocity observed for cylin-drical projectiles. Numerical simulations using Autodyn indicate that the transition is related to a critical velocity at which surface failure is initiated. At higher velocities this surface failure develops to a surface crack. This surface crack is present for both cylindrical and conical projectiles (Fig. 21). The main reason for the different modes of penetration of cylindrical and conical projectiles, and the large difference in transition velocity, is believed to be the radial growth of the surface load from the conical projectile. This growth has the effect that the surface crack is exposed to the radial flow of projectile material under rising surface pressure. Therefore, when the pres-sure is sufficiently high, projectile material penetrates into the crack as seen in the experimental tests.
Results from impact experiments with scaled unconfined alumina targets support the use of replica scaling in projectile penetration processes. Only a slight increase in final penetration LP /f with length scale L* can be seen. Linear regression suggests 3.5 and 2.4% increase in LP /f as scale increases by a factor of two at 1500 and 2500 m/s, respectively. This indicates that the small-scale test results in Papers II-V can be translated to full scale by use of replica scaling.
INTERFACE DEFEAT AND PENETRATION 51
REFERENCES1. A. Kelly and N. H. Macmillan. Strong Solids. Oxford: Clarendon Press (1986). 2. R. Feng, Y. M. Gupta and G. Yuan, Dynamic strength and inelastic deformation
of ceramics under shock wave loading. Shock compression of condensed matter-1997, edited by S. C. Schmidt, D. P. Dandekar and J. W. Forbes. AIP, pp. 483-488 (1998).
3. I. Mellgard, L. Holmberg, L-G. Olsson. An experimental method to compare the ballistic efficiencies of different ceramics against long rod projectiles. Proc. 11th. Int. Symp. on Ballistics, Vol. 2, 323-331(1989).
4. H. J. Ernst and K. Hoog. Protective power of several ceramics, correlated to some static material parameters. Proc. 13th. Int. Symp. Ballistics, Vol. 3, 119-126 (1993).
5. D. Yaziv, and Y. Partom. The ballistic efficiency of thick alumina targets against long rod penetrators. Proc. 14th. Int. Symp. Ballistics, Vol. 2, 331-340 (1993).
6. C. E. Anderson, Jr, and S. A. Royal-Timmons. Ballistic performance of 99.5%-Al2O3 ceramic tiles. Int. J. Impact Engng, 19(8), 703-713 (1997).
7. I. M. Pickup, A. K. Barker, R. Chenari, B. J. James, V. Hohler, K. Weber and R. Tham. Aspects of geometry affecting the ballistic performance of ceramic tar-gets. Ceramic Armour Materials by Design, Edited by J. W. McCauley, A. Crowson, W. A. Gooch, Jr., A. M. Rajendran, S. J. Bless, K. V. Logan, M. Normandia, S. Wax, Ceramic Transactions, Vol. 134, 643-650 (2002).
8. R. Subramanian and S. J. Bless. Penetration of semi-infinite AD995 alumina targets by tungsten long rod penetrators from 1.5 to 3.5 km/s. Int. J. Impact Engng, 17, 807-816 (1995).
9. D. L. Orphal, R. R. Franzen, A. J. Piekutowski and M. J. Forrestal. Penetration of confined aluminum nitride targets by tungsten long rods at 1.5 to 4.5 km/s. Int. J. Impact Engng, 18(4), 355-368 (1996).
10. D. L. Orphal and R. R. Franzen. Penetration of confined silicon carbide targets by tungsten long rods at impact velocities from 1.5 to 4.6 km/s. Int. J. Impact Engng, 19(1), 1-13 (1997).
11. D. L. Orphal, R. R. Franzen, A. C. Charters, T. L. Menna and A. J. Piekutowski. Penetration of confined boron carbide targets by tungsten long rods at impact velocities from 1.5 to 5.0 km/s. Int. J. Impact Engng, 19(1), 15-29, (1997).
12. D. L. Orphal, C. E. Anderson, Jr., D. W. Tempelton, Th. Behner, V. Hohler and S. Chocron. Using long rod penetration to detect the effect of failure kinetics in ceramics. Proc. 21st. Int. Symp. Ballistics, Vol. 2, 744-751 (2004).
13. Ceramic Armour Materials by Design, Edited by J. W. McCauley, A. Crowson, W. A. Gooch, Jr., A. M. Rajendran, S. J. Bless, K. V. Logan, M. Normandia, S. Wax, Ceramic Transactions, Vol. 134, (2002).
14. D. A. Shockey, A. H. Marchand, S. R. Skaggs, G. E. Cort, M. W. Burkett and R. Parker. Failure phenomenology of confined ceramic targets and impacting rods. Int. J. Impact Engng, 9(3), 263-275 (1990).
15. G. E. Hauver, P. H. Netherwood, R. F. Benck and L. J. Kecskes. Ballistic per-formance of ceramic targets. U. S. Army Symposium On Solid Mechanics, USA (1993).
52 PATRIK LUNDBERG
16. G. E. Hauver, P. H. Netherwood, R. F. Benck and L. J. Kecskes. Enhanced ballistic performance of ceramic targets. 19th. Army Science Conference, USA (1994).
17. E. J. Rapacki, G. E. Hauver, P. H. Netherwood and R. F. Benck. Ceramics for armours- a material system perspective. 7th. Annual TARDEC Ground Vehicle Survivability Symposium, USA (1996).
18. P. Lundberg, R. Renström, L. Holmberg. An experimental investigation of inter-face defeat at extended interaction times. Proc. 19th. Int. Symp. Ballistics, Vol. 3, 1463-1469 (2001).
19. J. C. LaSalvia, E. J. Horwath, E. J. Rapacki, C. J. Shih and M. A. Meyers. Mi-crostructural and micromechanical aspects of ceramic/long-rod projectiles inter-actions: dwell/penetration transitions. In Fundamental Issues and applications of Shock-Wave and High-Strain-Rate Phenomena, 437-446, edited by K. P. Staudhammer, L. E. Murr and M. A. Meyers, Elsevier Science, New York, (2001).
20. T. J. Holmquist and G. R. Johnson. A detailed computational analysis of inter-face defeat, dwell and penetration for a variety of ceramic targets. Proc. 20th.Int. Symp. Ballistics, Vol. 2, 746-753 (2002).
21. T. J. Holmquist and G. R. Johnson. Modelling projectile impact onto pre-stressed ceramic targets. J. Phys. IV, France, 110, 597-602 (2003).
22. T. J. Holmquist and G. R. Johnson. Modelling pre-stressed ceramic and its effect on ballistic performance. Int. J. Impact Engng (in press).
23. R. Renström, P. Lundberg, B. Lundberg. Stationary contact between a cylindri-cal metallic projectile and a flat target under conditions of dwell. Int. J. Impact Engng, 30, 1265-1282 (2004).
24. G. R. Johnson and T. J. Holmquist. A computational constitutive model for brittle materials subjected to large strains, high strain rates and high pressure. Proc. EXPLOMET Conference, San Diego, (1990).
25. D. R. Curran, L. Seaman, T. Cooper and D. A. Schockey. Micromechanical model for comminution and granular flow of brittle material under high pressure and strain raite; application to penetration of ceramic plates. Int. J. Impact Engng, 13(1), 53-83 (1993).
26. G. R. Johnson and T. J. Holmquist. An improved computational constitutive model for brittle materials. In High pressure science and technology—1993, Vol. 2, 981-984, Edited by S. C. Schmidt, J. W. Shaner, G. A. Samara and M. Ross, AIP Press, New York (1994).
27. A. M. Rajendran. Modeling the impact behaviour of AD85 ceramic under mul-tiaxial loading. Int. J. Impact Engng, 15(6), 749-768 (1994).
28. S. J. Bless, Z. and Rosenberg, B. Yoon. Hypervelocity penetration of ceramics. Int. J. Impact Engng, 5, 165-171 (1987).
29. L. Magness and W. Leonard. Scaling issues for kinetic energy penetrators. Proc.14th Int. Symp. on Ballistics, Vol. 2, 281-289, (1993).
30. C. E. Anderson Jr., S. A. Mullin, A. J. Piekutowski, N. W. Blaylock and K. L Poormon. Scale model experiments with ceramic laminated targets. Int. J. Im-pact Engng, 18(1), 1-22 (1996).
31. P. Lundberg and L. Holmberg. Replica modelling experiments with long rod projectiles into homogeneous armour steel. Proc. 16th. Int. Symp. on Ballistics.Vol. 3, 329-338 (1996).
32. P. Lundberg, M. Wickert, O. Andersson, L. Holmberg, V. Hohler. Replica mod-elling experiments with long rod penetrators hitting oblique plates. Influence of scale and experimental deviations. Proc. 21st. Int. Symp. Ballistics, Vol. 1, 232-238 (2004).
INTERFACE DEFEAT AND PENETRATION 53
33. J. W. Dally, W. F. Railey. Experimental stress analysis. MacGraw-Hill (1991). 34. G. R. Anstis, P. Chantikul, B. R. Lawn and D. B. Marshall. "Elastic/Plastic
Indentation Damage in Ceramics: The Median/Radial Crack System", J. Am. Ceram. Soc., 63, 574-581 (1980).
35. K. Zeng, E. Söderlund, A. E. Giannakopoulos and D. J. Rowcliffe. Controlled indentation: a general approach to determine mechanical properties of brittle materials. Acta mater, 44(3), 1127-1141 (1996).
36. K. Zeng and D. Rowcliffe. Analysis of penetration curves produced by sharp indentations on ceramic materials. Philosophical magazine A, 74(5), 1107-1116 (1996).
37. K. L. Johnson. Contact mechanics. Cambridge University Press (1985). 38. T. J. Holmquist, A. M. Rajendran, D. W. Templeton and K. D. Bishnoi. A ce-
ramic material database. TARDEC technical report AMSTA-TR-R (MS 263), (1999).
39. K. Birnbaum, M. S. Cowler, M. Itoh, M. Katayama and H. Obata. AUTODYN - an interactive non-linear dynamic analysis program for microcomputers through supercomputers. Ninth International Conference on Structural Mechanics in Reactor Technology. Lausanne, Switzerland, (1987).
40. K. Birnbaum and M. S. Cowler. Numerical simulation of impact phenomena in an interactive computing environment. International Conference on Impact Loading and Dynamic Behaviour of Materials "IMPACT 87". Bremen, Federal Republic of Germany, (1987).
41. F. Reich. Omlenkung eines freien Flussigkeitsstrahles an einer zur Strömungs-richtung senkrecht stehenden ebenen Platte. Diss Hannover: 1926, (oder VDI-Forsch. –Heft 290).
42. R. T. Shield. On the plastic flow of metals under conditions of axial symmetry. Proc. R. Soc. A., 233-267 (1955).
43. G. R. Johnson and W. H. Cook. A constitutive model and data for metals sub-jected to large strains, high strain rates, and high temperatures. Proc. 7th. Int. Symp. Ballistics, 541-547 (1983).
44. P. Skoglund. Constitutive modelling of a tungsten heavy metal alloy. J. Phys. IV, 207-212, France, 110 (2003).
45. T. J. Holmquist and G. R. Johnson. Response of silicon carbide to high velocity impact. J. Appl. Phys., 91(9), 5858-5866 (2002).
46. G. R. Johnson and T. J. Holmquist. Response of boron carbide subjected to large strains, high strain rates and high pressure. J. Appl. Phys., 85(12), 8060-8073 (1999).
47. A. Tate. Further results in the theory of long rod penetration. J. Mech. Phys. Solids. Vol. 17, 141-150 (1969).
48. C. E. Anderson Jr., S. A. Mullin, C. J. Kuhlman. Computer simulation of strain-rate effects in replica scale model penetration experiments. Int. J. Impact Engng,13(1), 35-52 (1993).
Acta Universitatis UpsaliensisComprehensive Summaries of Uppsala Dissertations
from the Faculty of Science and TechnologyEditor: The Dean of the Faculty of Science and Technology
Distribution:Uppsala University Library
Box 510, SE-751 20 Uppsala, Swedenwww.uu.se, [email protected]
ISSN 1104-232XISBN 91-554-6077-1
A doctoral dissertation from the Faculty of Science and Technology, UppsalaUniversity, is usually a summary of a number of papers. A few copies of thecomplete dissertation are kept at major Swedish research libraries, while thesummary alone is distributed internationally through the series ComprehensiveSummaries of Uppsala Dissertations from the Faculty of Science and Technology.(Prior to October, 1993, the series was published under the title “ComprehensiveSummaries of Uppsala Dissertations from the Faculty of Science”.)
Summary in Swedish
Interface Defeat och Penetration: Två Interaktionsmoder mellan Metalliska Projektiler och Keramiska Mål Keramiska material som används i skydd mot projektilpenetration karakteri-seras av hög hållfasthet (hög hårdhet) och låg densitet men också av relativt stor sprödhet (låg brottseghet). I enklare skyddskonstruktioner dominerar sprödheten över hållfastheten vilket resulterar i att kerammaterialet fragmen-teras och krossas vid projektilanslaget. Motståndet mot penetration ges där-för i huvudsak av det krossade kerammaterialets egenskaper snarare än det intakta, oskadade.
Genom att utnyttja olika former av krymp- eller pressförband (fördäm-ning) samt styra hur projektilen initialt belastar kerammaterialet kan frag-menteringsprocessen helt eller delvis undertryckas. Därmed kan en avsevärt större andel av det intakta materialets höga hållfasthet bidra till penetra-tionsmotståndet. Utnyttjandet av dessa tekniker har möjliggjort konstruktion av keramiska skydd med en så hög skyddsförmåga att en modern projektil inte alls kan penetrera skyddet vid normala anslagshastigheter. I stället kon-sumeras projektilen direkt mot kerammaterialets yta utan att någon nämn-värd penetration äger rum (projektilmaterialet avlänkas radiellt likt en vat-tenstråle som spolas mot en vägg). Denna skyddsmekanism benämns van-ligtvis ”interface defeat” eller ”dwell” (någon lämplig svensk översättning finns för närvarande inte).
I de fall där man vill utnyttja ”interface defeat” som den primära skydds-mekanismen är den så kallade omslagshastigheten en central storhet. Vid denna anslagshastighet blir kontakttrycket på målets yta sådant att möjlighe-ten att upprätthålla ”interface defeat” upphör och i stället initieras normal penetration.
I denna avhandling har interaktionen mellan olika metalliska projektiler och keramiska mål studerats såväl experimentellt som teoretiskt. Speciellt har omslagshastigheten för ett antal olika keramiska material, bland annat borkarbid (B4C), titandiborid (TiB2) och flera varianter av kiselkarbid (SiC), uppskattats via skjutförsök. Inverkan av kerammaterialets hållfasthet (hård-het), sprödhet (brottseghet), projektilmaterialets densitet och projektilens och
fördämningens geometriska utformning på omslagshastigheten har under-sökts i detalj.
Eftersom skjutförsöken har genomförts i reducerad skala (ofta med om-vänd skjutteknik där målet skjuts mot en stationär projektil) har också inver-kan av skalning studerats. Den skalmodell som använts kallas ”replica mod-elling”. I korthet innebär denna modell att geometrin för såväl mål som pro-jektil skalas likformigt och att material och anslagshastigheter skall vara desamma i de olika försöksskalorna.
För att möjliggöra studier av interaktionen mellan projektil och mål och för bestämning av omslagshastigheten har penetrationsförloppet avbildats med hjälp av röntgenblixtteknik. Denna typ av röntgenutrustning ger en kort-varig men intensiv röntgenpuls (ca 50 ns) vilket möjliggör att man kan se igenom målet och avbilda även mycket snabba förlopp i detalj. Röntgen-blixttekniken är också helt okänslig för ljus och rök vilket vanligtvis omöj-liggör användandet av bildalstrande kameror. Genom att utnyttja flera rönt-genblixtar (fyra till fem i dessa experiment) kan en serie bilder tas under själva interaktionsförloppet. Utifrån dessa bilder kan penetrations- och ero-sionshastigheter för olika projektil- och målkombinationer uppskattas som funktion av anslagshastigheten.
De experimentellt bestämda omslagshastigheterna har jämförts med kri-tiska hastigheter som uppskattats teoretiskt. Genom att uppskatta hur pro-jektillasten (kontakttrycket) beror av anslagshastigheten och projektilmateri-alets egenskaper har anslagshastigheterna som svarar mot begynnande plas-ticering respektive genomplasticering av målmaterialet uppskattats som funktion av målmaterialets hållfasthet.
För mer detaljerad modellering av omslagshastigheten och penetrations-förloppet har numeriska simuleringar med det kontinuumdynamiska beräk-ningsprogrammet AUTODYN-2D genomförts. I dessa simuleringar har kon-stitutiva samband som inkluderar såväl projektilmaterialets töjnings-, töj-ningshastighets- och temperaturberoende hållfasthet som kerammaterialets tryck- och skadeberoende hållfasthet utnyttjats. Såväl förenklade som full-ständiga projektil och målkonfigurationer har modellerats och analyserats i detalj.
Skjutförsöken visar att varje keramiskt material uppvisar ett distinkt omslag från ”interface defeat” till penetration. Detta indikerar att det sanno-likt finns en unik omslagshastighet för varje kombination av projektilmateri-al, projektilgeometri, kerammaterial och målutformning. Försök med olika projektilmaterial (Wolfram respektive Molybden) visar att omslaget sker vid ett kritiskt kontakttryck. Det hårdaste materialet, Syndie (en komposit av diamant och kobolt), uppvisade den högsta omslagshastigheten, över 2100 m/s.
I experimenten med olika kiselkarbidmaterial med snarlika mekaniska egenskaper sammanföll inte variationerna i omslagshastighet med variatio-nerna i materialens hårdhet. Detta antyder att hårdheten, vilken speglar mate-rialets skjuvhållfasthet, inte enbart kan användas för att skatta omslagshas-tigheten. I stället korrelerade omslagshastigheten med brottsegheten. Detta indikerar att materialens sprödhet snarare än deras hårdhet påverkar omsla-get från ”interface defeat” till penetration i dessa försök. Detta skulle kunna innebära att omslagshastigheten i detta fall kan ökas genom att t.ex. öka för-dämningstrycket. Detta eftersom ett högre tryck skulle kunna bidra till att undertrycka det spröda beteendet till förmån för andra deformationsmeka-nismer (t.ex. plastisk deformation).
För en projektil med konisk form inträffade omslag från ”interface defeat” till penetration vid en betydligt lägre anslagshastighet än för motsvarande cylindriska projektil. Penetrationsförloppet var också markant annorlunda för den koniska projektilen i jämförelse med den cylindriska. I stället för att penetrationen initierades direkt framför projektilen (längs symmetriaxeln) trängde projektilmaterialet ner i kerammaterialet längs en konformad sprick-yta som var riktad bort från symmetriaxeln. Den observerade omslagshastig-heten för den koniska projektilen överensstämde kvalitativt med den kritiska hastighet (uppskattad via numeriska simuleringar) då en ringspricka initieras på kerammålets yta. Anledningen till att projektilmaterialet samverkar med ytsprickor är sannolikt relaterat till att projektillasten från den koniska pro-jektilen växer radiellt över tiden. Detta innebär att en ringspricka successivt utsätts för ett ökande tryck från det radiellt strömmande projektilmaterialet. Vid något kritiskt tryck tränger projektilmaterialet ner i sprickan och pene-trationen initieras.
Skjutförsöken i olika skalor (en skalfaktor på fem) visade inget signifi-kant inflytande av skalan. Dessa experiment stödjer därför användandet av ”replica modelling” då resultat framtagna i modellskala ska överföras till en annan, större skala.