Embed Size (px)
Citation preview

Interesting directions being pursued in seismic curvature attribute analysis
Satinder Chopra* and Kurt J. Marfurt†
*Arcis Seismic Solutions, Calgary; †The University of Oklahoma, Norman
Summary
Seismic curvature attribute analysis forms an integral part of
most interpretation projects as they yield useful information that
adds value for the interpreters. Being a popular tool, curvature
applications are expanding in terms of not only different types of
curvature measure but also in terms of their visualization, their
application on other types of data besides seismic amplitudes,
and scaling curvature with other attributes so as to extract more
useful information. In this work we discuss the different
developments and their applications.
Introduction
Seismic curvature attributes are derived from lateral second-
order derivatives of the structural component of seismic time or
depth of reflection events. Such a “structural curvature”
computation information that may be difficult to see using first-
order derivative attributes such as dip magnitude and dip-
azimuth. Curvature has long been used by geologists, using
both topographic maps and surfaces generated from well tops.
Since these attributes were introduced to seismic horizons by
Roberts (2001), various types of curvature attributes have been
developed and have found their way into commercial software
packages. Here we describe the interesting directions that are
being pursued in terms of not only the optimum applications of
these attributes to seismic data, but also the newer developments
of these attributes that show promise.
1. Conditioning of input data. We begin with the realization
that since curvature attributes are second-order derivatives of
structural time or depth they tend to enhance not only subtle
changes in signal but exacerbate the subtle omnipresent noise in
the data. Consequently, to do a good job for curvature attribute
computation, the input seismic data needs to be noise-attenuated
or conditioned (Chopra and Marfurt, 2008). Random noise
inherent in poststack migrated data volumes is perhaps most
safely attenuated using edge-preserving structure-oriented
filtering. Marfurt (2006) described a multiwindow (Kuwahara)
principal component (pc) filter that uses a small volume of data
samples to compute the waveform that best represents the
seismic data in the spatial analysis window. The output data
looks cleaner overall and the vertical faults look sharper.
Nonlinear mean, median, alpha-trim mean, and LUM edge-
preserving structure-oriented filters can be more effective when
dealing with high energy noise bursts contaminating the data.
When the input data are contaminated by acquisition footprint,
whether resulting from acquisition design or introduced by
suboptimum processing, it needs to be addressed before
attributes are computed on the data. Accentuation of footprint
can often be prevented during processing by appropriate
interpolation. However, if interpolation becomes
computationally prohibitive, other methods are available
(Gulunay, 1999; Soubaras, 2001). Chopra and Larsen (2000)
suggested the application of narrow kx-ky filters on seismic time
slices. While this method performs reasonably well, it has a
downside in that if the fault/fracture lineament orientations fall
in the direction of the footprint, they could get filtered out.
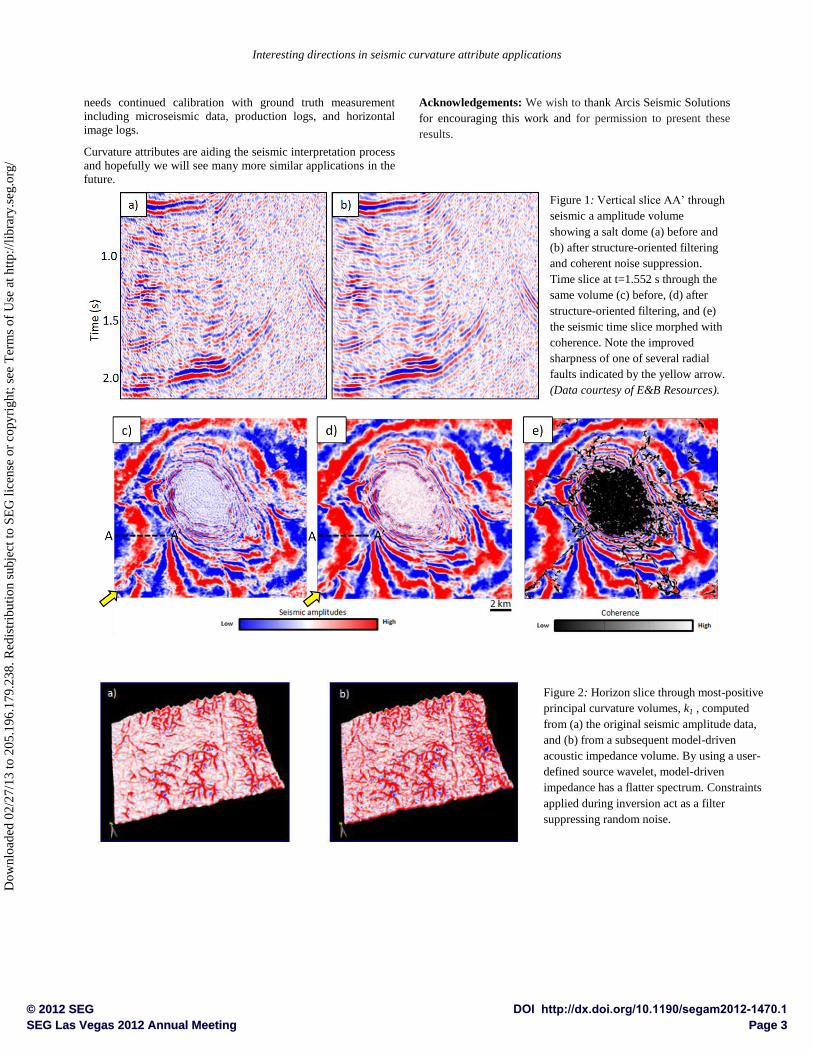
If the seismic data have some type of coherent noise masking
the reflection data, dip filtering is used to suppress it, before
attribute computation. Figure 1 shows the effect of using dip
filters and how the resulting attributes look so much better.
Such processes are all referred to as conditioning of the input
data.
2. Visualization of seismic attributes. Seismic attributes need to
be visualized in such a way that they add value to the seismic
interpretation. Many times planar display of seismic attributes
are not enough to gauge the precious information we are trying
to squeeze out. 3D visualization capability when adopted for
seismic data interpretation can be a powerful tool that could
integrate the different types of data. Directional illumination (or
shaded illumination) of interpreted horizons is a powerful means
of enhancing subtle fault edges that fall near the limits of
seismic resolution (Rijks and Jauffred,1991). The angle at
which a given display is illuminated serves to help visualize the
data clearly and leads to a detailed level of understanding of the
data being interpreted. One of the common false-color image
techniques used for merging spectral components of seismic
data plots three discrete frequencies against red, green and blue
(RGB) colors. Features imaged at a higher frequency may be
displayed in blue, those imaged at intermediate frequencies
displayed in green and the lower frequency component in red.
Such a display helps combine more information into one display
where we are using the power of the colors for the purpose. The
HLS model is more appropriate for color modulation, where one
attribute, such as the strike of most-positive curvature, is plotted
against hue, and is modulated by a second attribute, such as the
value of most-positive curvature, plotted against lightness.
Volume rendering allows the interpreter to see and interact with
features inside 3D volumes in their true 3D perspective. It
consists of controlling the color and opacity of each voxel and
projecting them onto the image plane. In this manner we bring in
shading so as to highlight specific zones, stratal volumes or
otherwise sculpted volumes of the 3D seismic data, thereby
facilitating the understanding of the spatial disposition of the
features of interest. Further manipulation can be effectively used
to combine two or more different attribute volumes so that
specific features stand out.
3. Computation of curvature attributes on frequency-enhanced
data. A common problem with surface seismic data is their
relatively low bandwidth which may not serve to achieve the
objectives set for the interpretation exercise. Significant efforts
are made during processing to enhance the frequency content of
the data as much as possible to provide a spectral response that
is consistent with the acquisition parameters. Curvature
attributes are now being computed on frequency-enhanced
© 2012 SEG DOI http://dx.doi.org/10.1190/segam2012-1470.1SEG Las Vegas 2012 Annual Meeting Page 1
Dow
nloa
ded
02/2
7/13
to 2
05.1
96.1
79.2
38. R
edis
trib
utio
n su
bjec
t to
SEG
lice
nse
or c
opyr
ight
; see
Ter
ms
of U
se a
t http
://lib
rary
.seg
.org
/

Interesting directions in seismic curvature attribute applications
seismic data (Chopra and Marfurt, 2010) so that the interpreters
have a better understanding of the geology, the play concept and
are able to make more meaningful conclusions when it comes to
prospect generation.
4. Computation of curvature attributes on impedance data.
Poststack and prestack impedance inversion run on seismic
volumes remove the effect of the seismic wavelet, modestly
increase vertical resolution, compensate for tuning and upward-
fining and upward coarsening, and generate volumes that are
more tightly correlated to lithology, porosity, and mechanical
behavior. Generating coherence from seismic amplitude
provides a measure of lateral waveform similarity. The same
computation applied to impedance provides a measure of lateral
lithologic similarity (Chopra, 2001). Because the inversion
volume has a higher vertical resolution than the input seismic
data and enhanced S/N ratio, the coherence resolution from
acoustic impedance data is significantly superior to the
coherence process applied to seismic data. In a similar way,
curvature attributes generated from impedance volumes yield
more detail that is useful in interpretation. Figure 2 shows one
such comparison.
5. Generating amplitude curvature attributes instead of
structural curvature. As stated above the conventional
computation of curvature is termed as structural curvature, as
lateral second-order derivatives of structural component of
seismic time or depth of reflection events are used to generate
them. Application of lateral second-order derivatives on the
amplitudes of seismic data along the reflectors yields amplitude
curvature (Chopra and Marfurt, 2011). Application of
amplitude curvature computation to real seismic data shows
higher level of lineament detail as compared with structural
curvature, and we show such a comparison in Figure 3. More
applications of amplitude curvature and its comparison with
structural curvature are discussed in Chopra and Marfurt (2012).
6. Using Euler curvature. Euler curvature is a generalization
of the dip and strike components of curvature in any user-
defined direction. This attribute is useful for the interpretation of
lineament features in desired azimuthal directions, say,
perpendicular to the minimum horizontal stress (Chopra and
Marfurt, 2011). If a given azimuth is known or hypothesized to
be correlated with open fractures or if a given azimuth can be
correlated to enhanced production or effective horizontal
drilling, an Euler-curvature intensity volume can be generated
for that azimuth thereby high-grading potential sweet spots.
Euler curvature run in desired azimuthal directions can exhibit a
more well-defined set of lineaments that may be of interest.
7. Fracture prediction from scaled curvature attributes. If we
examine curvature on vertical sections, we notice that it has a
vertical striping corresponding to the shapes of the seismic
reflections. Curvature is a measurement of strain, not of
lithology, both of which factors, along with bed thickness,
control fractures (Nelson, 2000). Corendering curvature and
impedance provides a better fracture indicator (Hunt et al,
2011). Goodway et al. (2006) have shown that the rock’s
brittleness can be reasonably described by lambda/mu ratio or
the closure stress ratio. The elastic rock parameter mu is a
measure of the rigidity of the rock and so could be used to scale
the curvature in such a way that the scaled attribute still shows
the vertical striping and also shows the characteristics of the
rigidity estimate. Rocks of different brittleness that have the
same curvature value may now be more correctly inferred as
having different fracture densities. In Figure 4 we show a
section of such a scaled curvature attribute, where the anomaly
in the lower middle shows good correlation with the fracture
density seen on the log data.
8. Combining seismic azimuthal impedance anisotropy and
curvature. It is common knowledge that the existence of
fractures and anisotropic stress fields result in velocity variations
with azimuth, and hence acoustic impedance. Thus fractures
could be estimated by studying reflectivity as a function of
azimuth. Impedance data can be generated from seismic data as
a function of azimuth (after removing the seismic wavelet and
thin-bed tuning effects). In the zone of interest, a horizon is
picked on the full stacked volume, and using it as a constraint,
horizons are snapped on the azimuth-limited volumes and the
minimum and the maximum acoustic impedance values are
determined. These then allow the estimation of anisotropy in the
zone of interest (Zhang et al., 2010). An overlay of anisotropy
over the curvature attribute clearly shows the
compartmentalization as we show in Figure 5.
9. Using shape attributes and 3D rose diagrams in seismic
interpretation. Once the curvedness of a surface is determined,
it is possible to generate different shape attributes such as valley,
ridge, dome and bowl attributes. Azimuth of minimum
curvature can also be determined from the strike of the valley or
the ridge attributes. With these in hand, Chopra et al. (2009)
showed that 3D rose diagrams can be generated for any gridded-
square area defined by n-inline by m-crossline analysis window
on each horizontal slice. Within each analysis window, we bin
each pixel into rose petals according to its azimuth, weighted by
its threshold-clipped ridge or valley components of curvedness,
then sum and scale them into rose diagrams. The process is
repeated for the whole data volume. After that, the rose
diagrams are mapped to a rose volume which is equivalent to the
data volume and centered in the analysis window, located at the
same location as in the input data volume. A robust generation
of rose diagrams for the whole lineament volume (corresponding
to the seismic volume) is computed, yielding intensity and
orientation of lineaments. In Figure 6 we show such 3D rose
diagrams at different levels and how they indicate the changes in
the orientation of the fractures therein. These rose diagrams can
be vector correlated to similar roses from image logs to provide
a quantitative prediction of open fracture prediction.
Conclusions
Interpretation workflows of curvature volumes continue to
evolve. In addition to structural curvature, curvature can be
computed from amplitude, rms amplitude, impedance, lambda-
rho, mu-rho, and other inversion volumes. In order to extract
meaningful information from seismic attributes, due
consideration should be given to pre-conditioning of seismic
data and robust dip-steering options. Proper visualization should
be done with composite attribute volumes, such as co-rendering
volumetric curvature or shape attributes with coherence,
provides particularly powerful interpretation tools. Use of shape
attributes and 3D rose diagrams aid the interpretation process
and facilitate the comparison with image log data. Curvature
© 2012 SEG DOI http://dx.doi.org/10.1190/segam2012-1470.1SEG Las Vegas 2012 Annual Meeting Page 2
Dow
nloa
ded
02/2
7/13
to 2
05.1
96.1
79.2
38. R
edis
trib
utio
n su
bjec
t to
SEG
lice
nse
or c
opyr
ight
; see
Ter
ms
of U
se a
t http
://lib
rary
.seg
.org
/
Interesting directions in seismic curvature attribute applications
needs continued calibration with ground truth measurement
including microseismic data, production logs, and horizontal
image logs.
Curvature attributes are aiding the seismic interpretation process
and hopefully we will see many more similar applications in the
future.
Acknowledgements: We wish to thank Arcis Seismic Solutions
for encouraging this work and for permission to present these
results.
Figure 1: Vertical slice AA’ through
seismic a amplitude volume
showing a salt dome (a) before and
(b) after structure-oriented filtering
and coherent noise suppression.
Time slice at t=1.552 s through the
same volume (c) before, (d) after
structure-oriented filtering, and (e)
the seismic time slice morphed with
coherence. Note the improved
sharpness of one of several radial
faults indicated by the yellow arrow.
(Data courtesy of E&B Resources).
Figure 2: Horizon slice through most-positive
principal curvature volumes, k1 , computed
from (a) the original seismic amplitude data,
and (b) from a subsequent model-driven
acoustic impedance volume. By using a user-
defined source wavelet, model-driven
impedance has a flatter spectrum. Constraints
applied during inversion act as a filter
suppressing random noise.
© 2012 SEG DOI http://dx.doi.org/10.1190/segam2012-1470.1SEG Las Vegas 2012 Annual Meeting Page 3
Dow
nloa
ded
02/2
7/13
to 2
05.1
96.1
79.2
38. R
edis
trib
utio
n su
bjec
t to
SEG
lice
nse
or c
opyr
ight
; see
Ter
ms
of U
se a
t http
://lib
rary
.seg
.org
/

Interesting directions in seismic curvature attribute applications
Figure 3: Chair display with
seismic section as vertical and a
stratal slice 10 ms above the Evie
Shale marker from (a) Stratal
slice from structural most-
positive principal curvature and
(b) Equivalent stratal slice from
amplitude most-positive
curvature.
Figure 4: The scaled attribute (μρk1) combines the vertical-stratigraphic changes in rigidity with the vertical striping of the
curvature attribute. This makes more intuitive sense than either attribute alone. (After Hunt et al., 2011)
Figure 6: Time slices at (a) t=2.142 and (b) t=2.418 s through k1 most-positive principal curvature.
Time slices through at (a) t=2.142 and (b) t=2.418 s through , the corresponding rose diagram
volume. Note the change in the orientation of the lineaments as well as their signature on the roses.
Data courtesy of CGGVeritas Library, Canada.
Figure 5: Blended image of k1 most positive principal curvature and azimuth
of maximum stress. Note how the display shows the compartmentalization of
the reservoir. (After Zhang et al., 2011)
© 2012 SEG DOI http://dx.doi.org/10.1190/segam2012-1470.1SEG Las Vegas 2012 Annual Meeting Page 4
Dow
nloa
ded
02/2
7/13
to 2
05.1
96.1
79.2
38. R
edis
trib
utio
n su
bjec
t to
SEG
lice
nse
or c
opyr
ight
; see
Ter
ms
of U
se a
t http
://lib
rary
.seg
.org
/

http://dx.doi.org/10.1190/segam2012-1470.1 EDITED REFERENCES Note: This reference list is a copy-edited version of the reference list submitted by the author. Reference lists for the 2012 SEG Technical Program Expanded Abstracts have been copy edited so that references provided with the online metadata for each paper will achieve a high degree of linking to cited sources that appear on the Web. REFERENCES
Anderson, N. L., and E. K. Franseen, 1991, Differential compaction of Winnipegosis reefs: A seismic perspective: Geophysics, 56, 142–147.
Chopra, S., 2001, Integrating coherence cube imaging and seismic inversion: The Leading Edge, 20, 354–362.
Chopra, S., and G. Larsen, 2000, Acquisition footprint — Its detection and removal: CSEG Recorder, 25, no. 8, 16–20.
Chopra, S., and K. J. Marfurt, 2008, Gleaning meaningful information from seismic attributes: First Break, 26, 43–53.
Chopra, S., and K. J. Marfurt, 2011, Structural curvature versus amplitude curvature: 81st Annual International Meeting, SEG, Expanded Abstracts, 980–984.
Chopra, S., and K. J. Marfurt, 2012, Seismic attribute expression of differential compaction: 82nd Annual International Meeting, SEG, Expanded Abstracts.
Chopra, S., K. J. Marfurt, and H. T. Mai, 2009, Using automatically generated 3D rose diagrams for correlation of seismic fracture lineaments with similar lineaments from attributes and well log data: First Break, 27, 37–42.
Chopra, S., K. J. Marfurt, and S. Misra, 2010, Seismic attributes on frequency-enhanced seismic data: 80th Annual International Meeting, SEG, Expanded Abstracts, 1281–1286.
Goodway, W., J. Varsek, and C. Abaco, 2006, Practical applications of P-wave AVO for unconventional gas resource plays — I: CSEG Recorder, 31, 90–95.
Gulunay, N., 1999, Acquisition geometry footprints removal: 69th Annual International Meeting, SEG, Expanded Abstracts, 637–640.
Hunt, L., S. Reynolds, T. Brown, S. Hadley, J. Downton, and S. Chopra, 2011, Quantitative estimates of fracture density variations: Further perspectives: CSEG Recorder, 36, no. 1, 9–18.
Marfurt, K. J., 2006, Robust estimates of reflector dip and azimuth: Geophysics, 71, no. 4, P29–P40.
Nelson, R. A., 2001, Geologic analysis of naturally fractured reservoirs: Gulf Professional Publishing.
Rijks, E. J. H., and J. E. E. M. Jauffred, 1991, Attribute extraction: An important application in any 3-D seismic interpretation: The Leading Edge, 10, no. 9, 11–19.
Roberts, A., 2001, Curvature attributes and their application to 3-D interpreted horizons: First Break, 19, 85–99.
Soubaras, R., 2002, Attenuation of acquisition footprint for nonorthogonal 3D geometries: 72nd Annual International Meeting, SEG, Expanded Abstracts, 2142–2145.
© 2012 SEG DOI http://dx.doi.org/10.1190/segam2012-1470.1SEG Las Vegas 2012 Annual Meeting Page 5
Dow
nloa
ded
02/2
7/13
to 2
05.1
96.1
79.2
38. R
edis
trib
utio
n su
bjec
t to
SEG
lice
nse
or c
opyr
ight
; see
Ter
ms
of U
se a
t http
://lib
rary
.seg
.org
/

Zhang, K., B. Zhang, J. T. Kwiatkowski, and K. J. Marfurt, 2010, Seismic azimuthal impedance anisotropy in the Barnett Shale: 80th Annual International Meeting, SEG, Expanded Abstracts, 273–277.
© 2012 SEG DOI http://dx.doi.org/10.1190/segam2012-1470.1SEG Las Vegas 2012 Annual Meeting Page 6
Dow
nloa
ded
02/2
7/13
to 2
05.1
96.1
79.2
38. R
edis
trib
utio
n su
bjec
t to
SEG
lice
nse
or c
opyr
ight
; see
Ter
ms
of U
se a
t http
://lib
rary
.seg
.org
/