Embed Size (px)
Citation preview
Interest Rate Risk Management (IRR)What CFO’s Should Expect During Their Next
Bank Examination
A Live Webinar Presented by:Austin Associates, LLC_____________________________________
April 25, 201211:00 am – 11:40 am EST
2
Presented By:
Thomas C. Hauck,
Managing Director & Principal
Financial Management [email protected]
Todd A. Togrul,
Managing Director & Principal
Financial Management [email protected]
Austin Associates’ Practice Areas
Investment Banking
Strategic Consulting
Financial Management
Risk Management and Compliance
Technology Solutions
Insurance and Financial Services
www.austinassociates.com
3
4
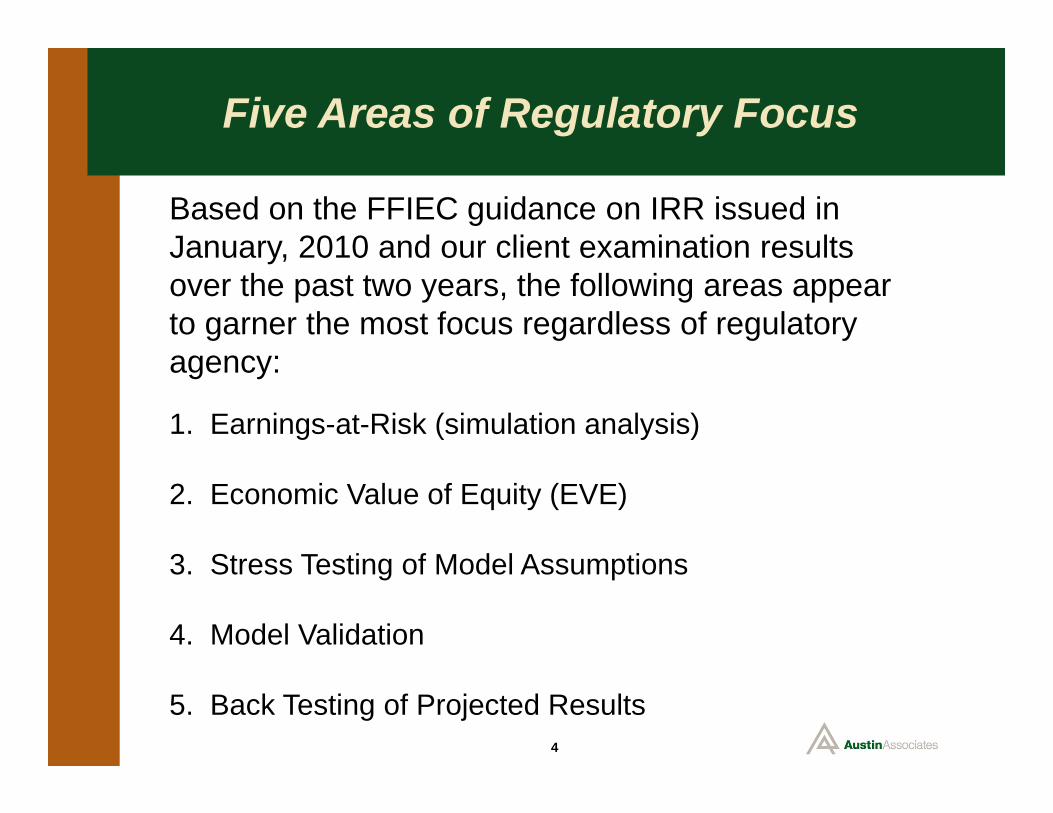
Five Areas of Regulatory Focus
Based on the FFIEC guidance on IRR issued in January, 2010 and our client examination results over the past two years, the following areas appear to garner the most focus regardless of regulatory agency:
1. Earnings-at-Risk (simulation analysis)
2. Economic Value of Equity (EVE)
3. Stress Testing of Model Assumptions
4. Model Validation
5. Back Testing of Projected Results

5
Austin Associates, LLC.
Earnings-at-Risk
6
Earnings at Risk
Overview:
What are the parameters examiners expect to evaluate with regard to:
Interest rate changes
Simulation timeframes
Balance sheet scenarios
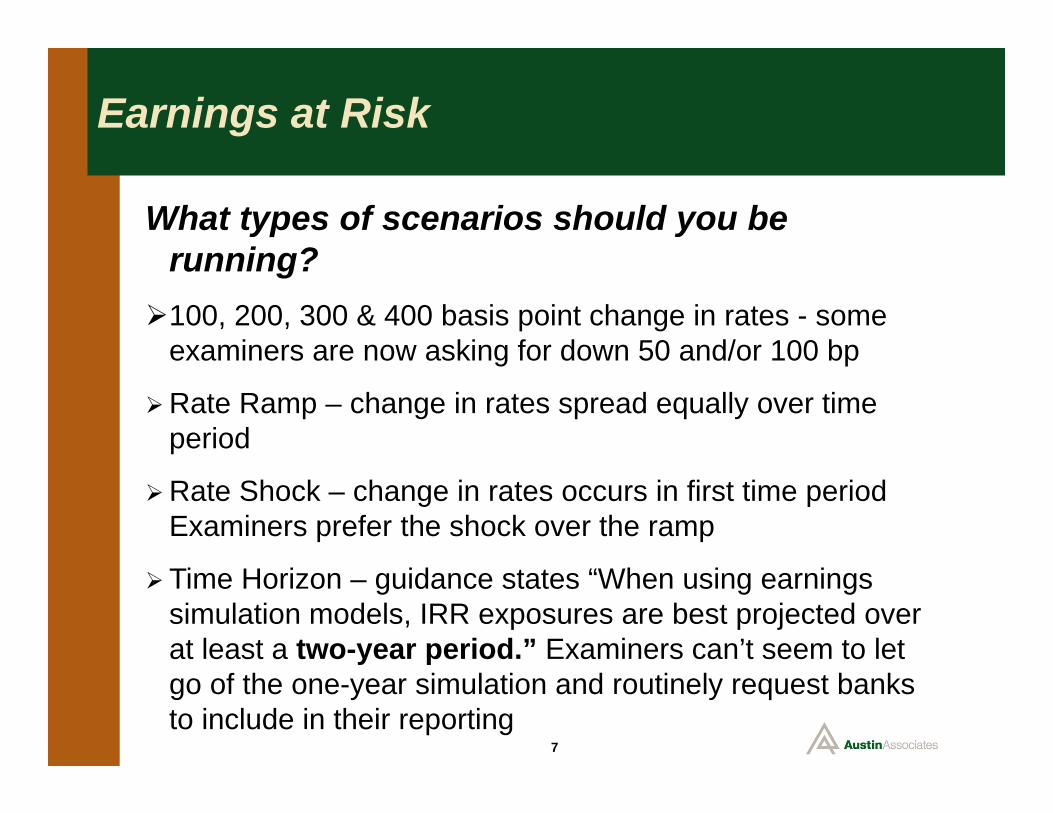
Earnings at Risk
What types of scenarios should you be running?100, 200, 300 & 400 basis point change in rates - some
examiners are now asking for down 50 and/or 100 bp
Rate Ramp – change in rates spread equally over time period
Rate Shock – change in rates occurs in first time period Examiners prefer the shock over the ramp
Time Horizon – guidance states “When using earnings simulation models, IRR exposures are best projected over at least a two-year period.” Examiners can’t seem to let go of the one-year simulation and routinely request banks to include in their reporting
7
Earnings at Risk
What types of scenarios should you be running?
Static Balance Sheet – no growth. Examiner preference
Dynamic Balance Sheet – typically use budgeted growth and adjust during the year if necessary. A very good tool for budgeting
Projections of net interest income and net income should be completed. Focus will be on net interest income
8
Earnings at Risk - Example
9
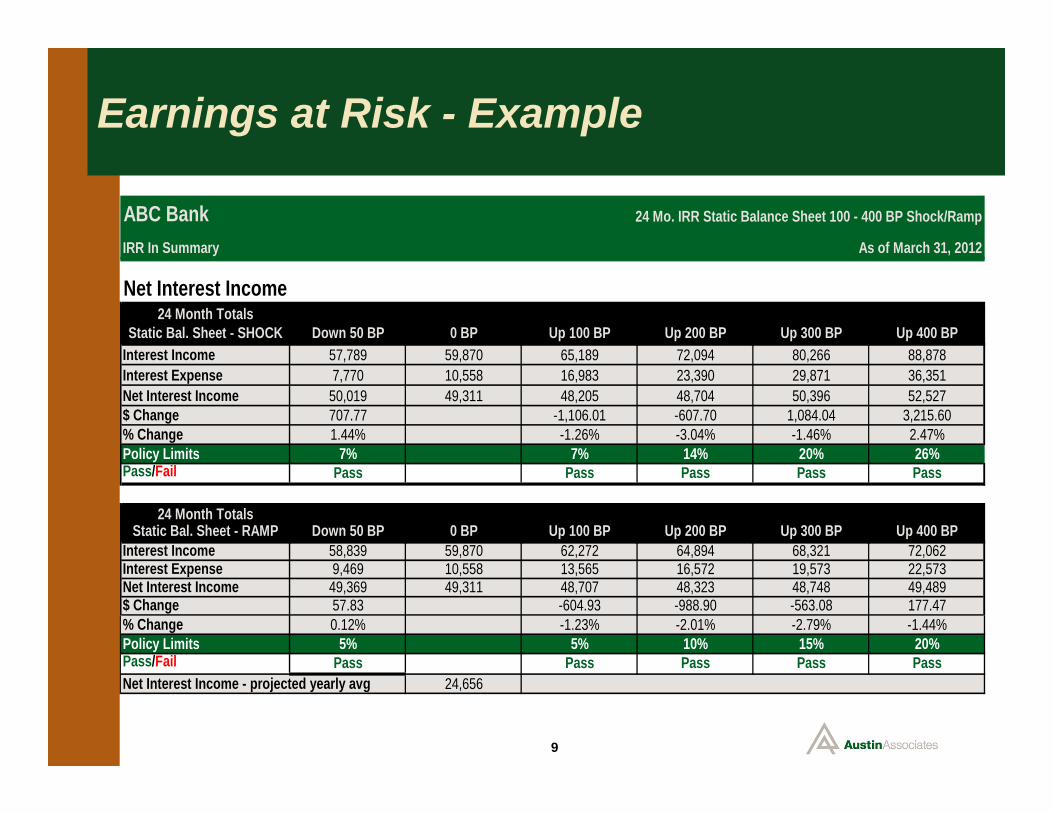
IRR In Summary
Net Interest Income24 Month Totals
Static Bal. Sheet - SHOCK Down 50 BP 0 BP Up 100 BP Up 200 BP Up 300 BP Up 400 BPInterest Income 57,789 59,870 65,189 72,094 80,266 88,878Interest Expense 7,770 10,558 16,983 23,390 29,871 36,351Net Interest Income 50,019 49,311 48,205 48,704 50,396 52,527$ Change 707.77 -1,106.01 -607.70 1,084.04 3,215.60% Change 1.44% -1.26% -3.04% -1.46% 2.47%Policy Limits 7% 7% 14% 20% 26%Pass/Fail Pass Pass Pass Pass Pass
24 Month TotalsStatic Bal. Sheet - RAMP Down 50 BP 0 BP Up 100 BP Up 200 BP Up 300 BP Up 400 BP
Interest Income 58,839 59,870 62,272 64,894 68,321 72,062Interest Expense 9,469 10,558 13,565 16,572 19,573 22,573Net Interest Income 49,369 49,311 48,707 48,323 48,748 49,489$ Change 57.83 -604.93 -988.90 -563.08 177.47% Change 0.12% -1.23% -2.01% -2.79% -1.44%Policy Limits 5% 5% 10% 15% 20%Pass/Fail Pass Pass Pass Pass PassNet Interest Income - projected yearly avg 24,656
As of March 31, 2012
ABC Bank 24 Mo. IRR Static Balance Sheet 100 - 400 BP Shock/Ramp
10
Austin Associates, LLC.
Economic Value of Equity (EVE)
11
Economic Value of Equity (EVE)
Overview:
The emphasis of many recent exams has been on the use of bank specific deposit decay and loan prepayment speeds. How do your analytics compare with your community bank counterparts?
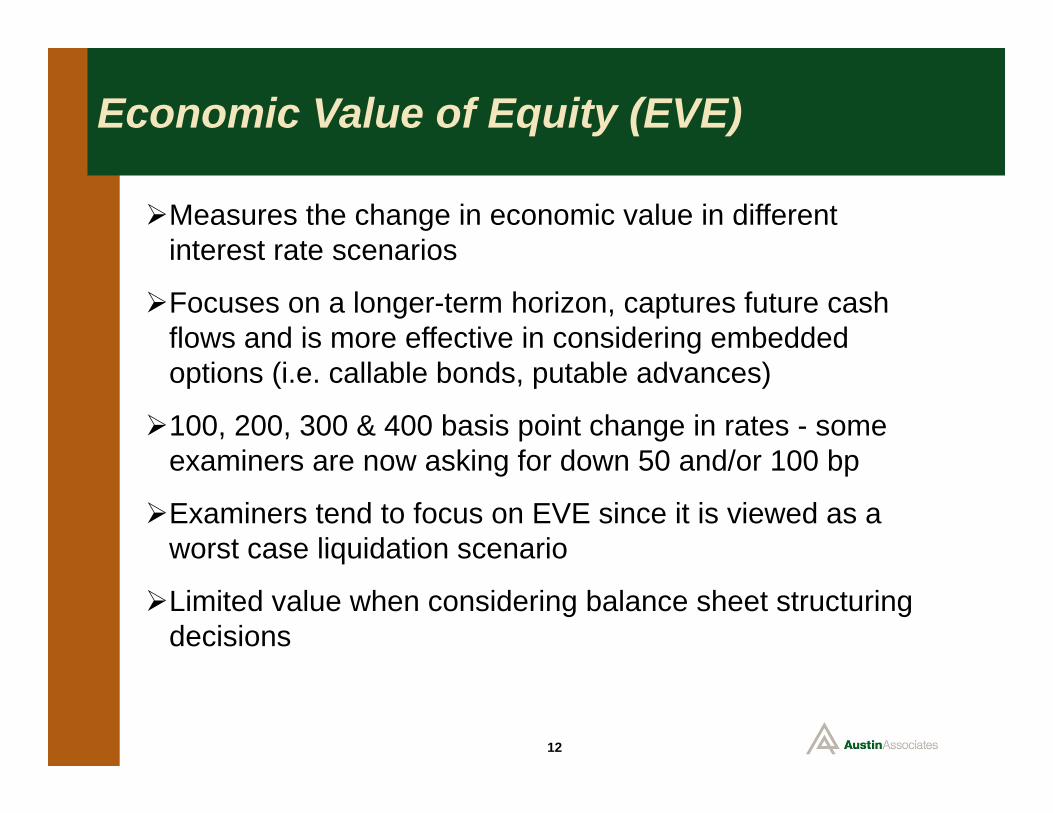
Economic Value of Equity (EVE)
Measures the change in economic value in different interest rate scenarios
Focuses on a longer-term horizon, captures future cash flows and is more effective in considering embedded options (i.e. callable bonds, putable advances)
100, 200, 300 & 400 basis point change in rates - some examiners are now asking for down 50 and/or 100 bp
Examiners tend to focus on EVE since it is viewed as a worst case liquidation scenario
Limited value when considering balance sheet structuring decisions
12
Economic Value of Equity (EVE)
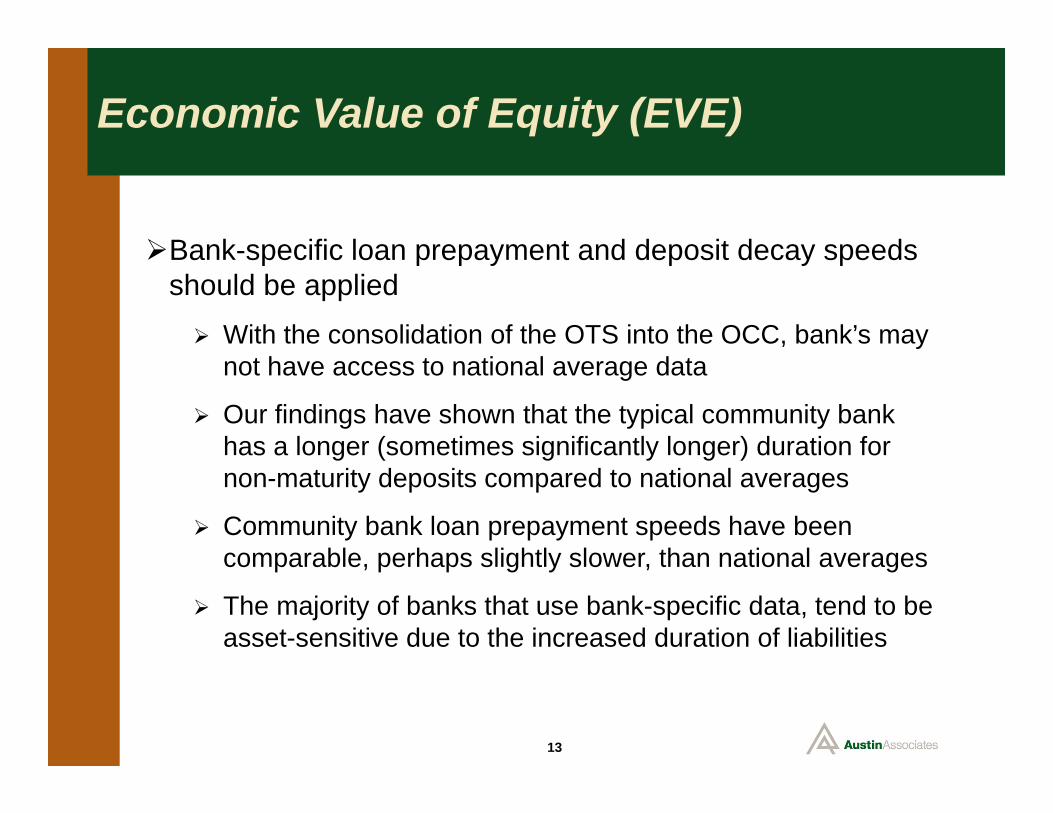
Bank-specific loan prepayment and deposit decay speeds should be applied With the consolidation of the OTS into the OCC, bank’s may
not have access to national average data
Our findings have shown that the typical community bank has a longer (sometimes significantly longer) duration for non-maturity deposits compared to national averages
Community bank loan prepayment speeds have been comparable, perhaps slightly slower, than national averages
The majority of banks that use bank-specific data, tend to be asset-sensitive due to the increased duration of liabilities
13
Economic Value of Equity (EVE) - Example
14
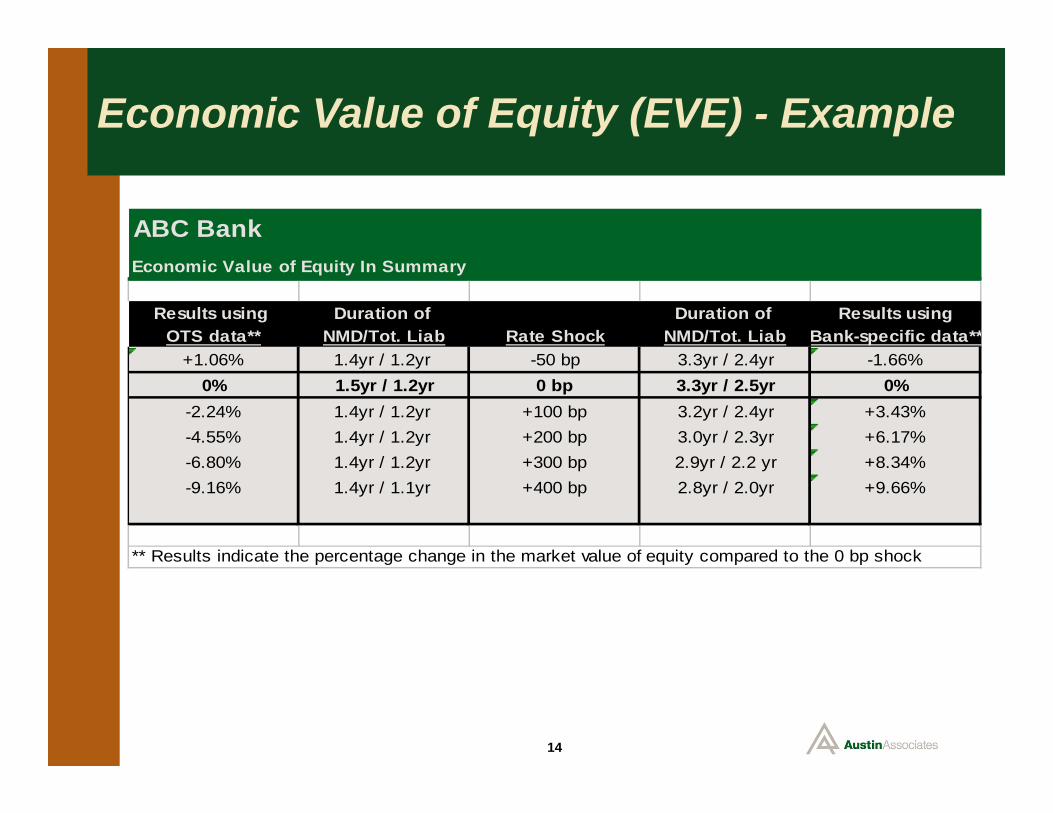
Economic Value of Equity In Summary
Results using Duration of Duration of Results usingOTS data** NMD/Tot. Liab Rate Shock NMD/Tot. Liab Bank-specific data**
+1.06% 1.4yr / 1.2yr -50 bp 3.3yr / 2.4yr -1.66%0% 1.5yr / 1.2yr 0 bp 3.3yr / 2.5yr 0%
-2.24% 1.4yr / 1.2yr +100 bp 3.2yr / 2.4yr +3.43%-4.55% 1.4yr / 1.2yr +200 bp 3.0yr / 2.3yr +6.17%-6.80% 1.4yr / 1.2yr +300 bp 2.9yr / 2.2 yr +8.34%-9.16% 1.4yr / 1.1yr +400 bp 2.8yr / 2.0yr +9.66%
** Results indicate the percentage change in the market value of equity compared to the 0 bp shock
ABC Bank

15
Austin Associates, LLC.
Stress Testing
16
Stress Testing
Overview:
All banks are expected to test various financial assumptions – are you selecting the appropriate range of financial scenarios?
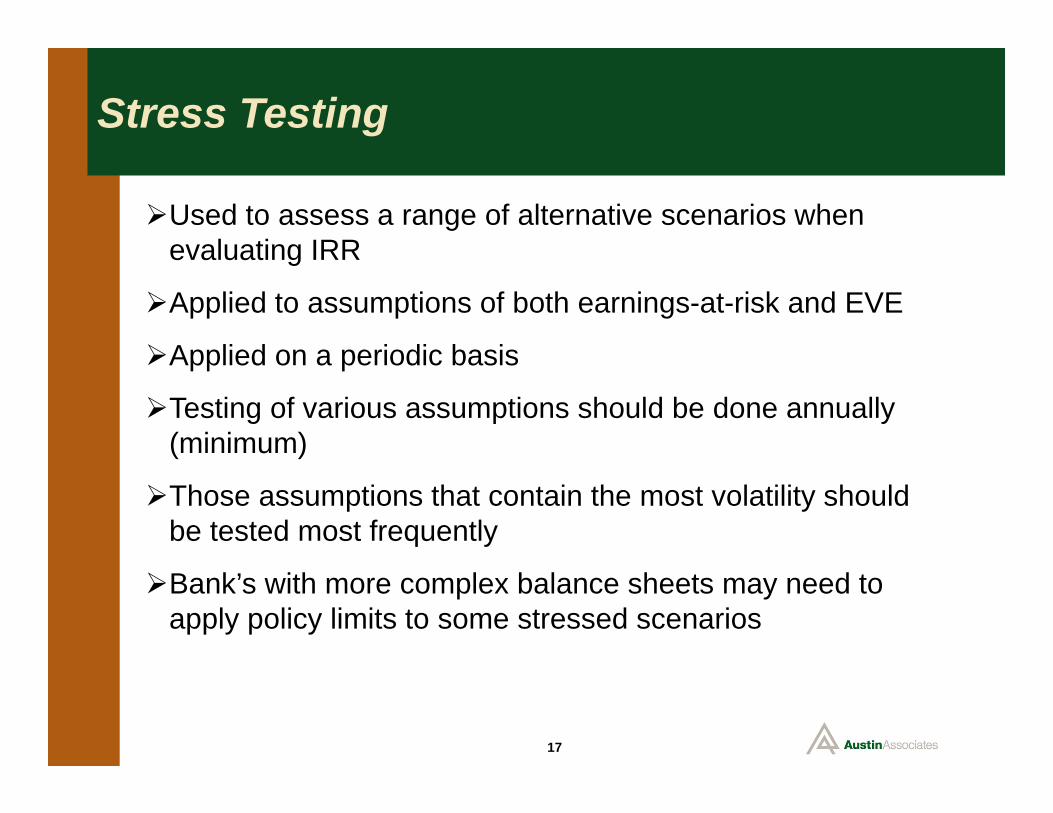
Stress Testing
Used to assess a range of alternative scenarios when evaluating IRR
Applied to assumptions of both earnings-at-risk and EVE
Applied on a periodic basis
Testing of various assumptions should be done annually (minimum)
Those assumptions that contain the most volatility should be tested most frequently
Bank’s with more complex balance sheets may need to apply policy limits to some stressed scenarios
17
Stress Testing
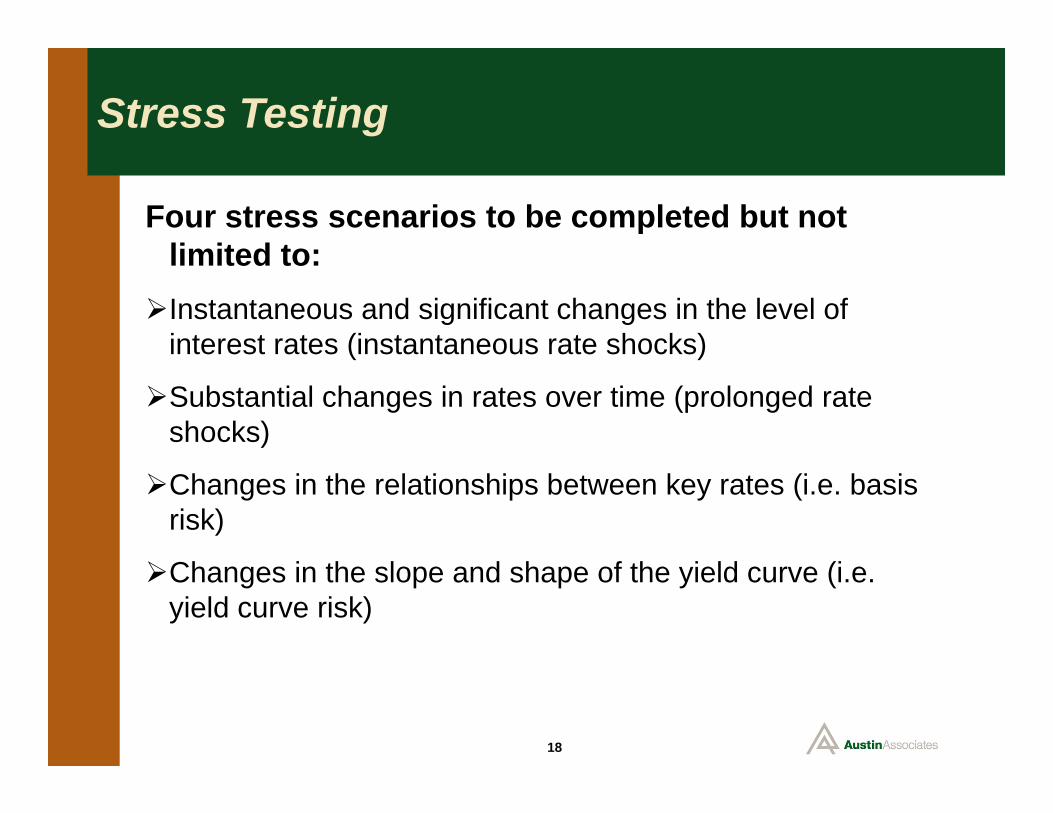
Four stress scenarios to be completed but not limited to:Instantaneous and significant changes in the level of
interest rates (instantaneous rate shocks)
Substantial changes in rates over time (prolonged rate shocks)
Changes in the relationships between key rates (i.e. basis risk)
Changes in the slope and shape of the yield curve (i.e. yield curve risk)
18
Stress Testing
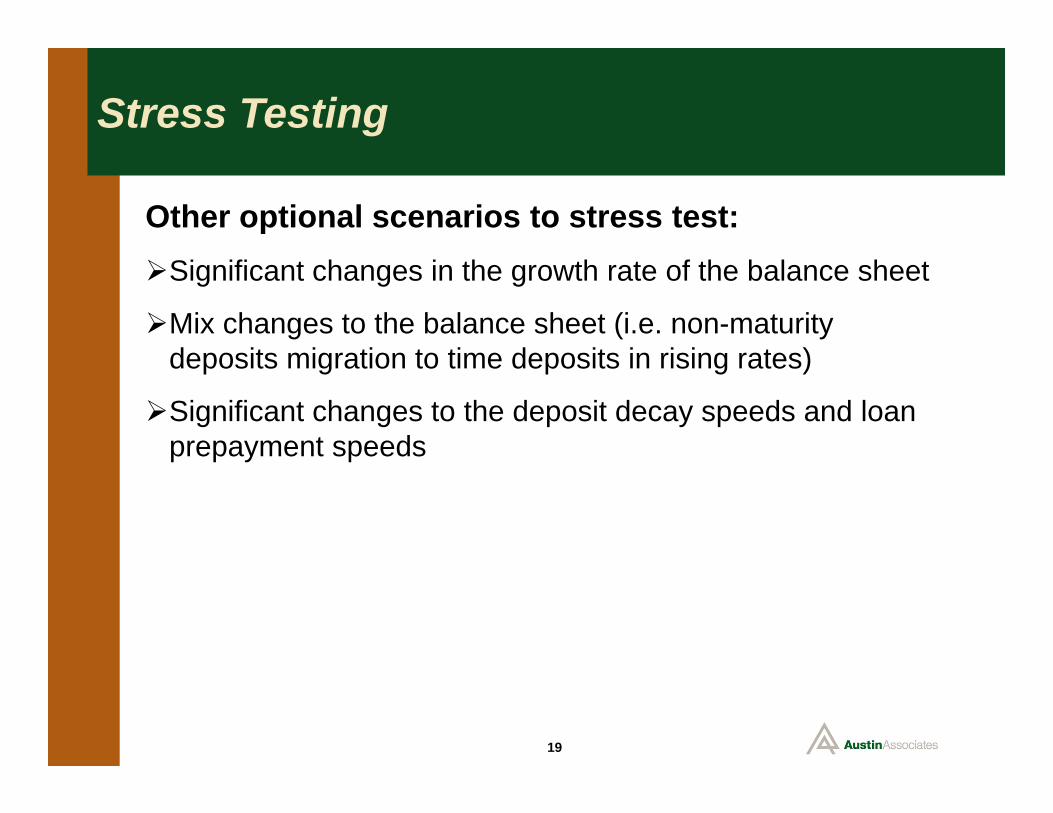
Other optional scenarios to stress test:Significant changes in the growth rate of the balance sheet
Mix changes to the balance sheet (i.e. non-maturity deposits migration to time deposits in rising rates)
Significant changes to the deposit decay speeds and loan prepayment speeds
19
Stress Testing - Example
20
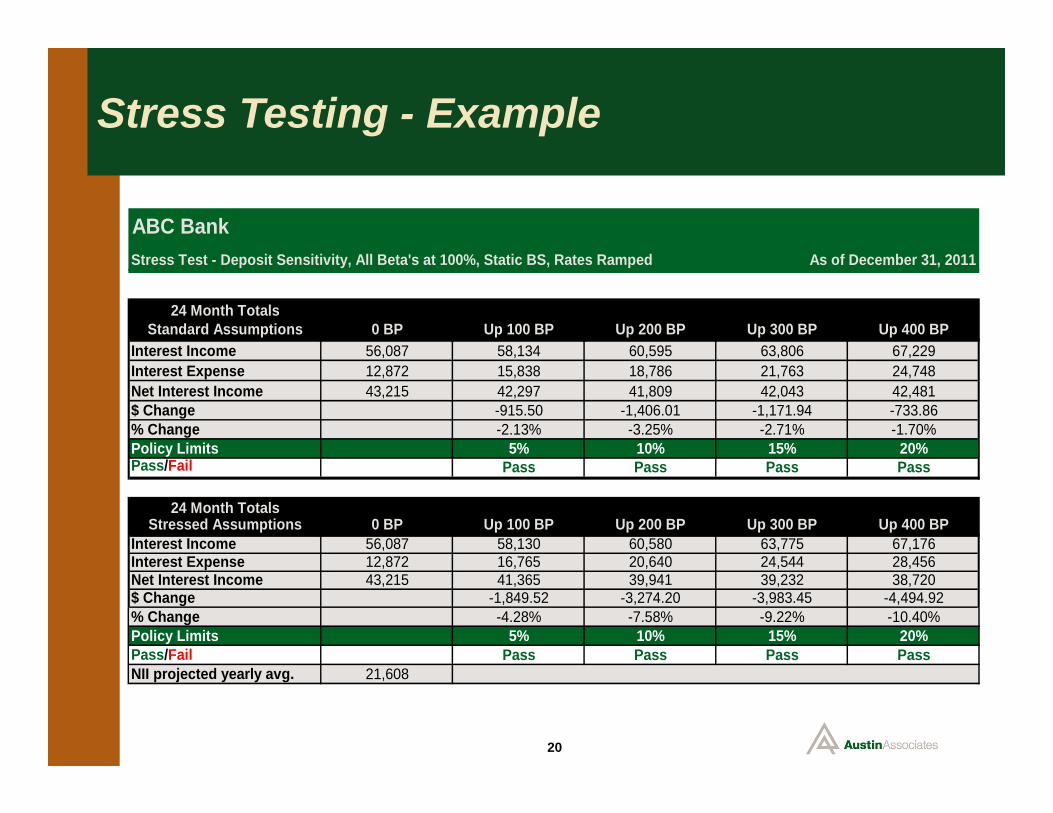
ABC BankStress Test - Deposit Sensitivity, All Beta's at 100%, Static BS, Rates Ramped
24 Month TotalsStandard Assumptions 0 BP Up 100 BP Up 200 BP Up 300 BP Up 400 BP
Interest Income 56,087 58,134 60,595 63,806 67,229Interest Expense 12,872 15,838 18,786 21,763 24,748Net Interest Income 43,215 42,297 41,809 42,043 42,481$ Change -915.50 -1,406.01 -1,171.94 -733.86% Change -2.13% -3.25% -2.71% -1.70%Policy Limits 5% 10% 15% 20%Pass/Fail Pass Pass Pass Pass
24 Month TotalsStressed Assumptions 0 BP Up 100 BP Up 200 BP Up 300 BP Up 400 BP
Interest Income 56,087 58,130 60,580 63,775 67,176Interest Expense 12,872 16,765 20,640 24,544 28,456Net Interest Income 43,215 41,365 39,941 39,232 38,720$ Change -1,849.52 -3,274.20 -3,983.45 -4,494.92% Change -4.28% -7.58% -9.22% -10.40%Policy Limits 5% 10% 15% 20%Pass/Fail Pass Pass Pass PassNII projected yearly avg. 21,608
As of December 31, 2011

21
Austin Associates, LLC.
Model Validation
22
Model Validation
Overview:
Whether your IRR model is derived from an in-house system or from a third-party vendor, it must be continually assessed to ensure all risk factors are depicted in your analyses.
Model Validation
Model Certification:
Mechanics and mathematics certification, completed by a third party, should be provided by the model vendor
Re- certification should coincide with any version update of ALM software (computation update only)
Independent Third Party ALM Review:
Independent review of the logic and conceptual soundness
Performed by a third party that is independent from the individual(s) charged with measuring and monitoring IRR
Assess the reasonableness of assumptions and results
23
Model Validation
Independent Third Party ALM Review (con’t):
At a minimum, ensure the reasonableness of asset prepayments, non-maturity deposit price sensitivity and decay rates, and key rate drivers
Management to implement adequate follow-up procedures to handle model enhancements
Review to completed annually
24

25
Austin Associates, LLC.
Back Testing
26
Back Testing
Overview:
It is essential to compare actual with forecasted financial results; gain insights into the full range of scenarios your back testing processes need to address.
Back Testing
Back testing is the comparison of actual net interest income versus forecasted net interest income
Typically performed after a fiscal year is complete
The forecast used for comparison should be the “most likely” scenario
Are your actual results consistent with your forecast?
If so, were the interest income and expense components consistent as well?
If not, why not? Balance sheet growth or mix? Rate forecast?
27
Back Testing
A variance analysis can identify the differences between actual and forecast
Where inconsistencies are identified, use the information to strengthen the process for future forecasts
What would be considered an accurate forecast?
Actual net interest income within 2% of projections
28
Back Testing - Example
29
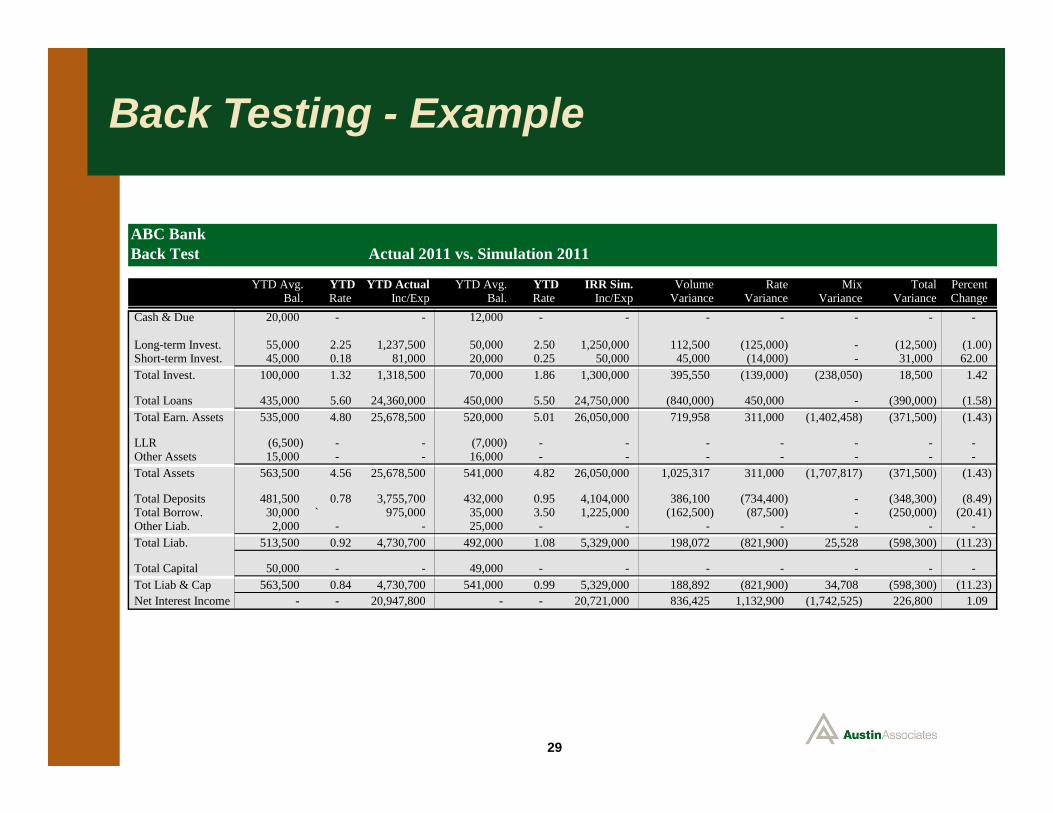
ABC BankBack Test Actual 2011 vs. Simulation 2011
YTD Avg. YTD YTD Actual YTD Avg. YTD IRR Sim. Volume Rate Mix Total PercentBal. Rate Inc/Exp Bal. Rate Inc/Exp Variance Variance Variance Variance Change
Cash & Due 20,000 - - 12,000 - - - - - - -
Long-term Invest. 55,000 2.25 1,237,500 50,000 2.50 1,250,000 112,500 (125,000) - (12,500) (1.00) Short-term Invest. 45,000 0.18 81,000 20,000 0.25 50,000 45,000 (14,000) - 31,000 62.00 Total Invest. 100,000 1.32 1,318,500 70,000 1.86 1,300,000 395,550 (139,000) (238,050) 18,500 1.42
Total Loans 435,000 5.60 24,360,000 450,000 5.50 24,750,000 (840,000) 450,000 - (390,000) (1.58) Total Earn. Assets 535,000 4.80 25,678,500 520,000 5.01 26,050,000 719,958 311,000 (1,402,458) (371,500) (1.43)
LLR (6,500) - - (7,000) - - - - - - - Other Assets 15,000 - - 16,000 - - - - - - - Total Assets 563,500 4.56 25,678,500 541,000 4.82 26,050,000 1,025,317 311,000 (1,707,817) (371,500) (1.43)
Total Deposits 481,500 0.78 3,755,700 432,000 0.95 4,104,000 386,100 (734,400) - (348,300) (8.49) Total Borrow. 30,000 ` 975,000 35,000 3.50 1,225,000 (162,500) (87,500) - (250,000) (20.41) Other Liab. 2,000 - - 25,000 - - - - - - - Total Liab. 513,500 0.92 4,730,700 492,000 1.08 5,329,000 198,072 (821,900) 25,528 (598,300) (11.23)
Total Capital 50,000 - - 49,000 - - - - - - - Tot Liab & Cap 563,500 0.84 4,730,700 541,000 0.99 5,329,000 188,892 (821,900) 34,708 (598,300) (11.23) Net Interest Income - - 20,947,800 - - 20,721,000 836,425 1,132,900 (1,742,525) 226,800 1.09
30
Austin Associates, LLC.
Q & A


![[PPT]Internal Rate of Return (IRR) and Net Present Value …leeds-faculty.colorado.edu/thibodea/REAL3000/files/2005... · Web viewInternal Rate of Return (IRR) and Net Present Value](https://img.pdfslide.us/doc/110x75/5aefd30e7f8b9a572b8ea779/pptinternal-rate-of-return-irr-and-net-present-value-leeds-viewinternal.jpg)