Embed Size (px)
Citation preview
University of WollongongResearch Online
Faculty of Commerce - Papers (Archive) Faculty of Business
2012
Interest rate pass through and the asymmetricrelationship between the cash rate and themortgage rateAbbas ValadkhaniUniversity of Wollongong, [email protected]
Sajid AnwarUniversity of the Sunshine Coast
Research Online is the open access institutional repository for the University of Wollongong. For further information contact the UOW Library:[email protected]
Publication DetailsValadkhani, A. & Anwar, S. (2012). Interest rate pass through and the asymmetric relationship between the cash rate and the mortgagerate. The Economic Record, 88 (282), 341-350.

Interest rate pass through and the asymmetric relationship between thecash rate and the mortgage rate
AbstractThere is an ongoing controversy over whether banks’ mortgage rates rise more rapidly than they fall due totheir asymmetric responses to changes in the cash rate. This paper examines the dynamic interplay betweenthe cash rate and the standardvariable mortgage rate using monthly data in the post-1989 era. Unlike previousAustralian studies, our proposed threshold and asymmetric error-correction models account for both theamount and adjustment asymmetries. We found that the Reserve Bank of Australia’s rate rises have a muchlarger and more instantaneous impact on the mortgage rate than rate cuts.
Keywordscash, between, relationship, mortgage, asymmetric, interest, rate, pass
DisciplinesBusiness | Social and Behavioral Sciences
Publication DetailsValadkhani, A. & Anwar, S. (2012). Interest rate pass through and the asymmetric relationship between thecash rate and the mortgage rate. The Economic Record, 88 (282), 341-350.
This journal article is available at Research Online: http://ro.uow.edu.au/commpapers/2787
1
Interest Rate Pass Through and the Asymmetric Relationship between the
Cash Rate and the Mortgage Rate*
There is an ongoing controversy over whether banks’ mortgage rates rise more rapidly than
they fall due to their asymmetric responses to changes in the cash rate. This paper examines the
dynamic interplay between the cash rate and the standard-variable mortgage rate using monthly
data in the post–1989 era. Unlike previous Australian studies, our proposed threshold and
asymmetric error-correction models account for both the amount and adjustment asymmetries.
We found that the RBA’s (Reserve Bank of Australia) rate rises have a much larger and more
instantaneous impact on the mortgage rate than rate cuts.
JEL classification codes: C24, C58, E43 and E58.
Keywords: Banks’ mortgage rates, Asymmetric and threshold error-correction models, Australia.
I Introduction
Examining the asymmetric behaviour of banks has been an important and ongoing empirical
issue in macroeconomics and finance since the pioneering work of Eichengreen, Watson and
Grossman (1985) in which they analysed the Bank of England’s discount rate policy under the
interwar gold standard (1925–31). They found that there was asymmetry in the Bank's response
to reserve gains and losses: the Bank increased its discount rate upon losing reserves but failed to
reduce it upon gaining them. In the contemporary literature this phenomenon is referred to as
Bacon’s (1991) “rockets-and-feathers hypothesis”. Bacon argued that gasoline prices “shoot up
like rockets” in response to a positive rise in oil prices and “float down like feathers” in response
to a fall. Inter alia, Hannan and Berger (1991) and Neumark and Sharpe (1992) are among earlier
studies that have tested the “rockets and feathers hypothesis” in the context of the banking
* We wish to thank Professor Mardi Dungey and the two anonymous referees, whose invaluable inputs and
comments considerably improved an earlier version of this article. The usual caveat applies.
2
industry. Neumark and Sharpe (1992) found that consumer deposit interest rates respond more
slowly to positive than negative changes in the market interest rates.
In this paper we examine two specific issues. First, in overall terms, do standard-variable
mortgage rates respond asymmetrically to changes in the RBA’s cash rate? If the cash rate
changes, will Bacon’s (1991) “rockets-and-feathers hypothesis” be applicable in the context of
Australia’s mortgage rates? Second, when the cash rate increases by 1 per cent, how much and
how quickly does the standard-variable rate rise? If there exists a significant degree of
asymmetric rate adjustments, one may then argue that financial institutions are profiting from the
RBA rate changes. The second issue is of immense interest in the light of publicly held beliefs
regarding increasing bank profits. Liu, Margaritis and Tourani-Rad (2011) argued that banks in
Australia and New Zealand are very slow to pass on reductions in official interest rates and/or
cost of funds to borrowers and they are profiting at the expense of their customers.
The cash rate is not the only factor that affects lenders’ behaviour. The response of
individual lenders to changes in their funding cost is also influenced by a number of other factors
such as the extent of securitisation and individual bank exposures to external sources.1 However,
the cash rate has become increasingly politicised and is the focus of much attention by media
commentators. This is not hard to understand as for many families, mortgage payments constitute
a substantial part of their income and interest rate changes have a direct and appreciable effect on
their consumption. When the RBA lowers the cash rate, the media tends to focus on which
lenders reduce their rates more quickly and how much of the change is passed onto borrowers.2
1 Maudos and Fernandez de Guevara (2004, p.2277) examined the interest margin in the banking sectors of five
European countries (i.e. Germany, France, the UK, Italy and Spain) during the period 1993–2000 and found that “the
‘pure’ interest margin depends on the competitive conditions of the market, the interest rate risk, the credit risk, the
average operating expenses and the risk aversion of banking firms, as well as … opportunity cost of reserves,
payment of implicit interest and quality of management.”
2 The 7:30 Report (ABC), ‘Banks quiet on rates cut’, 7 Dec 2011: http://abc.net.au/7.30/content/2011/s3386046.htm
(accessed 6 March 2012).
3
Politicians of all persuasions in Australia have also advised banks (particularly the “Big 4”)
against increasing mortgage rates by more than increases in the RBA’s cash rate.3 For example,
in December 2009, three of Australia’s four largest banks caused outrage by raising rates more
than the RBA’s rate rise, while in February 2010 former Prime Minister, Kevin Rudd, urged
banks to follow a decision by the National Australia Bank to keep interest-rate adjustments in
alignment with any official rate rise.4 Banks have responded in a variety of ways, with some
justifying rate rises in excess of those of the RBA’s cash rate based on the increased cost of
funding while others have taken advantage of rate rises to increase their market share.5 It should
be noted that this is not a new issue (see Gittins, 1991).
The asymmetric pass through of funding costs into mortgage interest rates is by no means
Australia specific. Other developed countries face the same dilemma. Corvoisier and Gropp
(2002) and Bikker and Haaf (2002) have highlighted substantial differences across European
countries in terms of the pass through of monetary policy interest rate changes into money market
rates. Bikker and Haaf examined banking-sector competition in 23 countries and discovered that
competition is much weaker in local markets. Using the Dutch data, both Toolsema and Jacobs
(2007) and de Haan and Sterken (2011) found that there is asymmetric pass through of funding
costs into mortgage-interest rates as banks tend to raise interest rates immediately once costs rise,
while hesitating to lower their rates when costs drop. Their pass-through parameter was estimated
to be around half of the Euro-zone average (de Haan and Sterken, 2011).
3 ABC Radio, ‘PM plays down bank rate rise chances,’ 26 October 2007:
http://www.digradio.com.au/news/stories/2007/10/26/2071270ABC.htm, ABC Radio, ‘Costello warns banks against
rates rises,’ 23 October 2007: http://www.abc.net.au/news/stories/2007/10
/23/2068276.htm (both accessed 7 November 2011).
4 Money, ‘Kevin Rudd warns banks not to raise interest rates,’ 2 February 2010: http://money.ninemsn.com.au/
(accessed on 5 November 2011)
5 ABC Radio, ‘Banks have grounds to raise home loan rates: Deloitte,’ 2 November 2007:
http://www.digradio.com.au/news/stories/2007/11/02/2080595.htm (accessed 7 November 2011.)

4
There are numerous studies in the literature which found evidence of asymmetric pass
through in the mortgage market (e.g. Allen, Rutherford, and Wiley, 1999; Haney, 1988; Hofmann
and Mizen, 2004; de Haan and Sterken, 2011). Hofman and Mizen (2004) observed downward
rigidity of the mortgage interest rate in the UK, the US and Dutch markets. Payne and Waters
(2008) also found that the response of the prime rate to changes in the federal funds rate in the
US was asymmetric. By adopting the methodology proposed by Enders and Siklos (2001), Payne
(2007, 2006) provided convincing evidence that US mortgage rates were cointegrated with the
federal funds rate in the long run but with incomplete short-run pass through. Other international
evidence on incomplete pass through exists for New Zealand retail rates (Liu et al., 2008);
Canadian mortgage rates (Allen and McVanel, 2009) and the US online mortgage rates
(Arbatskaya and Baye, 2004).
Lim (2001) examined the asymmetric adjustments between three different types of interest
rates in Australia: a bank bill rate, a loan rate and a deposit rate. She uses a multivariate
asymmetric error-correction model to capture the long- and short-run relationships between the
levels of the rates and short-run relationships between the changes in the rates. Her empirical
results indicate that “banks value their borrowing customers and tend to pass on decreases in the
loan rates faster than they pass on increases” (Lim, 2001, p.146).
In a recent article Karamujic (2011) used monthly data (June 1994–March 2004) to examine
the nature of seasonality in the mortgage interest rates of two major banks in Australia (i.e.
National Australia Bank and Commonwealth Bank of Australia). By adopting a structural time
series modelling approach, he finds evidence of significant seasonal variations in the standard-
variable mortgage rates in May, June, November, December and January. He concludes that “the
observed seasonalities are not related to the bank’s intervention and can be attributed to the
particular stage of the interest rate cycle” (Karamujic, 2011, p.337).6
6 Some of these seasonal variations in the data have been captured in this study by the AR(1), AR(6) and AR(9)
terms in Table 2.

5
This paper offers an analytical modelling framework to quantify and assess the “rocket-and-
feathers hypothesis”. The results increase our understanding of the mortgage lending market in
Australia. By testing two different types of possible asymmetries (i.e. the amount asymmetry and
adjustment asymmetry), in this paper we address an important policy issue not recently tackled in
the Australian context. To the best of our knowledge, only three overseas studies have
incorporated both the amount and adjustment asymmetries in their short-run dynamic models for
mortgage rates: (1) Allen and McVanel (2009) in their study of the Canadian mortgage market;
(2) de Haan and Sterken (2011) in their work on the daily interest rate adjustment in the Dutch
mortgage market; and (3) Liu, Margaritis and Tourani-Rad (2011) in their aggregate analysis of
the interplay between the six-month deposit rate and two retail interest rates (the standard-
variable mortgage rate and the business lending rate) in New Zealand. The majority of previous
studies have only tested for the adjustment asymmetry (see for example Sarno and Thornton,
2003; Chong et al., 2006; Liu et al. 2008; Chong, 2010).
The rest of this paper is structured as follows. In Section II our threshold and asymmetric
error-correction models are briefly presented. Section III discusses the choice of our sample
period and presents the normality and unit-root test results. Section IV presents the empirical
results of the short- and long-run mortgage rate models and finally Section V provides some
concluding remarks.
II Theoretical Framework
The cash rate is the baseline for rates charged by Australian financial institutions for their
various loans including mortgage rates. Based on a relationship between the cash rate (rt) and the
mortgage rate (it) in the long run we assume that t t ti rβ ε= + . In this equation β denotes the long-
run pass-through parameter, and tε is the residual term. In the case where it and rt are
6
cointegrated an ECM version of this relationship, with thresholds for positive or negative
deviations from the long run relationship, can be specified.
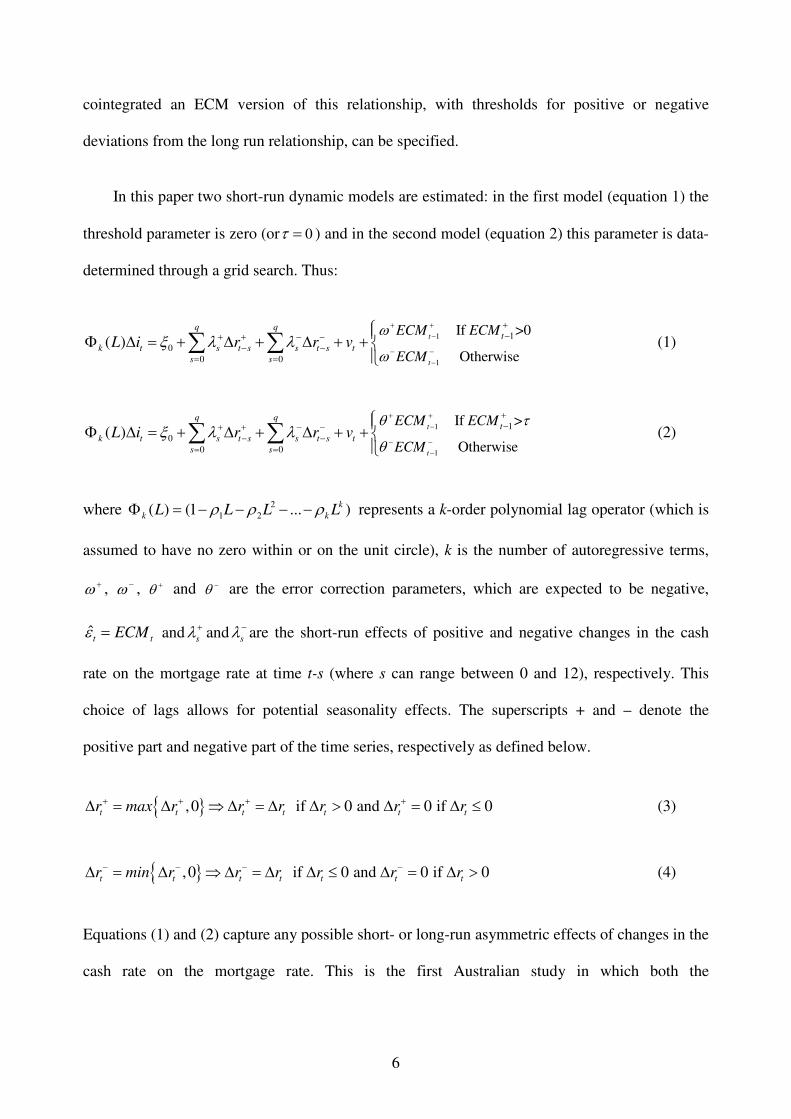
In this paper two short-run dynamic models are estimated: in the first model (equation 1) the
threshold parameter is zero (or 0τ = ) and in the second model (equation 2) this parameter is data-
determined through a grid search. Thus:
1
1
1
0
0 0
If >0
Otherwise( )
t
t
q qt
k t s t s s t s t
s s
ECM ECM
ECML i r r v
ω
ωξ λ λ
+ +−
− −−
+−+ + − −
− −= =
Φ ∆ = + ∆ + ∆ + +
∑ ∑ (1)
1
1
1
0
0 0
If >
Otherwise( )
t
t
q qt
k t s t s s t s t
s s
ECM ECM
ECML i r r v
θ τ
θξ λ λ
+ +−
− −−
+−+ + − −
− −= =
Φ ∆ = + ∆ + ∆ + +
∑ ∑ (2)
where 2
1 2( ) (1 ... )k
k kL L L Lρ ρ ρΦ = − − − − represents a k-order polynomial lag operator (which is
assumed to have no zero within or on the unit circle), k is the number of autoregressive terms,
ω + , ω − , θ + and θ − are the error correction parameters, which are expected to be negative,
t̂ tECMε = and sλ
+and sλ
−are the short-run effects of positive and negative changes in the cash
rate on the mortgage rate at time t-s (where s can range between 0 and 12), respectively. This
choice of lags allows for potential seasonality effects. The superscripts + and – denote the
positive part and negative part of the time series, respectively as defined below.
}{ ,0 if 0 and 0 if 0t t t t t t t
r max r r r r r r+ + + +∆ = ∆ ⇒ ∆ = ∆ ∆ > ∆ = ∆ ≤ (3)
}{ ,0 if 0 and 0 if 0t t t t t t t
r min r r r r r r− − − −∆ = ∆ ⇒ ∆ = ∆ ∆ ≤ ∆ = ∆ > (4)
Equations (1) and (2) capture any possible short- or long-run asymmetric effects of changes in the
cash rate on the mortgage rate. This is the first Australian study in which both the
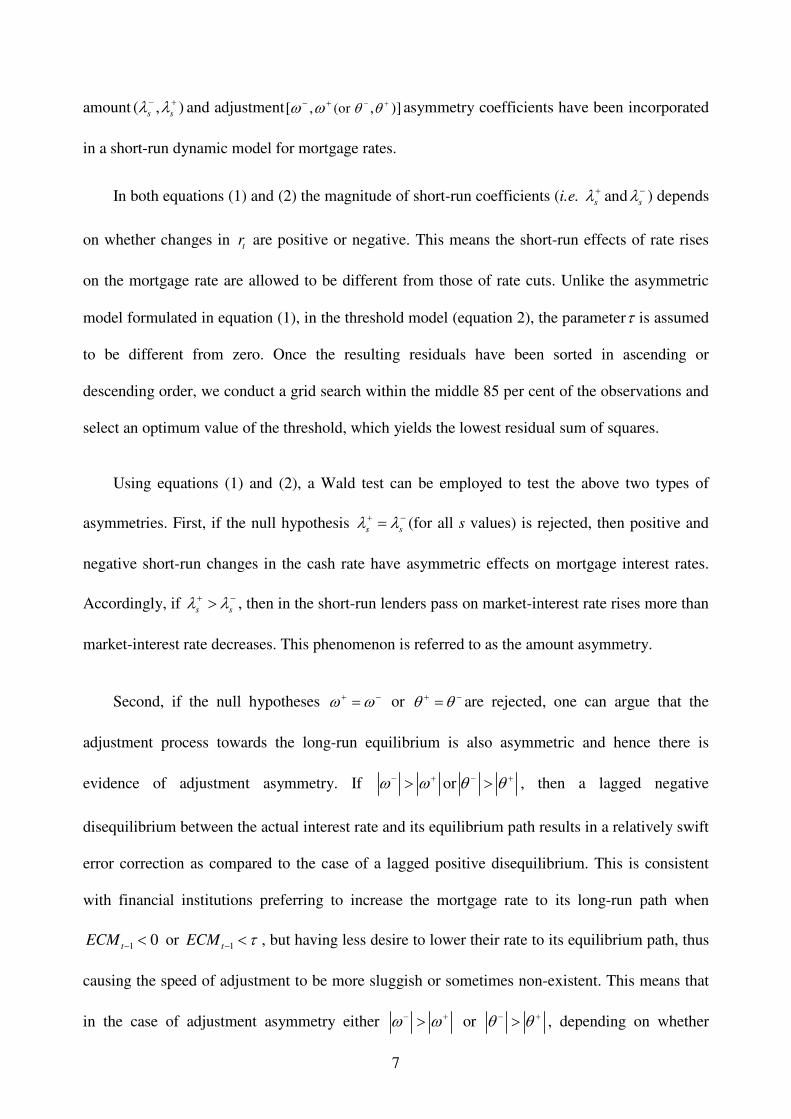
7
amount ( , )s sλ λ− +and adjustment (or [ , , )]θ θω ω − +− + asymmetry coefficients have been incorporated
in a short-run dynamic model for mortgage rates.
In both equations (1) and (2) the magnitude of short-run coefficients (i.e. sλ+
and sλ−) depends
on whether changes in tr are positive or negative. This means the short-run effects of rate rises
on the mortgage rate are allowed to be different from those of rate cuts. Unlike the asymmetric
model formulated in equation (1), in the threshold model (equation 2), the parameterτ is assumed
to be different from zero. Once the resulting residuals have been sorted in ascending or
descending order, we conduct a grid search within the middle 85 per cent of the observations and
select an optimum value of the threshold, which yields the lowest residual sum of squares.
Using equations (1) and (2), a Wald test can be employed to test the above two types of
asymmetries. First, if the null hypothesis s sλ λ+ −= (for all s values) is rejected, then positive and
negative short-run changes in the cash rate have asymmetric effects on mortgage interest rates.
Accordingly, if s sλ λ+ −> , then in the short-run lenders pass on market-interest rate rises more than
market-interest rate decreases. This phenomenon is referred to as the amount asymmetry.
Second, if the null hypotheses ω ω+ −= or θ θ+ −= are rejected, one can argue that the
adjustment process towards the long-run equilibrium is also asymmetric and hence there is
evidence of adjustment asymmetry. If ω ω− +> or θ θ− +> , then a lagged negative
disequilibrium between the actual interest rate and its equilibrium path results in a relatively swift
error correction as compared to the case of a lagged positive disequilibrium. This is consistent
with financial institutions preferring to increase the mortgage rate to its long-run path when
1 0tECM − < or 1tECM τ− < , but having less desire to lower their rate to its equilibrium path, thus
causing the speed of adjustment to be more sluggish or sometimes non-existent. This means that
in the case of adjustment asymmetry either ω ω− +> or θ θ− +> , depending on whether
8
equation (1) or equation (2) is being used in the testing procedure. For a detailed discussion of the
distinction between the amount and adjustment asymmetries in the literature see Chen et al,
(2005), Bachmeier and Griffin (2003) and Bettendorf et al (2009) in the context of petrol prices;
Allen and McVanel (2009) and de Haan and Sterken (2011) in the context of mortgage rates.
III Data
(i) Choice of the Sample Period 1989–2011
Since 1989, the RBA has conducted monetary policy by setting the desired interest rate on
overnight loans in the money market (Grenville, 1990). This year is the starting point for our
sample period (April 1989–October 2011). Figure 1 suggests that there is a very close
relationship between the cash rate and the standard-variable mortgage rate. We use monthly data
as lower frequencies have been found to obscure asymmetries (see Brannas and Ohlsson, 1999).
[FIGURE 1 ABOUT HERE]
(ii) Normality and Unit Root Test Results
Based on the reported Jarque-Bera statistic in Table 1, the null hypothesis of normality is
rejected at any conventional level for all series as their distributions are positively skewed and
show a typical leptokurtic pattern with the kurtosis statistic exceeding well above 3.0. The
augmented Dickey-Fuller (1981) and Kwiatkowski-Phillips-Schmidt-Shin (KPSS, 1992) test
results have been presented in Table 1. In this paper the lowest value of the Schwarz criterion
(SC) has been used as a guide to determine the optimal lag length. In Table 1 we have also
reported the results of the Lee and Strazicich (2003) test, which endogenously incorporates two
structural breaks in the testing procedure. The resulting two break dates for rt and it are shown in
Figure 1 by the vertical dotted lines and solid lines, respectively. Irrespective of which test is
considered, it appears that both rt and it contain a unit root and the residuals obtained from
9
t t ti rβ ε= + are stationary.7 Hence, one can argue that rt and it are cointegrated and this is easily
backed up by the visual inspection of the graph presented in Figure 1. Lowe (1995) also found
similar results based on his sample period which ran from January 1986 to October 1994.
[TABLE 1 ABOUT HERE]
IV Empirical Results
A cursory look at Figure 1 reveals that during the entire sample period 1989–2011 there are
four specific periods when both the mortgage rate and the cash rate witnessed a noticeable
downward trend: January 1990–July 1994 (as a result of a recession), May 1996–January 2000
(as an outcome of the Asian financial crisis), January 2001–April 2002 (due to another recession)
and September 2008–August 2009 (as a consequence of the recent global financial crisis). As can
be seen from Figure 1, while the cash rate was on a downward trajectory during these periods, the
reduction in the mortgage rate was not of the same magnitude over time. As a result, the gap
between these two rates became wider when both rates were decreasing. This phenomenon is
more noticeable in the first (January 1990–July 1994) and the last periods (September 2008–
August 2009). Such behaviour was not exhibited at times when the cash rate was on the rise.
Attention is now directed to examine such an asymmetric behaviour using a more formal
econometric approach.
(i) Estimated Threshold Error-Correction Models
In this section, we estimate the long-run relationship between the standard-variable mortgage rate
and the cash rate by OLS. With 2 =0.637,R the resulting residuals from our estimated
relationship, 1.252t ti r= , appear to be stationary (ADF=-4.316). Thus, 1 1 11.252t t tECM i r− − −= − can
7 The non-stationarity of interest rates has important implications for macroeconomic modelling at both the
theoretical and the empirical levels. If interest rates contain unit roots, a one-time shock to interest rates will have
permanent effects through time. On the other hand, if interest rates are stationary, then innovations are of transitory
nature and reversible. The presence of a unit root in the nominal interest rates is found in many studies in the
literature. However, DeJong et al. (1992) argue that this non-stationarity can be attributed to small samples and the
well-known low power of unit root tests, which cannot distinguish between an I(1) and a near unit-root process.

10
be used as an error correction mechanism in a short-run dynamic model. The long-run pass-
through parameter is estimated at 1.252, which is statistically significant at the 1 per cent level
with a correct sign. This means that in the long run a 1 per cent rise in the cash rate by the RBA
leads to a 1.252 per cent increase in the mortgage rate. We also tested the hypothesis that the
long-run pass through parameter is equal to 1. Given F(1,270)=305 and p-value=0.00, such a
hypothesis is rejected. Before using OLS, we also conducted the Hausman (1978) test in the
following two stages to ensure that there is no simultaneity between the mortgage rate (it) and the
cash rate (rt). First, we regressed rt on our selected instrumental variables (i.e. it-1, it-2, rt-1 and rt-2)
and then the fitted values (i.e. t̂r ) and the resulting residuals (i.e. t̂e ) were obtained. Second, it was
regressed on the estimated t̂r and t̂e . Since the coefficient for t̂e (-0.113) was not statistically
significant (p-value=0.67), it was concluded that the cash rate was weakly exogenous with
respect to the dependent variable.
As discussed in the previous section, we have adopted two dynamic error-correction models
(i.e. equations 1 and 2). In the first short-run dynamic model (Model I) the threshold parameter
(τ ) was assumed zero. However, in Model II, which is based on equation (2), this parameter is
determined endogenously by the data. In other words, after sorting the resulting residuals, we
searched within the middle 85 per cent of the observations and selected a value of the threshold
which yielded the lowest residual sum of squares as an estimate of the optimal threshold. The
lower and upper values in our grid search were 0.2262 and 1.9194, respectively, with an
increment of 0.01 at each step leading to an optimal threshold value of 0.2462.
In terms of determining the optimal lag length (q) in equations (1) and (2), given that we are
using monthly data, an upper band of 12 lags was allowed. Following the general-to-specific
methodology, insignificant variables in equations (1) and (2) were omitted on the basis of a
battery of maximum likelihood tests. We imposed joint-zero restrictions on explanatory variables

11
in the unrestricted (general) model to obtain the most parsimonious and robust equation. The
estimation results for both Model I and Model II have been presented in Table 2.
[TABLE 2 ABOUT HERE]
According to Table 2, all of the estimated coefficients are statistically significant at the 1 per
cent level and have the expected theoretical signs, with the only exception being1t
ECM+− . Both
models also perform well in terms of goodness-of-fit statistics. The adjusted R2 is as high as 0.64
and the overall F test rejects the null hypothesis at the 1 per cent level of significance.
Furthermore, both estimated models pass a battery of diagnostic tests and show no sign of serial
correlation (see the Breusch-Godfrey LM tests), misspecification (see the Ramsey RESET test),
heteroskedasticity (see the ARCH tests) or instability (see the Chow forecast tests in three
different out of sample periods). The only diagnostic test that our models could not pass was the
Jarque-Bera normality test of the residuals. One should not be concerned about the normality test
results as we have used a large sample size with 261 monthly observations.8 The estimated
coefficients of AR(1), AR(6) and AR(9) are also statistically significant. This indicates the
presence of some seasonality as also found by Karamujic (2011). The corresponding inverse roots
of AR polynomials for both models are well within the unit circle. As can be seen from Table 2,
the estimated coefficients in both Models I and II are very similar in terms of their magnitudes
and statistical significance.
Ceteris paribus, if in the short run the cash rate increased, say by 1 per cent in a particular
month, this would have immediately led to a rise of 1.158 per cent in the mortgage rate. On the
other hand, a similar 1 per cent rate cut would have resulted in only 0.550 per cent instantaneous
fall followed by a subsequent 0.290 per cent cut a month later. The total short-run effect
associated with the RBA’s rate cut would then be only 0.84 per cent (0.55+0.29), whereas the
8 Although the Jarque-Berra statistic rejects the normality of the errors, the reported F statistics are asymptotically
justified as the method of moments’ diagnostic tests. See Hayashi (2000, sections 2.7 and 2.10).

12
corresponding effect for a rate rise would be 1.158 per cent. This proffers support for the short-
run applicability of the “rockets-and-feathers hypothesis” in the context of the mortgage market
in Australia.
What about the adjustment asymmetry? In Table 2 ω ω− +> and θ θ− +> , it is thus clear
that whenever the actual mortgage rate is below its equilibrium path at time t-1 (i.e.1
0t
ECM−< ),
the mortgage rate quickly adjusts towards its equilibrium with an estimated feedback coefficient
of -0.176 per month. However, when the mortgage rate is above the equilibrium value
or1
0t
ECM−> , such an adjustment does not take place as the corresponding t ratio for the feedback
coefficient is insignificant (see the t ratio for the coefficient of 1t
ECM+
− in Table 2). It appears that
the Australian mortgage lenders charge above equilibrium rates when such a deviation from the
equilibrium path occurs. Conversely, when their actual rates are below the market equilibrium
(i.e. Model I) or less than a certain threshold (i.e. Model II where 0.2462τ = ), they correct the
prevailing gap by raising their mortgage rates with a feedback coefficient of -0.17.
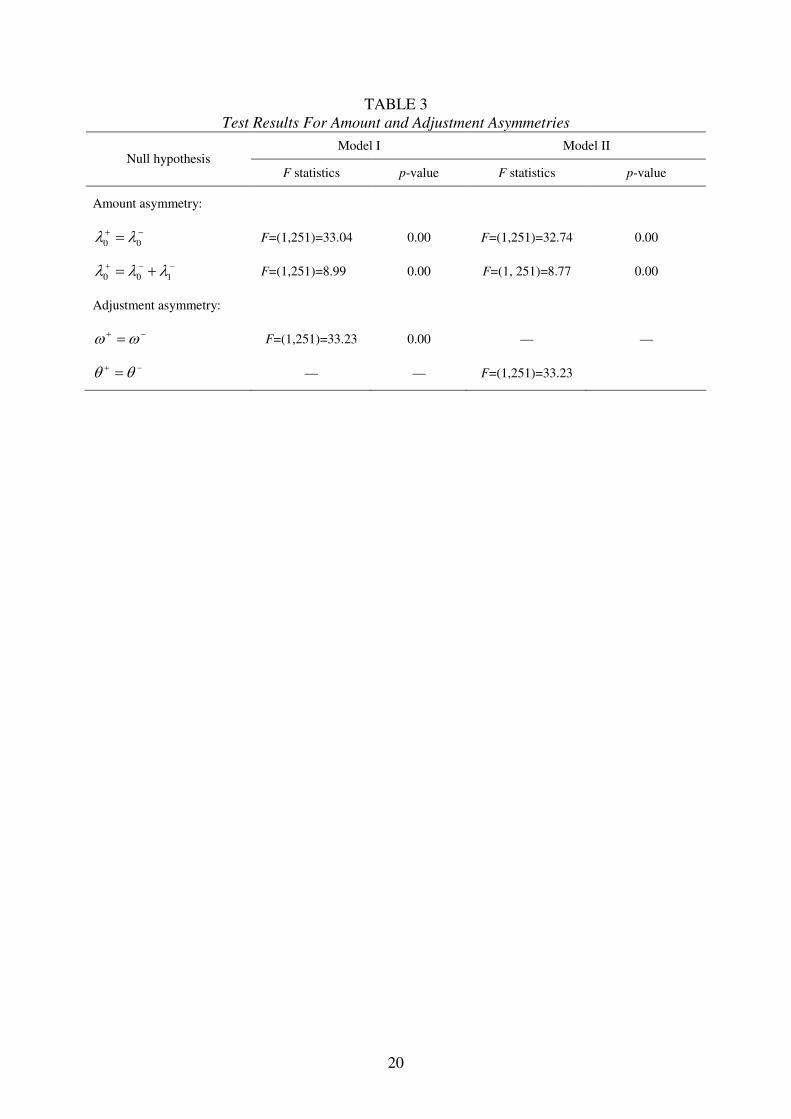
We have also formally tested the absence of both the amount asymmetry (i.e. the short-run
asymmetry) and the adjustment asymmetry (i.e. the long-run asymmetry) using a Wald test with
the results presented in Table 3. The null hypotheses are rejected at the 1 per cent level of
significance, irrespective of which model has been used in the testing procedure. Based on these
results, one can argue that there is convincing evidence for the existence of both amount
asymmetry and adjustment asymmetry. Our results are also consistent with previous studies. An
overwhelming majority of previous studies suggest that there is a great deal of asymmetry in the
short-run changes in mortgage rates. See for instance Heffernan (1997), Payne (2007, 2006),
Toolsema and Jacobs (2007), Saadon, et al. (2008), Liu, et al. (2008), Allen and McVanel (2009)
and de Haan and Sterken (2011).
[TABLE 3 ABOUT HERE]

13
What can possibly explain this phenomenon? In general, Peltzman (2000) believed that
various measures of imperfect competition, the existence of consumer search costs, inventory
cost, inflation-related asymmetric menu costs, and input price volatility, determine the extent of
asymmetric changes in the prices of goods and services. Since interest rates represent the price of
borrowed or loaned funds, one can relate to Peltzman’s findings with a slightly different
perspective regarding changes in interest rates. Previous interest rate studies have identified five
explanations for the rigidity in the rate adjustment process: fixed menu cost, high switching cost,
imperfect competition, asymmetric information, and interest rate regulation (see inter alia
Hannan and Berger, 1991; Scholnick, 1996; Chong et al., 2006; and Chong, 2010).
In the context of Australian mortgage rates, Lowe and Rohling (1992) provided a detailed
account of the stickiness of various types of loan rates. They argued that the two most important
explanations for the downward stickiness of the mortgage rates in Australia are switching costs
and risk sharing. Switching costs (such as loan establishment fees, stamp duty, early repayment
fees) associated with moving from one housing loan to another could be quite high. It is also
argued that “if borrowers are more risk averse than the shareholders of the bank, there exists an
implicit risk insurance argument for the stickiness of interest rates” (Lowe and Rohling, 1992,
p.11). If competition is not strong and customers’ decisions are interest-rate inelastic, then
changes in the cash rate may have relatively little impact on mortgage rates.
V Conclusion
Banks’ asymmetric behaviour in setting mortgage rates is a cause of concern in the
community. As in many other countries, mortgage interest payments constitute a significant
proportion of consumer spending in Australia. However, little empirical work has been conducted
regarding the dynamic effects of a change in the cash rate on Australia’s retail mortgage rate.
This paper quantifies the extent of asymmetric behaviour exhibited by the banking industry as a
whole by tracing out the dynamic asymmetric responses of lenders to changes in the cash rate

14
over time. Specifically, this paper tests the “rockets-and-feathers hypothesis” in the Australian
residential mortgage market. The framework can be adapted to model the asymmetries in other
types of retail and wholesale interest rates, including those for credit cards, personal loans, and
business loans.
Using monthly data from 1989 to 2011, we found that rate rises are passed onto the
consumer faster than rate cuts. The short-run effects of a 1 per cent rise and fall in the cash rate
on the mortgage rate are 1.158 per cent (occurred almost instantaneously) and 0.84 per cent
(eventuated within 1–2 months), respectively. In sum, one can conclude that when actual
mortgage rates are below the market equilibrium value, Australian banks quickly fill the gap by
raising their mortgage rates. Conversely, when actual mortgage rates are above the equilibrium
path, lenders usually hesitate to lower their rates.
REFERENCES
Allen, J. and McVanel, D. (2009), ‘Price Movements in the Canadian Residential Mortgage
Market’, Bank of Canada Working Paper 2009-13, Ottawa.
Allen, M.T., Rutherford, R.C. and Wiley, M.K. (1999), ‘The Relationships between Mortgage
Rates and Capital Market Rates Under Alternative Market Conditions’, Journal of Real Estate
Finance Economics, 19, 211–21.
Arbatskaya, M. and Baye, M. (2004), ‘Are Prices `Sticky' Online? Market Structure Effects and
Asymmetric Responses to Cost Shocks in Online Mortgage Markets’, International Journal
of Industrial Organization, 22, 1443-62.
Bachmeier, L.J. and Griffin, J.M. (2003), ‘New Evidence on Asymmetric Gasoline Price
Responses’, The Review of Economics and Statistics, 85(3), 772–76
Bacon, R.W. (1991), ‘Rockets and Feathers: The Asymmetric Speed of Adjustment of U.K. Retail
Gasoline Prices to Cost Changes’, Energy Economics, 13, 211–18.
Bettendorf, L., van der Geest, S.A. and Kuper, G.H. (2009), ‘Do Daily Retail Gasoline Prices
Adjust Asymmetrically?’, Journal of Applied Statistics, 36(4), 385–97.
Bikker, J.A. and Haaf, K. (2002), ‘Competition, Concentration and their Relationship: An
Empirical Analysis of the Banking Industry’, Journal of Banking and Finance, 26, 2191–214.
Brännäs, K. and Ohlsson, H. (1999), ‘Asymmetric Time Series and Temporal Aggregation’,
Review of Economics and Statistics, 81, 341–44.
Chen, L.H., Finney, M. and Lai, K.S. (2005), ‘A Threshold Cointegration Analysis of Asymmetric
Price Transmission from Crude Oil to Gasoline Prices’, Economics Letters, 89, 233–39.

15
Chong, B.S. (2010), ‘Interest Rate Deregulation: Monetary Policy Efficacy and Rate Rigidity’,
Journal of Banking and Finance, 30, 1467–84.
Chong, B.S., Liu, M.H. and Shrestha, K. (2006), ‘Monetary Transmission via the Administered
Interest Rates Channel’, Journal of Banking and Finance, 34, 1299–1307.
Corvoisier, S. and Gropp, R. (2002), ‘Bank Concentration and Retail Interest Rates’, Journal of
Banking and Finance, 26(1), 2155–89.
de Haan, L. and Sterken, E. (2011), ‘Bank-Specific Daily Interest Rate Adjustment in the Dutch
Mortgage Market’, Journal of Financial Services Research, 39, 145–59.
DeJong, D.N., Nankervis, J., Savin, N.E. and Whiteman, C.H. (1992), ‘The Power Problems of
Unit Root Tests in Time Series with Autoregressive Errors’, Journal of Econometrics, 53,
323–43.
Dickey, D. and Fuller, W. (1981), ‘Likelihood Ratio Tests for Autoregressive Time Series with a
Unit Root’, Econometrica, 49, 1057-72.
Eichengreen, B., Watson, M.W. and Grossman, R.S. (1985), ‘Bank Rate Policy under the Interwar
Gold Standard: A Dynamic Probit Model’, The Economic Journal, 95, 725–45.
Enders, W. and Siklos, P.L. (2001), ‘Cointegration and Threshold Adjustment’, Journal of
Business and Economic Statistics, 19, 166–76.
Gittins, R. (1991), ‘Bank Rates May Not Be in Your Interest’, Sydney Morning Herald, November
13, 1991.
Haney, R.L. (1988), ‘Sticky Mortgage Rates: Some Empirical Evidence’, Journal of Real Estate
Research, 3, 61–73.
Hannan, T.H. and Berger, A.N. (1991), ‘The Rigidity of Prices: Evidence from the Banking
Industry’, American Economic Review, 84, 938–45.
Hausman, J.A. (1978), ‘Specification Tests in Econometrics’, Econometrica, 46(6), 1251–71.
Hayashi, F. (2000), Econometrics. Princeton University Press, Princeton.
Heffernan, S.A. (1997), ‘Modelling British Interest Rate Adjustment: An Error Correction
Approach’, Economica, 65, 211–31.
Hofmann, B. and Mizen, P. (2004), ‘Interest Rate Pass-Through and Monetary Transmission:
Evidence from Individual Financial Institutions’ Retail Rates’, Economica, 71, 99–123.
Kwiatkowski, D., Phillips, P.C.B., Schmidt, P. and Shin, Y. (1992), ‘Testing the Null Hypothesis
of Stationarity Against the Alternative of a Unit Root: How Sure Are We That Economic
Time Series Have a Unit Root?’, Journal of Econometrics, 54, 159–78.
Lee, J. and Strazicich, M.C. (2003), ‘Minimum Lagrange Multiplier Unit Root Test with Two
Structural Breaks’, Review of Economics and Statistics, 85, 1082-9.
Lim, G.C. (2001), ‘Bank Interest Rate Adjustments: Are They Asymmetric?’, Economic Record,
77(237), 135-47.
Liu, M.H., Margaritis, D. and Tourani-Rad, A. (2008), ‘Monetary Policy Transparency and Pass-
Through of Retail Interest Rates’, Journal of Banking and Finance, 32(4), 501-11.
Liu, M.H., Margaritis, D. and Tourani-Rad, A. (2011), ‘Asymmetric Information and Price
Competition in Small Business Lending’, Journal of Banking and Finance, 35, 2189–96.
Lowe, P. (1995), ‘The Link Between The Cash Rate And Market Interest Rates’, Research
Discussion Paper 9504, Economic Research Department, Reserve Bank of Australia.

16
Lowe, P. and Rohling, T. (1992), ‘Loan Rate Stickiness: Theory and Evidence’, Research
Discussion Paper 9206, Economic Research Department, Reserve Bank of Australia.
Maudos, J. and Fernandez de Guevara, J. (2004), ‘Factors Explaining the Interest Margin in the
Banking Sectors of the European Union’, Journal of Banking and Finance, 28, 2259–81.
Neumark, D. and Sharpe, S.A. (1992), ‘Market Structure and the Nature of Price Rigidity:
Evidence from the Market for Consumer Deposits’, Quarterly Journal of Economics, 107,
657–80.
Payne, J.E. (2006), ‘The Response of the Conventional Mortgage Rate to the Federal Funds Rate:
Symmetric or Asymmetric Adjustment?’, Applied Financial Economics Letters, 2(5), 279-84.
Payne, J.E. (2007), ‘Interest Rate Pass Through and Asymmetries in Adjustable Rate Mortgages’,
Applied Financial Economics, 17(16-18), 1369-76.
Payne, J.E. and Waters, G.A. (2008), ‘Interest Rate Pass Through and Asymmetric Adjustment:
Evidence from the Federal Funds Rate Operating Target Period’, Applied Economics, 40(10-
12), 1355-62.
Peltzman, S. (2000), ‘Prices Rise Faster than They Fall’, Journal of Political Economy, 108, 466–
502.
Reserve Bank of Australia (2011), Statistical Tables, (Tables F1 and F5), Accessed 20 October,
2011, http://www.rba.gov.au/Statistics
Saadon, Y., Ben David, N., Benzion, U. and Shiffer, Z. (2008), ‘Asymmetric Preferences and the
Central Bank's Interest Rate’, Journal of Money, Investment and Banking, 1(5), 67-84.
Sarno, L. and Thornton, D.L. (2003), ‘The Dynamic Relationship Between the Federal Funds Rate
and the Treasury Bill Rate: An Empirical Investigation’, Journal of Banking and Finance, 27,
1079–110
Scholnick, B.(1996), ‘Asymmetric Adjustment of Commercial Bank Interest Rates: Evidence from
Malaysia and Singapore’, Journal of International Money and Finance, 15, 485–96.
Toolsema, L.A. and Jacobs, J.P.A.M. (2007), ‘Why Do Prices Rise Faster than They Fall? With an
Application to Mortgage Rates’, Managerial and Decision Economics, 28(7), 701–12.

17
FIGURE 1
The Cash Rate (rt) and the Mortgage Rate (it) 1989M4-2011M10
0
4
8
12
16
20
1989
1990
1991
1992
1993
1994
1995
1996
1997
1998
1999
2000
2001
2002
2003
2004
2005
2006
2007
2008
2009
2010
2011
Cash rate (r)Standard variable rate (i)
%
90M
01-9
4M
7
96M
05-0
0M
1
01M
01-0
2M
4
08M
09-0
9M
8
Note: The endogenously-determined two break dates for rt and it are shown by the vertical
dotted lines and solid lines, respectively.
Source: The Reserve Bank of Australia (RBA, 2011).

18
TABLE 1
Normality and Unit Root Test Results
Description t
i ti∆ t
r t
r∆ t
ECM
Skewness 1.62 -1.06 2.33 -1.69 -1.976
Kurtosis 4.88 9.42 7.96 8.30 9.051
Jarque-Bera 159* 517* 523* 446* 590*
ADF test:
t stat. -2.576 -8.315* -2.426 -6.854* -4.316*
Optimal lag 4 1 2 1 4
KPSS:
LM stat. 0.400* 0.041 0.274* 0.095 0.119
Bandwidth 12 9 12 10 12
Lee and Strazicich LMτ test:
t ratio -2.950 -7.281* -2.693 -6.856* -6.617*
Optimal lag 6 6 6 1 8
ˆB
T 1993:8
2009:3
1993:08
1996:06
1995:01
2009:03
1992:03
1995:01
1994:10
2008:11
Notes: (1) * indicates that the corresponding null hypothesis is rejected at 1 per cent level of
significance. (2) The choice between the crash model and the trend break model in the Lee and
Strazicich (2003) test was based on the statistical significance of the corresponding parameters.

19
TABLE 2
Estimated Asymmetric Short-Run Dynamic Models For ( ti∆ )
Model I
(Equation 1)
Model II
(Equation 2) Variable
Coefficient t ratio p-value Coefficient t ratio p-value
Intercept -0.009 -0.6 0.55 -0.003 -0.2 0.85
tr+∆
1.158* 13.0 0.00 1.153* 13.0 0.00
tr−∆
0.550* 11.1 0.00 0.548* 11.1 0.00
1tr−−∆
0.290* 6.2 0.00 0.291* 6.2 0.00
1tECM
+
− -0.006 -0.5 0.58 -0.008 -0.8 0.40
1tECM
−
− -0.176* -6.1 0.00 -0.175* -6.2 0.00
tD
-0.656* -5.7 0.00 -0.653* -5.7 0.00
AR(1) -0.319* -5.4 0.00 -0.317* -5.3 0.00
AR(6) 0.218* 4.1 0.00 0.220* 4.1 0.00
AR(9) 0.130* 2.8 0.00 0.131* 2.9 0.00
Goodness of fit statistics:
2
R 0.657 0.659
2
R 0.645 0.647
Overall F(7, 251) 53.5* 0.00 53.9* 0.00
Akaike info criterion -1.045 -1.050
Schwarz criterion -0.908 -0.913
Hannan-Quinn criterion -0.990 -0.995
Diagnostic tests
DW 1.932 1.932
Serial correlation LM Test:
2 lags 1.455 0.24 1.225 0.30
4 lags: F(4,247) 1.523 0.20 1.359 0.25
6 lags: F(6,245) 1.520 0.17 1.363 0.23
8 lags: F(8,243) 1.563 0.14 1.455 0.17
10 lags: F(10, 241) 1.280 0.24 1.191 0.30
Ramsey RESET: F(1,250) 1.695 0.19 2.257 0.13
Jarque-Bera: (2)χ 535.9* 0.00 528.4* 0.00
Heteroskedasticity ARCH test:
1 lag: F(1,259) 1.892 0.17 2.043 0.15
2 lags: F(2,258) 1.400 0.25 1.450 0.24
3 lags: F(3,257) 1.284 0.28 1.233 0.30
4 lags: F(4,256) 1.255 0.29 1.168 0.33
Chow forecast test:
2007M01-2011M10: F(58,193) 0.774 0.87 0.806 0.83
2008M01-2011M10: F(46,205) 1.026 0.44 1.040 0.41
2009M01-2011M10: F(34,217) 0.651 0.93 0.661 0.93
Notes: (1) * indicates that the corresponding null hypothesis is rejected at 1 per cent level of significance. (2)
EViews and WinRats software packages have been used in generating our results.
20
TABLE 3
Test Results For Amount and Adjustment Asymmetries
Model I Model II Null hypothesis
F statistics p-value F statistics p-value
Amount asymmetry:
0 0λ λ+ −= F=(1,251)=33.04 0.00 F=(1,251)=32.74 0.00
0 0 1λ λ λ+ − −= + F=(1,251)=8.99 0.00 F=(1, 251)=8.77 0.00
Adjustment asymmetry:
ω ω+ −= F=(1,251)=33.23 0.00 — —
θ θ+ −= — — F=(1,251)=33.23