Embed Size (px)
Citation preview

HAL Id: hal-00524485https://hal.archives-ouvertes.fr/hal-00524485
Submitted on 8 Oct 2010
HAL is a multi-disciplinary open accessarchive for the deposit and dissemination of sci-entific research documents, whether they are pub-lished or not. The documents may come fromteaching and research institutions in France orabroad, or from public or private research centers.
L’archive ouverte pluridisciplinaire HAL, estdestinée au dépôt et à la diffusion de documentsscientifiques de niveau recherche, publiés ou non,émanant des établissements d’enseignement et derecherche français ou étrangers, des laboratoirespublics ou privés.
Interdisciplinary safety analysis of complexsocio-technological systems based on the Functional
Resonance Accident Model: An application to railwaytraffic supervision
Fabien Belmonte, Walter Schön, Laurent Heurley, Robert Capel
To cite this version:Fabien Belmonte, Walter Schön, Laurent Heurley, Robert Capel. Interdisciplinary safety analysis ofcomplex socio-technological systems based on the Functional Resonance Accident Model: An appli-cation to railway traffic supervision. Reliability Engineering and System Safety, Elsevier, 2011, 96,pp.237-249. �10.1016/j.ress.2010.09.006�. �hal-00524485�

Interdisciplinary safety analysis of complexsocio-technological systems based on the FunctionalResonance Accident Model: an application to railway
traffic supervision
Fabien Belmontea, Walter Schönb, Laurent Heurleyc, Robert Capela
aAlstom Transport48 rue Albert Dhalenne
93482 Saint-Ouen cedex, FrancebUniversité de Technologie de Compiègne
Laboratoire HeudiasycCentre de Recherches de Royallieu
BP2052960205 Compiègne cedex, France
cUniversité de Picardie Jules VerneÉquipe Cognition, Langage, Émotion et Acquisition (CLEA)
EA 4296, UFR de Philosophie, Sciences Humaines et SocialesChemin du Thil, 80025 Amiens, Cedex 1.
Abstract
This paper presents an application of Functional Resonance Accident
Models (FRAM) for the safety analysis of complex socio-technological sys-
tems, i.e. systems which include not only technological, but also human and
organizational components. The supervision of certain industrial domains
provides a good example of such systems, because although more and more
actions for piloting installations are now automatized, there always remains
a decision level (at least in the management of degraded modes) involving
human behavior and organizations. The field of application of the study
presented here is railway traffic supervision, using modern Automatic Train
Supervision (ATS) systems. Examples taken from railway traffic supervision
Preprint submitted to Reliability Engineering and System Safety August 27, 2010

illustrate the principal advantage of FRAM in comparison to classical safety
analysis models, i.e. their ability to take into account technical as well as
human and organizational aspects within a single model, thus allowing a true
multidisciplinary cooperation between specialists from the different domains
involved.
A FRAM analysis is used to interpret experimental results obtained from
a real ATS system linked to a railway simulator that places operators (experi-
mental subjects) in simulated situations involving incidents. The first results
show a significant dispersion in performances among different operators when
detecting incidents. Some subsequent work in progress aims to make these
“performance conditions” more homogeneous, mainly by ergonomic modifi-
cations. It is clear that the current Human-Machine Interface (HMI) in ATS
systems (a legacy of past technologies that used LED displays) has reached
its limits and needs to be improved, for example, by highlighting the most
pertinent information for a given situation (and, conversely, by removing
irrelevant information likely to distract operators).
Keywords:
Automatic Train Supervision (ATS), Human-Machine Interface (HMI),
Human-Machine System (HMS), Human Reliability, Functional Resonance
Accident Model (FRAM), Simulated environment, Experiments.
1. Introduction
Industrial risk management has become a major challenge for our soci-
ety. Born out of the need to control new hazards that have accompanied
technological advances (especially since the second half of the 20th century),
2

industrial risk management was first formalized in the nineteen-sixties with
the emergence of reliability and maintainability theory [1]. The designers
of safety-critical systems subsequently incorporated this formalism into the
standard techniques of systems engineering [2]. These techniques have now
been normalized for particular domains of activity. See for example [3] for
programmable electronics, or [4, 5, 6] for the specific domain of railway sig-
naling. Such developments did not, however, explicitly include any reference
to human factors. Nevertheless, in the military domain the central role of
the human operator in the operation of safety-critical systems was quickly
recognized. Norbert Wiener’s Cybernetics [7], for example, drew on obser-
vations of an anti-aircraft defence operator and a perceived analogy between
the mechanical laws governing the physical evolution of the system and the
operator’s behavior. A number of studies aiming to improve working con-
ditions have been successfully conducted and have contributed to reducing
risks. However, establishing a direct link between risk management and the
social and human sciences remains somewhat elusive. The methodological
framework for risk management now includes specific tools for evaluating hu-
man reliability, and more recently organizational reliability. The first meth-
ods to be developed used the formal framework of reliability, which meant
approximating human behavior to machine behavior. This approach was
strongly criticized by the scientific community. Dougherty [8] and Hollnagel
[9] provide a summary of this criticism. This first generation of methods also
initiated a debate about the nature of human error [10]. In the following
years a second generation of methods emerged, taking into account human
and social factors in a more detailed manner and drawing upon developments
3

in the human and social sciences [9, 11, 12, 13]; see [14] for a review of the
literature.
This paper deals with industrial risks assessment in complex socio-technical
systems comprising a technical level (hardware and software), a human level
(maintenance agents, operators, designers) and an organizational level (a set
of rules and interactions governing the different actions that can be per-
formed on the system). Each one of these components could be addressed
separately by adopting either a machine-centered approach (or technical-
centered approach) or a human-centered approach. Instead, we propose to
adopt a Human-Machine System (HMS) approach that considers these sep-
arate levels in a systemic way [15].
To illustrate our approach we present an interdisciplinary study we have
conducted to evaluate the impact of automation in a railway traffic supervi-
sion subsystem on the overall safety of the railway system. The methodology
used in this study involves carrying out the risk analysis as recommended by
each framework, and applying a complementary analysis to take into account
the human and organizational levels in a more satisfactory manner than the
classical approach to the safety of technological systems. This complemen-
tary approach must establish a referential common to the three scientific
domains involved in the complex socio-technical systems.
In the first part of the paper, we present briefly the HMS approach we
adopted. The second part uses the theory of accident modeling to demon-
strate the need for a systemic approach in evaluating the human and orga-
nizational levels. The Functional Resonance Accident Model (FRAM), de-
veloped by E. Hollnagel [16] to analyze accidents, uses this approach, where
4

the three components (technical, human, organizational) are present simul-
taneously and interact continuously. This method and its application in the
railway field are presented in the last two sections: we begin with the detailed
presentation of a safety procedure for protecting a zone of work on a railway
track where the different levels of human activity are strongly impacted, after
which we examine a further case study involving traffic monitoring and in-
cident detection by operators. In this second case the corresponding FRAM
network is calibrated using experimental results obtained from real opera-
tors during simulations. Used as a complement to the classical approach, the
FRAM method can provide a more detailed insight into human and organi-
zational events, allowing qualitative results to be refined. We conclude the
paper with some perspectives for future work: the main objectives of further
work will be to evaluate the likely benefits of improving Human-Machine
Interfaces (HMI) in ATS systems as regards the detection of incidents by
human operators, and possibly to seek to derive quantitative analysis from
qualitative analysis using belief function approaches.
This work is supported by the French State and the “Picardie” Region
as part of the “Human, Technologies and Complex Systems” research pro-
gramme. It was the subject of a PhD. thesis defended in 2008 [17].
2. Machine-centered vs. Human-Machine System approach
The present paper adopts an HMS approach rather than a machine-
centered approach.
In terms of the discipline, the machine-centered approach corresponds to
an engineering approach, the concepts and tools of industrial risk manage-
5

ment being based on standard techniques of dependability, using the math-
ematical formalism of reliability and maintainability developed by Barlow
and Proschan [1]. This formalism contains a bi-modal model of the system’s
components with only two possible states (functioning / failure) for each
component. Other methods, such as Fault Tree Analysis, are able to deal
with multimodal problems [18] i.e. taking more than one failure mode into
account. In all cases the system is characterized by a characteristic vector
giving the state of each of its components. The approach involves determin-
ing the system’s state as a function of this characteristic vector. Rigorous
methods, using inductive or deductive reasoning, are employed to this end.
The methodology is based on a systematic exploration of hazardous events or
components’ failure modes. The methods developed by dependability engi-
neers provide the tools needed to explain the failures at the system’s different
levels that result in accidents (see [19] for a detailed presentation of these
methods).
However, this machine-centered approach appeared to be insufficient to
improve the reliability of complex automated systems such as nuclear reactors
or transportation systems. It became clear that human operators are a key
component in reliability and safety of such systems. For example, Rasmussen
1969 cited by Vicente [20] points out that one of the conclusions of an analysis
of 129 industrial accidents in the nuclear and air transportation domains
conducted by the cross-disciplinary research team of the RISØ group was
that “accidents initiated by human maloperation amount to roughly three
quarters of the total number of reported cases” [20] page 11.
For this reason, from the beginning of the 1960s some researchers began
6

to shift from a machine-centered approach to an HMS approach [20, 21].
From the start, one of the main problems faced by researchers and designers
was analyzing and understanding the impact of interface design on operators’
cognitive processes and performances when interacting with complex systems
(e.g., in nuclear control rooms) in order to improve the way information
was presented to operators. Instead of finding answers to their questions in
the psychological literature they found a gap, and in an attempt to fill this
gap were led to carry out research and develop new models and methods
adapted to HMS. They used concepts, approximate models of cognition [22]
and methods developed in cognitive psychology and in cognitive science.
Nowadays, the HMS approach is well represented in three fields which
emerged at the end of the 1970s and at the beginning of the 1980s. These
fields, whose frontiers are still not clearly identified, are cognitive engineering,
cognitive systems engineering and cognitive ergonomics [23, 15]. Cognitive
engineering can be defined as “an applied cognitive science that draws on
the knowledge and techniques of cognitive psychology and related disciplines
to provide the foundation for principle-driven design of person-machine sys-
tems”. [23] p. 415. Cognitive systems engineering is a variant of cognitive
engineering in which work, humans and technology are considered as a joint
cognitive system [24]. It has recently been defined as “an approach to the de-
sign of technology, training, and processes intended to manage cognitive com-
plexity in sociotechnical systems.” [25] p. 3. Cognitive ergonomics adopts
a similar approach to the two others, but having emerged in the context
of human-computer interactions cognitive ergonomics focuses more closely
on the role of the human in HMS, whereas cognitive engineering and cogni-
7

tive systems engineering place greater emphasis on the role of the machine
[26, 15].
These fields both consider that the psychological functioning of opera-
tors (improperly referred to by the terms “cognitive” or “cognition” [21]) is
a crucial part of the overall reliability and safety of the rest of the system
in/with which they interact, and consequently must be taken into account
and incorporated in the design process of complex systems. This position is
well illustrated by Hollnagel and Woods who consider that “the costs and
consequences of ignoring the cognitive functions of Man Machine Systems are
noted in technological failures daily (we need only mention the Three Mile
Island accident)” [21] p. 585. Certain concepts, as well as theories about
the architecture and functioning of human cognition that were initially elab-
orated in the context of laboratory research (principally in an information-
processing perspective), and also methods taken from cognitive psychology
and cognitive science, have been used and adapted for practical needs by
these three fields [27, 28].
As it will appear in the following sections, our research is situated at the
meeting point of these different fields.
3. Accident theory models
The analytical method used in dependability analysis represents accidents
as successions of events in which safety appears as a property of the system.
Resilience engineering [29], in a systemic framework, goes beyond this and
defines safety as an emergent system phenomenon, rather than as a property.
8

3.1. Accident models
To facilitate this approach a classification of accidents into three cate-
gories has been proposed [16]: sequential, epidemiological and systemic.
In the sequential model, an accident is explained as a succession of events
linked together by a cause-to-effect relationship. In Reason’s [30] epidemio-
logical model an accident is the result of passive failures, introduced by latent
conditions whose effect is not immediate, but becomes manifest when a par-
ticular function or system component is called upon. Finally, the systemic
model introduced by Woods [31], Leveson [19] and Hollnagel [16] describes
an accident as the result of complex interactions between the different com-
ponents of the system. An accident is the consequence of a coincidence of
events, rather than of a deterministic succession of events [16].
3.2. Methodological referential
Dependability theories have not yet developed methods for evaluating
the dynamics of accidents relative to all three models listed above. Only the
first two models are addressed in the methodological framework. The main
methods derive from two approaches [2]:
• inductive approach (from causes to consequences: methods include
Event-Trees, Failure Modes Effects and Criticality Analysis);
• deductive approach (from consequences to causes: methods include
Fault Trees).
Several methods based on the same theoretical background have been
developed in order to address human factors and/or organizational risk anal-
ysis; see [32] for a global overview of these methods.
9

Component 1
Component 2
OK
Not O
K
Not OK
OK
1
23
4
Figure 1: Example of discrete scenario space
All these methods are widely used in various industrial domains and rec-
ommended by the normative referential. Each of them creates a representa-
tion of the system using the state of its components, which can be bi-modal
(functioning / failure) or multi-modal (several degraded modes and failure
modes). These methods enable the system’s state to be inferred from its
state vector (that is to say the values of the bi-modal or multi-modal vari-
ables defining the state of system components), and make it possible to plot
the evolution of system state via a state diagram. As an example, Figure 1
represents a system composed of two components with bi-modal states, which
leads to four states for the system. The path illustrated in the figure shows a
scenario for the evolution of system state in four steps. This representation
of accidents fulfils the requirement for the safety of a technical system to be
demonstrable, provided that it can be shown that the set of pre-established
failure scenarios is exhaustive (in terms of the severity of the consequences).
It is, however, too restrictive when dealing with events involving humans
and organizations. Considering human beings as bi-modal components (or
as components with only a few clearly identified failure modes) is obviously
10
too restrictive and does not correspond to the models to be found cognitive
psychology. In an attempt to go beyond this overly simplistic representa-
tion, systemic models have focused on system functions instead of on system
components. The purpose is to be able to represent socio-technical system
dynamics, in a continuum based on measurements of the effectiveness of
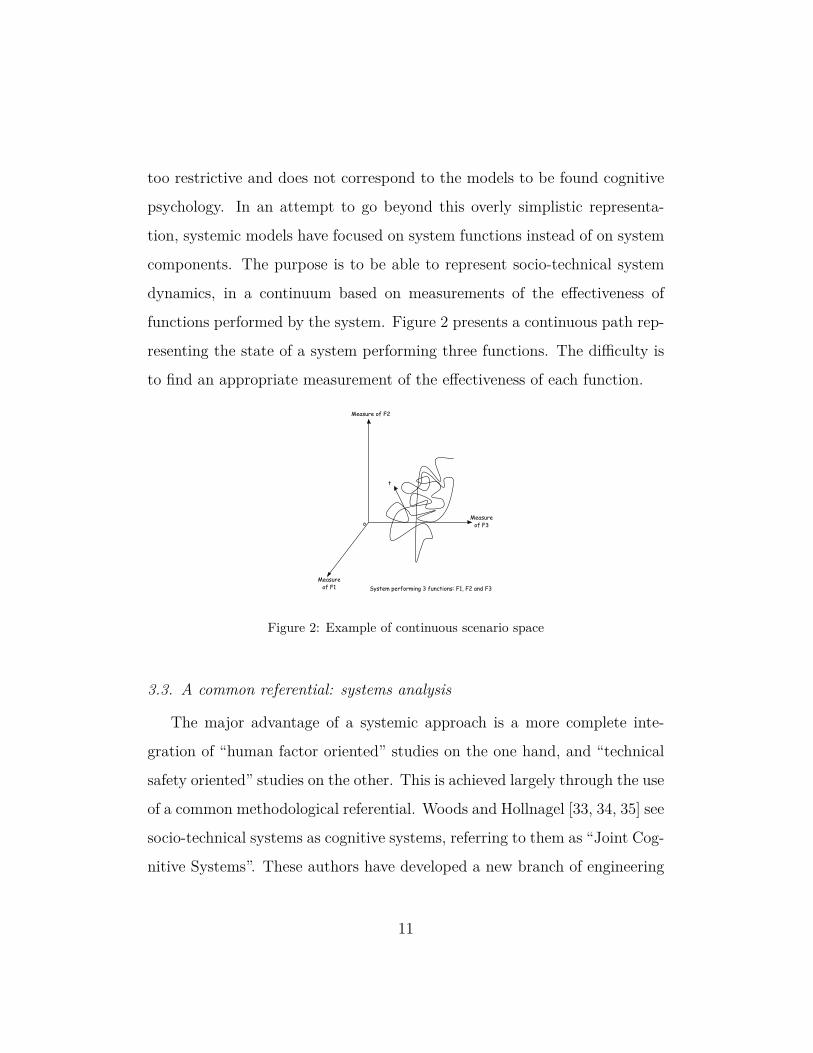
functions performed by the system. Figure 2 presents a continuous path rep-
resenting the state of a system performing three functions. The difficulty is
to find an appropriate measurement of the effectiveness of each function.
Measure of F2
Measure of F3
Measure of F1
t
System performing 3 functions: F1, F2 and F3
o
Figure 2: Example of continuous scenario space
3.3. A common referential: systems analysis
The major advantage of a systemic approach is a more complete inte-
gration of “human factor oriented” studies on the one hand, and “technical
safety oriented” studies on the other. This is achieved largely through the use
of a common methodological referential. Woods and Hollnagel [33, 34, 35] see
socio-technical systems as cognitive systems, referring to them as “Joint Cog-
nitive Systems”. These authors have developed a new branch of engineering
11

for human-machine interaction which has become known as Cognitive Sys-
tems Engineering (CSE) [36, 37]. Human-machine systems have traditionally
been analyzed using separate approaches for the human and technical com-
ponents, followed by a complementary study of interactions. For the creators
of CSE, this reductive approach is inadequate, and should be replaced by a
representation of the complete system including human operators and ma-
chines. The common denominator is given by the cognitive dimension of this
overall system.
However, a representation of the complete system will not in itself improve
the system’s safety. Internal relationships within the system do not have
identical weight, nor do they have identical consequences for safety. For
Bieder [13], a systemic representation is not sufficient by itself to yield an
integrated approach for the safety of complex socio-technical systems. A
joint endeavor bridging the divide between dependability engineering and
the human and social sciences is also needed. However, performing safety
studies by systemic methods is, in our view, a fundamental complement
to classical safety analysis. It is in this perspective that the Functional
Resonance Analysis Method was put forward.
4. The Functional Resonance Analysis Method
The FRAM method, developed by E. Hollnagel [16], describes the socio-
technical system in terms of its functions and its activities rather than in
terms of its structure. The aim of the FRAM method is to represent the
system’s dynamics by modeling the non-linear interactions that are part
of the system, and through a novel representation of the performance of
12

functions and activities. The dependency model is based on the concept of
functional resonance, which comes from undulatory physics and can be seen
as a metaphor for stochastic resonance. The stochastic resonance principle
involves superimposing noise, in non-linear systems, on a low amplitude sig-
nal that is hardly detectable. Adding the noise creates a “resonance” with
the low amplitude signal that makes it detectable. Hollnagel here makes
use of the concept of stochastic resonance (more often used to explain the
appearance of order in a system) in order to explain the occurrence of acci-
dents. He carries out this transfer from physics to safety analysis by using
the variability of performance of operational units within a socio-technical
system. Traditionally, functions represent technical system operations and
activities represent human/organizational operations; here the two concepts
are merged in the concept of “operations”. Within a socio-technical system
operational units might be technical systems, humans or organizations. In
the view of [16], variability of performance in a technical system is related
to imperfections arising out of the processes of design and production, and
to non-exhaustive specifications of working conditions (effects due to the
environment and to non-expected inputs). Variability of performance in hu-
mans and organizations comes from their capacity to adapt themselves to
working conditions and from the irregularity in activities (perception, cog-
nition, action and communication). The parallel with stochastic resonance
can be explained by the stochastic nature of the variability of performance
of operational units within the socio-technical system, considered as a non-
linear system. In addition, Hollnagel uses the superposition of the signal as
a functional dependency model between system’s operational units. The low
13

amplitude signal corresponds to the variability of performance of a partic-
ular operational unit. This variability is a “low amplitude signal” insofar
as deviations in performances (considered individually and not in the global
system context) have little or no impact on the global system performance
and on safety. The “noise” signal creating the resonance corresponds to the
variability of performance of the rest of the system. The low amplitude sig-
nal may therefore be the variability of performance of any operational unit
in the system, and consequently the “noise” corresponds to the aggregation
of the variability of performance of all other operational units (including the
environment). Hollnagel calls this phenomenon “functional resonance”.
Examining the potentiality of accidents using the FRAM method means
examining the operation of a particular system in three separate steps that
we outline below.
OperationalUnit o
rp
i
t cInputs (i)
Outputs (o)Ressources (r)
Controls/constraints (c)Precondition (p)
time (t)
Figure 3: Hexagram
The first step is a formal breakdown of system operation into elementary
operational units, each of which has six attributes (see Figure 3). These
attributes serve as connectors between elementary operational units:
• Inputs (i): input(s) of the operational unit;
• Outputs (o): output(s) of the operational unit;
14

• Resource (r): resource(s) required for the processing performed by the
operational unit;
• Times (t): time required for the processing performed by the opera-
tional unit;
• Control (c): control(s) and constraint(s) governing processing by the
operational unit (exceptions, procedures, methods, etc.);
• Precondition (p): conditions that must be satisfied for the operational
unit to function correctly.
Workingplan
Workingplan
HMI ATS
HMI ATS
HMI ATS
Signs on tracksCommunication
Workingplan
H
To workon tracks o
rp
i
t c
F10
F9
T
To blockswitch o
rp
i
t c
F7
F8
F6
F5
F4
H - T
To identify,to memoriseSwitch ID.
o
rp
i
t c
F2
F3
F1
msg. confirmation
ti
to
15s - (ti-to)
H - T
To Authorisework on track
o
rp
i
t c
To commandswitch blocking o
rp
i
t c
To confirmHILC
o
rp
i
t c
To validatethe
preparationo
rp
i
t c
To prepareHILC o
rp
i
t c
To requestfor
protectiono
rp
i
t c
T
T
H - T
H - T
T
To Acknowledgeswitch blocked o
rp
i
t c
H - T
CRCcontrol
Switch's stateupdated on HMI
Switchblocked
msg.cmd
msg.preparation
Workauthorisation
Switchblocked
msg.acknowledgepreparation
Switch ATS'S ID.position on HMI
Switch ATS'sID.
Switch ATS's ID.positionon MMI
Switch field's ID.
Blockrequest for
Switch field's ID.
Figure 4: FRAM network model
The second step is determining the potential variability of each opera-
tional unit. FRAM classifies operational units into three categories: Human
(H), Technical (T) and Organizational (O). The operational unit’s poten-
tial variability is determined by the respective weights of eleven common
15

performance conditions (CPC), acting as context factors on the operational
unit, according to its category. The CPC used in FRAM are based on Holl-
nagel’s CREAM (Cognitive Reliability and Error Analysis Method) method
for studying human reliability; see [9] for a detailed presentation.
The CPC are shown in Table 1, according to operational unit category.
These context factors can have positive or negative impacts on performance.
CPC Category
Resource availability H - T
Training and experience H
Quality of communications H - T
Quality of human-machine interfaces T
Accessibility and availability of meth-
ods and procedures
H
Working conditions H - T
Number of simultaneous objectives H - O
Time available H
Circadian rhythm H
Quality of team collaboration H
Quality of organizational support O
Table 1: Common Performance Conditions (CPC)
The quality of each CPC takes one of three possible values: (1) stable
or variable but adequate, (2) stable or variable but inadequate, (3) unpre-
dictable. The aim is to determine the set of applicable CPCs for each oper-
ational unit and to evaluate their quality. As a general rule, where a CPC is
stable or variable but adequate the corresponding variability of performance
is low, and where the CPC is stable or variable but inadequate, variability of
performance is high. Finally, if a CPC is unpredictable, the corresponding
16

variability of performance is very high.
The third step establishes dependencies between operational units. This
is easily performed by inserting correspondence attributes assigned in the
first step. Graphically, this means connecting the inputs and outputs of each
unit, represented by its hexagon, to the outputs and inputs of other units,
thus constituting what is termed a “FRAM network”: Figure 4 shows an
example of a FRAM network constructed in this way (this network repre-
sents the railway case study presented in the following section, for protecting
maintenance teams on tracks, in its nominal mode). This network enables
information flows during the normal execution of an operation to be repre-
sented formally. The labels H, T and O in the header part of a unit’s hexagon
indicate the category of entities participating in the operational unit. The
network is then used to search for negative functional resonances which may
affect the correct sequence of operational units and to detect the propagation
of such resonances through the system.
The following section presents a case study of the use of FRAM in the
domain of railway safety.
5. Application to railway traffic supervision
5.1. Railway supervision context
In the past, the safety of railway traffic was almost entirely dependent
on actions by humans (mechanical signals were manually manipulated by
agents). Now railway systems are widely automated:
• On most lines, trains are automatically and safely detected inside fixed
zones known as “blocks” (very few lines currently use “moving blocks”
17

whose positions depend on the movements of trains). Safe detection
means that no single failure or plausible combination of failures can
lead to the non-detection of a train (consequently failures usually lead
to false detections);
• This automatic train detection is used to operate signals which en-
sure that trains only enter blocks that are not already occupied. This
function is called “block logic” or “block system”;
• To accommodate trains going in several directions, a railway network
includes branch lines and junctions that rely on “switches” or “points”.
The state of the switches is safely controlled;
• Automatic train detection, switch control and signals are used to allow
a train to travel on a “route” (a section of track between two switches)
only if no trains are simultaneously allowed to travel on a conflicting
(i.e. opposite direction, convergent, sequent, etc.) route. This function
is called “interlocking”;
• If a driver fails to respect a signal, this will be detected and result in
the train being stopped. This function is known as “Automatic Train
Protection” (ATP);
• On some urban lines trains are driven automatically, and in certain
cases no driver is present in the cab. This function, known as “Auto-
matic Train Operation” (ATO) is not considered safety critical (since
safety is ensured by ATP function);
18

• Finally, the control and monitoring of traffic is more and more central-
ized in “Operating and Control Centers” (OCC). This function, known
Automatic Train Supervision (ATS) is the framework for the present
paper.
The ATS function has evolved considerably in recent years: it now makes
wide use of computer systems to perform functions like “automatic route
setting” (routes are automatically set for trains using predefined “timeta-
bles” or “time schedules” where each train’s mission is defined). Therefore,
in a completely nominal situation the human operator’s role is restricted to
monitoring (see [38] for a detailed description of “ironies of automation”).
However, human interventions remain necessary to recover from unavoidable
incidents which make some trains late, make some sections of track unavail-
able, and so on. In such cases, human operators will use ATS to modify the
schedule, to manually set routes, etc. Although this might seem surprising
at first sight, the ATS function is not considered safety critical, given that
safety is built in at the level of the interlocking and ATP functions. How-
ever, the ATS function is a nerve center because of its central position in
relation to operators’ decisions and actions, especially in degraded situations
where operator intervention is required. Indeed, the analysis of some rail-
way accidents has shown that consequences would have been far less severe
if operators had performed appropriate “last chance” recovery actions (but
they did not do so through lack of information, or lack of time, etc.) For this
reason, a recent tendency has been to assign to modern ATS subsystems a
non-zero Safety Integrity Level (SIL is a measure of the degree of confidence
in the safety of a function, level 0 indicating no safety constraint at all, and
19

level 4 being the maximum value). In this perspective, the aim of our ap-
proach is to evaluate the impact of the ATS subsystem on the global safety
of a railway system. Technical components having attained a high safety
level, attention should now be focused on the evaluation of human-machine
interactions and their impact on safety. This approach requires cooperation
between railway engineers (for the technical component), human and social
scientists (for the human and organizational component) and safety engineers
(for the synthesis and the global evaluation of the safety level.)
To illustrate the interest of a systemic approach in this interdisciplinary
context, we now present a case study using FRAM as a complement to clas-
sical safety analysis for a scenario involving the locking of a switch for the
protection of maintenance agents on the track. In this example interactions
between operators, as well as interactions between operators and machines,
have a significant impact on safety.
5.2. Case study
The protection of maintenance teams on sections of track requires the
locking of switches that otherwise might direct trains towards the working
zone. Any failure of the locking operation could be fatal for the workers
involved. The locking operation is performed in collaboration between the
head of maintenance team and the ATS operator. It requires a direct control
of the interlocking function (the “ultra safe” function making it impossible
to set conflicting routes), which is in stark contrast to the usual mode of
operation, given that most executable controls are normally “filtered” by the
interlocking and ATP functions (an unsafe command issued by an ATS func-
tion will simply not be executed). Here the command is directly transmitted
20
to safety installations, without validation by another “ultra safe” function.
For this reason safety engineers have put in place a safety procedure called
“High Integrity Level Commands” (HILC). This procedure is a sequence of
safety related communications between ATS computer systems in OCCs and
the protection system which controls the switches (interlocking). An error
detection code based on a Cyclic Redundancy Check (CRC) ensures the in-
tegrity of digital data exchanges between computers. The operator is obliged
to use a double command mechanism which protects against unintentional
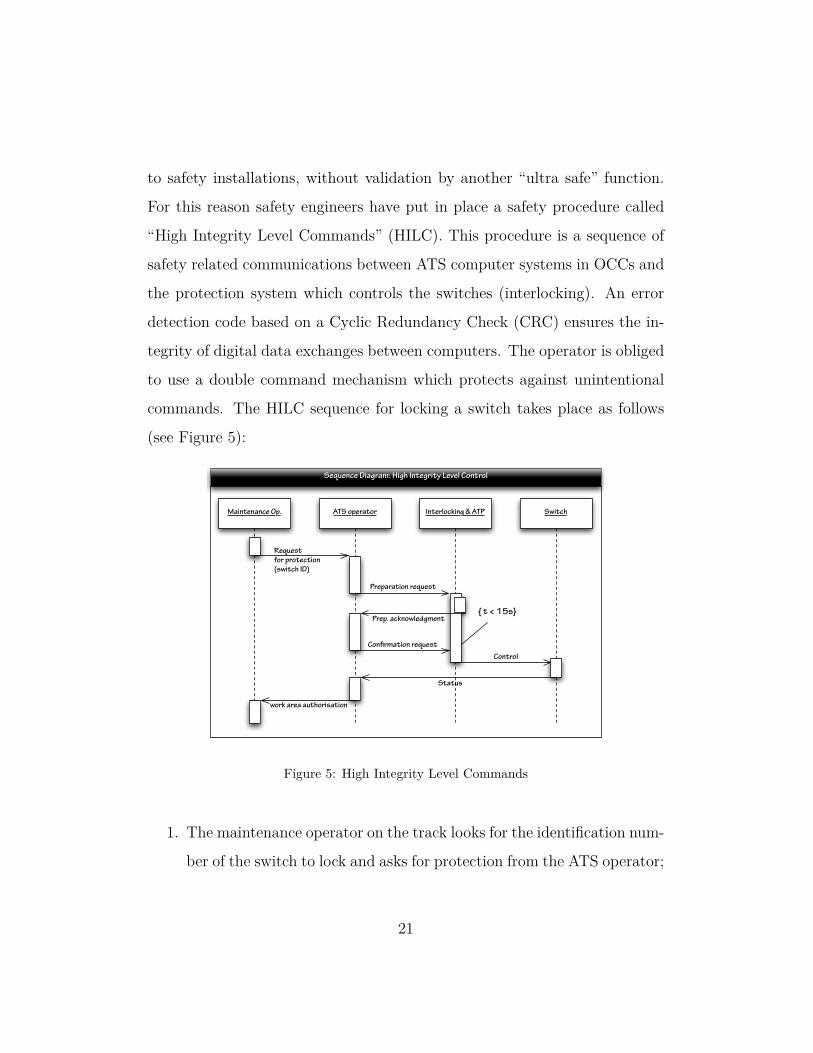
commands. The HILC sequence for locking a switch takes place as follows
(see Figure 5):
ATS operator Interlocking & ATPMaintenance Op.
Requestfor protection(switch ID)
Switch
Preparation request
Prep. acknowledgment
Confirmation requestControl
Status
work area authorisation
{ t < 15s}
Sequence Diagram: High Integrity Level Control
Figure 5: High Integrity Level Commands
1. The maintenance operator on the track looks for the identification num-
ber of the switch to lock and asks for protection from the ATS operator;
21

2. The ATS operator sends a preparatory request to the protection sys-
tem;
3. The protection system (control / monitoring of the interlocking func-
tion) sends an acknowledgement of this preparatory request to ATS;
4. After making sure that the received acknowledgement corresponds to
the request, the ATS operator validates the request by sending a con-
firmation request;
5. The protection system ensures the validity of the message by checking
the coherence between the CRCs of the two messages received from
ATS, performs the locking of the correct switch, and then sends an
acknowledgement to ATS indicating the status of the switch operation;
6. Finally, the ATS operator checks via a visual display that the switch is
locked, and confirms this fact to the maintenance operator in the field.
5.3. Safety Analysis
5.3.1. Classical safety analysis
The potential for accidents is linked to the delay introduced by the ATS
operator when seeking to detect uncompleted or erroneous HILCs. Safety
engineers build fault trees based on functional analysis for each potential ac-
cident, having previously identified potential hazards. This analytical tech-
nique is based on a linear accident model in a discrete state space of the
system. The fault tree analysis of a potential “failure of switch locking” ac-
cident is shown in Figure 6. Rectangles represent “function failure” events.
Logical gates indicate the conjunction or disjunction of lower level failures
resulting in a given upper level failure. Circles indicate that the event will not
be further decomposed and that a given occurrence rate can be attributed
22

Potential accident: "workers not protected
by locked switch"
Switch not locked
Wrong switch locked
Unnoticed undone HILC
Procedure not observed by ATS
operator
Procedure not observed by
operator on track
Switch movementprobability
Unnoticedwrong HILC
Wrong identification of switch on ATS
Switch movementprobability
FH
FH
FH
FH
FH
Figure 6: Fault Tree for “Potential accident by failure of switch locking”
to it. Inverted triangles, on the other hand, mean that the event is decom-
posed into other elementary events shown in another fault tree. For a better
readability, the label “FH” identifies events that are due to human factors.
Probability values for pieces of technical hardware are determined based
on studies of the behavior of specific components, on experience feedback or
using data from suppliers. Probabilities of failure of actions by operators are
generally taken from the human reliability literature, for example, work by
Swain [39] and Rasmussen [40]. The likelihood that an operator does not
respect a procedure will depend on contextual factors including experience
and training, and these are taken into account. Typically, for an adequately
trained operator performing a habitual activity, a failure probability of 10−3
23

will be used.
The result of this method applied to the case of an HILC switch locking
a maintenance zone shows that a potential for accident could arise from the
joint failure of at least three operations, with a failure probability of less than
10−3 for each operation.
Workingplan
Workingplan
HMI ATS
HMI ATS
HMI ATS
Signs on tracksCommunication
Workingplan
H
To workon tracks o
rp
i
t c
F10
F9
T
To blockswitch o
rp
i
t c
F7
F8
F6
F5
F4
H - T
To identify,to memoriseSwitch ID.
o
rp
i
t c
F2
F3
F1
msg. confirmation
ti
to
15s - (ti-to)
H - T
To Authorisework on track
o
rp
i
t c
To commandswitch blocking o
rp
i
t c
To confirmHILC
o
rp
i
t c
To validatethe
preparationo
rp
i
t c
To prepareHILC o
rp
i
t c
To requestfor
protectiono
rp
i
t c
T
T
H - T
H - T
T
To Acknowledgeswitch blocked o
rp
i
t c
H - T
CRCcontrol
Switch's stateupdated on HMI
Switchblocked
msg.cmd
msg.preparation
Workauthorisation
Switchblocked
msg.acknowledgepreparation
Switch ATS'S ID.position on HMI
Switch ATS'sID.
Switch ATS's ID.positionon MMI
Switch field's ID.
Blockrequest for
Switch field's ID.
X
X
X
>>
>>>>
X
>>
Wrong HMI position⇒
Switch field's ID.
≠Switch ATS's ID.
Figure 7: Degraded FRAM network
5.3.2. Complementary approach using FRAM
The FRAM network of an HILC switch locking a maintenance zone is
shown in Figure 4. The maintenance operator, requesting protection for a
particular working section, initiates the procedure. Two pieces of data are
used by this procedure: the locking request and the identification number of
the concerned switch. These two data are sent to the ATS operator. In the
figure, this is expressed by two functional relations between the maintenance
operator’s activity and the ATS operator’s activity, first in identifying the
24

correct switch via the ATS interface, and secondly in preparing the HILC
protection.
The procedure mainly requests actions by human operators. It is therefore
possible to visualize many scenarios, simply by modifying the variability of
performance of the operational units performed by the ATS operator.
As an example, Figure 7 shows a scenario in which the ATS operator’s
performance condition, in relation to the available time, is unsuitable or un-
predictable. In the diagram this time pressure is represented by the symbol (
» ) next to the time attribute of actions performed by this operator (the nota-
tion used in the example described in [16]). This pressure can be explained by
the urgency of the situation or by an excessive number of objectives that the
operator is attempting to meet. Thus, the operator does not correctly iden-
tify the switch to lock, the time pressure being too great to correctly execute
control operations requested for identification via the ATS human-machine
interface. This is represented by the cross next to the connectors of the func-
tion, which is dependent on the switch identification activity. The negative
impact associated with the time pressure restricts the precondition for the
operator’s next activity, which means that the two acknowledgements sent
by the control-command protection system are not checked, and the switch
locking is not confirmed to the maintenance operator. The outcome is that
an HILC for locking a switch has been executed, but for the wrong switch,
and so the maintenance operators are not protected.
FRAM enables fault tree events to be analyzed very thoroughly. The
example just described allowed a deeper analysis of the human causes of the
“wrong switch locked” event than is possible in classical fault tree analysis
25

(see Figure 6). The main contribution of FRAM is that it highlights complex
interactions that arise in the socio-technical system and which provide the
biggest clues in identifying the pertinence of the scenarios.
5.4. Interdisciplinary Study
Other scenarios can be described using a similar model. This kind of
model is currently used as a common support between safety specialists and
human and social scientists specializing in cognitive ergonomics. To calibrate
the model (i.e. identify the potential variability of each functional unit) it is
possible to use feedback data from actual experience, as well as the results
of experiments performed in the laboratory.
This approach will be illustrated by a second case study concerning rail-
way traffic supervision of an OCC’s ATS functions. The aim of this activity
is to monitor traffic using information provided by the ATS human-machine
interface, to detect any incidents (especially those with an impact on safety),
to diagnose them and to perform appropriate recovery actions. The FRAM
network proposed for this activity is shown in Figure 8. The different op-
erational units are the monitoring strategy of the Schematic Control Panel
(SCP) which provides the global overview of the traffic, traffic monitoring,
incident detection, incident diagnosis, selecting a recovery action, and finally
the action itself. The FRAM network highlights the links between these
functional units which can generate the Functional Resonances. Figure 8
shows the normal situation where basic input-output dependencies between
functional units are obvious. Notice the time dependency of the detection
activity on the monitoring strategy. This link indicates that the time needed
to detect an incident depends on the strategy chosen for monitoring. To
26

calibrate this model, an experimental ATS platform called Spica-rail was
installed in the Heudiasyc Laboratory at Compiègne University of Technol-
ogy [41]. This platform is used as a support for studying the behavior of
ATS operators. Using simulated railway traffic, the platform can reproduce
the main aspects of OCC activities. On the one hand the FRAM analy-
sis lets researchers consider various hypotheses regarding operators’ perfor-
mance conditions and how these might impact safety, and on the other hand
it can synthesize results into scenarios for use in classical safety analysis.
These scenarios may then be validated by experiments performed using the
Spica-rail platform. A first series of experiments was conducted, aiming
to validate an experimental protocol and to calibrate the FRAM analysis.
MonitoringStrategy of
the Schematic
Control Panel
o
rp
i
t c
H
HMI
TrafficMonitoring
o
rp
i
t c
H
IncidentDetection
o
rp
i
t c
H, T
IncidentDiagnostic
o
rp
i
t c
H
Choice of a
recoveryaction
o
rp
i
t c
H
Actiono
rp
i
t c
H, T, O
Incidentdetected
Figure 8: FRAM network of incident detection and recovery
27
5.5. Experiments
5.5.1. spica-rail platform
Spica-rail is based on a real Automatic Train Supervision (ats) prod-
uct developed by Alstom Transport. The ATS system is connected to the
interlocking system and the Automatic Train Control (ATC) system (that
includes Automatic Train Operation and Automatic Train Protection; see
[42] for detailed descriptions of these systems). The ATS performs a broad
range of traffic supervisory functions, from staff and rolling stock manage-
ment to the monitoring and control of signaling and route setting. Signaling
and route setting, intensively automated over the last decade, remain safety
critical operations when degraded circumstances occur [43]. Interlocking and
ATC are simulated in spica-rail by the traffic simulator system developed
by Alstom Transport for validating and testing ATS projects. The traffic
simulator simulates railway traffic operations through the use of a scripting
language.
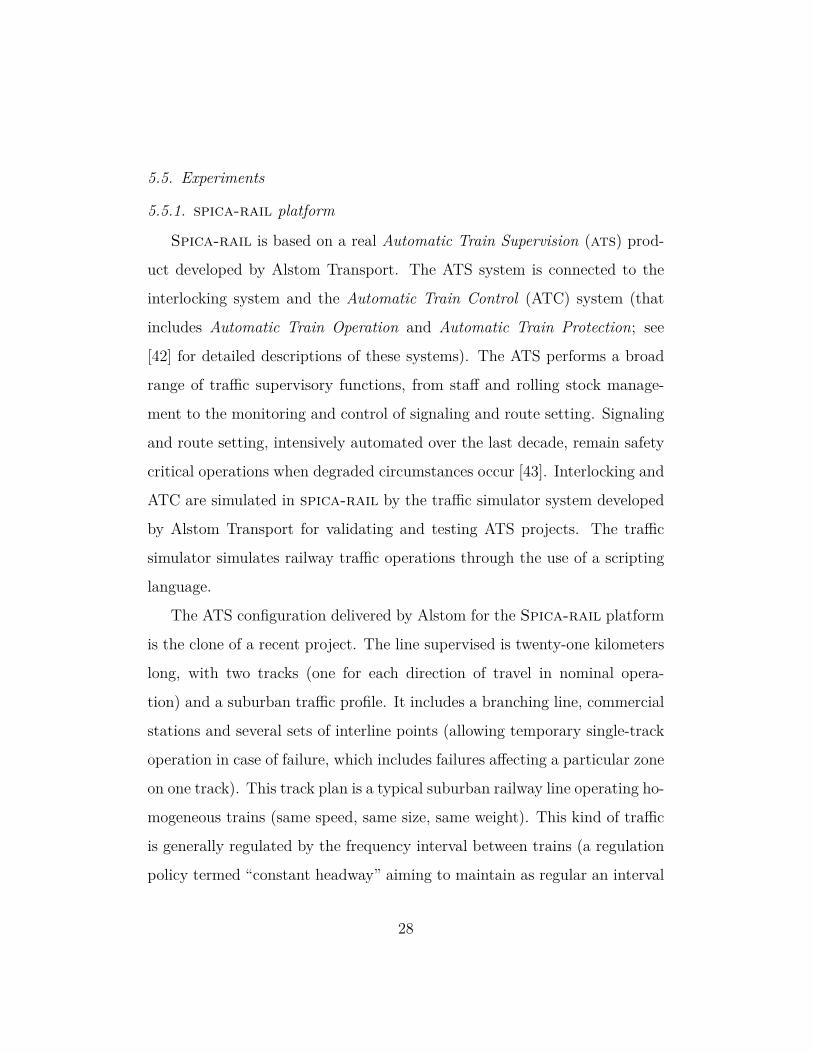
The ATS configuration delivered by Alstom for the Spica-rail platform
is the clone of a recent project. The line supervised is twenty-one kilometers
long, with two tracks (one for each direction of travel in nominal opera-
tion) and a suburban traffic profile. It includes a branching line, commercial
stations and several sets of interline points (allowing temporary single-track
operation in case of failure, which includes failures affecting a particular zone
on one track). This track plan is a typical suburban railway line operating ho-
mogeneous trains (same speed, same size, same weight). This kind of traffic
is generally regulated by the frequency interval between trains (a regulation
policy termed “constant headway” aiming to maintain as regular an interval
28

The ATS delivered by ALSTOM is the clone of a recent project. The line super-vised is twenty one kilometres long, two side lines and suburban traffic type. Itincludes a bifurcation, commercial stations and several interline switch points.This track plan is a typical suburban railway line operating homogeneous trains(same speed, same size, same weight). This kind of traffic is generally regulatedby the frequency interval between trains (named "constant headway"). In order togeneralise our experiments to main railway lines, we introduced a new equipmentallowing to regulate the traffic in time and in space, indeed several kinds of trains(different speed, size and weight) could be regulated. This equipment includes twosupplementary tracks that allow low speed trains to be overtaken by fast trains. Wedeveloped in collaboration with ALSTOM the necessary engineering tasks in theATS and the traffic simulator to obtain this equipment. The simplified view of thetrack plan is presented in figure 1.
Station
Bifurcation
tracks
Depot
Track 1
Track 2
~ 21 KM
StationStation Station Station
Figure 1: SPICA-RAIL track plan
The Man Machine Interface is composed of two elements. There is a generalmimics display called Schematic Control Display SCP that can be seen from everyoperator in OCC. The second element corresponds to the operator’s computer thatpresents several views of the railway track plan. Figure 2 shows the SPICA-RAILplatform and the general MMI of the track plan.
3.2 Experimental protocol
Three voluntary novices assimilated to ATS operator in formation participated tothe experiments. Each of them was formed and trained to the detection of threetypes of incidents :
Figure 9: spica-rail track plan
as possible between successive trains). In order to generalize our experiments
to main railway lines (operated with different types of trains with different
speeds, sizes and weights, making it essential for trains to be able to overtake
one another), the initial Spica-rail network configuration was modified by
the addition of passing tracks at a particular station. The regulation policy
of this second kind of network is termed “time schedule” (aiming to maintain
the schedule of each train as closely as possible). A simplified view of the
modified track plan is provided in Figure 9.
The human-machine interface is composed of two elements. The first is
a general MIMIC display known as the Schematic Control Panel (SCP) that
can be seen by every operator in the OCC. The second element corresponds to
operator workstations (“supervision computers”) which give different views
of the railway track plan. Figure 10 shows the spica-rail platform and the
general HMI of the track overview. Figure 11 shows the specific signaling
elements of the SCP.
29

!"
Figure 5#" $%&'(%'&)" *)" +," +-./)" %)++)" 0'1)++)" )2%" &)3&42)/%4)" *,/2"
+1-/%)&5,()"*167896$:#";)2"5+<(=)2"*)"(>'+)'&">/%"4%4"&,?>'%4)2"-(-"3>'&" -/*-0')&" +)"2)/2"*)"(-&('+,%->/"*)2" %&,-/2#";)2"3,&%-)2".&-24)2"(>&&)23>/*)/%" ,'@" 3,&%-)2" *)" +," +-./)" 0'-" /1>/%" 3,2" 4%4"-A3+4A)/%4)2"2'&"+,"3+,%)5>&A)#"
"
Figure 6#"B')"*)" +1-/%)&5,()"*167896$:",C)(" &)3&42)/%,%->/" D3>'&"+)2" E)2>-/2" *)" +1)@3+-(,%->/F" *)2" G>/)2" />/" '%-+-24)2" 3)/*,/%"+1)@34&-)/()" DG>/)2" =,(='&4)2F#" ;)2" G>/)2" =,(='&4)2" &>'.)2"(>&&)23>/*)/%" ,'@" G>/)2" />/" -A3+4A)/%4)2" 2'&" +," 3+,%)5>&A)"H" +,"G>/)"=,(='&4)"E+)')"(>&&)23>/*"I"+,"5)/J%&)"*1,+,&A)2#"
SCP Traffic simulators Supervision computers non operational zone during experiment
HMI
Figure 2: SPICA-RAIL platform
• Switch point uncontrolled. This problem comes from the position sensor thatcannot indicate the real position of the point. Thus, the signal protecting thispoint goes to absolute stop. This incident is not safety critical but, impliesserious disturbances on the traffic and stresses the activity ;
• Signal failed to open. This incident is not safety critical but, as the precedentstresses seriously the traffic ;
• Signal failed to close. This incident is safety critical, it has the same con-sequences that a signal passed at danger. It is thus of prime importance todetect this default in order to insure safety.
Four variables have been introduced in the protocol, in order to evaluate themonitoring performance in different traffic supervision configurations.
The type of incident is the first variable, because there are more indices on theMMI for an uncontrolled switch point, we assume that the time detection would belower for this type of incident than the case of signal failure.
The time of the incident occurrence is the second variable. In order to simplifythe sessions, each scenarios was 30 minutes long. We assume that the detectionwould be faster at the beginning of the session.
The third variable concerns the presence of a train around the incident. Weassume that human operator focus his attention periodically on dynamic elementsof the MMI. Consequently, the detection should be lower when trains circulate nearthe incident.
Routes are pieces of track where trains are authorised to circulate. There is twoway to trace a route from ATS. The permanent way traces the route only once, andtrains do not clear the route after crossing. The automatic destruction way trace the
Figure 10: spica-rail platform
5.5.2. Experimental protocol
The protocol was defined in order to evaluate the performance of the
graphical view that exists to provide useful information to the human opera-
tors. During evaluation the integrated alarm system was disconnected from
the ATS.
Three experimental subjects (post-doctoral students in computer science
assuming the role of ATS operators undergoing training) participated in the
experiments. For practical reasons, it was not possible to perform experi-
ments with more subjects because of the considerable amount of data and
videos to process. This will be done in subsequent work. However, signifi-
cant results were obtained. Prior to the experiment, each of them was trained
to supervise nominal situations and to detect three representative types of
incidents:
• Uncontrolled points. This problem can arise from a failure of the po-
sition sensor that renders it unable to indicate the current position of
the points. The signal protecting the points therefore remains blocked
30

Before incident
(nominal situation)
During incident
(switch point uncontrolled)
Signal is green (open) Signal is red (closed)
Figure 11: spica-rail signaling elements
at absolute stop. This incident is not safety critical, but entails serious
disturbances to the traffic, and throttles activity as a result of degraded
operating modes such as temporary single track. Figure 11 illustrates
scenarios where an “uncontrolled points” incident occurs on the HMI;
• Signal failed to open. This might be a consequence of the previous
type of incident, but it can also arise out of failures of the signal itself
or of devices controlling it (in the latter case there are fewer visible
symptoms to help diagnose the initial cause of the incident). This
incident is not safety critical, but like the previous type of incident it
can seriously impact network traffic;
• Signal failed to close. This is of course a safety-critical incident, whose
consequences, including collisions and derailments, are potentially catas-
trophic. A possible cause would be a failure in the control-command
devices which, although highly improbable (because of a “fail safe” de-
sign), is nevertheless imaginable. Given the ease with which this very
31

exceptional situation can be simulated using the experimental platform,
it was judged interesting to include it in the experimental protocol (an
adapted reaction on the part of operators having the potential to reduce
dramatically the severity of consequences).
Four independent variables (i.e., under the experimenter’s control) were
included in the protocol in order to evaluate the monitoring efficiency of
the experimental subjects in different traffic supervision configurations. The
dependent variable (i.e. the variable providing an assessment of subjects’
performance) was the incident detection time (in seconds). Using the FRAM
analysis, hypotheses were formulated regarding the influence of each of these
parameters, and the experimental sessions aimed to validate (or invalidate)
these hypotheses.
• The first variable was the type of incident (uncontrolled points vs. sig-
nal failure). Because uncontrolled points generate more indices on the
HMI, the hypothesis for this variable was that detection time would be
lower for this type of incident than for the two cases of signal failure.
It was also expected that a signal failing to close would be more effi-
ciently detected than a signal failing to open, because of the seriousness
of potential consequences in the former case;
• The second variable was the time at which the incident occurred in
relation to the duration of the supervision session (i.e. early or late in
the session). For the purposes of simplification each scenario was 30
minutes long. The hypothesis regarding this variable was that detection
would be faster at the beginning of the session, because of the monotony
32

associated with a long period of nominal operation;
• The third variable, dependency, corresponded to the presence or ab-
sence of a causal relation between the incident and subsequent train
behavior (no dependency meaning that the incident had no impact on
trains, and dependency that the incident caused a train to stop). For
this variable, the hypothesis was that human operators would period-
ically focus their attention on dynamic elements of the HMI. Conse-
quently, detection should be easier when trains were circulating in the
vicinity of the incident;
• The fourth variable was the type of setting for the route affected by
the incident (permanent vs. non permanent). Routes are track sections
(generally between two sets of points) where trains are authorized to
circulate. There are two ways of setting a route in ATS: a permanent
route is set once and not cleared by a train running along this route
(so remaining set for the next train) whereas an automatic destruction
route is specifically set for one train and cleared after the train has run
along the route. Routes running through stations are generally set in
permanent mode, while the automatic destruction setting is used for
routes going to “passing tracks” (places where another train may over-
take). Because there are more graphical indices in cases of equipment
failure on permanent routes, the hypothesis for this variable was that
detection times should be shorter for permanent routes.
Among the twenty-four possible types of scenario (corresponding to the
number of combinations of values for the four variables) twenty could be
33

implemented on the platform. For each one, a specific scenario was created.
Ten “distraction” scenarios were also introduced in order to prevent subjects
making inferences about sequences of different types of incidents.
The complete session of 30 scenarios was performed for each of the three
experimental subjects, who were asked to indicate and explain orally each
failure as soon as they detected it. In addition to the detection time and
number of correct/incorrect detections (i.e., dependent variables), subjects’
actions and verbalizations were video-recorded.
5.6. Results
Ten hours of recorded video per subject were collected. The great ma-
jority of equipment failures were detected. The rates of non-detection and
false detection were about 1/30 for each subject. Given that the subjects
had only just been initiated into railway supervision, these results show that
the training received was effective.
Because of high inter- and intra-subject variability and the presence of
extreme values, means and variances could not be used. A statistical analysis
was therefore performed using medians and ranges. The median detection
time (TD) was 11, 94s with a range of 299s. Analysis of detection times
based on test scenarios reveal a high variability between subjects. Medians
and ranges for the three subjects are presented in Table 2.
It might first be remarked that detection times are relatively high, con-
sidering the favorable experimental environment compared to the real envi-
ronment:
• Subjects know that there is one failure to be detected in each scenario
(this is not the case in real situations);
34

Subject TD median (sec.) Range
1 5,48 299
2 22,42 160,9
3 11,57 298,96
Table 2: Detection times: Medians and ranges
• There are only three possible types of failure. In real situations there
will be a greater variety of possible events;
• The duration of scenarios was very short (30 mn) compared to the
6-hour shifts undertaken by real OCC operators;
• Failure detection was the only task to be performed, whereas in ATS
several activities may be performed in parallel (for example, the manual
setting of some routes);
• The track plan was reduced to a short zone with a single branching.
Secondly, it will be observed that subject number two appears noticeably
less efficient (in terms of the detection time for incidents) than the two other
subjects. 60% of subject number two’s detection times exceed 20 s. The rate
is only 20% for subjects one and three. This results suggests that detection
time is highly dependent on the strategy used by operators to explore the
hmi and that this strategy is not the same from one individual to another.
Moreover, the failure information given by hmi are not sufficiently striking
to be perceived in the same manner by all subjects. In order to confirm the
significance of this difference, statistical tests were performed on the rough
results.
35

The data collected does not satisfy normality and homogeneity conditions,
and consequently the statistical significance of every comparison between
modalities of subjects and variables was evaluated using non-parametric test-
independent observations. The significance threshold was fixed at α = 0, 05
for each comparison.
The Mann-Witney test for independent groups was used to compare sub-
jects. This statistic takes account of the total number of observations made
by the first subject that are greater than observations made by the second.
Table 3 shows the p-values, that represent the probabilities of false rejections
on the null hypothesis that the two samples are identical.
Subjects p H0: T 1D = T 2
D
Subject 1 - Subject 2 0,00041 Significant
Subject 1 - Subject 3 0,21 Non significant
Subject 2 - Subject 3 0,03 Significant
Table 3: Comparison between subjects: Mann-Witney, α = 0.05
This result confirms that detection times for subject number 2 are indeed
significantly different from the two others.
In order to evaluate the impact of the traffic configuration variables on
the detection times, the Wilcoxon signed-rank test for paired comparisons
was used. This test is usually used for two related samples or repeated
measurements on a single sample. It involves comparisons of differences
between measurements.
Unexpectedly, only one comparison reached significance. Sample size
seems to be responsible for this lack of significance. Nevertheless, a non-
parametric paired rank test such as the Wilcoxon test may be applied to
36

these data. In every case the number of pairs is greater than 8. This kind of
test could, moreover, give results for fewer pairs [44].
However, the effect of the dependency variable denoting the presence of
trains in the vicinity of the incident produced a significant result. It was
assumed that the detection time would be lower when a train was nearby.
In fact, the Wilcoxon statistic reveals the opposite effect, and with signifi-
cance. This result is quite surprising. It seems reasonable to suppose that
the strategy used by the human operator would be to follow periodically the
movements of trains. Complementary investigations should be performed to
shed further light on this effect.
5.7. Analysis
The performance conditions investigated in this first series of experiments
concerned time pressure. The time taken by operators to detect abnormal
events was measured. The first results suggest that in a simplified simulation
environment where the detection of abnormal situations arguably presents
fewer challenges than in the real world, some subjects nevertheless fail to
detect these abnormal situations at all quickly. Placed in the framework of
FRAM, these first elements enable an order of magnitude to be assigned to
operators’ performance in a particular context.
Experimental results also confirm differences between strategies employed
by human operators, using the human-machine interface under investigation,
to detect equipment failures impacting traffic safety. Clearly, not all oper-
ators use the same strategy, which creates a wide spread of varying perfor-
mances. The reasons for these differences need to be explored through a
more detailed analysis of operators’ behavior.
37

However, merely knowing that there is a dispersion of monitoring strate-
gies which impacts incident detection enables us to identify a potential sce-
nario of inadequate decision as a consequence of a “functional resonance”
phenomenon. Figure 12 illustrates such a scenario, and show how high vari-
ability propagates within the FRAM network modeling operator’s activity.
An inadequate monitoring strategy leads to late incident detection, which
in turn leads to time pressure on the diagnostic operational unit. In nomi-
nal situations this operational unit makes adequate decisions (no problems
of diagnosis came to light during our experimental sessions) but in other
situations time pressure could lead to incorrect choices of recovery actions,
especially where a situation is safety-critical and where there is little time
available to avert an impending accident. An inappropriate recovery action
means that the ATS operator might not succeed in reducing the gravity of
an accident.
MonitoringStrategy of
the Schematic
Control Panel
o
rp
i
t c
H
HMI
TrafficMonitoring
o
rp
i
t c
H
IncidentDetection
o
rp
i
t c
H, T
IncidentDiagnostic
o
rp
i
t c
H
Choice of a
recoveryaction
o
rp
i
t c
H
Actiono
rp
i
t c
H, T, O
Signalfailed to
close
Greathurry
Greathurry
inadequatestrategy
Incidentdetected
RecoveryincompatibleTime detection
too high>>
X
>>
>>
No recovery
X
X
Figure 12: FRAM scenario model of incident detection and recovery
38

Other experimental series will therefore be performed using the Spica-
rail platform and the standard model presented in this paper, using also
oculometers to record operators’ eye movements. Results obtained should
help to clarify the reasons for the dispersion of performances, and possibly
to identify new accidental scenarios.
5.8. Proposals for ergonomic enhancements
The experimental results presented above highlight the importance of
ATS interfaces in the efficient detection of incidents and, like certain previous
studies [45, 46, 47], suggest that ATS interfaces could be better adapted to
operator’s needs than they currently are.
Armed with the results of the present study and with research findings
in the literature, a specific working group was therefore constituted by Al-
stom to draw whatever conclusions may be drawn and to rough out some
proposals for ergonomic requirements for ATS HMI that might enhance the
performance of the joint ATS-operator system [34].
These proposals are listed below:
• To reduce the number of graphical elements to what is really needed
by the operators:
– For any safety-related operational situation, the HMI should dis-
play “just enough” (i.e. necessary and sufficient [48]) information
to enable a safe situation to be maintained or recovered. Too
much information makes the important information less salient
and increases the operator’s cognitive load [46];
39

– For other operations, the HMI should show only information re-
quired to anticipate future events:
∗ In nominal situations (automatic mode), the ATS HMI should
allow the operator to anticipate degraded modes (in realistic
situations operators prefer to adopt an anticipative than a
reactive mode [46]);
∗ In degraded situations (manual mode: operations are per-
formed by the operator):
· The ATS HMI should allow the operator to predict what
might happen if no action is performed;
· The ATS HMI should allow the operator to anticipate the
result of any action (for example, the result of a "cancel
route” action will stop a specific train at a signal within
x seconds and begin to disrupt regular traffic within y
seconds);
• Analogue representations should be preferred to digital displays: digital
information need to be computed/interpreted by the ATS operator,
whereas analogue information provides a more intuitive representation.
Moreover, analogue representations enable the use of various perceived
affordances [49];
• The HMI dynamics should be adapted in real time to mental activity
required by the operators (the decision process is continuous and needs
to be linked to the dynamic situation [48]);
• The response time of the supervised equipment in the field should be
40

real-time constrained and certified (response time is a crucial parameter
in dynamic situation supervision [50, 51]);
• Operators should at all times know which control systems are partic-
ipating their Safety Integrity Level. In particular, operators shall not
have over-confidence in system safety;
• In case of simultaneous incidents, the HMI should focus the attention
of the operators on the most severe safety-critical event, such as “signal
failed to close” or “signal passed at danger”. The operators’ attention
should be drawn to the specific part of the interface where the event
has occurred through the aid of a specific visual alarm, instead of via
a textual alarm on the general interface without a precise location.
These proposals need to be tested in experimental, simulated or realistic
situations before being adopted as guidelines for future ATS systems.
6. Conclusion
The interest of a systemic approach is to offer a complementary exchange
support between risk management and human and organizational factors. In-
deed, analysis of accidents involving human and organizational factors clearly
demonstrate that methods using a sequential accident model are not suffi-
cient. In this perspective, the FRAM method enables experimental results
from cognitive psychology and from classical safety analysis to be integrated
using the same formalism. Used as a complement to classical safety anal-
ysis, the FRAM method explores the impact of human and organizational
factors more thoroughly than a simple allocation of error probabilities is able
41

to achieve. Moreover, a dynamic representation of the system using quali-
tative attributes can identify new scenarios for incidents or accidents, and
these can be analyzed via new hypotheses that can be tested in the field
or in a simulated environment. Whereas classical safety analysis methods
show elements that are going wrong, FRAM also allow the execution of func-
tions or activities that are performing correctly [16]. To this extent, classical
methods and FRAM analysis are complementary, and their combined use in
a systemic approach is a step towards a better understanding the activity
of real operators, taking into account psychological and ergonomic factors.
In this perspective, a fruitful improvement of FRAM method would be to
include quantitative aspects allowing the relative likelihood of the different
scenarios to be estimated using belief functions. This is the subject of subse-
quent work aiming at assigning likelihoods to each functional unit input and
propagating them in the FRAM network.
The systemic approach used in this present study has already provided
fruitful results in aeronautic and industrial supervision situations, and more
recently in railway traffic control [46]. The results presented in the present
paper confirm the pertinence of this approach for a better understanding
of the determining parameters for a complex socio-technical system such a
railway Operating and Control Centre. They show that even when given
identical training, different operators do not use the same monitoring strat-
egy, and the consequence is a very high variability in the time taken to detect
incidents (variability in strategies used by operators to control railway traffic
has already been observed in naturalistic and simulation-based studies; see
for instance [52] and [47]). These strategies should be described in more
42

details, and this is the subject of a study in progress, but for the moment
the key point is to improve the ergonomics of the ATS interface in order
to reduce this variability. Some proposals by a specific working group have
been presented in this paper, and their efficiency will be tested in future ex-
perimental sessions. The determining factor is to provide the operator with
“just enough” information for a clear understanding the present situation
and for anticipating the immediate future. This goes through an adapted
“pre-diagnostic” performed by automatic systems, the final diagnostic al-
ways remaining, at least in degraded situations, a human prerogative. In a
broader perspective, it will be necessary in the future to define and design
the right level of cooperation between more and more automated machines
and human operators [53, 54].
References
[1] R. E. Barlow, F. Proschan, Mathematical theory of reliability, Wiley,
New York, 1965.
[2] A. Villemeur, Reliability, availability, maintainability, and safety assess-
ment, J. Wiley, Chichester, 1992.
[3] IEC, 61508:1998 and 2000, part 1 to 7. Functional Safety of Electrical,
Electronic and Programmable Electronic Systems., 2000.
[4] CENELEC, EN-50126: Application ferroviaires - Spécification et dé-
monstration de Fiabilité, Disponibilité, Maintenabilité et Sécurité
(FMDS), Norme, CENELEC, 1999.
43

[5] CENELEC, EN-50128: Applications ferroviaires - Système de signalisa-
tion, de télécommunication et de traitement - Logiciels pour systèmes
de commande et de protection ferroviaire, Norme, CENELEC, 2001.
[6] CENELEC, EN-50129: Application ferroviaires - Système de signalisa-
tion, de télécommunication et de traitement - Systèmes électroniques
relatifs à la sécurité pour la signalisation, Norme, CENELEC, 2001.
[7] N. Wiener, Cybernetics, Second Edition: or the Control and Communi-
cation in the Animal and the Machine, The MIT Press, 1965.
[8] E. M. Dougherty, Human reliability analysis - where shouldst thou
turn?, Reliability Engineering & System Safety 29 (1990) 283–299.
[9] E. Hollnagel, Cognitive reliability and error analysis method, Elsevier
Science Ltd, Oxford, 1998.
[10] E. M. Dougherty, Is human failure a stochastic process?, Reliability
Engineering & System Safety 55 (1997) 209–215.
[11] P. Le Bot, Human reliability data, human error and accident models–
illustration through the three mile island accident analysis, Reliability
Engineering & System Safety 83 (2004) 153–167.
[12] A. Isaac, S. T. Shorrock, B. Kirwan, Human error in european air traffic
management: the hera project, Reliability Engineering & System Safety
75 (2002) 257–272.
[13] C. Bieder, Les facteurs humains dans la gestion des risques, évolution
de la pensée et des outils, Hermès, Paris, 2006.
44

[14] I. S. Kim, Human reliability analysis in the man-machine interface
design review, Annals of Nuclear Energy 28 (2001) 1069–1081.
[15] J.-M. Hoc, Human and automation: A matter of cooperation, in:
HUMAN’07, Timimoun, Algeria.
[16] E. Hollnagel, Barrier analysis and accident prevention, Aldershot, UK:
Ashgate, 2004.
[17] F. Belmonte, Impact des postes centraux de supervision de trafic fer-
roviaire sur la sécurité, Ph.D. thesis, Université de Technologie de Com-
piègne, 2008.
[18] N. Limnios, Arbres de défaillances, deuxième édition revue et augmen-
tée, Hermès Science, Lavoisier, 2005.
[19] N. Leveson, A new accident model for engineering safer systems, Safety
Science 42 (2004) pp. 237–270.
[20] K. Vicente, Cognitive engineering research at riso from 1962-1979, in:
E. Salas (Ed.), Advances in Human Performance and Cognitive Engi-
neering Research, volume 1, Elsevier, New York, 2001, pp. 1–57.
[21] E. Hollnagel, D. Woods, Cognitive systems engineering: New wine in
new bottles, International Journal of Man-Machine Studies 18 (1983)
583–591.
[22] D. A. Norman, Cognitive engineering, in: D. A. Norman, S. W.Draper
(Eds.), User centered design: New perspectives on Human-Computer
45

Interaction, Lawrence Erlbaum Associates, Hillsdale, NJ, USA, 1986,
pp. 31–61.
[23] D. D. Woods, E. M. Roth, Cognitive engineering: Human problem
solving with tools, Human Factors 30 (1988) 415–430.
[24] M. R. Endsley, R. Hoffman, D. Kaber, E. Roth, Cognitive engineer-
ing and decision making: An overview and future course, Journal of
Cognitive Engineering and Decision Making 1 (2007) 1–21.
[25] L. G. Militello, C. O. Domingez, G. Lintern, G. Klein, The role of
cognitive systems engineering in the systems engineering design process,
Systems Engineering (2009) 1–12.
[26] J.-M. Hoc, F. Darses, Introduction, in: J.-M. Hoc, F. Darses (Eds.),
Psychologie ergonomique : tendances actuelles, Presses Universitaires
de France, Paris, 2004, pp. 1–13.
[27] M. D. Byrne, Cognitive architecture, in: A. Sears, J. Jacko (Eds.), The
human computer interaction handbook: Fundamentals evolving tech-
nologies and emerging applications (2nd ed), CRC Press, Boca Raton,
FL, USA, 2008, pp. 93–113.
[28] R. W. Proctor, K.-P. L. Vu, Human information processing: An
overview for human-computer interaction, in: A. Sears, J. Jacko (Eds.),
The human computer interaction handbook: Fundamentals evolving
technologies and emerging applications (2nd ed), CRC Press, Boca Ra-
ton, FL, USA, 2008, pp. 43–60.
46
[29] E. Hollnagel, D. Woods, N. Leveson, Resilience Engineering: Concepts
and precepts, Ashgate, Aldershot, 2006.
[30] J. Reason, Human Error, Cambridge University Press, 1990.
[31] D. D. Woods, On taking human performance seriously in risk analysis:
Comments on dougherty, Reliability Engineering & System Safety 29
(1990) 375–381.
[32] C. W. Johnson, Failure in safety-critical systems: A handbook of ac-
cident and incident reporting, University of Glasgow Press, Glasgow,
Scotland, 2003.
[33] D. D. Woods, E. M. Roth, K. B. Bennett, Explorations in joint human-
machine cognitive systems, in: S. P. Robertson, W. W. Zachary, J. B.
Black (Eds.), Cognition, computing, and cooperation, Ablex Publishing
Corp., Norwood, NJ, USA, 1990, pp. 123–158.
[34] D. Woods, E. Hollnagel, Joint Cognitive Systems, CRC Press, Inc., Boca
Raton, FL, USA, 2006.
[35] E. Hollnagel, Dependability of joint human-computer systems, in:
SAFECOMP ’02: Proceedings of the 21st International Conference
on Computer Safety, Reliability and Security, Springer-Verlag, London,
UK, 2002, pp. 4–9.
[36] E. Hollnagel, D. Woods, Joint Cognitive Systems: Foundations of Cog-
nitive Systems Engineering, CRC Press, 2005.
47
[37] B. Johansson, Joint control in dynamic situations, Ph.D. thesis,
Linköpings universitet, Institute of Technoloy, 2005.
[38] L. Bainbridge, Ironies of automation, Automatica vol. 19 (1983) 775–
779.
[39] A.-D. Swain, G. H-E., Handbook on Human Reliability Analysis
with Emphasis on Nuclear Power Plant Application, Technical Report
NUREG/CR-1278, USNRC, 1983.
[40] J. Rasmussen, Skills, rules, knowledge; signals, signs, and symbols, and
other distinctions in human performance models, IEEE Transactions on
Systems, Man and Cybernetics 13 (1983) 257–266.
[41] F. Belmonte, W. Schön, J. Boulanger, K. Berkani, Railway traffic su-
pervision research program : Spica rail platform, in: EURNEX-ZEL,
14th international symposium "Toward the competitive rail systems in
europe", Zilina, Rep. Slovaque (EU).
[42] F. Belmonte, K. Berkani, J. Boulanger, W. Schön, Safety enhancement
of railway traffic by modern supervision systems, in: WCRR (Ed.),
Seventh World Congress on Railway Research., Montreal (Canada).
[43] F. Belmonte, K. Berkani, J. Boulanger, W. Schön, Taking into account
human factors in railway supervision, in: I. S. S. A. (ISSA) (Ed.), Ninth
International Symposium of the ISSA Research Section: Design process
and human factors integration: optimising compagny performance, Nice
(France).
48

[44] S. Siegel, N. Castellan, Nonparametric statistics for the behavioral sci-
ences, McGraw-Hill, New York, 1988.
[45] S. Djibo, Analyse ergonomique et organisationnelle de la charge de tra-
vail des agents des postes de commandes centralisés (PCC) à la RATP,
Technical Report, Report French PREDIT II research program, 2004.
[46] A. Kauppi, A human-computer interaction approach to train traffic con-
trol, Dissertation for the degree of licenciate of technology in computer
science, Uppsala University, Sueden, 2006.
[47] C. Zanarelli, Caractérisation des stratégies instrumentales de gestion
d’environnements dynamiques : analyse de l’activité de régulation du
métro, Ph.D. thesis, Thèse de doctorat d’ergonomie non publiée. Paris :
Université Paris 8, 2003.
[48] R. Amalberti, La conduite des systèmes à risques, Presses Universitaires
de France, Paris, 2001.
[49] D. Norman, Affordances, conventions and design, Interaction VI.3
(1999) 38–42.
[50] J.-M. Hoc, Supervision et contrôle de processus : la cognition en situa-
tion dynamique, Presses Universitaires de Grenoble, Grenoble, 1996.
[51] J.-M. Hoc, R. Amalberti, J.-M. Cellier, V. Grosjean, Adaptation et ges-
tion des risques en situation dynamique, in: Psychologie ergonomique :
tendances actuelles, Presses Universitaires de France, Paris, 2004, pp.
15–48.
49

[52] T. M. J. Lenior, Analyses of cognitive processes in train traffic control,
Ergonomics 36 (1993) 1361 – 1368.
[53] D. Lenior, W. Janssen, M. Neerincx, K. Schreibers, Human-factors
engineering for smart transport: Decision support for car drivers and
train traffic controllers, Applied Ergonomics 37 (2006) 479 – 490.
[54] J. Wilson, B. J. Norris, Rail human factors: Past, present and future,
Applied Ergonomics 36 (2005) 649 – 660.
50