Embed Size (px)
Citation preview
Source of Acquisition NASA Ames Research Center
Interconnect Performance Evaluation of SGI Altix 3700 BX2, Cray X1, Cray Opteron Cluster, and Dell PowerEdge
Rod Fatoohi’, Subhash Saki2, and Robert Ciotti2
Computer Engineering Department San Jose State Univeristy One Washington Square
San Jose, California 95192 rfatoohi@ sjsu.edu
1
Abstract
We study the performance of inter-process communication on four high-speed multiprocessor systems using a set of communication benchmarks. The goal is to identifi certain limiting factors and bottlenecks with the interconnect of these systems as well. as to compare these interconnects. We measwed network bandwidth using different number of communicating pi-ocesson and Communication patterns - such as point- to-point commmicution, coDective communication, and dense communication patter-ns. The four plaforms are: a 5 12-processor SGI Altix 3 700 BX2 shar-ed-memoiy machine with 3.2 GB/s links; a 64-pr.ocessor (single- streaming) Cray XI shared-memory machine with 32 1.6 GB/s links; a 128-processor Cruy Opteron cluster using a Myrinet network; and a 1280-node Dell PowerEdge cluster with an InjkiBand network. Our, results show the impact of the network bandwidth and topology on the ovei8all perjormance of each interconnect.
1. Introduction
Message passing paradigm has become the de facto standard in programming the high-end parallel computers. The performance of the real world applications depend on the performance of the Message Passing Interface (MPI) functions implemented on these systems. Bandwidth and latency have been traditionally used as two metrics in the assessing the performance of the interconnect fabric of the system. These two metrics are not adequate to determine the performance of real world applications. Computer vendors highlight the performance of network by latency using zero byte message sizes and peak bandwidth for a very large message sizes ranging from 2 MB to 4 MB for a very smal1 system typically 32 to 64 processors. Real world applications tend to send messages ranging from 10 KB to 2 MB using not only point-to-point communication but using all possible
Advanced Supercomputing Division NASA Ames Research Center
Moffett Field, California 94035 SubhashSaini Onasa. gov,
ciotti @nas.nasa. gov
2
communications patterns including collective and reduction patterns.
In this paper, we focus on the communication network of four state-of-the-art high-speed multiprocessors with different network speeds and topologies. Two of these systems (SGI Altix BX2 and Cray XI) are shared memory machines while the other two (Cray Opteron and Dell PowerEdge) are distributed-memory machines - clusters of dual-processor computers. Two of these platforms use custom networks (SGI Altix 3700 and Cray XI) while the other two platforms employ commercial networks (Cray Opteron and Dell PowerEdge). We used three different benchmarks to get a better insight into the performance of four different networks. Our benchmarks measure the unidirectional and bidirectional bandwidth of communication links, collective communication and dense communication patterns.
Recently there have been several performance evaluation studies of Cray XI and SGI Altix 3700BX2 supercomputers mainly at NASA Ames Research Center and Oak Ridge National Laboratory ( O m ) where some of these machines are located. The focus of most of these studies have been on the overall performance of these systems including floating point operations, memory bandwidth, message passing and using several kernels as well as scientific applications. The results of two studies conducted at NASA Ames by Biswas, et al. [I], [2] indicate dose performance between the SGI Altix 3700 BX2 and the Cray X1 for several micro-benchmarks, kernels, and applications. Among several performance studies conducted at O W , Dunigan, et aI. [4] found that the Altix 3700 is competitive with the Cray XI on a number of kernels and applications. Another study at ORNL by Woriey, et al. [ I l l focuses on recent Cray products: XlKlE, XDI, and XT3 with an emphasis on the inter-process communication. Their study shows that the X1 communication bandwidth is significantly better than that of the other two systems while MPI latency is unimpressive on the X1 and very low on the XDI.
.
https://ntrs.nasa.gov/search.jsp?R=20060021476 2018-05-19T07:53:47+00:00Z
2. Interconnect Networks
The SGI Altix BX2 system [lo] is a 512-processor global shared memory architecture with one Tbytes of memory, a peak performance of 3.28 Tflops and running the L i n u operating system. It is one node of the 20 node super-cluster, called Columbia, located at NASA Ames with a total of 10,240 processors. The Altix 3700 BX2 is essentially a double-density version of the 3700 - doubling the number of processors, memory size, and link bandwidth. Each processor is an Intel Itanium-2 64-bit processor and runs at 1.6 GHz clock. The Altix 3700 system is built fi-om a number of component modules called bricks. The compute brick (called C-brick) on the Altix BX2 system contains 8 processors, 16 Gbytes of local memory, and 4 ASICs called Scalable Hub (SHUl3). Each SKLTB interfaces with the processors, memory, 'VO devices, other SHUBs, and an interconnection network called NUMAlink4. The NLTMAlink4 interconnect is a custom network with a fat-tree topology and a peak bandwidth of 6.4 Gbyteds. Within a C-brick, the SHuBs and each pair of processors are connected internally by a 6.4 Gbytesh bus. In addition to the C-bricks, the BX2 system has I/O modules (called IX-bricks) and router modules (called R-bricks). The R-bricks are used to build the interconnect fabric between the C-bricks. There are 48 R-bricks in the 512-processor BX2 system with two levels: 32 R-bricks in level 1, which are directly connected to the 64 C-bricks, and 16 R-bricks at level 2, which are connected to the R-bricks of level 1.
The Cray X1 at NASA Ames contains 64 single streaming processors (SSPs) configured into four separate nodes and 64 Gbytes of memory with a peak performance of 204.8 Gflops and running the UNICOS operating system. Each node has four multi-steaming processors (MSPs) sharing a fiat memory through 16 memory controllers, called MChips. Each MSP has four SSPs sharing a 2 Mbyte cache. The machine at NASA Ames is configured with one node used for system purposes while the remaining three nodes are available for computing. Each node has 32 network ports with each port supports 1.6 Gbytes fidl duplex links. A 4-node system can be connected directly through the MChips while larger systems use a 4-D hypercube or a modified 2-D torus. An XI appJication can run in either the SSP mode or the MSP mode, through a compiler directive. In the SSP mode, each SSP runs independently of the others executing its own stream of instructions while in the MSP mode, each MSP closely couples the interactions of its four SSPs and distributes the parallel parts of an application to its SSPs.
The Cray Opteron cluster at NASA Ames has 64 nodes with 130 Gbytes of memory, a peak performance
of 512 Gflops and running the Linux operating system. Each node has two AMD Opteron 246 series processors running at 2.0 GHz. The machine is configured with one node used as the server node and the remaining 63 nodes (126 processors) used as compute nodes. The nodes are interconnected via Myrinet network. Myrinet [3] uses cut- through routing and remote memory direct access to write tohead fi-om the remote memory of other host adapter cards, called Lanai cards. The Myrinet PCMD cards are running at 225 MHz with 2 MI3 memory plugged into the Newisys 133 MHZ PCI-X slot. The limit of the PCI-X bus is 1067 Mbyteds, and the NIC cards are capable of sustained PCI data rates.
The Dell PowerEdge 1850 cluster at the National Center for Supercomputer Applications (NCSA), called Tungsten 2, has 1280 nodes with 7.68 Tbytes of memory, a peak performance of 9.2 Tflops/s and running the Linux operating system. Each node has two Intel Xeon EM64T 3.6 GHz processors, 6 Gbytes of memory, and PCI-X IB card in a 133 M H z slot. The nodes are interconnected with a high-speed InfinBand fabric. InhiBand [SI is a bit-serial switched network with a raw data rate of 250 Mbytesh in each direction per serial link. The nodes in the cluster use four serial links run in parallel giving a peak data rate of 1 Gbytes/s in each direction. The InhiBand adapters are connected to the system through a PCI-Express X8 slot which has a theoretical bandwidth of 2 Gb$es/s. The InfiniBand fabric design is based on a two-tier network with edge switches connecting the hosts and core switches comprising the backbone of the fabric.
3. Results
3.1. Effective Bandwidth Benchmark
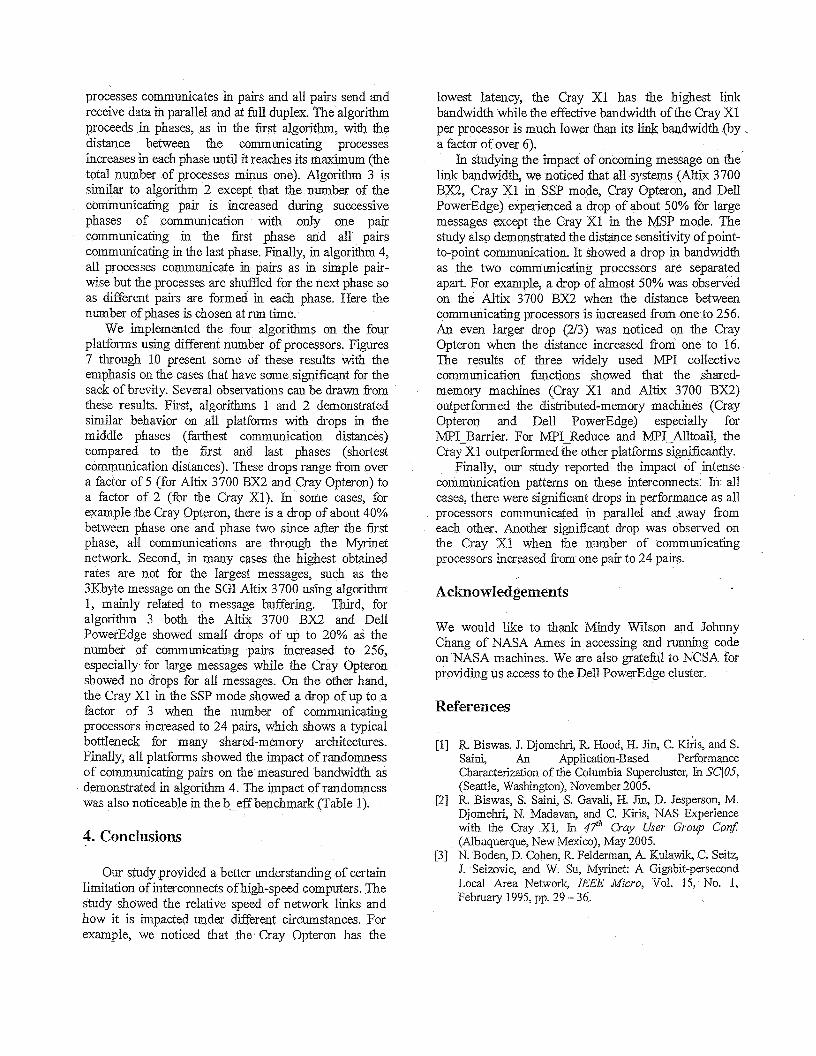
We used the effective bandwidth benchmark [9] to measure the accumulated bandwidth of our networks. The benchmark employs several message sizes, communication patterns and methods where the result is a single number, c d e d the effective bandwidth @-e@. It is defined as: a) a logarithmic average over several ring patterns (a total of 6) and random patterns, b) using the average of different message sizes (a total of 21 sizes ranging fi-om 1 byte to 1/128 of the memory of each processor), and c) the maximum over three communication methods (MF'I-Sendrecv; MPI-Alltoallv; and non-blocking with MPI-Irecv, MPI-Isend, and MPI-Waitall). A fundamental difference between this benchmark and the ping-pong benchmark is that here all processes are sending messages to neighbors in parallel.
Table 1 shows the b-eff benchmark results on the four platforms using different number of processors. In addition to reporting the measured b-eff using different patterns and message sizes (3rd column), the benchmark measures b-eff at the maximum message size L,, (1 Mbytes for all cases) using ring and random patterns (gfh column), b-eff at L,, using ring patterns only (7* column), the point-to-point bandwidth (ping-pong) measurement (9& column) and the latency measurement (IOth column). The b-eff per processor results ( 6 , 6th and Sth columns) extrapolate to the network performance if all processors are communicating to their neighbors.
One way to interpret the results of Table 1 is a comparison across platforms for a specific measurement (horizontally). The latency results (last column) show that the Cray Opteron has the lowest latency (of about 0.7 psec) while the Cray XI (in both modes) has the highest latency (of about 10 psec) among the four platforms - a similar observation about the Cray XI latency was reported in [ 1 I]. The ping-pong results (9* column) show that the Cray XI has the highest link bandwidth (of over 9 GBlsec in MSP mode and over 4 GB/sec in SSP mode). In the MSP mode, it outperformed the Altix 3700 BX2, the Cray Opteron, and the Dell PowerEdge by factors of about 9, 13, and 23, respectively. The b-eff results (3rd column) shows that with respect to the effective bandwidth of the whole system the 512-processor Altix 3700 BX2 outperformed a 48-processor Cray XI, a 128-processor Dell PowerEdge, and a 64-processor Cray Opteron by factors of about 9, 10, and 26, respectively.
Another way to interpret the results of Table 1 is a comparison across different measurements for a specific platform (vertically). Comparing the ping-pong results (gth column) with the b-eff at L,, per processor using ring patterns only (8* column), we observe the impact of communicating in parallel on each processor which is quite significant on the Cray XI in the SSP mode (of a factor of over six using 32 processors) while it is only 64% on the Altix 3700 BX2 (for both configurations). Another comparison is between b-eff at L,, per processor using ring patterns only (8" column) and its value using rings and random patterns (6k column) to show the effect of random neighbor locations where we notice a drop of about 50% on the 64 processor Cray Opteron while the Cray XI in the SSP mode shows no degradation. Yet another comparison is between b-eff at L,,using ring and random patterns (6* column) and the overall b-eff per processor (4fh column) to show the impact of different message sizes where we notice significant drops for all systems since the overall b-eff is an average over several message sizes. These drops range between a factor of 4.6 for the Cray XI in the MSP mode and 2 for the 64-processor Cray Opteron.
As the number of processors increases for the same platform, the b-eff per processor decreases but by different factors. It decreases by 20% as the number of processors doubled on the Alf& 3700 BX2, while it decreases by 30% as the number of processors increased by a factor of eight on the Cray Opteron.
3.2. Intel MPI Benchmark
We used Intel MPI Benchmarks (BIB) suite [7] for both point-to-point communication and collective communication. We employed five IMB benchmarks: PingPong, Ping-Ping, Barrier, Reduce, and Alltoall. The PingPong benchmark measures the point-to-point bandwidth of a message sent between two processes using MPI-Send and MPI-Recv. The Pingping benchmark also measures the point-to-point bandwidth of a single message but under the circumstance that the message is obstructed by oncoming messages. Here the two processes communicate with each other using MPI-Isend, MPI-Recv, and MPI-Wait with the two MPI-Isend functions issued simultaneously. The expected number of the later is between half and full of 'the former. We call the former the unidirectional bandwidth and the later the bidirectional bandwidth (ow bidirectional bandwidth is about 112 of the aggregate bidirectional bandwidth that is normally reported by vendors). The Barrier, Reduce, and Alltoall benchmarks measure the MPI-Barrier, MPI-Reduce, and MPI-Alltoall functions, respectively.
Figure 1 shows the unidirectional and bidirectional benchmark results for different message sizes on the four platforms. The Cray XI in the MSP mode achieved a rate of over 13 Gbytesls using ping-pong and a drop of less than 30% due to oncoming messages. On the other hand, the Dell PowerEdge with the InhiBand network achieved a rate of about 400 Mbytesls using ping-pong with a drop of 50% due to oncoming messages. The Aztix 3700 BX2 achieved a rate of about 1800 Mbytesls using ping-pong with a drop of about 50% due to oncoming messages mainly for large messages. In comparing between the modes of the Cray X1, we noticed a difference of a factor of over three between the MSP and SSP modes since in the MSP mode the Cray XI can use four times the number of ports than in the SSP mode. We also noticed that the best performance on the Dell PowerEdge and Cray Opteron was achieved with messages of sizes 16K and 128K bytes, respectively, due to switch buffering.
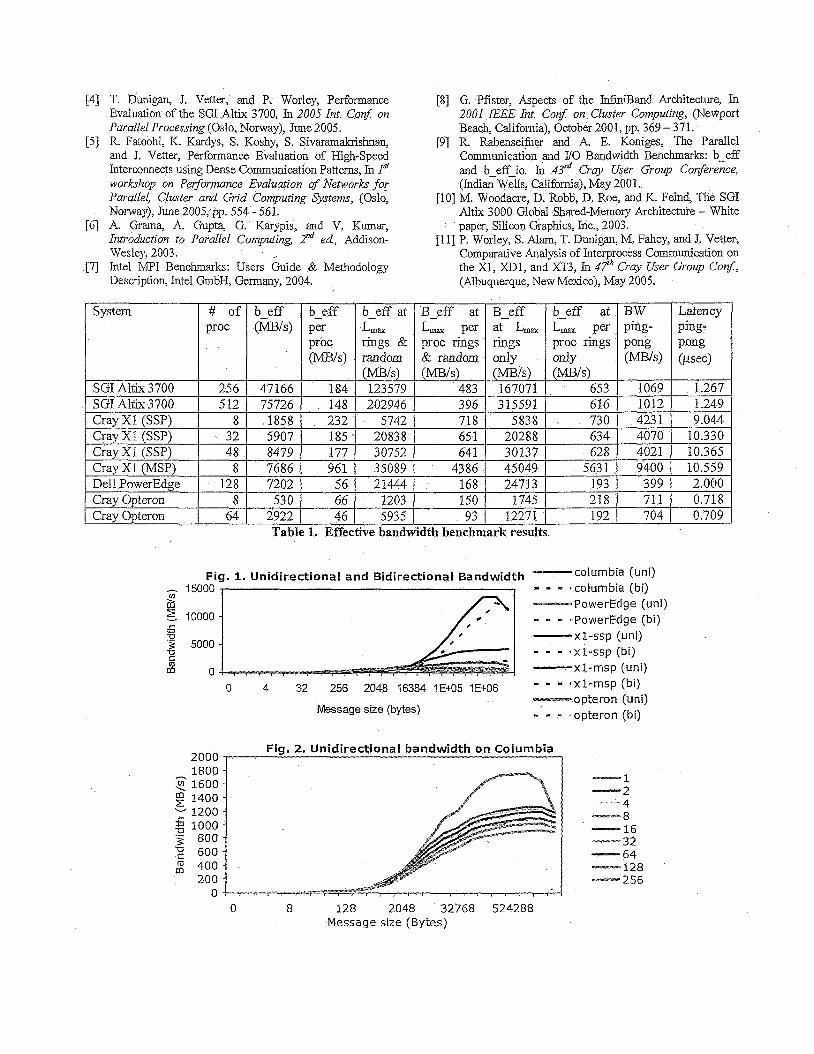
We measured the point-to-point data rate as we varied the distance between the two communicating processors on both the SGI Altix 3700 and Cray Opteron. Fiewe 2 shows the unidirectional bandwidth (using PingPong) results measured on the 512-processor Altix 3700 for nine cases ran,@ng fi-om a distance,
between the communicating processors, of one to 256 (the farthest two communicating processors). As mentioned earlier, the 5 12-processor BX2 consists of 64 C-bricks with each C-brick contains four nodes and each node has two Itanium-2 processors. Figure 2 shows the differences in transfer rate whether communication is between processors on the same node (distance of one), on the same C-brick (distances of two and four), or between C-bricks (distances of 8, 16, 32, 64, 128, and 256). Obviously, the highest rate achieved is between processors on the same node. Interestingly, the highest rates achieved are for messages of size either 1 or 2 Mbytes while it drops (by as much as 113 for a distance of one) for the 4 Mbytes message. The highest measured rates are: 1762, 1264, 1191, 1097, 1016, and 917 Mbytes/s for distances of 1, 2 or 4, 8 or 16, 32 or 64, 128, and 256, respectively. The rate drops for longer distances (distances of over 4) can be attributed to the number of the R-bricks (routers) that the message has to travel between C-bricks.
Figure 3 shows the results of distance sensitivity on the Cray Opteron for distances between communicating processors of 1, 2, 4, 8, and 16. Similar to the SGI AI& 3700, each node has two processors (using A$4D Opteron 246 series) so communication of distance one stays within the node. The results show that a rate of about 900 M%ytesJs achieved with a distance of one for the 128 Kbytes message. This rate drops to 670 MbytesJs (by about 25%) for the 4 Mbytes message with the same distance (one). For all other distances (2 to 16) the rate is about 234 Mbytes for large messages - a drop of 213 &om distance one rate. Interestingly, the measured results for all messages of distance of more than one are about the same which is an indication of distance insensitivity for the Myrinet network.
In comparing the ping-pong results of the b-eff benchmark (Sth column of Table 1) with theIMB results (Figures 1 through 3), we noticed some differences largely due to the message size and location of the communicating processes. In Table 1, we reported a single value for ping-pong, which is the measured bandwidth between the processes with rank 0 and 1 in MPI-COMM_UrORLD using a 1 Mbyte message, while Figures 1 through 3 show a range of values for different messages and communicating partners.
The three collective operation functions that we measured (MPI-Barrier, MPI-Reduce and MPI_Alltoall) are used extensively in many applications [6]. The MPI-Reduce function implements an all-to-one reduction operation, where each process sends a message of size M to a single process and data fi-om all processes are combined through an associative operator at the single destination process into a buffer of size M, and is used in many parallel algorithms such as matsix- vector multiplication, vector-inner product, and shortest
paths. The MPI_Alltoall function implements all-to-all personalized communication (also called total exchange) operation, where each process sends a distinct message to every other process, and is used many parallel algorithms such as fast Fourier transform, matrix transpose, sample sort, and some parallel database join operations. The MPI-Barrier function implements a synchronization poinq where each process is held until all other participating processes have reached the barrier, and is heavily used in parallel algorithms as well as in debugging. The performance of these functions reflects not only the richness of the network (in Iatency, bandwidth and topology) but also the efficient implementation, by the vendor, in optimized communication libraries.
Fi,gn-es 4 through 6 show the measured timings of these functions on the four platforms for three message sizes 8, 1K, and 1M bytes (for the last two functions only). The results for MPI-Barrier (Figure 4) show that the shared memory systems (SGI Altix 3700 and Cray Xl) perform much better than the distributed memory systems (Dell PowerEdge and Cray Opteron), even though the Cray Opteron has a very low latency. For example, for the same number of processors, 64, the Altix 3700 BX2 runs more than six times faster than the Dell PowerEdge and more than 13 times faster than the Cray Opteron using MPI-Barrier. The results for MPI-Reduce (Fiawe 5) show the Cray X1 outperforming the other three platforms for the three message sizes, even in the SSP mode. Using 32 processors and one Mbytes message, for example, the Cray XI in the SSP outperformed the Altix 3700 BX2, Dell PowerEdge, and Cray Opteron by factors of 10, 8.6, and 20, respectively. The Cray XI also outperformed the other platforms using MPI_Alltoall (Figure 6), but the performance gap between the XI and the Altix 3700 BX2 is narrower than for MPI-Reduce, especially for the large message.
We used the dense communication benchmark [5] to evaluate our networks when multiple processors communicating in parallel using four different intense communication algorithms (also referred consecutively as algorithms 1 through 4): congested-controlled all-to- all personalized communication (AAPC), simple pair- wise, cumulative pair-wise, and random pair-wise. In algorithm 1, each process sends data to its next higher neighbor (in rank) and receives data &om its next lower neighbor. The algorithm proceeds in phases such that the distance between the communicating processes increases in each phase till the last phase where every process sends data to its lower neighbor and receives data fi-om its higher neighbor. In algorithm 2, a set of
processes communicates in pairs and all pairs send and receive data in parallel and at full duplex. The algorithm proceeds in phases, as in the first algorithm, with the distance between the communicating processes increases in each phase until it reaches its maximum (the total number of processes minus one). Algorithm 3 is similar to algorithm 2 except that the number of the communicating pair is increased during successive phases of communication with only one pair communicating in the first phase and all pairs communicating in the last phase. Finally, in algorithm 4, all processes communicate in pairs as in simple pair- wise but the processes are shuffled for the next phase so as different pairs are formed in each phase. Here the number of phases is chosen at run time.
We implemented the four algorithms on the four platforms using different number of processors. Figures 7 through 10 present some of these results with the emphasis on the cases that have some significant for the sack of brevity. Several observations can be drawn &om these results. First, algorithms 1 and 2 demonstrated simiIar behavior on all platforms with drops in the middle phases (farthest communication distances) compared to the first and last phases (shortest communication distances). These drops range fkom over a factor of 5 (for Altix 3700 BX2 and Cray Opteron) to a factor of 2 (for the Cray Xl). In some cases, for example the Cray Opteron, there is a drop of about 40% between phase one and phase two since after the first phase, all communications are through the Myri.net network. Second, in many cases the highest obtained rates are not for the largest messages, such as the 3I#yte message on the SGI Altix 3700 using algorithm 1, mainly reIated to message buffering. Third, for algorithm 3 both the Altix 3700 BX2 and Dell PowerEdge showed small drops of up to 20% as the number of communicating pairs increased to 256, especially for large messages while the Cray Opteron showed no drops for all messages. On the other hand, the Cray X1 in the SSP mode showed a drop of up to a factor of 3 when the number of communicating processors increased to 24 pairs, which shows a typical bottleneck for many shared-memory architectures. Finally, all platforms showed the impact of randomness of communicating pairs on the measured bandwidth as demonstrated in algorithm 4. The impact of randomness was also noticeable in the b-eff benchmark (Table 1).
4. Conclusions
Our study provided a better understanding of certain limitation of interconnects of high-speed computers. The study showed the relative speed of network links and how it is impacted under different circumstances. For example, we noticed that the Cray Opteron has the
lowest latency, the Cray X1 has the highest liTlk bandwidth while the effective bandwidth of the Cray XI per processor is much lower than its link bandwidth (by a factor of over 6).
In studying the impact of oncoming message on the link bandwidth, we noticed that all systems (Altix 3700 BX2, Cray X1 in SSP mode, Cray Opteron, and Dell PowerEdge) experienced a drop of about 50% for large messages except the Cray X1 in the MSP mode. The study also demonstrated the distance sensitivity of point- to-point communication. It showed a drop in bandwidth as the two communicating processors are separated apart. For example, a drop of almost 50% was observed on the Altix 3700 BX2 when the distance between communicating processors is increased fiom one to 256. An even larger drop (213) was noticed on the Cray Opteron when the distance increased fkom one to 16. The results of three widely used MPI collective communication functions showed that the shared- memory machines (Cray X1 and Altix 3700 BX2) outperformed the distributed-memory machines (Cray Opteron and Dell PowerEdge) especially for MPI-Barrier. For MPI-Reduce and MPI-Alltoall, the Cray X1 outperformed the other platforms significantly.
Finally, our study reported the impact of intense communication patterns on these interconnects. In all cases, there were significant drops in performance as all processors communicated in parallel and away fkom each other. Another significant drop was observed on the Cray X1 when the number of communicating processors increased from one pair to 24 pairs.
Acknowledgements
We would like to thank Mmdy Wilson and Johnny Chang of NASA Ames in accessing and running code on NASA machines. We are also grateful to NCSA for providing us access to the Dell PowerEdge cluster.
References
[I] R Biswas, J. Djomehri, R. Hood, H. Jin, C. Kihs, and S. Saini, An Application-Based Performance Characterization of the Columbia Supercluster, In SC105, (Seattle, Washington), November 2005.
[2] R. Biswas, S. Saini, S. Gavali, H. fin, D. Jesperson, M. Djomehri, N. Madavan, and C. a i s , NAS Experience with the Cray XI, In 47’ Cray User Group Cor$ (Albuquerque, New Mexico), May 2005.
[3] N. Boden, D. Cohen, R Felderman, A. Kulawik, C. Seitz, J. Seizovic, and W. Su, Myrinet: A G<gabit-persecond Local Area Network, IEEE Micro, Vol. 15, No. 1, February 1995, pp. 29 - 36.
[4] T. Dunigan, J. Vetter, and P. Worley, Performance Evaluation of the SGI Altix 3700, In 2005 Int. C o ~ on Parallel Pi*ocessing (Oslo, Norway), June 2005.
[5] R Fatoohi, K. Kardys, S. Koshy, S. Sivararnakrishnan, and J. Vetter, Performance Evaluation of High-speed Interconnects using Dense Communication Patterns, In Ia workshop on Performance Evaluation of Networks for Parallel, Cluster and Grid Computing Systems, (Oslo, Norway), June 2005;pp. 554 - 561.
[6] A. Grama, A. Gupta, G. Karypis, and V. Kumar, Inhoduction to Parallel Computing, 2'" ea!, Addison- Wesley, 2003.
[7) Intel MPI Benchmarks: Users Guide & Methodology Description, Intel GmbH, Germany, 2004.
SGI Ntix 3700 256 SGI Altix 3700 5 12 CravX1 (SSP) 8
CrayX1 (SSP) Cray XI (MSP) Dell P0werEdg.e 128 Cray Opteron 8 Cray Opteron 64
rings &
1858 232 5742 5907 185 20838 8479 177 30752 7686 961 35089 7202 56 21444 530 66 1203
2922 46 5935 Table 2. Effective bandl
[8] G. Pfister, Aspects of the InfiniBand Architecture, In 2001 IEEE Int. Con$ on Cluster Computing, (Newport Beach, California), October 2001, pp. 369 - 371.
[9] R Rabenseifner and A. E. Koniges, The Parallel Communication and YO Bandwidth Benchmarks: b-eff and b-eff-io. In 43rd Cray User Group Co$erence, (Indian Wells, Califomia), May 2001.
[lo] M. Woodacre, D. Robb, D. Roe, and K. Feind, The SGI Altix 3000 Global Shared-Memory Architecture - White paper, Silicon Graphics, Inc., 2003.
[ll] P. Worley, S. Alam, T. Dunigan, M. Fahey, and J. Vetter, Comparative Analysis of Interprocess Communication on the X1, XD1, and XT3, In 47'" Cray User Group Con$, (Albuquerque, New Mexico), May 2005.
B-eff at B-eff b-eff at L, per at Lax L,, per proc rings rings proc rings & random only only (MB/s) (MB/s) (MB/s)
483 167071 653 396 315591 616 718 5838 73 0
4386 45049 563 1 24713
150 1745 218 93 12271 192
dth benchmark results.
Columbia (mi) - F i g . 1. Unidirectiona! and Bidirectional Bandwidth - 15000 = - - ccolumbia (bi) a 7 PowerEdge (uni) z 10000 _ _ * PowerEdge (bi) 5 - xl-ssp (uni)
5000
m - xl-msp (uni) m 0
UJ
n - - - axl-ssp (bi)
- - - tx l -msp (bi)
73 S
0 4 32 256 2048 16384 lEUJ5 I E 0 6
kkssage size (bytes) -opteron (uni) - = - .opteron (bi)
2000 1800 1600
2 1400 - 1200
.z 800 2 600
400 200
0
- c g 1000
Fig . 2. Unidirectional bandwidth on Columbia
1 2 4 8 16 32 - 64 128 256
- _I__
-- _II
-7
-1 - 0 8 128 2048 32768 524288
Message size (Bytes)
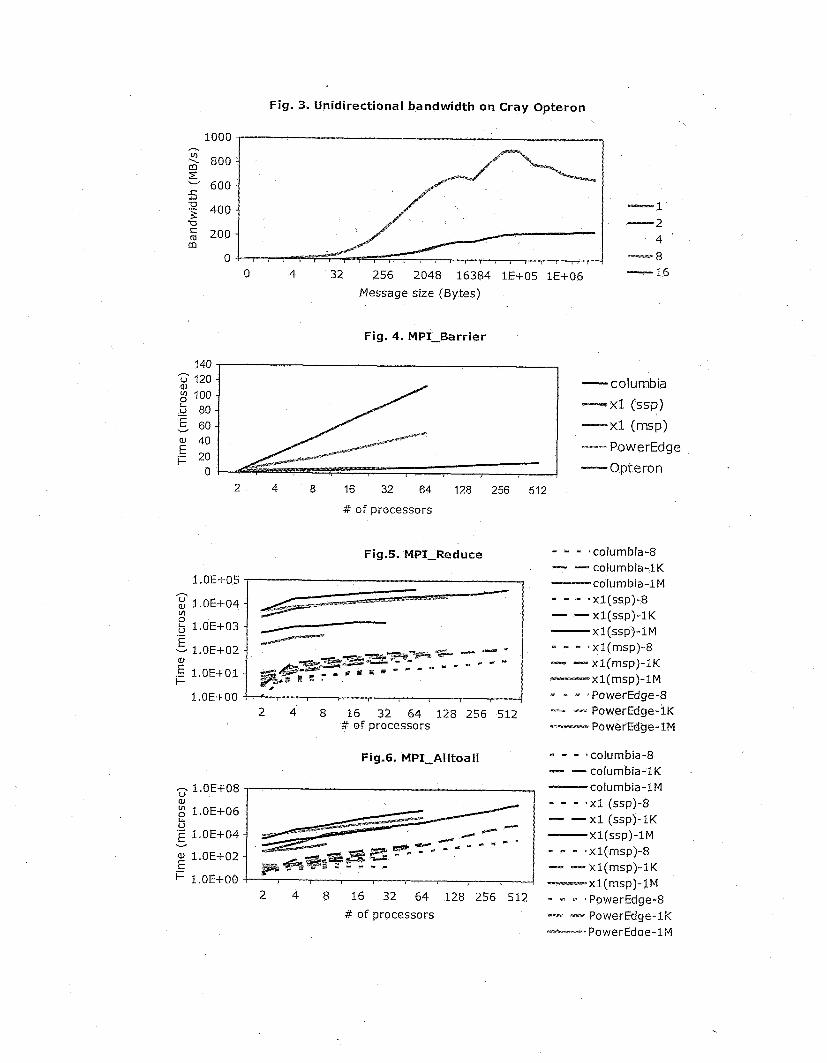
Fig. 3. Unidirectional bandwidth on Gray Opteron
1000 I
-1 2 4
-8
49_.1
16 32 256 2048 16384 1E+05 1E+06 - 0 4 Message size (Bytes)
Fig. 4. MPI-Barrier
140 z 120 0" 100 .- b 80 E v 60
p 20
e,
E 40
0 2 4 8 16 32 64 128 256 512
# o f processors
F i g .5. MPI-Re d u ce
1.OE+05 f
1.OE+04 v)
p 1.OE+03f - - i 1.OE+00
2 4 8 16 32 64 128 256 512 # of processors
Fig .6. M PI-A I I to a I I
W v, 1.OE+06 e
1.OE+04
1.OE+02 E i= 1.OE+00
V
v
2 4 8 16 32 64 128 256 512 # of processors
-Columbia
-Xl (ssp)
---XI. (mP> - PowerEdge -0pteron
. . - - > columbia-8 - - colurnbia-1K _I_ Columbia-1 M 8 . m - ' X l ( s sP ) -~ - - Xl(SSP)-lK - X l(ssp)-IM _ _ m t xl(msp)-8 =- - xl(msp)-lK - x 1 (rnsp)-1M - = ~PowerEdge-8 - -- PowerEdge-1K -* PowerEdge-1M
b columbia-8 I - - - - Columbia-1K P Columbia-1M - - - ' X l (SSp)-8 - - x l (SSp)-lK
X 1 (Ssp)-l M - - . a - - x l ( msp)-8 +-- - xl(msp)-iK
x l( mSp)- 1 M - = 'PowerEdge-8 - - PowerEdge-IK - PowerEdae-1M
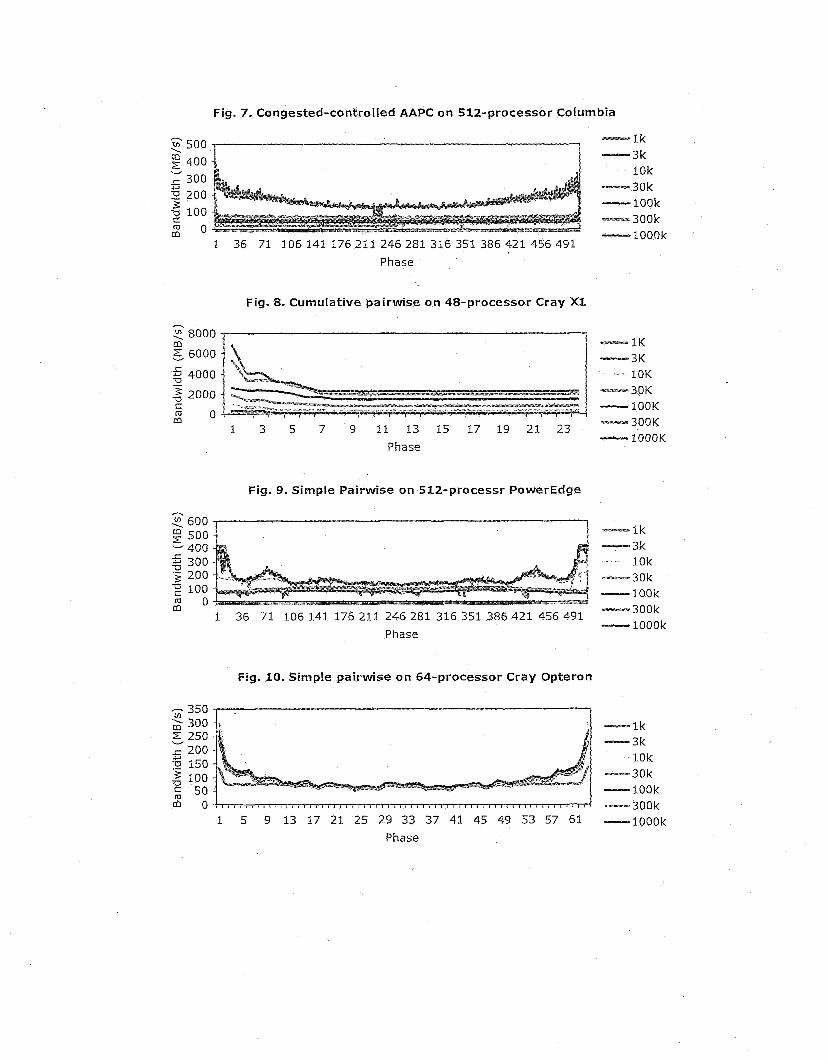
Fig. 7. Congested-controlled AAPC on 512-processor Columbia
-1k -3k \ - - -
1Ok - 30k
400 300 5
0 200 3 - lOOk --- 300k 2 0 -1000k
U
z 100
1 36 71 1 0 6 1 4 1 1 7 6 2 1 1 2 4 6 2 8 1 3 1 6 3 5 1 3 8 6 4 2 1 4 5 6 4 9 1 Phase
Fig. 8. Cumulative pairwise on 48-processor Cray XI
T 8000 - 1K m 5 6000 - 3K g 4000 10K - 30K - l O O K
c .- 4 2000 c
~-300K - l O O O K
m o m 1 3 5 7 9 11 13 15 17 19 21 23
Phase
Fig . 9. Simple Pairwise on 512-processr PowerEdge
h
--Ik -3k
p 600 500 - 400
10k 300 .? 200 - 30k z 100 - 1OOk
-300k m o m - 1OOOk
c
1 36 71 106 141 175 211 246 281 316 351 386 421 456 491 Phase
Fig. 10. Simple pa i rdse on 64-processor Cray Opteron
- 350 $ 300 - 1 k v E 250 -3k c 200 % 150
C 50 m o
10k -30k - lOOk - 300k
U 5 100 m
1 5 9 13 17 21 25 29 33 37 41 45 49 5 3 57 61 ----1000k Phase