Embed Size (px)
Citation preview

Intercomparisons of Water Vapor Intercomparisons of Water Vapor Measurements during IHOP_2002 Measurements during IHOP_2002
– Radiosonde and Dropsonde– Radiosonde and Dropsonde
Junhong (June) WangJunhong (June) WangNCAR Atmospheric Technology DivisionNCAR Atmospheric Technology Division
Acknowledgement: Kate Beierle, Scot Loeher, ARM EDC

Outline:Outline:
1. Goals for intercomparisons
2. Summary of Comparisons between Snow White and Vaisala RS80-H/VIZ-B2 during IHOP_2002
3. Comparison of Radiosonde Data at Norman, OK and ARM-B6 site (Purcell, OK) from 1996-2002
4. Comparison of dropsonde and radiosonde data during IHOP_2002

Errors in Observation system:Errors in Observation system:1. Natural Error: • Instrument error (systematic and radom)• Error of representativeness
2. Gross Error:• Improperly calibrated instruments• Incorrect registration of observations• Incorrect coding of observations• Telecommunication errors
Goals:
•Mean errors/biases for the climate community
•Observation error variances (only instrument error) for the data assimilation community

SummarySummary
±5%:•Typical accuracy
•Requirements for synoptic meteorology
Wang et al. (2003 )
http://www.atd.ucar.edu/homes/junhong/paper/Refsonde-GRL.pdf

•Two sites are ~16 miles (25 km) apart.
• VIZ-B, VIZ-B2, Vaisala RS80-H, Vaisala RS90 were used at two sites during 1996-2002.
• 490 pairs of soundings launched within half hour and sampling the same air mass are found for comparisons.
Comparisons of radiosonde data at Norman, OK and ARM-B6 site (Purcell, OK) from 1996 to 2002

Norman 1996-2002
0
10
20
30
40
50
60
70
80
90
100
9601 9701 9801 9901 0001 0101 0201
Year/Month
Nu
mb
er o
f S
ou
nd
ing
s
Vaisala RS80-HVIZ-B VIZ-B2
ARM-B6 1996-2002
0
25
50
75
100
125
150
175
200
225
250
9601 9701 9801 9901 0001 0101 0201
Year/Month
Nu
mb
er o
f S
ou
nd
ing
s
Vaisala RS80-H Vaisala RS90
VIZ-B/RS80-H B2/RS80H RS80-H/RS80-H RS80-H/RS90
(97) (131) (158) (104)

RHRH

Norman
ARM-B6
Monthly Mean RH ProfilesMonthly Mean RH Profiles

TT

Significance of T Significance of T differences differences

Estimation of Instrument Error VariancesEstimation of Instrument Error Variances
Richner and Philips (1982)
“The Radiosonde Intercomparison SONDEX”

Estimation of Instrument Error VariancesEstimation of Instrument Error Variances
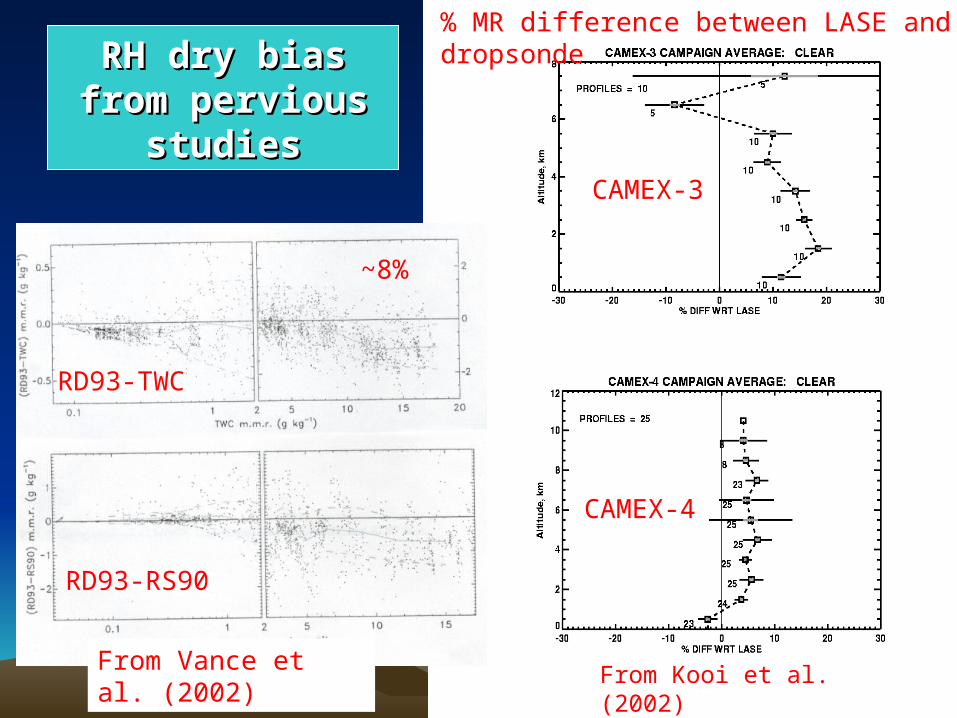
CAMEX-3
CAMEX-4
From Kooi et al. (2002)
% MR difference between LASE and dropsonde
RH dry bias from RH dry bias from pervious studiespervious studies
From Vance et al. (2002)
RD93-TWC
RD93-RS90
~8%

Comparisons of Comparisons of dropsonde and dropsonde and
radiosonde data: RHradiosonde data: RH Homestead (RS80-H 7)
ARM-CF (RS90 2)

Comparisons at 18:04 UTC on June 9Comparisons at 18:04 UTC on June 9
QTRH

Performance in Clouds (Dycoms-II)Performance in Clouds (Dycoms-II)
Marine Stratus Cumulus clouds

Time lag error
Time-lag ErrorTime-lag Error

ConclusionsConclusions
1. The Sippican (VIZ) carbon hygristor used in 14% of global radiosonde stations fails to respond to humidity changes in the UT, sometimes even in the middle troposphere. This lack of response has produced significant and artificial humidity changes in the UT when the transition occurred and resulted in incapability of carbon hygristor to measure vertical and seasonal variations of humidity in UT.
2. Vaisala RS80-H Humicap used in ~51% of global radiosonde stations agrees very well with the SW in the middle and lower troposphere, but has dry biases in the UT.
3. Comparisons of seven years of data from two neighboring stations (Norman and ARM-B6) show unexplained significant and consistent drier RS90 than RS80-H (~5%) in UT and warmer temperature (~0.5C) in the middle and upper troposphere at ARM-B6 than at Norman when Vaisala sondes were launched at both sites.
4. The dry bias in dropsonde humidity data found by previous studies are preliminarily evaluated by comparing with co-located radiosonde data during IHOP. The comparison shows good agreements except inside moist layers.

Comparisons between VIZ and RS80-HComparisons between VIZ and RS80-H
No response
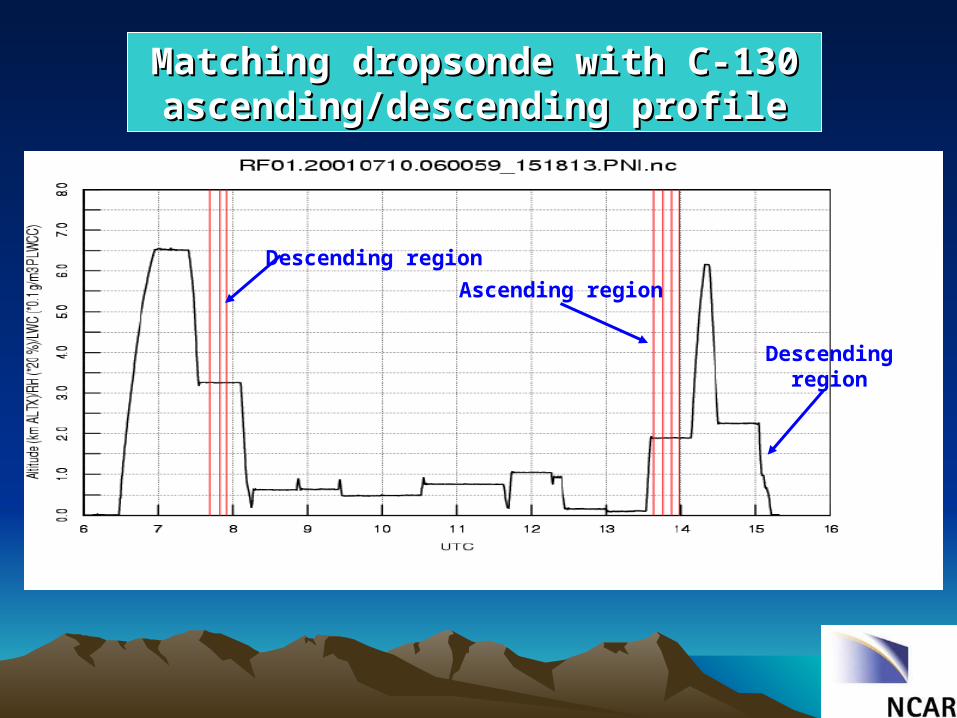
Descending region
Ascending region
Descendingregion
Matching dropsonde with C-130 Matching dropsonde with C-130 ascending/descending profileascending/descending profile


Height and Temperature at No-Response LevelHeight and Temperature at No-Response Level

Comparisons between RS80-H and RS80-H/RS90Comparisons between RS80-H and RS80-H/RS90
RS90 (B6) v.s. RS80H (Norman)
during IHOP (N=52)
RS80H (B6) v.s. RS80H (Norman)
1999/2000 (N=158)

Significant and consistent drier RS90 than RS80-H in UT
Significant and consistent warmer temperature in the middle and upper troposphere at ARM-B6 than at Norman when Vaisala sondes were launched at both sites.

Comparisons of Comparisons of dropsonde and dropsonde and
radiosonde data: RHradiosonde data: RH
Homestead (RS80-H 7)
ARM-CF (RS90 2)