Embed Size (px)
Citation preview
Interactome Maps of Mouse GeneRegulatory Domains Reveal BasicPrinciples of Transcriptional RegulationKyong-Rim Kieffer-Kwon,1,12 Zhonghui Tang,2,12 Ewy Mathe,1,12 Jason Qian,1,12 Myong-Hee Sung,3,12 Guoliang Li,2
Wolfgang Resch,1 Songjoon Baek,3 Nathanael Pruett,1 Lars Grøntved,3 Laura Vian,1 Steevenson Nelson,1 Hossein Zare,4
Ofir Hakim,5 Deepak Reyon,6,7 Arito Yamane,1 Hirotaka Nakahashi,1 Alexander L. Kovalchuk,8 Jizhong Zou,9
J. Keith Joung,6,7 Vittorio Sartorelli,4 Chia-Lin Wei,10 Xiaoan Ruan,2 Gordon L. Hager,3,12 Yijun Ruan,2,12
and Rafael Casellas1,11,12,*1Genomics and Immunity, NIAMS, National Institutes of Health, Bethesda, MD 20892, USA2The Jackson Laboratory for Genomic Medicine, and Department of Genetic and Development Biology, University of Connecticut,400 Farmington, CT 06030, USA3Laboratory of Receptor Biology and Gene Expression, NCI, National Institutes of Health, Bethesda, MD 20892, USA4Laboratory of Muscle Stem Cells and Gene Regulation, NIAMS, National Institutes of Health, Bethesda, MD 20892, USA5Bar-Ilan University, Ramat-Gan 5290002, Israel6Molecular Pathology Unit, Center for Computational and Integrative Biology, and Center for Cancer Research, Massachusetts GeneralHospital, Charlestown, MA 02129, USA7Department of Pathology, Harvard Medical School, Boston, MA 02115 USA8Laboratory of Immunogenetics, National Institute of Allergy and Infectious Diseases, National Institutes of Health, Rockville,MD 20852, USA9Laboratory of Stem Cell Biology, NIAMS, National Institutes of Health, Bethesda, MD 20892, USA10DOE Joint Genome Institute, 2800 Mitchell Drive, Walnut Creek, CA 94598, USA11Center of Cancer Research, NCI, National Institutes of Health, Bethesda, MD 20892, USA12These authors contributed equally to this work*Correspondence: [email protected]://dx.doi.org/10.1016/j.cell.2013.11.039
SUMMARY
A key finding of the ENCODE project is that theenhancer landscape of mammalian cells undergoesmarked alterations during ontogeny. However, thenature and extent of these changes are unclear.As part of the NIH Mouse Regulome Project, wehere combined DNaseI hypersensitivity, ChIP-seq,and ChIA-PET technologies to map the promoter-enhancer interactomes of pluripotent ES cells anddifferentiated B lymphocytes. We confirm thatenhancer usage varies widely across tissues. Unex-pectedly, we find that this feature extends tobroadly transcribed genes, including Myc andPim1 cell-cycle regulators, which associate with anentirely different set of enhancers in ES and B cells.By means of high-resolution CpG methylomes,genome editing, and digital footprinting, we showthat these enhancers recruit lineage-determiningfactors. Furthermore, we demonstrate that theturning on and off of enhancers during developmentcorrelates with promoter activity. We propose thatorganisms rely on a dynamic enhancer landscapeto control basic cellular functions in a tissue-specificmanner.
INTRODUCTION
Gene expression during development is orchestrated by pro-moter sequences and a variety of distal cis-regulatory elements.Key among these are enhancers, which associate with pro-moters to increase the transcriptional output of target genes ina tissue-specific manner (Visel et al., 2009). Enhancers aretypically distinguished from nonregulatory DNA by their hyper-sensitivity to DNaseI digestion (Sabo et al., 2006) and bindingof chromatin modifiers. The CBP/p300 acetyltransferase forinstance mediates H3K27 acetylation of chromatin at activeenhancers (Creyghton et al., 2010). In addition, enhancers dis-play high levels of H3K4 monomethylation (H3K4me1; Bueckerand Wysocka, 2012), and a relative depletion of H3K4me3(Heintzman et al., 2007) and the histone variant H2AZ (Kouzineet al., 2013). Based on these parameters, !400,000 genomicsites displaying enhancer-like features were recently discov-ered, spanning nearly 10% of the human genome (ENCODEProject Consortium et al., 2012).Enhancers control lineage identity by recruiting transcription
factors, cofactors, and RNA Polymerase II (PolII) to target genes.They physically interact with promoters resulting in looping out ofintervening sequences (Krivega and Dean, 2012), which in someinstances can span over 1 Mb of DNA (Nobrega et al., 2003). Incontrast to promoters and insulators, which vary little acrosscell types, the enhancer landscape changes considerably duringdevelopment (Thurman et al., 2012). This feature predicts that
Cell 155, 1507–1520, December 19, 2013 ª2013 Elsevier Inc. 1507
functional connectivity inmammalian cells (1)must display a highdegree of tissue specificity and (2) should closely reflect tran-scriptome changes during cell differentiation. However, theseideas have not been fully explored because of the difficulty ofmapping promoter-enhancer connections during development.
In the absence of direct approaches, enhancers have beentypically assigned to ‘‘cognate’’ promoters based on linear prox-imity or shared chromatin states. This strategy has limitationsbecause enhancers do not always regulate nor share chromatinprofiles with the nearest promoter. Alternatively, chromosomeconformation capture techniques have been used to exploreregulatory interactions at predefined genomic loci. However,the resolution of 3C-based techniques alone is insufficient tomap promoter-enhancer connectivity in entire genomes (Xieand Ren, 2013). To overcome this challenge, the ChIA-PET pro-tocol was recently developed (Fullwood et al., 2009). ChIA-PETis a ChIP-based method that captures long-range chromatin in-teractions involving or mediated by a protein of interest such asestrogen receptor a in adenocarcinoma cells (Fullwood et al.,2009) or RNA PolII in human cell lines (Li et al., 2012).
We here introduce the NIHMouse Regulome Project, an initia-tive that seeks to define the 3D interplay of gene regulatorydomains in developing mouse primary cells. In this first reportwe compare pluripotent embryonic stem (ES) cells and dif-ferentiated B lymphocytes. By combining ChIA-PET, CpGmethylomes, DNaseI hypersensitivity, transcriptomes, digitalfootprinting, and TALEN-mediated genome editing, our studiesreveal the dynamics of the mouse regulome during ontogeny.
RESULTS
A Comprehensive Map of Regulatory Domains and TheirInteractions in Mouse Primary CellsTo characterize the mouse regulome in primary cells we firstapplied DNaseI hypersensitivity (DHS) followed by deep-sequencing to CD43" B lymphocytes activated in the presenceof lipopolysaccharide and interleukin-4 (LPS+IL-4). From two in-dependent experiments (268million aligned reads), we identified90,015 high-confidence DNaseI domains in B cells. As expected,DNaseI-seq profiles were highly reproducible between biologicalreplicates (Spearman’s r = 0.99; Figure S1A available online).
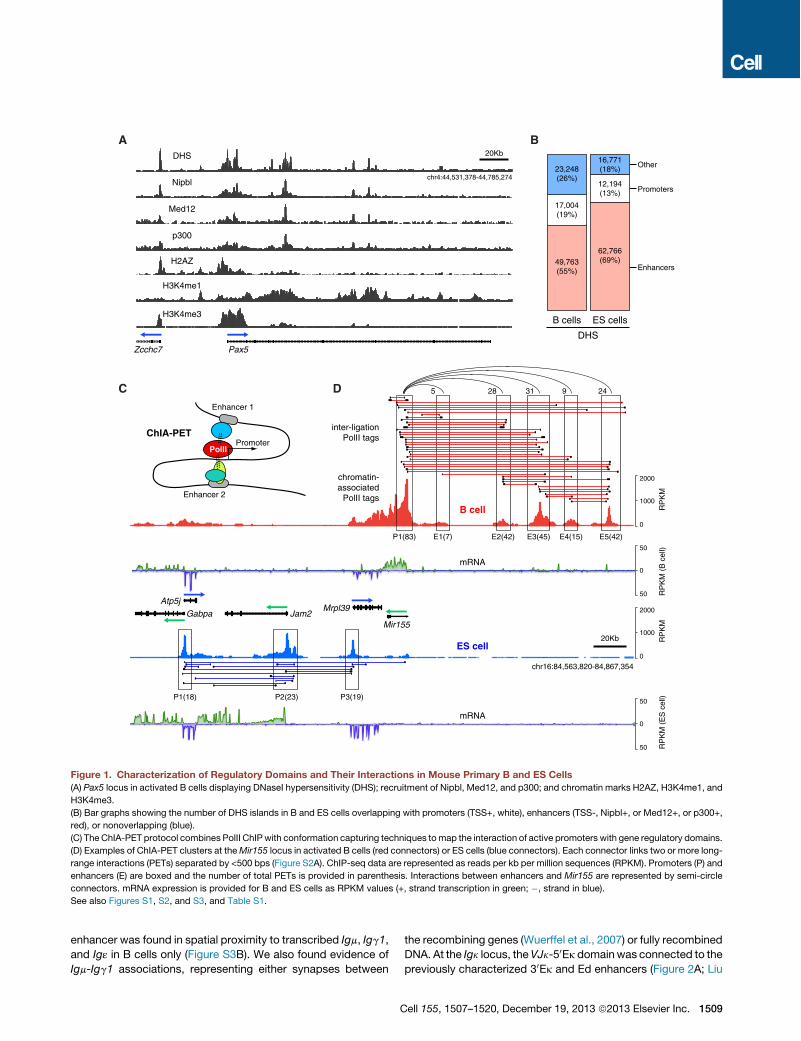
To identifyDHSsites associatedwith gene regulatorydomains,we next mapped Nipbl, Med12, and p300 by ChIP-seq (Fig-ure 1A). We chose the cohesin-loading factor Nipbl and theMed12 component of mediator because they demarcate en-hancers tethered with core promoters (Kagey et al., 2010). Like-wise, the transcription regulator p300 occupies a subset ofactive promoters and enhancers (Chen et al., 2008). There wasa considerable, although incomplete, overlap in the recruitmentof these factors in B cells (Figures 1A and S1B). Active promoterswere thus identified as Nipbl+, Med12+, or p300+ DHS sitesthat overlapped with ENSEMBL-annotated transcription startsites (TSSs). Based on this strategy we identified 17,004DHS promoter elements associated with 16,931 genes, 49,763enhancer elements, and an additional 23,248 that did not overlapwith either (Figure 1B). Promoters were in general H3K4me1-lowH3K4me3high H2AZhigh, whereas the opposite signaturedemarcated enhancer domains (Figure 1A; Kouzine et al.,
2013). DHS analysis of mouse ES cells uncovered a similar num-ber of DHS promoters (16,771) and an increased number of en-hancers (62,766, Figure 1B).To directly map the promoter-enhancer interactome, we
applied chromatin interaction analysis by paired-end-tag se-quencing (ChIA-PET; Fullwood et al., 2009; Zhang et al.,2012), which combines PolII ChIP with 3C technology (Figures1C, S2A). We generated two independent B cell ChIA-PETlibraries, from which !15 million reads were uniquely alignedand classified into two separate data sets: 5.7 million reads ofPolII chromatin occupancy, and 9.2 million reads clusteredinto 14,247 high-confidence PolII long-range cis interactionsor PETs (Figure 1D and Table S1). Both data sets were corre-lated between replicates (Spearman’s r > 0.83, Figures S2Band S2C).Attesting to the specificity of ChIA-PET, most PolII long-range
interactions (13,070, 92%) were linked to at least one gene reg-ulatory domain (Figure S1C). Furthermore, of 16,931 B cell pro-moters associated with DHS domains, 6,890 were involved inPolII long-range interactions. In general, these genes were tran-scribed 2-fold higher (p < 2 3 1016, Figure S1D) and recruitedmore PolII (p < 2 3 1016, Figure S1E) than nonanchored ones.We also detected 6,813 DHS enhancer domains involved in PolIIinteractions. Of these, 71%were active (H3K27Ac+), whereas upto 60% of nonanchored ones were poised (H3K27Ac", Fig-ure S1F). In general, the number of ChIA-PET interactions perregulatory site was proportional to the extent of DNaseI digestion(Figure S1G). Thus, ChIA-PET preferentially detects PolII long-range interactions involving H3K27Ac+ enhancers and transcrip-tionally active promoters.As previously shown (Li et al., 2012), PolII interactions fell into
four distinct groups: (1) intragenic, connecting promoters togene bodies; (2) extragenic, connecting promoters to distalregulatory elements; (3) intergenic, tethering promoters fromdifferent genes; and (4) enhancer-enhancer interactions (Fig-ure S1H). Examples of these are provided in Figure 1D for theAtp5j-Mir155 gene locus. Consistent with high expression ofMir155 in activated B cells (Kuchen et al., 2010), its promoterwas associated with 83 long-range interaction tags (Figure 1D,upper). Of these, 70 were extragenic, involving 5 upstreamenhancer domains, while 13were intragenic, connecting the pro-moter to downstream sequences. An additional 23 PolII long-range interactions interconnected the 5 enhancers upstream ofMir155. In contrast to B cells, ES cells actively transcribeMrpl39, Jam2, and Atp5j but express little Mir155 mRNA (Fig-ure 1D, lower). Consistent with this, we identified 30 intergenicconnections between Mrpl39, Jam2, and Atp5j promoters inES cells, whereas few connections involved Mir155 (Figure 1D).As in previous ChIA-PET studies, both direct and indirect inter-actions were considered in our analysis (Figure S1I).
TALEN-Mediated Validation of Promoter-EnhancerConnectivityChIA-PET confirmed established connections between generegulatory domains. For instance, the pluripotent gene Sox2was associated in ES cells with a series of enhancers recentlydescribed by 5C studies (Figure S3A; Phillips-Cremins et al.,2013). Likewise, the immunoglobulin heavy chain (Igh) 30Ea
1508 Cell 155, 1507–1520, December 19, 2013 ª2013 Elsevier Inc.
enhancer was found in spatial proximity to transcribed Igm, Igg1,and Ig! in B cells only (Figure S3B). We also found evidence ofIgm-Igg1 associations, representing either synapses between
the recombining genes (Wuerffel et al., 2007) or fully recombinedDNA. At the Igk locus, theVJk-50Ek domainwas connected to thepreviously characterized 30Ek and Ed enhancers (Figure 2A; Liu
B
B cells ES cells
DHS
A
Pax5Zcchc7
H2AZ
H3K4me1
H3K4me3
DHS
Nipbl
Med12
p300
chr4:44,531,378-44,785,274
Enhancers
Promoters
Other23,248(26%)
17,004(19%)
49,763(55%)
62,766(69%)
12,194(13%)
16,771(18%)
chromatin-associated
PolII tags
C
PolII
Enhancer 1
Promoter
Enhancer 2
ChIA-PET
Mir155
Mrpl39Atp5j
chr16:84,563,820-84,867,354
Jam2Gabpa
2000
1000
0
2000
1000
0R
PK
MR
PK
M
E1(7) E2(42) E3(45) E4(15) E5(42)
P3(19) P2(23)P1(18)
inter-ligationPolII tags
ES cell
B cell
P1(83)
D
50
0
50 RP
KM
(B
cel
l)
mRNA
50
0
50 RP
KM
(E
S c
ell)
mRNA
20Kb
20Kb
5 28 31 9 24
Figure 1. Characterization of Regulatory Domains and Their Interactions in Mouse Primary B and ES Cells(A) Pax5 locus in activated B cells displaying DNaseI hypersensitivity (DHS); recruitment of Nipbl, Med12, and p300; and chromatin marks H2AZ, H3K4me1, and
H3K4me3.
(B) Bar graphs showing the number of DHS islands in B and ES cells overlapping with promoters (TSS+, white), enhancers (TSS-, Nipbl+, or Med12+, or p300+,
red), or nonoverlapping (blue).
(C) The ChIA-PET protocol combines PolII ChIPwith conformation capturing techniques tomap the interaction of active promoters with gene regulatory domains.
(D) Examples of ChIA-PET clusters at theMir155 locus in activated B cells (red connectors) or ES cells (blue connectors). Each connector links two or more long-
range interactions (PETs) separated by <500 bps (Figure S2A). ChIP-seq data are represented as reads per kb per million sequences (RPKM). Promoters (P) and
enhancers (E) are boxed and the number of total PETs is provided in parenthesis. Interactions between enhancers and Mir155 are represented by semi-circle
connectors. mRNA expression is provided for B and ES cells as RPKM values (+, strand transcription in green; ", strand in blue).
See also Figures S1, S2, and S3, and Table S1.
Cell 155, 1507–1520, December 19, 2013 ª2013 Elsevier Inc. 1509
B
C D
chr6:122,457,153-122,560,872
Mfap5 Aicda Apobec1TALENHomologous Recombination
Knockout targeting cassette
E3(26) E4(31)
lox-Puro/TK-lox
E5(2)E2(35)E1(19) P2(4)P1(32)
2.01.8
1.41.21.00.8
0.40.2
0
Aicda
Gen
e ex
pres
sion
(ar
bitr
ary
units
)
Activation
WT!E1!E2
1.6
0.6
Cd83 Apobec1
15% 1.4% IgM
IgA
E1!WT E2!
Ezh2
1.1%
chr6:70,653,579-70,722,844
PolII interactions
DHS
J"
5’E"(64)
C"
3’E"(10) Ed(15) E4(35)
Rpia
E5(2)
A
0.25
0.15
0.05
0
0.10
0.20
******
**
Nipbl WT
Nipbl !E2
PolII WT
PolII !E2
Mfap5 Aicda Apobec1 Foxj2 C3ar1 Necap1
E
0
20
0
15
0
20
0
15
RP
KM
E2
chr6:122,474,255-122,556,944 chr6:122,745,356-122,848,127188,412bps
E6(2)
- + + + +
5Kb
10Kb
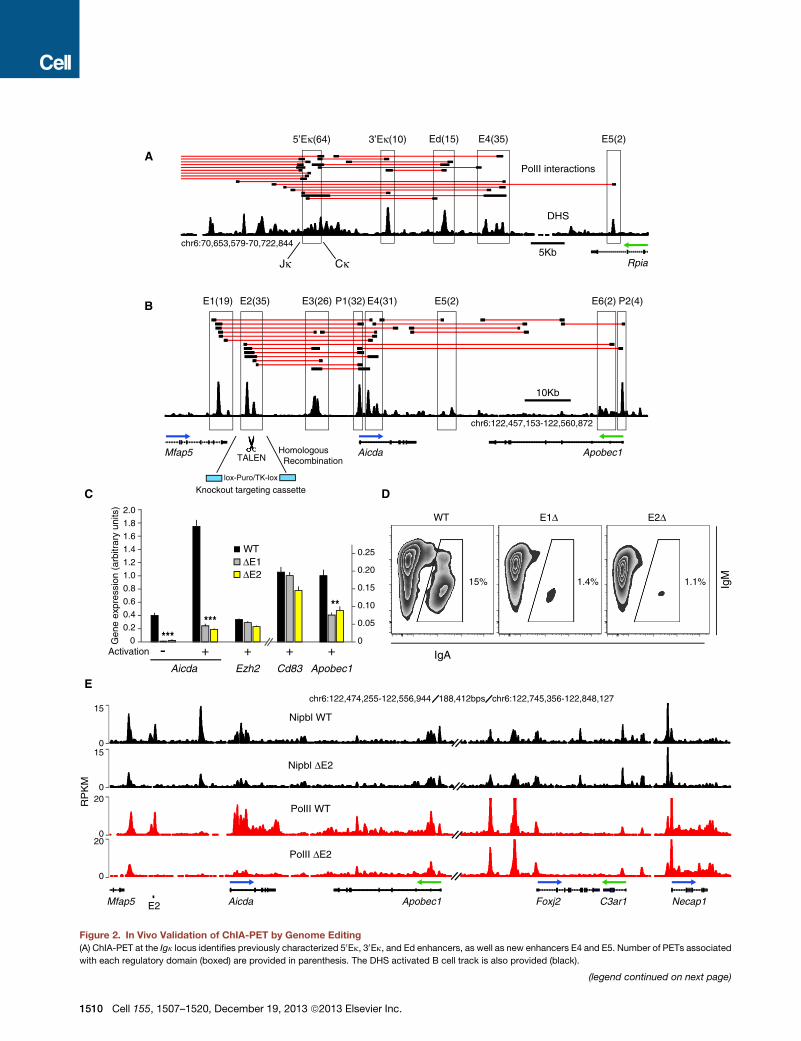
Figure 2. In Vivo Validation of ChIA-PET by Genome Editing(A) ChIA-PET at the Igk locus identifies previously characterized 50Ek, 30Ek, and Ed enhancers, as well as new enhancers E4 and E5. Number of PETs associated
with each regulatory domain (boxed) are provided in parenthesis. The DHS activated B cell track is also provided (black).
(legend continued on next page)
1510 Cell 155, 1507–1520, December 19, 2013 ª2013 Elsevier Inc.
et al., 2002; Meyer and Neuberger, 1989). Unexpectedly, theanalysis uncovered two additional enhancers located 8 kb (E4)and 15 kb (E5) downstream of Ed (Figure 2A).We also found additional enhancers (E1-E2) associated with
the activation induced deaminase (AID) gene Aicda (Figure 2B).The three enhancers previously shown to regulate AID transcrip-tion in vivo were also linked by PolII long-range interactions inthe analysis (E3-E5, Figure 2B; Crouch et al., 2007; Huonget al., 2013; Sayegh et al., 2003). The Apobec1 promoter anda sixth enhancer located in Apobec1 intron 2 were also clus-tered (Figure 2B). To validate ChIA-PET associations, wedeleted E1 and E2 in CH12 mouse lymphoma cells. We chosethis B cell line because upon activation it transcribes high levelsof AID and undergoes efficient Igm-Iga recombination (Naka-mura et al., 1996). To facilitate homozygous gene targeting,knockout constructs were cotransfected with enhancer-specifictranscription activator-like effector nucleases (TALENs), assem-bled via a solid-phase high-throughput system (Reyon et al.,2012; Figure S4A). Upon activation, wild-type CH12 cellsincreased AID mRNA expression !5-fold and recombined toIgA (15%, Figures 2C and 2D). Deletion of E1 or E2 howevermarkedly reduced AID transcription and IgA expression (Figures2C and 2D), consistent with the notion that the extent ofswitching is proportional to AID expression (Takizawa et al.,2008). Transcription of Apobec1 was also impaired in themutant cells, whereas noninteracting Ezh2 and Cd83 geneswere unaffected (Figure 2C). Importantly, E1"/" and E2"/" cellsdisplayed an overall reduction in Nipbl and PolII occupancy atall regulatory domains within the Aicda locus, including theApobec1 promoter (Figure 2E and S4B). In contrast, this effectwas not observed at the Foxj2-Necap1 locus, !190 kb down-stream of Apobec1 (Figure 2E and S4B). Thus, E1 and E2regulate AID and Apobec1 transcription by controlling localrecruitment of PolII.To further validate the ChIA-PET results, we targeted
additional regulatory elements associated with the Pou2af1(OCA-B), and Cd79a genes. We uncovered an intronic enhancer(E3) !15 kb downstream of OCA-B TSS required for transcrip-tional upregulation upon B cell activation but dispensable forbasal transcription in nonstimulated cells (Figure S4C). Thisactivity is consistent with the reported dynamics and signalingrequirements of OCA-B expression during B cell differentiation(Casellas et al., 2002; Qin et al., 1998). A similar analysisconfirmed the presence of enhancer elements that augmentbasal Cd79a transcription (Figure S4D). Additional gene target-ing experiments within the Pim1 oncogene locus are discussedbelow (Figure 5). Taken together, these results demonstratethat at least a fraction of PolII long-range interactions, as definedby ChIA-PET, represent functional promoter-enhancer connec-tions in B lymphocytes.
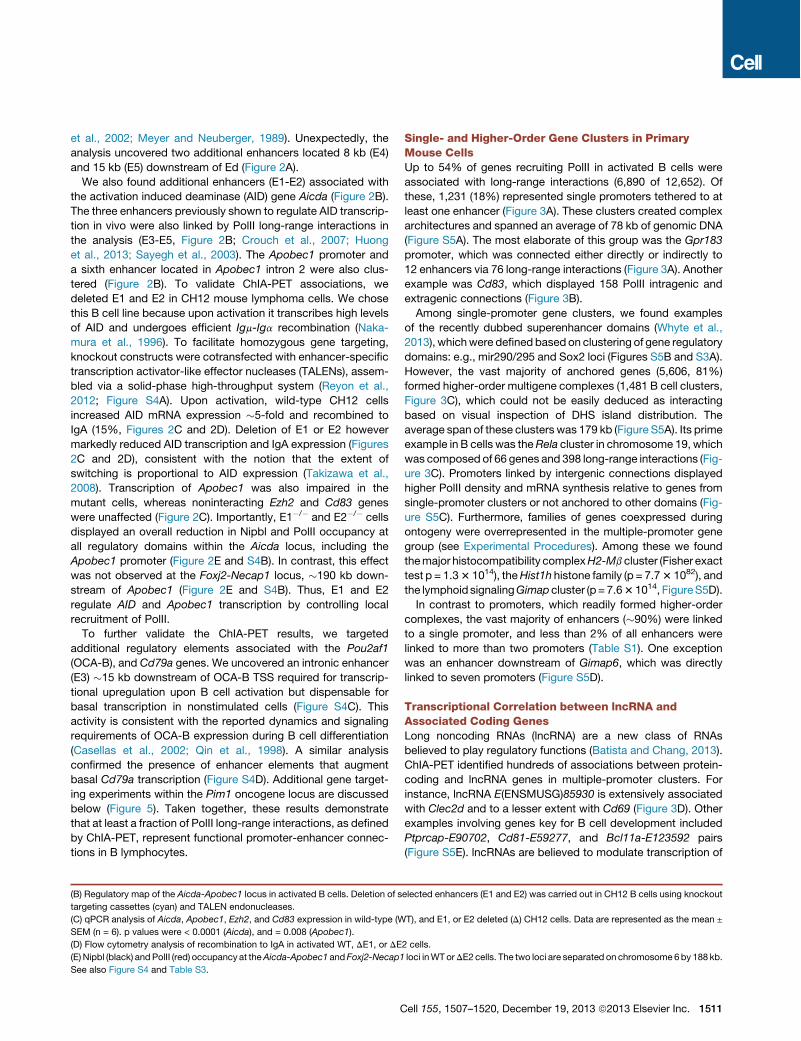
Single- and Higher-Order Gene Clusters in PrimaryMouse CellsUp to 54% of genes recruiting PolII in activated B cells wereassociated with long-range interactions (6,890 of 12,652). Ofthese, 1,231 (18%) represented single promoters tethered to atleast one enhancer (Figure 3A). These clusters created complexarchitectures and spanned an average of 78 kb of genomic DNA(Figure S5A). The most elaborate of this group was the Gpr183promoter, which was connected either directly or indirectly to12 enhancers via 76 long-range interactions (Figure 3A). Anotherexample was Cd83, which displayed 158 PolII intragenic andextragenic connections (Figure 3B).Among single-promoter gene clusters, we found examples
of the recently dubbed superenhancer domains (Whyte et al.,2013), whichwere defined based on clustering of gene regulatorydomains: e.g., mir290/295 and Sox2 loci (Figures S5B and S3A).However, the vast majority of anchored genes (5,606, 81%)formed higher-order multigene complexes (1,481 B cell clusters,Figure 3C), which could not be easily deduced as interactingbased on visual inspection of DHS island distribution. Theaverage span of these clusters was 179 kb (Figure S5A). Its primeexample in B cells was theRela cluster in chromosome 19, whichwas composed of 66 genes and 398 long-range interactions (Fig-ure 3C). Promoters linked by intergenic connections displayedhigher PolII density and mRNA synthesis relative to genes fromsingle-promoter clusters or not anchored to other domains (Fig-ure S5C). Furthermore, families of genes coexpressed duringontogeny were overrepresented in the multiple-promoter genegroup (see Experimental Procedures). Among these we foundthemajor histocompatibility complexH2-Mb cluster (Fisher exacttest p = 1.33 1014), theHist1h histone family (p = 7.73 1082), andthe lymphoid signalingGimapcluster (p= 7.631014, FigureS5D).In contrast to promoters, which readily formed higher-order
complexes, the vast majority of enhancers (!90%) were linkedto a single promoter, and less than 2% of all enhancers werelinked to more than two promoters (Table S1). One exceptionwas an enhancer downstream of Gimap6, which was directlylinked to seven promoters (Figure S5D).
Transcriptional Correlation between lncRNA andAssociated Coding GenesLong noncoding RNAs (lncRNA) are a new class of RNAsbelieved to play regulatory functions (Batista and Chang, 2013).ChIA-PET identified hundreds of associations between protein-coding and lncRNA genes in multiple-promoter clusters. Forinstance, lncRNA E(ENSMUSG)85930 is extensively associatedwith Clec2d and to a lesser extent with Cd69 (Figure 3D). Otherexamples involving genes key for B cell development includedPtprcap-E90702, Cd81-E59277, and Bcl11a-E123592 pairs(Figure S5E). lncRNAs are believed to modulate transcription of
(B) Regulatory map of the Aicda-Apobec1 locus in activated B cells. Deletion of selected enhancers (E1 and E2) was carried out in CH12 B cells using knockout
targeting cassettes (cyan) and TALEN endonucleases.
(C) qPCR analysis of Aicda, Apobec1, Ezh2, and Cd83 expression in wild-type (WT), and E1, or E2 deleted (D) CH12 cells. Data are represented as the mean ±
SEM (n = 6). p values were < 0.0001 (Aicda), and = 0.008 (Apobec1).
(D) Flow cytometry analysis of recombination to IgA in activated WT, DE1, or DE2 cells.
(E) Nipbl (black) andPolII (red) occupancy at theAicda-Apobec1 andFoxj2-Necap1 loci inWTorDE2 cells. The two loci are separated on chromosome 6by 188 kb.
See also Figure S4 and Table S3.
Cell 155, 1507–1520, December 19, 2013 ª2013 Elsevier Inc. 1511

neighboring genes by promoting local topological changes inchromatin (Ponting et al., 2009). Consequently, transcription oflncRNAs and their targeted genes is often coordinated (Guiland Esteller, 2012). To test this idea across the genome wemeasured expression of lncRNAs and their interacting protein-coding genes as defined by ChIA-PET. We found that genesassociated with highly abundant lncRNAs were transcribed athigher levels than those associated with lncRNAs detected atlow or trace levels (p < 0.05, Figure 3E). These findings areconsistent with the proposal that transcription of lincRNAs andtheir targets can be coordinated. Whether the same scenarioapplies to promoter-promoter clusters not involving lncRNAremains to be determined.
Broadly Expressed Genes Are Linked to Cell-Type-Specific EnhancersAs expected, genes differentially expressed in B and ES cellswere linked to tissue-specific regulatory elements. The pluripo-
10Kb
Single-promoter clusters (1,231)
Gpr183 cluster
A
B
E3
E4E5
E6
E7
E9N1
N3
N2
E8
E1E2
E10
E11
E12
N4
N5
P1
Multiple-promoter clusters (1,481)C
E
200
150
100
50
0
TraceLow
High
lncRNA expression
Ass
ocia
ted
gene
ex
pres
sion
(F
PK
M)
P1(39) P2(56) P3(51)E1(10)
chr6:129,107,868-129,284,687
Clec2d Cd69E85930
E2(13) E3(2) E4(6) E5(10) E6(27) E7(24)
D**
***
P39
E13E14
P26
Rela cluster
P11
E4E12
E8E10
E18
E11
E6
E9
E21
E16
E17
E7
P8
P23
P6
P22
P18
N1
N2
N7N6
N3N11
P5
P17
P16P24
P12
P34
P15
P21
P36
P35
P33
P25
P32P9
P10 P30
P19
P31
P38
E6
P20
P5P14
P13 P2P1
P7
P37
P39E2E3E1
P28
P29P27
N4
N5
N8
N9N10
N12
DHS
Interactions
Cd83
P1(59) E5(68)E4(63)E3(84)E2(14)E1(38)
chr13:43,838,238-43,911,499
*
5Kb
Figure 3. Gene Clusters Identified byChIA-PET(A) Single-promoter clusters in activated B cells
connecting 1,231 gene promoters to at least
one enhancer. Right: e.g., the Gpr183 promoter
(blue circle) is linked to 12 enhancers (red circles)
via 76 interactions. PETs anchored outside en-
hancers are represented with gray circles. Circles
are sized according to the absolute number of
anchored PETs.
(B) Interactions at the Cd83 single gene cluster.
(C) Multipromoter clusters (n = 1,481) identified in
B cells. The Rela cluster display 398 interactions
involving 66 genes.
(D) PolII connections between lncRNA E85930,
Clec2d, and Cd69. Promoters and enhancers are
boxed and number of PETs are provided in
parenthesis.
(E) Transcription levels of genes associated with
trace (no detectable FPKM), low (<0.9 FPKM), or
highly transcribed lncRNAs (R0.9 FPKM).
See also Figure S5.
tent gene Sox2 for instance was associ-ated with ES-cell-specific enhancers(Figure S3A). Conversely, the B-cell-spe-cific Cd79b gene was only anchored toenhancers in the B cell compartment(Figure S6A).We next turned our attention to genes
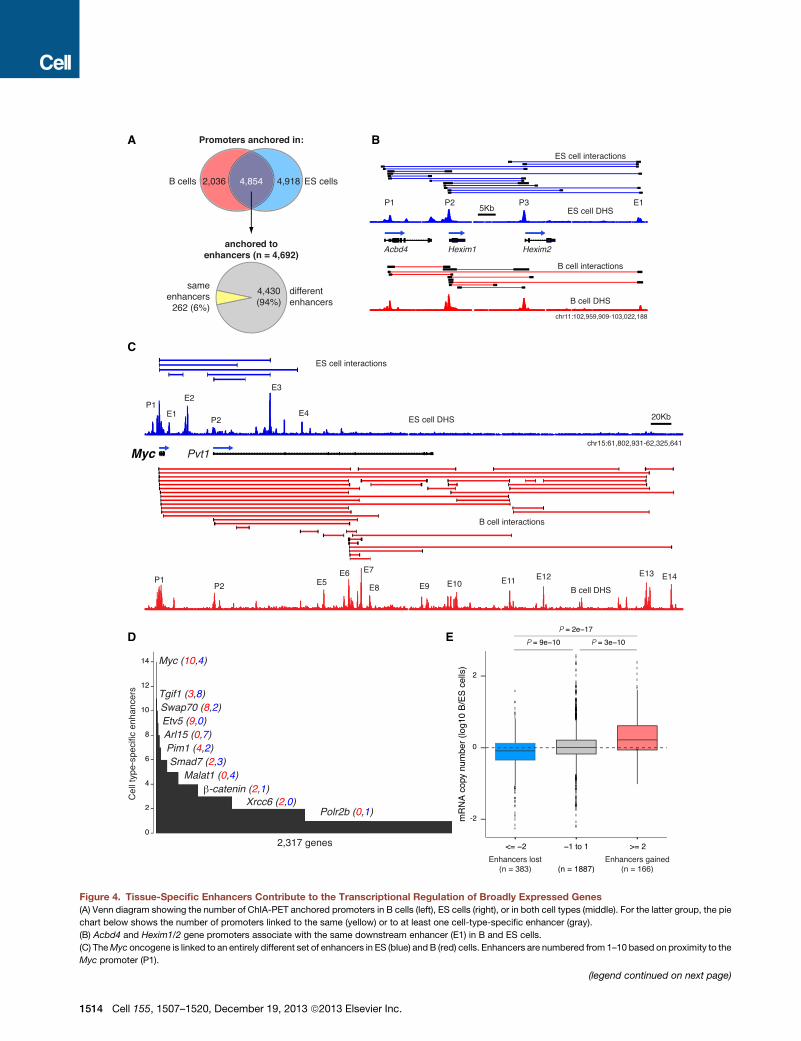
transcribed in both cell types. Of 6,890promoters anchored by ChIA-PET inB cells, 4,854 (70%) were also anchoredin ES cells (Figure 4A, Venn diagram). Asan example, the Hexim1-2 genes werelinked to the same downstream enhancer(E1) in B and ES cells (Figure 4B). Surpris-ingly, most anchored promoters in thetwo cell types (4,430, 94%) were associ-ated with at least one additional tissue-specific enhancer (Figure 4A, lower pie
chart). A striking example was the Myc proto-oncogene, whichdisplayed a completely different enhancer landscape in ES andB cells (Figure 4C). In B cells, Myc was linked to ten enhancers(E5-E14) located near or downstream of exon 3 of the lncRNAPvt1, whereas in ES cells all enhancers associated with Myc(E1-E4) were found upstream of this site (Figure 4C). Other ex-amples included Tgif1, Smad7, and Malat1, which were prefer-entially linked to ES-cell-specific enhancers, whereas Swap70,Etv5, and Pim1 were tethered to a greater number of enhancersin B lymphocytes (Figure 4D).To explore whether changes in the enhancer landscape
impacts transcription of this gene group, we measured theirexpression by calculating mRNA copy numbers per cell. Genesthat turned on or off a single tissue-specific enhancer displayedlittle or no changes in transcription levels in the two cell types(Figure 4E). However, as genes interacted with two or more addi-tional enhancers their expression was significantly different (p <93 1010, Figure 4E).Myc, for instance, was transcribed!4 times
1512 Cell 155, 1507–1520, December 19, 2013 ª2013 Elsevier Inc.

higher in B cells than in ES cells (Table S2). This observation isconsistent with the notion that, in general, transcription levelsof a given promoter are commensurate with the number of reg-ulatory domains it is regulated by (Li et al., 2012). On the basisof these findings we conclude that (1) broadly expressed genescan be regulated by cell-type-specific enhancers and (2) theturning on and off of enhancers during ontogeny impacts tran-scription levels.
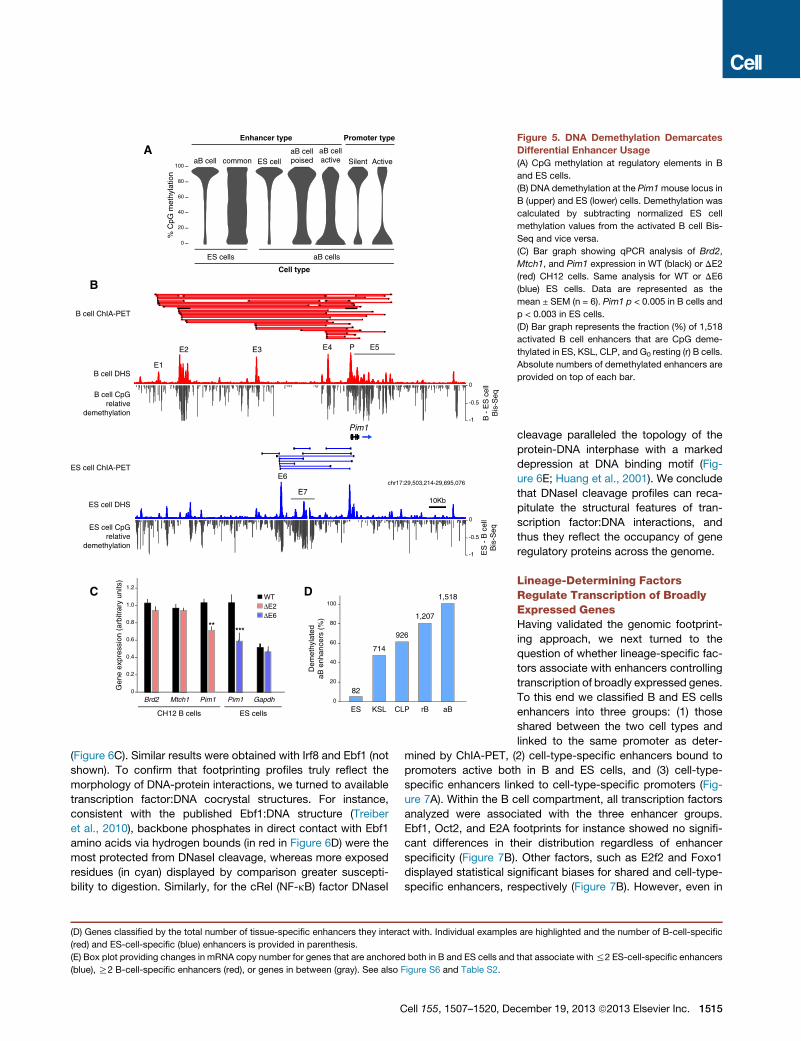
Dynamic CpG Methylation of Cell-Type-SpecificRegulatory DomainsCellular differentiation is accompanied by changes in DNAmethylation at promoters and distal regulatory domains (Shenet al., 2013; Song et al., 2013; Stadler et al., 2011; Ziller et al.,2013). To explore whether the dynamics of DNA methylationcorrelate with differential enhancer usage, we applied bisulphitesequencing (Bis-Seq) and generated methylome libraries atsingle-nucleotide resolution. Bis-Seq of activated B cells pro-vided a total of 148 billion mappable methylome bases.We com-plemented this data set with Bis-Seq libraries from mouse EScells (Stadler et al., 2011) and calculated the percentage ofCpG methylation at gene regulatory domains. With few excep-tions, activated B-cell-specific enhancers were highly methyl-ated in ES cells (>80% of CpGs), whereas enhancers commonto both cell types displayed a broad range of CpG methylationlevels (Figure 5A). High methylation was also observed at EScell-specific enhancers in activated lymphocytes, whereas Bcell enhancers displayed low methylation levels (Figure 5A).Importantly, the level of CpG methylation was lower at activethan at poised enhancers (p < 33 1016, Figure 5A). As expected,promoters of silent genes displayed on average higher CpGmethylation than active ones (p < 2.23 1016, Figure 5A). Methyl-ation levels were also inversely proportional to the extent ofChIA-PET signals (Figure S6B). Thus, enhancers are highlymethylated when inactive, but become demethylated duringdevelopment concomitant with the presence of tissue-specificPolII interactions.We explore in Figure 5B transcriptional regulation of the Pim1
oncogene, whose promoter is tethered to an entirely different setof enhancers in activated B cells and ES cells. The analysisshows a direct correlation between CpG demethylation andenhancer usage. For instance, B cell enhancers E2 and E5 andES cell enhancers E6 and E7 display nearly complete CpGdemethylation in a cell-type-specific manner (Figure 5B). Toconfirm that these enhancers truly promote Pim1 transcription,we targeted E2 and E6 in CH12 B cells and ES cells, respectively.As measured by qPCR, we found a significant decrease in Pim1mRNA levels in the targeted cells, whereas expression of Brd2,Mtch1, and Gapdh was unaffected (Figure 5C). Attempts todelete E2 and E6 in the cell type where they are inactive wereunsuccessful (not shown), likely due to the inability of TALENsto target methylated DNA (Bultmann et al., 2012).In ES cells, B-cell-specific enhancers, including those linked to
broadly expressed genes, were hypermethylated (Figure S6C).To examine at which stage during B lymphopoiesis theseregulatory elements become demethylated, we generatedmeth-ylome libraries from bone marrow hematopoietic stem cells(KSL), B lymphoid precursors (CLP), and peripheral G0 resting
B cells. Of 1,518 B-cell-specific enhancers that were linked bylong-range interactions and hypomethylated during activation,only 82 (5%) were also hypomethylated in ES cells (Figure 5D).However, in KSL precursors nearly half (714, 47%) of activatedB cell enhancers were already demethylated (Figure 5D). Thisgroup included Pim1 enhancers E2, E3, and E5, which displayednearly identical CpG methylation levels in KSL, CLP, G0 resting,and cycling B cells (Figure S6D). As KSLs develop into CLP B cellprecursors, demethylation was observed in 61% (926) of B cellenhancers. In resting G0 B cells, this number increased to 80%(1,207, Figure 5D). At this stage of development, the overallmean methylation was comparable between activated B cellenhancers and those functional both in B and ES cells (Fig-ure S6C). Thus, most activated B cell enhancers, including thoseassociated with broadly expressed genes, are demethylated bythe time naive lymphocytes migrate from the bone marrow to theperiphery. This finding is consistent with the notion that thegenome of G0 lymphocytes is primed for activation and thatmost genes expressed during the humoral immune responseare transcribed at basal levels in the naive compartment (Kou-zine et al., 2013; Nie et al., 2012). At the same time, it is importantto point out that !20% of activated B cell enhancers do notbecome fully demethylated until activation occurs. Among these,we find Pim1 E4 and Aicda E3 and E4 (Figures S6D and S6E).
Digital Genomic Footprinting Characterizes TF Bindingin the Mouse GenomeThe observation that cell-type-specific enhancers can promotetranscription of broadly expressed genes implies that factorsdriving lineage specification are involved in this regulation. Toexplore this idea, we sought to comprehensively catalog tran-scription factor occupancy in mouse B lymphocytes and EScells. To this end, we took advantage of the fact that transcriptionfactors protect their binding sites from DNaseI cleavage, leavingnucleotide-resolution footprints within DHS islands (Neph et al.,2012). Figure 6A, for instance, shows four DNaseI footprints atthe Pold4 gene promoter in G0 and cycling B cells. Importantly,these footprints overlap with recognizable binding motifs fortranscription factors PU.1, Ebf1, Egr1, and Sp1 (Figure 6A). Byapplying an established algorithm (Baek et al., 2012), we de-tected 706,669 high-confidence (FDR < 5%) footprints within75,917 B cell DHS domains (70% of total DHS). To link thesefootprints to known transcription factor recognition sequences,we examined all empirically defined DNA binding motifs,compiled by HOMER, UniPROBE, JASPAR, and similar data-bases. We found a significant enrichment in transcription factorbinding motifs within DHS footprints (p < 1 3 106, Figure S7A).Altogether, we linked 247 distinct transcription factor DNAmotifs to 122,505 footprints in B cells (Table S1). In addition,de novo motif discovery yielded 18 new binding sites that didnot match known recognition sequences (Table S1). A similaranalysis linked 306 DNA motifs to 346,284 footprints in ES cells(Table S1).Figure 6B shows examples of cleavage profiles for tran-
scription factors Irf8, Sp1, Nrf1, PU.1, and CTCF (an extendedview of footprints is provided in Figure S7B). Importantly, ChIP-seq analysis showed a correlation between PU.1 and CTCFoccupancy, their DNA binding motifs, and cognate footprints
Cell 155, 1507–1520, December 19, 2013 ª2013 Elsevier Inc. 1513
A B
C
D E
Figure 4. Tissue-Specific Enhancers Contribute to the Transcriptional Regulation of Broadly Expressed Genes(A) Venn diagram showing the number of ChIA-PET anchored promoters in B cells (left), ES cells (right), or in both cell types (middle). For the latter group, the pie
chart below shows the number of promoters linked to the same (yellow) or to at least one cell-type-specific enhancer (gray).
(B) Acbd4 and Hexim1/2 gene promoters associate with the same downstream enhancer (E1) in B and ES cells.
(C) TheMyc oncogene is linked to an entirely different set of enhancers in ES (blue) and B (red) cells. Enhancers are numbered from 1–10 based on proximity to the
Myc promoter (P1).
(legend continued on next page)
1514 Cell 155, 1507–1520, December 19, 2013 ª2013 Elsevier Inc.
(Figure 6C). Similar results were obtained with Irf8 and Ebf1 (notshown). To confirm that footprinting profiles truly reflect themorphology of DNA-protein interactions, we turned to availabletranscription factor:DNA cocrystal structures. For instance,consistent with the published Ebf1:DNA structure (Treiberet al., 2010), backbone phosphates in direct contact with Ebf1amino acids via hydrogen bounds (in red in Figure 6D) were themost protected from DNaseI cleavage, whereas more exposedresidues (in cyan) displayed by comparison greater suscepti-bility to digestion. Similarly, for the cRel (NF-kB) factor DNaseI
(D) Genes classified by the total number of tissue-specific enhancers they interact with. Individual examples are highlighted and the number of B-cell-specific
(red) and ES-cell-specific (blue) enhancers is provided in parenthesis.
(E) Box plot providing changes in mRNA copy number for genes that are anchored both in B and ES cells and that associate with%2 ES-cell-specific enhancers
(blue), R2 B-cell-specific enhancers (red), or genes in between (gray). See also Figure S6 and Table S2.
B cell DHS
ES cell DHS
B cell CpGrelative
demethylation
ES cell CpGrelative
demethylation
E7
E4 E5E2 E3 P
E1
E6
Pim1
B cell ChIA-PET
ES cell ChIA-PET
A
aB cellsES cells
Enhancer type
% C
pG m
ethy
latio
n
20
40
60
80
100
0
aB cell ES cellcommonaB cellpoised
aB cellactive
Cell type
Promoter type
Silent Active
B
C
Gen
e ex
pres
sion
(ar
bitr
ary
units
)
WT
0.8
0.6
0.4
0.2
0
!E2
1.2
1.0
Pim1
***
Brd2 Mtch1 Pim1
**
Gapdh
!E6
CH12 B cells ES cells
D
Dem
ethy
late
daB
enh
ance
rs (
%)
60
40
20
0
80
100
ES
82
KSL
714
CLP
926
rB
1,207
aB
1,518
chr17:29,503,214-29,695,076
10Kb
0
-0.5
-1
0
-0.5
-1
B -
ES
cel
lB
is-S
eqE
S -
B c
ell
Bis
-Seq
Figure 5. DNA Demethylation DemarcatesDifferential Enhancer Usage(A) CpG methylation at regulatory elements in B
and ES cells.
(B) DNA demethylation at the Pim1mouse locus in
B (upper) and ES (lower) cells. Demethylation was
calculated by subtracting normalized ES cell
methylation values from the activated B cell Bis-
Seq and vice versa.
(C) Bar graph showing qPCR analysis of Brd2,
Mtch1, and Pim1 expression in WT (black) or DE2
(red) CH12 cells. Same analysis for WT or DE6
(blue) ES cells. Data are represented as the
mean ± SEM (n = 6). Pim1 p < 0.005 in B cells and
p < 0.003 in ES cells.
(D) Bar graph represents the fraction (%) of 1,518
activated B cell enhancers that are CpG deme-
thylated in ES, KSL, CLP, and G0 resting (r) B cells.
Absolute numbers of demethylated enhancers are
provided on top of each bar.
cleavage paralleled the topology of theprotein-DNA interphase with a markeddepression at DNA binding motif (Fig-ure 6E; Huang et al., 2001). We concludethat DNaseI cleavage profiles can reca-pitulate the structural features of tran-scription factor:DNA interactions, andthus they reflect the occupancy of generegulatory proteins across the genome.
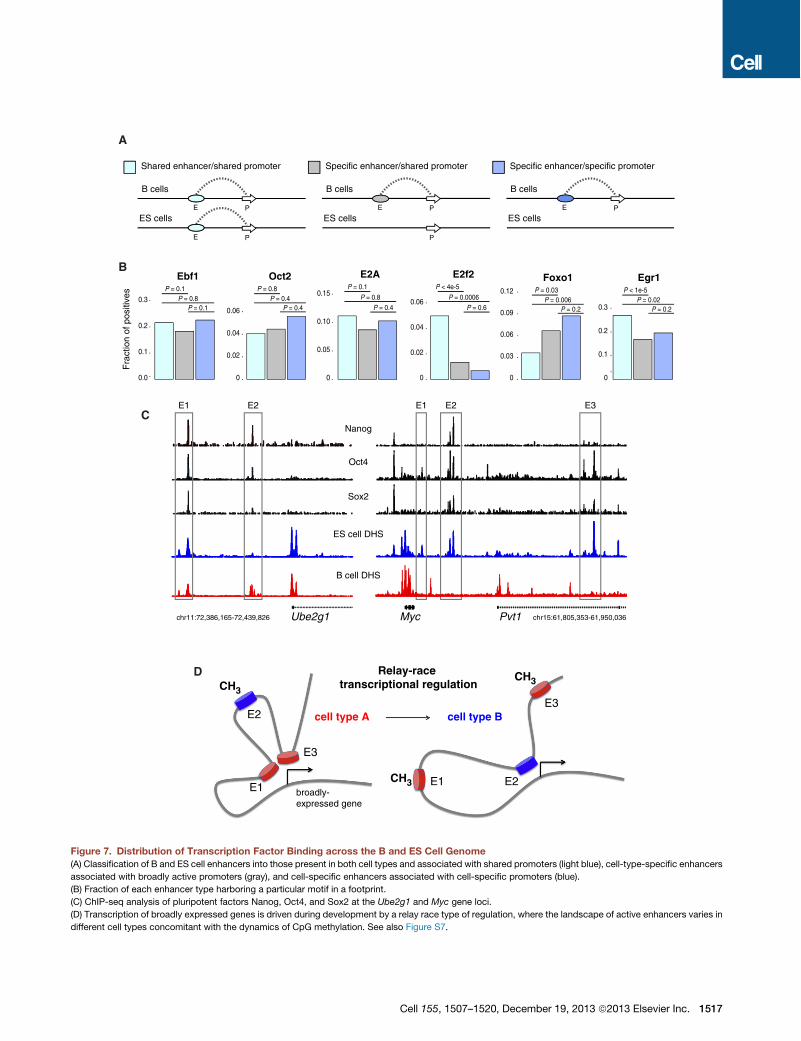
Lineage-Determining FactorsRegulate Transcription of BroadlyExpressed GenesHaving validated the genomic footprint-ing approach, we next turned to thequestion of whether lineage-specific fac-tors associate with enhancers controllingtranscription of broadly expressed genes.To this end we classified B and ES cellsenhancers into three groups: (1) thoseshared between the two cell types andlinked to the same promoter as deter-
mined by ChIA-PET, (2) cell-type-specific enhancers bound topromoters active both in B and ES cells, and (3) cell-type-specific enhancers linked to cell-type-specific promoters (Fig-ure 7A). Within the B cell compartment, all transcription factorsanalyzed were associated with the three enhancer groups.Ebf1, Oct2, and E2A footprints for instance showed no signifi-cant differences in their distribution regardless of enhancerspecificity (Figure 7B). Other factors, such as E2f2 and Foxo1displayed statistical significant biases for shared and cell-type-specific enhancers, respectively (Figure 7B). However, even in
Cell 155, 1507–1520, December 19, 2013 ª2013 Elsevier Inc. 1515

these cases, footprints were not excluded from any enhancergroup. A similar distribution was observed in ES cells (Fig-ure S7C). Thus, lineage specification factors associate bothwith tissue-specific and broadly active enhancers. Confirming
this finding, ChIP-seq analysis of the pluripotent factors Nanog,Oct4, and Sox2 showed occupancy of B and ES cell sharedenhancers at theUbe2g1 locus aswell as binding to ES-cell-spe-cific enhancers at theMyc locus (Figure 7C). A global analysis of
Irf8
3.5
n = 4,435
1.5
3.0
2.5
2.0
1.0
0.5
B
Cle
avag
e co
unts
G0
Sp1
n = 29,119
Cle
avag
e co
unts
EBF1
Cle
avag
e co
unts
n = 5,700
4
1
3
2
0
D E
n = 1,834
Cle
avag
e co
unts 4
1
3
2
0
PU.1
4
3.5
1.5
3.0
2.5
2.0
1.0
Nrf1
15
10
5
n = 4,534
PU.1 Ebf1 Egr1 Sp1Pold4
Cycling
DHS
Pold4
A Cchr19:4,227,253-4,236,134
0
20
40
60
PU
.1 R
PK
M
!500 !250 0 250 500Position (bp)
n = 9,854
6
2
5
4
3
1
CTCF
0
50
100
150
200
!500 !250 0 250 500Position (bp)
CT
CF
RP
KM
5
5
4
3
2
1
-50 -500
10 3020 -20 0 20
-20 0 +20 -20 0 +20 -20 0 +20 -20 0 +20position (bp)
position (bp)
5
0 40 50 60
c-Rel (NF-"B)
n = 3,110
Figure 6. Digital Genomic Footprinting(A) Characterization of footprints at the Pold4 promoter in primary resting or cycling CH12 B cells. Transcription factor binding motifs overlapping with each
footprint are shown below the graph (red rectangles). Tracks were configured to display the maximum (light gray) and one standard deviation above the mean
(dark gray).
(B) Examples of footprints overlapping with Irf8, Sp1, Nrf1, PU.1, and CTCF DNA recognition motifs.
(C) Composite of PU.1 and CTCF ChIP-seq (blue data points, upper graphs) and cumulative footprinting (lower graphs) associated with cognate binding motifs
(middle logos) in B cells. The absolute number of motif occurrences is provided. Grey data points represent ChIP-seq signals at footprints not associated with
PU.1 or CTCF motifs.
(D) The cocrystal structure of Ebf1 bound to its DNA ligand is compared to its cognate footprint profile. Motif nucleotides least sensitive to cleavage are depicted in
red; most sensitive residues are depicted in cyan.
(E) Similar analysis as in (D) for the NFkB-cRel dimer.
1516 Cell 155, 1507–1520, December 19, 2013 ª2013 Elsevier Inc.
P = 0.1P = 0.8
P = 0.4
0
0.05
0.10
0.15
E2A
A
B
Fra
ctio
n of
pos
itive
s P = 0.1P = 0.8
P = 0.1
0.0
0.1
0.2
0.3
Ebf1P = 0.8
P = 0.4P = 0.4
0
0.02
0.04
0.06
Oct2P < 4e-5
P = 0.0006P = 0.6
0
0.02
0.04
0.06
E2f2
E P
B cells
ES cells
Specific enhancer/specific promoter
E P
P
B cells
ES cells
Specific enhancer/shared promoter
E P
E P
B cells
ES cells
Shared enhancer/shared promoter
P < 1e-5P = 0.02
P = 0.2
0
0.1
0.2
0.3
Egr1P = 0.03
P = 0.006P = 0.2
0
0.03
0.12
Foxo1
0.09
0.06
CE3
Myc Pvt1 chr15:61,805,353-61,950,036
E2E1
Ube2g1chr11:72,386,165-72,439,826
E2E1
Nanog
Oct4
Sox2
ES cell DHS
B cell DHS
D
cell type A cell type B
E1
E2
E3
E1 E2
E3
CH3
CH3CH3
broadly-expressed gene
Relay-race transcriptional regulation
Figure 7. Distribution of Transcription Factor Binding across the B and ES Cell Genome(A) Classification of B and ES cell enhancers into those present in both cell types and associated with shared promoters (light blue), cell-type-specific enhancers
associated with broadly active promoters (gray), and cell-specific enhancers associated with cell-specific promoters (blue).
(B) Fraction of each enhancer type harboring a particular motif in a footprint.
(C) ChIP-seq analysis of pluripotent factors Nanog, Oct4, and Sox2 at the Ube2g1 and Myc gene loci.
(D) Transcription of broadly expressed genes is driven during development by a relay race type of regulation, where the landscape of active enhancers varies in
different cell types concomitant with the dynamics of CpG methylation. See also Figure S7.
Cell 155, 1507–1520, December 19, 2013 ª2013 Elsevier Inc. 1517
Irf4, Irf8, Pu.1, Ebf1, and Stat6 ChIP-seq from B cells alsocorroborated the results (data not shown). We conclude thattranscription factors driving lineage specification associatewith regulatory elements of broadly expressed genes. We pointout that the functional significance of TF recruitment as definedby digital footprinting remains to be empirically determined. Atthe same time, our findings are consistent with the notion thatbroadly expressed genes can be regulated in a tissue-specificmanner.
DISCUSSION
We have here characterized the first interactomes of gene regu-latory domains in primary cells. The data provide a wealth ofinformation from the mouse genome with thousands of pro-moter-enhancer pairs. Even for loci that have been extensivelystudied, the analysis uncovered new connectivities. At the Igklocus, for instance, we identified novel enhancers linked to50Ek, the regulatory domain fromwhich NF-kBwas originally iso-lated 27 years ago (Sen and Baltimore, 1986). ChIA-PET also un-covered three additional enhancers tethered at a long distance(up to 50 kb) to the AID gene promoter; the previously character-ized AID enhancers are all located within 15 kb of the TSS. Thus,one clear advantage of ChIA-PET lies in its ability to identify long-range interactions, even when they leapfrog noninteractinggenes, as is the case for 65% of all enhancers (Table S1). A strik-ing example is apair of giant enhancers linked toPax5byskippingover !250 kb of DNA containing the Zcchc7 gene (Figure S7D).
Like other conformation capturing techniques, ChIA-PET doesnot directly address functionality of chromatin interactions. Thiscan only be determined empirically by other means. Typically,enhancer activity is defined by luciferase-based plasmids orLacZ transgenes. However, these experimental approachesonly provide an incomplete view of transcriptional regulationbecause they either lack proper chromatin structure or the influ-ence of neighboring enhancers, insulators, and silencers is nottaken into account. Conversely, genome editing provides ameans to measure the impact of enhancer deletion in the phys-iological context. Inmost cases, we found that cognate promoteractivity was partially reduced following enhancer ablation, sup-porting the model that the contribution of individual enhancersto gene expression is additive in nature. Examples of this cate-gory were enhancers linked to the Cd79a, Pou2af1, and Pim1.On the other hand, the targeting of AID 50 enhancers E1 or E2nearly entirely abolished AID expression and activity, a resultthat is reminiscent of those obtained upon deletion of AIDenhancers E3 and E5 in BAC transgenic mice (Crouch et al.,2007; Huong et al., 2013), or by interference with E4 activity inprimary B cells (Sayegh et al., 2003). Thus, rather than workingin additive fashion, AID gene regulatory elements seem to syner-gize or act as a cooperative unit. Conceivably, the local topologyof the Aicda-Apobec1 locus requires activation of all enhancersfor optimal transcription to occur. This strategy may be useful forgenes that require tight regulation as AID, whose expression isstrictly limited to activated B cells to minimize its well knowntumorigenic activity (Casellas et al., 2009). Consistent with thismodel, our methylome analysis indicates that the AID locus isnot completely demethylated until B cells are activated.
A direct comparison between the B and ES cell interactomesrevealed that up to 95% of genes anchored in both cell typesare associated with at least one tissue-specific enhancer.Transcription modularity, the mechanism whereby genes accu-mulate regulatory elements during ontogeny, is a well-describedphenomenon that controls the spatiotemporal expression ofdevelopmental genes (Davidson, 2001; Visel et al., 2007). Forinstance, the cardiac homeobox gene Nkx2-5 is targeted to spe-cific subregions of the developing heart by turning on additionalcis-regulatory domains over time (Schwartz and Olson, 1999).Similarly, expression of the human apolipoprotein E gene is trig-gered in hepatocytes and astrocytes by enhancers only active inthose tissues (Grehan et al., 2001). Our studies demonstrate thatthe turning on and off of enhancers is not a singularity of devel-opmental gene loci. Instead, it is a widespread mechanism thatregulates broadly expressed genes involved in basic cellularfunctions, such as cell-cycle initiation (Myc), signal transduction(b-catenin), and cellular motility (Malat1).Mechanistically, we show that the changing enhancer land-
scape in mammalian development results from the unbiasedrecruitment of lineage-determining factors, which associatewith enhancers anchored not only to tissue-specific promotersbut also to constitutively active ones. Based on these observa-tions we propose a ‘‘relay race’’ model of transcriptional regula-tion, whereby broadly active genes make use of tissue-specificcis-regulatory elements and transcription factors as cells prog-ress through development (Figure 7D). For genes that onlyreplace a subset of their regulatory domains, transcription isroughly maintained at comparable levels in different cell types.However, as the number of connected enhancers fluctuatesconsiderably, promoter activity can be significantly altered.We can think of at least two reasons why higher organisms
modulate the enhancer landscape of broadly expressed genes.First, as aforementioned, it enables fine-tuning of protein output,which in turns controls protein activity. Second, it places basiccellular functions under the control of tissue-specific factors. Inthe B cell compartment, these strategies are perhaps best illus-trated during the immune response to invading pathogens. Inthis microenvironment B lymphocytes move rapidly from a G0,quiescent state to one of the fastest proliferative rates amongeukaryotic cells (Liu et al., 1991). Key in this process isMycwhich,along with TFIIH, triggers a!10-fold amplification of the lympho-cyte transcriptome concomitant with cell-cycle entry (Kouzineet al., 2013; Nie et al., 2012). Thus, vis-a-vis proliferation B cellsdiffer substantially from continuously dividing ES cells, in thatthey must rapidly engage a burst of Myc expression and activityduring the immune response tocopewith fast dividingpathogens.Our studies imply that this unique response ismediated, at least inpart, by the large number of cis- and trans-responsive elementsthat associate with theMyc promoter in the B cell compartment.
EXPERIMENTAL PROCEDURES
Cell Isolation and CultureHematopoietic stem cells were isolated from the bone marrow of 25 6-week-
old C57BL6 mice (Jackson Laboratory). Cells were purified following Ema
et al.’s protocol (PMID: 17406558). KSL (KIT+, SCA1+, Lin-, IL-7R-) and CLP
(KIT+, SCA1+, Lin-, IL-7R+) cells were sorted using MoFlo Legacy (Beckman
Coulter) and BD FACSAria III. Resting splenic B cells were isolated from
1518 Cell 155, 1507–1520, December 19, 2013 ª2013 Elsevier Inc.
6- to 8-week-old wild-type C57BL6/J mice with anti-CD43 Microbeads (anti-
Ly48; Miltenyi Biotech) and were activated for 48-60 hr with LPS (50 mg/ml;
Sigma), IL-4 (5 ng/ml; Sigma) and 0.5 mg/ml of anti-CD180 (RP105) antibody
(RP/14, BD PharMingen). E14 tg2A mouse embryonic stem cells were main-
tained as described in (PMID:18555785). Switchable IgM+/IgA+ murine
CH12-F3 Ly-1+ B cell lymphoma line was maintained and passaged every
2 days in RPMI 1640 supplemented with 10% FBS (ATCC), 1% penicillin/
streptomycin (Invitrogen), 55 mM 2-b mercaptoethanol (Invitrogen). All cells
were maintained at 37#C and 5% CO2 in a humidified incubator.
ACCESSION NUMBERS
The Short Read Archive Project Number for the ChIP-seq data in activated B
cells (other than CTCF) and CH12 cells, DHS-seq in activated B cells, RNA-
seq, whole genome methylation (other than ES cells), and ChIA-PET data
reported in this paper is SRP029721.
SUPPLEMENTAL INFORMATION
Supplemental Information includes Extended Experimental Procedures, seven
figures, and three tables and can be found with this article online at http://dx.
doi.org/10.1016/j.cell.2013.11.039.
ACKNOWLEDGMENTS
We thank Kefei Yu for CH12 cells and protocols; J. Simone and J. Lay for cell
sorting; G. Gutierrez for technical assistance with Illumina analyzer. This work
was supported by the Intramural Research Program of NIAMS and NCI, and
internal Jackson Laboratory fund JAX19020120 to Y.R. J.K.J. was supported
by NIH grants DP1 GM105378 and P50 HG005550, the Defense Advanced
Research Projects Agency grant W911NF-11-2-0056 and The Jim and Ann
Orr Massachusetts General Hospital Research Scholar Award. J.Q. was
supported by the NIH UGSP program. All animal experiments were performed
according to NIH guidelines. High-performance computation was performed
using NIH Helix Systems (http://helix.nih.gov). J.K.J. has a financial interest
in Transposagen Biopharmaceuticals. J.K.J.’s interests were reviewed and
are managed by Massachusetts General Hospital and Partners HealthCare
in accordance with their conflict of interest policies.
Received: September 11, 2013
Revised: November 1, 2013
Accepted: November 25, 2013
Published: December 19, 2013
REFERENCES
Baek, S., Sung,M.H., and Hager, G.L. (2012). Quantitative analysis of genome-
wide chromatin remodeling. Methods Mol. Biol. 833, 433–441.
Batista, P.J., and Chang, H.Y. (2013). Long noncoding RNAs: cellular address
codes in development and disease. Cell 152, 1298–1307.
Buecker, C., and Wysocka, J. (2012). Enhancers as information integration
hubs in development: lessons from genomics. Trends Genet. 28, 276–284.
Bultmann, S., Morbitzer, R., Schmidt, C.S., Thanisch, K., Spada, F., Elsaesser,
J., Lahaye, T., and Leonhardt, H. (2012). Targeted transcriptional activation of
silent oct4 pluripotency gene by combining designer TALEs and inhibition of
epigenetic modifiers. Nucleic Acids Res. 40, 5368–5377.
Casellas, R., Jankovic, M., Meyer, G., Gazumyan, A., Luo, Y., Roeder, R.,
and Nussenzweig, M. (2002). OcaB is required for normal transcription and
V(D)J recombination of a subset of immunoglobulin kappa genes. Cell 110,
575–585.
Casellas, R., Yamane, A., Kovalchuk, A.L., and Potter, M. (2009). Restricting
activation-induced cytidine deaminase tumorigenic activity in B lymphocytes.
Immunology 126, 316–328.
Chen, X., Xu, H., Yuan, P., Fang, F., Huss,M., Vega, V.B.,Wong, E., Orlov, Y.L.,
Zhang, W., Jiang, J., et al. (2008). Integration of external signaling pathways
with the core transcriptional network in embryonic stem cells. Cell 133,
1106–1117.
Creyghton, M.P., Cheng, A.W., Welstead, G.G., Kooistra, T., Carey, B.W.,
Steine, E.J., Hanna, J., Lodato, M.A., Frampton, G.M., Sharp, P.A., et al.
(2010). Histone H3K27ac separates active from poised enhancers and pre-
dicts developmental state. Proc. Natl. Acad. Sci. USA 107, 21931–21936.
Crouch, E.E., Li, Z., Takizawa, M., Fichtner-Feigl, S., Gourzi, P., Montano, C.,
Feigenbaum, L., Wilson, P., Janz, S., Papavasiliou, F.N., and Casellas, R.
(2007). Regulation of AID expression in the immune response. J. Exp. Med.
204, 1145–1156.
Davidson, E.H. (2001). Genomic regulatory systems: development and evolu-
tion (San Diego: Academic Press).
ENCODE Project Consortium, Bernstein, B.E., Birney, E., Dunham, I., Green,
E.D., Gunter, C., and Snyder, M. (2012). An integrated encyclopedia of DNA
elements in the human genome. Nature 489, 57–74.
Fullwood,M.J., Liu, M.H., Pan, Y.F., Liu, J., Xu, H., Mohamed, Y.B., Orlov, Y.L.,
Velkov, S., Ho, A., Mei, P.H., et al. (2009). An oestrogen-receptor-alpha-bound
human chromatin interactome. Nature 462, 58–64.
Grehan, S., Tse, E., and Taylor, J.M. (2001). Two distal downstream enhancers
direct expression of the human apolipoprotein E gene to astrocytes in the
brain. J. Neurosci. 21, 812–822.
Guil, S., and Esteller, M. (2012). Cis-acting noncoding RNAs: friends and foes.
Nat. Struct. Mol. Biol. 19, 1068–1075.
Heintzman, N.D., Stuart, R.K., Hon, G., Fu, Y., Ching, C.W., Hawkins, R.D.,
Barrera, L.O., Van Calcar, S., Qu, C., Ching, K.A., et al. (2007). Distinct and pre-
dictive chromatin signatures of transcriptional promoters and enhancers in the
human genome. Nat. Genet. 39, 311–318.
Huang, D.B., Chen, Y.Q., Ruetsche, M., Phelps, C.B., and Ghosh, G. (2001).
X-ray crystal structure of proto-oncogene product c-Rel bound to the CD28
response element of IL-2. Structure 9, 669–678.
Huong, T., Kobayashi, M., Nakata, M., Shioi, G., Miyachi, H., Honjo, T., and
Nagaoka, H. (2013). In vivo analysis of Aicda gene regulation: a critical balance
between upstream enhancers and intronic silencers governs appropriate
expression. PLoS ONE 8, e61433.
Kagey, M.H., Newman, J.J., Bilodeau, S., Zhan, Y., Orlando, D.A., van Ber-
kum, N.L., Ebmeier, C.C., Goossens, J., Rahl, P.B., Levine, S.S., et al.
(2010). Mediator and cohesin connect gene expression and chromatin archi-
tecture. Nature 467, 430–435.
Kouzine, F., Wojtowicz, D., Yamane, A., Resch, W., Kieffer-Kwon, K.-R., Ban-
dle, R., Nelson, S., Nakahashi, H., Awasthi, P., Feigenbaum, L., et al. (2013).
Global regulation of promotermelting in naive lymphocytes. Cell 153, 988–999.
Krivega, I., and Dean, A. (2012). Enhancer and promoter interactions-long
distance calls. Curr. Opin. Genet. Dev. 22, 79–85.
Kuchen, S., Resch, W., Yamane, A., Kuo, N., Li, Z., Chakraborty, T., Wei, L.,
Laurence, A., Yasuda, T., Peng, S., et al. (2010). Regulation of microRNA
expression and abundance during lymphopoiesis. Immunity 32, 828–839.
Li, G., Ruan, X., Auerbach, R.K., Sandhu, K.S., Zheng, M., Wang, P., Poh,
H.M., Goh, Y., Lim, J., Zhang, J., et al. (2012). Extensive promoter-centered
chromatin interactions provide a topological basis for transcription regulation.
Cell 148, 84–98.
Liu, Y.J., Zhang, J., Lane, P.J., Chan, E.Y., andMacLennan, I.C. (1991). Sites of
specific B cell activation in primary and secondary responses to T cell-depen-
dent and T cell-independent antigens. Eur. J. Immunol. 21, 2951–2962.
Liu, Z.M., George-Raizen, J.B., Li, S., Meyers, K.C., Chang, M.Y., and Garrard,
W.T. (2002). Chromatin structural analyses of the mouse Igkappa gene locus
reveal new hypersensitive sites specifying a transcriptional silencer and
enhancer. J. Biol. Chem. 277, 32640–32649.
Meyer, K.B., and Neuberger, M.S. (1989). The immunoglobulin kappa locus
contains a second, stronger B-cell-specific enhancer which is located down-
stream of the constant region. EMBO J. 8, 1959–1964.
Nakamura, M., Kondo, S., Sugai, M., Nazarea, M., Imamura, S., and Honjo, T.
(1996). High frequency class switching of an IgM+ B lymphoma clone CH12F3
to IgA+ cells. Int. Immunol. 8, 193–201.
Cell 155, 1507–1520, December 19, 2013 ª2013 Elsevier Inc. 1519
Neph, S., Vierstra, J., Stergachis, A.B., Reynolds, A.P., Haugen, E., Vernot, B.,
Thurman, R.E., John, S., Sandstrom, R., Johnson, A.K., et al. (2012). An expan-
sive human regulatory lexicon encoded in transcription factor footprints.
Nature 489, 83–90.
Nie, Z., Hu, G., Wei, G., Cui, K., Yamane, A., Resch, W., Wang, R., Green, D.R.,
Tessarollo, L., Casellas, R., et al. (2012). c-Myc is a universal amplifier of ex-
pressed genes in lymphocytes and embryonic stem cells. Cell 151, 68–79.
Nobrega, M.A., Ovcharenko, I., Afzal, V., and Rubin, E.M. (2003). Scanning
human gene deserts for long-range enhancers. Science 302, 413.
Phillips-Cremins, J.E., Sauria, M.E., Sanyal, A., Gerasimova, T.I., Lajoie, B.R.,
Bell, J.S., Ong, C.T., Hookway, T.A., Guo, C., Sun, Y., et al. (2013). Architec-
tural protein subclasses shape 3D organization of genomes during lineage
commitment. Cell 153, 1281–1295.
Ponting, C.P., Oliver, P.L., and Reik, W. (2009). Evolution and functions of long
noncoding RNAs. Cell 136, 629–641.
Qin, X.F., Reichlin, A., Luo, Y., Roeder, R.G., and Nussenzweig, M.C. (1998).
OCA-B integrates B cell antigen receptor-, CD40L- and IL 4-mediated signals
for the germinal center pathway of B cell development. EMBO J. 17, 5066–
5075.
Reyon, D., Tsai, S.Q., Khayter, C., Foden, J.A., Sander, J.D., and Joung, J.K.
(2012). FLASH assembly of TALENs for high-throughput genome editing. Nat.
Biotechnol. 30, 460–465.
Sabo, P.J., Kuehn, M.S., Thurman, R., Johnson, B.E., Johnson, E.M., Cao, H.,
Yu, M., Rosenzweig, E., Goldy, J., Haydock, A., et al. (2006). Genome-scale
mapping of DNase I sensitivity in vivo using tiling DNA microarrays. Nat.
Methods 3, 511–518.
Sayegh, C.E., Quong, M.W., Agata, Y., and Murre, C. (2003). E-proteins
directly regulate expression of activation-induced deaminase in mature B
cells. Nat. Immunol. 4, 586–593.
Schwartz, R.J., and Olson, E.N. (1999). Building the heart piece by piece:
modularity of cis-elements regulating Nkx2-5 transcription. Development
126, 4187–4192.
Sen, R., and Baltimore, D. (1986). Multiple nuclear factors interact with the
immunoglobulin enhancer sequences. Cell 46, 705–716.
Shen, L., Wu, H., Diep, D., Yamaguchi, S., D’Alessio, A.C., Fung, H.L., Zhang,
K., and Zhang, Y. (2013). Genome-wide analysis reveals TET- and TDG-
dependent 5-methylcytosine oxidation dynamics. Cell 153, 692–706.
Song, C.X., Szulwach, K.E., Dai, Q., Fu, Y., Mao, S.Q., Lin, L., Street, C., Li, Y.,
Poidevin, M., Wu, H., et al. (2013). Genome-wide profiling of 5-formylcytosine
reveals its roles in epigenetic priming. Cell 153, 678–691.
Stadler, M.B., Murr, R., Burger, L., Ivanek, R., Lienert, F., Scholer, A., van
Nimwegen, E., Wirbelauer, C., Oakeley, E.J., Gaidatzis, D., et al. (2011).
DNA-binding factors shape the mouse methylome at distal regulatory regions.
Nature 480, 490–495.
Takizawa, M., Tolarova, H., Li, Z., Dubois, W., Lim, S., Callen, E., Franco, S.,
Mosaico, M., Feigenbaum, L., Alt, F.W., et al. (2008). AID expression levels
determine the extent of cMyc oncogenic translocations and the incidence of
B cell tumor development. J. Exp. Med. 205, 1949–1957.
Thurman, R.E., Rynes, E., Humbert, R., Vierstra, J., Maurano, M.T., Haugen,
E., Sheffield, N.C., Stergachis, A.B., Wang, H., Vernot, B., et al. (2012). The
accessible chromatin landscape of the human genome. Nature 489, 75–82.
Treiber, N., Treiber, T., Zocher, G., and Grosschedl, R. (2010). Structure of an
Ebf1:DNA complex reveals unusual DNA recognition and structural homology
with Rel proteins. Genes Dev. 24, 2270–2275.
Visel, A., Bristow, J., and Pennacchio, L.A. (2007). Enhancer identification
through comparative genomics. Semin. Cell Dev. Biol. 18, 140–152.
Visel, A., Rubin, E.M., and Pennacchio, L.A. (2009). Genomic views of distant-
acting enhancers. Nature 461, 199–205.
Whyte, W.A., Orlando, D.A., Hnisz, D., Abraham, B.J., Lin, C.Y., Kagey, M.H.,
Rahl, P.B., Lee, T.I., and Young, R.A. (2013). Master transcription factors and
mediator establish super-enhancers at key cell identity genes. Cell 153,
307–319.
Wuerffel, R., Wang, L., Grigera, F., Manis, J., Selsing, E., Perlot, T., Alt, F.W.,
Cogne, M., Pinaud, E., and Kenter, A.L. (2007). S-S synapsis during class
switch recombination is promoted by distantly located transcriptional ele-
ments and activation-induced deaminase. Immunity 27, 711–722.
Xie, W., and Ren, B. (2013). Developmental biology. Enhancing pluripotency
and lineage specification. Science 341, 245–247.
Zhang, J., Poh, H.M., Peh, S.Q., Sia, Y.Y., Li, G., Mulawadi, F.H., Goh, Y., Full-
wood, M.J., Sung, W.K., Ruan, X., and Ruan, Y. (2012). ChIA-PET analysis of
transcriptional chromatin interactions. Methods 58, 289–299.
Ziller, M.J., Gu, H., Muller, F., Donaghey, J., Tsai, L.T., Kohlbacher, O., De
Jager, P.L., Rosen, E.D., Bennett, D.A., Bernstein, B.E., et al. (2013). Charting
a dynamic DNA methylation landscape of the human genome. Nature 500,
477–481.
1520 Cell 155, 1507–1520, December 19, 2013 ª2013 Elsevier Inc.
Supplemental Information
EXTENDED EXPERIMENTAL PROCEDURES
Genome EditingTALENs for specific loci were designed and assembled using protocols described in (Reyon et al., 2012). The donor vectorincluded 500-1500 bp homology arms and a loxP-flanked puromycin-T2A-thymidine kinase cassette to select for targetedclones (Figure S3). Activated B or E14 cells were nucleofected with the donor cassette and the TALEN plasmid pair usingNucleofector Kit V according to the manufacturer’s instructions (Lonza). After 72 hr, limiting dilution was performed in media con-taining 0.5–1 mg/ml puromycin (Sigma) and incubation was continued for 6–8 days. Individual clones were picked and genomicDNA was extracted (Promega). Genotyping was done by nested PCR using locus-specific external and vector internal primers(Table S3) under the following conditions: 98!C for 30 s; 35 3 (98!C for 10 s, 63!C for 30 s, 72!C for 30 s); 72!C for 3 min;hold at 4!C. PCR products were run on 1% agarose gel. Positive clones were expanded and nucleofected with a plasmid express-ing CMV- or EF1a-driven Cre recombinase (Addgene). At 72 hr, limiting dilution was performed in the presence of 0.5–2 mg/mlganciclovir (Sigma) for 6–8 days. Once again, single clones were picked and genotyped by PCR using primers amplifying deletedloci (Figure S3).
qPCRRNA from locus-deleted clones was extracted with RNAqueous-Micro Kit (Ambion). cDNAwas synthesized with SuperScript III First-Strand Synthesis SuperMix (Invitrogen). qPCR samples were mixed with SyBrgreener (Invitrogen) and run on BioRad CFX96. qPCRprimers are listed in Table S3.
ChIP-SeqCultured cells were fixed with 1% formaldehyde (Sigma) for 10’ at 37!C. Fixation was quenched by addition of glycine (Sigma) at afinal concentration of 125 mM. Twenty million fixed cells were washed with PBS and resuspended in 1 ml of RIPA buffer (10 mM Tris[pH 7.6], 1 mM EDTA, 0.1% SDS, 0.1% sodium deoxycholate, 1% Triton X-100, 1 3 Complete Mini EDTA free proteinase inhibitor[Roche]) or stored at "80!C until further processing. Sonication was performed using Covaris S2 sonicator at duty cycle 20%,intensity 5, cycle/burst 200 for 30 min. Five to ten micrograms of anti-NIPBL (Bethyl, A301-779A), anti-p300 (Santa Cruz, SC-584), anti-Med12 (Bethyl, A300-774A), anti-H3K27Ac (Abcam ab4279-100), anti-H2AZ (Abcam, ab4174-100), anti-H3K4me1 (Abcamab8895-50), anti-H3K4me3 (Millipore 04-745), and anti-PU1 (Santa Cruz, SC-352) was incubated with 40 ml of Dynabeads Protein A(or G) for 40 min at room temperature. Antibody-bound beads were added to 500 ml of sonicated chromatin, incubated at 4!C over-night, and washed twice with RIPA buffer, twice with RIPA buffer containing 0.3 M NaCl, twice with LiCl buffer (0.25 M LiCl, 0.5%Igepal-630, 0.5% sodium deoxycholate), once with TE (pH 8) plus 0.2% Triton X-100, and once with TE (pH 8.0). Crosslinkingwas reversed by incubating the beads at 65!C for 4 hr in the presence of 0.3%SDS and 1mg/ml Proteinase K. ChIP DNAwas purifiedby phenol-chloroform extraction followed by ethanol precipitation. DNA was subsequently blunt-ended with End-It DNA end repairkit (Epicenter) and A-tailed with Taq DNA polymerase (Invitrogen) in the presence of 200 mM of dATP for 40 min at 70!C. Sampleswere purified by phenol-chloroform extraction after each reaction. Illumina compatible adaptors (Illumina or Bioo Scientific) were thenligated with T4 DNA ligase (Enzymatics), and the reaction was purified once with AMpure XP magnetic beads (Beckman Coulter).Samples were PCR amplified for 18 cycles with KAPA HiFi DNA polymerase mix (KAPA Biosystems) and run on a 2% agarose geland size-selected at 200–300 bp. Thirty-six or 50 bp of sequencing data (Table S1) were acquired on the Illumina GAII or HiSeq2000(Illumina).
DHS-SeqDigital DNase I mapping was performed as described in reference (Sekimata et al., 2009). Briefly, we pelleted 13 108 B cells, washedthemwith cold PBS and resuspended them in Buffer A (15mMTris-Cl (pH 8.0), 15mMNaCl, 60mMKCl, 1mMEDTA (pH 8.0), 0.5mMEGTA (pH 8.0), 0.5 mM spermidine, 0.15 mM spermine) to a final concentration of 23 106 cells/ml. Nuclei were isolated by dropwiseaddition of an equal volume of Buffer A containing 0.04% NP-40, followed by incubation on ice for 10’. Nuclei were centrifuged at1,000 g for 5 min and then resuspended and washed with 25 ml of cold Buffer A. Nuclei were resuspended in 2 ml of Buffer A ata final concentration of 1 3 107 nuclei/ml. We performed DNase I (Roche, 10–80 U/ml) digests for 30 at 37!C in 2 ml volumes ofDNase I buffer (13.5 mM Tris-HCl pH 8.0, 87 mM NaCl, 54 mM KCl, 6 mM CaCl2, 0.9 mM EDTA, 0.45 mM EGTA, 0.45 mM Spermi-dine). Reactions were terminated by addition of an equal volume (2 ml) of stop buffer (1 M Tris-Cl (pH 8.0), 5 M NaCl, 20% SDS and0.5 M EDTA (pH 8.0), 10 mg/ml RNase A, Roche) and incubated at 55!C. After 15’, we added Proteinase K (25 mg/ml final concen-tration) to each digest reaction and incubated for one hour at 55!C. After DNase I treatment, phenol-chloroform extractions wereperformed. Control (untreated) samples were processed as above except for the omission of DNase I. DNase I double-cut fragmentsand sequencing libraries were constructed as described in the ChIP-seq protocol with the exception of the size-selection of300-400 bp.
RNA-SeqTotal RNA from 106 ES, resting, or activated B cells was isolated by Trizol extraction. To obtain more precise measurements of tran-scription, RNA spike-ins were used by adding 1 ml of 1/10 dilution of Ambion’s ERCC RNA Spike-in Mix (catalog number 4456740) to
Cell 155, 1507–1520, December 19, 2013 ª2013 Elsevier Inc. S1
total RNA. mRNA was then isolated and the standard RNA-Seq library preparation was performed following Illumina’s RNA-Seqprotocol v2.
Bi-SeqGenomic DNA was isolated from 5x10⁶ cells using QIAGEN DNeasy blood and tissue kit. Libraries were prepared following whole-genome bisulfite sequencing for methylation analysis guide from Illumina (15021861_B) with slight modifications. Briefly, 5 mg ofgenomic DNA was sheared and blunt-ended with End-It DNA end repair kit (Epicenter) and A-tailed with Taq DNA polymerase(Invitrogen) in the presence of 200 mM of dATP for 40 min at 70!C. Illumina compatible adaptors (50 P-GATXGGAAGAGXGGTTXAGXAGGAATGXXGAG, 50 AXAXTXTTTXXXTAXAXGAXGXTXTTXXGATXT where X is a methylated cytosine) were then ligated with T4DNA ligase (Enzymatics). Adaptor-ligated DNA of 275-350 bp was isolated by 2% agarose gel electrophoresis, and sodium bisulfiteconversion performed on it using the Epitect Bisulfite kit (QIAGEN). Bisulfite converted DNA was divided in three tubes and PCRamplified for 6 cycles by PfuTurbo Cx hotstart DNA polymerase (Stratagene). The reaction products were purified using the MinElutePCR purification kit (QIAGEN) then separated by 2% agarose gel electrophoresis and purified from the gel using the MinElute gelpurification kit (QIAGEN).
ChIA-PETRNA PolII ChIA-PET was performed as previously described (Fullwood et al., 2009; Goh et al., 2012; Li et al., 2012). Briefly, B or EScells (up to 3x10⁹ cells) were treated with 1% formaldehyde at room temperature for 10 min and then neutralized using 0.2 M glycine.The crosslinked chromatin was subjected to fragmentation with an average length of 300 bp by sonication. The anti-PolII monoclonalantibody 8WG16 (Covance, MMS-126R) was used to enrich PolII-bound chromatin fragments. A portion of ChIP DNA was eluted offfrom antibody-coated beads for concentration quantification using Picogreen fluorimetry and for enrichment analysis using quanti-tative PCR. For ChIA-PET library construction ChIP DNA fragments from two biological replicates were end-repaired using T4 DNApolymerase (NEB) and ligated to either linker A or linker B. Other than four nucleotides in the middle of the linkers that were used asnucleotide barcode, the two linkers share the same nucleotide sequences. After linker ligation, the two samples were combined forproximity ligation in diluted conditions. During the proximity ligation, DNA fragments within the same ChIP complex with the samelinker were ligated, which generated the ligation products with homodimer linker composition. However, chimeric ligations betweenChIP fragments that are bound in different chromatin complexes could also occur, thus producing ligation products with heterodimerlinker composition. These heterodimer linker composition products were used to assess the frequency of nonspecific ligations andwere then removed bioinformatically. As shown in Figure S2A, all heterodimer linker ligations are by definition nonspecific. Becauserandom intermolecular associations in the test tube are expected to be comparable for linkers A and B, the frequency of randomhomo and heterodimer linker ligations must also be equivalent. In our PolII ChIA-PET libraries, only 3.8% of pair-end ligations(PETs) involved heterodimer linkers. Thus, we estimate that less than 5% of total homodimer ligations are nonspecific. Even thoughthis represents but a small number of PETs, we reduced this number even further by discarding singleton PETs. In other words, weonly report PolII long-range interactions when two or more pair-end reads create a PET cluster (Figure S2A). The strategy is basedupon the fact that random heterodimer ligations rarely form PET clusters. In the PolII ChIA-PET libraries for instance, of 487,981 het-erodimer PETs, only 26 PET clusters were obtained. Conversely, 9M homodimer PETs created #15,000 PET clusters. Thus, whilethere are #20 times more homodimer than heterodimer PETs, we obtain #600 times more homodimer than heterodimer PET clus-ters. Following proximity ligation, the Paired-End-Tag (PET) constructs were extracted from the ligation products and the PET tem-plates were subjected to paired-end sequencing using Illumina GAII.
Bioinformatics Software
d ABI Solid whole transcriptome alignment pipeline (WTP) and Bioscope 1.0d BatMis 3.0 (Tennakoon et al., 2012)d Bedtools 2.17.0 (Quinlan and Hall, 2010)d Bowtie 0.12.8 (Langmead et al., 2009)d ChIA-PET Tool (Li et al., 2010)d Cufflinks 2 (Trapnell et al., 2010)d Cytoscape 2.8.2 (Shannon et al., 2003)d DNase2Hotspots (Baek et al., 2012)d Fastqc 0.10.0 and 0.10.1 (http://www.bioinformatics.babraham.ac.uk/projects/fastqc/)d ggplot2 (Wickham, 2009)d gsnap 2012-07-20 (Wu and Nacu, 2010)d htseq 0.5.3p9 (Simon Anders, http://www-huber.embl.de/users/anders/HTSeq/doc/overview.html)d Illumina Casava (versions 1.3 to 1.8.2)d Macs2 2.0.10 (Zhang et al., 2008)d R 2.15 (‘‘R: A Language and Environment for Statistical Computing,’’ R Core Team, http://www.R-project.org)d Samtools 0.1.18 (Li et al., 2009)
S2 Cell 155, 1507–1520, December 19, 2013 ª2013 Elsevier Inc.
Bioinformatics AnalysesDHS-Seq, ChIP-Seq, and RNA-Seq ProcessingDHS-Seq and ChIP-seq were sequenced using the Illumina Genome Analyzer II and the Illumina HiSeq 2000, following the manufac-turer’s instructions. The standard Illumina pipeline (versions 1.3 to 1.8.2) was used for image analysis and base calling. The softwareFastqc was applied to the fastq files to ensure that the quality of each read position was no less than 28.Alignment of DHS-Seq and ChIP-Seq ReadsReads were aligned to the National Center for Biotechnology Information mouse genome data (July 2007; NCBI37/mm9). The align-ment software Bowtie version 0.12.8 was used with the following options:–best–all–strata -m1 -n2 –l[read length]. These optionsreport the reads that align uniquely to the best stratum and allowing 2 mismatches.Alignment of RNA-Seq ReadsStrand-specific B and E14 cell RNA-Seq reads were mapped onto the mouse reference genome (mm9) with SOLiD WTP andanalyzed by ABI SOLiD Bioscope (version 1.0) analysis pipeline. Expression values were determined in terms of reads per kilobaseper million mapped reads (RPKM).For increased precision in transcriptionmeasurements, ERCCRNA spike-in mix was added to the total RNA before standard RNA-
Seq library preparation (as described above). Reads were aligned against the mouse genome (build mm9) with gsnap using onlyknown splice sites obtained from the Refseq annotation as present in the USCS genome browser database in January 2012with –novelsplicing = 0. Subsequently, the same reads were also aligned to the ERCC RNA standard, also with gsnap but not lookingfor splice sites. The number of reads matching each Refseq gene was then determined using htseq-count while the number of readsmatching ERCC standard RNAs was determined by a simple line count. Spike and mRNA counts were then read into R wherecounts were normalized by library size and exonic size of each gene to obtain RPKM (reads per kb per million aligned reads). A linearmodel was fit to the ERCC spike data to relate the known copy number to the measured RPKM and cell type: lm(log10(known copynumber) ?log10(RPKM) + cell, data = counts). The linear model was then used to estimate the copy number of each expressed genebased on the cell type and measured RPKM.PolII ChIA-PET ProcessingThe pipeline for ChIA-PET sequencing processing is described in (Li et al., 2010). Briefly, the redundant sequences were collapsedinto a nonredundant PET sequence set based on sequence content. The nonredundant PET sequences were analyzed for linker bar-code composition and identified as sequences with homodimer linker derived from specific ligation products, or sequences with het-erodimer linker derived from nonspecific ligation products. The linker composition information was used to evaluate the noise in theChIA-PET library and sequences with heterodimer linkers were removed. After trimming the linkers, PET sequences were mapped tothe mouse reference genome (mm9) using customized BatMis 3.0 and only perfectly and uniquely aligned PETs were retained. PETsuniquely aligned and similarlymapped (within ± 2 bp) weremerged into one PET as they were considered to be derived from the sameDNA-fragment ligation with variations in MmeI enzyme digestion. Based on the mapping characteristics, each PET was categorizedas a self-ligation PET (two ends of the same DNA fragment) or interligation PET (two ends from two different DNA fragments in thesame chromatin complex). The PET categories were established by evaluating the mapping orientation and genomic span betweentwo tags of a PET. The interligation PETs were further categorized into intrachromosomal PETs, where the two tags from a PET lay onthe same chromosome, and interchromosomal PETs, where the two tags lay on different chromosomes. The self-ligation PETs wereutilized as a proxy for ChIP fragments since they provide two defined end points, as described above. The coverage of all self-ligatedPET sequences across the genome reflects the specific PolII binding sites, which is analogous to ChIP-seqmapping for protein bind-ing sites. The local summits of the sequence coverage were called as potential peaks if there were multiple self-ligation PETs over-lapping in that region. Assuming multiple self-ligation PETs would not occur by random chance, the random background was set asthe maximum of the global tag density, local tag densities at 10 kb and 20 kb windows around the peak, and the Poisson distributionwas applied to estimate the p values for the peaks. P values were then adjusted for multiple comparisons using the Benjamini-Hochberg false discovery rate method (B-H FDR method). FDRs less than 0.05 were used as the criteria for final peak calling.Throughout the text, PET clusters with 2 or more PETs are referred to as interactions or connections.Bi-Seq ProcessingIn silico conversion mimicking complete bisulfite conversion was performed on the National Center for Biotechnology Informationmm9 mouse genome. Specifically, in silico C / T and G / A mm9 genomes were constructed by converting all C or Gs into Tor As. Sequence readswere C/ T converted and aligned to the C/ T andG/A genomes, resulting in two alignments per sample.Alignments were performed with Bowtie version 0.12.8 with the options ‘‘–best -n2 -k2,’’ which report the top 2 best alignments.Alignments against the C / T converted genome had the additional option –norc (only alignments against the forward strandwere reported) and alignments against the G / A converted genome was performed with the additional option –nofw (only align-ments against the reverse strand were reported). The two alignments per sample were merged and sorted using Samtools, andonly reads that had a unique alignment with the minimum number of mismatches were retained. Going through all the sorted uniquealignments, the number of methylated Cs (C nucleotide in the original read and C nucleotide in the genome) and the number ofunmethylated Cs (T nucleotide in the original read and C nucleotide in the genome) were determined for every position covered.The context of each C was determined and each C was classified as CpG, CHH, or CHG, where H is either A, T, or C nucleotide.For the CpGs, base positions that were consecutive and on different strands were merged. To ensure proper quality of the methyl-ation calls, a minimal base quality score of 20 and a minimum of 5 uniquely aligned reads covering a given position were required for
Cell 155, 1507–1520, December 19, 2013 ª2013 Elsevier Inc. S3

that position to be considered. For each C nucleotide with sufficient quality and coverage then, we calculated the percentage ofmethylated C nucleotides with respect to the sum of methylated and unmethylated C nucleotides. For each CG, the difference inpercent methylation between KSL or CLP or resting B cells or activated B cells and ES cells was calculated.Definition of DHS Hotspots and FootprintsDHS hotspots were detected using the software DNase2Hotspots with the following parameters: background window size200,000 bp, target window size 250 bp, mergeable gap: 0, z-score threshold 2, FDR 0%. Reads that mapped to chromosome Mwere removed prior to hotspot detection. The software DNase2Hotspots uses an algorithm that identifies local enrichment of tagsin a 250 bp target window relative to a local background window spanning 200 kb. To remove artifacts, reads that overlapped sat-ellites, long interspersed repetitive elements, and short tandem repeats were removed. With the remaining reads, a z-score, (n – m)/ sis calculated for each target windowwhere n is the original number of tags observed in the target window, m is the expected number oftags overlapping that target window based on the number of mappable reads in the background window, and s is the standarddeviation of the expectation. A false discovery rate is estimated for each z-score by calculating z-scores using randomly sampleduniquely mapped reads from the observed data set. Hotspots with 0% FDRwere selected here. Finally, DHS hotspots located within1 kb of TSSs were merged into promoter domains, while all other DHS were merged into enhancer domains if they were within 2 kbfrom each other.
Transcription factor footprints were called by applying ‘DNase2TF’, a program that implements a new footprint detection algorithm(S. Baek, G.L. Hager, M.-H. Sung, unpublished data). Briefly, the algorithm looks for regions of local depletion in DNaseI cutting withineach hotspot, taking the enzyme’s dinucleotide bias and mappability of sequence reads into account. Candidate intervals areobtained by considering binomial z-scores that reflect the depletion in cutting relative to a background window 3-fold the width ofthe candidate region and then by merging consecutive intervals. Candidate intervals whose z-scores correspond to FDR < 5%were retained for subsequent analyses.Annotation of DHS Regions into Promoters and EnhancersTheBedtools software suitewas utilized tomap theChIP-seq reads onto the DHS regions. First, the fragment sizes for eachChIP-seqexperiment was estimated using macs2. The 30 end of the aligned ChIP-seq reads were then lengthened to match these predictedfragment sizes. Next, the read counts overlapping each DHS region was calculated using bedtools intersect. These overlapping readcounts were then normalized to the total number of reads for each epigenetic mark and p values based on the negative binomial dis-tribution of the negative controls (a combination of negative pull-downs for B cells and IgG for ES cells) were calculated for eachregion. DHS regions with a Benjamini-Hochberg FDR-adjusted p value less than 1% were considered positive. DHS regions thatwere within 1 Kb of a TSS were denoted DHS-promoter. The remaining regions were classified as enhancers if they were p300 orMed12 or Nipbl positive.ChIA-PET Cluster Interactions: Definitions and AnnotationInterligation PETs reflect long-range chromatin interactions. However, there is technical noise from various sources, which should beinevitably considered. To determine if an interligation PET represents a specific interaction event between two DNA fragments thatare bound together in close spatial proximity by a PolII protein complex, we reasoned that the multiple interligation PETs would beenriched by the ChIP procedure between the same DNA fragments. To identify such chromatin interactions, both ends of the inter-ligation PETs were extended by 500 bp along the reference genome, and PETs overlapping at both ends were clustered together asone PET cluster. The number of PETs in a PET cluster therefore reflects the frequency of an interaction between two genomic regions.To determine whether the observed number of PETs in a PET cluster was significantly different from background noise or weakinteractions represented by singleton interligation PETs, we evaluated p values from a hypergeometric distribution with the tagcounts from both anchor regions of PET clusters and the sequencing depth as input. P values were corrected using the B-H FDRmethod for multiple hypothesis testing and the FDR cutoff is 0.05.Classification of PET ClustersIn this study, we only considered the intrachromosomal PET clusters with span less than 1 Mb on chromosomes and used thedefined DHS regions to annotate PET cluster interactions. DHS regions were extended by 1.5 kb in both directions and interactionPET clusters were considered anchored if they overlapped the extended DHS regions by at least 1 base. Interaction PET clusterswere then annotated into the following 4 types, according to the type of DHS region they overlapped: intragenic (promoter to geneinternal region), extragenic (promoter to enhancer), and intergenic (promoter to distal promoter), and enhancer-enhancer (neitheranchor of a PET cluster overlaps with a DHS promoter region). In some cases, interaction PET clusters overlap with both DHSpromoters and enhancers. If the interaction PET cluster overlapped with a DHS promoter region and a DHS enhancer regionlocated in the same gene internal region, the interaction was denoted as intragenic interaction. If the interaction PET cluster over-lapped with a DHS promoter and a distal DHS enhancer, the interaction was denoted as an extragenic interaction as shown inFigure S1H.Defining Transcription Models from Chromatin InteractionsPET interaction clusters were grouped with other interaction clusters based on what type of DHS region they were anchored to. Wethen defined three transcription models based on how the gene promoters were involved in these complex chromatin interactions:multigene (MG) interaction model, single gene (SG) interaction model, and basal promoter (BP) model. The MG model comprisesintergenic promoter-promoter interactions grouped in an interaction cluster that could also include intragenic and extragenicenhancer-promoter interactions. The SG model consists of single or multiple enhancer interactions with only one gene promoter,
S4 Cell 155, 1507–1520, December 19, 2013 ª2013 Elsevier Inc.
whereas the BP model includes genes with PolII binding but no chromatin interaction. MG and SG interaction cluster models werevisualized with Cytoscape.Reproducibility of ChIA-PET PolII Peaks and InteractionsSince the sonicated fragment size of ChIA-PET library is less than 1 kb, PolII peaks between biological replicates were consideredoverlapping if the distance from peak center to peak center was within 1 Kb. To account for the sonication fragment size anchors ofinteraction PET clusters were extended 1 kb at both ends. Extended PET clusters were considered overlapping if they shared at leastone nucleotide.Identification of lncRNAs Associated GenesThe lncRNA-associated genes were identified by PET clusters, which connected the DHS promoter regions of lnRNA and their targetgene. Ensembl version NCBI36.67 was utilized for annotation. When a lncRNA associated with multiple genes, the gene with highestconnection frequency was selected as the lnRNA-associated gene. Expression levels of lnRNAs and associated genes weremeasured as reads per kilobase per million reads (RPKM) from RNA-Seq sequencing by using Cufflinks 2 (Trapnell et al., 2013).CpG Methylation Changes across Cell TypesRPKM values were calculated for genes annotated using Refseq annotation as found in the USCS genome browser database(January 2012). Using R, a two-component mixture model was fit to the log-transformed RPKM values and genes with expressionlevels exceeding the 95th percentile were considered active while genes with expression levels below the 1st percentile were consid-ered silent. Methylation levels was averaged over each gene (TSS ± 200 bp) and the distribution of methylation levels in silent andactive genes were depicted with violin plots (Figure 5A). To assess global demethylation in enhancers across cellular development(Figure 5D), we considered DHS enhancer regions anchored by PETs in activated B cells only. A subset of these regions were notedas demethylated (average methylation %40%) in activated B cells and the number of these regions is depicted in Figure 5D.Accession NumbersAll accession numbers for raw data are provided in Table S1. All bed files used in the text are also available upon request.
SUPPLEMENTAL REFERENCES
Goh, Y., Fullwood, M.J., Poh, H.M., Peh, S.Q., Ong, C.T., Zhang, J., Ruan, X., and Ruan, Y. (2012). Chromatin Interaction Analysis with Paired-End Tag
Sequencing (ChIA-PET) for mapping chromatin interactions and understanding transcription regulation. J. Vis. Exp. 62, 3770.
Langmead, B., Trapnell, C., Pop,M., and Salzberg, S.L. (2009). Ultrafast andmemory-efficient alignment of short DNA sequences to the human genome. Genome
Biol. 10, R25.
Li, H., Handsaker, B., Wysoker, A., Fennell, T., Ruan, J., Homer, N., Marth, G., Abecasis, G., and Durbin, R.; 1000 Genome Project Data Processing Subgroup
(2009). The Sequence Alignment/Map format and SAMtools. Bioinformatics 25, 2078–2079.
Li, G., Fullwood, M.J., Xu, H., Mulawadi, F.H., Velkov, S., Vega, V., Ariyaratne, P.N., Mohamed, Y.B., Ooi, H.S., Tennakoon, C., et al. (2010). ChIA-PET tool for
comprehensive chromatin interaction analysis with paired-end tag sequencing. Genome Biol. 11, R22.
Phillips, J.E., and Corces, V.G. (2009). CTCF: master weaver of the genome. Cell 137, 1194–1211.
Quinlan, A.R., and Hall, I.M. (2010). BEDTools: a flexible suite of utilities for comparing genomic features. Bioinformatics 26, 841–842.
Sekimata, M., Perez-Melgosa, M., Miller, S.A., Weinmann, A.S., Sabo, P.J., Sandstrom, R., Dorschner, M.O., Stamatoyannopoulos, J.A., andWilson, C.B. (2009).
CCCTC-binding factor and the transcription factor T-bet orchestrate T helper 1 cell-specific structure and function at the interferon-gamma locus. Immunity 31,
551–564.
Shannon, P., Markiel, A., Ozier, O., Baliga, N.S., Wang, J.T., Ramage, D., Amin, N., Schwikowski, B., and Ideker, T. (2003). Cytoscape: a software environment for
integrated models of biomolecular interaction networks. Genome Res. 13, 2498–2504.
Tennakoon, C., Purbojati, R.W., and Sung, W.K. (2012). BatMis: a fast algorithm for k-mismatch mapping. Bioinformatics 28, 2122–2128.
Trapnell, C., Williams, B.A., Pertea, G., Mortazavi, A., Kwan, G., van Baren, M.J., Salzberg, S.L., Wold, B.J., and Pachter, L. (2010). Transcript assembly and
quantification by RNA-Seq reveals unannotated transcripts and isoform switching during cell differentiation. Nat. Biotechnol. 28, 511–515.
Trapnell, C., Hendrickson, D.G., Sauvageau, M., Goff, L., Rinn, J.L., and Pachter, L. (2013). Differential analysis of gene regulation at transcript resolution with
RNA-seq. Nat. Biotechnol. 31, 46–53.
Wickham, H. (2009). ggplot2: Elegant graphics for data analysis (New York: Springer).
Wu, T.D., and Nacu, S. (2010). Fast and SNP-tolerant detection of complex variants and splicing in short reads. Bioinformatics 26, 873–881.
Zhang, Y., Liu, T., Meyer, C.A., Eeckhoute, J., Johnson, D.S., Bernstein, B.E., Nusbaum, C., Myers, R.M., Brown, M., Li, W., and Liu, X.S. (2008). Model-based
analysis of ChIP-Seq (MACS). Genome Biol. 9, R137.
Cell 155, 1507–1520, December 19, 2013 ª2013 Elsevier Inc. S5

Figure S1. Properties of DHS-Seq and ChIA-PET Data Sets, Related to Figure 1.(A) Reproducibility of DHS-seq signal at defined hotspots in two biological replicates of activated B cells. Correlation was calculated via Spearman’s coefficient r.
(B) Overlap in B cell DHS regions vis-a-vis Med12, p300, and Nipbl occupancy.
(C) Bar graph showing the percentage of ChIA-PET interactions overlapping with DHS or non-DHS genomic domains.
(D) Box plot representing the transcription levels of genes associated or not associated with ChIA-PET connections at promoters (p < 2 3 1016).
(E) Box plot representing PolII density (RPKM) at promoters associated or not associated with ChIA-PET connections (p < 2 3 1016).
(F) Percentage of H3K27Ac+ (active) enhancers within ChIA-PET anchored and not anchored groups.
(G) DHS signal intensity at enhancers and promoters associated with 0, 2, or more than 5 PolII long-range interactions.
(H) Schematics showing the classification of PolII ChIA-PET interactions (PETs) as intragenic, extragenic, intergenic, or enhancer-enhancer.
(I) Representation of direct and indirect connections between promoters and enhancers as determined by ChIA-PET. Percentages were calculated for B and ES
cell ChIA-PET data sets combined.
S6 Cell 155, 1507–1520, December 19, 2013 ª2013 Elsevier Inc.
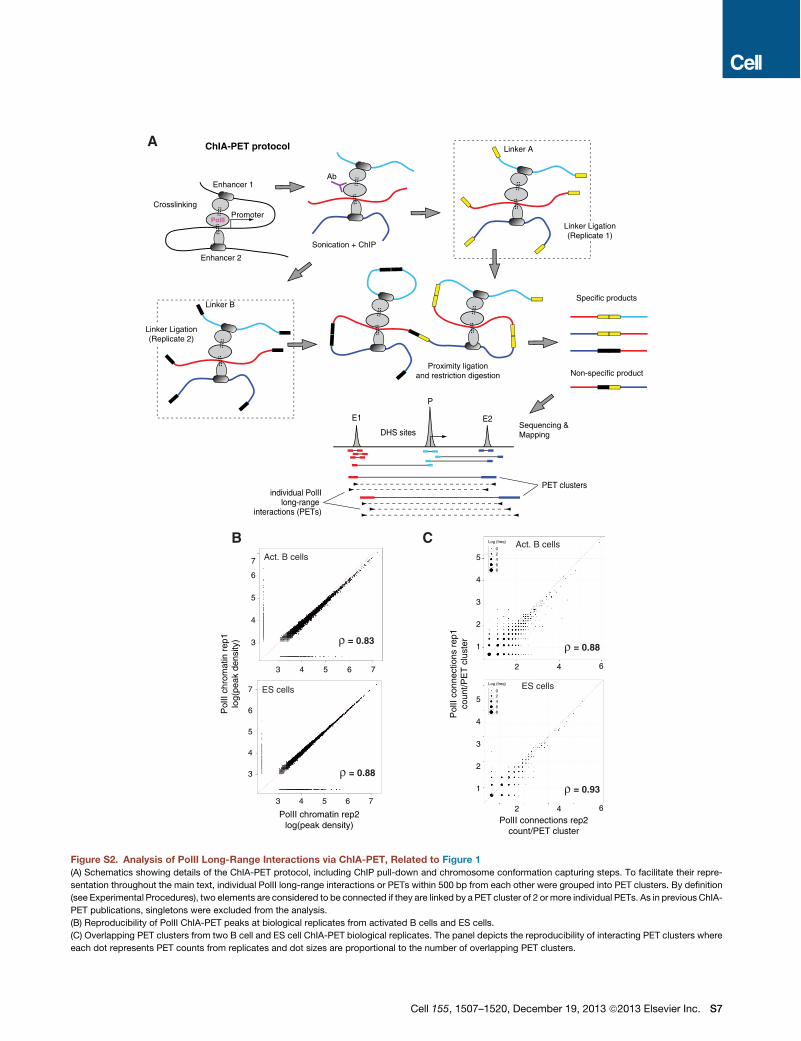
ChIA-PET protocol
PolII
Enhancer 1
Promoter
Enhancer 2
Crosslinking
Specific products
Non-specific product
Sonication + ChIP
Ab
Linker B
Linker A
Proximity ligation and restriction digestion
Sequencing &MappingDHS sites
Linker Ligation (Replicate 1)
Linker Ligation (Replicate 2)
A
PET clustersindividual PolII
long-range interactions (PETs)
E1 E2
P
B
3
! = 0.83
654 7
3
5
4
6
7
! = 0.88
Act. B cells
ES cells
PolII chromatin rep2log(peak density)
3 654 7
3
5
4
6
7
Pol
II ch
rom
atin
rep
1lo
g(pe
ak d
ensi
ty)
C
! = 0.93
3
5
4
1
2
PolII connections rep2count/PET cluster
642
02468
Log (freq)
! = 0.88
3
5
4
1
2
Pol
II co
nnec
tions
rep
1co
unt/P
ET
clus
ter
642
02468
Log (freq) Act. B cells
ES cells
Figure S2. Analysis of PolII Long-Range Interactions via ChIA-PET, Related to Figure 1(A) Schematics showing details of the ChIA-PET protocol, including ChIP pull-down and chromosome conformation capturing steps. To facilitate their repre-
sentation throughout the main text, individual PolII long-range interactions or PETs within 500 bp from each other were grouped into PET clusters. By definition
(see Experimental Procedures), two elements are considered to be connected if they are linked by a PET cluster of 2 or more individual PETs. As in previous ChIA-
PET publications, singletons were excluded from the analysis.
(B) Reproducibility of PolII ChIA-PET peaks at biological replicates from activated B cells and ES cells.
(C) Overlapping PET clusters from two B cell and ES cell ChIA-PET biological replicates. The panel depicts the reproducibility of interacting PET clusters where
each dot represents PET counts from replicates and dot sizes are proportional to the number of overlapping PET clusters.
Cell 155, 1507–1520, December 19, 2013 ª2013 Elsevier Inc. S7
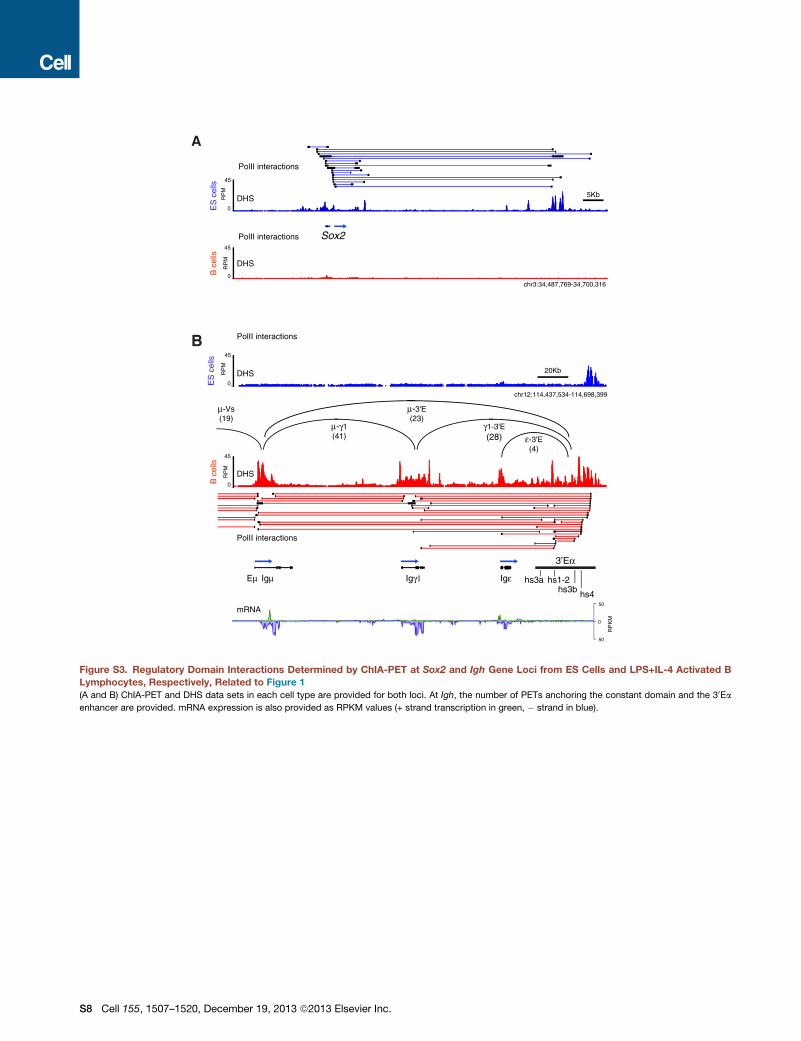
A
B
PolII interactions
Ig"Ig#1Igµ hs3a hs1-2hs3b hs4
µ-#1(41)
#1-3'E(28)
µ-3'E(23)
µ-Vs(19)
"-3'E(4)
chr12:114,437,534-114,698,399
Eµ
3’E$
50
50
0
RP
KM
mRNA
20Kb
PolII interactions
PolII interactions Sox2
chr3:34,487,769-34,700,316
DHS
45 _
0 _
RP
M
B c
ells
DHS
45 _
RP
M
0 _ES
cel
ls
5Kb
DHS
45 _
RP
M
0 _ES
cel
ls
DHS
45 _
0 _
RP
M
B c
ells
PolII interactions
Figure S3. Regulatory Domain Interactions Determined by ChIA-PET at Sox2 and Igh Gene Loci from ES Cells and LPS+IL-4 Activated BLymphocytes, Respectively, Related to Figure 1(A and B) ChIA-PET and DHS data sets in each cell type are provided for both loci. At Igh, the number of PETs anchoring the constant domain and the 30Ea
enhancer are provided. mRNA expression is also provided as RPKM values (+ strand transcription in green, " strand in blue).
S8 Cell 155, 1507–1520, December 19, 2013 ª2013 Elsevier Inc.
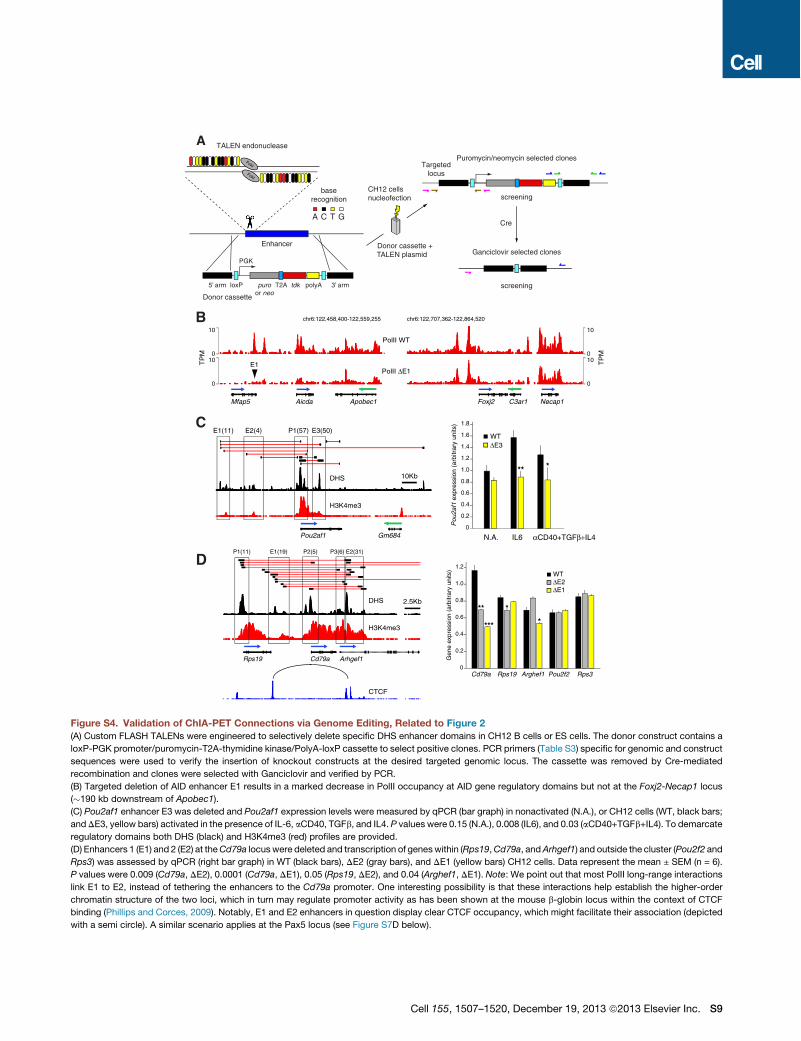
A
B
1.6
1.4
1.2
1.0
0.8
0.6
0.4
0.2
0Pou
2af1
exp
ress
ion
(arb
itrar
y un
its)
N.A. IL6 $CD40+TGF%+IL4
WT&E3
1.8
** *
Pou2af1 Gm684
E3(50)E2(4)E1(11) P1(57)
Rps19 Cd79a Arhgef1
P1(11) E1(19) E2(31)P2(5) P3(6)
Gen
e ex
pres
sion
(ar
bitr
ary
units
)
Cd79a Rps19 Arghef1
WT
&E1
Pou2f2 Rps3
**
1.2
1.0
0.8
0.6
0.4
0.2
0
&E2
***
*
*
CH12 cellsnucleofection
Donor cassette + TALEN plasmid
5’ arm
Donor cassette
PGK
loxP
Enhancer
FokI
FokI
A C T G
TALEN endonuclease
baserecognition
puroor neo
T2A tdk polyA 3’ arm
Targetedlocus
Puromycin/neomycin selected clones
screening
Cre
Ganciclovir selected clones
screening
C
D
Mfap5 Aicda Apobec1 Foxj2 C3ar1 Necap1
E1
PolII WT
PolII &E1
chr6:122,707,362-122,864,520chr6:122,458,400-122,559,255
0
100
10
TP
M
0
100
10
TP
M
DHS
H3K4me3
DHS
H3K4me3
2.5Kb
10Kb
CTCF
Figure S4. Validation of ChIA-PET Connections via Genome Editing, Related to Figure 2(A) Custom FLASH TALENs were engineered to selectively delete specific DHS enhancer domains in CH12 B cells or ES cells. The donor construct contains a
loxP-PGK promoter/puromycin-T2A-thymidine kinase/PolyA-loxP cassette to select positive clones. PCR primers (Table S3) specific for genomic and construct
sequences were used to verify the insertion of knockout constructs at the desired targeted genomic locus. The cassette was removed by Cre-mediated
recombination and clones were selected with Ganciclovir and verified by PCR.
(B) Targeted deletion of AID enhancer E1 results in a marked decrease in PolII occupancy at AID gene regulatory domains but not at the Foxj2-Necap1 locus
(#190 kb downstream of Apobec1).
(C) Pou2af1 enhancer E3 was deleted and Pou2af1 expression levels were measured by qPCR (bar graph) in nonactivated (N.A.), or CH12 cells (WT, black bars;
andDE3, yellow bars) activated in the presence of IL-6, aCD40, TGFb, and IL4. P values were 0.15 (N.A.), 0.008 (IL6), and 0.03 (aCD40+TGFb+IL4). To demarcate
regulatory domains both DHS (black) and H3K4me3 (red) profiles are provided.
(D) Enhancers 1 (E1) and 2 (E2) at theCd79a locuswere deleted and transcription of geneswithin (Rps19,Cd79a, andArhgef1) and outside the cluster (Pou2f2 and
Rps3) was assessed by qPCR (right bar graph) in WT (black bars), DE2 (gray bars), and DE1 (yellow bars) CH12 cells. Data represent the mean ± SEM (n = 6).
P values were 0.009 (Cd79a, DE2), 0.0001 (Cd79a, DE1), 0.05 (Rps19, DE2), and 0.04 (Arghef1, DE1). Note: We point out that most PolII long-range interactions
link E1 to E2, instead of tethering the enhancers to the Cd79a promoter. One interesting possibility is that these interactions help establish the higher-order
chromatin structure of the two loci, which in turn may regulate promoter activity as has been shown at the mouse b-globin locus within the context of CTCF
binding (Phillips and Corces, 2009). Notably, E1 and E2 enhancers in question display clear CTCF occupancy, which might facilitate their association (depicted
with a semi circle). A similar scenario applies at the Pax5 locus (see Figure S7D below).
Cell 155, 1507–1520, December 19, 2013 ª2013 Elsevier Inc. S9
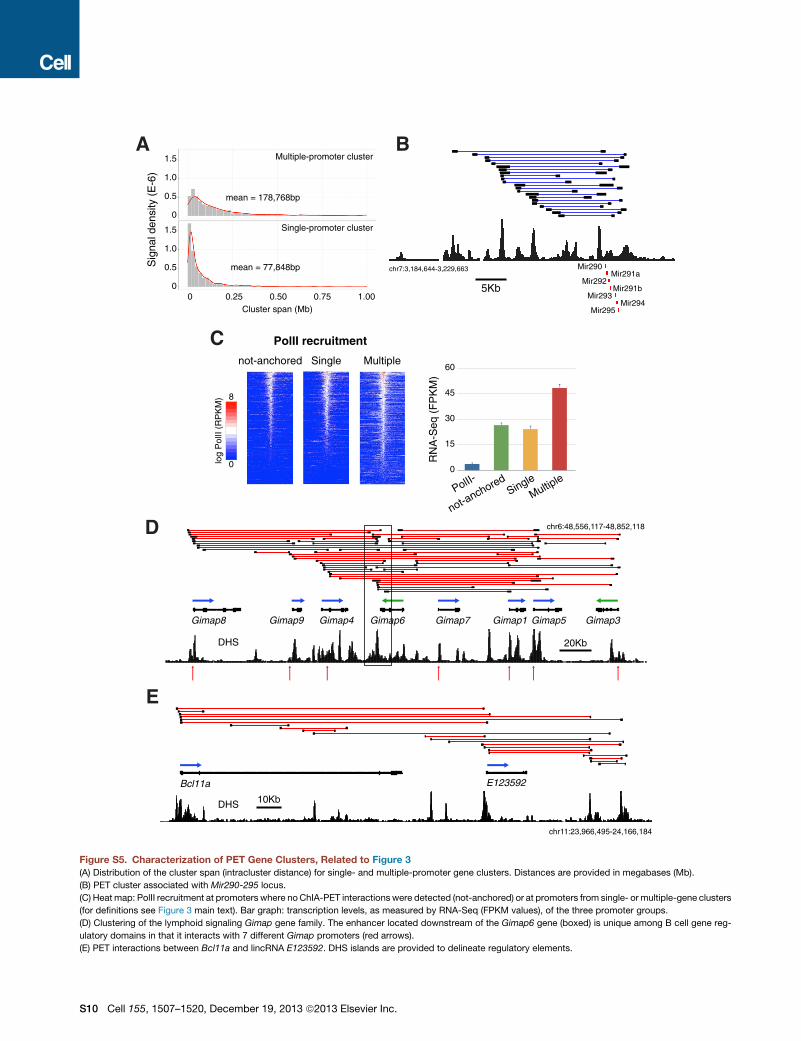
D
Cnot-anchored MultipleSingle
PolII recruitment
0
15
30
45
60
PolII-
not-anchoredSingle
Multiple
RN
A-S
eq (
FP
KM
)
E
E123592
chr11:23,966,495-24,166,184
DHS
Bcl11a
Gimap8 Gimap9 Gimap4 Gimap6 Gimap7 Gimap1 Gimap5 Gimap3
chr6:48,556,117-48,852,118
DHS
A
Single-promoter cluster
Multiple-promoter cluster
0 0.25 0.50 0.75 1.00Cluster span (Mb)
Sig
nal d
ensi
ty (
E-6
)
0
0.5
1.0
1.5
0
0.5
1.0
1.5
mean = 178,768bp
mean = 77,848bp Mir290Mir291a
Mir292Mir291b
Mir293Mir294
Mir295
chr7:3,184,644-3,229,663
B
10Kb
20Kb
5Kb
0
8
log
Pol
II (R
PK
M)
Figure S5. Characterization of PET Gene Clusters, Related to Figure 3(A) Distribution of the cluster span (intracluster distance) for single- and multiple-promoter gene clusters. Distances are provided in megabases (Mb).
(B) PET cluster associated with Mir290-295 locus.
(C) Heat map: PolII recruitment at promoters where noChIA-PET interactionswere detected (not-anchored) or at promoters from single- or multiple-gene clusters
(for definitions see Figure 3 main text). Bar graph: transcription levels, as measured by RNA-Seq (FPKM values), of the three promoter groups.
(D) Clustering of the lymphoid signaling Gimap gene family. The enhancer located downstream of the Gimap6 gene (boxed) is unique among B cell gene reg-
ulatory domains in that it interacts with 7 different Gimap promoters (red arrows).
(E) PET interactions between Bcl11a and lincRNA E123592. DHS islands are provided to delineate regulatory elements.
S10 Cell 155, 1507–1520, December 19, 2013 ª2013 Elsevier Inc.
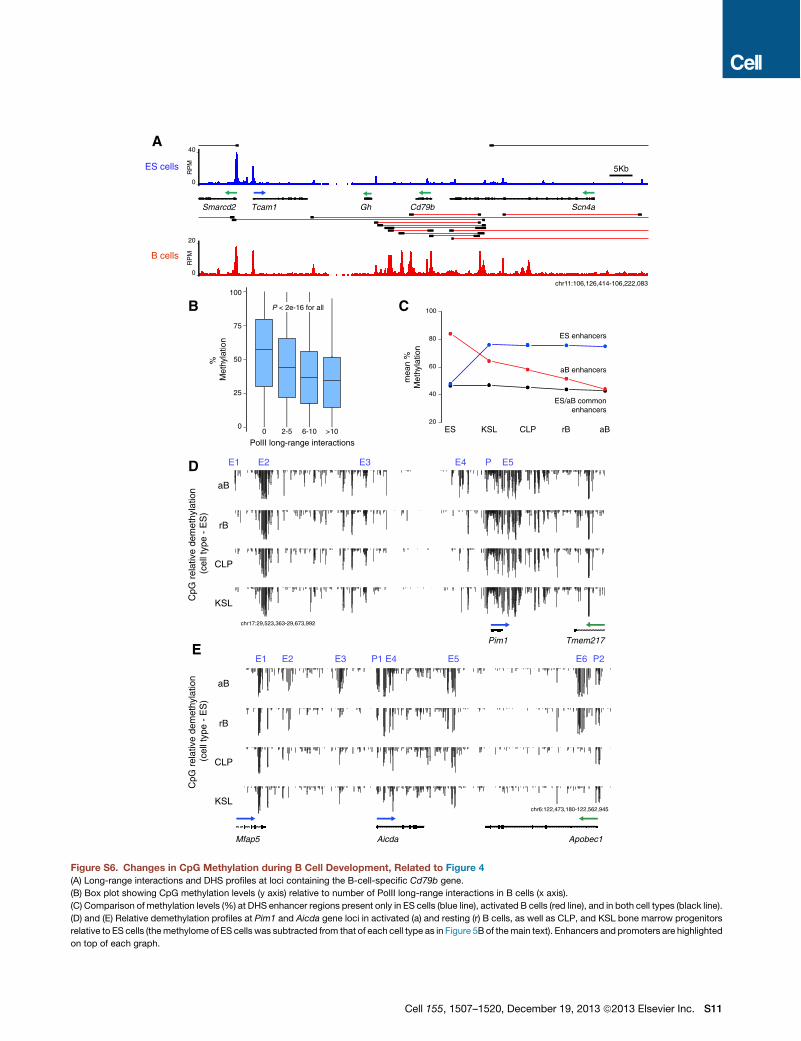
Smarcd2 Scn4aGhTcam1 Cd79b
40 _
RP
M0 _
20 _
0 _
RP
M
chr11:106,126,414-106,222,083
B cells
ES cells
A
5Kb
aB
rB
CLP
KSLchr6:122,473,180-122,562,945
Aicda Apobec1Mfap5
E1 E2 E4 E5E3 P1 P2E6
Pim1 Tmem217
E2 E4E3 P E5
chr17:29,523,363-29,673,992
E1
aB
rB
CLP
KSLCpG
rel
ativ
e de
met
hyla
tion
(cel
l typ
e -
ES
)
20
40
60
80
100
mea
n %
M
ethy
latio
n
ES KSL CLP rB aB
ES enhancers
aB enhancers
ES/aB commonenhancers
CpG
rel
ativ
e de
met
hyla
tion
(cel
l typ
e -
ES
)
0 2-5 6-10 >10
100
75
50
25
0
%
Met
hyla
tion
PolII long-range interactions
P < 2e-16 for allB C
D
E
Figure S6. Changes in CpG Methylation during B Cell Development, Related to Figure 4(A) Long-range interactions and DHS profiles at loci containing the B-cell-specific Cd79b gene.
(B) Box plot showing CpG methylation levels (y axis) relative to number of PolII long-range interactions in B cells (x axis).
(C) Comparison of methylation levels (%) at DHS enhancer regions present only in ES cells (blue line), activated B cells (red line), and in both cell types (black line).
(D) and (E) Relative demethylation profiles at Pim1 and Aicda gene loci in activated (a) and resting (r) B cells, as well as CLP, and KSL bone marrow progenitors
relative to ES cells (themethylome of ES cells was subtracted from that of each cell type as in Figure 5B of themain text). Enhancers and promoters are highlighted
on top of each graph.
Cell 155, 1507–1520, December 19, 2013 ª2013 Elsevier Inc. S11
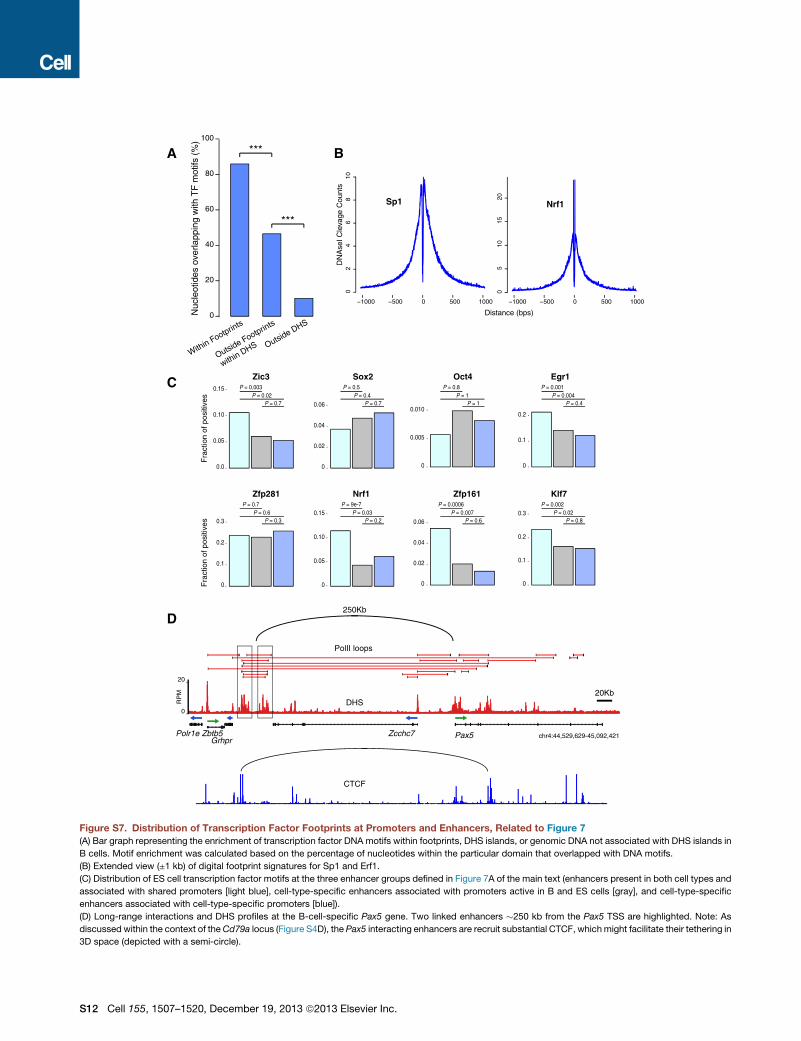
Nuc
leot
ides
ove
rlapp
ing
with
TF
mot
ifs (
%)
0
20
40
60
80
100
Within Footprints
Outside Footprints
within DHS Outside DHS
***
***
A
C P = 0.003P = 0.02
P = 0.7
0.05
0.10
0.0
0.15
Fra
ctio
n of
pos
itive
s
Zic3P = 0.5
P = 0.4P = 0.7
0
0.02
0.04
Sox2P = 0.8
P = 1P = 1
0
0.005
0.010
Oct4P = 0.001
P = 0.004P = 0.4
0
0.2
Egr1
P = 0.7P = 0.6
P = 0.3
Zfp281P = 9e-7
P = 0.03P = 0.2
0
0.05
0.10
0.15
Nrf1P = 0.0006
P = 0.007P = 0.6
0
0.06
0.02
0.04
Zfp161P = 0.002
P = 0.02P = 0.8
0
0.2
0.3
Klf7
0.06
0.1
0
0.1
0.2
0.3
0.1
Fra
ctio
n of
pos
itive
s
GrhprZbtb5Polr1e Pax5Zcchc7
20 _
0 _
RP
M
DHS
PolII loops
chr4:44,529,629-45,092,421
250Kb
20Kb
D
B
!1000 !500 0 500 1000
05
1015
20
Nrf1
!1000 !500 0 500 1000
02
46
810
Sp1
DN
Ase
I Cle
v age
Cou
nts
Distance (bps)
CTCF
Figure S7. Distribution of Transcription Factor Footprints at Promoters and Enhancers, Related to Figure 7(A) Bar graph representing the enrichment of transcription factor DNA motifs within footprints, DHS islands, or genomic DNA not associated with DHS islands in
B cells. Motif enrichment was calculated based on the percentage of nucleotides within the particular domain that overlapped with DNA motifs.
(B) Extended view (±1 kb) of digital footprint signatures for Sp1 and Erf1.
(C) Distribution of ES cell transcription factor motifs at the three enhancer groups defined in Figure 7A of the main text (enhancers present in both cell types and
associated with shared promoters [light blue], cell-type-specific enhancers associated with promoters active in B and ES cells [gray], and cell-type-specific
enhancers associated with cell-type-specific promoters [blue]).
(D) Long-range interactions and DHS profiles at the B-cell-specific Pax5 gene. Two linked enhancers #250 kb from the Pax5 TSS are highlighted. Note: As
discussed within the context of theCd79a locus (Figure S4D), the Pax5 interacting enhancers are recruit substantial CTCF, whichmight facilitate their tethering in
3D space (depicted with a semi-circle).
S12 Cell 155, 1507–1520, December 19, 2013 ª2013 Elsevier Inc.