Embed Size (px)
Citation preview
Applied Materials Confidential
Applied Global Services (AGS)
Interactive Server Side Data Miningand DecisionSite Integrated with
Applied Materials PEC
Paul Proctor Spotfire User Conference 2004October 5, 2004
Applied Materials Confidential
Applied Global Services (AGS)
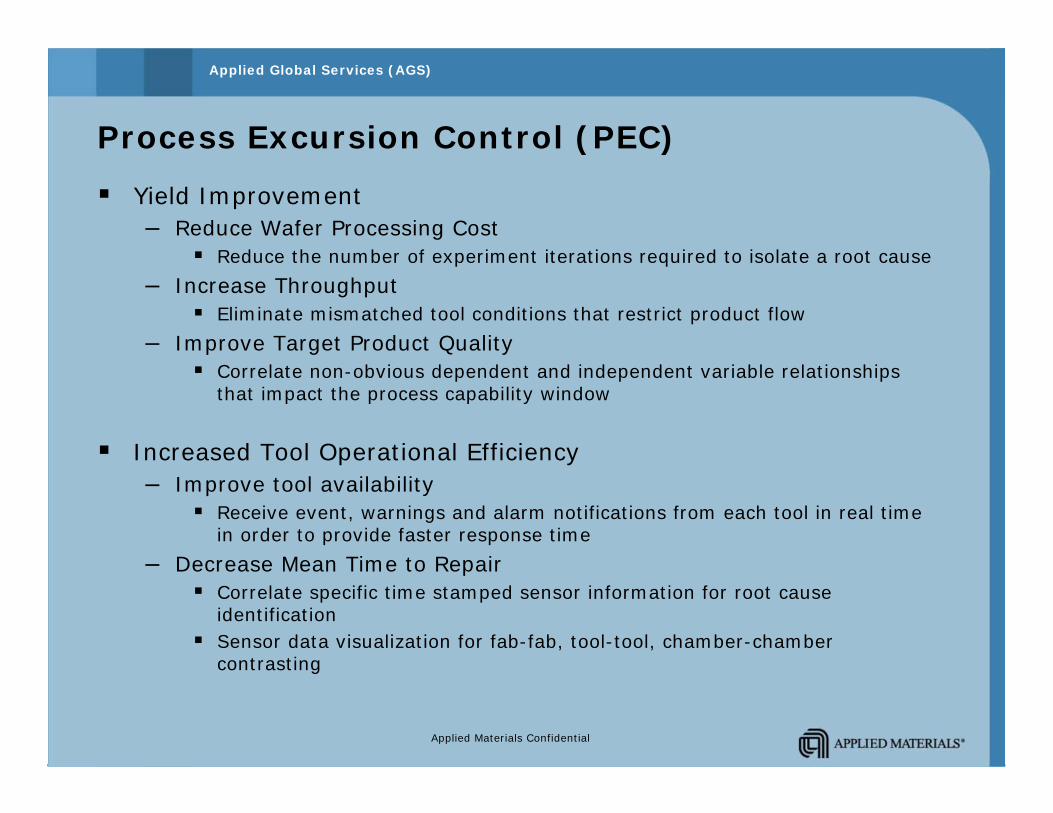
Process Excursion Control (PEC)
Yield Improvement – Reduce Wafer Processing Cost
Reduce the number of experiment iterations required to isolate a root cause
– Increase ThroughputEliminate mismatched tool conditions that restrict product flow
– Improve Target Product QualityCorrelate non-obvious dependent and independent variable relationships that impact the process capability window
Increased Tool Operational Efficiency – Improve tool availability
Receive event, warnings and alarm notifications from each tool in real time in order to provide faster response time
– Decrease Mean Time to RepairCorrelate specific time stamped sensor information for root cause identificationSensor data visualization for fab-fab, tool-tool, chamber-chamber contrasting
Applied Materials Confidential
Applied Global Services (AGS)
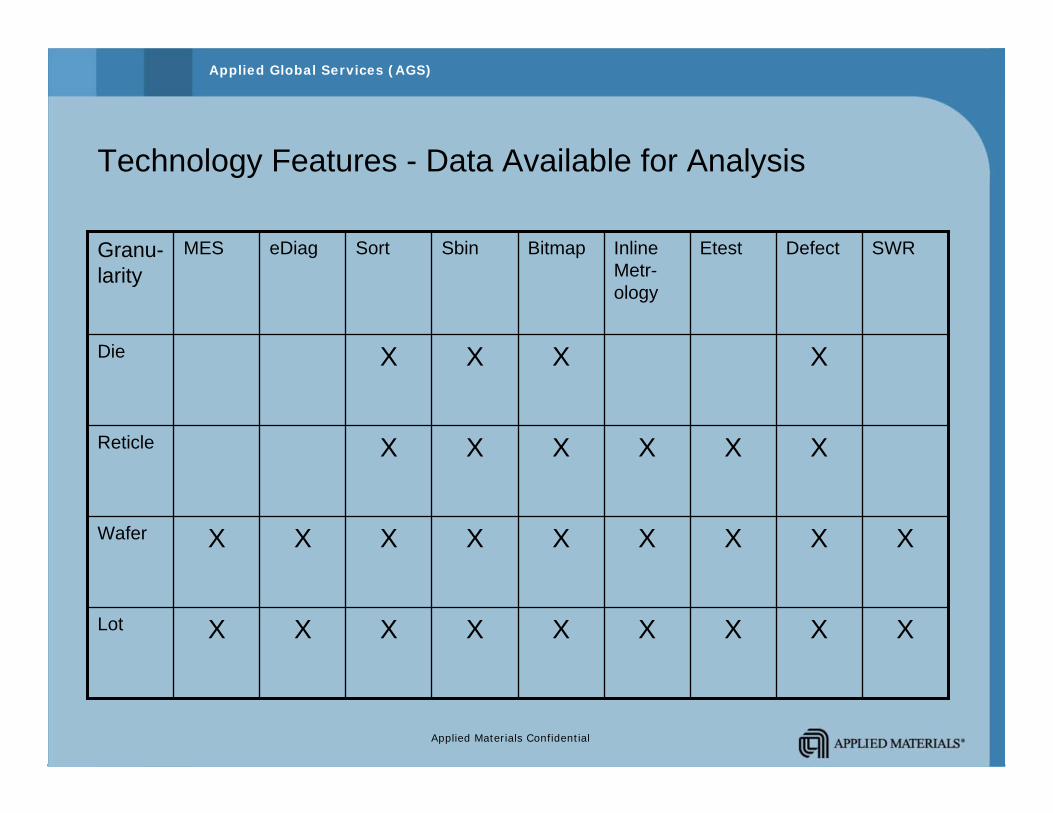
Technology Features - Data Available for Analysis
XXXXXXXXXLot
XXXXXXXXXWafer
XXXXXXReticle
XXXXDie
SWRDefectEtestInline Metr-ology
BitmapSbinSorteDiagMESGranu-larity
Applied Materials Confidential
Applied Global Services (AGS)
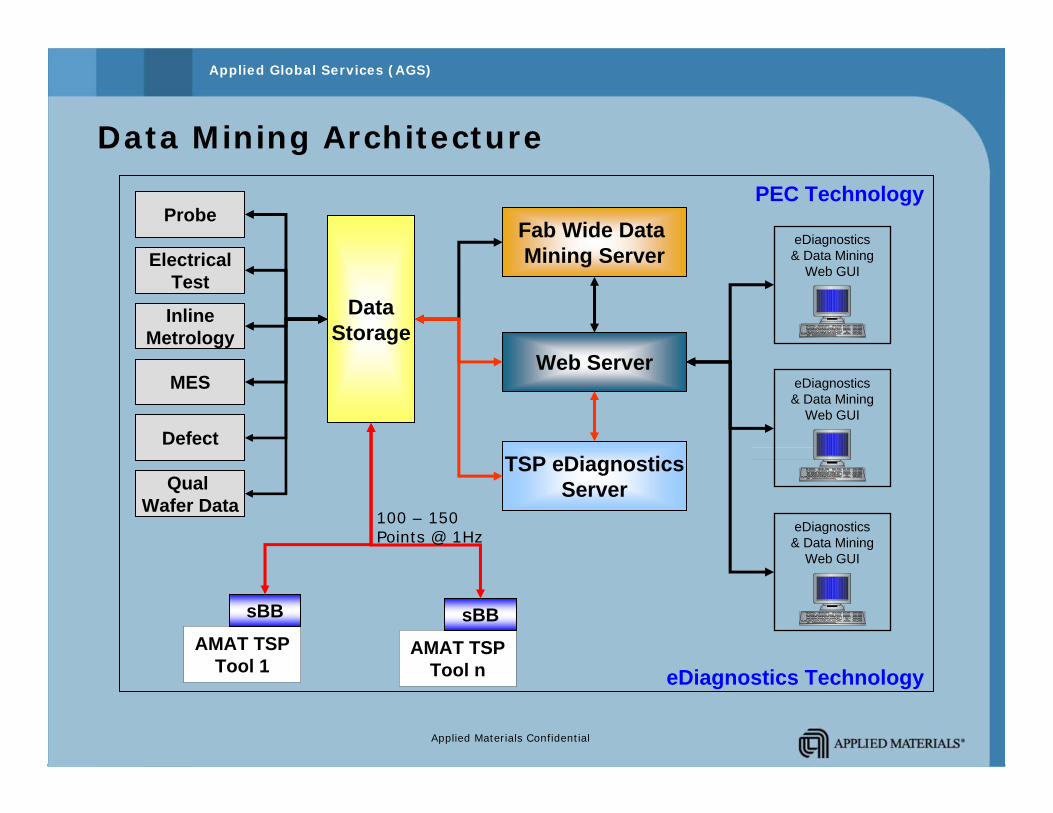
Data Mining Architecture
PEC Technology
MES
Probe
InlineMetrology
ElectricalTest
Fab Wide Data Mining Server
eDiagnostics& Data Mining
Web GUI
eDiagnostics& Data Mining
Web GUI
Web Server
eDiagnostics TechnologyAMAT TSP
Tool 1AMAT TSP
Tool n
TSP eDiagnosticsServer
sBB sBB
eDiagnostics& Data Mining
Web GUI
DataStorage
100 – 150 Points @ 1Hz
Defect
Qual Wafer Data
Applied Materials Confidential
Applied Global Services (AGS)
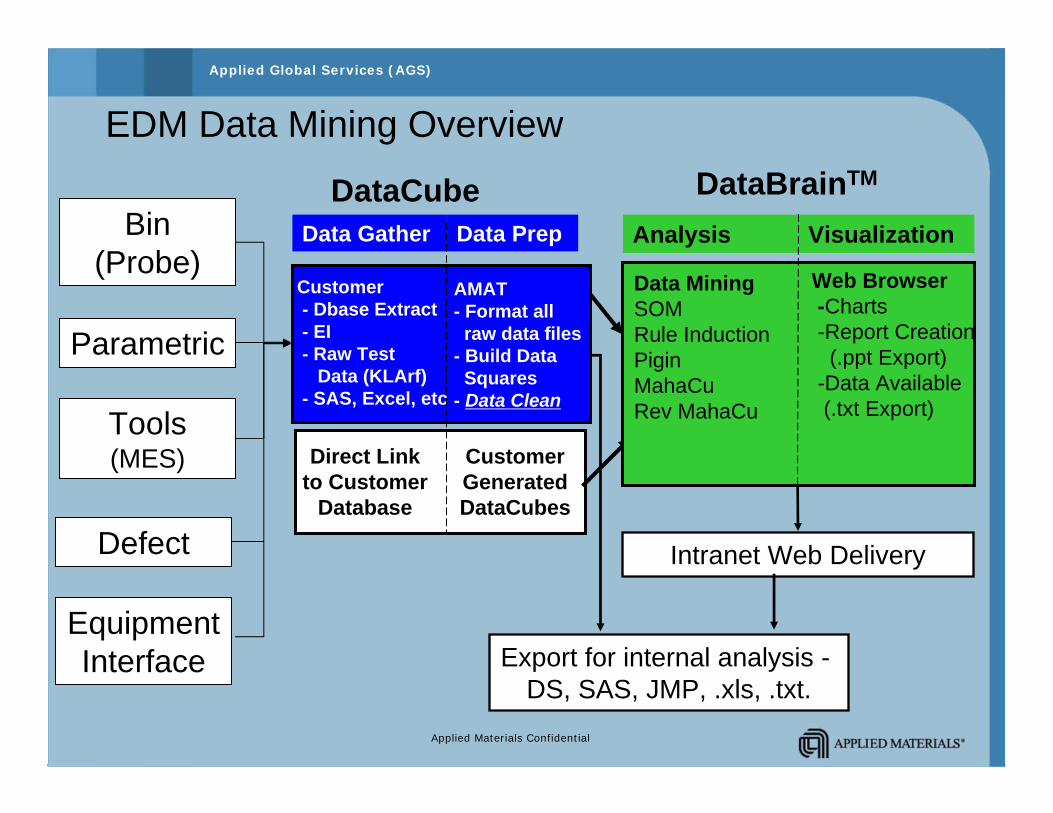
EDM Data Mining Overview
Export for internal analysis -DS, SAS, JMP, .xls, .txt.
Intranet Web Delivery
Data Gather Data Prep
Customer- Dbase Extract- EI- Raw Test
Data (KLArf)- SAS, Excel, etc
AMAT- Format all
raw data files- Build Data
Squares- Data Clean
CustomerGeneratedDataCubes
Direct Linkto Customer
Database
DataBrainTMDataCubeAnalysis Visualization
Data MiningSOMRule InductionPiginMahaCuRev MahaCu
Web Browser-Charts-Report Creation
(.ppt Export)-Data Available(.txt Export)
Bin (Probe)
Parametric
Tools (MES)
Defect
Equipment Interface
Applied Materials Confidential
Applied Global Services (AGS)
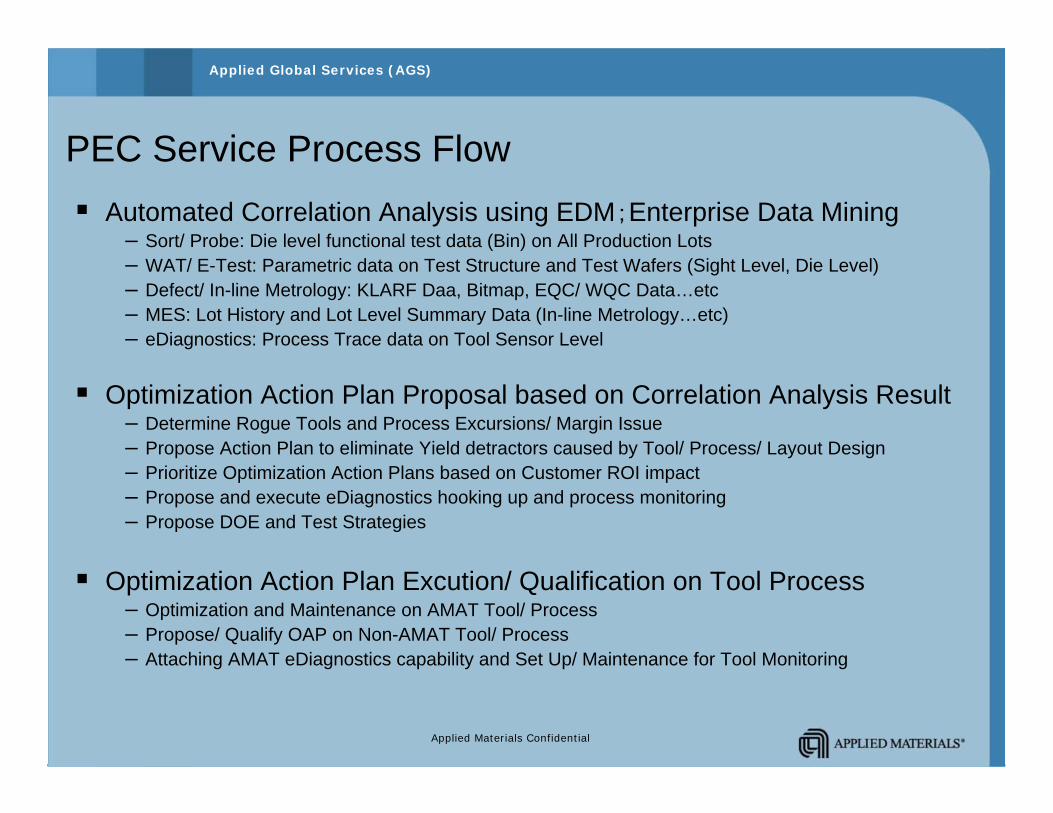
PEC Service Process FlowAutomated Correlation Analysis using EDM;Enterprise Data Mining
– Sort/ Probe: Die level functional test data (Bin) on All Production Lots– WAT/ E-Test: Parametric data on Test Structure and Test Wafers (Sight Level, Die Level)– Defect/ In-line Metrology: KLARF Daa, Bitmap, EQC/ WQC Data…etc– MES: Lot History and Lot Level Summary Data (In-line Metrology…etc)– eDiagnostics: Process Trace data on Tool Sensor Level
Optimization Action Plan Proposal based on Correlation Analysis Result– Determine Rogue Tools and Process Excursions/ Margin Issue– Propose Action Plan to eliminate Yield detractors caused by Tool/ Process/ Layout Design– Prioritize Optimization Action Plans based on Customer ROI impact– Propose and execute eDiagnostics hooking up and process monitoring– Propose DOE and Test Strategies
Optimization Action Plan Excution/ Qualification on Tool Process– Optimization and Maintenance on AMAT Tool/ Process– Propose/ Qualify OAP on Non-AMAT Tool/ Process– Attaching AMAT eDiagnostics capability and Set Up/ Maintenance for Tool Monitoring
Applied Materials Confidential
Applied Global Services (AGS)
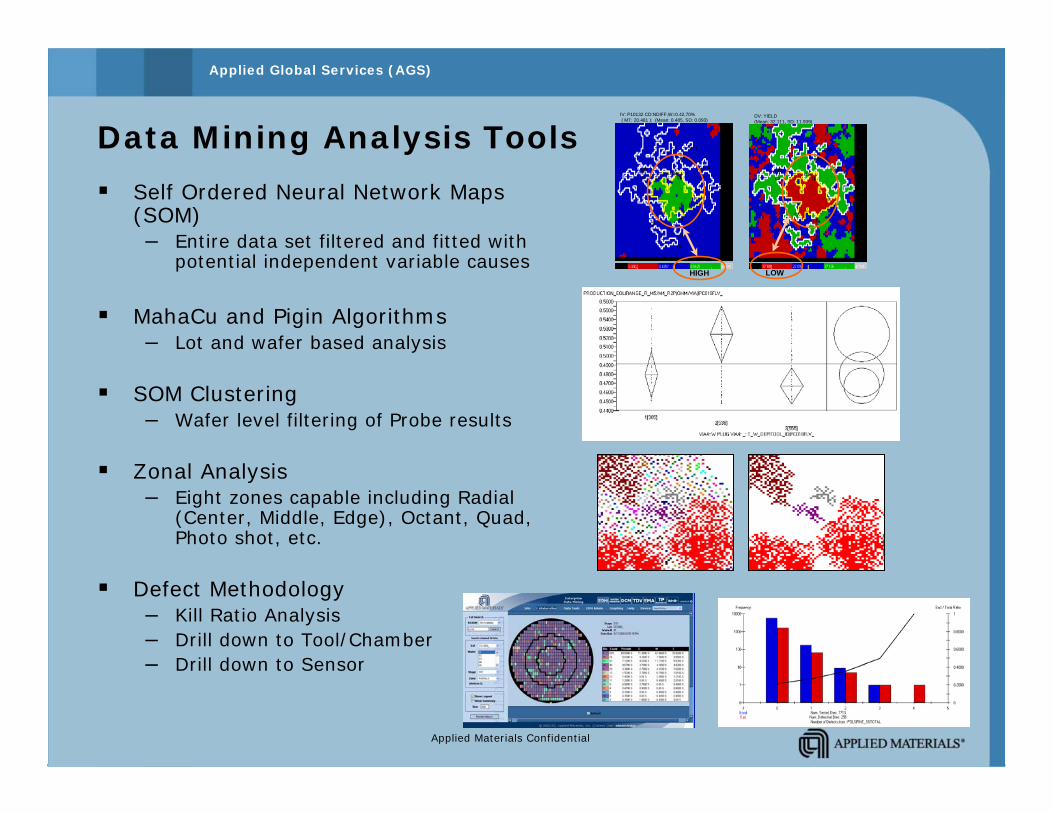
Data Mining Analysis Tools
Self Ordered Neural Network Maps (SOM)– Entire data set filtered and fitted with
potential independent variable causes
MahaCu and Pigin Algorithms– Lot and wafer based analysis
SOM Clustering– Wafer level filtering of Probe results
Zonal Analysis– Eight zones capable including Radial
(Center, Middle, Edge), Octant, Quad, Photo shot, etc.
Defect Methodology– Kill Ratio Analysis– Drill down to Tool/Chamber– Drill down to Sensor
IV: P10132 CD:NDIFF,W=0.42,70% ( MT: 20.481 ); (Mean: 0.485, SD: 0.093)
DV: YIELD(Mean: 32.111, SD: 11.939)
LOWHIGH
Applied Materials Confidential
Applied Global Services (AGS)
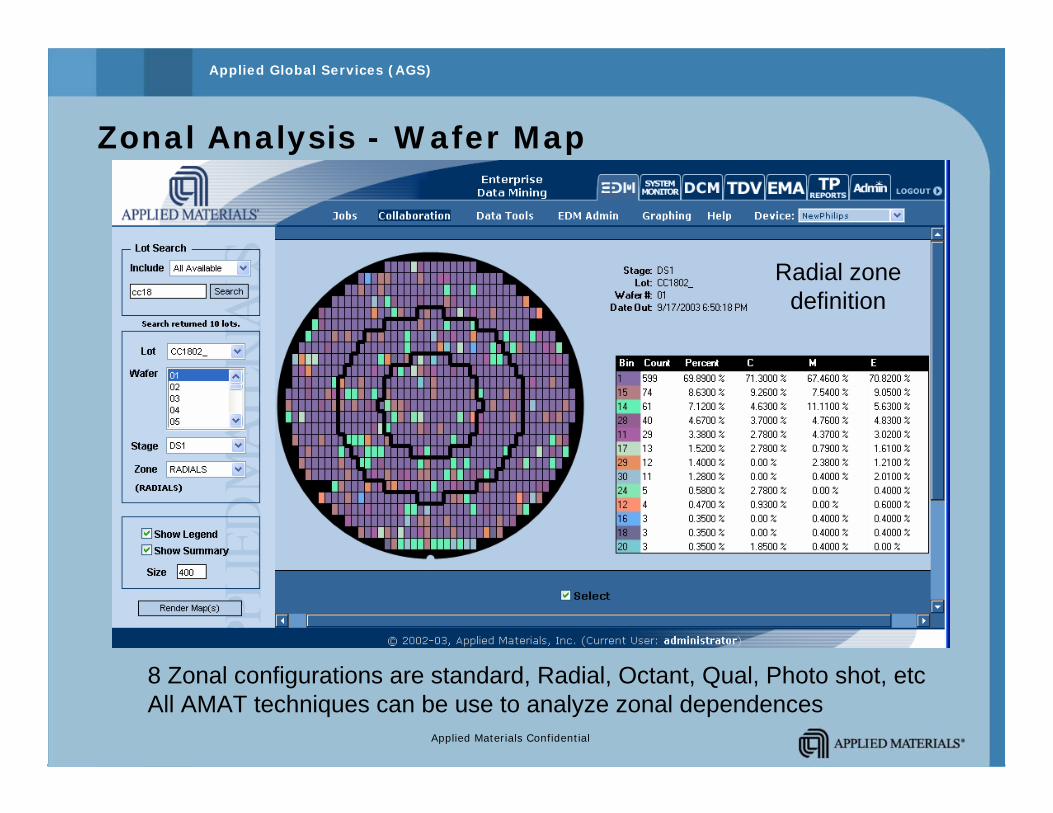
Zonal Analysis - Wafer Map
8 Zonal configurations are standard, Radial, Octant, Qual, Photo shot, etcAll AMAT techniques can be use to analyze zonal dependences
Radial zone definition
Applied Materials Confidential
Applied Global Services (AGS)
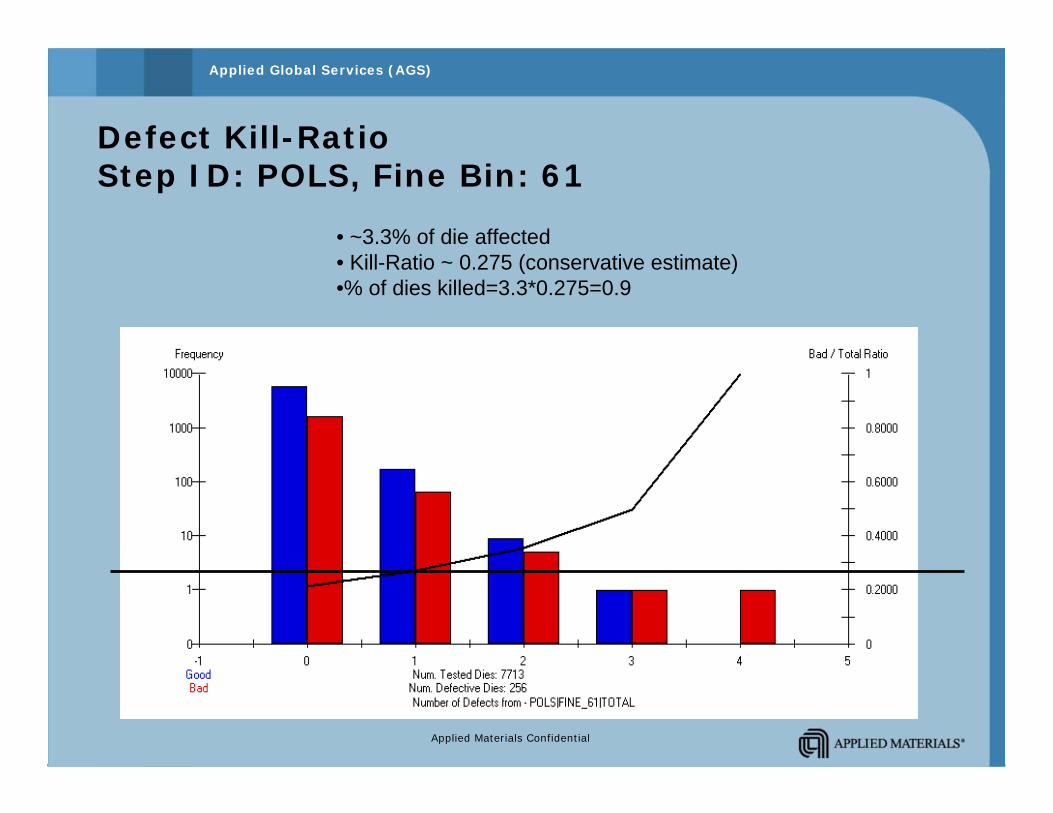
Defect Kill-RatioStep ID: POLS, Fine Bin: 61
• ~3.3% of die affected• Kill-Ratio ~ 0.275 (conservative estimate) •% of dies killed=3.3*0.275=0.9
Applied Materials Confidential
Applied Global Services (AGS)
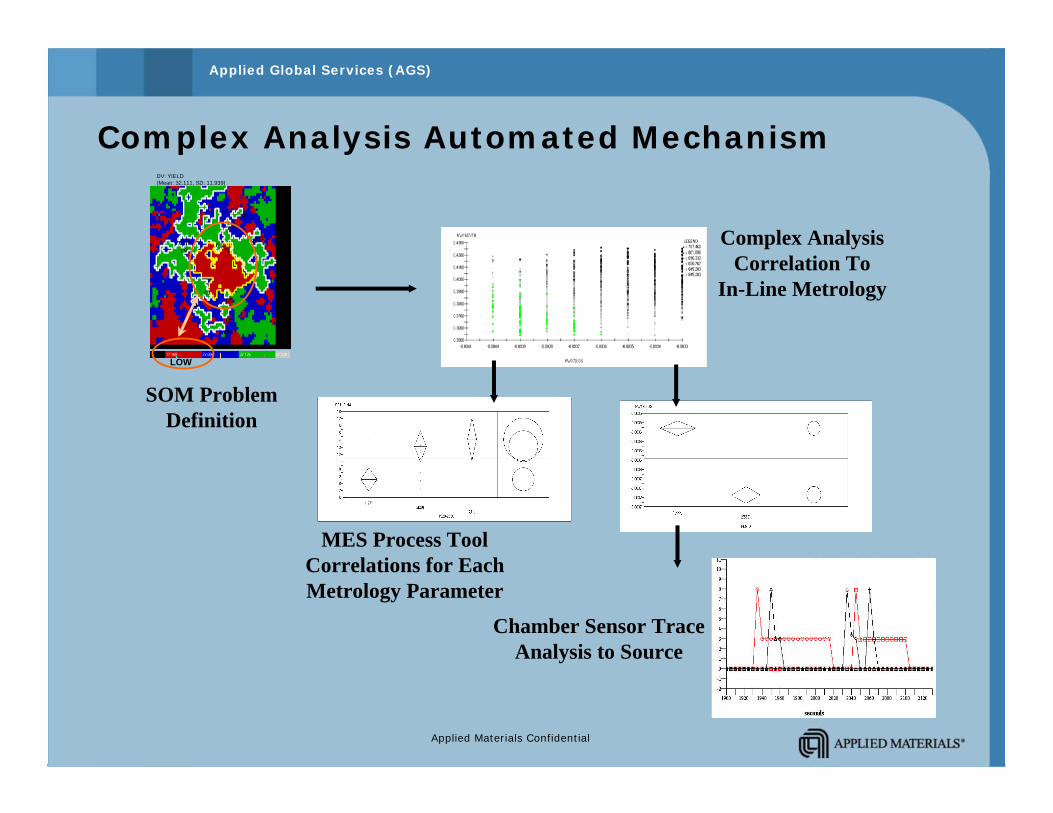
DV: YIELD(Mean: 32.111, SD: 11.939)
LOW
SOM ProblemDefinition
Complex AnalysisCorrelation To
In-Line Metrology
MES Process ToolCorrelations for EachMetrology Parameter
Chamber Sensor TraceAnalysis to Source
Complex Analysis Automated Mechanism
Applied Materials Confidential
Applied Global Services (AGS)
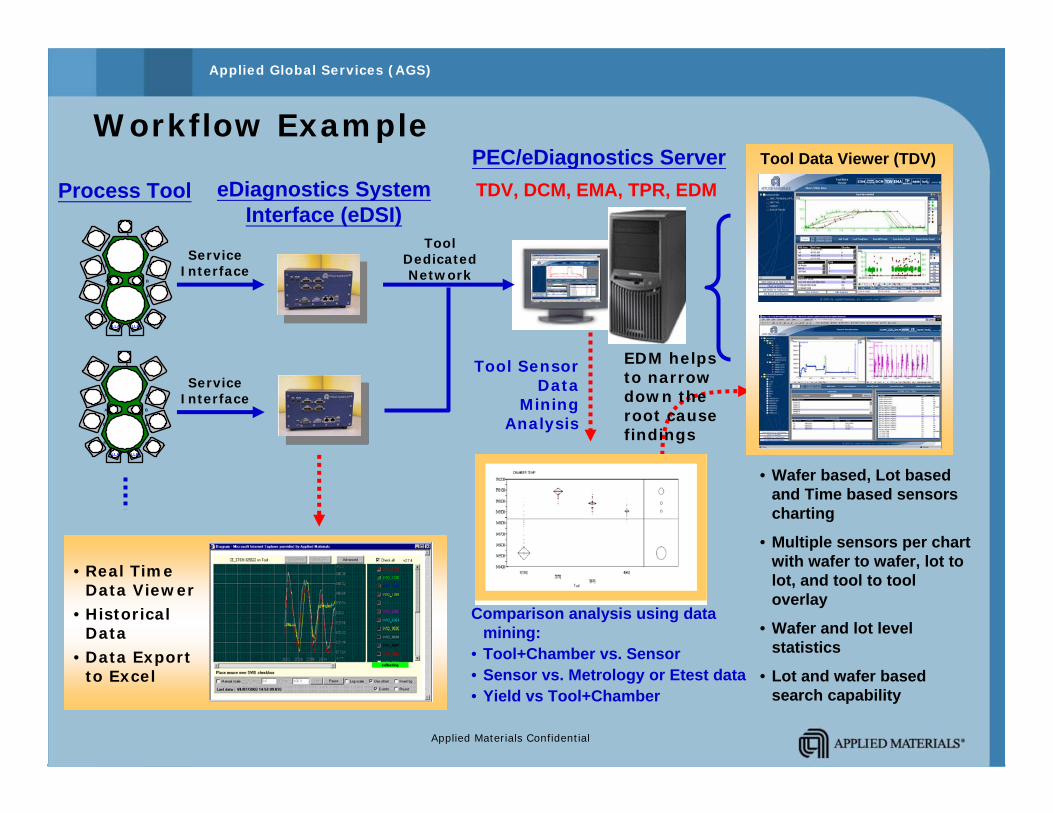
EDM helps to narrow down the root cause findings
Workflow Example
4
DC
A B
1
5
3
E
2
LLBLLA
F
Service Interface
PEC/eDiagnostics ServerTDV, DCM, EMA, TPR, EDM eDiagnostics System
Interface (eDSI)Tool
Dedicated Network
Service Interface
Tool Sensor Data
Mining Analysis
• Real Time Data Viewer
• Historical Data
• Data Export to Excel
• Wafer based, Lot based and Time based sensors charting
• Multiple sensors per chart with wafer to wafer, lot to lot, and tool to tool overlay
• Wafer and lot level statistics
• Lot and wafer based search capability
4
DC
A B
1
5
3
E
2
LLBLLA
F
Process ToolTool Data Viewer (TDV)
Comparison analysis using data mining:
• Tool+Chamber vs. Sensor• Sensor vs. Metrology or Etest data• Yield vs Tool+Chamber
Applied Materials Confidential
Applied Global Services (AGS)
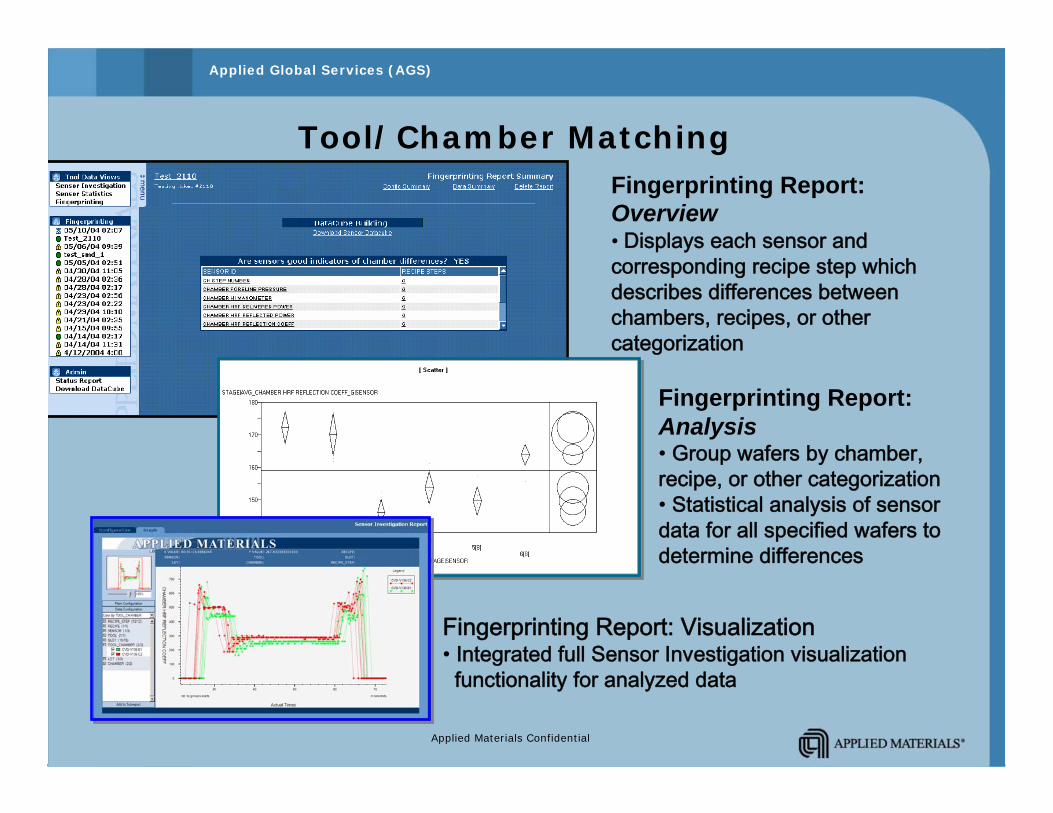
Tool/Chamber MatchingFingerprinting Report: Overview• Displays each sensor and corresponding recipe step which describes differences between chambers, recipes, or other categorization
Fingerprinting Report: Analysis• Group wafers by chamber, recipe, or other categorization• Statistical analysis of sensor data for all specified wafers to determine differences
Fingerprinting Report: Visualization• Integrated full Sensor Investigation visualization
functionality for analyzed data
Applied Materials Confidential
Applied Global Services (AGS)
Practical Example of Datamining
Analysis Case Study 1
Applied Materials Confidential
Applied Global Services (AGS)
Case Study 1
Module engineer wants to perform data-mining on in-line CD metrology and the corresponding tool sensor data to determine if any correlations exist.
Module Engineer is looking for an early warning predictor in the eD data so that a proactive intervention can be performed on the etcher “before” the product CD drifts to far.
TMN would be used to monitor and alarm if control limit(s) are violated on predictor sensor(s)
Overall Project goal was to improve CD CpK as well as optimize and extend the PM window with confidence.
Applied Materials Confidential
Applied Global Services (AGS)
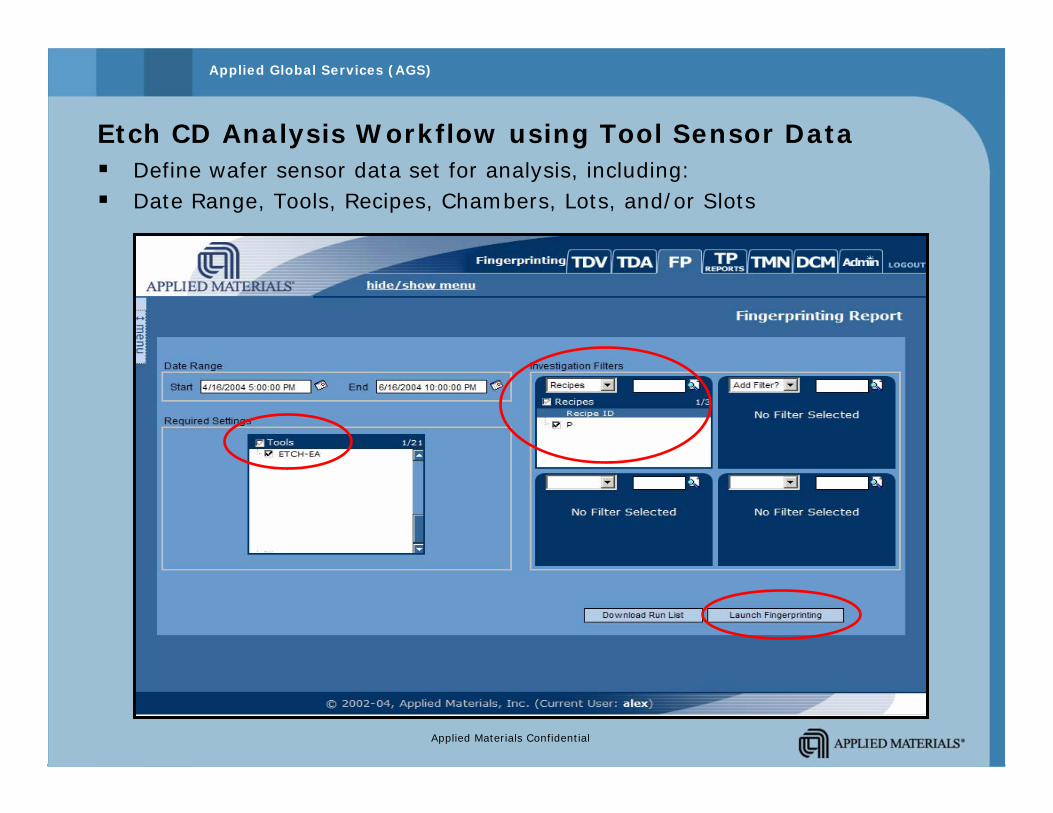
Etch CD Analysis Workflow using Tool Sensor DataDefine wafer sensor data set for analysis, including:Date Range, Tools, Recipes, Chambers, Lots, and/or Slots
Applied Materials Confidential
Applied Global Services (AGS)
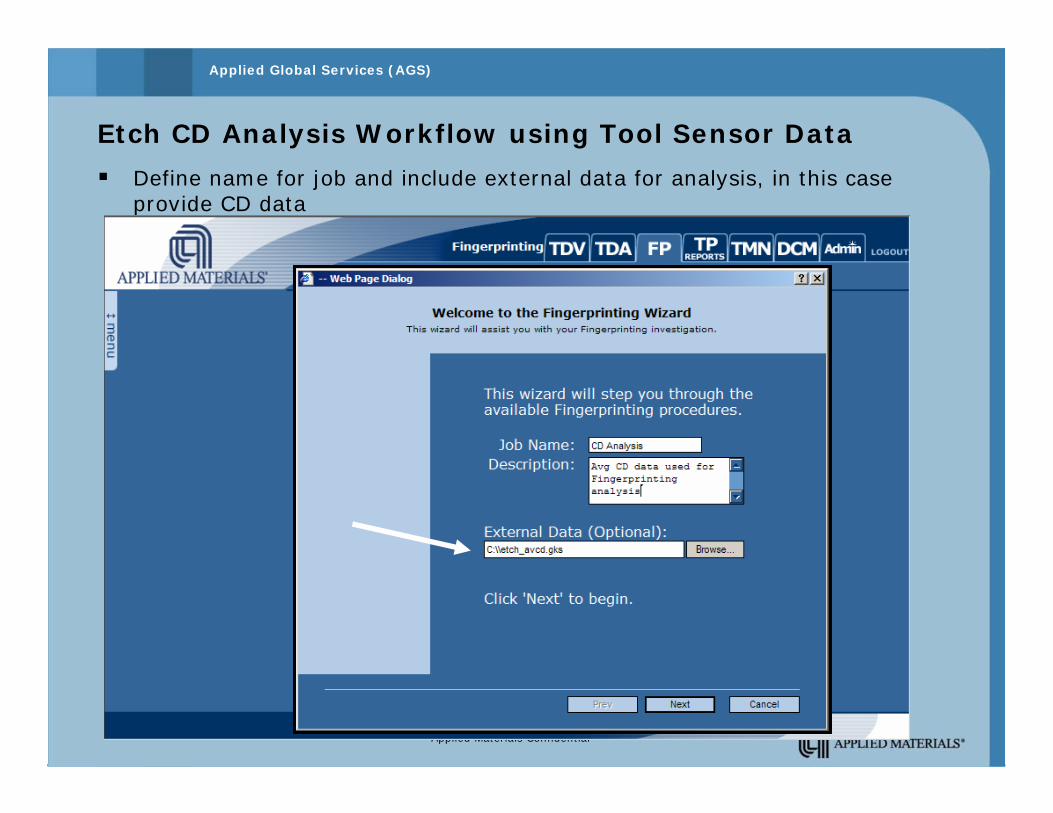
Etch CD Analysis Workflow using Tool Sensor Data
Define name for job and include external data for analysis, in this case provide CD data
Applied Materials Confidential
Applied Global Services (AGS)
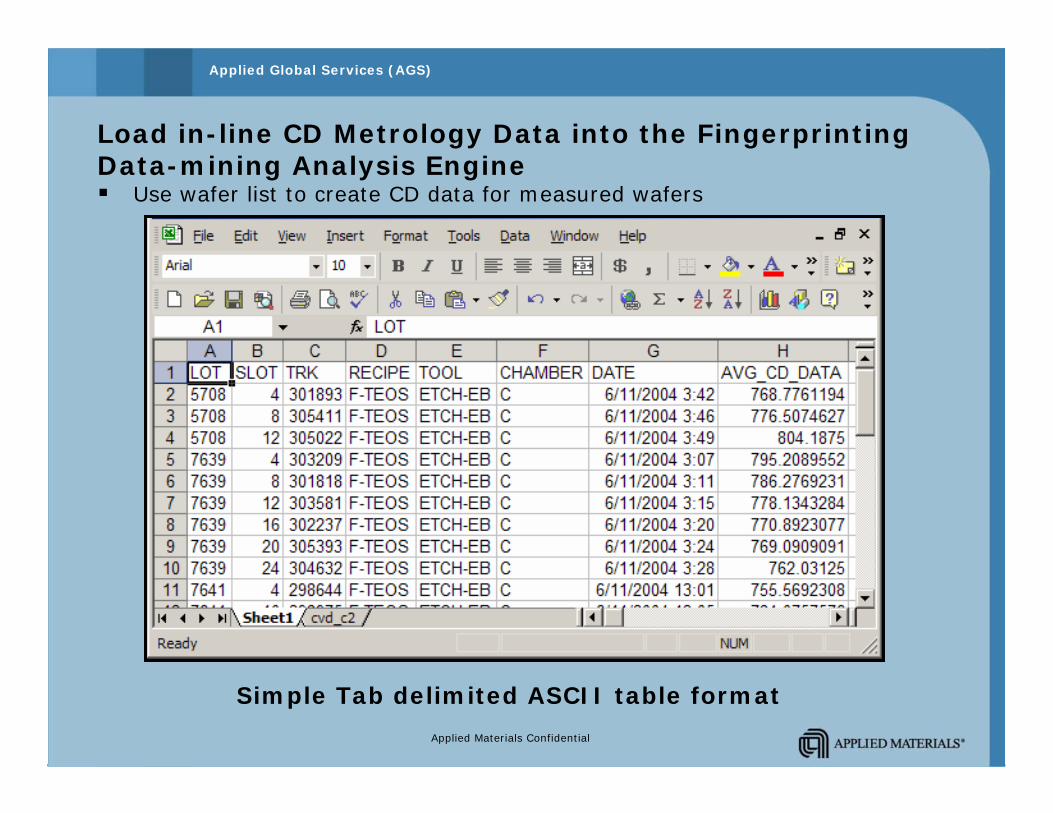
Load in-line CD Metrology Data into the Fingerprinting Data-mining Analysis Engine
Use wafer list to create CD data for measured wafers
Simple Tab delimited ASCII table format
Applied Materials Confidential
Applied Global Services (AGS)
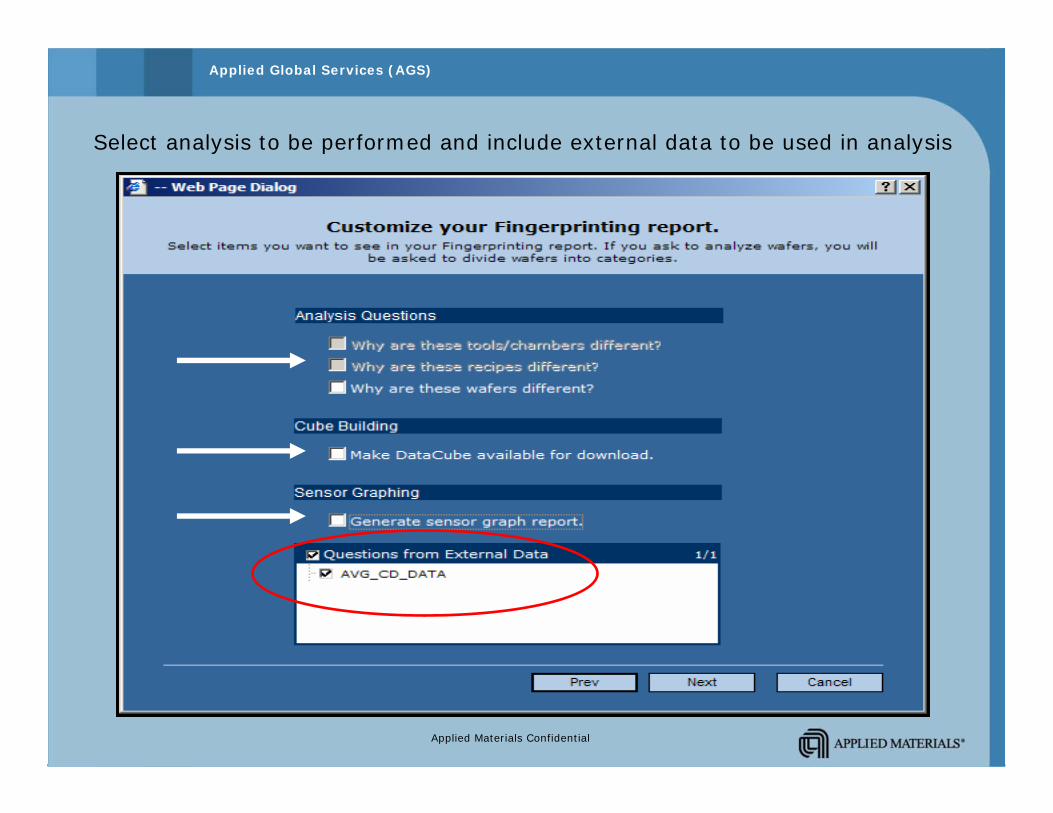
Select analysis to be performed and include external data to be used in analysis
Applied Materials Confidential
Applied Global Services (AGS)
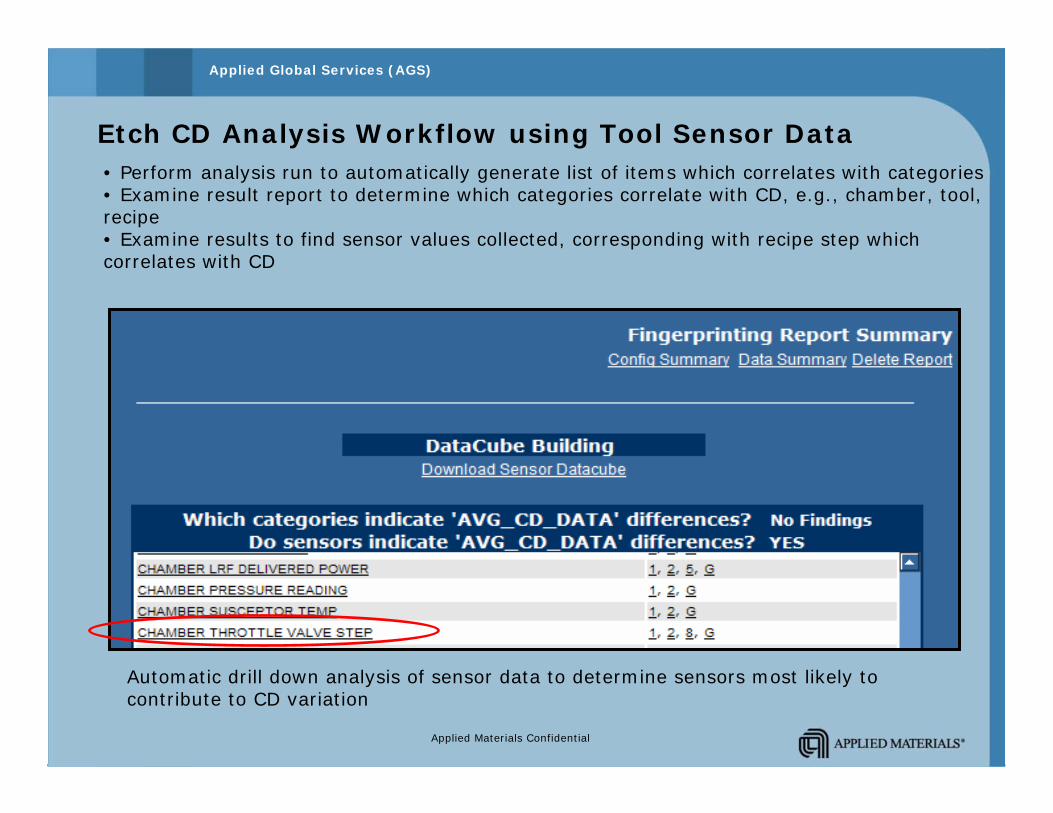
Etch CD Analysis Workflow using Tool Sensor Data• Perform analysis run to automatically generate list of items which correlates with categories• Examine result report to determine which categories correlate with CD, e.g., chamber, tool, recipe• Examine results to find sensor values collected, corresponding with recipe step which correlates with CD
Automatic drill down analysis of sensor data to determine sensors most likely to contribute to CD variation
Applied Materials Confidential
Applied Global Services (AGS)
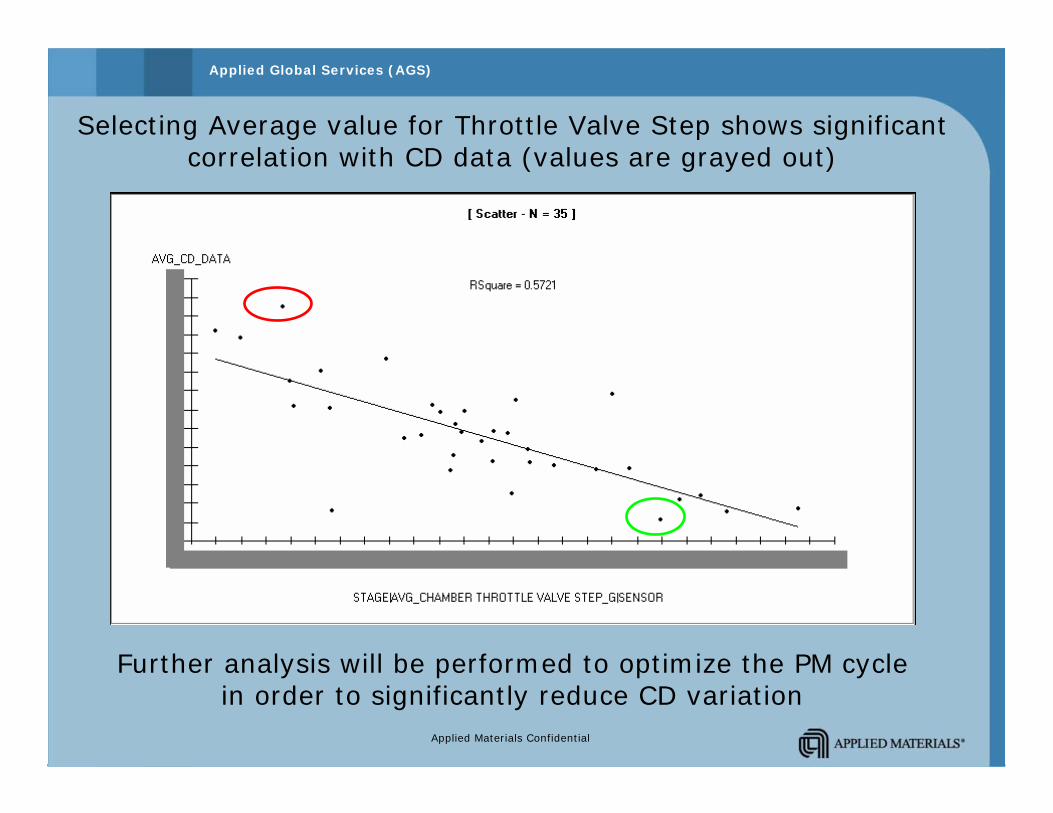
Selecting Average value for Throttle Valve Step shows significant correlation with CD data (values are grayed out)
Further analysis will be performed to optimize the PM cyclein order to significantly reduce CD variation
Applied Materials Confidential
Applied Global Services (AGS)
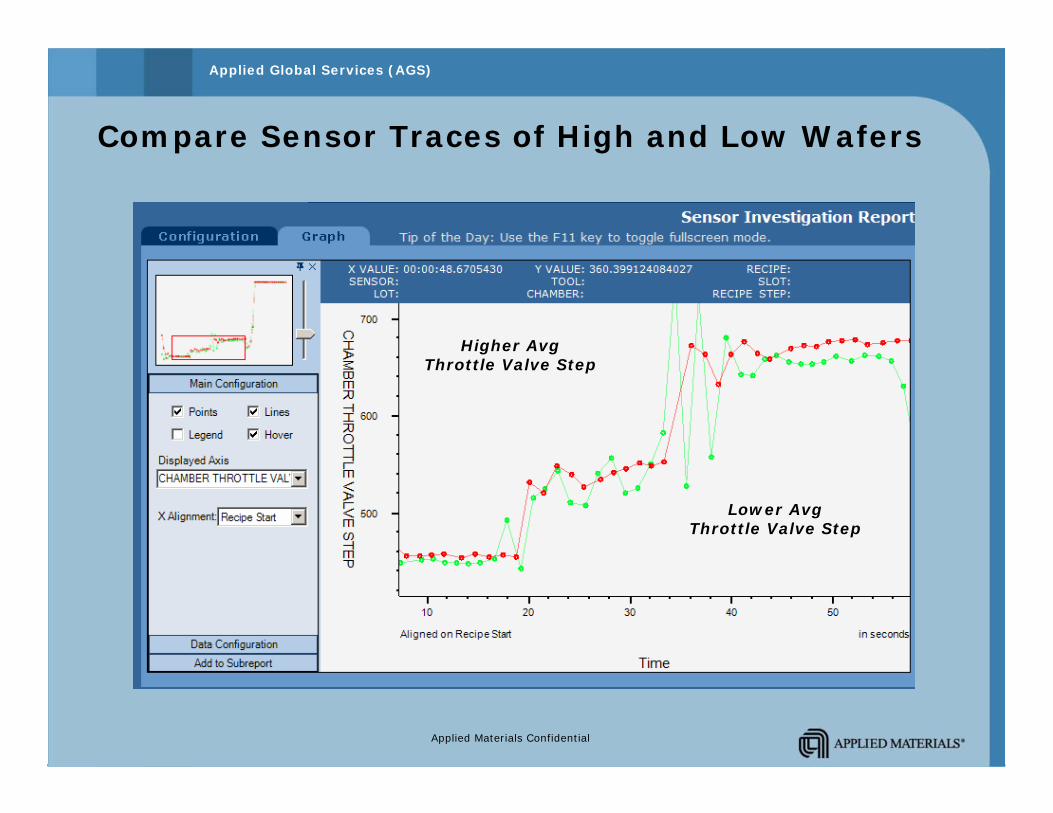
Compare Sensor Traces of High and Low Wafers
Higher AvgThrottle Valve Step
Lower AvgThrottle Valve Step
Applied Materials Confidential
Applied Global Services (AGS)
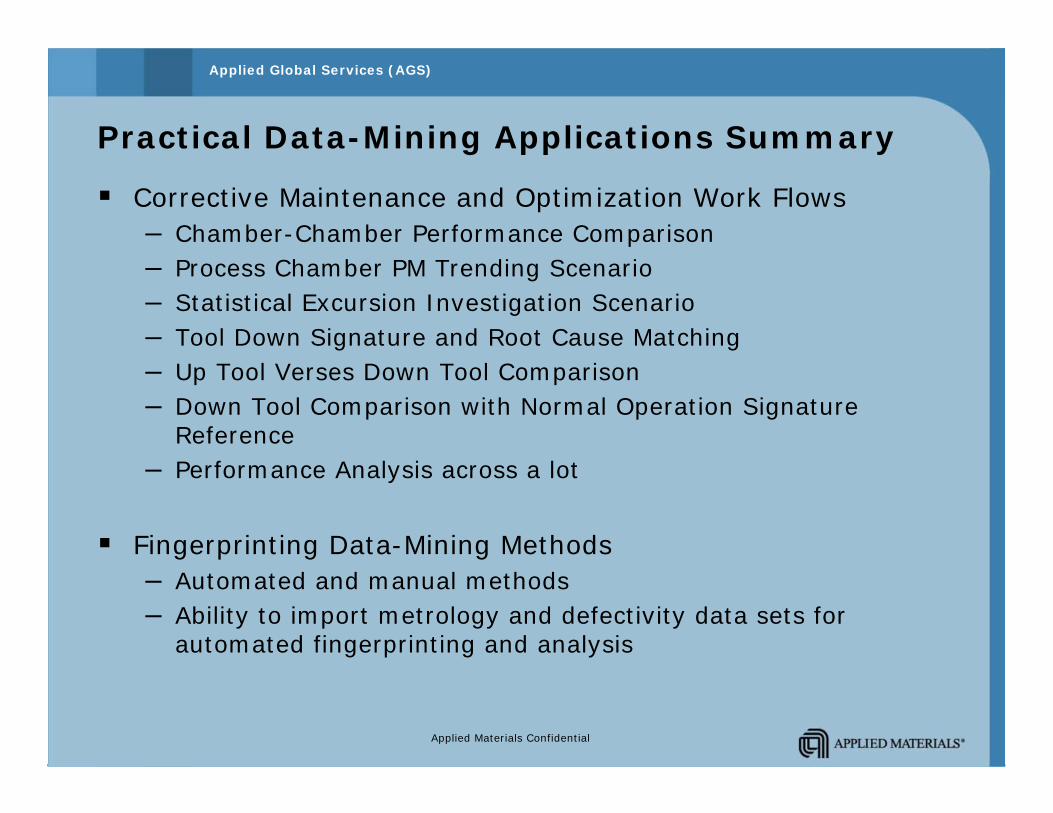
Practical Data-Mining Applications Summary
Corrective Maintenance and Optimization Work Flows– Chamber-Chamber Performance Comparison– Process Chamber PM Trending Scenario– Statistical Excursion Investigation Scenario– Tool Down Signature and Root Cause Matching– Up Tool Verses Down Tool Comparison– Down Tool Comparison with Normal Operation Signature
Reference– Performance Analysis across a lot
Fingerprinting Data-Mining Methods– Automated and manual methods– Ability to import metrology and defectivity data sets for
automated fingerprinting and analysis
Applied Materials Confidential
Applied Global Services (AGS)
Applied EDM/PEC &
Spotfire DecisionSite
Applied Materials Confidential
Applied Global Services (AGS)
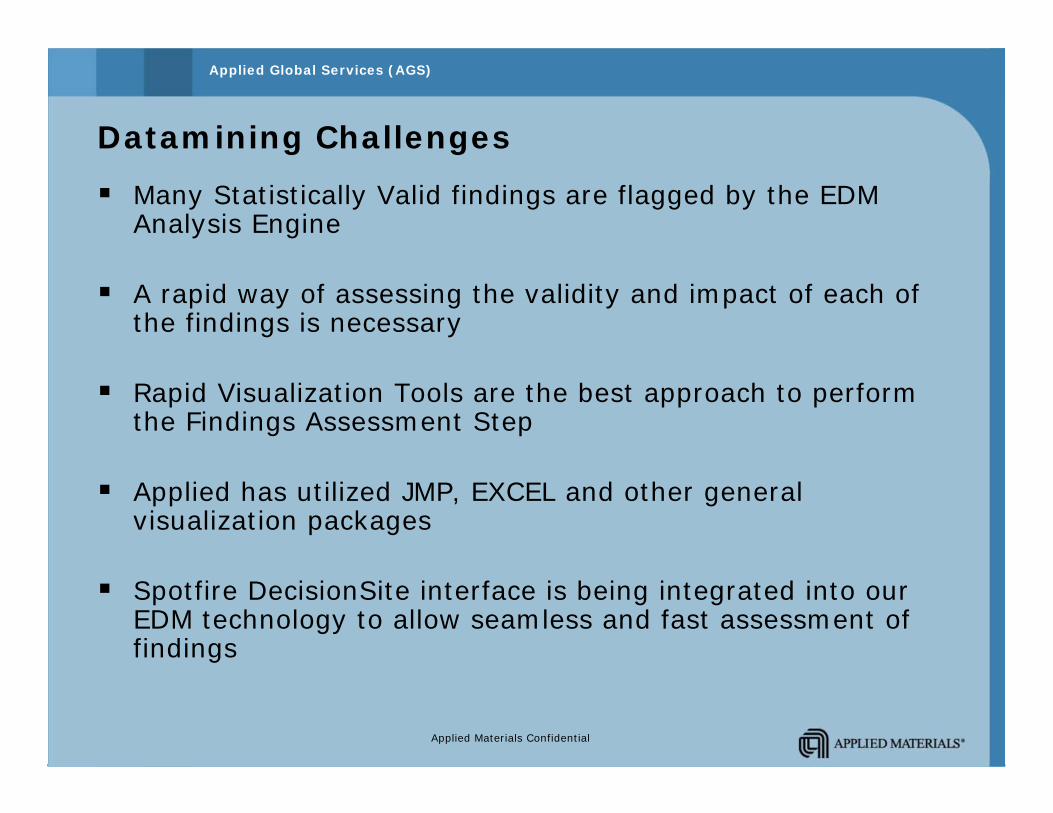
Datamining Challenges
Many Statistically Valid findings are flagged by the EDM Analysis Engine
A rapid way of assessing the validity and impact of each of the findings is necessary
Rapid Visualization Tools are the best approach to perform the Findings Assessment Step
Applied has utilized JMP, EXCEL and other general visualization packages
Spotfire DecisionSite interface is being integrated into our EDM technology to allow seamless and fast assessment of findings
Applied Materials Confidential
Applied Global Services (AGS)
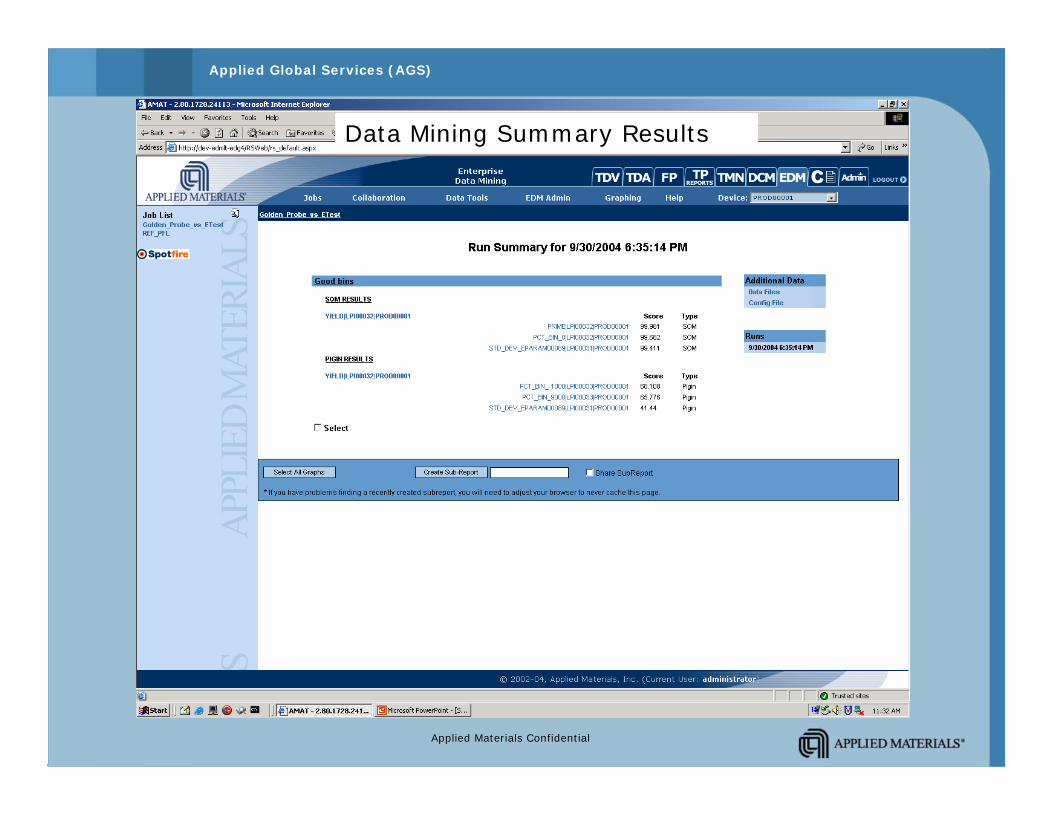
Data Mining Summary Results
Applied Materials Confidential
Applied Global Services (AGS)
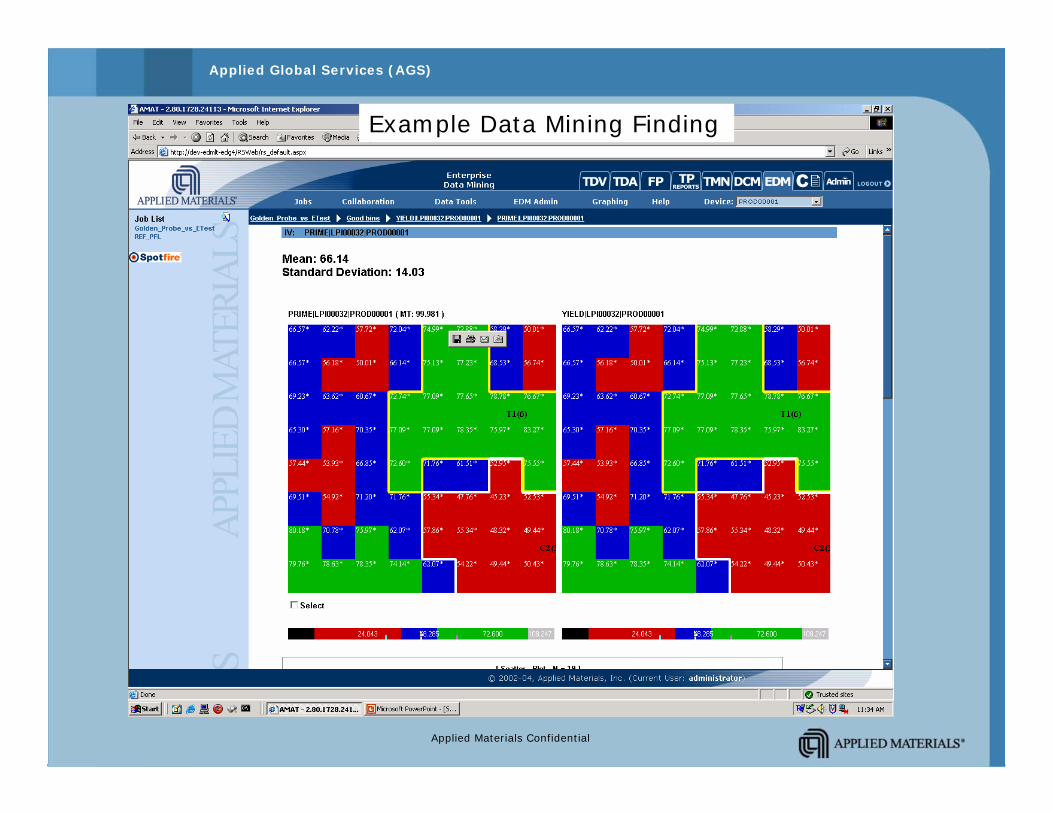
Example Data Mining Finding
Applied Materials Confidential
Applied Global Services (AGS)
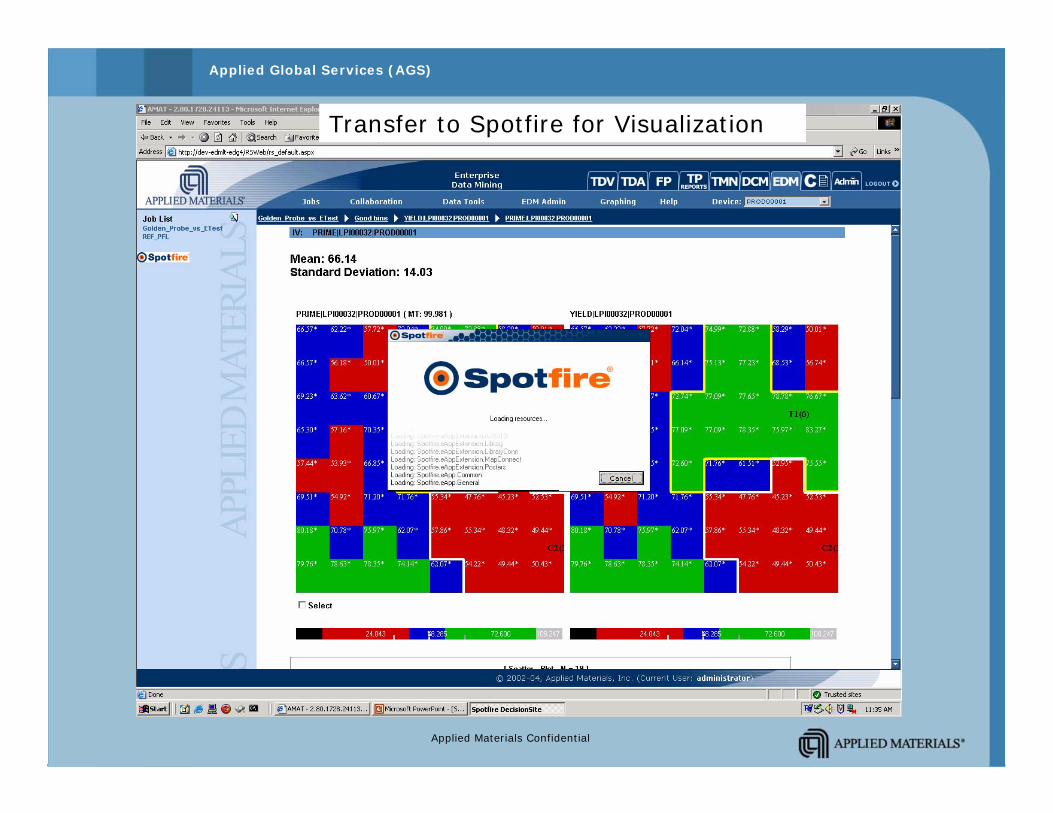
Transfer to Spotfire for Visualization
Applied Materials Confidential
Applied Global Services (AGS)
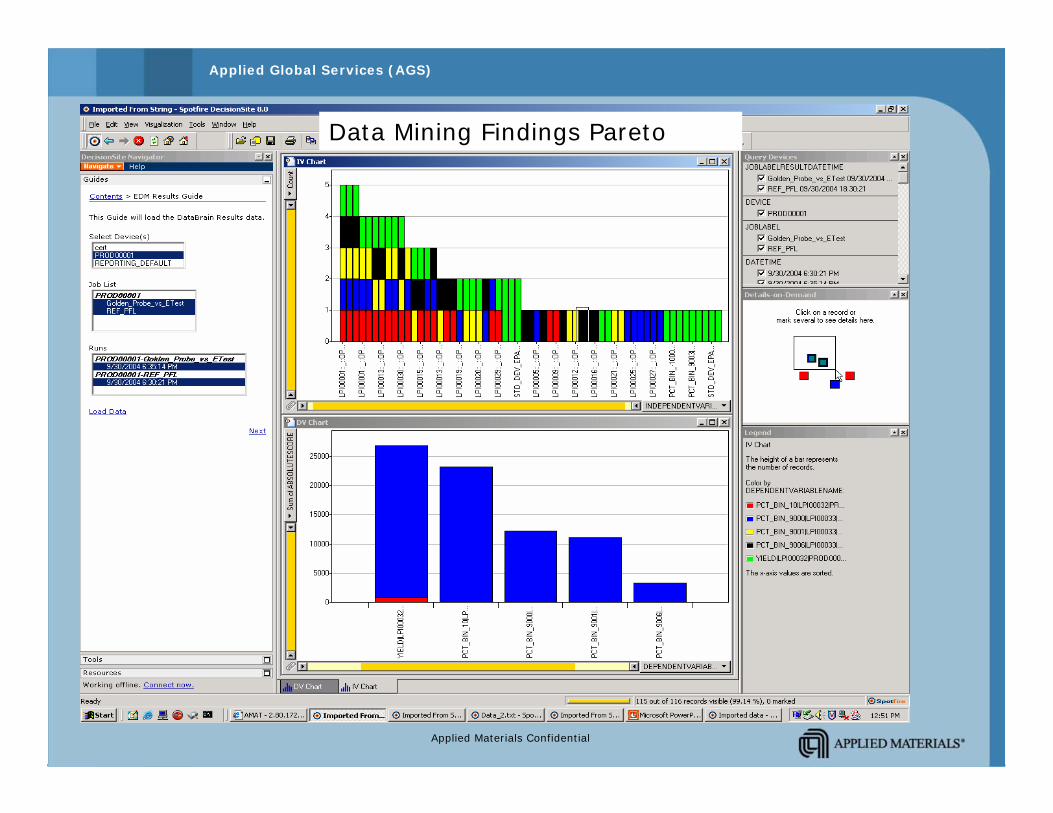
Data Mining Findings Pareto
Applied Materials Confidential
Applied Global Services (AGS)
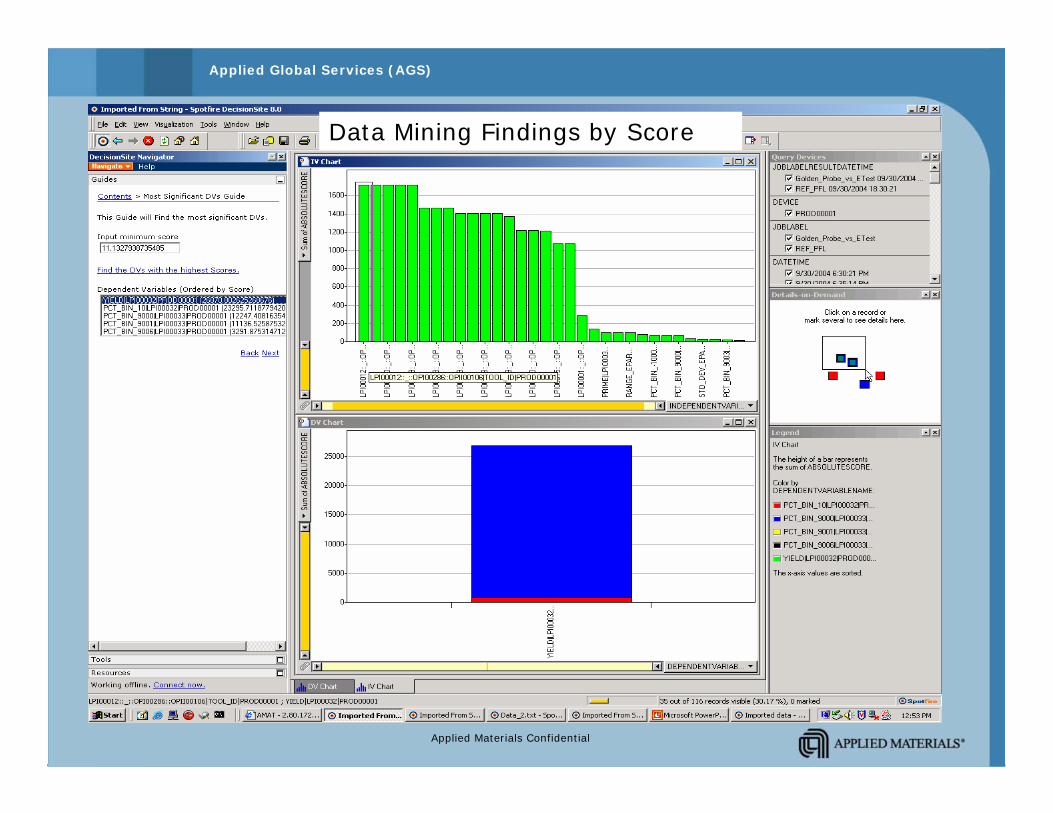
Data Mining Findings by Score
Applied Materials Confidential
Applied Global Services (AGS)
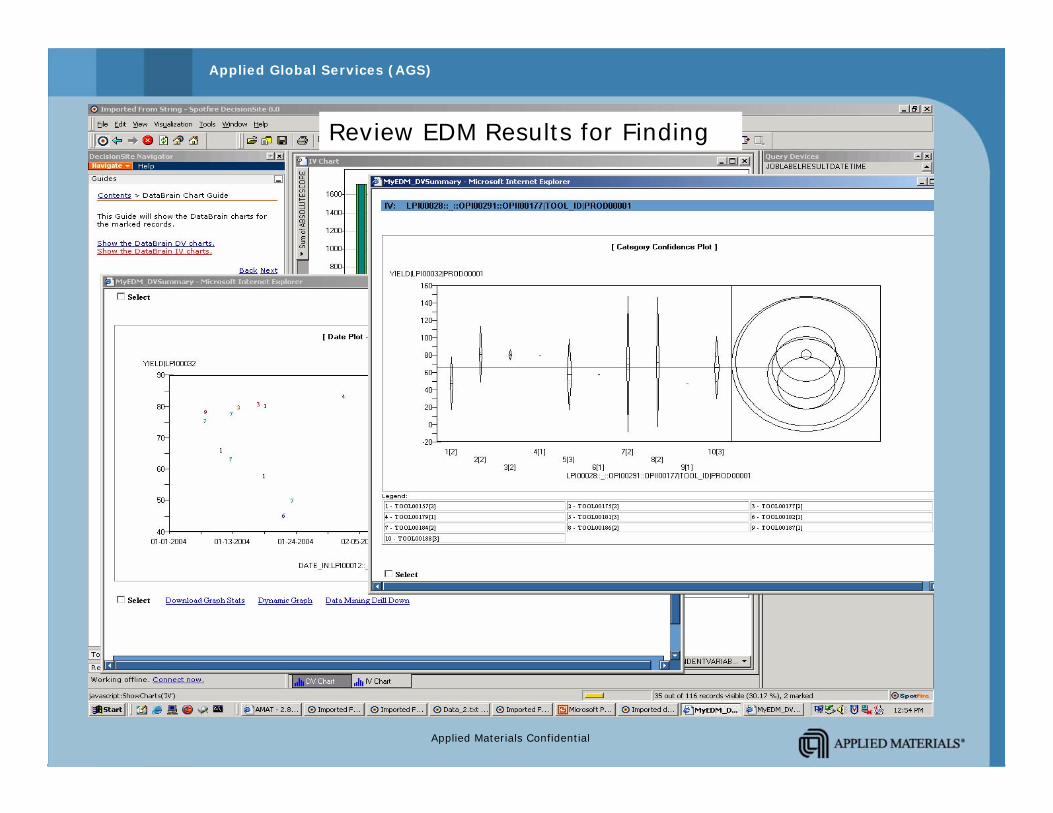
Review EDM Results for Finding
Applied Materials Confidential
Applied Global Services (AGS)
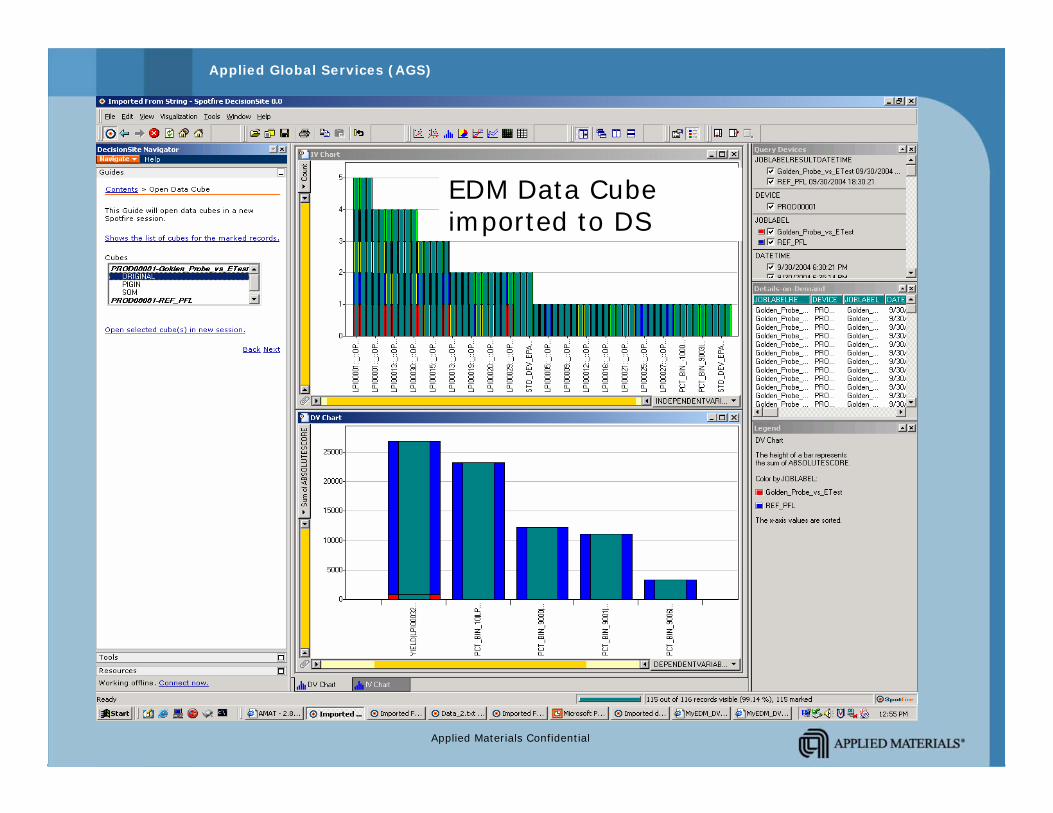
EDM Data Cube imported to DS
Applied Materials Confidential
Applied Global Services (AGS)
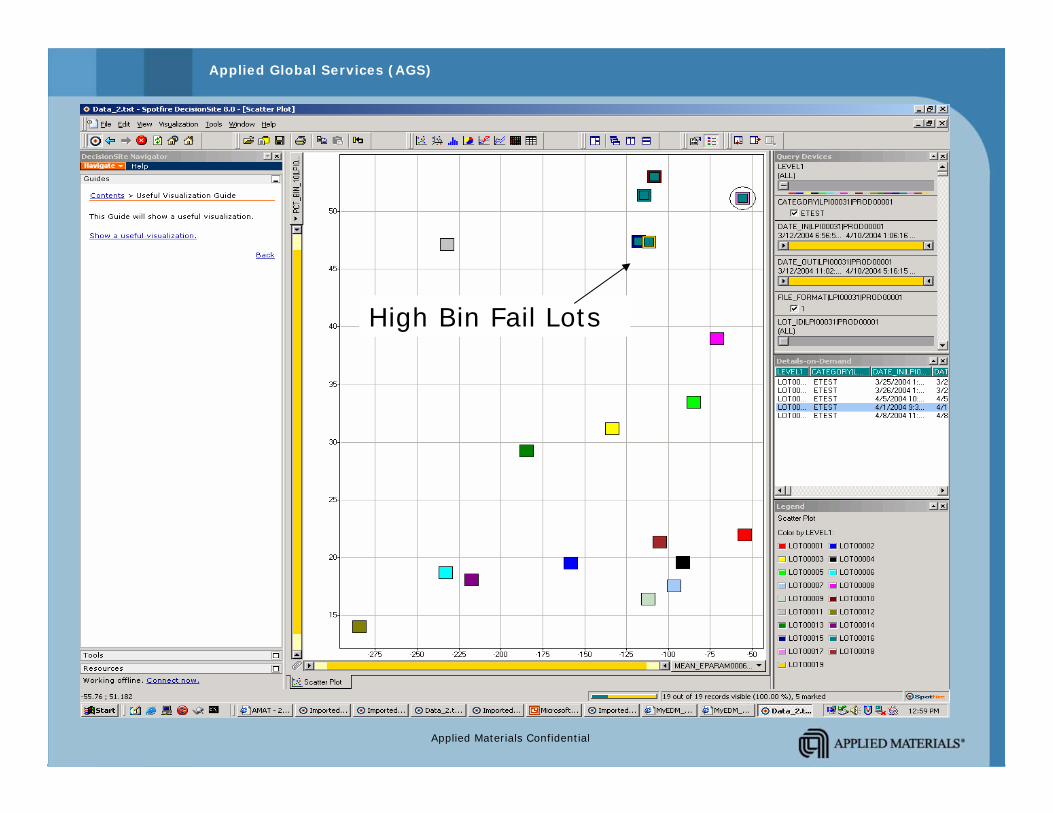
High Bin Fail Lots
Applied Materials Confidential
Applied Global Services (AGS)
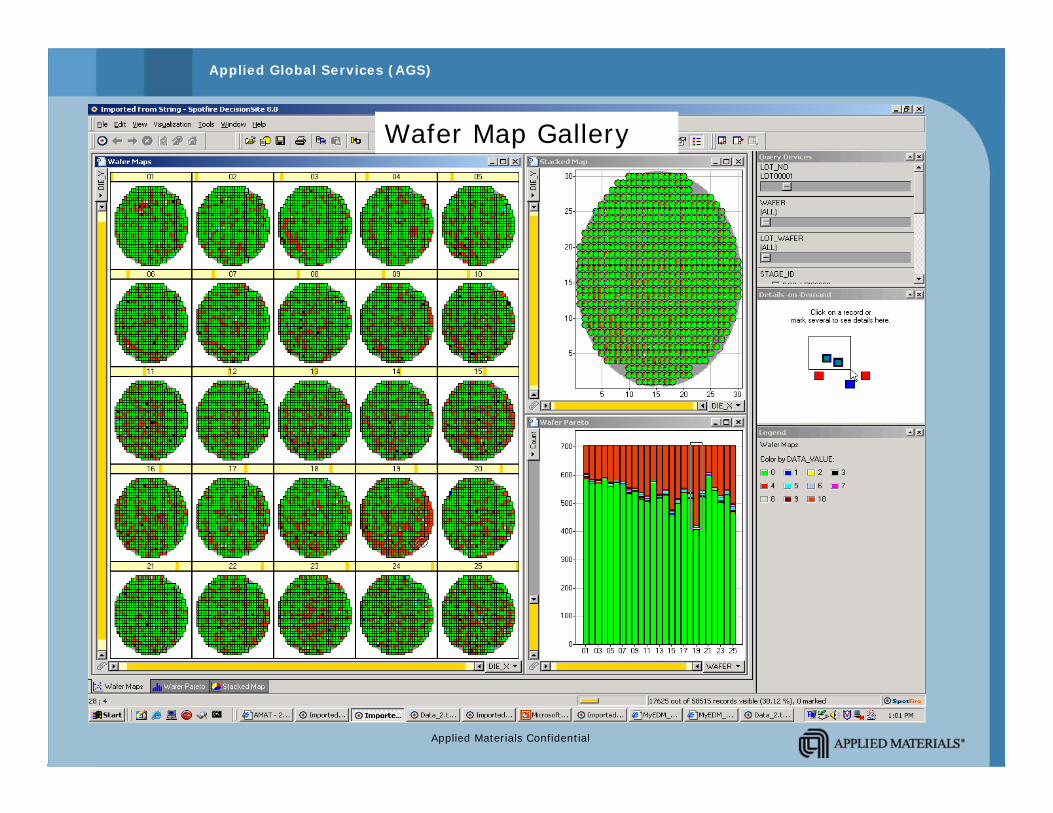
Wafer Map Gallery
Applied Materials Confidential
Applied Global Services (AGS)
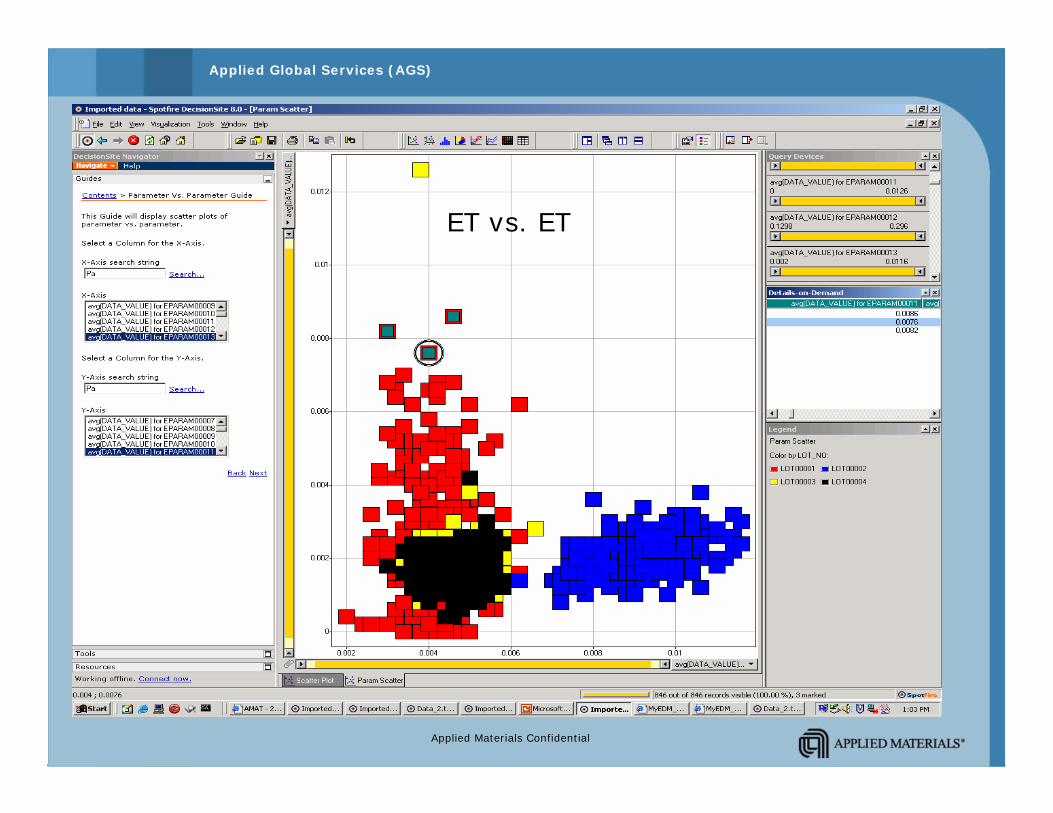
ET vs. ET
Applied Materials Confidential
Applied Global Services (AGS)
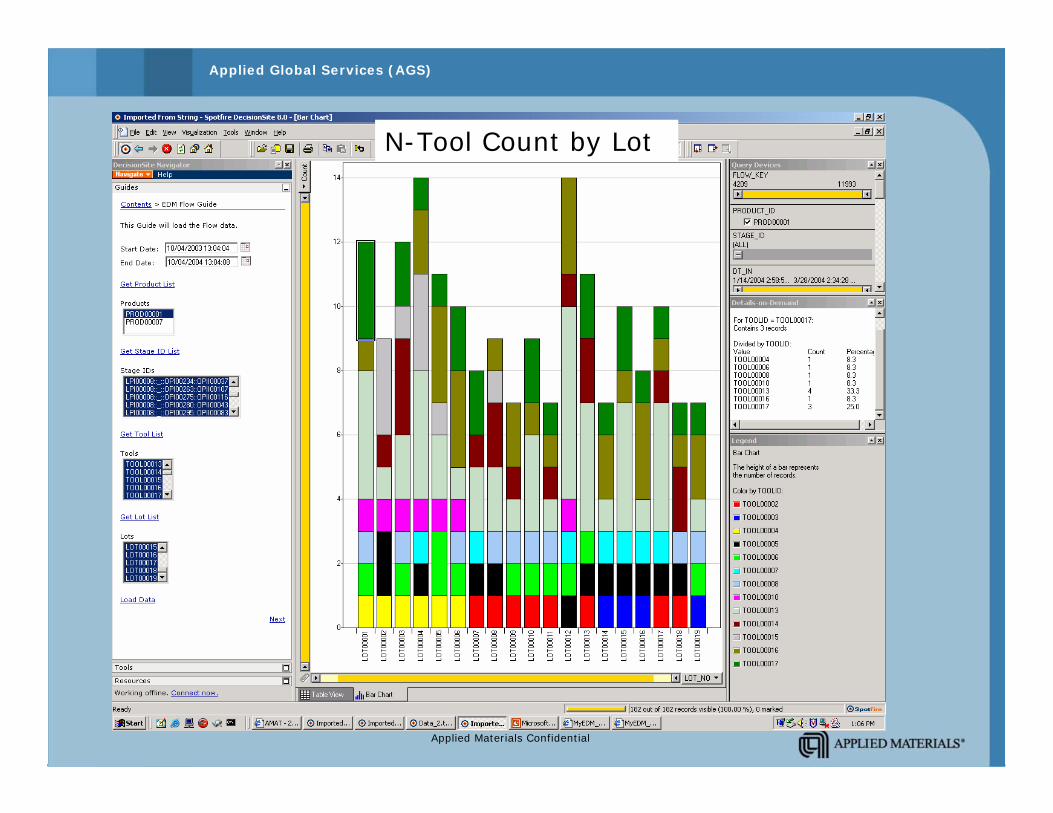
N-Tool Count by Lot
Applied Materials Confidential
Applied Global Services (AGS)
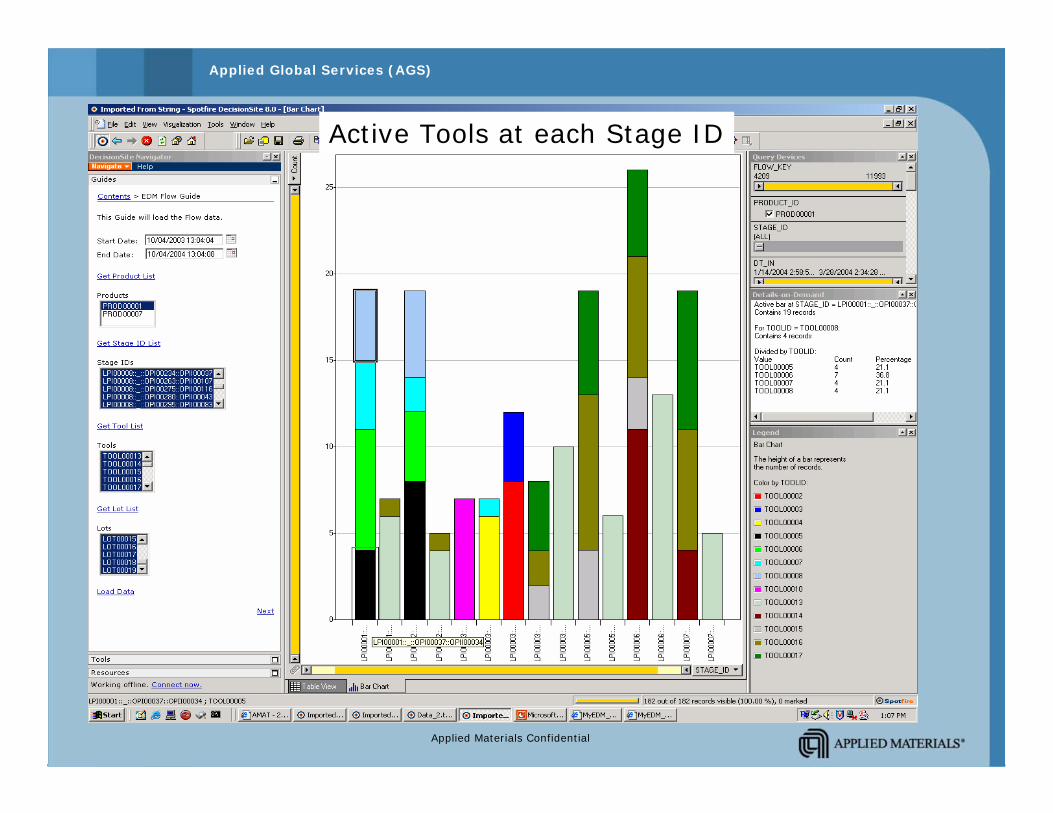
Active Tools at each Stage ID

Applied Materials Confidential
Applied Global Services (AGS)

![Transition probability of Brownian motion in the octant and its ...1801.00362v1 [q-fin.CP] 31 Dec 2017 Transition probability of Brownian motion in the octant and its application to](https://img.pdfslide.us/doc/110x75/5b0c46ac7f8b9af65e8bc9bc/transition-probability-of-brownian-motion-in-the-octant-and-its-180100362v1.jpg)