Embed Size (px)
Citation preview
420 IEEE JOURNAL OU SELECTED AREAS IN COMMUNICATIONS, VOL 14, NO 3, APRIL 1996
Interactive Computation of Coverage Regions for Wireless Communication in Multi floored Indoor Environments
Manish A. Panjwani, Student Member, IEEE, A. Lynn Abbott, Member, IEEE, and Theodore s. Rappaport, Senior Member, IEEE
Abstruct- For indoor wireless communication systems, radio frequency (RF) transceivers need to be placed strategically to achieve optimum communication coverage at the lowest cost. Unfortunately, the coverage region for a transceiver depends heavily on the type of building and on the placement of walls within the building. Traditionally, therefore, transceiver locations have been selected by human experts who rely on experience and heuristics to obtain the optimum (or near-optimum) placement. This paper describes an interactive software system that can be used to assist in transceiver placement. It is intended to be easy to use by individuals who are not experts at wireless communication system design. After the user has selected transceiver locations within a graphical floor plan, the system interprets the floor plan and uses simple path loss models to estimate coverage regions for each transceiver. These regions are highlighted, enabling the user to assess the total coverage. This paper describes the methodology used to compute the coverage regions for multifloored buildings and discusses the effect of interference sources. The resulting system is expected to be useful in the specification of indoor wireless systems.
I. INTRODUCTION
IRELESS radio frequency (RF) communication sys- tems are an attractive alternative to wire-based and
optical-fiber systems in indoor environments. Such systems offer several advantages such as the elimination of wiring around the building, roaming, providing several types of services to a large number of users, the flexibility of relo- cating equipment, and easier maintenance [l], [14]. Examples of indoor wireless systems include personal communication systems (PCS’s), wireless local area networks (WLAN’s), and wireless private branch exchanges (WPBX’s). PCS’s aim at merging cellular and cordless telephone concepts and providing two-way calling, data, voice, and video transmission services. WLAN systems incorporate one or more transceivers that are connected to a conventional cabled network backbone. These transceivers act as central controllers and communicate at RF or infrared frequencies with data terminal equipment (such as personal computers or workstations) that are placed
Manuscript revised November 1995. This work was supported by AT&T Global Information Solutions.
M. A. Panjwani was with the Bradley Department of Electrical Engi- neering, Virginia Polytechnic Institute and State University, Blacksburg, VA 24061-0350 USA. He is now with LCC, L.L.C., Arlington, VA USA.
A. L. Abbot and T. S. Rappaport are with the Mobile and Portable Radio Research Group, Bradley Department of Electrical Engineering, Virginia Polytechnic Institute and State University, Blacksburg, VA 24061-0350 USA.
Publisher Item Identifier S 0733-8716(96)01906-3.
A
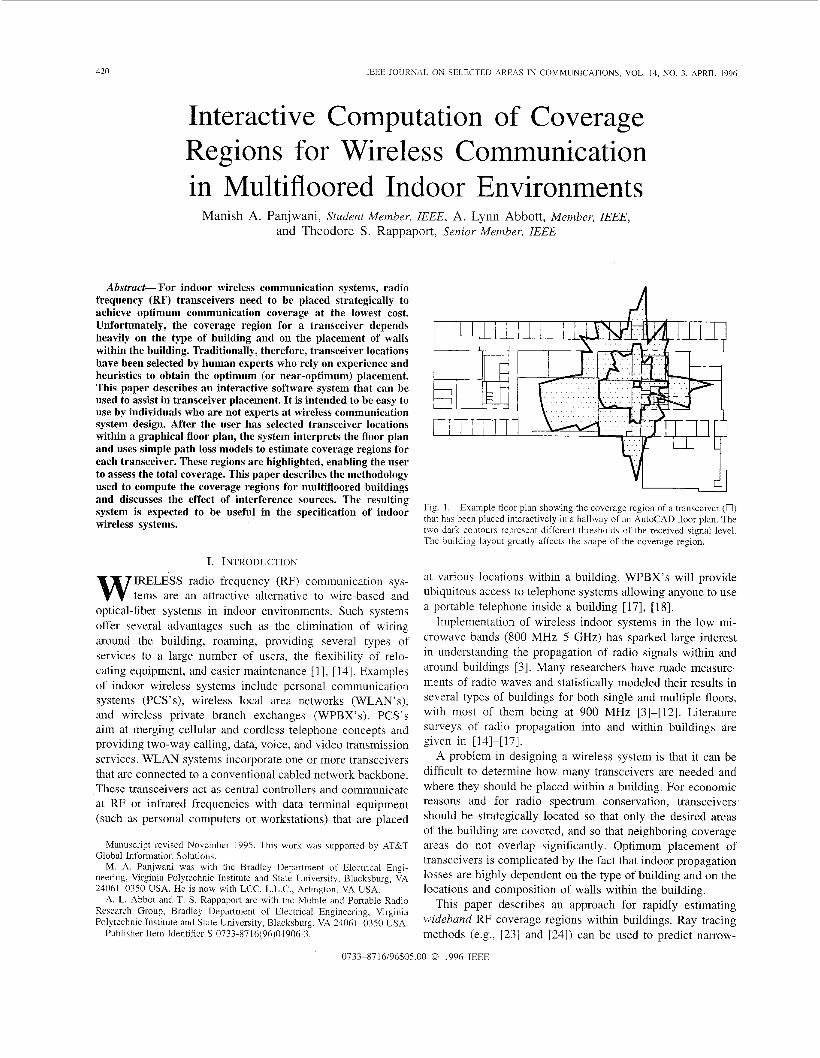
Fig. 1. Example floor plan showing the coverage region of a transceiver (0) that has been placed interactively in a hallway of an AutoCAD floor plan. The two dark contours represent different thresholds of the received signal level. Thc building layout greatly affects the shape of the coverage region.
at various locations within a building. WPBX’s will provide ubiquitous access to telephone systems allowing anyone to use a portable telephone inside a building [ 171, [ 181.
Implementation of wireless indoor systems in the low mi- crowave bands (800 MHz-5 GHz) has sparked large interest in understanding the propagation of radio signals within and around buildings [3] . Many researchers have made measure- ments of radio waves and statistically modeled their results in several types of buildings for both single and multiple floors, with most of them being at 900 MHz [3]-[12]. Literature surveys of radio propagation into and within buildings are given in [14]-[17].
A problem in designing a wireless system is that it can be difficult to determine how many transceivers are needed and where they should be placed within a building. For economic reasons and for radio spectrum conservation, transceivers should be strategically located so that only the desired areas of the building are covered, and so that neighboring coverage areas do not overlap significantly. Optimum placement of transceivers is complicated by the fact that indoor propagation losses are highly dependent on the type of building and on the locations and composition of walls within the building.
This paper describes an approach for rapidly estimating wideband RF coverage regions within buildings. Ray tracing methods (e.g., [23] and [24]) can be used to predict narrow-
0733-8716/96$05.00 @ 1996 IEEE
PANJWANI cf ul.: INTERACTIVE COMPUTATION OF COVERAGE REGIONS FOR WIRELESS COMMUNICATION 421
Variable d 4) PL p L
x, h P
-
n ______
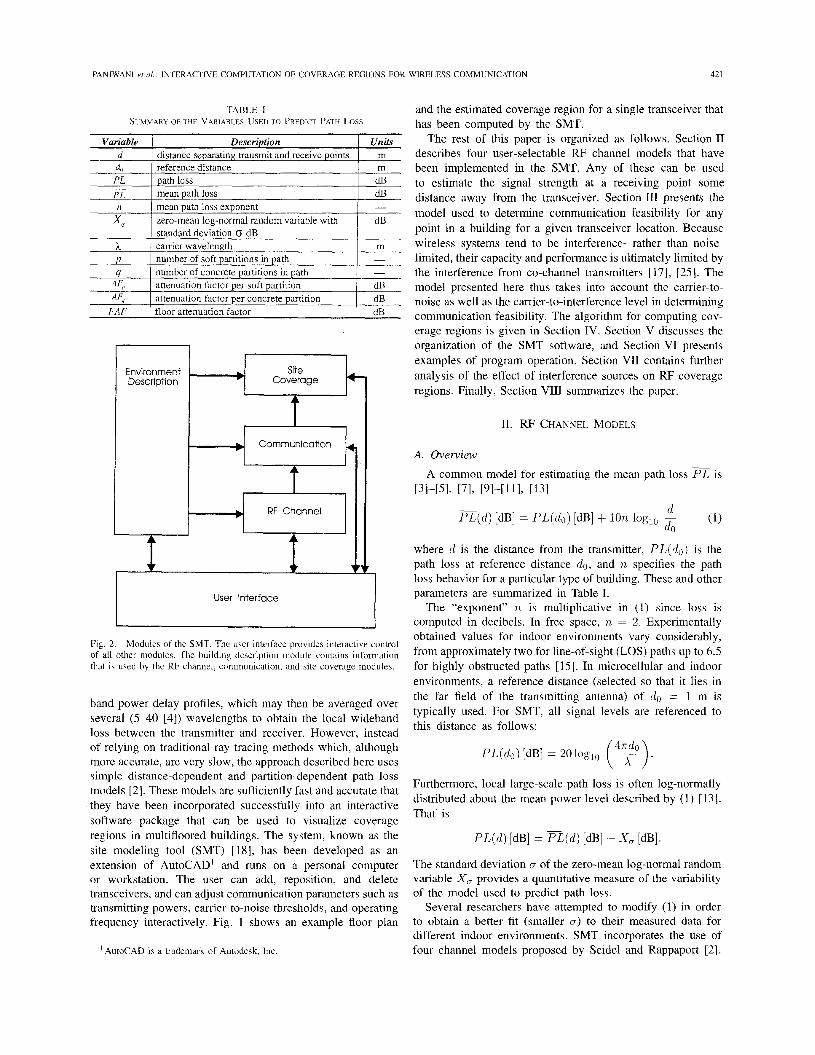
TABLE I SUMMARY OF THE VARIABLES USED TO PREDICT PATH LOSS
Description Units distance separating transmit and receive points m reference distance m path loss dB
dB mean path loss
zero-mean lognormal random variable with dB standard deviation B dB carrier wavelength m
- ~
number of soft partitions in path - 4 I number of concrete partitions in path -
AFq 1 attenuation factor per concrete partition I dB FAF I floor attenuation factor 1 dB
User Interface
I I
Fig. 2. Modules of the SMT. The user interface provides interactive control of all other modules. The building description module contains information that is used by the RF channel, communication, and site coverage modules.
band power delay profiles, which may then be averaged over several ( 5 4 0 [4]) wavelengths to obtain the local wideband loss between the transmitter and receiver. However, instead of relying on traditional ray tracing methods which, although more accurate, are very slow, the approach described here uses simple distance-dependent and partition-dependent path loss models [2]. These models are sufficiently fast and accurate that they have been incorporated successfully into an interactive software package that can be used to visualize coverage regions in multifloored buildings. The system, known as the site modeling tool (SMT) [18], has been developed as an extension of AutoCAD’ and runs on a personal computer or workstation. The user can add, reposition, and delete transceivers, and can adjust communication parameters such as transmitting powers, carrier-to-noise thresholds, and operating frequency interactively. Fig. 1 shows an example floor plan
’ AutoCAD is a trademark of Autodesk, Inc
and the estimated coverage region for a single transceiver that has been computed by the SMT.
The rest of this paper is organized as follows. Section I1 describes four user-selectable RF channel models that have been implemented in the SMT. Any of these can be used to estimate the signal strength at a receiving point some distance away from the transceiver. Section I11 presents the model used to determine communication feasibility for any point in a building for a given transceiver location. Because wireless systems tend to be interference- rather than noise- limited, their capacity and performance is ultimately limited by the interference from co-channel transmitters [ 171, [25]. The model presented here thus takes into account the carrier-to- noise as well as the carrier-to-interference level in determining communication feasibility. The algorithm for computing cov- erage regions is given in Section IV. Section V discusses the organization of the SMT software, and Section VI presents examples of program operation. Section VI1 contains further analysis of the effect of interference sources on RF coverage regions. Finally, Section VI11 summarizes the paper.
11. RF CHANNEL MODELS
A. Overview A common model for estimating the mean path loss is
[31-[51, V I , [91-[11], [13]
(1) P L ( d ) [dB] = PL(do) [dB] + 1071. log,O 7 d
U0
where d is the distance from the transmitter, PL(do) is the path loss at reference distance do, and n specifies the path loss behavior for a particular type of building. These and other parameters are summarized in Table I.
The “exponent” n is multiplicative in (1) since loss is computed in decibels. In free space, n = 2. Experimentally obtained values for indoor environments vary considerably, from approximately two for line-of-sight (LOS) paths up to 6.5 for highly obstructed paths [15]. In microcellular and indoor environments, a reference distance (selected so that it lies in the far field of the transmitting antenna) of do = 1 m is typically used. For SMT, all signal levels are referenced to this distance as follows:
Furthermore, local large-scale path loss is often log-normally distributed about the mean power level described by ( I ) [13]. That is
PL(d) [dB] = E($) [dB] + X , [dB].
The standard deviation cr of the zero-mean log-normal random variable X , provides a quantitative measure of the variability of the model used to predict path loss.
Several researchers have attempted to modify (1) in order to obtain a better fit (smaller cr) to their measured data for different indoor environments. SMT incorporates the use of four channel models proposed by Seidel and Rappaport [2].
422 IEEE JOURNAL ON SELECTED AREAS IN COMMUNlCATIONS, VOL. 14, NO. 3, APRIL 1996
These models utilize relatively simple but strikingly accurate prediction rules to estimate the wideband signal loss between any two points inside a building based on the effects of walls, office partitions, floors, and building layout. Two of the models are valid when the transmitter and receiver are on the same floor, and the remaining two models apply when different floors are involved. In an interactive site modeling system, the user may choose which models to use. The remainder of this section briefly summarizes these four models.
B. Single-Floor Models
1 ) Distance-Dependent Path Loss Model: This model uses (1) directly and does not depend explicitly on the partition locations in the floor plan. While using this model, the SMT allows the user to enter a value for n directly or to choose from a range of values for several building types.
2) Partition-Attenuation-Factor Path Loss Model: This model is similar to the one proposed in [20] for floors and walls. It assumes that the signal attenuates as in free space (n = 2) and attributes all additional path loss directly to intervening soft partitions and concrete walls
d m(d) [dB] = PL(do) [dB] + lOn(freespace) loglo -
dn + pAFp [dB] + qAF, [dB].
Typical values for AF, and AF, are 1.4 dBIpartition and 2.4 dB/partition, respectively [2].
C. Multi$oor Models
Both multifloor models are used only when the transmit and receive locations are on different floors of the building.
1) Distance-Dependent Path Loss Model: This model is similar to the first model in Section 11-B above, except that a larger value of n (typically between 4-5.5 for one to three floors [2], [lo]) is chosen to account for the increased attenuation of intervening floors. This may be represented as follows:
~ d
do PL(d ) [dB] = PL(d0) [dB] + l O n ( m ~ l t i f l ~ o r ) log,, -.
2 ) Floor-Attenuation-Factor Path Loss Model: This model is also similar to the first model given in Section 11-B. How- ever, the additional path loss caused by intervening floors is now added explicitly as the quantity floor-attenuation-factor (FAE;)
- PL(d) [dB] = PL(d0) [dB] + lOn(samefloor)
d do
.log,, - + F A F [dB].
Typical values for FAF, which are a function of the number of intervening floors, are about 15 dB for one floor of separation and an additional 6-10 dB for every additional floor up to five floors. There is no significant increase in FAF for more than five floors of separation [16].
Based on the current body of literature, there appear to be no significant effects of frequency on path loss for the same floor models [2]. The values of FAF, however, have been observed to be smaller at 900 MHz than at 1.7 GHz by about 6 dB [8].
111. COMMUNICATION FEASIBILITY MODEL
Communication feasibility at a given point is defined as the ability to receive a signal which exceeds the minimum required carrier-to-noise, receiver sensitivity, and (if any inter- ference sources are present) carrier-to-interference thresholds by a specified margin, and which therefore allows acceptable communication quality. It relies heavily on estimates of path attenuation from the chosen RF channel model for specified and undesired transmitters on the given floor plan.
In order to determine whether communication is feasible, it is necessary to compare the received carrier power G and carrier-to-noise ratio CIN with the user-specified receiver sensitivity CInin and specified minimum required carrier-to- noise ratio (C/Nmln) at the point under consideration. The likely allocation of only a limited range of radio frequencies for a particular wireless indoor system will require extensive frequency reuse within buildings in order to support many users. Since co-channel interference is the dominating factor in limiting capacity, it is essential to understand, estimate, and incorporate its influence on the coverage regions. Therefore, if a number of single-tone interference sources (co-channel trans- mitters) are present, the received carrier-to-interference ratio (co-channel interference) C / I is compared with the minimum allowed value ( C/I)mln. Electromagnetic equipment such as computers, CRT’s, elevators, TV’s, and microwave ovens are often found near transceivers and add to the ambient noise. Therefore, the calculation of noise power N , in addition to thermal noise, also incorporates the effect of this environmen- tal noise. Recent studies indicate that the mean power level of this noise is typically about 18 dB above the thermal noise floor at 900 MHz [19].
Consider a transceiver with transmit power Pt and a receiv- ing point at a distance dt from the transceiver. The carrier power C‘ at the receiving point is given by
(2) C [dBm] = Pt [dBm] - x ( d t ) [dB]
P,[W] = kTB
and the white noise Pn present at the receiver input is given by
where k = 1.38 x lopz3 J/K is Boltzmann’s constant, T is the absolute room temperature in degrees Kelvin, and B is the RF channel bandwidth in Hz. Also consider the effect of environmental noise P, on the carrier-to-noise ratio. The total noise power at the receiving point is therefore
Zii [dBm] = lO10g,~ (-) pn + lO10g,~ (&) (3) 1 mW
and the overall input carrier-to-noise ratio is given by CIN, using (2) and (3).
Now consider n single-tone interference sources, each trans- mitting with power P, ( i = 1; 2, . . . , n) and at a distance d, from the receiver. The interference power 1, at the receiver due to any single interference source is given by
(4)
We assume that interferers may be added on a power basis. The total interference power at the receiving point due to all
I, [dBm] = P, [dBm] - m(d,) [dB].
423 PANJWANI et al.: INTERACTIVE COMPUTATION OF COVERAGE REGIONS FOR WIRELESS COMMUNICATION
_. .
-50 0 50 100 150 Fig. 3. Effect of aingle-tone interferer (0). The coverage area is changed considerably by the interference source. x (4
Fig. 5. Contour plot of 1,' in dB. The transcciver is located at the origin.
Fig. 4. Second example floor plan. This is one floor of Virginia Tech's Veterinary Medicine building. Three transceivers have been placed as a first attempt to provide complete Roor coverage.
the interference sources is then given by
n
I = kJi i=l
-50 0 50 1 0 0 150
x (m) Fig. 6. Contour plot of V in dB. The transceiver is located at the origin and the interferer is located at (40, 0). The positive and negative maxima arise at the location of the transceiver and interferer, respectively.
The 3-dB threshold in (9) is commonly used in the industry. If no interference sources are present, then (9) reduces to ( 5 )
where the coefficients ki are determined by the transceiver ( U > 0 ) and ( W > 0 )
receive filter characteristics. The overall received carrier-to- interference ratio at the receiver input can now be written as C / I , using (2), (4), and (5 ) .
Finally, let us define variables U , V, and w as follows:
Depending on the exact specifications of ( c / ~ ) ~ ~ ~ , cmin, and N , the smaller of the coverage regions of U and w deter- mines the area of influence of the transceiver. In Sections IV and V, we assume that U < w at any given point. Since U will always, therefore, violate (10) before W will, it defines the limit of the transceiver's region of influence, and W can be ignored. If W were greater than U , we could simply substitute
(6)
W for U at all steps in the following analysis. (7)
W = C - Cnlirl [dB]. (8)
Communication is deemed feasible at a point if the following condition is satisfied:
Iv . CALCULATION OF COVERAGE REGIONS
By definition, the coverage region for a transceiver is the set of nearby points for which communication is feasible, as determined by (9) in the previous section. We assume that signals propagate equally in all directions from a transmitter. The default coverage region is, therefore, circular for a given floor (or spherical if three dimensions are considered). When interference sources are present, or when walls are present and
[(U > 0) and (V > 3 ) and (W > O)]
[(U > 3 ) and (V > 0) and (W > O)] .
or
(9)
424
80
60
40
20
0
-20
-40
-60 -1
IEEE JOUILWAL ON SELECTED AREAS IN COMMUNICATIONS, VOL. 14, NO. 3, APRIL 1996
I I I I
0 -50 0 50 100 150 x (m)
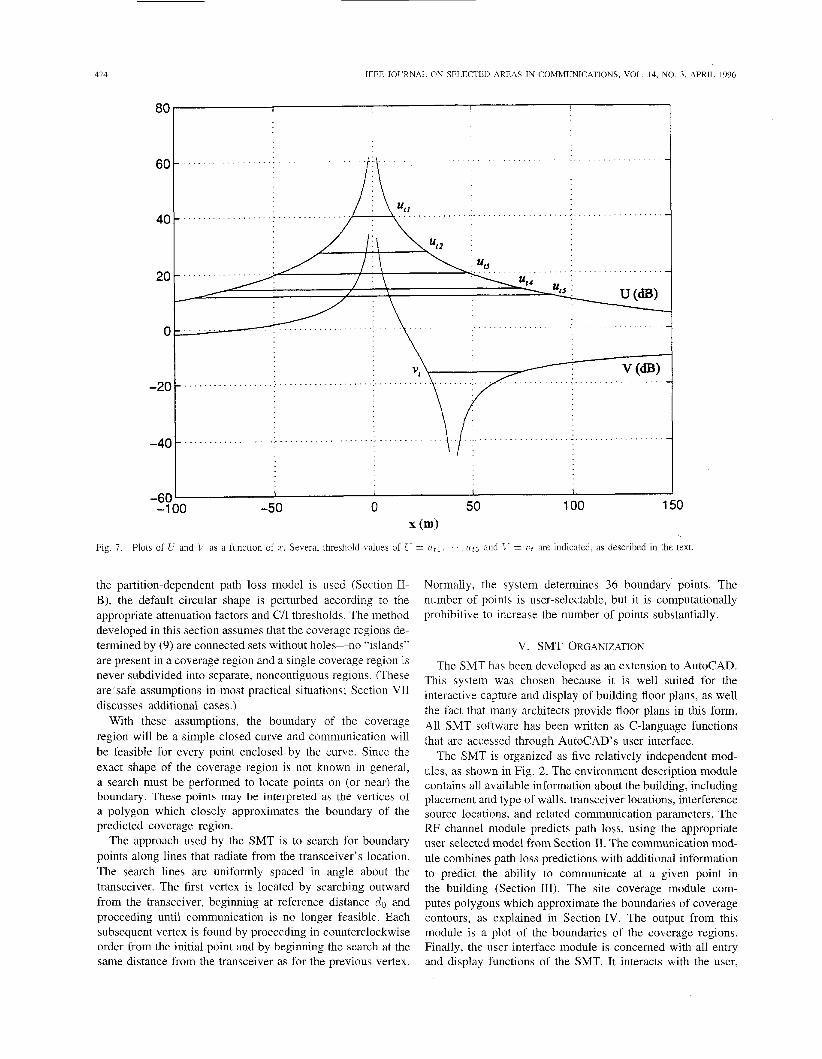
Fig, 7. Plots of U and V as a function of P. Several threshold values of I - = uti.. . . . u t i and 1- = vt are indicated, as described in the text
the partition-dependent path loss model is used (Section II- B), the default circular shape is perturbed according to the appropriate attenuation factors and C/I thresholds. The method developed in this section assumes that the coverage regions de- termined by (9) are connected sets without holes-no “islands” are present in a coverage region and a single coverage region is never subdivided into separate, noncontiguous regions. (These are safe assumptions in most practical situations; Section VI1 discusses additional cases.)
With these assumptions, the boundary of the coverage region will be a simple closed curve and communication will be feasible for every point enclosed by the curve. Since the exact shape of the coverage region is not known in general, a search must be performed to locate points on (or near) the boundary. These points may be interpreted as the vertices of a polygon which closely approximates the boundary of the predicted coverage region.
The approach used by the SMT is to search for boundary points along lines that radiate from the transceiver’s location. The search lines are uniformly spaced in angle about the transceiver. The first vertex is located by searching outward from the transceiver, beginning at reference distance do and proceeding until communication is no longer feasible. Each subsequent vertex is found by proceeding in counterclockwise order from the initial point and by beginning the search at the same distance from the transceiver as for the previous vertex.
Normally, the system determines 36 boundary points. The number of points is user-selectable, but it is computationally prohibitive to increase the number of points substantially.
V. SMT ORGANIZATION The SMT has been developed as an extension to AutoCAD.
This system was chosen because it is well suited for the interactive capture and display of building floor plans, as well the fact that many architects provide floor plans in this form. All SMT software has been written as C-language functions that are accessed through AutoCAD’s user interface.
The SMT is organized as five relatively independent mod- ules, as shown in Fig. 2. The environment description module contains all available information about the building, including placement and type of walls, transceiver locations, interference source locations, and related communication parameters. The RF channel module predicts path loss, using the appropriate user-selected model from Section 11. The communication mod- ule combines path loss predictions with additional information to predict the ability to communicate at a given point in the building (Section 111). The site coverage module com- putes polygons which approximate the boundaries of coverage contours, as explained in Section IV. The output from this module is a plot of the boundaries of the coverage regions. Finally, the user interface module is concerned with all entry and display functions of the SMT. It interacts with the user,
PANJWANI et ul.: INTERACTIVE COMPUTATiON OF COVERAGE REGIONS FOR WIRELESS COMMUNlCATiON 425
100
75
50
25
- 0 h
-2 5
-50
-75
-100 -50 0 50 100 150 -50 0 50 100 150
h E
5 I I __ -
-75
-LCIO
h
W E h
95
50
25
a -25
-50
-75
-1001 1 I I I -
-5%) U 50 3.00 150 -50 0 50 100 150 = C@
(C) (d)
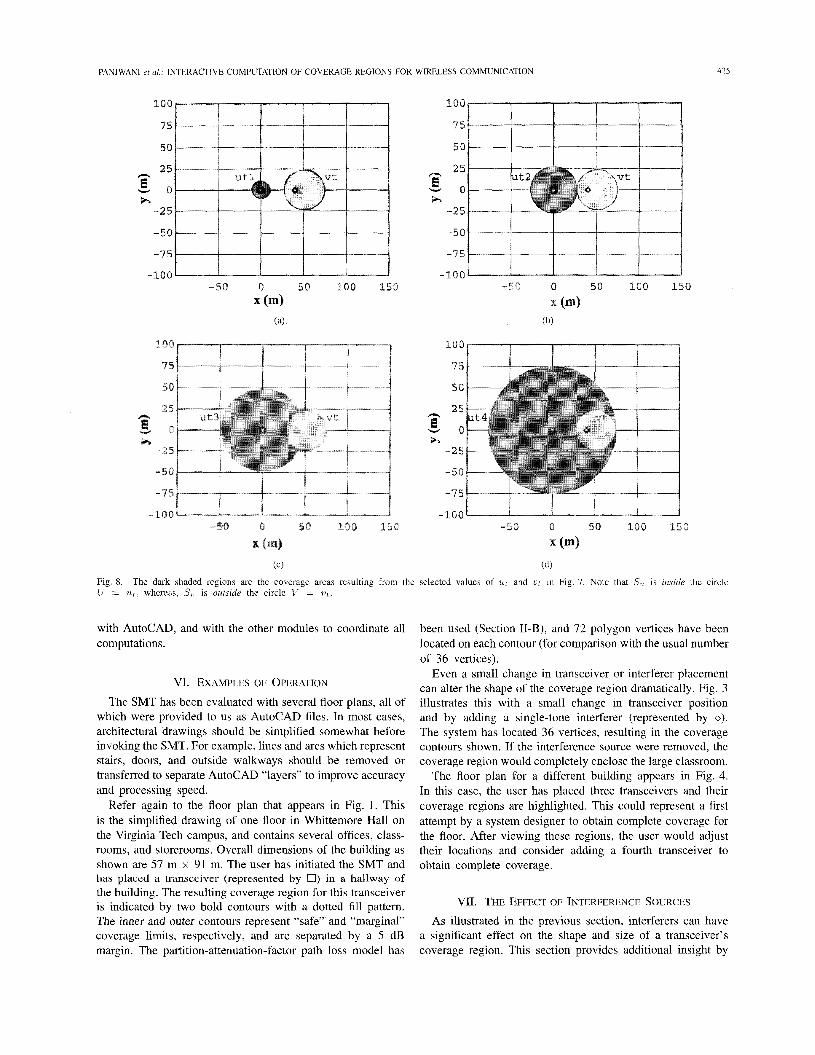
Fig 8 C = u t , whereas, S, i $ outside the circle X 7 = ut
The dark shaded regions dre the coverage areas resulting from the selected value\ of ut and t i t in Fig 7 Note thdt S, is Inside the circle
with AutoCAD, and with the other modules to coordinate all computations.
VI. EXAMPLES OF OPERATION
The SMT has been evaluated with several floor plans, all of which were provided to us as AutoCAD files. In most cases, architectural drawings should be simplified somewhat before invoking the SMT. For example, lines and arcs which represent stairs, doors, and outside walkways should be removed or transferred to separate AutoCAD “layers” to improve accuracy and processing speed.
Refer again to the floor plan that appears in Fig. 1. This is the simplified drawing of one floor in Whittemore Hall on the Virginia Tech campus, and contains several offices, class- rooms, and storerooms. Overall dimensions of the building as shown are 57 m x 91 m. The user has initiated the SMT and has placed a transceiver (represented by U) in a hallway of the building. The resulting coverage region for this transceiver is indicated by two bold contours with a dotted fill pattern. The inner and outer contours represent “safe” and “marginal” coverage limits, respectively, and are separated by a 5 dB margin. The partition-attenuation-factor path loss model has
been used (Section 11-B), and 72 polygon vertices have been located on each contour (for comparison with the usual number of 36 vertices).
Even a small change in transceiver or interferer placement can alter the shape of the coverage region dramatically. Fig. 3 illustrates this with a small change in transceiver position and by adding a single-tone interferer (represented by 0). The system has located 36 vertices, resulting in the coverage contours shown. If the interference source were removed, the coverage region would completely enclose the large classroom.
The floor plan for a different building appears in Fig. 4. In this case, the user has placed three transceivers and their coverage regions are highlighted. This could represent a first attempt by a system designer to obtain complete coverage for the floor. After viewing these regions, the user would adjust their locations and consider adding a fourth transceiver to obtain complete coverage.
VII. THE EFFECT OF INTERFERENCE SOURCES
As illustrated in the previous section, interferers can have a significant effect on the shape and size of a transceiver’s coverage region. This section provides additional insight by
IEEE JOURNAL ON SELECTED AREAS IN COMMUNICATIONS, VOL. 14, NO. 3, APRIL 1996
Variable n
P L ( d
426
80
Value Units 3.0 31.5 dB
60
9
40
20 dl3m
20
0
-20
-40
-50 0 50 100 x (m)
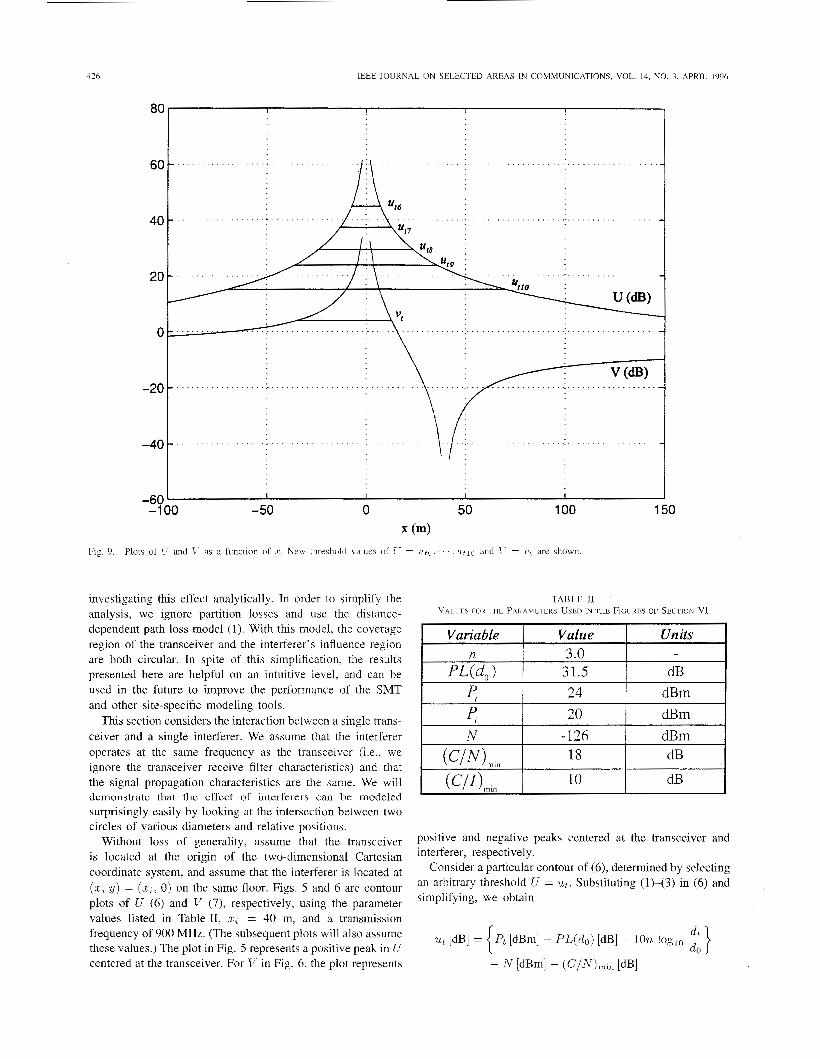
Fig. 9. Plots of IT and I’ as a function of s. Neu threshold values of I- = ( 1 t 6 . . . . . l i t l o and 1. = I‘I are shown
investigating this effect analytically. In order to simplify the analysis, we ignore partition losses and use the distance- dependent path loss model (1). With this model, the coverage region of the transceiver and the interferer’s influence region are both circular. In spite of this simplification, the results presented here are helpful on an intuitive level, and can be used in the future to improve the performance of the SMT and other site-specific modeling tools.
This section considers the interaction between a single trans- ceiver and a single interferer. We assume that the interferer operates at the same frequency as the transceiver (i.e., we ignore the transceiver receive filter characteristics) and that the signal propagation characteristics are the same. We will dcmonstrate that the effect of interferers can be modeled surprisingly easily by looking at the intersection between two circles of various diameters and relative positions.
Without loss of generality, assume that the transceiver is located at the origin of the two-dimensional Cartesian coordinate system, and assume that the interferer is located at ( r c , y) = ( x I , 0) on the same floor. Figs. 5 and 6 are contour plots of U (6) and V (7), respectively, using the parameter values listed in Table 11, x , = 40 m, and a transmission frequency of 900 MHz. (The subsequent plots will also assume these values.) The plot in Fig. 5 represents a positive peak in U centered at the transceiver. For V in Fig. 6, the plot represents
150
TABLE I1 V ~ L L E S FOR THE PARAMETERS USED IN THE FIGURES OF SECTION VI
I 24 I m m I
positive and negative peaks centered at the transceiver and interferer, respectively.
Consider a particular contour of (6) , determined by selecting an arbitrary threshold U = ut. Substituting (1)-(3) in (6) and simplifying, we obtain
Pt [dBm] - PL(d0) [dB] - 10n loglo -
PANJWANI el al.: INTERACTIVE COMPUTATION OF COVERAGE REGIONS FOR WIRELESS COMMUNICATION
~
421
50 100 150
(e)
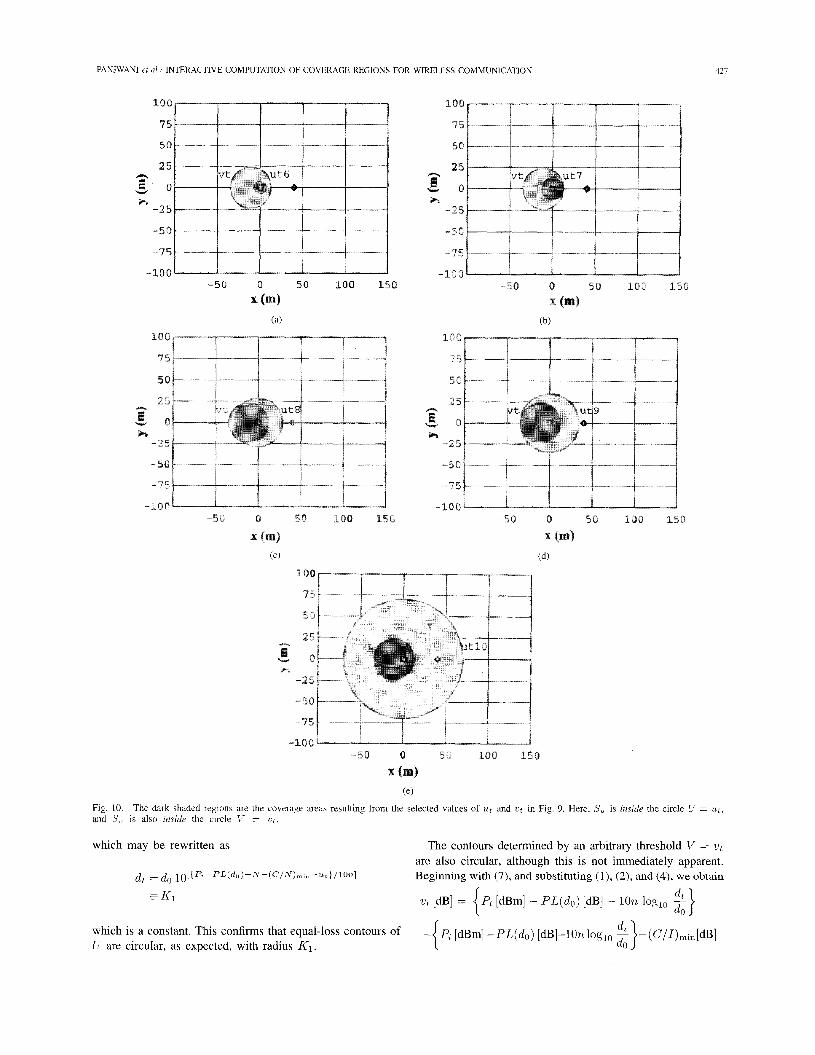
R g 10. and S, 13 also inride the circle V = rt
The dark shaded regions are the coverage areas resulting from the selected values of u t and rt in Fig 9 Here, S,, i\ inside the circle C = ut ,
which may be rewritten as The contours determined by an arbitrary threshold V = vt are also circular, although this is not immediately apparent. Beginning with (7), and substituting (l), (2) , and (4), we obtain
which is a constant. This confirms that equal-loss contours of -{Pi [dBrn] -PL(do) [dB]-lOn loglo U are circular, as expected, with radius K1.
428 IEEE JOURNAL ON SELECTED AREAS IN COMMUNICATIONS, VOL. 14, NO. 3, APRIL 1996
VI
n
"3 W
2
40 35 30 25 20 15 10 5 0
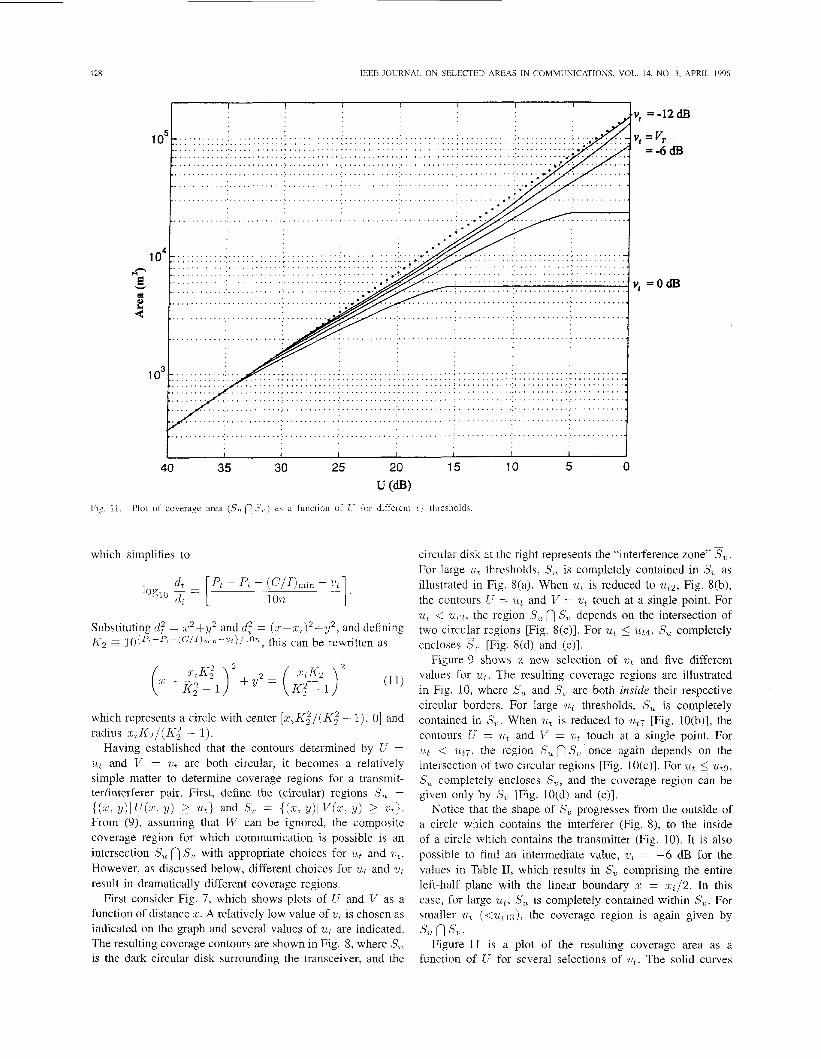
U (dB1 Fig. 11. Plot of coverage area (S, n S l . ) as a function of C- for different rt thresholds.
= -12 dB = vr = 45 dB
=OB
which simplifies to
which represents a circle with center [ L C ~ K ; / ( K ; - 1). 01 and radius z ; K ~ / ( K ~ - 1).
Having established that the contours determined by U = ut and V = ut are both circular, it becomes a relatively simple matter to determine coverage regions for a transmit- terlinterferer pair. First, define the (circular) regions s, =
From (9), assuming that W can be ignored, the composite coverage region for which communication is possible is an intersection S,, n S,, with appropriate choices for ut and vt. However, as discussed below, different choices for ut and ut result in dramatically different coverage regions.
First consider Fig. 7, which shows plots of U and V as a function of distance 2. A relatively low value of vt is chosen as indicated on the graph and several values of ut are indicated. The resulting coverage contours are shown in Fig. 8, where S, is the dark circular disk surrounding the transceiver, and the
( ( 2 , Y) I U ( 2 ; Y) 2 7 L t ) and Su = ( ( 5 , Y) l V ( X > Y) 2 U t ) .
circular disk at the right represents the "interference zone" s,, . For large ut thresholds, S, is completely contained in S,, as illustrated in Fig. 8(a). When ut is reduced to u t 2 , Fig. 8(b), the contours U = ut and V = vt touch at a single point. For ut < ut2, the region S, n S,, depends on the intersection of two circular regions [Fig. S(c)]. For ut 5 ut4, S, completely encloses 3, [Fig. 8(d) and (e)].
Figure 9 shows a new selection of ut and five different values for ut. The resulting coverage regions are illustrated in Fig. 10, where S, and S, are both inside their respective circular borders. For large ut thresholds, S,, is completely contained in S,. When ut is reduced to ut7 [Fig. lO(b)], the contours U = ut and V = ut touch at a single point. For ut < ut7, the region S, OS,, once again depends on the intersection of two circular regions [Fig. lO(c)]. For ut 5 ut9,
S, completely encloses S,,, and the coverage region can be given only by S,; [Fig. lO(d) and (e)].
Notice that the shape of S, progresses from the outside of a circle which contains the interferer (Fig. 8 ) , to the inside of a circle which contains the transmitter (Fig. 10). It is also possible to find an intermediate value, ut = -6 dB for the values in Table 11, which results in S, comprising the entire left-half plane with the linear boundary LC = zi/2. In this case, for large ut, S,, is completely contained within S,. For smaller ut (<ut13), the coverage region is again given by
Figure 11 is a plot of the resulting coverage area as a function of U for several selections of ut. The solid curves
s, n so.
PANJWANI et ul.: INTERACTIVE COMPUTATION OF COVERAGE REGIONS FOR WIRELESS COMMUNICATION 429
indicate the actual coverage area S,, S, which differs from the theoretical coverage area S, (shown by the dotted curve) that would have been obtained had no interferers been present. The different curves in Fig. 11 are of two fundamental types. The upper two plots correspond to Figs. 7 and 8, and asymp- totically increase as rapidly as the theoretical coverage area. The lower two plots (those which become constant as U approaches zero) correspond to the case of Figs. 9 and 10. The plot in the middle of Fig. 11 corresponds to the lim- iting case for which S,, is formed by the entire left half plane.
While using SMT, it has been observed that the coverage region shown in Fig. 10(e) occurs most commonly for practical parameter values. The situation in Fig. 1O(c) is also frequently encountered. For sufficiently small values of vt (less than 0 dB, also practically achievable), the regions shown in Fig. 8(c) and (e) can also result, although SMT is not currently capable of detecting the situation in Fig. 8(e). This is a subject of ongoing work.
It is easy to see that a change in any parameter listed in Table I1 will modify the corresponding circle(s) defined by U = ut andor V = v t . It is apparent that for practical values of v t , the coverage area (and therefore, overall system capacity) is dramatically influenced by the interferer.
VIII. SUMMARY
This paper has described a new visualization tool that can be used to predict coverage areas for wireless communica- tion systems within buildings. The system permits the user to place transceivers and interference sources interactively within a floor plan that has been generated using AutoCAD. After placement, the user can direct the system to compute coverage areas which are highlighted directly on the floor plan. Coverage areas are calculated as a function of trans- ceiver and interferer parameters, locations of walls and soft partitions, and building type. For versatility, all parameters are user-selectable. The system supports both single-floor and multifloor buildings.
In order to make the SMT interactive, relatively simple propagation models have been implemented. These models do not require computationally intensive techniques such as ray tracing. Instead, they depend only on distance and the number of intervening building partitions. The models were developed using extensive empirical measurements in an earlier work [2] and provide useful results in many environments.
The effect of interference sources on the coverage regions of a transceiver were also investigated here. We observe that the presence of interferers in the vicinity of a transceiver can dramatically alter its coverage region.
The SMT is simple to use, it accommodates many different types of buildings, and it provides visual feedback that is intu- itive and easy to understand. It can be used to rapidly design and help install systems, and thus satisfies an important need for system designers of indoor wireless systems. Currently, work is in progress to incorporate path loss measurements and directional antennas into the system.
ACKNOWLEDGMENT The helpful comments of the anonymous reviewers are
appreciated.
REFERENCES
D. C. Cox, “Universal portable radio communications,” IEEE Trans. Veh. Technol., vol. VT-34, no. 3, pp. 117-121, Aug. 1985. S. Y. Seidel and T. S. Rappaport, “914 MHz path loss prediction models for indoor wireless communications in multifloored buildings,” IEEE Trans. Antennas Propagat., vol. 40, no. 2, pp. 207-217, Feb. 1992. T. S. Rappaport, “Indoor radio communications for factories of the future,” IEEE Commun. Mag., pp. 15-24, May 1989. D. C. Cox, R. R. Murray, and A. W. Norris, “800 MHz attenuation measured in and around suburban houses,” AT&T Bell Lab. Tech. J. , vol. 63, pp. 921-954, July/Aug. 1984. A. A. M. Saleh and R. A. Valenzuela, “A statistical model for indoor multipath propagation,” IEEE J. Select. Areas Commun., vol. SAC-5, no. 2, pp. 128-137, Feb. 1987. J. F. Lafortune and M. Lecours, “Measurement and modeling of prop- agation losses in a building at 900 MHz,” IEEE Trans. Veh. Technol., vol. 39, no. 2, pp. 101-108, May 1990. T. S. Rappaport, “Characterization of UHF multipath radio channels in factory buildings,” IEEE Trans. Antennas Propagat., vol. 37, no. 8, pp. 1058-1069, Aug. 1989. A. J. Motley and J. M. P. Keenan, “Personal communication radio coverage in buildings at 900 MHz and 1700 MHz,” Electron. Lett., vol. 24, no. 12, pp. 763-764, 1988. D. M. J. Devasirvatham, M. J. Krain, and D. A. Rappaport, “Radio propagation measurements at 850 MHz, 1.7 CHz, and 4.0 GHz inside two dissimilar office buildings,” Electron. Lett., vol. 26, no. 7, pp. 445447, 1990. S. Y. Seidel, T. S. Rappaport, M. J. Feuerstein, and K. L. Blackard, “The impact of surrounding buildings on propagation for wireless in- building personal communications system design,” in Proc. IEEE Veh. Technol. Conf, Denver, CO, May 1992, pp. 814-818. D. A. Hawbaker, “Indoor wide band radio wave propagation measure- ments at 1.3 GHz and 4.0 GHz,” Eleclron. Lett., vol. 25, pp. 1800-1802, Oct. 1990. W. Honcharenko, H. L. Bertoni, and J. Dailing, “Mechanisms gov- erning propagation between different floors in buildings,” IEEE Trans. Antennas Propugat., vol. 41, no. 6, pp. 787-790, June 1993. T. S. Rappaport, Wireless Communications: Principles and Practice. Englewood Cliffs: Prentice-Hall, 1996, ch. 3. D. Molkdar, “Review on radio propagation into and within buildings,” IEEE Proc.-H, vol. 138, no. 1, pp. 61-73, Feb. 1991. H. Hashemi, “The indoor radio propagation channel,” Proc. IEEE, vol. 81, no. 7, pp. 943-968, July 1993. J. B. Andersen, T. S. Rappaport, and S. Yoshida, “Propagation mea- surements and models for wireless communications channels,” IEEE Commnn. Mag., vol. 33, no. 1, Jan. 1995. T. S. Rappaport and S. Sandhu, “Radio-wave propagation for emerging wireless personal communication systems,” IEEE Antennas Propug. Mag., vol. 36, no. 5 , pp. 14-24, Oct. 1994. M. A. Panjwani, A. L. Abbott, T. S. Rappaport, and J. Haagh, “An interactive system for visualizing wireless communication coverage within buildings,” in Proc. Virginia Tech 4th Symp. Wireless Personal Commun., June 1994, pp. 14.1-14.12. K. L. Blackard, T. S. Rappaport, and C. W. Bostian, “Measurements and models of radio frequency noise for indoor wireless communications,” IEEEJ. Select. Areas Commun., vol. 11, no. 7, pp. 991-1000, Sept. 1993. A. J. Motley and J. M. P. Keenan, “Radio coverage in buildings,” Er. Telecom Technol. J., Special Issue Mobile Communications, vol. 8 , no. 1, pp. 19-24, Jan. 1990. K. Pahlavan, R. Ganesh, and T. Hotaling, “Multipath propagation measurements on manufacturing floors at 9 10 MHz,” Electron. Lett., vol. 25, no. 3, pp. 225-227, Feb. 1989. D. M. J. Devasirvatham, C. Banerjee, R. R. Murray, and D. A. Rappaport, “Four frequency radiowave propagation measurements of the indoor environment in a large metropolitan commercial building,” in Proc. IEEE GLOBECOM ’91, Phoenix, AZ, Dec. 1991, pp. 1282-1286. S. Y. Seidel and T. S. Rappaport, “Site-specific propagation prediction for wireless in-building personal communication system design,” IEEE Trans. Veh. Technol., vol. 43, no. 4, pp. 879-891, Nov. 1994. R. A. Valenzuela, “A ray tracing approach to predicting indoor wireless transmission,” in Proc. IEEE Veh. Technol. CO$, 1993, pp. 214-218.
430 IEEE JOURNAL ON SELECTED AREAS IN COMMUNICATIONS, VOL. 14, NO. 3, APRIL 1996
[25] P. M. Cartwright and K. W. Sowerby, “Estimating regions of service in wireless indoor communication systems,” in Proc. Virginia Tech 4th Symp. Wireless Personal Commun., June 1994, pp. 12.1-12.11.
Manish A. Panjwani (S’93) was born on Octo- ber 25, 1970, in Bombay, India He received the Bachelor of Engineering degree in electronics (with honors) from the University of Bombay, India in July 1992 He received the M S degree in electrical engineering from Virginia Polytechnic Institute and State university, Blacksburg, in 1995
From August to December 1992, he was em- ployed with CMC Ltd. (Bombay), as an Information Technology Engineer Since March 1995. he has been working as a Design Engineer with LCC.
L.L.C., a telecommunications consulting firm based in Arlington, VA He is currently involved in the design of Pacific Bell Mobile Services‘ DCS1900 PCS network in Los Angeles, CA In addition to the design and development of cellular mobile and personal radio communications systems, his interests include spread spectmm, satellite communications, and radio astronomy
Mr Panjwani is a member of the Eta Kappa Nu Honor Society
A. Lynn Abbott (S’89-M’89) received the B.S. degree from Rutgers University, Rutgers, NJ. in 1980, the M.S. degree from Stanford University. Stanford, CA, in 1981, and the Ph.D. degree from the University of Illinois in 1990, all in electrical engineering.
He has been an Assistant Professor with the Bradley Department of Electrical Engineering at Virginia Tech, Blacksburg, since January 1990. From 1980 to 1985, he was a Member of Technical Staff at AT&T Bell Laboratories, where his duties
Theodore S. Rappaport (S’85-M’87-SM’91) was born in Brooklyn, NY, on November 26, 1960. He received the B.S.E.E., M.S.E.E., and Ph.D. degrees from Purdue University, Lafayette, IN, in 1982, 1984, and 1987, respectively.
In 1987, he joined the Electrical Engineering faculty of Virginia Tech, Blacksburg, where he is a professur in the Mobile and Portable Radio Research Group (MPRG), a group he founded in 1990. He conducts research in mobile radio communications system design, RF propagation, vehicular naviga-
tion, and wireband communication system design. He is the author of Wireless Cornrnitnicntion 5, Principles & Practice (Englewood Cliffs, NJ: Prentice-Hall), one of the first textbooks in the field, and has edited four books published by Kluwer Academic Press on the subject of wireless personal communications; also. he has contributed chapters on the subject for the CRC Handbook series. He holds scleral US patents and is co-inventor of SIRCIM, SMRCIM, and BERSIM. indoor and microcellular radio channel software simulators that have been adopted by more than 100 companies and Universities.
Dr. Rappaport received the Marconi Young Scientist Award for his contri- butions in indoor radio communications, in 1990, and was named a National Science Foundation Presidential Faculty Fellow, in 1992. He received the 1992 IEE Electronics Letters Premium Award for the paper “Path loss prediction in multi-floored buildings at 914 MHz,” which he co-authored. He is a Registered Professional Engineer in the State of Virginia and is a Fellow of the Radio Club of America.
involved hardware and software design of data communications equipment. He conducts research in the areas of computer vision, artificial intelligence. and high-performance computer architectures for image processing.
Dr. Abbott is a member of the ACM, Sigma Xi, Phi Kappa Phi, Eta Kappa Nu. and Tau Beta Pi.